© 2008 Illumina, Inc.Illumina, Making Sense Out of Life, Sentrix, GoldenGate, DASL, Oligator, Infinium, BeadArray, Array of Arrays, BeadXpress, VeraCode, IntelliHyb, iSelect, CSPro, and Solexa are registered trademarks or trademarks of Illumina Inc.
Applications on Illumina’s
Genome Analyzer – From Possibilities to Publications
Shawn C. Baker, Ph.D.Market Manager – Expression and Regulation Illumina
2
2009 System Roadmap
0
10
20
30
40
50
60
70
80
90
100
Q4 '08 Q1 '09 Q2 '09 Q3 '09 Q4 '09
Gig
abas
esof
Qua
lity
Dat
a pe
r Run
0.0
2.0
4.0
6.0
8.0
10.0
12.0
Gb/Run Gb/Day
2x100 PE
Pipeline and GA2x
2x125 PE
2x150 PE 95G
55G
35G
20G
SBS Version 3 +Pipeline 1.3
15G
Jan ‘09 Dec ‘09
3
THE ILLUMINA GENOME ANALYZER
SYSTEM
4
Flow cell
Simplified workflow
Clusters in a contained environment (no need for clean rooms)
Sequencing performed in the flow cell on the clusters
8 channels
Surface of flow cell coated with a lawn of oligo pairs
5
DNA (0.1-1.0 ug)
Single molecule arraySample
preparation Cluster growth5’
5’3’
G
T
C
A
G
T
C
A
G
T
C
A
C
A
G
TC
A
T
C
A
C
C
TAG
CG
TA
GT
1 2 3 7 8 94 5 6
Image acquisition Base calling
T G C T A C G A T …
Sequencing
Illumina Sequencing Technology Robust Reversible Terminator Chemistry Foundation
6
0
50,000
100,000
150,000
200,000
250,000
300,000
350,000
400,000
0 50,000 100,000 150,000 200,000 250,000 300,000 350,000 400,000 450,000
Initial Raw Clusters (per mm2)
Clu
ster
s P
F (p
er m
m2 )
PL 1.0
PL 1.3
PL 1.4
New Analysis Algorithm Doubles Yield 200,000
150,000
100,000
50,000
0200,000150,000100,00050,0000
Raw clusters/tile
PF
Clu
ster
s/til
e
x 100 for clusters per lane
7
New Analysis Algorithm also Improves Accuracy
Clusters/tile PF/tile Error rates Perfect reads
Yield* at 2x100bp
PL 1.3 239,310 136,455
16M/lane*
R1: 1.21%
R2: 2.06%
60%
50%
26.1G
PL1.4 238,577 201,140
24M/lane*
R1: 0.77%
R2: 1.34%
>70%
60%
38.6G
*for 120 tiles/lane
Lower error
Higher yield84% PF
8
Increasing Quality, Productivity, EconomyIncrease accuracy: improved chemistry and image detection for >Q30 basesIncrease read length (and reduce cycle time): Enhance alignment and de novo assemblyIncrease density (250M paired reads / flowcell)Increase yield, reduce cost
Readlength Gb
PF data / flowcells
Flowcells
/ 40x genome
Project
35 3.3 40 Yoruba genomes
50 10 12 1000 genomes pilot
75 15 8 Melanoma pilot
100 20 6 Human standard
100 30 4 Human standard
100 50 2 Human standard
9
New Software Improves Yield of Data
New Pipeline
10
New Pipeline
New Software Improves Accuracy of Data
11
2009 System Roadmap
On-track for 95G Output in 2009
0
10
20
30
40
50
60
70
80
90
100
Q4 '08 Q1 '09 Q2 '09 Q3 '09 Q4 '09
Gig
abas
esof
Qua
lity
Dat
a pe
r Run
0.0
2.0
4.0
6.0
8.0
10.0
12.0
Gb/Run Gb/Day
2x100 PE
Pipeline and GA2x
2x125 PE
2x150 PE 95G
55G
35G
20G
SBS Version 3 +Pipeline 1.3
15G
Jan ‘09 Dec ‘09
12
mRNA-Seq: Analysis and Quantitation of the Transcriptome
Quantitate levels of RNA expression–
Better sensitivity, dynamic range, and gene coverage than any microarray
Transcriptome Structure and Genome Annotation–
Provide EST-like information to annotate previously sequenced genomes
–
Data can be used to discover novel transcripts
–
Study RNA Processing and Characterize Alternative transcription
Study transcriptome polymorphism–
Characterize SNPs, point mutations, and insertion/deletions in mRNA
13
mRNA-Seq Sample Prep Workflow
1.5 hr 1.5 hr
1 hr 10 min
4.5 hr 20 min
2 hr 45 min
1.5 hr 30 min
1 hr 30 min
Tot al �Time
Hand s-On�Time
11.5 hr 3.75 hr
< 1 weekSample to Data
Sample Prep Total
PCR Enrich
Size-Select fromGel
Ligate Adaptors
Make cDNA
Fragment RNA
Isolate Poly-A RNA
14
Excellent Reproducibility of Digital Counting Data from Genome Analyzer
Lane
6 o
f Firs
t Flo
w C
ell
Lane 2 of Second Flow Cell
Reproducibility of counting reads assigned to all RefSeq Genes in two UHRR Replicates
When compared across 7 lanes and 2 flow cells, all Brain/Brain and
UHRR/UHRR replicates had linear r2 correlations > 0.99
15
10 -5 10 -4 10 -3 10 -2 10 -1 10 0 10 1
brain35.30ACL.lane2 Counts
UHR35.30ACL.lane1 Counts vs brain35.30ACL.lane2 Counts
10 -5
10 -4
10 -3
10 -2
10 -1
10 0
10 1
UH
R35
.30A
CL.
lane
1 C
ount
s
Differential Expression of Genes in Brain vs. UHRR
Comparison of Digital Counts of Brain vs. UHRR
Correlations between lanes is ~0.47 for all lanes
16
Large Linear Dynamic Range of Quantitation
Figure taken from “Mapping and quantifying mammalian transcriptomes
by RNA-Seq”
by Mortazavi, Williams, McCue, Schaeffer & Wold. Nature Methods, 2008
17
R = 0.965Slope = 0.984
Accurate Quantitation: mRNA-SEQ vs. RT-PCR
Fold
Cha
nge
for q
RT-
PC
R:
Bra
in/U
HR
Fold Change for mRNA-SEQ: Brain/UHR
18
Overview of mRNA-Seq Assays ►
Start with 1 µg (or less) of Total RNA►
Purify poly-A mRNA►
Randomly Fragment RNA
►
PCR Amplify 15 Cycles►
Purify, Quantify►
Grow Clusters►
Sequence on Illumina Genome Analyzer→
Single or Paired-end reads→
35 to 100 base read lengths
►
Random Prime mRNA cDNA
►
Make 2nd Strand cDNA
►
Ligate Sequencing Adapters
►
CIP Treatment►
PNK Treatment►
Ligate 3’- Small RNA Adapters►
Ligate 5’- Small RNA Adapters►
RT to make cDNA
mRNA-SeqDirectional mRNA-Seq
19
FKBP8 Gene Expression
Brain
UHRR
RPS3 Gene Expression
These screen shots were taken directly from the Illumina Genome Viewer (IGV), which is part of the GenomeStudio™
Software Suite
mRNA-Seq: Truly Quantitative Gene Expression
Brain
UHRR
13,025 reads
8,037 reads
3,115 reads
31,109 reads
20
“Exon”
Reads
“Splice Junction”
Reads
A Differentially Expressed Gene – IGFBP1
21
Directional RNA-Seq
Protocol uses existing Small RNA library prep protocol
Retains directionality of the RNA fragment
Valuable tool for annotation of new genomes
1.5-day library prep protocol
Currently in Early Access Sites –
Available soon!
Total RNA
Directional RNA-Seq Workflow
RNA fragment clean-up
RNA Adapter Ligations
Perform RT-PCR Amplification
Purify Library
Poly-A Selection
mRNA Fragmentation
22
Directional RNA-Seq
Standard mRNA-Seq
Directional RNA-Seq
23
This Transcript is a Product of Gene: ENSG00000007202
Gene Symbol: KIAA0100 Exons: 39 Transcript length: 7,430 bps Translation length: 2,235 residues
24
Illumina GAEnsembl
Capabilities
Length of read
Short-insert Paired Ends
Raw Read Accuracy
Human transcript comparing Ensembl
and Genome Analyzer data
25
Maher et al, Chimeric transcript discovery by paired-end transcriptome sequencing PNAS June 09
26
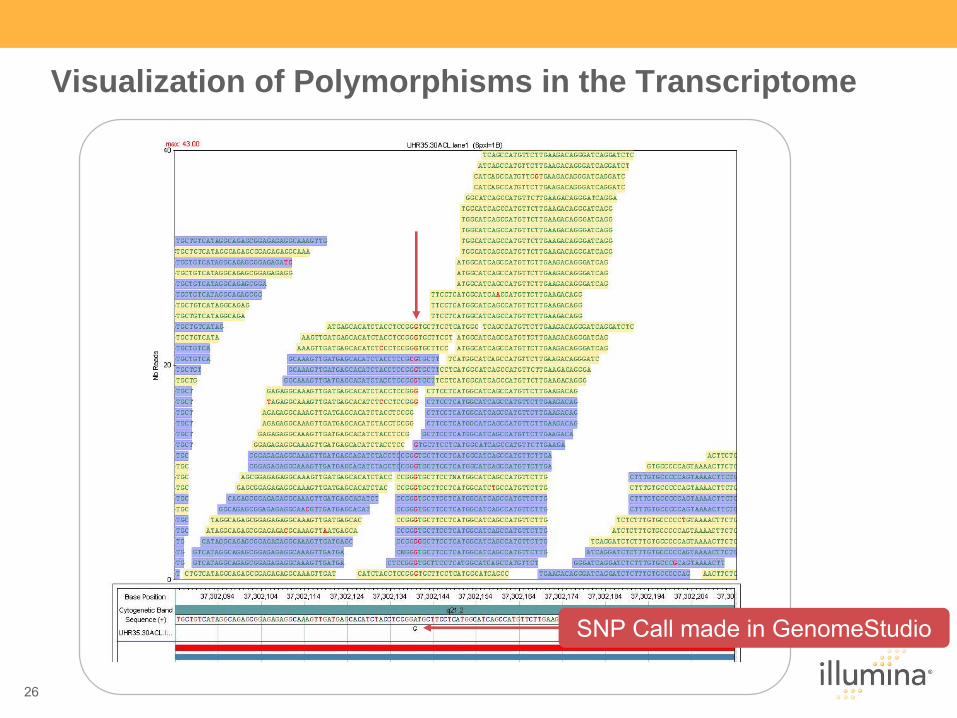
Visualization of Polymorphisms in the Transcriptome
SNP Call made in GenomeStudio
28
GRO-Seq (Global Runon Sequencing)
29
Which RNA-Seq assay and how much data are needed?
Counting or Profiling–
5 to 10 million total reads of 35 to 50 bp length from poly-A selected RNA will give
performance better than any microarray
Studying Alternative Splicing or quantifying cSNPs for most transcripts–
Deeper profiling of 50 to 100 million reads, with read lengths of 50 to 100 bps, from poly-
A selected RNA using mRNA-Seq
assay
Complete Annotation of a New Transcriptome–
100 million to 1 Billion Reads of 50 to 100 bp read length
–
or Long overlapping reads
–
Combination of random primed and directional chemistry
–
Poly-A selected and ribo-minus treated total RNA
–
Combination of single-read and paired-end data
–
Also must do Small RNA analysis as well…
30
Wide Variety of Methods are Possible Today on the GA
31
Wide Variety of Methods are Published Today on the GA
Read lengths of 35 to 100 + bps
Random Primed or Stranded Protocols
Poly-A Selected or Total RNA (-rRNA)
Single-Read or Paired-End Read
Insert Sizes of 50 to 500+ bps
32
Wide Variety of Methods are Published Today on the GA
Read lengths of 35 to 100 + bps
33
Wide Variety of Methods are Published Today on the GA
Read lengths of 35 to 100 + bps
Random Primed or Stranded Protocols
34
Wide Variety of Methods are Published Today on the GA
Read lengths of 35 to 100 + bps
Random Primed or Stranded Protocols
Poly-A Selected or Total RNA (-rRNA)
35
Wide Variety of Methods are Published Today on the GA
Read lengths of 35 to 100 + bps
Random Primed or Stranded Protocols
Poly-A Selected or Total RNA (-rRNA)
Single-Read or Paired-End Read
Insert Sizes of 50 to 500+ bps
36
Illumina’s Small RNA v1.5 library prep protocol
Just 6 hr library prep starting from total RNA
Enhanced workflow–
Shortest time from library to sequence –
2.5 hrs hands on time (6 hr total)–
Single gel excision
NO need for small RNA purification!–
Starts directly from total RNA
Reduced RNA input requirements–
1.0 µg total RNA input
Titrated to 100 ng
total
Highest quality data–
Most accurate quantification of small RNAs–
Superior results to RNA/DNA duplex method
As always, strand specific information–
Discover & profile microRNA–
Sequence other non-coding RNAs
Streamlined Workflow
3’
RNA Adaptor Ligation
5’
RNA Adapter Ligation
Perform RT-PCR Amplification
Purify Small RNA Library
~ 2.5 hours hands on time
Sample Prep RNA to Datax x x x
~ 4 days
6 hours Total time
37
Small RNA Discovery
Collaboration with Tuschl
Multiple stages/tissues of C. elegans
38
ChIP-Seq (Genome Wide Characterization of Transcription Factor Binding Sites and Epigenetic Modifications)
Superior Performance–
High sensitivity (millions of tags per sample)–
Very low background and false positive rate
Excellent Coverage–
Genome-wide coverage–
High specificity/fine resolution
Low Sample Input–
1 to 10 nanograms
of DNA
39
Distance from peakS
ite c
ount
CarG Boxes in SRF-enriched Regions
4.7 M reads
Wold Lab
ChIP-Seq: Serum Response Factor (SRF) in Mouse C2C12 Cells
40
Renaissance in the analysis of regulatory elements
High resolution mapping of regulatory elements including promoters, enhancers, control regions
Nucleosome
positioning
Histone
modificationTranscription Factor bindingChromatin structureRNA-binding proteins
41
Bisulfite Sequencing (BiS-Seq)
BiS-Seq
Simple Modification–
Methylated
adapters–
Bisulfite treatment
Genome-wide Coverage–
Hypothesis-free–
Single base resolution–
No probe design constraints
Discovery Applications–
Cancer–
Biomarkers
FragmentgDNA
LigateModified Adapters
5-MeC
5-MeC
Bisulfite Treatment
42
Genomic DNA
X X
Restriction Enzyme Digestion
Size Selection (200+25bp)
Bisulfite Treatment
Sequence Ends of Selected Fragments
Data Analysis
200 +/- 25 bp
“Reduced Representation” Sample Prep Method Based on approach developed by Meissner, etc.
43
Ilumina’s Complete Expression and Regulation Solution
Methyl-Seq
Nucleosome MappingDNAse1-Seq
Ribo-Seq
BIS-Seq
mRNA-Seq
ChIP-Seq Small RNA Discovery
Exp Arrays
Methyl Arrays
44
What can you do with just one single lane of GA data?
60X Arabidopsis
50X Drosophila
400X Yeast Genome1200X E. coli
2X Coverage Human