Biodiesel may be produced through transesterification reaction between triglycerides and light alcoholsin presence of different catalysts. This paper presents a study of kinetics of soybean methanolysis usingcement kiln dust (CKD) as a heterogeneous catalyst. All reactions took place at a constant methanol tooil molar ratio of 12:1 and catalyst loading of 3.5%. The study consists of three phases; the first one isto consider the reaction following irreversible homogeneous kinetic models (1st and 2nd orders) dueto using high excess of methanol. The second is to add the backward reaction term to the power lawmodels. Finally, models for heterogeneous catalysts such as Eley–Rideal and Langmuir–Hinshelwoodmodels are suggested to describe reaction kinetics. Least squares method, Runge–Kutta methods forordinary differential equations and Levenberg–Marquardt algorithm for minimizing objective functionwere used to obtain the parameters of each suggested model in each phase. Calculation of determination
coefficient (R2) and minimization of squared error summation method were used to determine whichmodel is the best one to fit the experimental data. Eley–Rideal kinetic model was the best model amongstthe suggested models. Fisher and Chi-square criteria were used to check the reliability of generated rateequation. The rate differential equation was solved to obtain the main engineering factors controlling thereaction.
Biodiesel is a mixture of monoalkyl esters produced throughransesterification reaction between triglycerides and light alco-ols such as methanol and ethanol. Triglycerides sources can beirgin or used edible oils [1] or non edible oils [2,3].
Typical edible oils which are widely used for biodiesel produc-ion are soybean and sunflower oils; also, these oils can be utilizeds feedstocks after being used in cooking or frying [4]. Recently,here is a general interest amongst research studies to produceiodiesel from non edible sources [5,6]. Some of the famous non-dible oils used are karanja oil [7], pongamia oil [8,9] jatrophail [9] and oils extracted from microalgae [10]. These studies aimo optimize different reaction parameters as well [11,7]. Theyre concerned about the optimization of these conditions in the
ake of the development of biodiesel mass production. Factorialesign and response surface methodology concepts are widely used
techniques for studying different factors affecting transesterifica-tion as well as their optimization [12,8].
Kinetics of transesterification reactions are well studied bymany researchers [13–15]. These studies are concerned in gen-erating expressions for reaction rate to help designing a properreactor to produce biodiesel from triglycerides. Reaction rates takedifferent forms according to the catalyst used [16]. In the case ofhomogeneous catalyzed transesterification the reaction rate cantake the form of power law rates (i.e. first or second order) [17].On the other hand, in the case of using heterogeneous catalysts,reaction rate takes other forms [18]. These formulas are elaboratedtaking into consideration the different mechanisms of reaction andthe controlling step of this reaction [19]. In the case of using solidcatalyst, controlling step can be the reaction step adsorption ofreactants, desorption of products or a mass transfer step [20]. Masstransfer steps include the external and internal diffusion relative tothe catalyst pellet [21].
There are two famous mechanisms which are: Eley–Rideal
mechanism and Langmuir–Hinshelwood mechanism. The formermechanism involves the reaction of an adsorbed molecule on acertain site with another molecule in fluid phase to produce twoproducts one of them is adsorbed while the other one is free in
E.G. Al-Sakkari et al. / Applied Catalysis B: Environmental 206 (2017) 146–157 147
Nomenclature
Abbreviations%x Percentage conversionTG Triglyceride (soybean oil)MA MethanolDG DiglycerideMG MonoglycerideFAME Fatty acid methyl ester (biodiesel)CA Concentration of component a (mol L−1)DAB Diffusivity of a in BDeff Effective diffusivityGL Glycerolr Rate (mol L−1 h−1)t Time (h)(k1) Rate constant of forward reaction of TG → DG(k2) Rate constant of backward reaction of TG → DG(k3) Rate constant of forward reaction of DG → MG(k4) Rate constant of backward reaction of DG → MG(k5) Rate constant of forward reaction of MG → G(k6) Rate constant of backward reaction of MG → G(kt) Rate constant of forward reaction of TG → G (overall
reaction)(kt−) Rate constant of backward reaction of TG → G (over-
all reaction)K Rate constant includes the constant methanol con-
centration(kad) Rate constant of forward reaction of adsorption of
methanol(kad−) Rate constant of backward reaction of adsorption of
methanol (ER)(ks) Rate constant of forward reaction of surface reaction
(ER)(ks−) Rate constant of backward reaction of surface reac-
tion (ER)(kd) Rate constant of forward reaction of desorption of
glycerol (ER)(kd−) Rate constant of backward reaction of desorption of
glycerol (ER)S Active siteSp Particle surface area(Kad’) Equilibrium constant of reaction of adsorption of
methanol (ER)(Kd’) Equilibrium constant of reaction of desorption of
glycerol (ER)Ct Concentration of total active sitesCv Concentration of empty active sitesK’, K” and Ki” Constantskm Mass transfer coefficientE Activation energyAo Pre-exponential factorR Universal gas constantVp Particle volume� Effectiveness factor� Porosity� Tortuosity� Density� Viscosity� Thiele modulusdp Particle diameter
Dr Reactor diameterSh Sherwood numberRe Reynolds number
� Angular velocityUL Linear velocity
Sch Schmidt number
the fluid phase [22]. On the other hand, Langmuir–Hinshelwoodmechanism involves single site mechanism or dual-site mechanismsurface reaction [23].
Noureddini and Zhu [24], Bambase et al. [25], Karmee et al.[26] and Vicente et al. [27] suggested a second-order reactionmechanism during the transesterification of soybean oil usinghomogeneous catalyst. Darnoko and Cheryan [28] reported that thereaction mechanism would be of second-order in the early stagesof reaction shifting to first order mechanism in latter stages.
All previously cited works assumed that the reaction is kinet-ically controlled and that the side reactions – saponification andneutralization of free fatty acids- are negligible [29]. However, Bam-base et al. [25], Darnoko and Cheryan [28] and Noureddini and Zhu[24] selected the step of triglyceride conversion to diglyceride ascontrolling step while Karmee et al. [26] suggested the conversionof diglyceride to monoglyceride as determining step and Vicenteet al. [27] selected conversion of monoglycerides to glycerol reac-tion as being the controlling step.
Dossin et al. [30] and Hattori et al. [31] reported methanoladsorption step as the main controlling step using heteroge-neous catalyst, while Xiao et al. [32], Dossin et al. [30] andHattori et al. [31] suggested surface reactions step. Eley–Rideal (ER)and Langmuir–Hinshelwood-Hougen-Watson (LHHW) mecha-nisms are the proposed mechanisms for heterogeneously catalyzedtransesterification. On using a solid catalyst that contains Lewisacid/base sites the reaction can be described by LHHW model [32].Dossin et al. [30] and Hattori et al. [31] claimed that ER kineticmodel was suitable for heterogeneous base catalysts. Both LHHWand ER models are not suitable for describing reactions catalyzed bya heterogeneous catalyst leaches into the reaction mixture as thiscatalyst cannot be considered totally heterogeneous, so these reac-tions can follow the models proposed for homogeneous reactions(i.e. first and second order kinetic models) [29,33].
MacLeod [34] fitted power law, ER and LHHW models withthe experimental data obtained by using alkali metals doped onmetal oxides (e.g. Li-CaO) as solid catalysts. Due to catalyst leach-ing, homogeneous contribution was found to be significant so thesecond order model was used to describe the reaction kinetics asan initial solution. On comparing the fitted data with experimen-tal data there results are not compatible so this model was notrepresentative. It was found that ER was the best model to repre-sent the reaction kinetics as it had lower sum of squares error thanLHHW model. However, even the ER model cannot be consideredto be totally appropriate due to leaching which make the reactionpartially homogeneous.
Recently the kinetics of methanolysis reaction over complexheterogeneous catalysts, prepared through simple synthesis pro-cess or derived from sustainable sources, was investigated [35].When K2O/NaX was used for catalyzing the methanolysis of saf-flower oil, it was found that the best kinetic model to fit theexperimental data is a model based on Eley–Rideal mechanismwhile the rate determining step was assumed to be the methanoladsorption step [36]. In 2013, Kumar and Ali [37] investigated thetransesterification of Low-quality triglycerides over a Zn/CaO and
they observed that the reaction follows a pseudo first order kineticmodel. Feyzi and Khajavia [38] studied the kinetics of biodiesel syn-thesis from sunflower oil using Ba-Sr/ZSM-5 nano-catalyst wherethey found out that the reaction can be described by pseudo
WINDOWS
Highlight
WINDOWS
Highlight
WINDOWS
Highlight
WINDOWS
Highlight
WINDOWS
Highlight
WINDOWS
Highlight
WINDOWS
Highlight
WINDOWS
Highlight
WINDOWS
Highlight
WINDOWS
Highlight
WINDOWS
Highlight
WINDOWS
Highlight
WINDOWS
Highlight
WINDOWS
Highlight
WINDOWS
Highlight
WINDOWS
Highlight
WINDOWS
Highlight
WINDOWS
Highlight
WINDOWS
Highlight
WINDOWS
Highlight
WINDOWS
Highlight
WINDOWS
Highlight
1 sis B: Environmental 206 (2017) 146–157
ssvttabtftKidtsaLCacwfitdyfbwmtofikaptmnp
oeikdbaawepwufvfccotss
mci
Table 1Physical Properties of Soybean Oil used [59,60].
Property Value (unit)
Density 20 ◦C 0.9261 g/mLViscosity 20 ◦C 58.5–62.2 cPSpecific Heat Capacity 20 ◦C 0.448 cal/g ◦CHeat of combustion 9450–9388 cal/gSmoke point 245 ◦CFlash Point 324 ◦CFire Point 360 ◦C
◦
determined. Typical chemical composition of CKD was determinedusing Axios XRF (Axios, Sequential WD XRF Spectrometer, PANa-lytical 2005). Sieve analysis test was carried out using 90, 75, 63 and50 �m sieves. The morphology of used CCKD was determined using
Table 2
48 E.G. Al-Sakkari et al. / Applied Cataly
econd order kinetic model. Nambo et al. [39] conducted a kinetictudy on olive oil methanolysis using ZnO nano-rods synthesizedia a wet chemistry approach as catalysts where it was observedhat at short reaction time the reaction was controlled by massransfer, on the other hand, as the reaction proceeded to moder-te and longer time, the reaction kinetics dominated where it cane described by a pseudo first order kinetic model. The applica-ion of CaO/SiO2, prepared through sol–gel technique, as a catalystor biodiesel production was investigated as well as the kinetics ofhe reaction which obeys a pseudo first order kinetic model [40].aur and Ali conducted several studies to investigate the usabil-
ty of different solid catalysts to catalyze biodiesel production fromifferent feedstocks as well as studying the reaction kinetics forhese different systems [41–44]. These studies included ethanoly-is of jatropha oil using molybdenum impregnated calcium oxides solid catalyst [41], ethanolysis of waste cottonseed oil usingi/NiO heterogeneous catalyst [42], preparation and utilization ofe/ZrO2−TiO2/SO4
2− as solid catalyst for the esterification of fattycids [43] and using lithium zirconate for simultaneous esterifi-ation and transesterification of low quality triglycerides [44]. Itas found that the reaction in these different cases follows pseudorst order kinetics and on applying Koros–Nowak test on these sys-ems it was demonstrated that reaction rates are independent fromiffusion limitations. In addition, the kinetics of jojoba oil butanol-sis over CaO derived from mussel shell was studied where it wasound that the reaction can be modeled using Eley–Rideal modelased on a three-step mechanism, whereas, the overall reactionas controlled by the surface reaction step [45]. On using wasteussel shells and demineralized (DM) water treatment precipi-
ates as CaO and MgO sources in order to catalyze waste cookingil transesterification, Moradi et al. [46] indicated that a pseudorst order kinetic model was satisfactory for modeling the reactioninetics. Aside from these studies, Avhad et al. [47] examined thepplication of glycerol- enriched CaO derived from Mytilus Gallo-rovincialis shells for catalyzing ethanolysis of avocado oil wherehey investigated that the reaction can obey a previously developed
athematical model [45] based on Eley–Rideal three-step mecha-ism however in this study of avocado oil ethanolysis the overallrocess was controlled by the ethanol-adsorption step.
Natural wastes can however be used as non hazardous sourcesf calcium such as, fertilizers, animal feed supplements and nutri-nts [48–50]. Other industrial wastes such as wastes from steelndustries [51], waste concrete [52], wood ash [53] and cementiln dust, can be used as sources of solid catalysts for biodiesel pro-uction. Cement kiln dust can be considered a promising sourceecause of its high yearly production rate as well as it containsctive metal oxides that have the ability of catalyzing triglycerideslcoholysis to produce biodiesel. The reuse of different industrialastes, especially solid wastes, in other applications can be consid-
red the recent general trend in order of reducing environmentalollution [54]. Taking into consideration material conservation asell as minimization of undesired environmental impacts, CKD wassed, in many studies, as a construction material, adsorbent andertilizer [55,56]. On the same line, using CKD can add economicalalue to production process as using a certain waste is a good wayor process cost minimization; as in this case the price of catalystan be eliminated or highly decreased relative to the price of otheratalysts such as homogeneous KOH catalyst. CKD consists mainlyf calcium oxide ranging from 19.45% to 64% by mass in additiono magnesium oxide. From literature, it may be observed that itspecific surface area ranges from 0.23 m2/g to 1.4 m2/g [57], andometimes it may reach higher values (e.g. 11.76 m2/g) [58].
The aim of this work is to study the kinetics of soybean oilethanolysis using cement kiln dust (CKD) as a heterogeneous
atalyst as well as to obtain the best rate equation that fits exper-mental data to generate an equation which relates concentration
Melting Point 0.6 CPour Point −12 to −16 ◦CCloud Point −9 ◦C
with time, taking into consideration the economical issues of usingsuch catalyst on choosing the methanol to oil molar ratio and cat-alyst loading (i.e. minimization of process cost by decreasing theusage of methanol and increasing the utilization of waste CKD).Finally, it will be proved that the reaction is independent from dif-fusion limitations through calculation of the external and internalmass transfer resistances in order to prove that they are negligible.
2. Materials and methods
2.1. Materials
2.1.1. Soybean oilThe oil used in this study is soybean oil obtained from Egyptian
food market and it has the properties tabulated in Tables 1 and 2.Virgin oil was used in this study as a first step to study the feasi-bility of using CKD to catalyze biodiesel production to ensure thatthere are no contaminants in the oil during the first study. Furtherwork will be performed using waste vegetable oil to decrease thedependence on virgin oils in biodiesel production.
2.1.2. Cement kiln dustThe catalyst used in this study was cement kiln dust (CKD)
obtained from Turah Cement Factory located in Southern Cairo.
2.1.3. MethanolMethanol (analytical grade) was used to transesterify soybean
oil. It was purchased from El-Nasr Pharmaceutical Chemicals Co.(ADWIC) (Mwt. 32 and purity of 99.8%).
2.2. Methods
2.2.1. Catalyst preparationCKD used to catalyze the reaction of soybean oil with methanol
to produce biodiesel was calcined for 4 h at 740 ◦C to ensure thatno humidity is left in the catalyst and to convert calcium carbon-ate into calcium oxide, the effective substance that catalyzes thetransesterification reaction.
2.2.2. Catalyst characterizationProperties of used calcined CKD (CCKD) such as specific sur-
face area, particle size distribution and chemical composition were
canning electron microscope “FEI QUANTA, Inspect S microscope”hile XRD analysis of this CCKD was obtained using Bruker D8dvance XRD Analyzer. Specific surface area and the full isothermf CCKD were obtained by applying BET gas sorption techniqueith nitrogen as adsorbate at 77.35 K using “Quantachrome NOVAutomated Gas Sorption System”. Average pore size and total poreolume values were determined according to DFT method usinghe same gas sorption system. The basic strength (H ) of CCKD wasetermined using Hammett indicators method [52]. Thermal gravi-etric analysis of used CKD was done using SDT Q600 Thermalnalysis Instrument.
.2.3. Transesterification reactionTransesterification was carried out in 250 ml reaction flasks
eated on a hot plate and equipped with water condenser, mag-etic stirrer and thermometer. Fifty grams of the oil was introduced
nto the reaction flask and then heated to the desired temperature.alcined CKD was added to the oil with alcohol and the mixtureas continuously stirred at 800 rpm. The mixture was filtered usinghatman ashless filter paper grade 42 (2.5 �m) to remove any
uspended solids and then carefully transferred to a separating fun-el and allowed to stand overnight. The lower layer (glycerol andethanol) and the upper layer (methyl esters and some methanol)ere separated in two separate beakers and methanol evaporated
t 105 ◦C. Overnight gravity separation was necessary for sepa-ating ester and glycerol layers due to their density differences.his is facilitated by the fact that the solubility of glycerol in ester-ethanol layer is negligible at ambient conditions. The purity and
atty acids methyl ester composition of the produced biodieselere characterized using Agilent HP 6890 GC system equippedith flame ionization detector (FID). The column used was hp 5
olumn type of 30 m length and 0.5 mm internal diameter. Percent-ge conversion was estimated using glycerol base by weighing theroduced glycerol [61,62]. At complete conversion, one mole of oilroduces one mole of glycerol. On mass basis, 50 g of oil producebout 5 g of glycerol.
x = weight of produced glycerol
weight of produced glycerol at complete conversion∗ 100%
(1)
or 50 g of oil, the conversion can be calculated by Eqn.2:
x = weight of produced glycerol in grams
5∗ 100% (2)
.3. Theoretical consideration
Three kinetic models were suggested, power law kinetics,ley–Rideal and Langmuir–Hinshelwood mechanisms.
.3.1. Power law modelsFirst, power law kinetics were tested, both first order and sec-
nd order reaction models as in the case of using homogeneousatalyst. The mechanism of homogeneous catalyst is illustrated byhe following set of reactions.
G + MA
k1→←−
k2
FAME + DG
G + MA
k3→←−
k4
FAME + MG
Environmental 206 (2017) 146–157 149
MG + MA
k5→←−
k6
FAME + GL
Overall reaction:
TG + 3MA
kt→←−k−t
3FAME + GL
Some assumptions can be taken into consideration in order tosimplify studying transesterification reaction kinetics [63,34]. Forkinetic studies, some researchers selected the three step reaction todescribe transesterification, which is complex and time consuming.This mechanism was replaced by simpler one step kinetics, withrespect to triglyceride and methyl ester only, which is the over-all transesterification reaction [64]. In the present work the finaloverall reaction was suggested to be the only one to be used todetermine the kinetics [65–68] as the concentration of partial glyc-erides were negligible compared to methanol, glycerol and oil aswell as biodiesel which indicate that these intermediate reactionsare fast. The reliability of this assumption was tested statisticallywith different tests such as R2 (determination coefficient), t-testand Fisher criterion. The reaction rate may beconsidered as in Eq.(3).
r = kt ∗ [TG] ∗ [MA]3 − k−t ∗ [FAME]3 ∗ [GL] (3)
As the concentration of methyl alcohol almost does not change dueto its use in large excess so the general rate equation will be:
r = K ∗ [TG]− k−t ∗ [FAME]3 ∗ [GL] (4)
where
r = −d [TG]dt
(5)
The rate equation was tested in different forms depending on dif-ferent assumptions. The following is a brief of the suggested formsand the assumptions led to those forms:
1) r = K ∗ [TG]First order in triglyceride concentration without theterm of backward reaction. This assumption was suggested dueto the high excess of methanol which shifts the reaction in theforward direction.
2) r = K ∗ [TG]2Second order in triglyceride concentration with-out the term of backward reaction. This assumption was alsosuggested due to the high excess of methanol which shifts thereaction in the forward direction.
3) r = K ∗ [TG]− k−t ∗ [FAME]3 ∗ [GL]First order in triglyceride con-centration and the term of backward reaction was considered.
4) r = K ∗ [TG]2 − k−t ∗ [FAME]3 ∗ [GL]Second order in triglycerideconcentration and the term of backward reaction was consid-ered.
2.3.2. Eley–Rideal kineticsThe suggested mechanism for Eley–Rideal method is illustrated
in the following three equilibrium reactions:
3MA + 3S ↔ 3MA.S
3MA.S + TG ↔ 3FAME + GL.S + 2S
GL.S ↔ GL + S
WINDOWS
Highlight
WINDOWS
Highlight
WINDOWS
Highlight
WINDOWS
Highlight
WINDOWS
Highlight
WINDOWS
Highlight
1 sis B: Environmental 206 (2017) 146–157
Tatd
r
r
r
Fo
C
Al
K
I
C
K
A
C
C
Sfi
r
K
K
2
otm
T
3
3
G
3
Tmtls
e
Table 3Chemical Composition of used CCKD.
Concentration by wt% Main Constituents
7.01 SiO2
0.27 TiO2
1.90 Al2O3
0.05 MnO2.31 Fe2O3
tot.
1.14 MgO45.89 CaO2.49 Na2O5.60 K2O0.06 P2O5
2.43 SO3
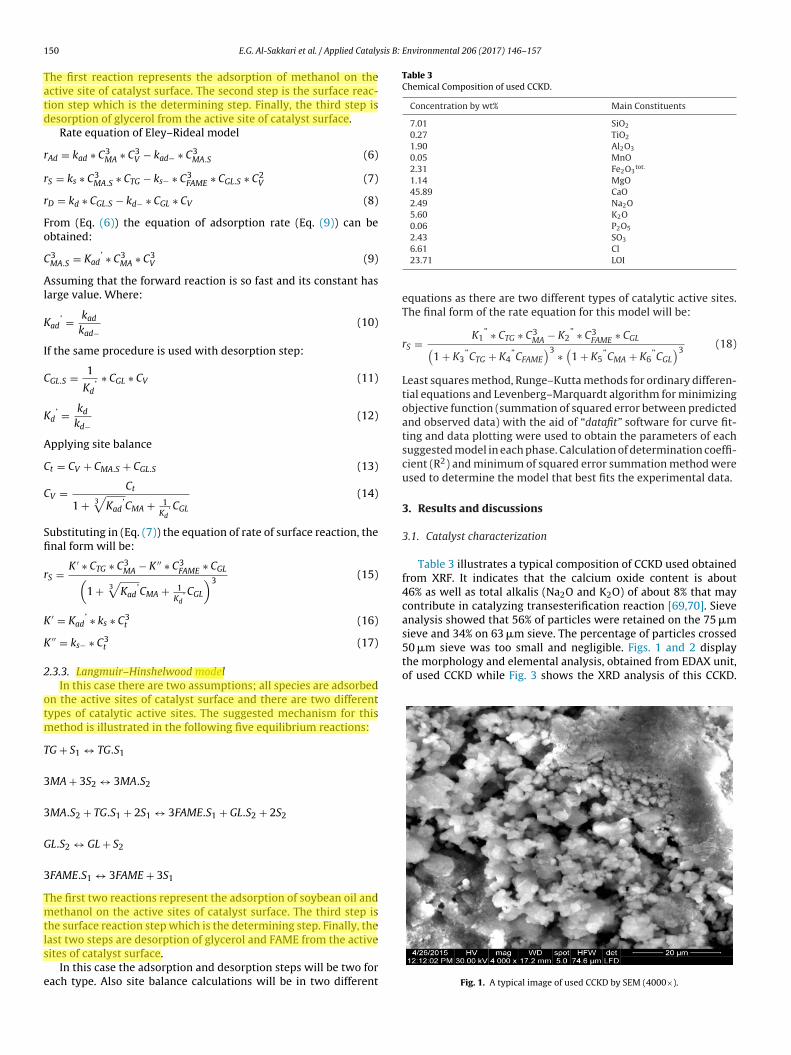
sieve and 34% on 63 �m sieve. The percentage of particles crossed50 �m sieve was too small and negligible. Figs. 1 and 2 displaythe morphology and elemental analysis, obtained from EDAX unit,of used CCKD while Fig. 3 shows the XRD analysis of this CCKD.
50 E.G. Al-Sakkari et al. / Applied Cataly
he first reaction represents the adsorption of methanol on thective site of catalyst surface. The second step is the surface reac-ion step which is the determining step. Finally, the third step isesorption of glycerol from the active site of catalyst surface.
Rate equation of Eley–Rideal model
Ad = kad ∗ C3MA ∗ C3
V − kad− ∗ C3MA.S (6)
S = ks ∗ C3MA.S ∗ CTG − ks− ∗ C3
FAME ∗ CGL.S ∗ C2V (7)
D = kd ∗ CGL.S − kd− ∗ CGL ∗ CV (8)
rom (Eq. (6)) the equation of adsorption rate (Eq. (9)) can bebtained:
3MA.S = Kad
’ ∗ C3MA ∗ C3
V (9)
ssuming that the forward reaction is so fast and its constant hasarge value. Where:
ad’ = kad
kad−(10)
f the same procedure is used with desorption step:
GL.S =1
Kd’∗ CGL ∗ CV (11)
d’ = kd
kd−(12)
pplying site balance
t = CV + CMA.S + CGL.S (13)
V =Ct
1 + 3√
Kad’CMA + 1
Kd’ CGL
(14)
ubstituting in (Eq. (7)) the equation of rate of surface reaction, thenal form will be:
S =K ′ ∗ CTG ∗ C3
MA − K ′′ ∗ C3FAME ∗ CGL(
1 + 3√
Kad’CMA + 1
Kd’ CGL
)3(15)
′ = Kad’ ∗ ks ∗ C3
t (16)
′′ = ks− ∗ C3t (17)
.3.3. Langmuir–Hinshelwood modelIn this case there are two assumptions; all species are adsorbed
n the active sites of catalyst surface and there are two differentypes of catalytic active sites. The suggested mechanism for this
ethod is illustrated in the following five equilibrium reactions:
G + S1 ↔ TG.S1
MA + 3S2 ↔ 3MA.S2
MA.S2 + TG.S1 + 2S1 ↔ 3FAME.S1 + GL.S2 + 2S2
L.S2 ↔ GL + S2
FAME.S1 ↔ 3FAME + 3S1
he first two reactions represent the adsorption of soybean oil andethanol on the active sites of catalyst surface. The third step is
he surface reaction step which is the determining step. Finally, the
ast two steps are desorption of glycerol and FAME from the activeites of catalyst surface.
In this case the adsorption and desorption steps will be two forach type. Also site balance calculations will be in two different
6.61 Cl23.71 LOI
equations as there are two different types of catalytic active sites.The final form of the rate equation for this model will be:
rS =K1
” ∗ CTG ∗ C3MA − K2
” ∗ C3FAME ∗ CGL(
1 + K3”CTG + K4
”CFAME
)3 ∗(
1 + K5”CMA + K6
”CGL
)3(18)
Least squares method, Runge–Kutta methods for ordinary differen-tial equations and Levenberg–Marquardt algorithm for minimizingobjective function (summation of squared error between predictedand observed data) with the aid of “datafit” software for curve fit-ting and data plotting were used to obtain the parameters of eachsuggested model in each phase. Calculation of determination coeffi-cient (R2) and minimum of squared error summation method wereused to determine the model that best fits the experimental data.
3. Results and discussions
3.1. Catalyst characterization
Table 3 illustrates a typical composition of CCKD used obtainedfrom XRF. It indicates that the calcium oxide content is about46% as well as total alkalis (Na2O and K2O) of about 8% that maycontribute in catalyzing transesterification reaction [69,70]. Sieveanalysis showed that 56% of particles were retained on the 75 �m
Fig. 1. A typical image of used CCKD by SEM (4000×).
WINDOWS
Highlight
WINDOWS
Highlight
WINDOWS
Highlight
WINDOWS
Highlight
E.G. Al-Sakkari et al. / Applied Catalysis B: Environmental 206 (2017) 146–157 151
XcoTCitwcp1m
Table 4Physical Properties of used CCKD.
Property Value unit
Specific Surface Area 17.81 m2/gAverage Pore Size 13 APore Volume 0.0115 cc/gParticle Density 2400 kg/m3
Bulk Density 700 kg/m3
0.1
1
10
100
0 0.1 0. 2 0.3 0. 4 0.5 0. 6 0.7 0. 8 0.9 1
Volu
me
CC/g
Rela�ve Pressure P/Po
Fig. 2. Elemental Analysis of used CCKD obtained from EDAX unit.
RD pattern showed five sharp diffraction peaks produced by well-rystallized cubic calcium oxide and some weak and smaller peaksf other components such as Ca(OH)2 and sodium calcium silicate.able 4 summarizes some important physical properties of usedCKD while Figs. 4 and 5 display the full adsorption-desorption
sotherm and multipoint BET plot, respectively. It may be observedhat the pore volume and specific surface area are relatively lowhich indicates that CCKD used is not porous and the transesterifi-
ation reaction takes place only on the outer surface of the catalystarticles. It was found that the value of (H ) lies between 15 and8.4. It was also observed that a solution of CCKD (0.5 g in 20 mlethanol) has a pH of about 12.5 which reveals strong basicity of
Fig. 3. XRD Pattern
Fig. 4. Adsorption-Desorption Isotherm of used CCKD.
CCKD. Thermal gravimetric analysis of used CKD is illustrated inFig. 6; it may be observed from the figure that, decomposition ofcalcium hydroxide occurred in the range 350–400 ◦C [71] while cal-cium carbonate was decomposed at temperature range from 550 ◦C
to 700 ◦C [72]. Volatilization of alkali salts could be the cause of theadditional weight losses.
of used CCKD.
152 E.G. Al-Sakkari et al. / Applied Catalysis B: Environmental 206 (2017) 146–157
R² = 0.998 3
0102030405060708090
100
0 0.0 5 0.1 0.1 5 0. 2 0.2 5 0.3 0.3 5
1/[W
((Po/
P)-1
)]
Rela�ve Pressure P/Po
BET Plot
Fig. 5. Multipoint BET Plot.
-0.1
0
0.1
0.2
0.3
0.4
0.5
50
60
70
80
90
100
110
0 100 200 300 400 500 600 700 800 900 1000
Wei
ght (
%)
Temperature (oC)
Deriv. Weight (%/oC)
Fig. 6. TGA Pattern of used CKD.
0
10
20
30
40
50
60
0 1 2 3 4 5 6
%x
t, Time (h r)
T = 65 CT = 55 CT = 40 C
FC
3
waa
wt[s
f(phtrt
46
48
50
52
54
56
58
8 9 10 11 12 13 14 15 16
Conv
ersi
on%
Molar Ra�o
Fig. 8. Effect of molar ratio on conversion (at 3.5% catalyst loading and 3 h reactiontime).
48
49
50
51
52
53
54
55
56
1 2 3 4 5 6
Conv
ersi
on%
Catalyst Loadin g wt.%
ig. 7. Effect of temperature on Soybean oil transesterification with methanol usingKD as a catalyst (12:1 molar ratio and 3.5% catalyst loading).
.2. Experimental results
Transesterification was done using soybean oil and methanolith constant molar ratio of 12:1 and CKD catalyst loading of 3.5%
t three different temperatures 40, 55 and 65 ◦C. The conversionsre plotted versus time in Fig. 7.
The effect of molar ratio and catalyst loading on reaction extentere investigated in order to get the optimum of each in soybean oil
ransesterification using calcined CKD as a heterogeneous catalyst73]. Figs. 8 and 9 illustrate the effect of these two variables onoybean oil conversion to biodiesel.
The agitation speed was kept at a constant value of 800 rpm;rom Fig. 8, it is obvious that using higher excess of methanolhigher methanol to oil ratio) shifts the reaction to the forwardath which increases reaction extent as well as its rate. On the other
and, as catalyst loading increases, reaction conversion decreases,hat is illustrated in Fig. 9, due to the increase of mass transferesistance which decreases mass transfer rate and consequentlyhe reaction rate.
Fig. 9. Effect of catalyst loading on conversion (at 12:1 molar ratio and 3 h reactiontime).
The values of reaction parameters, molar ratio of 12:1 and cat-alyst loading of 3.5%, were chosen for this study for economicalreasons and in order to use the generated rate equation in the mod-eling of an industrial scale reactor for biodiesel production [74]. Inthis study it was desired to use methanol as low as it could be inorder to decrease the cost of reactants to make the process moreeconomic, while in the case of CKD, it was desired to utilize as muchas possible of this waste, which produced in huge amounts, as it isrelatively cheap (relative to other catalysts such as homogeneousKOH catalyst) which can also increase biodiesel production processfeasibility and economy.
3.3. Homogeneous models
These models are suggested due to presence of soluble alka-line oxides (i.e. Na2O and K2O) which may contribute in catalyzingtransesterification homogeneously as well as leaching of solidoxides. After fitting the experimental data obtained at 65 ◦C to thefirst suggested two kinetic models Eqs. (19) and (20) reaction rate(mol L−1 h−1) equations were obtained.
r = 0.1637 ∗ CTG (19)
r = 0.3646 ∗ C2TG (20)
It was observed that the assumption of second order is better thanfirst order but both of them cannot represent the kinetics of trans-esterification reaction using calcined CKD as a solid catalyst. Fig. 10illustrates this interpretation. Scattered points in this figure repre-
sent the experimental data while the dashed line is the first orderkinetics and the smooth line is the second order kinetics. It is obvi-ous that these two models cannot fit heterogeneously catalyzedtransesterification as the error ranges from about 16% to about 35%
E.G. Al-Sakkari et al. / Applied Catalysis B: Environmental 206 (2017) 146–157 153
0
0.1
0.2
0.3
0.4
0.5
0.6
0.7
0 2 4 6
C TG(m
ol L
- 1)
Observedconc entra�on
1st order mo del
2nd order model
ic
berwcm
r
r
Tmt
r
TmofSe
3
ba
3
cera
r
r
3
a
Table 5Determination Coefficient (R2) for Suggested Kinetic Models.
Kinetic Model R2
Reversible First order model 0.9809Reversible Second order model 0.9768Homogeneous model (variable methanol concentration) 0.9621Irreversible Eley–Rideal model 0.6339Reversible Eley–Rideal model 0.9908Langmuir–Hinshelwood model 0.9628
Table 6Summation of squared errors for some suggested kinetic models.
Kinetic Model Summation ofsquared errors
Reversible First order model 0.00055Reversible Second order model 0.00204Homogeneous model (variable methanol concentration) 0.00152Reversible Eley–Rideal model 0.00027Langmuir–Hinshelwood model 0.00054
Table 7Results of t-test.
t (h)
Fig. 10. Irreversible Homogeneous Models.
n the case of first order model, and ranges from 10% to 26% in thease of second order model.
The second phase of generating rate equation was to add theackward reaction term of this reversible reaction. Three mod-ls were suggested in this case. The first one was first order withespect to oil concentration and the second one was second orderith respect to oil concentration. In both two models methanol
oncentration was constant. Eq. (21) represents the first orderodel and Eq. (22) represents second order kinetics at 65 ◦C.
s = 0.324 ∗ CTG − 0.2565 ∗ CGL ∗ C3FAME (21)
s = 0.5974 ∗ C2TG − 0.132 ∗ CGL ∗ C3
FAME (22)
he third suggested model in this phase is to consider a variableethanol concentration. Eq. (23) is the mathematical representa-
ion of this model
s = 0.001 ∗ CTG ∗ C3MEOH − 0.1708 ∗ CGL ∗ C3
FAME (23)
hese three models showed good results and fitting to the experi-ental data as the values of determination coefficient for each one
f them are 0.9809, 0.9768 and 0.9621, respectively; they will beurther discussed and compared to the heterogeneous models inection 3.5 in order to select the best model that fits the obtainedxperimental data.
.4. Heterogeneous catalysis models
For heterogeneous catalytic reactions, kinetics of reaction cane modeled using Eley–Rideal and Langmuir–Hinshelwood modelsnd the results will be illustrated in the following subsections.
.4.1. Eley–Rideal kinetics modelIn this case, two models were suggested. The first one was to
onsider an irreversible reaction due to high agitation rate andxcess methanol. In second model, reaction was considered to beeversible and the term of backward reaction was added. Eqs. (24)nd (25) represent the rate equations of these two models at 65 ◦C.
S =0.8043 ∗ CTG ∗ C3
MA
(1 + 1.0376CMA + 14.7693CGL)3(24)
S =0.6731 ∗ CTG ∗ C3
MA − 139.3176 ∗ C3FAME ∗ CGL
(1 + 1.1876CMA − 2.6739CGL)3(25)
.4.2. Langmuir–Hinshelwood modelThe last generated model is the L-H kinetic model. Triglyceride
nd FAME are suggested to be adsorbed on the same kind of sites
The validity of each rate equation was evaluated by calculatingdetermination coefficient (R2) for each one. The results of this testare tabulated in Table 5 from which it may be observed that (R2)ranges from 0.96 to about 0.99 except the value related to the irre-versible Eley–Rideal kinetic model which is about 0.634 and thedetermination coefficient of reversible Eley–Rideal kinetic modelhas the highest value among the suggested kinetic models which is0.9908. But as the values are so close so another method should beused to determine which model is the best one to fit the obtainedexperimental data.
3.5. Selection of best available model
The selection of the most suitable kinetic model that fits theexperimental data obtained in the range of present study was donethrough the least squares method. The concept of this method is toget the summation of squared errors at different points for all mod-els then the best one of them has the least summation of squarederrors. Table 6 summarizes the results of applying this method ondifferent models from which it is obvious that models of pure het-erogeneous catalyzed reactions have lower summations than thoseof homogeneous models. The best model that describes the kinet-ics of Soybean oil transesterification in this study is the reversibleEley–Rideal kinetic model.
The validity of reversible Eley–Rideal model was further testedusing Fisher criterion. It was found that Fcritical = 9.5520 andFcalculated = 1.8434 which means that reversible Eley–Rideal modelfits the experimental data adequately. On using Chi-square cri-terion, the critical Chi-square is 11.0705 and the calculated oneis 0.0301which means that the model fairly fits the experimentaldata. Significance of each parameter was evaluated using t-test at
confidence level of 95%. The results of this test are illustrated inTable 7 noting that the critical t-value is 3.1824. Results of this teststatistic show that all four parameters are at high significance. Theconfidence level in these statistical tests was 95%.
WINDOWS
Highlight
WINDOWS
Highlight
WINDOWS
Highlight
WINDOWS
Highlight
WINDOWS
Highlight
WINDOWS
Highlight
WINDOWS
Highlight
WINDOWS
Highlight
154 E.G. Al-Sakkari et al. / Applied Catalysis B: Environmental 206 (2017) 146–157
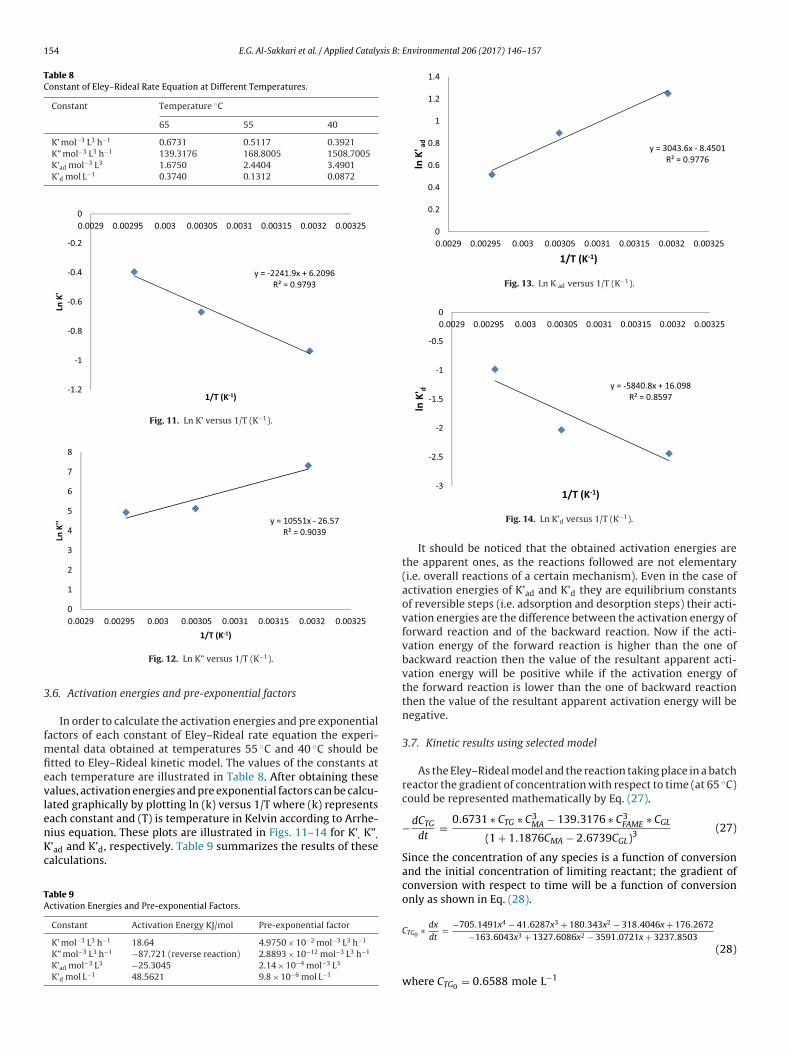
Table 8Constant of Eley–Rideal Rate Equation at Different Temperatures.
.6. Activation energies and pre-exponential factors
In order to calculate the activation energies and pre exponentialactors of each constant of Eley–Rideal rate equation the experi-
ental data obtained at temperatures 55 ◦C and 40 ◦C should betted to Eley–Rideal kinetic model. The values of the constants atach temperature are illustrated in Table 8. After obtaining thesealues, activation energies and pre exponential factors can be calcu-ated graphically by plotting ln (k) versus 1/T where (k) representsach constant and (T) is temperature in Kelvin according to Arrhe-
ius equation. These plots are illustrated in Figs. 11–14 for K’, K”,
’ad and K’d, respectively. Table 9 summarizes the results of thesealculations.
able 9ctivation Energies and Pre-exponential Factors.
Constant Activation Energy KJ/mol Pre-exponential factor
It should be noticed that the obtained activation energies arethe apparent ones, as the reactions followed are not elementary(i.e. overall reactions of a certain mechanism). Even in the case ofactivation energies of K’ad and K’d they are equilibrium constantsof reversible steps (i.e. adsorption and desorption steps) their acti-vation energies are the difference between the activation energy offorward reaction and of the backward reaction. Now if the acti-vation energy of the forward reaction is higher than the one ofbackward reaction then the value of the resultant apparent acti-vation energy will be positive while if the activation energy ofthe forward reaction is lower than the one of backward reactionthen the value of the resultant apparent activation energy will benegative.
3.7. Kinetic results using selected model
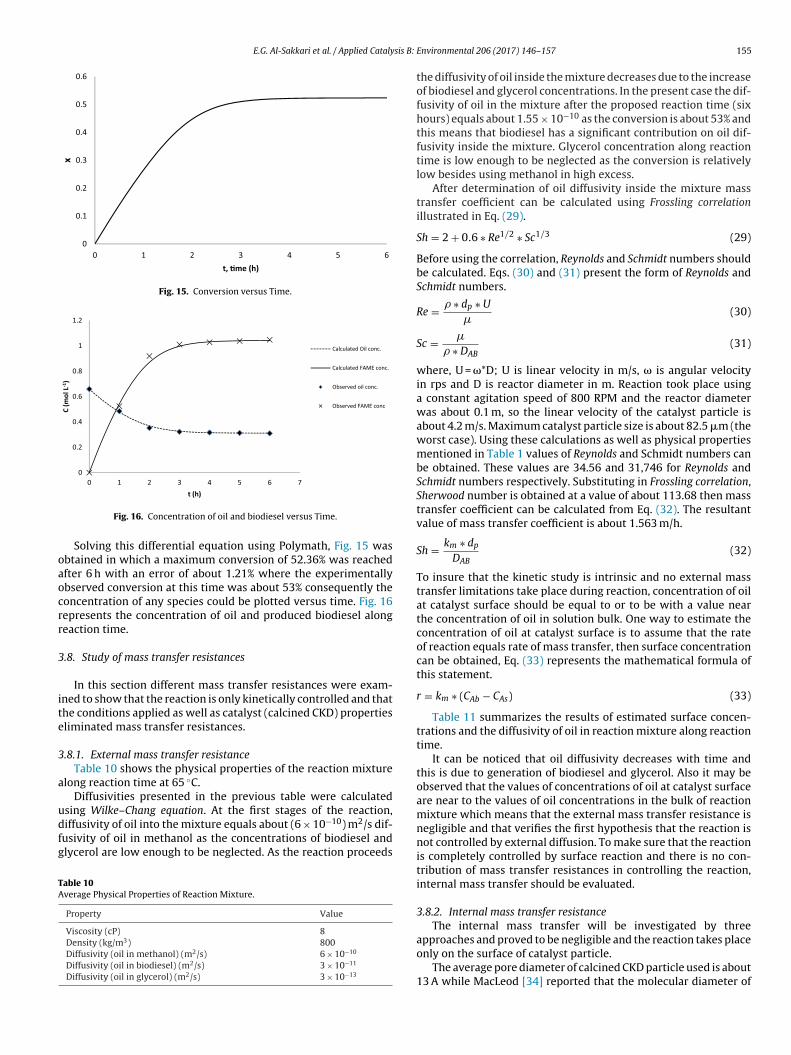
As the Eley–Rideal model and the reaction taking place in a batchreactor the gradient of concentration with respect to time (at 65 ◦C)could be represented mathematically by Eq. (27).
−dCTG
dt= 0.6731 ∗ CTG ∗ C3
MA − 139.3176 ∗ C3FAME ∗ CGL
(1 + 1.1876CMA − 2.6739CGL)3(27)
Since the concentration of any species is a function of conversionand the initial concentration of limiting reactant; the gradient ofconversion with respect to time will be a function of conversiononly as shown in Eq. (28).
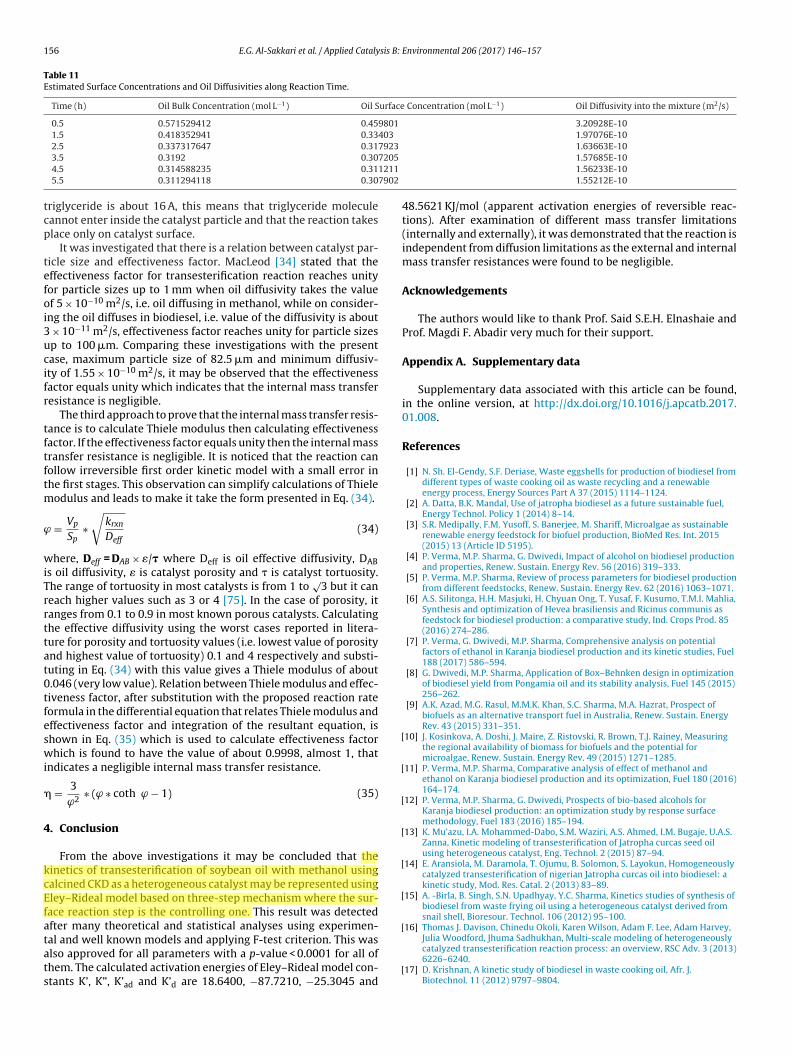
Fig. 16. Concentration of oil and biodiesel versus Time.
Solving this differential equation using Polymath, Fig. 15 wasbtained in which a maximum conversion of 52.36% was reachedfter 6 h with an error of about 1.21% where the experimentallybserved conversion at this time was about 53% consequently theoncentration of any species could be plotted versus time. Fig. 16epresents the concentration of oil and produced biodiesel alongeaction time.
.8. Study of mass transfer resistances
In this section different mass transfer resistances were exam-ned to show that the reaction is only kinetically controlled and thathe conditions applied as well as catalyst (calcined CKD) propertiesliminated mass transfer resistances.
.8.1. External mass transfer resistanceTable 10 shows the physical properties of the reaction mixture
long reaction time at 65 ◦C.Diffusivities presented in the previous table were calculated
sing Wilke–Chang equation. At the first stages of the reaction,iffusivity of oil into the mixture equals about (6 × 10⁻¹⁰) m2/s dif-usivity of oil in methanol as the concentrations of biodiesel andlycerol are low enough to be neglected. As the reaction proceeds
able 10verage Physical Properties of Reaction Mixture.
the diffusivity of oil inside the mixture decreases due to the increaseof biodiesel and glycerol concentrations. In the present case the dif-fusivity of oil in the mixture after the proposed reaction time (sixhours) equals about 1.55 × 10⁻¹⁰ as the conversion is about 53% andthis means that biodiesel has a significant contribution on oil dif-fusivity inside the mixture. Glycerol concentration along reactiontime is low enough to be neglected as the conversion is relativelylow besides using methanol in high excess.
After determination of oil diffusivity inside the mixture masstransfer coefficient can be calculated using Frossling correlationillustrated in Eq. (29).
Sh = 2 + 0.6 ∗ Re1/2 ∗ Sc1/3 (29)
Before using the correlation, Reynolds and Schmidt numbers shouldbe calculated. Eqs. (30) and (31) present the form of Reynolds andSchmidt numbers.
Re = � ∗ dp ∗ U
�(30)
Sc = �
� ∗ DAB(31)
where, U = �*D; U is linear velocity in m/s, � is angular velocityin rps and D is reactor diameter in m. Reaction took place usinga constant agitation speed of 800 RPM and the reactor diameterwas about 0.1 m, so the linear velocity of the catalyst particle isabout 4.2 m/s. Maximum catalyst particle size is about 82.5 �m (theworst case). Using these calculations as well as physical propertiesmentioned in Table 1 values of Reynolds and Schmidt numbers canbe obtained. These values are 34.56 and 31,746 for Reynolds andSchmidt numbers respectively. Substituting in Frossling correlation,Sherwood number is obtained at a value of about 113.68 then masstransfer coefficient can be calculated from Eq. (32). The resultantvalue of mass transfer coefficient is about 1.563 m/h.
Sh = km ∗ dp
DAB(32)
To insure that the kinetic study is intrinsic and no external masstransfer limitations take place during reaction, concentration of oilat catalyst surface should be equal to or to be with a value nearthe concentration of oil in solution bulk. One way to estimate theconcentration of oil at catalyst surface is to assume that the rateof reaction equals rate of mass transfer, then surface concentrationcan be obtained, Eq. (33) represents the mathematical formula ofthis statement.
r = km ∗ (CAb − CAs) (33)
Table 11 summarizes the results of estimated surface concen-trations and the diffusivity of oil in reaction mixture along reactiontime.
It can be noticed that oil diffusivity decreases with time andthis is due to generation of biodiesel and glycerol. Also it may beobserved that the values of concentrations of oil at catalyst surfaceare near to the values of oil concentrations in the bulk of reactionmixture which means that the external mass transfer resistance isnegligible and that verifies the first hypothesis that the reaction isnot controlled by external diffusion. To make sure that the reactionis completely controlled by surface reaction and there is no con-tribution of mass transfer resistances in controlling the reaction,internal mass transfer should be evaluated.
3.8.2. Internal mass transfer resistanceThe internal mass transfer will be investigated by three
approaches and proved to be negligible and the reaction takes placeonly on the surface of catalyst particle.
The average pore diameter of calcined CKD particle used is about13 A while MacLeod [34] reported that the molecular diameter of
156 E.G. Al-Sakkari et al. / Applied Catalysis B: Environmental 206 (2017) 146–157
Table 11Estimated Surface Concentrations and Oil Diffusivities along Reaction Time.
Time (h) Oil Bulk Concentration (mol L−1) Oil Surface Concentration (mol L−1) Oil Diffusivity into the mixture (m2/s)
riglyceride is about 16 A, this means that triglyceride moleculeannot enter inside the catalyst particle and that the reaction takeslace only on catalyst surface.
It was investigated that there is a relation between catalyst par-icle size and effectiveness factor. MacLeod [34] stated that theffectiveness factor for transesterification reaction reaches unityor particle sizes up to 1 mm when oil diffusivity takes the valuef 5 × 10⁻¹⁰ m2/s, i.e. oil diffusing in methanol, while on consider-ng the oil diffuses in biodiesel, i.e. value of the diffusivity is about
× 10−11 m2/s, effectiveness factor reaches unity for particle sizesp to 100 �m. Comparing these investigations with the presentase, maximum particle size of 82.5 �m and minimum diffusiv-ty of 1.55 × 10⁻¹⁰ m2/s, it may be observed that the effectivenessactor equals unity which indicates that the internal mass transferesistance is negligible.
The third approach to prove that the internal mass transfer resis-ance is to calculate Thiele modulus then calculating effectivenessactor. If the effectiveness factor equals unity then the internal massransfer resistance is negligible. It is noticed that the reaction canollow irreversible first order kinetic model with a small error inhe first stages. This observation can simplify calculations of Thiele
odulus and leads to make it take the form presented in Eq. (34).
= Vp
Sp∗√
krxn
Deff(34)
here, Deff = DAB× �/� where Deff is oil effective diffusivity, DABs oil diffusivity, � is catalyst porosity and � is catalyst tortuosity.he range of tortuosity in most catalysts is from 1 to
√3 but it can
each higher values such as 3 or 4 [75]. In the case of porosity, itanges from 0.1 to 0.9 in most known porous catalysts. Calculatinghe effective diffusivity using the worst cases reported in litera-ure for porosity and tortuosity values (i.e. lowest value of porositynd highest value of tortuosity) 0.1 and 4 respectively and substi-uting in Eq. (34) with this value gives a Thiele modulus of about.046 (very low value). Relation between Thiele modulus and effec-iveness factor, after substitution with the proposed reaction rateormula in the differential equation that relates Thiele modulus andffectiveness factor and integration of the resultant equation, ishown in Eq. (35) which is used to calculate effectiveness factorhich is found to have the value of about 0.9998, almost 1, that
ndicates a negligible internal mass transfer resistance.
= 3ϕ2∗ (ϕ ∗ coth ϕ − 1) (35)
. Conclusion
From the above investigations it may be concluded that theinetics of transesterification of soybean oil with methanol usingalcined CKD as a heterogeneous catalyst may be represented usingley–Rideal model based on three-step mechanism where the sur-ace reaction step is the controlling one. This result was detectedfter many theoretical and statistical analyses using experimen-
al and well known models and applying F-test criterion. This waslso approved for all parameters with a p-value < 0.0001 for all ofhem. The calculated activation energies of Eley–Rideal model con-tants K’, K”, K’ad and K’d are 18.6400, −87.7210, −25.3045 and
[
1.57685E-101.56233E-101.55212E-10
48.5621 KJ/mol (apparent activation energies of reversible reac-tions). After examination of different mass transfer limitations(internally and externally), it was demonstrated that the reaction isindependent from diffusion limitations as the external and internalmass transfer resistances were found to be negligible.
Acknowledgements
The authors would like to thank Prof. Said S.E.H. Elnashaie andProf. Magdi F. Abadir very much for their support.
Appendix A. Supplementary data
Supplementary data associated with this article can be found,in the online version, at http://dx.doi.org/10.1016/j.apcatb.2017.01.008.
References
[1] N. Sh. El-Gendy, S.F. Deriase, Waste eggshells for production of biodiesel fromdifferent types of waste cooking oil as waste recycling and a renewableenergy process, Energy Sources Part A 37 (2015) 1114–1124.
[2] A. Datta, B.K. Mandal, Use of jatropha biodiesel as a future sustainable fuel,Energy Technol. Policy 1 (2014) 8–14.
[3] S.R. Medipally, F.M. Yusoff, S. Banerjee, M. Shariff, Microalgae as sustainablerenewable energy feedstock for biofuel production, BioMed Res. Int. 2015(2015) 13 (Article ID 5195).
[4] P. Verma, M.P. Sharma, G. Dwivedi, Impact of alcohol on biodiesel productionand properties, Renew. Sustain. Energy Rev. 56 (2016) 319–333.
[5] P. Verma, M.P. Sharma, Review of process parameters for biodiesel productionfrom different feedstocks, Renew. Sustain. Energy Rev. 62 (2016) 1063–1071.
[6] A.S. Silitonga, H.H. Masjuki, H. Chyuan Ong, T. Yusaf, F. Kusumo, T.M.I. Mahlia,Synthesis and optimization of Hevea brasiliensis and Ricinus communis asfeedstock for biodiesel production: a comparative study, Ind. Crops Prod. 85(2016) 274–286.
[7] P. Verma, G. Dwivedi, M.P. Sharma, Comprehensive analysis on potentialfactors of ethanol in Karanja biodiesel production and its kinetic studies, Fuel188 (2017) 586–594.
[8] G. Dwivedi, M.P. Sharma, Application of Box–Behnken design in optimizationof biodiesel yield from Pongamia oil and its stability analysis, Fuel 145 (2015)256–262.
[9] A.K. Azad, M.G. Rasul, M.M.K. Khan, S.C. Sharma, M.A. Hazrat, Prospect ofbiofuels as an alternative transport fuel in Australia, Renew. Sustain. EnergyRev. 43 (2015) 331–351.
10] J. Kosinkova, A. Doshi, J. Maire, Z. Ristovski, R. Brown, T.J. Rainey, Measuringthe regional availability of biomass for biofuels and the potential formicroalgae, Renew. Sustain. Energy Rev. 49 (2015) 1271–1285.
11] P. Verma, M.P. Sharma, Comparative analysis of effect of methanol andethanol on Karanja biodiesel production and its optimization, Fuel 180 (2016)164–174.
12] P. Verma, M.P. Sharma, G. Dwivedi, Prospects of bio-based alcohols forKaranja biodiesel production: an optimization study by response surfacemethodology, Fuel 183 (2016) 185–194.
13] K. Mu’azu, I.A. Mohammed-Dabo, S.M. Waziri, A.S. Ahmed, I.M. Bugaje, U.A.S.Zanna, Kinetic modeling of transesterification of Jatropha curcas seed oilusing heterogeneous catalyst, Eng. Technol. 2 (2015) 87–94.
14] E. Aransiola, M. Daramola, T. Ojumu, B. Solomon, S. Layokun, Homogeneouslycatalyzed transesterification of nigerian Jatropha curcas oil into biodiesel: akinetic study, Mod. Res. Catal. 2 (2013) 83–89.
15] A. -Birla, B. Singh, S.N. Upadhyay, Y.C. Sharma, Kinetics studies of synthesis ofbiodiesel from waste frying oil using a heterogeneous catalyst derived fromsnail shell, Bioresour. Technol. 106 (2012) 95–100.
16] Thomas J. Davison, Chinedu Okoli, Karen Wilson, Adam F. Lee, Adam Harvey,
Julia Woodford, Jhuma Sadhukhan, Multi-scale modeling of heterogeneouslycatalyzed transesterification reaction process: an overview, RSC Adv. 3 (2013)6226–6240.
17] D. Krishnan, A kinetic study of biodiesel in waste cooking oil, Afr. J.Biotechnol. 11 (2012) 9797–9804.
18] J.F. Portha, F. Allain, V. Coupard, A. Dandeu, E. Girot, E. Schaer, L. Falk,Simulation and kinetic study of transesterification of triolein to biodieselusing modular reactors, Chem. Eng. J. 207–208 (1 (October)) (2012) 285–298,http://dx.doi.org/10.1016/j.cej.2012.06.106.
19] F. Allain, J.F. Portha, E. Girot, L. Falk, A. Dandeu, V. Coupard, Estimation ofkinetic parameters and diffusion coefficients for the transesterification oftriolein with methanol on a solid ZnAl2O4 catalyst, Chem. Eng. J. 283 (2016)833–845.
20] K. Ankur, W. Karen, F.L. Adam, S. Jhuma, Kinetic modeling studies ofheterogeneously catalyzed biodiesel synthesis reactions, Ind. Eng. Chem. Res.50 (2011) 4818–4830.
21] R. Klaewkla, M. Arend, W.F. Hoelderich, in: H. Nakajima (Ed.), A Review ofMass Transfer Controlling the Reaction Rate in Heterogeneous CatalyticSystems, Mass Transfer – Advanced Aspects, InTech, Rijeka, Croatia, 2011,ISBN: 978-953-307-636-2. vailable from: http://www.intechopen.com/books/mass-transfer-advanced-aspects/a-review-of-mass-transfer-controlling-thereaction-rate-in-heterogeneous-catalytic-systems.
22] H.S. Fogler, Elements of Chemical Reaction Engineering, 3rd edition,Prentice-Hall, New Delhi, India, 2005.
23] M.E. Davis, R.J. Davis, Fundamentals of Chemical Reaction Engineering, 1stedition, McGraw Hill, New York, USA, 2003.
24] H. Noureddini, D. Zhu, Kinetics of transesterification of soybean oil, J. Am. OilChem. Soc. 74 (1997) 1457–1463.
25] M.E. Bambase, N. Nakamura, J. Tanaka, M. Matsumura, Kinetics ofhydroxide-catalyzed methanolysis of crude sunflower oil for the productionof fuel-grade methyl esters, J. Chem. Technol. Biotechnol. 82 (2007) 273–280.
26] S.K. Karmee, D. Chandna, R. Ravi, A. Chadha, Kinetics of base-catalyzedtransesterification of triglycerides from Pongamia oil, J. Am. Oil Chem. Soc. 83(2006) 873–877.
27] G. Vicente, M. Martínez, J. Aracil, A. Esteban, Kinetics of sunflower oilmethanolysis, Ind. Eng. Chem. Res. 44 (2005) 5447–5454.
28] D. Darnoko, M. Cheryan, Kinetics of palm oil transesterification in a batchreactor, J. Am. Oil Chem. Soc. 77 (2000) 1263–1267.
29] V.C. Eze, The Use of Meso-Scale Oscillatory Baffled Reactors for RapidScreening of Heterogeneously Catalyzed Biodiesel Production Reactions, PhDThesis, School of Chemical Engineering and Advanced Materials, NewcastleUniversity, United Kingdom, 2014.
30] T.F. Dossin, M.F. Reyniers, G.B. Marin, Kinetics of heterogeneouslyMgO-catalyzed transesterification, Appl. Catal. B: Environ. 62 (2006) 35–45.
31] H. Hattori, M. Shima, H. Kabashima, Alcoholysis of ester and epoxidecatalyzed by solid bases, Stud. Surf. Sci. Catal. 130 (2000) 3507–3512.
32] Y. Xiao, L. Gao, G. Xiao, J. Lv, Kinetics of the transesterification reactioncatalyzed by solid base in a fixed-bed reactor’, Energy Fuels 24 (2010)5829–5833.
33] M. Di Serio, R. Tesser, L. Pengmei, E. Santacesaria, Heterogeneous catalysts forbiodiesel production, Energy Fuels 22 (2008) 207–217.
34] C. Macleod, Evaluation of Heterogeneous Catalysts for Biodiesel Production,Ph.D Thesis, School of Chemical Engineering and Advanced Materials,Newcastle University, United Kingdom, 2008.
35] A.P. Singh Chouhan, A.K. Sarma, Modern heterogeneous catalysts for biodieselproduction: a comprehensive review, Renew. Sustain. Energy Rev. 15 (2011)4378–4399.
36] G.E.G. Mucino, R. Romero, A. Ramírez, M.J. Ramos, R.B. Jiménez, R. Natividad,Kinetics of transesterification of safflower oil to obtain biodiesel usingheterogeneous catalysis, Int. J. Chem. Reactor Eng. 14 (2016) 929–938.
37] D. Kumar, A. Ali, Transesterification of low-quality triglycerides over a Zn/CaOheterogeneous catalyst: kinetics and reusability studies, Energy Fuels 27(2013) 3758–3768.
38] M. Feyzi, G. Khajavia, Kinetics study of biodiesel synthesis from sunflower oilusing Ba-Sr/ZSM-5 nano-catalyst, Iran. J. Catal. 6 (2016) 29–35.
39] A. Nambo, C.M. Miralda, J.B. Jasinski, M.A. Carreon, Methanolysis of olive oilfor biodiesel synthesis over ZnO nanorods, React. Kinet. Mech. Catal. 114(2015) 583–595.
40] G. Moradi, M. Mohadesi, Z. Hojabri, Biodiesel production by CaO/SiO2 catalystsynthesized by the sol–gel process, Reac. Kinet. Mech. Cat. 113 (2014)169–186.
41] N. Kaur, A. Ali, Biodiesel production via ethanolysis of jatropha oil usingmolybdenum impregnated calcium oxide as solid catalyst, RSC Adv. 5 (2015)13285–13295.
42] M. Kaur, A. Ali, An efficient and reusable Li/NiO heterogeneous catalyst forethanolysis of waste cottonseed oil, Eur. J. Lipid Sci. Technol. 117 (2015)550–560.
43] N. Kaur, A. Ali, Preparation and application of Ce/ZrO2-TiO2/SO42− as solid
catalyst for the esterification of fatty acids, Renew. Energy 81 (2015) 421–431.44] N. Kaur, A. Ali, Lithium zirconate as solid catalyst for simultaneous
esterification and transesterification of low quality triglycerides, Appl. Catal.A: Gen. 489 (2015) 193–202.
45] M.R. Avhad, M. Sánchez, E. Pena, A. Bouaid, M. Martínez, J. Aracil, J.M.Marchetti, Renewable production of value-added jojobyl alcohols andbiodiesel using a naturally-derived heterogeneous green catalyst, Fuel 179(2016) 332–338.
46] G.R. Moradi, M. Mohadesi, M. Ghanbari, M.J. Moradi, Sh. Hosseini, Y.Davoodbeygi, Kinetic comparison of two basic heterogeneous catalystsobtained from sustainable resources for transesterification of waste cookingoil, Biofuel Res. J. 6 (2015) 236–241.
[
[
Environmental 206 (2017) 146–157 157
47] M.R. Avhad, M. Sánchez, E. Pena, A. Bouaid, M. Martínez, J. Aracil, J.M.Marchetti, Modeling chemical kinetics of avocado oil ethanolysis catalyzed bysolid glycerol-enriched calcium oxide, Energy Convers. Manage. 126 (15(October)) (2016) 1168–1177, http://dx.doi.org/10.1016/j.enconman.2016.07.060.
48] M. Gaonkar, A.P. Chakraborty, Application of eggshell as fertilizer and calciumsupplement tablet, Int. J. Innov. Res. Sci. Eng. Technol. 5 (2016) 3520–3525.
49] A.M. King’ori, A review of the uses of poultry eggshells and shell membranes,Int. J. Poult. Sci. 10 (2011) 908–912.
50] C. McLaughlan, P. Rose, D.C. Aldridge, Making the best of a pest: the potentialfor using invasive zebra mussel (Dreissena polymorpha) biomass as asupplement to commercial chicken feed, Environ. Manage. 54 (2014)1102–1109.
51] A.M. Khan, N. Fatima, M.S. Hussain, K. Yasmeen, Biodiesel production fromgreen seaweed ulva fasciata catalyzed by novel waste catalysts from Pakistansteel industry, Chin. J. Chem. Eng. 24 (8 (August)) (2016) 1080–1086, http://dx.doi.org/10.1016/j.cjche.2016.01.009.
52] J.X. Wang, K.T. Chen, B.Z. Wen, Y.H.B. Liao, C.C. Chen, Transesterification ofsoybean oil to biodiesel using cement as a solid base catalyst, J. Taiwan Inst.Chem. Eng. 43 (2012) 215–219.
53] B.K. Uprety, W. Chaiwong, C. Ewelike, S.K. Rakshit, Biodiesel production usingheterogeneous catalysts including wood ash and the importance of enhancingbyproduct glycerol purity, Energy Convers. Manage. 115 (2016) 191–199.
54] H.H.M. Darweesh, Utilization of cement kiln by-pass dust waste as a source ofCaO in ceramic industry, Silic. Ind. 66 (2001) 47–52.
55] M.H. El-Awady, T.M. Sami, Removal of heavy metals by cement kiln dust, Bull.Environ. Contam. Toxicol. 59 (1997) 603–610.
56] M.K. Rahman, S. Rehman, O.S.B. Al-Amoudi, Literature review on cement kilndust usage in soil and waste stabilization and experimental investigation,IJRRAS 7 (2011) 77–87.
57] M.S. Konsta-Gdoutos, S.P. Shah, Hydration and properties of novel blendedcements based on cement kiln dust and blast furnace slag, Cem. Concr. Res. 33(2003) 1269–1276.
58] A. Sreekrishnavilasam, M.C. Santagata, Development of Criteria for theUtilization of Cement Kiln Dust (CKD) in Highway Infrastructures.FHWA/IN/JTRP-2005/10, Final Report for Joint Transportation ResearchProgram, School of Civil Engineering, Purdue University, India, 2006.
59] O.E. Agwu, A.N. Okon, F.D. Udoh, A comparative study of diesel oil and soybeanoil as oil-based drilling mud, J. Pet. Eng. 2015 (2015) 10, Article ID 828451.
60] F. Shahidi, Bailey’s industrial oil and fat products Six Volume Set, Vol. 2, sixthedition, John Wiley & Sons, Inc., 2005, pp. 584–586 (Ch. 13).
61] N. Asikin-Mijana, H.V. Lee, Y.H. Taufiq-Yap, Synthesis and catalytic activity ofhydration–dehydration treated clamshell derived CaO for biodieselproduction, Chem. Eng. Res. Des. 102 (2015) 368–377.
62] Z.A. Shajaratun Nur, Y.H. Taufiq-Yap, M.F. Rabiah Nizah, S.H. Teo, O.N.Syazwani, A. Islam, Production of biodiesel from palm oil using modifiedMalaysian natural dolomites, Energy Convers. Manage. 78 (2014) 738–744.
63] H.I. El Shimi, N.K. Attia, S.T. El Sheltawy, G.I. El Diwani, Reactive extractionprocessing of spirulina-platensis microalgae to produce biodiesel: kineticsstudy, Int. J. Eng. Sci. Innov. Technol. 4 (2015) 338–349.
64] P. Verma, M.P. Sharma, Review of process parameters for biodiesel productionfrom different feedstocks, Renew. Sustain. Energy Rev. 62 (2016) 1063–1071.
65] N.B. Talib, S. Triwahyono, A.A. Jalil, C.R. Mamat, N. Salamun, N.A.A. Fatah, S.M.Sidik, L.P. Teh, Utilization of a cost effective Lapindo mud catalyst derivedfrom eruption waste for transesterification of waste oils, Energy Convers.Manage. 108 (2016) 411–421.
66] G. Moradi, M. Mohadesi, S. Hosseini, Y. Davoodbeygi, R. Moradi, DM waterplant sedimentation as a cheap and waste source of catalyst for biodieselproduction, Int. J. Chem. Reactor Eng. 14 (2015) 113–124.
67] I. Lukic, Z. Kesic, S. Maksimovic, M. Zdujic, J. Krstic, D. Skala, Kinetics ofheterogeneous methanolysis of sunflower oil with CaO·ZnO catalyst:influence of different hydrodynamic conditions, Chem. Ind. Chem. Eng. Q. 20(2014) 425–439.
68] D.J. -Vujicic, D. Comic, A. Zarubica, R. Micic, G. Boskovi, Kinetics of biodieselsynthesis from sunflower oil over CaO heterogeneous catalyst, Fuel 89 (2010)2054–2061.
69] S.L. Martínez, R. Romero, R. Natividad, J. González, Optimization of biodieselproduction from sunflower oil by transesterification using Na2O/NaX andmethanol, Catal. Today 220–222 (2014) 12–20.
70] R. Pena, R. Romero, S.L. Martínez, R. Natividad, A. Ramírez, Characterization ofKNO3/NaX catalyst for sunflower oil transesterification, Fuel 110 (2013)63–69.
71] R.Sh. Mikhail, S. Brunauer, L.E. Copeland, Kinetics of the thermaldecomposition of calcium hydroxide, J. Colloid Interface Sci. 21 (1996)394–404.
73] E.G. Al-Sakkari, S.T. El-Sheltawy, M.F. Abadir, N.K. Attia, G. El-Diwani,Investigation of cement kiln dust utilization for catalyzing biodieselproduction via response surface methodology, Int. J. Energy Res. (2016) 3635(in press) http://onlinelibrary.wiley.com/doi/10.1002/er.3635/epdf.
74] S.T. El-Sheltawy, E.G. Al-Sakkari, M. Fouad, Modeling and process simulationof biodiesel production from soybean oil using cement kiln dust as aheterogeneous catalyst, J. Solid Waste Technol. Manag. 42 (2016) 313–324.
75] T.O. Salmi, J.P. Mikkola, J.P. Warna, Chemical Reaction Engineering andReactor Technology, CRC Press/Taylor and Francis, 2011, pp. 550.