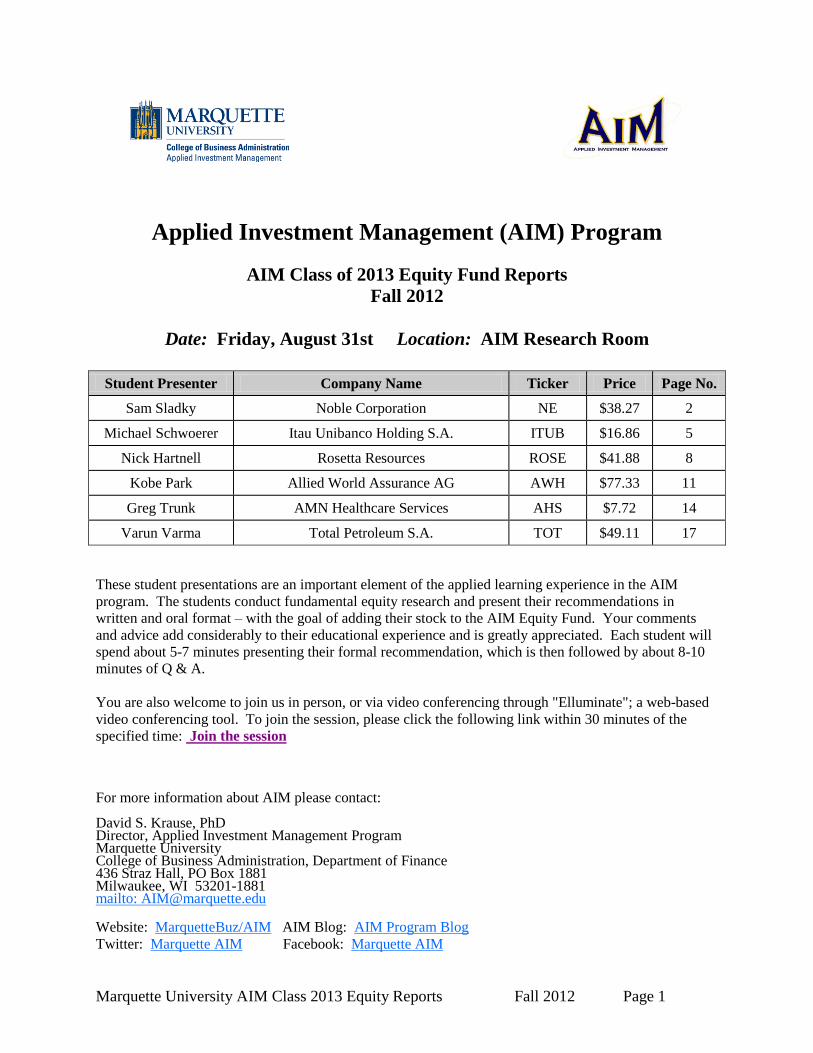
Page 1
Marquette University AIM Class 2013 Equity Reports Fall 2012 Page 1
Applied Investment Management (AIM) Program
AIM Class of 2013 Equity Fund Reports
Fall 2012
Date: Friday, August 31st Location: AIM Research Room
Student Presenter Company Name Ticker Price Page No.
Sam Sladky Noble Corporation NE $38.27 2
Michael Schwoerer Itau Unibanco Holding S.A. ITUB $16.86 5
Nick Hartnell Rosetta Resources ROSE $41.88 8
Kobe Park Allied World Assurance AG AWH $77.33 11
Greg Trunk AMN Healthcare Services AHS $7.72 14
Varun Varma Total Petroleum S.A. TOT $49.11 17
These student presentations are an important element of the applied learning experience in the AIM
program. The students conduct fundamental equity research and present their recommendations in
written and oral format – with the goal of adding their stock to the AIM Equity Fund. Your comments
and advice add considerably to their educational experience and is greatly appreciated. Each student will
spend about 5-7 minutes presenting their formal recommendation, which is then followed by about 8-10
minutes of Q & A.
You are also welcome to join us in person, or via video conferencing through "Elluminate"; a web-based
video conferencing tool. To join the session, please click the following link within 30 minutes of the
specified time: Join the session
For more information about AIM please contact: David S. Krause, PhD Director, Applied Investment Management Program Marquette University College of Business Administration, Department of Finance 436 Straz Hall, PO Box 1881 Milwaukee, WI 53201-1881 mailto: [email protected] Website: MarquetteBuz/AIM AIM Blog: AIM Program Blog
Twitter: Marquette AIM Facebook: Marquette AIM
Page 2
Marquette University AIM Class 2013 Equity Reports Fall 2012 Page 2
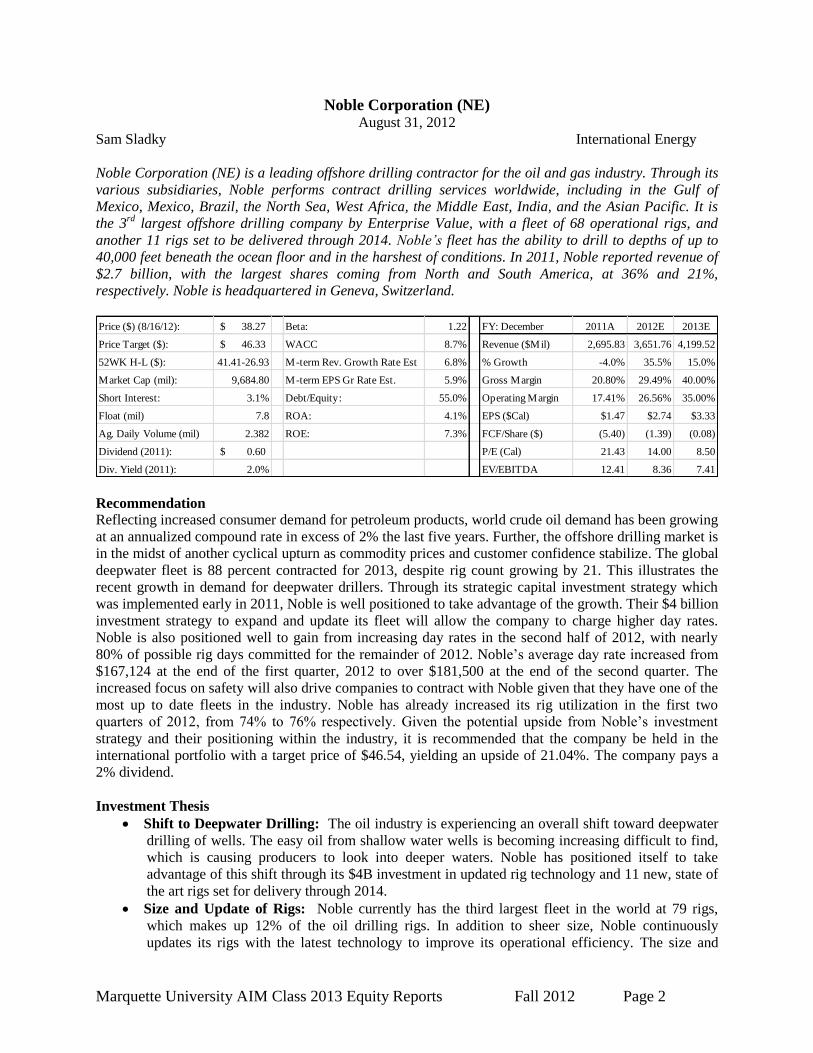
Noble Corporation (NE) August 31, 2012
Sam Sladky International Energy
Noble Corporation (NE) is a leading offshore drilling contractor for the oil and gas industry. Through its
various subsidiaries, Noble performs contract drilling services worldwide, including in the Gulf of
Mexico, Mexico, Brazil, the North Sea, West Africa, the Middle East, India, and the Asian Pacific. It is
the 3rd
largest offshore drilling company by Enterprise Value, with a fleet of 68 operational rigs, and
another 11 rigs set to be delivered through 2014. Noble’s fleet has the ability to drill to depths of up to
40,000 feet beneath the ocean floor and in the harshest of conditions. In 2011, Noble reported revenue of
$2.7 billion, with the largest shares coming from North and South America, at 36% and 21%,
respectively. Noble is headquartered in Geneva, Switzerland.
Price ($) (8/16/12): 38.27$ Beta: 1.22 FY: December 2011A 2012E 2013E
Price Target ($): 46.33$ WACC 8.7% Revenue ($Mil) 2,695.83 3,651.76 4,199.52
52WK H-L ($): 41.41-26.93 M-term Rev. Growth Rate Est 6.8% % Growth -4.0% 35.5% 15.0%
Market Cap (mil): 9,684.80 M-term EPS Gr Rate Est. 5.9% Gross Margin 20.80% 29.49% 40.00%
Short Interest: 3.1% Debt/Equity: 55.0% Operating Margin 17.41% 26.56% 35.00%
Float (mil) 7.8 ROA: 4.1% EPS ($Cal) $1.47 $2.74 $3.33
Ag. Daily Volume (mil) 2.382 ROE: 7.3% FCF/Share ($) (5.40) (1.39) (0.08)
Dividend (2011): 0.60$ P/E (Cal) 21.43 14.00 8.50
Div. Yield (2011): 2.0% EV/EBITDA 12.41 8.36 7.41
Recommendation
Reflecting increased consumer demand for petroleum products, world crude oil demand has been growing
at an annualized compound rate in excess of 2% the last five years. Further, the offshore drilling market is
in the midst of another cyclical upturn as commodity prices and customer confidence stabilize. The global
deepwater fleet is 88 percent contracted for 2013, despite rig count growing by 21. This illustrates the
recent growth in demand for deepwater drillers. Through its strategic capital investment strategy which
was implemented early in 2011, Noble is well positioned to take advantage of the growth. Their $4 billion
investment strategy to expand and update its fleet will allow the company to charge higher day rates.
Noble is also positioned well to gain from increasing day rates in the second half of 2012, with nearly
80% of possible rig days committed for the remainder of 2012. Noble’s average day rate increased from
$167,124 at the end of the first quarter, 2012 to over $181,500 at the end of the second quarter. The
increased focus on safety will also drive companies to contract with Noble given that they have one of the
most up to date fleets in the industry. Noble has already increased its rig utilization in the first two
quarters of 2012, from 74% to 76% respectively. Given the potential upside from Noble’s investment
strategy and their positioning within the industry, it is recommended that the company be held in the
international portfolio with a target price of $46.54, yielding an upside of 21.04%. The company pays a
2% dividend.
Investment Thesis
Shift to Deepwater Drilling: The oil industry is experiencing an overall shift toward deepwater
drilling of wells. The easy oil from shallow water wells is becoming increasing difficult to find,
which is causing producers to look into deeper waters. Noble has positioned itself to take
advantage of this shift through its $4B investment in updated rig technology and 11 new, state of
the art rigs set for delivery through 2014.
Size and Update of Rigs: Noble currently has the third largest fleet in the world at 79 rigs,
which makes up 12% of the oil drilling rigs. In addition to sheer size, Noble continuously
updates its rigs with the latest technology to improve its operational efficiency. The size and
Page 3
Marquette University AIM Class 2013 Equity Reports Fall 2012 Page 3
ability of Noble’s fleet ensures that it will maintain its competitive edge over other offshore
drilling contractors by allowing the company to charge higher day rates on average per rig.
Contract Backlog: As of Q1 2012, Noble had $14.5B in its backlog, which is more than both
Ensco and Transocean (its two main competitors) on a per rig basis. The backlog consists of
revenue under contract or letters of intent. The backlog allows Noble to maintain a more stable
revenue stream, with more predictable revenues due to planned projects. The backlog also allows
Noble to reduce idle rig time while increasing profitability.
Rising Day Rates/Focus on Safety: Following the BP Oil Spill in the Gulf of Mexico, increased
regulation has pushed safety to become a primary concern with rig contractors. A premium has
been placed on new, updated rigs which Noble is poised to take advantage of. The $4B
investment strategy Noble has employed since 2011 will allow the company to charge higher
rates for its new rigs due to the safety concerns of preventing another blowout.
Valuation
To find the intrinsic value of Noble Corporation, a seven-year DCF was conducted. After projecting out
revenues, a conservative WACC of 8.7% was used with a terminal growth rate of 3% to yield an intrinsic
value of $48.44. A P/E multiple was also used with a price target multiple of 14x. After weighing the
2012 and 2013 EPS at 50-50, a target price of $42.46 was calculated. Finally, a dividend discount model
was also used. With a target dividend yield of 1.3% and a 2012 dividend of $0.60, a target price of $46.15
was achieved. After weighing the DCF, P/E multiple, and dividend discount price targets at 40%, 20%,
and 40% respectively, an overall price target of $46.54 was achieved, with an upside of 21.06%.
Risks
Industry Risk. Noble’s business depends on the level of activity in the oil and gas industry,
which is significantly affected by volatile oil and gas prices. Demand for drilling services
depends on a variety of economic and political factors and the level of activity in offshore oil and
gas exploration and development and production markets worldwide. Commodity prices and
market expectations of potential changes in these prices, may significantly affect this level of
activity which ultimately will impact the profitability of the company.
Government Regulations. Governmental laws and regulations, including environmental laws
and regulations, may add costs or affect Noble’s drilling activity. Nobles business is affected by
public policy and regulations relating to the energy industry and the environment in the
geographic areas where the company operates. Increased governmental regulations, specifically
those regarding the Gulf of Mexico and Alaska, may materially impact the profitability of the
company.
High Capital Expenditures. Noble has undertaken considerable debt to finance its long-term
investment strategy. The ability of the company to repay its debt will have a material effect on the
ability of the company to continue its operations worldwide.
Management
David Williams joined Noble in 2006, rising to his current position as CEO/President in 2008. He
previously served for 5 years as Executive Vice President for Diamond Offshore Drilling, Inc., a
competitor. Julie Robertson, Executive Vice President, has been with the company continuously since
1979. James MacLennan, Senior Vice President/CFO, worked with Noble from 1993-1997 and recently
rejoined Noble this past January. Overall, the executive team for Noble averages 9.8 years of tenure, as
compared to 6.2 years for the industry. The high retention rate has given Noble a dedicated, credible
management team who has helped Noble emerge as a leader in the industry.
Page 4
Marquette University AIM Class 2013 Equity Reports Fall 2012 Page 4
Ownership
Source: Bloomberg
Top 5 Shareholders
Holder Shares % Out
Wentworth Hauser and Violich 16,449,182 6.51
Fidelity Management and Research 14,061,804 5.57
Franklin Resources Incorporated 10,550,055 4.18
Vanguard Group Inc. 10,456,076 4.14
Wellington Management Co. LLP 10,065,339 3.98
Source: Bloomberg
% of Shares Held by All Insider and 5% Owners: .58%
% of Shares Held by Institutional & Mutual Fund Owners: 91.9%
Page 5
Marquette University AIM Class 2013 Equity Reports Fall 2012 Page 5
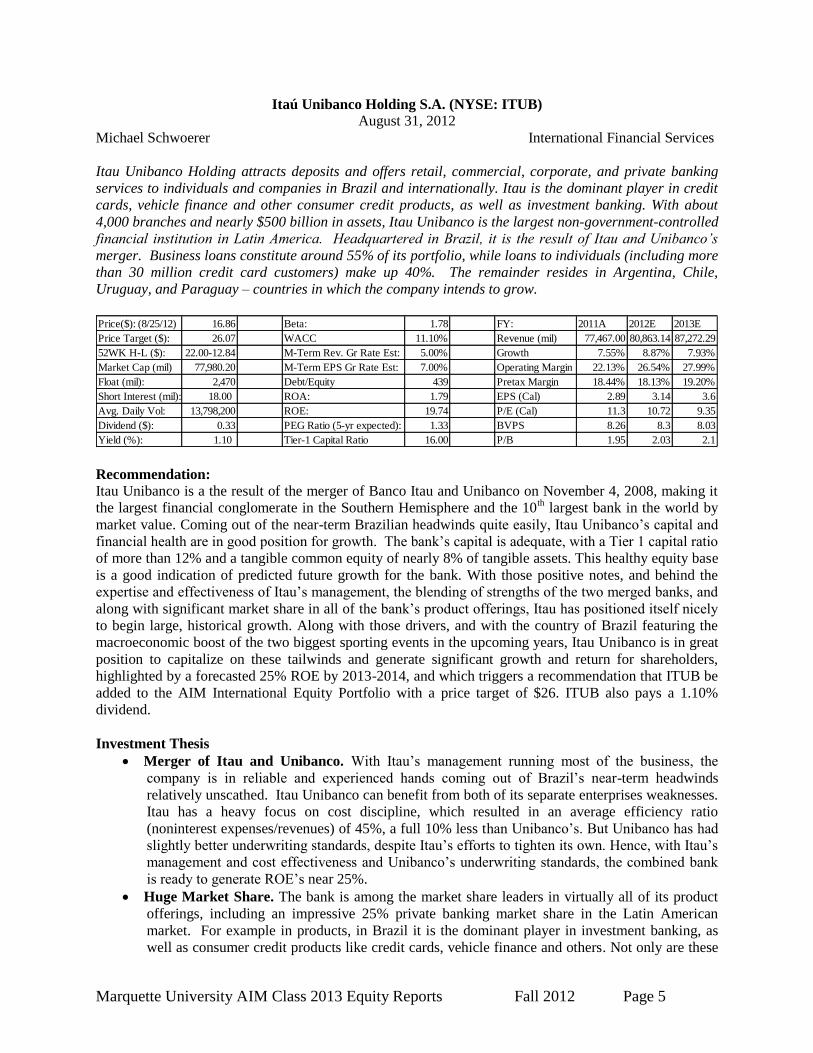
Itaú Unibanco Holding S.A. (NYSE: ITUB)
August 31, 2012
Michael Schwoerer International Financial Services
Itau Unibanco Holding attracts deposits and offers retail, commercial, corporate, and private banking
services to individuals and companies in Brazil and internationally. Itau is the dominant player in credit
cards, vehicle finance and other consumer credit products, as well as investment banking. With about
4,000 branches and nearly $500 billion in assets, Itau Unibanco is the largest non-government-controlled
financial institution in Latin America. Headquartered in Brazil, it is the result of Itau and Unibanco’s
merger. Business loans constitute around 55% of its portfolio, while loans to individuals (including more
than 30 million credit card customers) make up 40%. The remainder resides in Argentina, Chile,
Uruguay, and Paraguay – countries in which the company intends to grow.
Price($): (8/25/12) 16.86 Beta: 1.78 FY: 2011A 2012E 2013E
Price Target ($): 26.07 WACC 11.10% Revenue (mil) 77,467.00 80,863.14 87,272.29
52WK H-L ($): 22.00-12.84 M-Term Rev. Gr Rate Est: 5.00% Growth 7.55% 8.87% 7.93%
Market Cap (mil) 77,980.20 M-Term EPS Gr Rate Est: 7.00% Operating Margin 22.13% 26.54% 27.99%
Float (mil): 2,470 Debt/Equity 439 Pretax Margin 18.44% 18.13% 19.20%
Short Interest (mil): 18.00 ROA: 1.79 EPS (Cal) 2.89 3.14 3.6
Avg. Daily Vol: 13,798,200 ROE: 19.74 P/E (Cal) 11.3 10.72 9.35
Dividend ($): 0.33 PEG Ratio (5-yr expected): 1.33 BVPS 8.26 8.3 8.03
Yield (%): 1.10 Tier-1 Capital Ratio 16.00 P/B 1.95 2.03 2.1 Recommendation: Itau Unibanco is a the result of the merger of Banco Itau and Unibanco on November 4, 2008, making it
the largest financial conglomerate in the Southern Hemisphere and the 10th largest bank in the world by
market value. Coming out of the near-term Brazilian headwinds quite easily, Itau Unibanco’s capital and
financial health are in good position for growth. The bank’s capital is adequate, with a Tier 1 capital ratio
of more than 12% and a tangible common equity of nearly 8% of tangible assets. This healthy equity base
is a good indication of predicted future growth for the bank. With those positive notes, and behind the
expertise and effectiveness of Itau’s management, the blending of strengths of the two merged banks, and
along with significant market share in all of the bank’s product offerings, Itau has positioned itself nicely
to begin large, historical growth. Along with those drivers, and with the country of Brazil featuring the
macroeconomic boost of the two biggest sporting events in the upcoming years, Itau Unibanco is in great
position to capitalize on these tailwinds and generate significant growth and return for shareholders,
highlighted by a forecasted 25% ROE by 2013-2014, and which triggers a recommendation that ITUB be
added to the AIM International Equity Portfolio with a price target of $26. ITUB also pays a 1.10%
dividend.
Investment Thesis
Merger of Itau and Unibanco. With Itau’s management running most of the business, the
company is in reliable and experienced hands coming out of Brazil’s near-term headwinds
relatively unscathed. Itau Unibanco can benefit from both of its separate enterprises weaknesses.
Itau has a heavy focus on cost discipline, which resulted in an average efficiency ratio
(noninterest expenses/revenues) of 45%, a full 10% less than Unibanco’s. But Unibanco has had
slightly better underwriting standards, despite Itau’s efforts to tighten its own. Hence, with Itau’s
management and cost effectiveness and Unibanco’s underwriting standards, the combined bank
is ready to generate ROE’s near 25%.
Huge Market Share. The bank is among the market share leaders in virtually all of its product
offerings, including an impressive 25% private banking market share in the Latin American
market. For example in products, in Brazil it is the dominant player in investment banking, as
well as consumer credit products like credit cards, vehicle finance and others. Not only are these
Page 6
Marquette University AIM Class 2013 Equity Reports Fall 2012 Page 6
very profitable and growing segments, but they also provide a vast economic moat, making it
very difficult for competitors to enter into the market and erode Itau Unibanco’s market share in
these product offerings.
Upcoming Mega-Macro Events in Brazil. In 2014, the soccer World Cup will be held in 12
Brazilian cities and then two years later, in 2016, the Olympic Summer Games are to be held in
Rio de Janeiro. Government officials expect tourism to rise in the course of these events, as well
as investing billions of dollars into Brazil’s infrastructure. New roads and railway lines will be
built and plans to expand Rio’s international airport are under way. Money will go into other
social and economic projects as well. While these events will most likely not immediately
impact ITUB, the World Cup in South Africa in 2010 gave the country a major economic boost,
and the same is expected to happen in Brazil. This will fuel GDP growth and the growth of Itau
Unibanco.
Valuation
To find the intrinsic value of ITUB, a P/B multiple, P/E multiple, and 5-year DCF models were used. A
2.10x multiple was applied to a 2012 BVPS estimate of 10.50 to reach an intrinsic value of $22.05. For
the P/E model, a 12x multiple was used with a 2012 EPS estimate of $3.14, which generated an intrinsic
value of $37.68. For the DCF model a conservative WACC of 12% was used, which includes a foreign
country premium, and terminal growth rate of 2%. This model generated an intrinsic value of $33.20. I
weighted the P/B model 70%, and the P/E and DCF models 15% each and came up with a final intrinsic
value of $26, which represents a potential upside of 54%. Itau Unibanco also pays a dividend yield of
1.10%.
Risks
Currency Oscillations. In addition to directly affecting ADR prices, these foreign currency
exposures and changes influence the bank’s underlying business. Itau issues dollar-denominated
debt and derivatives can be profitable during times when the Brazilian real is appreciating, but
companies that have not adequately hedged their exposure are also at risk if the real depreciates.
Weakening of the real could impair these companies’ cash flows as their interest payments rise,
which could ultimately result in added loan losses for Itau Unibanco.
Inflation and Fluctuation in Interest Rates. If inflation rises and exports fall, industrial activity
in Brazil likely will contract, making it hard for Itau Unibanco to grow at its former rate. Also,
prolonged periods of high inflation provoke distortions in the allocation of resources, resulting in
actual loan losses or margin contractions. The vast majority of Itau’s income, expenses, assets
and liabilities are directly tied to interest rates. Therefore, Itau’s results of operations and
financial condition are significantly affected by inflation, and interest rate fluctuations. From
2004 to 2011, the average annual inflation rate was 5.4%. Expected inflation for 2012, as
surveyed by the Central Bank, is 5.28%.
Management
The bank is run mostly by Itau’s top management, despite the fact that Unibanco’s former CEO is the
new company’s chairman. Historically, Itau has done a better job of creating shareholder value through
more efficient operations, which has resulted in higher returns on equity at Itau than at Unibanco. By
maintaining Itau’s top management, the merged company will be able to incorporate Unibanco’s better
credit standards without losing sight of profitability. Itau’s management is like many large corporations in
Latin America, as in they are controlled by a few families or individuals. Itau Unibanco is controlled by
the Egydio de Souza Aranha and the Moreira Salles families. The CEO and the chairman are members of
these families, and despite such tight control, Itau has rewarded its shareholders well through handsome
profits so far. Management’s net worth is very closely tied to the bank’s fate, which reinforces the belief
that Itau’s top management will remain a good steward of shareowner capital.
Page 7
Marquette University AIM Class 2013 Equity Reports Fall 2012 Page 7
Source: Bloomberg
Top Institutional Shareholders
Holder Shares % Out
Vanguard Group, Inc. (The) 44,268,560 1.92
Thornburg Investment Management 31,613,051 1.39
Northern Cross LLC 30,811,749 7.16
Templeton Asset Management 30,811.749 1.35
Source: Yahoo Finance
Page 8
Marquette University AIM Class 2013 Equity Reports Fall 2012 Page 8
Rosetta Resources, Inc. (ROSE)
August 31, 2012
Nick Hartnell Energy
Rosetta Resources, Inc. (NASDAQ: ROSE) is an independent onshore oil and gas exploration and
production company. Rosetta owns producing properties in the Eagle Ford shale in southern Texas as
well as an exploratory position in the Southern Alberta Basin in northwest Montana. The Eagle Ford
shale property provided 78% of total production in 2011 where ROSE holds a 65,000 net acre leasehold
position. Rosetta became an independent company on July 7, 2005 when it was spun-out from Calpine
Corporation and went public on February 13, 2006. Under a new leadership team beginning in 2007,
ROSE sold most of its legacy assets and has become the 8th largest unconventional player in Eagle Ford.
It is headquartered in Houston, TX and employs 165 full-time employees.
Price ($): (8/23/12) 41.88 Beta: 1.54 FY: Dec. 31 2011A 2012E 2013E
Price Target ($): 57.46 WACC 13.24% Revenue (mil) 446.20 617.91 850.00
52 WK H-L ($): 30.42-54.58 M-Term Rev. Gr Rate Est: 10.00% % Growth 44.67% 38.48% 37.56%
Market Cap (mil): 2212.70 M-Term EPS Gr Rate Est: 10.00% Gross Margin 56.85% 58.93% 55.00%
Float (mil): 51.40 Total Debt/EBITDA 0.77 Operating Margin 39.98% 45.92% 38.00%
Short Interest (%): 10.86% Total Debt/Equity 0.42 EPS (Cal) 1.91 1.66 3.54
Avg. Daily Vol (mil): 0.92 ROA: 15.09% FCF/Share -2.56 -2.53 -3.57
Dividend ($): 0.00 ROE: 25.56% EV/EBITDA 8.32x 6.17x 5.62x
Yield (%): 0.00% EV/BOE/d 89.62x 73.71x 76.33x
Recommendation
An early entrant and now a pure player in the liquids-rich Eagle Ford shale region, Rosetta’s strategic
focus has shifted dramatically from being 95% natural gas four years ago to 59% hydrocarbon liquids.
ROSE has diversified its production base to include a greater mix of crude oil and NGLs, which continue
to be priced at more favorable levels than natural gas (note: natural gas prices have decreased 62% and oil
prices have risen 32% since 2009). Q2 2012 production averaged 33,400 BOE per day, up 25% from Q2
2011, and is expected to rise to 40,000 by year’s end. ROSE is currently replacing reserves at a 22x rate,
well outpacing competitors. The Company has had an exceptional track record of well drilling, with a
100% success rate in 1H 2012 when they drilled an additional 37 wells, bringing the total to 91. At its
current pace of 60 well completions per year, there is an estimated 15 years left of Eagle Ford
development, translating into double-digit growth in production for years to come. The sale of non-
strategic assets ($440MM) and increased operational efficiencies have led to a lowering of the firm’s cost
structure, as lease operating expenses decreased to $3.06 per BOE from $4.94 a year ago. Because of
these reasons and a favorable valuation, it is recommended that ROSE be added to the AIM Equity Fund
with a price target of $57.46, which offers a potential upside of 37%. No dividend is paid by the firm.
Investment Thesis
Location. Eagle Ford is a lucrative region to be operating and is one of the most active shale
plays in the U.S., where Rosetta has 900 location opportunities with 0.5B BOE potential. Proven
reserves, which are 54% liquids, more than doubled to 161MM BOE at FYE 2011 and less than
10% of the identified inventory in this region is drilled and on production. The Company has put
93% of its capital towards this area, while the Southern Alberta Basin has been put on hold after
an $82.8MM impairment following initial exploration. This opportunity in Montana gives
Rosetta optionality and an intriguing place to operate in the longer-term.
Financial Flexibility. Rosetta’s leverage profile is light at 0.77x Total Debt/LTM EBITDA,
giving the Company ample room to finance future expansion with more LTD ($535 MM
available on their revolver and $60MM of cash at 6/30/12). The Eagle Ford expansion is self-
funding at current oil prices according to management. Maintenance CapEx (to keep production
levels flat) is $250MM annually, giving Rosetta ample room for further growth. Moody’s
Page 9
Marquette University AIM Class 2013 Equity Reports Fall 2012 Page 9
upgraded ROSE’s debt rating to B1 from B2 with a positive outlook, highlighting the Company’s
low leverage, strong cash margins, and growing liquids production.
Lowering Cost Structure. According to Bloomberg’s industry research report, the breakeven oil
price may rise to $72/BOE from $69 in 2011 and likewise, companies that consistently achieve
lower full-cycle costs should outperform. The sale of non-strategic assets ($440MM) and
operational efficiencies have led to a lowering cost structure for ROSE, as lease operating
expenses decreased to $3.06/BOE from $4.94 a year ago. ROSE also has a record of low finding
and development costs (F&D), which have consistently averaged under $10/BOE. Though
depleting the proven undeveloped reserves (PUD) may pressure the low F&D costs, the rapid
increase in liquids production should mitigate any margin pressure resulting from higher costs.
Valuation
To find the intrinsic value of ROSE, a ten-year DCF using a half-year convention discount rate was
conducted. Total revenue is expected to grow 38% yoy in 2012 and 27% yoy in 2013 due to increasing
Eagle Ford development. Mid-term revenue growth is expected to hold constant at 20% annually, long-
term growth is 10%, and terminal growth is 2%. A WACC of 13.24% was used and yielded an intrinsic
value of $55.90. Sensitivity analysis accounted for variations in WACC and the terminal growth rate,
which resulted in a price target range of $54-60. An EV/EBITDA multiple approach was also used.
Blending a historic regression, historic average, and peer average, 8.07x was generated, yielding a $59.88
target. Finally, an EV/BOE/d multiple approach was used, employing the same methodology as the
EV/EBITDA valuation, and it produced a 76.33x multiple, garnering an intrinsic value of $56.54.
Triangulating the three valuation methods and weighing the DCF 40%, EV/EBITDA 30%, and
EV/BOE/d 30% resulted in an overall price target of $57.46, which offers a 37% upside.
Risks
Hydraulic Fracturing Regulation. The EPA has recently focused on the risk of water
contamination from drilling and hydraulic fracturing activities. On April 17, 2012, the EPA
issued regulations required under the Clean Air Act; including the first federal air standards for
natural gas wells that are hydraulically fractured. New wells would be required to have special
equipment separating gas and liquid hydrocarbons from the flowback. The rules are expected to
be fully implemented in 2015. Also, Texas and Montana are among the states that require
disclosing chemicals used in fracking. However, ROSE is in material compliance with applicable
environmental regulations and does not use diesel fuel as one of the fluid components.
Volatile Oil, NGLs, and Natural Gas Prices. As an E&P company, ROSE’s stock price is
sensitive to oil, NGLs, and natural gas prices. Large price fluctuations in these commodities may
significantly impact the future production expectations in the industry. This risk is perpetuated
due to a high 56% correlation between the daily stock price and the price of WTI oil over the past
two years. To mitigate this risk, ROSE hedges with swaps and costless collars.
Potential Exploration Failures. As ROSE increases its use of capital towards exploring to 10%
from 5% currently, there is heightened risk/reward. These activities include the risks that no
commercially productive quantities of oil, NGLs, and natural gas will be discovered or that
drilling operations may be curtailed, delayed, or cancelled. ROSE employs geophysical analysis
through 3-D seismic data and visualization techniques to best pinpoint hydrocarbons.
Management
Randy Limbacher has been the CEO since November 2007 and was appointed Chairman of the Board in
February 2010. Prior to joining Rosetta, he served as the President of exploration and production in the
western hemisphere for ConocoPhillips and has over 30 years of experience in the energy industry. John
Hagale is the CFO and Treasurer, assuming duties in November 2011. He has more than 30 years of
financial experience in oil and gas and healthcare. Executive compensation is in line with achieving
revenue and profitability targets.
Page 10
Marquette University AIM Class 2013 Equity Reports Fall 2012 Page 10
Ownership
Source: Bloomberg
Top 5 Shareholders
Holder Shares % Out
Capital World Investors 4,378,808 8.28
Wellington Management Company, LLP 4,304,995 8.14
Jennison Associates, LLC 3,784,244 7.16
Vanguard Group, Inc. 3,323,903 6.29
Goldman Sachs Group, Inc. 2,534,644 4.79
Source: Bloomberg
% of Shares Held by All Insiders: 2.53%
% of Shares Held by Institutional Owners: >90%
Page 11
Marquette University AIM Class 2013 Equity Reports Fall 2012 Page 11
Allied World Assurance AG (AWH)
August 31, 2012
Kobe Park International Financial Services
Allied World Assurance Company Holdings, AG (NYSE:AWH), is a Swiss-based specialty insurance and
reinsurance company that underwrites a diversified portfolio of property and casualty lines of business
through offices located in Bermuda, Hong Kong, Ireland, Singapore, Switzerland, the United Kingdom,
and the United States. The company mainly operates in three business segments: U.S. insurance,
international insurance, and reinsurance. AWH competes against companies like ACE Limited, Arch
Capital Group Ltd., Chartis Inc, PartnerRe Ltd., and HCC Insurance Holdings, Inc.
Price ($) : (08/24/12) 77.33 Beta: 0.79 FY: Sep 2011A 2012E 2013E
Price target ($) : 89.75 WACC (%) 7.15 Revenue (Mil) 1,457 1,644 1,733
52 WK H-L ($) : 80.1-49.2 L-Term Rev. Gr Rate est (%): 3.00 % Growth 7.20 21.00 5.41
Market Cap (mil): 2,766 L-Term EPS Gr Rate est (%): 2.00 Expense Ratio (%) 34.17 30.50 31.72
Float (mil): 2,711 Mid-Term Rev. Gr Rate est (%): 5.00 Combined Ratio (%) 95.96 89.11 90.13
Short Interest (%) : 0.71 Financial Leverage 3.62 EPS (Cal) ($) 7.65 11.82 11.11
Avg. Daily Vol (mil) : 0.11 ROA (%): 4.70 P/E (Cal) 10.11 8.29 6.96
Dividend ($) : 1.875 ROE (%): 15.4 BVPS ($) 83.44 91.36 106.70
Yield (%) : 2.38 P/B 0.75 0.85 0.72
Recommendation
As the uncertainties in the global market continue, companies with robust financial health and strong
profitability seem more attractive than ever. Among many financial institutions, Allied World Assurance
is a good portfolio holding because of its revenue stability, profitability, and growth opportunities. AWH
announced its Q2 earnings results on July 31st and the company’s quarterly revenues were up 25% on a
YoY basis. Even with weaker net investment income, the company managed to beat the consensus
estimate EPS of $1.76 by $.59, driven primarily by strong revenue growth in all three segments.
Compared to its peers, AWH boasts a conservative balance sheet with a low financial leverage of 3.62.
For such reasons, it is recommended that Allied World Assurance AG be added to the AIM International
Equity Fund with a target price of $89.75, which offers a potential upside of 16% with an attractive
2.38% dividend yield.
Investment Thesis
Strong financial health and well diversified product line. AWH has a total debt to equity ratio
of 24.3%, making it one of the less leveraged companies among other firms in this sector. AWH
also carries a conservative investment portfolio. For example, AWH’s fixed income portfolio has
an average duration of approximately 2 years; one of the lowest in the industry. AWH also stays
away from many high yield fixed income securities, including European sovereign and corporate
debt issues. While this strategy currently yields a lower level of investment income than others in
the industry, it does put the company in a good position against sudden investment capital losses.
Its diversified product line also provides protection for AWH investors as the firm derives about
40% of its revenue from the U.S. insurance segment, 30% from international insurance, and 30%
from the reinsurance business. AWH offers traditional casualty and property insurance along
with its niche reinsurance programs and coverage in areas like catastrophe, professional liability,
and specialty lines. For such reasons, seven of nine subsidiaries of AWH are rated “A” by S&P
and eight are rated “A” by A.M. Best. Additionally, its Lloyd’s Syndicate 2232 is rated A+
(Strong) by Standard & Poor’s and Fitch.
Growth opportunities driven by a strong market position in the U.S. AWH generates about
40% of its revenue from the U.S. insurance segment. The firm mainly targets direct property and
casualty insurance for small and middle-market non-Fortune 1000 companies. In the past, AWH
Page 12
Marquette University AIM Class 2013 Equity Reports Fall 2012 Page 12
was not a big contender in the U.S. market due to its smaller size; however, in the past few years,
through series of acquisitions, it has successfully built up sufficient economies of scale to
compete with other insurers with its competitive pricing. As a result, gross premiums written in
the U.S. insurance segment increased from $200M in 2007 (13% of total GPW) to $838M in
2011 (40% of total GPW). There is still more room to grow in this market for AWH as it can
further utilize its scale of economy in the U.S. insurance market.
Increase in profitability. After ROE declined during the 2008 to 2011 period, the firm’s ROE
resurged back as AWH started to utilize some of the acquisitions made in previous periods, such
as the build-out of the U.S. platform, the acquisition of Darwin, the establishment of a U.S.
reinsurance company. The expense ratio increased from 26.7% in 2008 to 32.8% in 2010, while
that of the peer average moved from 31.3% to 34.2%. In 2012, ROE has increased to 15.4% and
the expense ratio has dropped to 29.2%; significantly lower than a peer average of 34.4%.
Valuation To find the intrinsic value of AWH, the P/E method, P/B method, and excess equity return method were
used. Since AWH operates globally in different segments, it is hard to define true competitors. Therefore,
historical multiples since 2006 were used. AWH has been traded at an average P/E ratio of 7.17x and P/B
ratio of .90x historically. With 2013 estimated EPS of $11.11, estimated by sum of three different
business segments, price target of $79.66 was found for P/E method and $94.32 for P/B method by using
2013 estimated BVPS of $106.7. The sensitivity analysis for different possible multiples and 2013
estimated earnings suggested the target price can range from $72 to $118. Expected equity return method
was used to discount future retained earnings with cost of equity of 8.53% to generate a target price of
$93.61. By weighing P/B 40% and P/E and equity return model 30% each, an intrinsic value of $89.75
was found, providing 16% upside from the current price. The company pays a 2.38% dividend yield.
Risks
Downgrades or the revocation of the financial strength ratings. A strong balance sheet and
high credit ratings have been important factors in this company’s growth. It is common for
reinsurance contracts to contain terms that would allow ceding companies to cancel a contract if
insurance subsidiaries are downgraded below an A-. Currently, AWH is rated as a solid A by
S&P.
Significant losses and volatility in financial results from catastrophic events. As a multi-line
casualty and property insurer and reinsurer, AWH could experience significant losses from claims
arising out of catastrophic events. U.S. GAAP does not permit insurers and reinsurers to reserve
for catastrophes until they occur and claims for these events could cause substantial volatility in
financial results for any fiscal quarter or year which can affect financial ratings. The last three
recent events that affected AWH were the 2011 Japanese earthquake/tsunami, 2010 Chilean
earthquake, and 2008 hurricanes Gustav and Ike.
Interest rate risk. Investment income remains challenging in the current low interest
environment, as insurance companies place most of their investment in fixed income securities. A
prolonged period of extremely low interest rates or a sudden jump in interest rates could
challenge the firm’s ability to earn a sufficient investment return. AWH appears to be well
positioned against a sudden jump in rates as its current fixed maturity portfolio has a duration of
about 2 years, one of the lowest in the industry.
Management
Scott A. Carmilani was elected as AWH’s president and CEO in January 2004. Prior to joining the
company in 2002, he was the president of the Mergers & Acquisition Insurance Division of subsidiaries
of AIG. He was appointed Chairman of the Board in January 2008.
Page 13
Marquette University AIM Class 2013 Equity Reports Fall 2012 Page 13
Ownership
Source: Bloomberg
Top 5 Shareholders
Shareholder Shares % Out
Fidelity Management & Research 2,459,668 6.88
Vanguard Group Inc. 2,235,710 6.25
Clearbridge Advisors LLC 2,225,350 6.22
Artisan Partners Holdings LP 2,166,733 6.06
Champlain Investments Partners 1,468,445 4.10
Source: Bloomberg
% of Shares Held by All Insider and 5% Owners: 27.9%
% of Shares Held by Institutional & Mutual Fund Owners: 97%
Page 14
Marquette University AIM Class 2013 Equity Reports Fall 2012 Page 14
AMN Healthcare Services (AHS)
August 31, 2012
Greg Trunk Healthcare
AMN Healthcare Services (NYSE: AHS) provides placement of permanent and temporary healthcare
professionals and workforce management solutions across three functional divisions; Nurse and Allied
Healthcare Staffing (64% of revenue), Locum Tenens Staffing (31%), and Physician Permanent
Placement Services (5%). AHS’s Nurse and Allied Healthcare Staffing concentrates upon providing a
variety of nursing and other healthcare professional staffing services to medical organizations. This
includes managing all temporary nursing and allied needs, traditional temporary hiring services, and
managing the outside recruitment process. The Locum Tenens division places physicians with clients on a
temporary basis and Physician Permanent Placement Services assists clients in finding healthcare
professionals for permanent employment. The company was founded in 1985 and is headquartered in San
Diego, California.
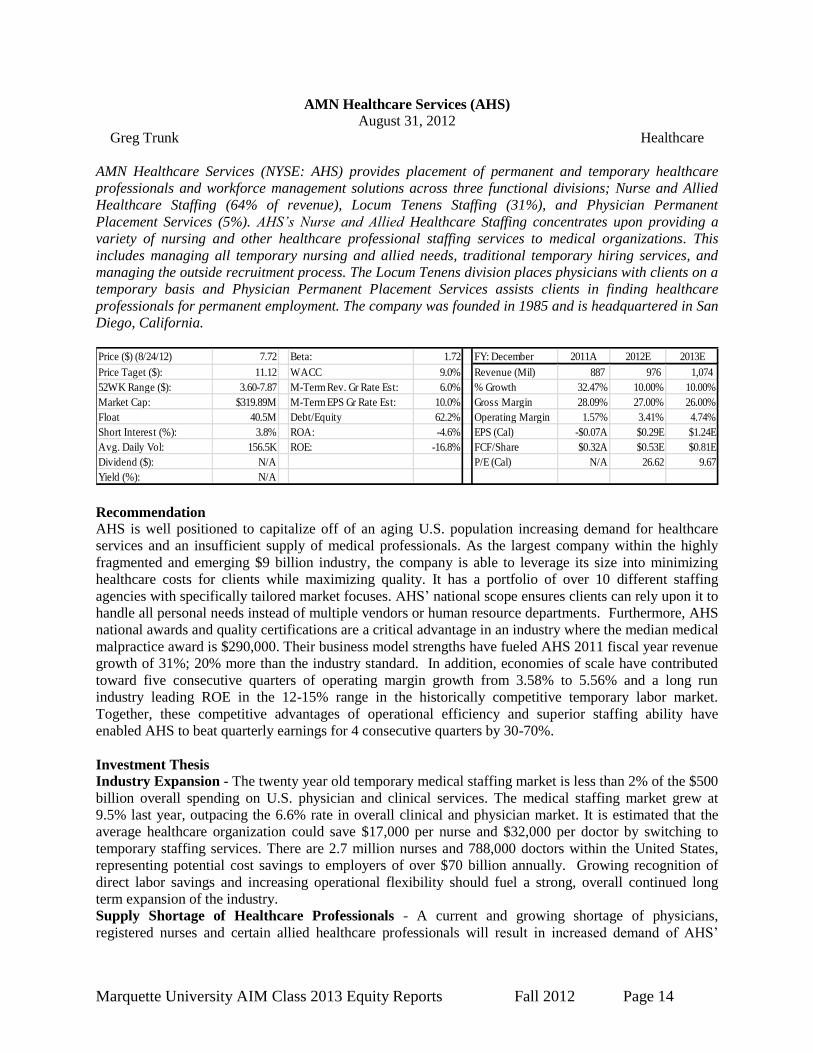
Price ($) (8/24/12) 7.72 Beta: 1.72 FY: December 2011A 2012E 2013E
Price Taget ($): 11.12 WACC 9.0% Revenue (Mil) 887 976 1,074
52WK Range ($): 3.60-7.87 M-Term Rev. Gr Rate Est: 6.0% % Growth 32.47% 10.00% 10.00%
Market Cap: $319.89M M-Term EPS Gr Rate Est: 10.0% Gross Margin 28.09% 27.00% 26.00%
Float 40.5M Debt/Equity 62.2% Operating Margin 1.57% 3.41% 4.74%
Short Interest (%): 3.8% ROA: -4.6% EPS (Cal) -$0.07A $0.29E $1.24E
Avg. Daily Vol: 156.5K ROE: -16.8% FCF/Share $0.32A $0.53E $0.81E
Dividend ($): N/A P/E (Cal) N/A 26.62 9.67
Yield (%): N/A Recommendation
AHS is well positioned to capitalize off of an aging U.S. population increasing demand for healthcare
services and an insufficient supply of medical professionals. As the largest company within the highly
fragmented and emerging $9 billion industry, the company is able to leverage its size into minimizing
healthcare costs for clients while maximizing quality. It has a portfolio of over 10 different staffing
agencies with specifically tailored market focuses. AHS’ national scope ensures clients can rely upon it to
handle all personal needs instead of multiple vendors or human resource departments. Furthermore, AHS
national awards and quality certifications are a critical advantage in an industry where the median medical
malpractice award is $290,000. Their business model strengths have fueled AHS 2011 fiscal year revenue
growth of 31%; 20% more than the industry standard. In addition, economies of scale have contributed
toward five consecutive quarters of operating margin growth from 3.58% to 5.56% and a long run
industry leading ROE in the 12-15% range in the historically competitive temporary labor market.
Together, these competitive advantages of operational efficiency and superior staffing ability have
enabled AHS to beat quarterly earnings for 4 consecutive quarters by 30-70%.
Investment Thesis
Industry Expansion - The twenty year old temporary medical staffing market is less than 2% of the $500
billion overall spending on U.S. physician and clinical services. The medical staffing market grew at
9.5% last year, outpacing the 6.6% rate in overall clinical and physician market. It is estimated that the
average healthcare organization could save $17,000 per nurse and $32,000 per doctor by switching to
temporary staffing services. There are 2.7 million nurses and 788,000 doctors within the United States,
representing potential cost savings to employers of over $70 billion annually. Growing recognition of
direct labor savings and increasing operational flexibility should fuel a strong, overall continued long
term expansion of the industry.
Supply Shortage of Healthcare Professionals - A current and growing shortage of physicians,
registered nurses and certain allied healthcare professionals will result in increased demand of AHS’
Page 15
Marquette University AIM Class 2013 Equity Reports Fall 2012 Page 15
recruitment and placement services. Approximately 47% of all licensed physicians in the United States
are at least 50 years old and nurses over the age of 50 comprise 45%. Additionally, 55% of nurses over
age 50 are expected to retire within the next ten years according to the Nursing Management Aging
Workforce Survey - and according to the Association of American Medical Colleges, nearly one-third of
all physicians will retire in the next decade. The estimated physician shortage is expected to quadruple
from 30,000 currently to 130,000 by 2025 and nursing demand is expected to grow from 300,000 to
around 800,000. These growing shortages are despite the fact that overall employment of physician and
nurses are expected to rise by 24% and 26% respectively over the next decade according to the U.S.
Bureau of Labor, more than any other common professional category. AHS will benefit on both demand
and supply sides as healthcare organizations increasingly rely upon staffing agencies to solve staffing
shortages and there is a growing pool of qualified candidates.
Increased Reliance upon Healthcare Companies - The U.S. Census Bureau projects the population of
people over 65 to double by 2030 from 35 million to 71 million. Admissions for the over-65 age group
are expected to rise from 38% in 2004 to 56% in 2030. Patients age 65 and older typically average six to
seven doctor visits per year compared to two to four visits annually for those under age 65. If the annual
number of visits continues at the present rate, the U.S. population will make 53% more trips to the doctor
in 2020 than in 2000, according to report by Association of American Medical Colleges. In order to
accommodate the larger influx of patients’ healthcare organizations will be driven to rely more upon the
staffing services AHS provides.
Valuation
To compute the intrinsic value of AHS, a 5 year DCF, P/S, and EV/EBTIDA approach was used. In the
DCF analysis a growth rate of 10% growth rate was used in years 3-5, a 1% perpetual growth rate and a
discount rate of 11%. A premium of 2% was added to the WACC to reflect the large financial leverage
present and cyclicality of the business. Through using a multiple approach with a long term historical P/S
of .47X and an EV/EBTIDA of 12X yields respective values of $11.74 and $10.60. Based upon a
triangulation approach with weightings of 50% DCF, 25% P/S, and 25% EV/EBTIDA, an estimated price
target of $11 was established, representing a potential upside of 38%. No dividend is currently paid.
Risks
Economic Sensitivity - Demand for staffing services is closely correlated to changes within the economy.
During times of economic downturns medical professionals are less likely to leave and are more likely to
work additional hours. In addition the rise in general unemployment during times of economic distress
results in increased amounts of uninsured patients, which intern produces subsequent underutilization of
the healthcare system. The factors of reduced healthcare system demand by patients and increase supply
of medical professionals leave AHS sensitive to changes in the aggregate economic activity level.
Regulatory Risk - Though AHS does not derive any revenue from Medicare or Medicaid it clients
typically are heavily reliant upon the programs. Changes in provider reimbursement methods and
payment rates could influence demand and pricing for AHS services. Furthermore, it is currently an
industry standard to treat physicians as independent contractors. If federal or state governments define
contractors as employees it could expose AHS to additional taxes. In addition some states have laws that
prohibit non-physician owned companies from employing physicians. Classification of AHS current
independent contractor physicians as employees in states that prohibit the corporate practice of medicine
could prohibit AHS from operating the Locum Tenens portions of its business in those states.
Management
Susan Salka has been the CEO of AMN Healthcare Service since 2005. She previously held a variety of
positions since joining the company in in 1990 including VP of healthcare services and business
development. She was named San Diego’s Most Admired Public Company CEO. Brian Scott has been
Chief Financial Officer since 2011 and joined the company in 2003. He previously served as the Senior
VP of Operations Finance.
Page 16
Marquette University AIM Class 2013 Equity Reports Fall 2012 Page 16
Ownership
Source: Bloomberg
Top 5 Shareholders
Holder Shares % Out
Edgepoint Investment Group 6,768,100 16.57%
Invesco LTD 4,288,925 10.50%
Metropolitan West Capital Mngt 2,444,149 5.99%
Manulife Asset Management 2,343,870 5.74%
Vanguard Group Inc 2,160,835 5.29%
Source: Bloomberg
% of Shares Held by All Insider and 5% Owners: 45.4%
% of Shares Held by Institutional & Mutual Fund Owners: 87%
Page 17
Marquette University AIM Class 2013 Equity Reports Fall 2012 Page 17
Total Petroleum S.A. (TOT)
August 31, 2012
Varun Varma International Energy
Total S.A. (NYSE: TOT) is the fifth largest publicly-traded international integrated oil company in the
world. TOT generates revenue from three segments: Upstream (65%), Downstream (25%) and
Petrochemicals (10%). Upstream activities include oil/gas/LNG E&P operations, while downstream
activities include refining and marketing of oil products, which has allowed TOT to become one of the
largest refiners in Europe. They have one of the most diversified operations across more than 130
different countries with primary regions of: Europe (70.5%), Asia (14.8%), Africa (7.5%), and North
America (7.2%). Incorporated in 1924, TOT employs 96,000 globally with headquarters in Paris, France.
One TOT ADR represents one ordinary shares of TOT on the Paris Exchange (FP.FP).
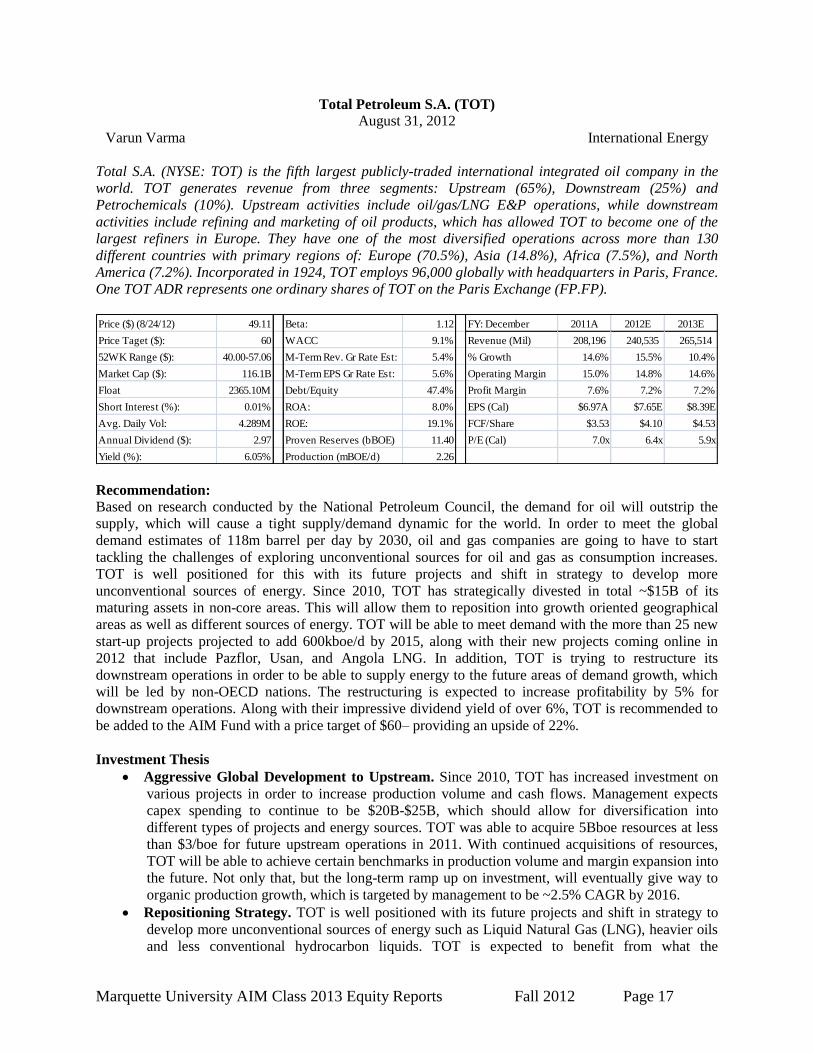
Price ($) (8/24/12) 49.11 Beta: 1.12 FY: December 2011A 2012E 2013E
Price Taget ($): 60 WACC 9.1% Revenue (Mil) 208,196 240,535 265,514
52WK Range ($): 40.00-57.06 M-Term Rev. Gr Rate Est: 5.4% % Growth 14.6% 15.5% 10.4%
Market Cap ($): 116.1B M-Term EPS Gr Rate Est: 5.6% Operating Margin 15.0% 14.8% 14.6%
Float 2365.10M Debt/Equity 47.4% Profit Margin 7.6% 7.2% 7.2%
Short Interest (%): 0.01% ROA: 8.0% EPS (Cal) $6.97A $7.65E $8.39E
Avg. Daily Vol: 4.289M ROE: 19.1% FCF/Share $3.53 $4.10 $4.53
Annual Dividend ($): 2.97 Proven Reserves (bBOE) 11.40 P/E (Cal) 7.0x 6.4x 5.9x
Yield (%): 6.05% Production (mBOE/d) 2.26
Recommendation: Based on research conducted by the National Petroleum Council, the demand for oil will outstrip the
supply, which will cause a tight supply/demand dynamic for the world. In order to meet the global
demand estimates of 118m barrel per day by 2030, oil and gas companies are going to have to start
tackling the challenges of exploring unconventional sources for oil and gas as consumption increases.
TOT is well positioned for this with its future projects and shift in strategy to develop more
unconventional sources of energy. Since 2010, TOT has strategically divested in total ~$15B of its
maturing assets in non-core areas. This will allow them to reposition into growth oriented geographical
areas as well as different sources of energy. TOT will be able to meet demand with the more than 25 new
start-up projects projected to add 600kboe/d by 2015, along with their new projects coming online in
2012 that include Pazflor, Usan, and Angola LNG. In addition, TOT is trying to restructure its
downstream operations in order to be able to supply energy to the future areas of demand growth, which
will be led by non-OECD nations. The restructuring is expected to increase profitability by 5% for
downstream operations. Along with their impressive dividend yield of over 6%, TOT is recommended to
be added to the AIM Fund with a price target of $60– providing an upside of 22%.
Investment Thesis
Aggressive Global Development to Upstream. Since 2010, TOT has increased investment on
various projects in order to increase production volume and cash flows. Management expects
capex spending to continue to be $20B-$25B, which should allow for diversification into
different types of projects and energy sources. TOT was able to acquire 5Bboe resources at less
than $3/boe for future upstream operations in 2011. With continued acquisitions of resources,
TOT will be able to achieve certain benchmarks in production volume and margin expansion into
the future. Not only that, but the long-term ramp up on investment, will eventually give way to
organic production growth, which is targeted by management to be ~2.5% CAGR by 2016.
Repositioning Strategy. TOT is well positioned with its future projects and shift in strategy to
develop more unconventional sources of energy such as Liquid Natural Gas (LNG), heavier oils
and less conventional hydrocarbon liquids. TOT is expected to benefit from what the
Page 18
Marquette University AIM Class 2013 Equity Reports Fall 2012 Page 18
International Energy Agency (IEA) calls the “Golden Age of Gas,” by currently being the
second-largest LNG player in the world. In addition, more than 70% of LNG supply is already
committed on long-term contracts indexed to oil prices. The inability of the United States to
export natural gas and LNG in the short term to meet demand outside of the U.S. will benefit
TOT. The most attractive markets for TOT to supply gas to are still Europe and Asia, where the
World Bank expects natural gas prices to stay around $10/mmbtu and LNG to stay around $12.5-
$15/mmbtu until 2020. The expected demand CAGR for gas and LNG by 2020 is 2.5% and
5.0%, respectively.
Attractive Dividend. TOT has one of the largest dividend yields in the sector (TOT: ~6% v.
Sector: ~2%), which they have been able to consistently increase and payout. Since 2003, TOT
has had a dividend growth CAGR of 7%. They firmly believe in being able to return cash back to
investors by targeting a payout ratio of 50%. Historically, TOT has maintained the payout ratio
in a 40%-50% payout ratio band, which should continue into the future with the strengthening
cash flow from future organic growth.
Valuation
To value TOT, a 5-year DCF methodology was used along with an EV/EBITDA and EV/BOE/d multiple
methodologies. Using a WACC of 9.1% along with a terminal EV/EBITDA multiple of 3.5x resulted in a
valuation of $56. The EV/EBITDA methodology applied a blended peer multiple of 4.0x against the
estimated 2013 EBITDA of $42B, with a valuation of $66. The EV/BOE/d methodology applied a
blended peer multiple of 65.0x to estimated BOE/d by management of 2.3MBOE/d, with a valuation of
$58. Weighing the DCF 40%, EV/EBITDA multiple 30%, and EV/BOE/d multiple 30%, the target price
of $60 was achieved, yielding an upside of 22%.
Risks
Substantial Decline in Commodity Prices. A decline in commodity prices can have a negative
effect on TOT. TOT estimates that a $1/bbl decrease in the annual average price of Brent would
reduce net operating income by $0.14B. Despite the dependence of commodity prices in order to
generate revenues, TOT has been able to diversify as a vertically integrated oil company to
reduce the pressure on declining commodity prices since the downstream operations would see
operating margin expansion with declining commodity prices.
Unexpected Disruptions in Production. Delays or stoppages in production are normal for major
oil companies in order to perform maintenance on existing production assets. However, any
unexpected delays or stops in the production can have a significant impact on revenues due to
reduction in boe/d numbers such as the Elgin leak incident in April ‘12 for TOT, which reduced
TOT’s boe/d by 50kboe/d for over 9 months. This specific delay will cost $400m in lost
production and cleanup costs.
Operations in Politically Sensitive Areas. TOT conducts operations in some the most areas
politically unstable areas of the world such as Iran, Syria, Sudan and Cuba. TOT also had
exposure to the “Arab Spring” in 2011, where production was halted in nations such as Liberia
and Egypt. Operating in these unstable areas can cause unexpected disruptions in production as
well as increase costs in order to cooperate with the governments.
Management
Christophe de Margerie has been CEO of Total S.A since 2007 and Chairman of the Board since 2010.
Christophe has been with Total S.A. since 1974 and has served in various executive capacities throughout
his tenure. The almost 40 years of experience in the energy industry has been integral to his success as
well as Total’s. Patrick de la Chevaridere has been CFO since 2008. He initially started with TOT in 1982
as a Drilling Engineer and has served in the Finance Division in several roles since 1989 including the
role of Deputy CFO from 2003-2008.
Page 19
Marquette University AIM Class 2013 Equity Reports Fall 2012 Page 19
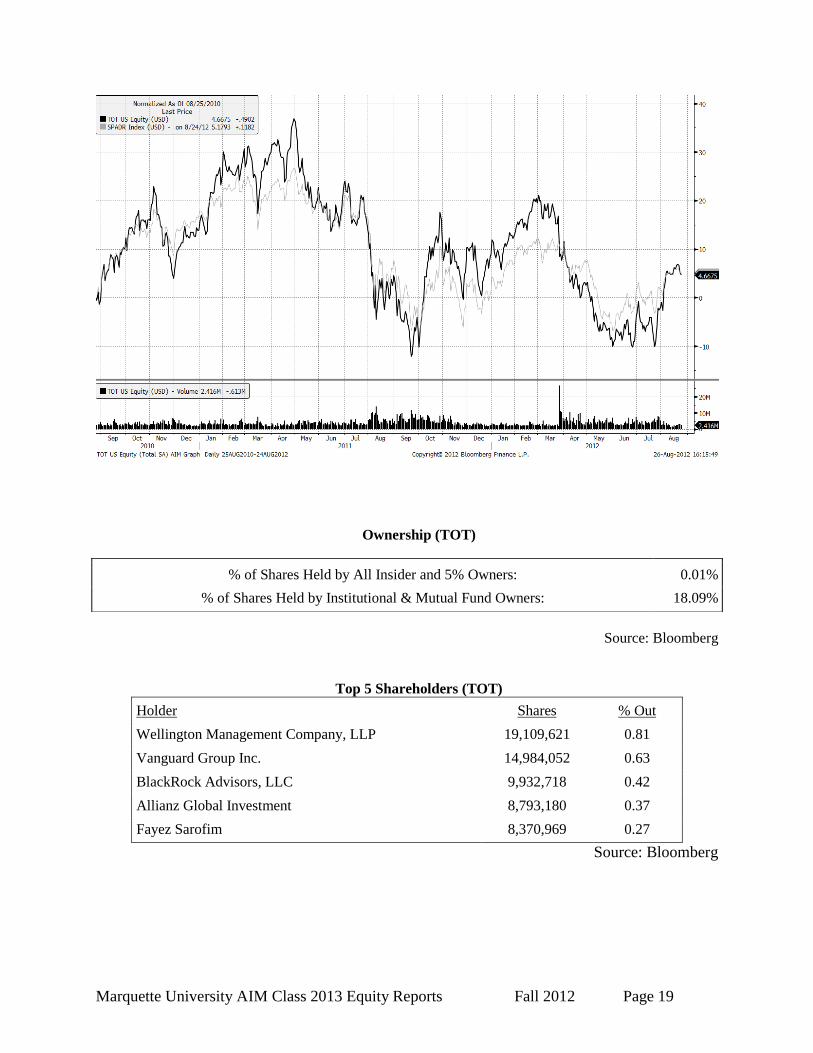
Ownership (TOT)
Source: Bloomberg
Top 5 Shareholders (TOT)
Holder Shares % Out
Wellington Management Company, LLP 19,109,621 0.81
Vanguard Group Inc. 14,984,052 0.63
BlackRock Advisors, LLC 9,932,718 0.42
Allianz Global Investment 8,793,180 0.37
Fayez Sarofim 8,370,969 0.27
Source: Bloomberg
% of Shares Held by All Insider and 5% Owners: 0.01%
% of Shares Held by Institutional & Mutual Fund Owners: 18.09%