Planning for a 100% independent energy system based on smart energy storage for integration of renewables and CO 2 emissions reduction Goran Kraja ci c a, * , Neven Dui c a, b , Zlatko Zmijarevi c c , Brian Vad Mathiesen d , Aleksandra Ani c Vu cini c a , Maria da Graça Carvalho b,1 a Department of Energy, Power Engineering and Environment, University of Zagreb, Ivana Lucica 5, 10002 Zagreb, Croatia b Department of Mechanical Engineering, Instituto Superior Técnico, Lisbon, Portugal c Croatian Energy Regulatory Agency, Ulica grada Vukovara 14, Zagreb, Croatia d Department of Development and Planning, Aalborg University, Denmark article info Article history: Received 29 November 2010 Accepted 11 March 2011 Available online 26 March 2011 Keywords: Energy storage Renewable energy sources Intermittency Energy planning Post carbon society Croatian energy system abstract EU import dependence on hydrocarbons and resulting negative environmental impact related to their use led to setting of new measures and energy policy that will make, in time, a post carbon society more feasible and achievable. Energy systems of this society will be based on four pillars: Renewable Energy, Buildings as Positive Power Plants, Energy Storage and Smart grids in combination with Plug-in Vehicles. All these pillars must be supported by the use of smart energy storage. The results of previous research has shown that in order to increase security, efficiency and viability, there is need for energy storage, in primary or secondary form, in order to transfer energy surplus from period of excess to the period when there is a lack. The problem of today’s storage systems is that they increase the cost of already expensive, distributed and renewable energy sources. That makes the large scale use of storage systems even less economically viable in market circumstances, despite economics of scale. The paper shows results of an energy planning methodology applied to several cases where use of smart energy storage system helps integration of energy flows, transformations and energy demand at the location of the energy end-use or close to it. Main results presented in this paper focus on planning a 100% independent energy system of Croatia. They also show the role of energy storage in a self-sustainable energy system with excess electricity production from renewable energy sources. The technical and financial analyses have been carried out for periods of one year taking into consideration demands and renewable energy production during all hours. Ó 2011 Elsevier Ltd. All rights reserved. 1. Introduction In 2007, the primary energy import dependency of the EU-27 was 53.1%. It is expected that in the next 20e30 years it will reach or surpass 70%. The situation in Croatia is similar, where in 2008 the import dependence was 52.3%, while for 2030 it is predicted to reach 72% [1]. EU-27 imports: 41.2% of solid fuels, 82.6% of oil and 60.3% of gas [2]. Such dependence on imported hydrocarbons leads to decreased security of energy supply as the import from Russia surpassed 1/3rd of total imported fossil fuels and approximately 1/ 3rd of imported gas and oil come from unstable geopolitical regions. Of course, competition for those same resources from developing countries is progressively growing. Thus, the EU energy strategy and a compatible Croatian strategy are focused on policies and measures that will increase the share of renewable and distributed energy sources, increase energy savings and improve energy efficiency. All these measures will increase the security of energy supply and decrease green house gas emissions. Moreover, the latest actions of the EU energy policy makers are focused on promoting and planning of the Post Carbon Society [3] and [4]. The four pillars of energy systems of the Post Carbon Society, as they were presented by Carvalho et al. [5], are: Abbreviations: CAES, compressed air energy storage; CEEP, critical excesses electricity production; CES, Croatian energy strategy; CHP, combined heat and power; COP, coefficient of performance; CSHP, industrial combined heat and power; DH, district heating; DHP, district heating plant; EEX, the european energy exchange AG; ENTSO-E, european network of transmission system operators for electricity; ESCO, energy service company; HEP, Croatian utility company; HPP, hydro power plant; HR, Croatia; JP, jet petrol; LPG, liquefied petroleum gas; LULUCF, (land use, land e use change and forestry); N.gas, natural gas; NPP, nuclear power plant; PHS, pumped hydro storage; PP, power plant (condensing); RES, renewable energy sources; SL, Slovenia; TSO, transmission system operator; V2G, vehicle-to- grid. * Corresponding author. Tel.: þ385 915658884; fax: þ385 16156940. E-mail address: [email protected](G. Krajacic). 1 Presently Member of the European Parliament. Contents lists available at ScienceDirect Applied Thermal Engineering journal homepage: www.elsevier.com/locate/apthermeng 1359-4311/$ e see front matter Ó 2011 Elsevier Ltd. All rights reserved. doi:10.1016/j.applthermaleng.2011.03.014 Applied Thermal Engineering 31 (2011) 2073e2083
Planning for a 100% independent energy system based on smart energy storagefor integration of renewables and CO2 emissions reduction
Goran Kraja�ci�c a,*, Neven Dui�c a,b, Zlatko Zmijarevi�c c, Brian Vad Mathiesen d, Aleksandra Ani�c Vu�cini�c a,Maria da Graça Carvalho b,1
aDepartment of Energy, Power Engineering and Environment, University of Zagreb, Ivana Lu�ci�ca 5, 10002 Zagreb, CroatiabDepartment of Mechanical Engineering, Instituto Superior Técnico, Lisbon, PortugalcCroatian Energy Regulatory Agency, Ulica grada Vukovara 14, Zagreb, CroatiadDepartment of Development and Planning, Aalborg University, Denmark
a r t i c l e i n f o
Article history:Received 29 November 2010Accepted 11 March 2011Available online 26 March 2011
Keywords:Energy storageRenewable energy sourcesIntermittencyEnergy planningPost carbon societyCroatian energy system
Abbreviations: CAES, compressed air energy stoelectricity production; CES, Croatian energy strategpower; COP, coefficient of performance; CSHP, industriDH, district heating; DHP, district heating plant;exchange AG; ENTSO-E, european network of transmelectricity; ESCO, energy service company; HEP, Crohydro power plant; HR, Croatia; JP, jet petrol; LPG, liqu(land use, land e use change and forestry); N.gas, natplant; PHS, pumped hydro storage; PP, power plant (energy sources; SL, Slovenia; TSO, transmission systegrid.* Corresponding author. Tel.: þ385 915658884; fax
E-mail address: [email protected] (G. Kraja�ci�c1 Presently Member of the European Parliament.
1359-4311/$ e see front matter � 2011 Elsevier Ltd.doi:10.1016/j.applthermaleng.2011.03.014
a b s t r a c t
EU import dependence on hydrocarbons and resulting negative environmental impact related to theiruse led to setting of new measures and energy policy that will make, in time, a post carbon society morefeasible and achievable. Energy systems of this society will be based on four pillars: Renewable Energy,Buildings as Positive Power Plants, Energy Storage and Smart grids in combination with Plug-in Vehicles.All these pillars must be supported by the use of smart energy storage. The results of previous researchhas shown that in order to increase security, efficiency and viability, there is need for energy storage, inprimary or secondary form, in order to transfer energy surplus from period of excess to the period whenthere is a lack. The problem of today’s storage systems is that they increase the cost of already expensive,distributed and renewable energy sources. That makes the large scale use of storage systems even lesseconomically viable in market circumstances, despite economics of scale. The paper shows results of anenergy planning methodology applied to several cases where use of smart energy storage system helpsintegration of energy flows, transformations and energy demand at the location of the energy end-use orclose to it. Main results presented in this paper focus on planning a 100% independent energy system ofCroatia. They also show the role of energy storage in a self-sustainable energy system with excesselectricity production from renewable energy sources. The technical and financial analyses have beencarried out for periods of one year taking into consideration demands and renewable energy productionduring all hours.
� 2011 Elsevier Ltd. All rights reserved.
1. Introduction
In 2007, the primary energy import dependency of the EU-27was 53.1%. It is expected that in the next 20e30 years it will reach
rage; CEEP, critical excessesy; CHP, combined heat andal combined heat and power;EEX, the european energyission system operators foratian utility company; HPP,efied petroleum gas; LULUCF,ural gas; NPP, nuclear powercondensing); RES, renewablem operator; V2G, vehicle-to-
: þ385 16156940.).
All rights reserved.
or surpass 70%. The situation in Croatia is similar, where in 2008 theimport dependence was 52.3%, while for 2030 it is predicted toreach 72% [1]. EU-27 imports: 41.2% of solid fuels, 82.6% of oil and60.3% of gas [2]. Such dependence on imported hydrocarbons leadsto decreased security of energy supply as the import from Russiasurpassed 1/3rd of total imported fossil fuels and approximately 1/3rd of imported gas and oil come from unstable geopoliticalregions. Of course, competition for those same resources fromdeveloping countries is progressively growing. Thus, the EU energystrategy and a compatible Croatian strategy are focused on policiesand measures that will increase the share of renewable anddistributed energy sources, increase energy savings and improveenergy efficiency. All these measures will increase the security ofenergy supply and decrease green house gas emissions. Moreover,the latest actions of the EU energy policy makers are focused onpromoting and planning of the Post Carbon Society [3] and [4]. Thefour pillars of energy systems of the Post Carbon Society, as theywere presented by Carvalho et al. [5], are:
G. Kraja�ci�c et al. / Applied Thermal Engineering 31 (2011) 2073e20832074
� Renewable energy� Buildings as positive power plants� Energy storage� Smart grids and plug-in vehicles
These characteristics will also be the result of strong political,public and economic support for all renewable energy technolo-gies. In the EU political support has been reflected through Euro-pean Energy Policy and primarily by its directives, the EU “climateand energy package” and The Strategic Energy Technology Plan(SET Plan). EU had an indicative target to cover 12% of the grossinland energy consumption by RES in 2010. New RES directive issetting RES target for 2020 on 20% of the gross final energyconsumption, while the most recent initiatives have already begunprocess to convert EU Energy supply to 100% RES. On 15th April2010 RE-thinking 2050 Campaign [6] was launched in the EuropeanParliament. It outlines a path how the European Union can switchto a 100% renewable energy supply (for electricity, heating andcooling as well as transport), and harvest the positive effects ofEurope’s energy supply system and reduce CO2 emissions. RE-thinking 2050 and similar initiatives [7e10] will help to create PostCarbon Society for the EU. As it is highlighted by Prof. Carvalho [3]:A post carbon society makes it possible to reframe the energy andclimate change challenges as opportunities, not just to fostera wealthier society, but also to create a more equitable andsustainable one. The Post Carbon Society is the concept thatexplains a more sustainable world, independent from the use offossil fuels. It describes the process of change and the necessarydevelopment of new technologies together with their integrationin energy, environment and other systems. Aside technologicalchange, it will require changing of society life-styles and behaviour.For more information on these issues see Refs [3,4].
In order to increase efficiency and viability of power systems,there is need for energy storage, in primary or secondary form, inorder to transfer energy surplus from period of excess production(or cheaper production) to other more appropriate periods.Although storage systems have a positive effect on RES integration,their problem is that they increase the cost of already expensivedistributed and renewable energy sources, making them, in marketcircumstances, even less economically viable.
Many energy storage technologies have been present on themarket for more than a century. What is novel and smart in thesetechnologies is their use for specific purposes and their synergieswith new processes and combination with other energy sources.
Use of traditional energy storage for increasing RES integrationhas been tackled and proposed by many authors. Use of pumpedhydro storage (PHS) is proposed in [11e13] batteries in [14e16] andcompressed air energy storage (CAES) in [17]. Use of emergingtechnologies as flow batteries and storages connected to newenergy carriers has been explained in [15,18,19]. Thermal storageand heat pumps could be used to store excess of RES production asshowed in [20] or effectively combined with smaller scale appli-cations to rise profits as modelled and explained in Ref. [21].
Some solutions based on novel principle of use of the thermalstorage for electricity storage and generation in cases where PHS orCAES are not applicable are explained in [22]. A more detailedreview of thermal storage, in particular thermal storage with phasechange materials and their application is given in [23]. Coolingstorage could also be used for the integration of renewable energysources [24,25].
The idea behind this work was to see how smart use of energystorage could improve and guide the development of a real energysystem. In addition, it was needed to investigate differentapproaches for addressing intermittency problems and energyindependency for selected sectors. It was also important to compare
the planned systemwithout storage and an alternativewith storage,thus highlighting advantages and disadvantages. Energy storagesystemcould helpwith integration of energy flows, transformationsand energy demand at the location of the energy end-use or close toit. The smart use of energy storagewill support all four pillars of thePost Carbon Society.
2. Problem background, methods and tools implemented inthe case study
This section presents the main issues that arise in using energystorage in long-term planning of energy systems. It continues bypresenting tools used by the authors for modelling as well as threemajor scenarios/systems modelled and investigated.
By portraying three different cases, the current status andpossible development of the Croatian Energy System will be given.Information used in the modelling will be presented together withthe assumptions and regulation strategies applied to the technicalenergy system analyses of the increased penetration of RES, storageand integration technologies.
2.1. Renewable energy, its intermittency problem and energystorage
The intermittency of renewable sources like wind, solar andwaves prohibits their exclusive use for power production as inmany cases it is very hard to match intermittent production withdemand. Technical and economic problems of variable productioncould be decreased by introducing different types of energy stor-ages. Typically, as RES penetration gets higher for autonomous orweakly interconnected areas (i.e. islands), operators give instruc-tions for shedding RES production. Similar problems appear in largepower systems when RES penetration reaches certain levels [26].As previously indicated, potential use of this excess electricity canbe utilized by heat pumps and thermal energy storage for later use.However, introducing storage systems further increases the cost ofan already expensive system using renewable energy sources.Consequently, this makes the large scale integration of storage lesseconomically viable in market circumstances. So an appropriateapproach is need for achieving a system based on high RES pene-tration (a highly independent system). For the case of hydrogen ithas been shown in [27] that electricity price should be in range of43 euro cents/kWh to 171 euro cents/kWh.
Analysis for storage requirements that will respond to inter-mittency problems and critical excesses electricity production(CEEP) has been carried out based on the Croatian energy Strategyafter 2020 and the premise of a 100% independent energy system.
2.2. Tools used for analyses
A detailed energy system analysis is performed by the use of thefreeware model EnergyPLAN [28] and H2RES [27]. Both models areinput/output models that perform annual analyses in steps of 1 h.Inputs are power demands and capacities of different technologiesincluded as well as demand distributions, and fluctuating renew-able energy distributions. Different options can be includedenabling the reconstruction of all elements of an energy system andallowing the analyses of used technologies.
H2RES model was used to determine hourly production of windturbines in Southern Croatia from the wind speed measurementsobtained within the AWSERCRO project [29]. The same model wasused to create the distribution curve of PV production. The Ener-gyPLAN is used for analysis of scenarios with large amounts ofintermittent renewable energy production and for analysing CHPsystems with large interaction between heat and electricity supply.
G. Kraja�ci�c et al. / Applied Thermal Engineering 31 (2011) 2073e2083 2075
EnergyPLANwas used to simulate a 100% renewable energy systemfor the island of Mljet in Croatia [30] the entire country of Denmark[7]. It was also used in various studies to investigate large scaleintegration of wind energy in power systems [20], optimalcombinations of renewable energy sources [31], management ofsurplus electricity [32], the integration of wind power using electricvehicles (EVs) [33], the investigation of fuel cells’ and electrolysers’potential in future energy systems [34], the effect of energy storage[25] and compressed-air energy storage [17].
The EnergyPLAN identifies CEEP as the export which exceedsthe transmission line capacity. This production can damage systemand electricity supply so it is not allowed in real system operation.However, it is calculated in order to see the system behaviour underdifferent operational and optimization conditions. Also, Ener-gyPLAN can use different regulation/policy strategies, puttingemphasis on heat and power supply, import/export of electricity,excess electricity production and use of different components inthe analysed energy system. Outputs include energy balances,annual productions, fuel consumptions, and import/exports.
Table 1The share of RES in the gross final consumption of energy.
Gross final consumption Share of RES %
Electricity 9.2Transport fuel 2.2Heating and cooling 8.6
2.3. The reference energy system
The Croatian energy system for 2008 has been modelled inEnergyPLAN. Energy consumption and supply data have been takenfrom[1],whilehourly loaddata forCroatianpower systemhavebeenprovided by ENTSO-E [35]. Basic data on generators has beenobtained from the Croatian electricity company (HEP) [36] and from[1]. Data for hourly production of hydro power plants has beenreconstructed frommonthly values provided in [35]while capacitiesof hydro storage have been calculated by data provided in [37]. Loadcurves for the hourly district heating demand were calculatedaccording to yearly heat consumption in Croatia [1] and usingpatterns of hourly heat demand in Denmark that are available inEnergyPLAN. Heat production from large cogeneration plants anddistrict heating systemshavebeen added asdistrict heating demand,while all industry heat and process steam demand was treatedseparately, through energy consumption of the industry sector.EnergyPLAN has the ability to model hourly heat production fromindustry and this heat is modelled using its own distribution underwhich it supplies heat to thedistrict heating systems. In EnergyPLAN,there is nopossibility to treat separately heat demand in the industrysector from the other sectors, since all district heating demands areaggregated and represented by the one hourly demand curve.
A total cross border transmission capacity for electricityexchange is set to 3200 MWas published in Ref. [38]. The author inRef. [39] provides a value of 3040 MW for the total import capacityfor Croatia and 2400 MW for the export capacity to neighbouringcountries. For the same capacities, the Slovenian TSO calculatesinterconnection capacities from SL to HR to be 1200 MW, instead of1000MW that has been published in [39] so 3200MWwas taken asfinal value for 2008.
Croatian import of electricity varies from 25% to 40% of yearlyend-consumption and is fairly dependent on hydro powerproduction and fossil fuel prices. Final import quantities and pricesare mostly set by bilateral contracts. As there are no obligations topublish these contracts there is no data regarding the price of theimported electricity. To replicate similar conditions as in 2008,hourly changes of market prices from the German spot marketpublished at EEX have been adopted by the elasticity, that isexplained in the EnergyPLAN manual [40].
The market price on the external market, pX, is calculated byformula:
pX ¼ pi þ (pi/po)� Facdepend � dNet-Import (1)
where pi is the system market price (as used by EnergyPLAN[40]),
Facdepend is the price elasticity (€/MWh/MW)po is the basic price level for price elasticity (input),dNet-Import the trade on the market.The Nuclear Power Plant (NPP) Krsko in Slovenia, which is under
50% ownership of HEP, is modelled as fixed import under theconstant hourly distribution taking into account the real outagesfrom 2008. It resulted in an almost constant power of 344 MWsupplied by NPP. In all calculated cases, the import was 2986 GWh.
Reference case calculated by the EnergyPLAN model has beencompared to statistical data for Croatia [1] in order to see how wellit represents the situation in 2008.
2.4. The case of Croatian energy strategy scenario until 2020
The idea behind this scenariowas to analyse the Croatian energysystem if it will follow the development plans laid down in thecurrent Croatian Energy Strategy (CES). According to the CES, theshare of RES in the gross final consumptionwill be 20% in 2020. Thisshare is divided between three energy vectors and it is planned tohave 35% of RES share in electricity consumption, 10% of RES sharein transport fuel and 20% RES share in heating and cooling. The 20%goal in terms of final energy consumption is given in the Table 1.
As it is mentioned above, one of the goals of the strategy is tosatisfy 35% of electricity consumption by renewable energy sourcesincluding big hydro power plants in 2020. To fulfill this goal it isexpected to add 300 MW of new large hydro power plants,1.200 MW of wind turbines, 85 MW of biomass power plants and100 MW of small hydro power plants. These RES installation havebeen inserted in the EnergyPLAN model in a way that one half ofthe planned capacity of new big hydro powerwas added as the run-off river hydro and the other half as storage hydro. Small hydro hasbeen treated separately but with the same hourly distributioncurve as run-of river.
For 2020, the CES envisages use of 26 PJ of biomass and 9 PJ ofbiofules while planned production of biogas from agriculture is 2.6PJ. Another 6 PJ will come from waste as a result of better wastemanagement. This will lead to a reduction of GHG emission for1.069 Gg CO2-eq [41]. Additionally, CES sets a goal to install0.225 m2 of solar thermal collectors per each Croatian resident(0.225 m2/per capita).
The current power plants in Croatian Energy systems are older(in average) than 35 years and it is envisaged by the CES that1100 MW will be decommissioned until 2020. In order to haveenough production capacities to satisfy peak loads and to provideadequate security of supply, the strategy set a goal to install1200 MW of new gas power plants and 1200 MW of coal powerplants until 2020. An additional 300 MW of new power plants willbe installed as CHP units which will partly replace existing ones.After 2020 it is not planned to use oil in power plants. This was themain reason for separating new units and existing units that willnot be decommissioned in two groups in EnergyPLAN. One grouprepresented by CHP plants, modelled as a combination of backpressure and condensing plants and another group with thecondensing plants using coal.
Fig. 1. Gross energy consumption by fuel and electricity export in the reference case(*geothermal heat for hot water and space heating not included).
Fig. 3. Electricity production by source in Reference case (*data from statistics are notdivided according type of HPP).
G. Kraja�ci�c et al. / Applied Thermal Engineering 31 (2011) 2073e20832076
Until 2020 it is planned to construct several new natural gaspipelines. One cross border line with Hungary with transportcapacity of 860,000 m3/h and new LNG terminal in Omisalj, on theisland of Krk, with the capacity of 10e15 Gm3/year. By successfulrealization of at least one of these two projects, Croatia will ensureenough import capacity for gas that will be supplied to new powerplants. Without new import capacity it will be hard to satisfypredicted demand.
According to sustainable scenario presented in the CES, pro-jected final energy consumption in 2020 is 386.84 PJ includingenergy efficiency measures foreseen to save 22.76 PJ. For the period2006e2020 the predicted increase in electricity consumption is2.7% yearly. The CES did not take into account recent economicalcrisis which has also decreased energy consumption. Based on thisfact the gross electricity consumption (without heat pumps,pumping and electric vehicles) used in the model has been set to22.5 TWh. This value gives the same increase in the period2012e2020 as it was in the period 2000e2008. Similar, the growthin the transport sector and for individual households is set to lowerrates than those assumed by the Strategy.
2.5. 100% independent (self-sufficient) Croatian energy system
Current Croatian natural gas reserves are estimated at36.4361 Gm3 and with a yearly production at 2.8472 Gm3, theo-retically they may be exhausted in less than 13 years. Similar life-time can be predicted for Croatian domestic oil reserves that areestimated at 11.4725 Mm3 and depleted with a yearly production of815,000 tonnes. However, this is just a hypothetical prediction as in
Fig. 2. Gross fuel consumption by sector, 2008 (**Includes boiler consumption withinCHP plant; **Consumption of households plus services without electricity consump-tion and heat from DH; ***Consumption of Industry plus Agriculture plus losses inrefineries and gas production facilities).
a real system the production will fall together with the reserveswhich means that domestic reserves will last longer but witha lower yearly production rates. Without significant domestic hardcoal reserves, it seems that even in the near future the Croatianenergy system could become 100% independent only if its energysupply will rely 100% on local renewable energy sources. With thisin mind, a scenario has been defined that uses energy storage andRES and will enable energy independency.
According to Croatian Green Paper [42] the total estimatedpotential of wood biomass from forestry, industry and agriculturein Croatia is 26 TWh with an additional potential of 4 TWh forbiofuels production using standard crops. A larger estimation of thepotential for biofuels production of 14.15 TWhwith a special type ofbiomass and using second generation of biofuels is given by authorsin Ref. [43]. While above numbers are related to the total technicalpotential of biomass in Croatia, more realistic and economicallyfeasible numbers are provided in Ref. [44]. The authors estimated 6TWh/year as the average energy potential of forestry residues,wheat straw and corn stover. In the period after 2020, most oftechnical potential for large hydro power plants will be exploited.Only options that may be built would have to be pumped storageand small hydro power plants. Locations have been already iden-tified for 200MW in small hydro power plants and registered in thenational registry of RES projects. Therefore, an additional 100 MWcapacity has been envisaged (in addition to the CES) and taken intoconsideration. There is also potential for geothermal power plantsand a total of 40 MW was added to the model. Aside from hydropower, biomass is renewable energy source with the highestpotential in the continental part of Croatia while wind and solarrepresent the highest potential for electricity production along thecoastline and in southern Croatia. For low temperature heatgeneration, besides traditionally used biomass, solar andgeothermal have the highest potential. The economic potential ofsolar energy for heat production is estimated to be around 50% ofthe total low temperature heat production in 2000 in Croatia, ornearly 12 TWh/year [42].
For the period after 2020, the transport sector is modelled in theway that regular cars on gasoline and diesel will phase out whilethe share of electric and biodiesel vehicles will progressively grow.In case of the 100% independent system it is assumed that a share of25% of diesel consumption in the transport sector is used by trucks,
Table 2Fuel prices used in calculations.
Fuel prices [€/GJ]
Year Coal Fuel oil Diesel Petrol/JP N.gas LPG Biomass
Table 4Gross energy consumption and CO2 emissions in 2020. (*gross final energyconsumption in sustainable scenario).
EP_Market Strategy EP_Tech
Total energy [TWh] 118.86 108.10* 106.78Total energy corrected [TWh] 109.96 n/a 106.76CO2 [Mt] 26.51 n/a 21.14CO2 corrected [Mt] 24.91 n/a 21.34
G. Kraja�ci�c et al. / Applied Thermal Engineering 31 (2011) 2073e2083 2077
busses and other vehicles or 4.75 TWh and an additional 5.4 TWh isused by trucks and other heavy vehicles from industry and agri-culture. In this case diesel consumption is modelled as it was totallycovered by biofuels. All other road transport or 30 billion/km peryear, is assumed to be switched to electric vehicles making inaverage 10,000 km per year. Batteries are integrated part of electricvehicles and way of their operation (grid charging and eventualdischarging) could have large impact on future energy systems. Jetfuel consumption in this case is increased for 50% to 3 TWh and hasnot been replaced by any other fuel.
Due to a large potential in energy efficiency and a dubiousdemographic growth it has been assumed that yearly energyconsumptionwill not increase significantly from the level planed inthe CES for 2020. To demonstrate the potential for energy savingsand energy efficiency, a good example is electricity consumptionfor a public lighting (440.16 GWh in 2008). Only one ESCO projectaimed at public lighting of the town of Karlovac [45] realizedsavings of 25%. If similar measures were to be applied across thewhole country, approximate savings only for public lightning couldreach 110 GWh annually, which is figuratively speaking the annualelectricity production of a medium size power plant. In the sameyear households’ electricity consumption was 6711 GWh. In the EU,in average 20% of electricity consumption in households is spent onlighting so if the same share is applicable to Croatia it accounts for1342 GWh in electricity consumption. New efficient lightning couldreduce this consumption to 1/5 of its original value. In relation toenergy efficiency in buildings, with proper insulation achievable
Fig. 4. Gross energy consumption by fuel and electricity export in the case of CES 2020(*geothermal heat for hot water and space heating not included).
savings in Croatia for households and buildings is around 50 PJ (oralmost equal to all heat consumption in the household sector) [46].
3. Results of modelling in EnergyPLAN
3.1. Analysis of the reference case for 2008
Despite difficulties in obtaining some data that represents realhourly consumption in 2008, the final numbers have showed thatEnergyPLAN model could represent the Croatian energy systemadequately. Comparison of the gross energy consumption by fueland electricity exports for two different calculations (market andtechnical optimization) and data from the literature have beenpresented in the Fig. 1.
Gross fuel consumption by sector is given in Fig. 2. It shows bigdifferences in energy sector between results of market optimiza-tion regulation strategy and literature data on the one side and thetechnical optimization on the other. This difference is caused by thepreference of technical optimization to supply demand with localproduction instead of importing. Thus the market optimizationprovides a more realistic simulation. In EnergyPLAN, consumptionof the energy sector has been divided between heat and powerproducers. The energy losses at refineries, gas production facilitiesand energy consumption of all other production facilities have beenadded to the energy consumption of the industry sector. Energyconsumption in agriculture has been also added to the industrysector. The Household sector, in EnergyPLAN, has been used torepresent the consumption of households and the services sector,although consumption of different types of energy has been treatedseparately.
Electricity production by source and import of electricity aregiven in Fig. 3. Since no published data exists related to productionof hydro power plants according to their type, hourly productiondistribution curves have not been compared to real data. Aspreviouslymentioned, technical optimization tries to avoid importsor exports and minimizes the use of fossil fuels in observed powerplants whereas energy from all other sources is calculated beforeestimation of the PP share.
Analyseswere conductedwith the following restrictions in orderto ensure the delivery of ancillary services and achieve grid stability(voltage and frequency). At least 30% of the produced electric power(at any hour) must come from power production units capable ofsupplying ancillary services, such as central PP, CHP, HPP. Thedistributed generation from RES and small CHP units is not capableof supplying ancillary services necessary for grid stability. Addi-tionally, large CHPs are not able to operate below their minimum
Table 5Cost of CES 2020 case for different model optimizations.
Fig. 5. Critical excess electricity production for increased wind capacity (the case ofinterconnected and independent energy system).
Fig. 6. Gross energy consumption by fuel and electricity export in the case of 100%independent system (*geothermal heat for hot water and space heating not included).
G. Kraja�ci�c et al. / Applied Thermal Engineering 31 (2011) 2073e20832078
load that can be set within EnergyPLAN (in this case 110MW),whiletheminimum load for condensing power plants is set to 516MW. Inthe analyses here, the Croatian energy systemwas treated as a onepoint system, i.e. no internal bottlenecks are assumed.
EnergyPLAN does not offer the possibility to automaticallycalculate uncertainty or an error estimate for the use of aggregatingdistribution curves, installed storage and production capacities. Oneshould calculate these values according to one’s own methodologyand check if it is wrong to treat the whole system as a point.
However, Croatia can be roughly divided in three climate regions:continental, coastline or Mediterranean and mountain. Hourly
Fig. 7. Electricity production by source in the case of 100% independent s
distributions of energy consumption are highly dependent on the airtemperature and population density. It can be concluded that thereare significant differences between the indicated climate regions andtheir hourly distribution curves of heat and electricity consumption.
Applied market optimization regulation strategy was conductedwith the real fuel prices published in Ref. [1] for 2008. All futureprices of fuel and investment costs for new technologies and unitshave been taken from EnergyPLAN data used in Ref. [7], data fromRef. [47] data obtained from Strategic Energy Technology Infor-mation System (SETIS) web calculator. Table 2 presents fuel pricesused in calculations for different years.
Gross final energy consumption, CO2 and fuel costs for differentoptimization strategies and literature data are presented in Table 3.Values of CO2 taken from Ref. [1] just represent preliminary datasince official statistics for emissions from the energy sector in 2008have never been published. In 2007, CO2 emissions in energy sectorwere 24.7 Mt CO2 according to Ref. [2], while the EUROSTAT valuefor 2008 is 22.14 Mt CO2. This value includes all sectors andexcludes international bunkers and LULUCF (Land Use, Land e UseChange and Forestry) emissions. As data for CO2 emissions obtainedby EnergyPLAN calculations falls in the range of published data theyare considered acceptable.
The CO2 corrected emissions take into account imported elec-tricity and they have been adjusted according inland production.This means that imported electricity produced the same amount ofGHG emissions as if it was produced in Croatia. Looking at a wholepicture, importing electricity is not a solution for reducing the GHGemission, as CO2 is a global problem, so import sometimes justmoves the problem across the borders.
3.2. Analysis of the case Croatian Energy Strategy 2020
Results for the gross energy consumption by fuel and electricityexports in the case of CES 2020 for different system optimizationsand CES data are presented in Fig. 4. The values from CES includedata according to the baseline scenario. The difference is mostlyresult of the used estimation of energy consumption growth ratesas explained in chapter 2.
In the Green paper [42], the estimated use of heat pumps forheating is 18% of useful surfaces in services sector and householdsfor 2020. The value used in EnergyPLAN calculations is 2.7 TWhsupplied by heat pumps with COP 3. The related electricityconsumption was 0.86 TWh where 0.25 TWh of heat needs inhouseholds with heat pumps was assumed to be supplied by solarthermal. It is also presumed that those installations also includeheat storage with a capacity sufficient for providing two days of
ystem (*data from statistics are not divided according type of HPP).
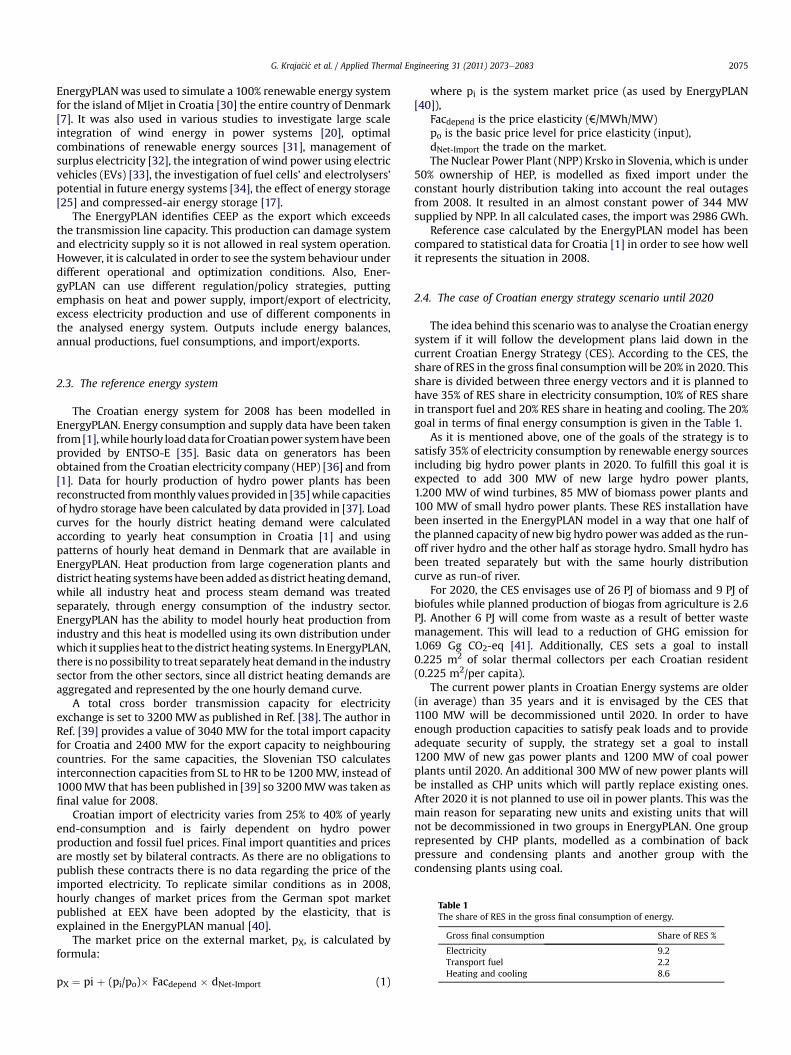
Fig. 8. Reduction of critical excess electricity production for different installed windpower capacities and pumped storage capacities.
Table 6Gross energy consumption and CO2 emissions in 2020.
EP_Market EP_Tech
Total energy [TWh] 89.91 80.22Total energy corrected [TWh] 73.23 80.22CO2 [Mt] 5.45 4.372CO2 corrected [Mt] 3.41 4.372
G. Kraja�ci�c et al. / Applied Thermal Engineering 31 (2011) 2073e2083 2079
average heat demand. Based on plans for large grid extensions withthe neighbouring countries, maximum import and export has beenincreased to 10000 MW. Modernization of power plants was set toallow better flexibility of their operation so theminimal load of CHPplants was set to 50 MW while minimal load for power plants thatoperate in condensing mode was set to 400 MW. Additional 10GWh thermal storages have been added to large CHP facilities inorder to increase their flexibility, while existing pumped storagefacilities of 257/282 MW turbine/pump capacity have been put inthe function of RES integration. Grid stabilization share was kept at30% of the hourly load.
Estimated averaged increase in fuel prices for 2020 (Table 2)from 2008 is 52%. It is consequently assumed electricity marketprices of EEX will also increase by 50%. The electricity price elas-ticity was the same as in 2008. The price of CO2 emission allow-ances has been set to 20€/tCO2 and the discount rate used for theinvestment calculation was 5%.
Gross energy consumption and CO2 emissions for this case arepresented in Table 4. By comparing it with the results for thereference case it can be concluded that CO2 will be reduced only inthe alternative provided by the technical optimization whichminimizes use of coal and thus makes investment in 1200 MW ofnew coal power plants questionable.
Table 5 shows difference in costs between market and technicaloptimizations in the case of CES 2020. Market optimizationincreases load of coal power plants but even in the market opti-mization, they operate with a low load factor of 29%. Total grossinland electricity consumption calculated by EnergyPLAN (takinginto account pumping, electric vehicles, heat pumps and extraelectric heating) was 23.68 TWh for the case of the market opti-mization for the 2020 case. With the export of 6.77 TWh it couldrepresent total inland electricity consumption of 30.45 TWh. Thegross inland consumption according to the CES 2020 is assumed tobe 29.94 TWh. Since there is a fixed yearly import of 2.99 TWh fromNPP Krsko that will certainly continue for the next three decades,only 3.78 TWh could be additionally produced by coal powerplants. Even if the load will increase by the double growth ratesthan in period 2003e2008 and by neglecting all additional importbeside existing NPP, planned coal power plants could reach loadfactors of 70%. This will certainly not ensure adequate return oninvested capital to investors so construction of 1200 MW of coalpower plants as foreseen in the Strategy should be definitelyreconsidered before making the final investment decision.
The needs for introducing integration technologies necessary toachieve 100% independent energy system after the 2020 has beenanalysed by varying the amount of wind energy in the electricitysystem. In this study, installed wind power generation is varied
Table 7Cost of 100% independent energy system for different model optimizations.
from 17 MW to 7000 MW with corresponding electricity genera-tion from 0.04 TWh to 16.69 TWh.
Fig. 5 shows just rough requirements for allocation options forincreased wind production in the case of the market optimizationin an interconnected system and the technical optimization in anindependent (closed) system without interconnections withneighbouring countries. It could be concluded that in an opensystem, with an organized spot market, there would be no prob-lems for installing 2000 MWof wind turbines, under the conditionthat new condensing power plants envisaged by the Strategy willallow flexible operation with minimal load at 400 MW while CHPunits should be allowed minimum operation at 50 MW with 10GWh of thermal storage capacity. Detailed analysis for the inde-pendent (closed) system is provided in the following two chapters.
3.3. Analysis of the case of a 100% independent energy system
The goal of modelling and analysing a 100% independent energysystem is not to finally operate it in standalone mode but to make itmore sustainable and to insure adequate security of energy supplyand independency. A system that does not depend on energyimport/exports can achieve better opportunities on the market. Asenergy systems are planned for periods of 20e40 years, an impor-tant step is todetermine futureenergyneeds anddemands,which inthis case shouldbe satisfiedby locallyavailable resources. In termsofthis study, this requiredadetailed analysis of available resources andtheir potential. As mentioned in Chapter 2.5, biomass and biofuelspotential for Croatia are estimated to 30 TWh - but to fully exploitthis potential, its exploitation has to be properly managed.Management of biomass resource could be done as explained by[48]. Similarly, other resources should be managed by using propermodelling tools andmethodologies. When needs and potentials areknown, oneof themost challenging tasks is to seewhat technologiescouldmatch demands by using available resources. Analyses should
Fig. 9. Reduction of critical excess electricity production for different installed windpower capacities and storage capacities of PHS.
Fig. 10. Increasing wind integration by different PHS capacities.
Fig. 11. Calculated total yearly costs for different PHS capacities.
G. Kraja�ci�c et al. / Applied Thermal Engineering 31 (2011) 2073e20832080
cover the current status of available technologies but also theirstatus in the future.Here, all alternatives are stated and comparedbyobjective technical, economic, environmental and social parame-ters. As a general rule, decision makers could choose the mostsustainable and acceptable alternatives and consequently proposeappropriate strategies to realize the plans based on evaluationresults. This means that the case of 100% independent Croatianenergy system, calculated by the EnergyPLAN model, representsonly a part of possible alternatives as it mostly takes into accountcurrent and market mature, technologies (except electric vehicles).These technologies can be used immediately although their pricewill not significantly decrease over the time due to learning effects(except PV technology).
Fig. 12. Reduction of CEEP for different consumption
Anindependentenergysystemwasdesignedas followingefirstly,all hydropower technical potential has beenutilized, then all biomasspotential has been allocated for consumption in different sectors,adequate shareof solar thermalheatinghasbeen introduced togetherwith proper heat storages. Similarly, heat pumps with appropriateheat storages have been added to replace traditional boiler heating.After the introduction of electric cars and related electricity demand,wind capacity has been increased as showed in Fig. 5 where therelated CEEP has been reduced by installation of PHS systems oradditional heat pumps andheat storage. The additional need for extraenergy has been satisfied by increasing of PV installations.
When the reduction of CEEP (by adding of new storage capacity)became inefficient, further reduction has beenmade by operationalregulation: by reducing RES production, by reducing CHP produc-tion and replacing it by boiler, and by replacing boiler heatproduction with electric heating.
Final calculations for the gross energy consumption by fuel andelectricity export are given in Fig. 6. Data shown in the figurerepresents results of two optimizations: a market optimizationdone in an open system with 10 GW of interconnection anda technical optimization based on a closed system with no inter-connections. Unsurprisingly, the demand in the market system isgreater since it is possible to trade electricity on external markets.Electricity production by source in the case of a 100% independentsystem is presented in Fig. 7. It should be emphasized that underthe conditions of the technical optimization, load of condensingpower plants has been almost 0. This was possible under theassumption that PP and CHP will be allowed full operational
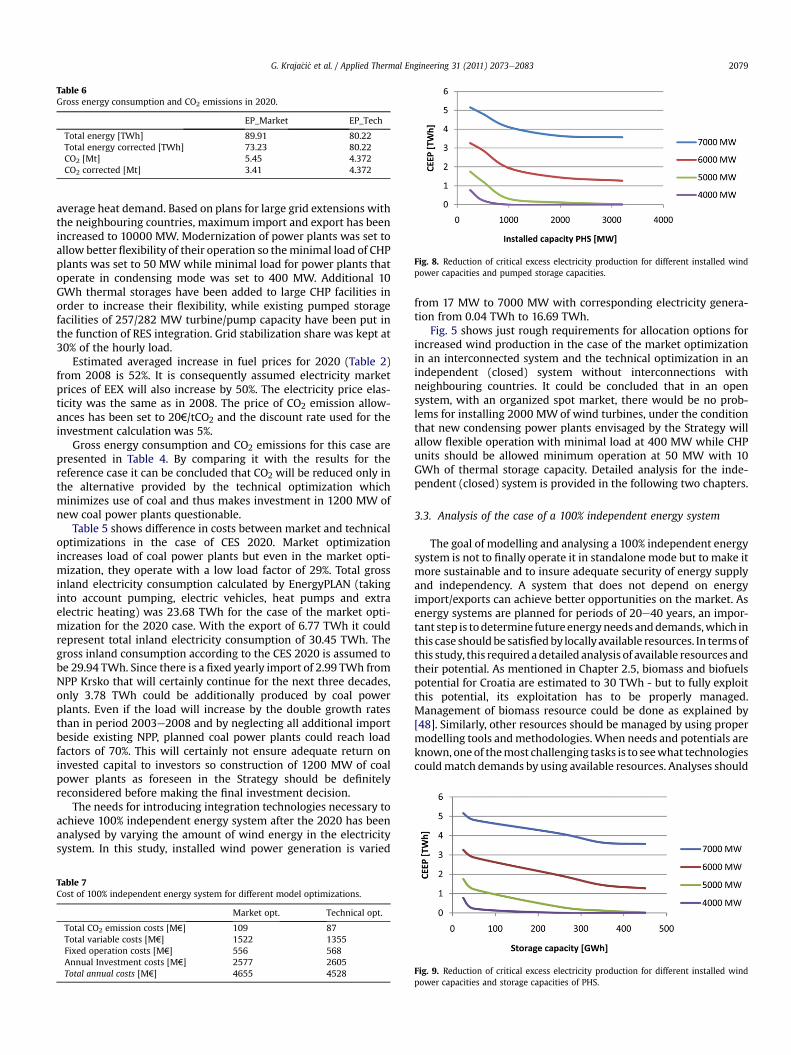
of heat pumps in household and services sector.
Fig. 13. Calculated total costs for different consumption of heat pumps in household and services sector.
G. Kraja�ci�c et al. / Applied Thermal Engineering 31 (2011) 2073e2083 2081
flexibility or, put it differently, they could be frequently switched offand on (which means they can operate without minimal load).
Table 6 and Table 7 present gross energy consumption, CO2emissions and costs of options provided by different optimizationstrategies in the 2020 case. Technical optimization gives lower costsas in market optimization electricity is also produced for trade onexternal markets.
3.4. Role of smart storage in increase of RES penetration
Due to smart use of energy storage Croatia could reach highpenetration of RES or 78.4% in the gross final energy consumptionand decrease energy dependence from predicted 70% to almost 20%in the period after 2020.
Currently, the PHS technology is the most widespread storagetechnology used in the power systems around the world. As it ispresented in Figs. 8e10 after installed 2000 MW and its 350 GWh,PHS contribution to further integration of wind energy into Croa-tian power system is rather small. Fig. 11 shows calculated totalyearly costs for different PHS capacities. By increasing only ofinstalled wind capacity it is possible to decreases total system costs,but only up to certain number if CEEP is not acceptable. Thus, Fig. 11and Fig. 10 should be analysed at the same context.
Fig. 12 shows results for the reduction of critical excess elec-tricity production with different consumption of heat pumps in
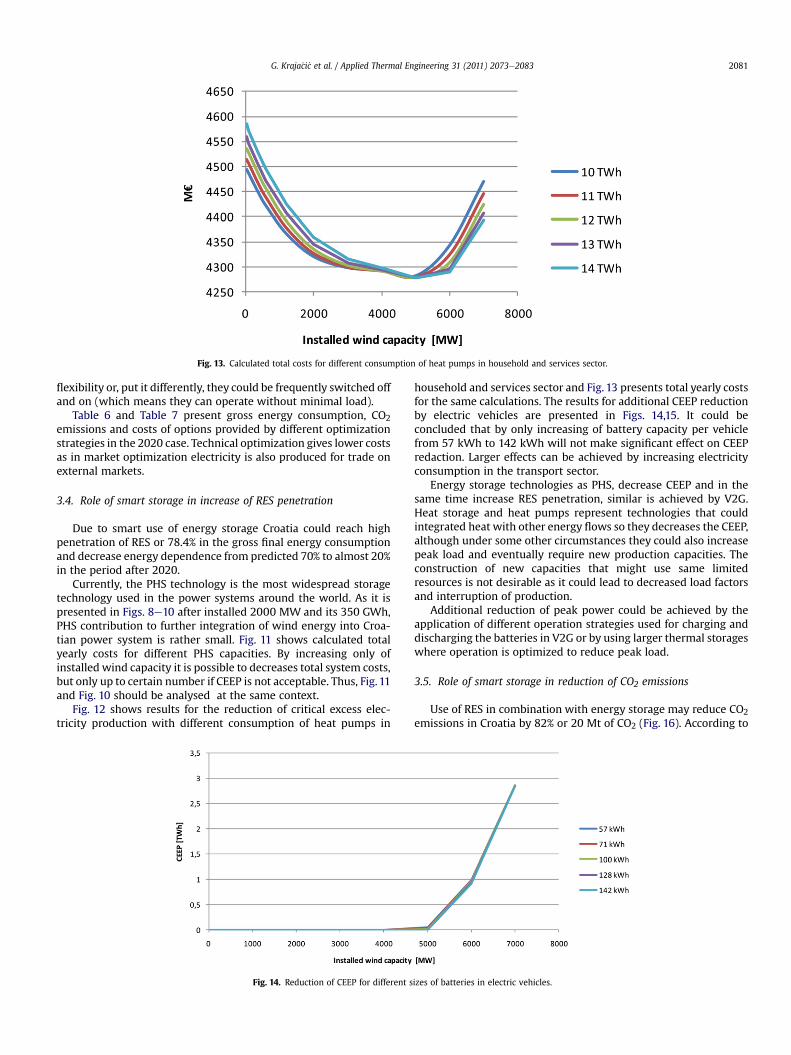
Fig. 14. Reduction of CEEP for different s
household and services sector and Fig. 13 presents total yearly costsfor the same calculations. The results for additional CEEP reductionby electric vehicles are presented in Figs. 14,15. It could beconcluded that by only increasing of battery capacity per vehiclefrom 57 kWh to 142 kWh will not make significant effect on CEEPredaction. Larger effects can be achieved by increasing electricityconsumption in the transport sector.
Energy storage technologies as PHS, decrease CEEP and in thesame time increase RES penetration, similar is achieved by V2G.Heat storage and heat pumps represent technologies that couldintegrated heat with other energy flows so they decreases the CEEP,although under some other circumstances they could also increasepeak load and eventually require new production capacities. Theconstruction of new capacities that might use same limitedresources is not desirable as it could lead to decreased load factorsand interruption of production.
Additional reduction of peak power could be achieved by theapplication of different operation strategies used for charging anddischarging the batteries in V2G or by using larger thermal storageswhere operation is optimized to reduce peak load.
3.5. Role of smart storage in reduction of CO2 emissions
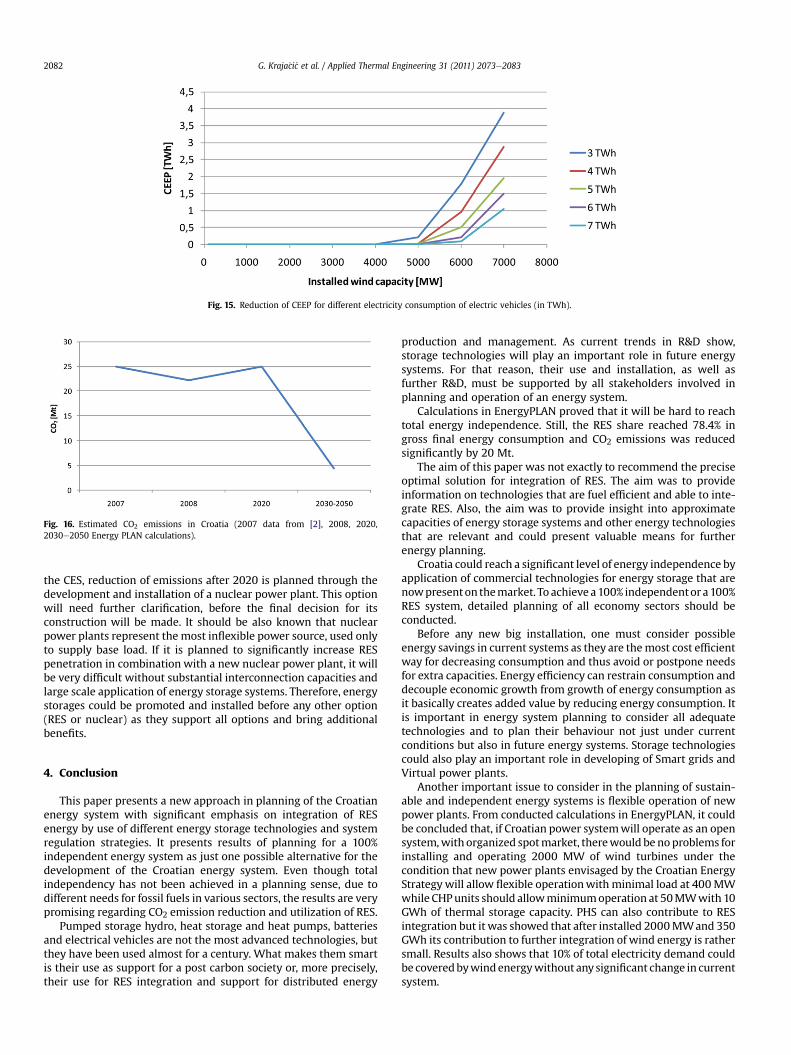
Use of RES in combination with energy storage may reduce CO2emissions in Croatia by 82% or 20 Mt of CO2 (Fig. 16). According to
izes of batteries in electric vehicles.
Fig. 15. Reduction of CEEP for different electricity consumption of electric vehicles (in TWh).
Fig. 16. Estimated CO2 emissions in Croatia (2007 data from [2], 2008, 2020,2030e2050 Energy PLAN calculations).
G. Kraja�ci�c et al. / Applied Thermal Engineering 31 (2011) 2073e20832082
the CES, reduction of emissions after 2020 is planned through thedevelopment and installation of a nuclear power plant. This optionwill need further clarification, before the final decision for itsconstruction will be made. It should be also known that nuclearpower plants represent the most inflexible power source, used onlyto supply base load. If it is planned to significantly increase RESpenetration in combination with a new nuclear power plant, it willbe very difficult without substantial interconnection capacities andlarge scale application of energy storage systems. Therefore, energystorages could be promoted and installed before any other option(RES or nuclear) as they support all options and bring additionalbenefits.
4. Conclusion
This paper presents a new approach in planning of the Croatianenergy system with significant emphasis on integration of RESenergy by use of different energy storage technologies and systemregulation strategies. It presents results of planning for a 100%independent energy system as just one possible alternative for thedevelopment of the Croatian energy system. Even though totalindependency has not been achieved in a planning sense, due todifferent needs for fossil fuels in various sectors, the results are verypromising regarding CO2 emission reduction and utilization of RES.
Pumped storage hydro, heat storage and heat pumps, batteriesand electrical vehicles are not the most advanced technologies, butthey have been used almost for a century. What makes them smartis their use as support for a post carbon society or, more precisely,their use for RES integration and support for distributed energy
production and management. As current trends in R&D show,storage technologies will play an important role in future energysystems. For that reason, their use and installation, as well asfurther R&D, must be supported by all stakeholders involved inplanning and operation of an energy system.
Calculations in EnergyPLAN proved that it will be hard to reachtotal energy independence. Still, the RES share reached 78.4% ingross final energy consumption and CO2 emissions was reducedsignificantly by 20 Mt.
The aim of this paper was not exactly to recommend the preciseoptimal solution for integration of RES. The aim was to provideinformation on technologies that are fuel efficient and able to inte-grate RES. Also, the aim was to provide insight into approximatecapacities of energy storage systems and other energy technologiesthat are relevant and could present valuable means for furtherenergy planning.
Croatia could reach a significant level of energy independence byapplication of commercial technologies for energy storage that arenowpresenton themarket. To achieve a100% independentor a100%RES system, detailed planning of all economy sectors should beconducted.
Before any new big installation, one must consider possibleenergy savings in current systems as they are themost cost efficientway for decreasing consumption and thus avoid or postpone needsfor extra capacities. Energy efficiency can restrain consumption anddecouple economic growth from growth of energy consumption asit basically creates added value by reducing energy consumption. Itis important in energy system planning to consider all adequatetechnologies and to plan their behaviour not just under currentconditions but also in future energy systems. Storage technologiescould also play an important role in developing of Smart grids andVirtual power plants.
Another important issue to consider in the planning of sustain-able and independent energy systems is flexible operation of newpower plants. From conducted calculations in EnergyPLAN, it couldbe concluded that, if Croatian power systemwill operate as an opensystem,with organized spotmarket, therewould be noproblems forinstalling and operating 2000 MW of wind turbines under thecondition that new power plants envisaged by the Croatian EnergyStrategy will allow flexible operationwith minimal load at 400MWwhile CHPunits should allowminimumoperation at 50MWwith 10GWh of thermal storage capacity. PHS can also contribute to RESintegration but it was showed that after installed 2000MWand 350GWh its contribution to further integration of wind energy is rathersmall. Results also shows that 10% of total electricity demand couldbe coveredbywindenergywithout any significant change in currentsystem.
G. Kraja�ci�c et al. / Applied Thermal Engineering 31 (2011) 2073e2083 2083
Acknowledgements
Authors would like to thank the National Foundation forScience, Higher Education and Technological Development of theRepublic of Croatia for supporting the project “Role of the SmartEnergy Storage in 100% Independent Energy Systems” and theMinistry of Science, Education and Sport of the Republic of Croatiafor supporting the project “Smart Energy Storage for SustainableDevelopment of Energy Systems” that resulted in this work.
References
[1] MINGORP, Energy in Croatia - Annual Energy Report - 2008. Annual Report.Ministry of Economy Labour and Entrepreneurship, Zagreb, Croatia, 2009.
[2] European Commission, EU Energy and Transport in Figures. Statistical Pock-etbook 2010. EU, Luxembourg, 2010, ISBN 978-92-79-13815-7.
[3] M.G. Carvalho, M. Bonifacio, P. Dechamps, Building a low carbon society,Energy (2010). doi:10.1016/j.energy.2010.09.030.
[4] European Commission, EUR 23172-Towards a “Post-Carbon Society” - Euro-pean Research on Economic Incentives and Social Behaviour. ConferenceProceedings. EU, Luxembourg, 2007, ISBN 978-92-79-07622-0.
[5] M.G. Carvalho, M. Bonifacio, P. Dechamps, Building a low carbon society, in:Invited Lecture in 5th Dubrovnik Conference on Sustainable Development ofEnergy, Water and Environment Systems, Dubrovnik, Croatia (28 September2009), ISBN 978-953-6313-98-3.
[6] A. Zervos, C. Lins, J. Muth, E. Smith, RE-thinking 2050: a 100% RenewableEnergy Vision for the European Union. EREC-Report, EREC. EuropeanRenewable Energy Council, Brussels, Belgium, 2010.
[7] H. Lund, B. Mathiesen, Energy system analysis of 100% renewable energysystemseThe case of Denmark in years 2030 and 2050, Energy 34 (5) (2009)524e531.
[8] H. Lund, Renewable energy strategies for sustainable development, Energy 32(2007) 912e919.
[9] INFORSE: International Network for Sustainable Energy www.inforse.org/europe/Vision2050.htm (accessed 25.11.10).
[10] G. Kraja�ci�c, N. Dui�c, M.G. Carvalho, How to achieve a 100% RES electricitysupply for Portugal? Applied Energy 88 (2011) 508e517.
[11] N. Dui�c, G. Kraja�ci�c, M.G. Carvalho, RenewIslands methodology for sustainableenergy and resource planning for islands, Renewable and Sustainable EnergyReviews 12 (4) (2008) 1032e1062.
[12] G. Caralis, K. Rados, A. Zervos, On the market of wind with hydro-pumpedstorage systems in autonomous Greek islands, Renewable and SustainableEnergy Reviews 14 (2010) 2221e2226.
[13] M. Kapsali, J.K. Kaldellis, Combining hydro and variable wind power genera-tion by means of pumped-storage under economically viable terms, AppliedEnergy 87 (2010) 3475e3485.
[14] M. Perrin, Y.M. Saint-Drenan, F. Mattera, P. Malbranche, Leadeacid batteries instationary applications: competitors and new markets for large penetration ofrenewable energies, Journal of Power Sources 144 (2005) 402e410.
[15] K.C. Divya, J. Østergaard, Battery energy storage technology for power sys-temsdAn overview, Electric Power Systems Research 79 (2009) 511e520.
[16] M.A. Kashem, G. Ledwich, Energy requirement for distributed energyresources with battery energy storage for voltage support in three-phasedistribution lines, Electric Power Systems Research 77 (2007) 10e23.
[17] H. Lund, G. Salgi, The role of compressed air energy storage (CAES) in futuresustainable energy systems, Energy Conversion and Management 50 (5)(2009) 1172e1179.
[18] G. Kraja�ci�c, R. Martins, A. Busuttil, N. Dui�c, M.G. Carvalho, hydrogen as anenergy vector in the islands’ energy supply, International Journal of HydrogenEnergy 33 (4) (2008) 1091e1103.
[19] Y. Li, H. Chen, X. Zhang, C. Tan, Y. Ding, Renewable energy carriers: hydrogenor liquid air/nitrogen? Applied Thermal Engineering 30 (2010) 1985e1990.
[20] H. Lund, Large-scale integration of wind power into different energy systems,Energy 30 (13) (2005) 2402e2412.
[21] G. Pagliarini, S. Rainieri, Modelling of a thermal energy storage system coupledwith combined heat and power generation for the heating requirements ofa University Campus, Applied Thermal Engineering 30 (2010) 1255e1261.
[22] T. Desrues, J. Ruer, P. Marty, J.F. Fourmigué, A thermal energy storage processfor large scale electric applications, Applied Thermal Engineering 30 (2010)425e432.
[23] B. Zalba, J. Marın, L. Cabeza, H. Mehling, review on thermal energy storagewith phase change: materials, heat transfer analysis and applications, AppliedThermal Engineering 23 (2003) 251e283.
[24] Y. Yu, Z. Ma, X. Li, a new integrated system with cooling storage in soil andground-coupled heat pump, Applied Thermal Engineering 28 (2008)1450e1462.
[25] M. Blarke, H. Lund, The effectiveness of storage and relocation options inrenewable energy systems, Renewable Energy 33 (7) (2008) 1499e1507.
[26] G. Kraja�ci�c, N. Dui�c, A. Tsikalakis, M. Zoulias, G. Caralis, E. Panteri,M.G. Carvalho, Feed-in tariffs for promotion of energy storage technologies,Energy Policy (2011). doi:10.1016/j.enpol.2010.12.013.
[27] G. Kraja�ci�c, N. Dui�c, M. Carvalho, H2RES, Energy planning tool for islandenergy systems e The case of the Island of Mljet, International Journal ofHydrogen Energy 34 (16) (2009) 7015e7026.
[28] Aalborg University. EnergyPLAN: Advanced Energy System Analysis ComputerModel. <energy.plan.aau.dk> (accessed 25.11.10).
[29] N. Karad�za, L. Horváth, Z. Mati�c, Progress of wind resource assessmentprogram in Croatia 31 March - 3, in: European Wind Energy Conference &Exhibition, Brussels Expo, Belgium (April 2008) On-line proceedings.
[30] H. Lund,N. Duic, G. Krajacic,M.G. Carvalho, Twoenergy systemanalysismodels:a comparison of methodologies and results, Energy 32 (6) (2007) 948e954.
[31] H. Lund, Large-scale integration of optimal combinations of PV, wind andwavepower into the electricity supply, Renewable Energy 31 (4) (2006) 503e515.
[32] H. Lund, E. Munster, Management of surplus electricity-production fromafluctuating renewable-energy source, Applied Energy 76 (1e3) (2003) 65e74.
[33] H. Lund, W. Kempton, Integration of renewable energy into the transport andelectricity sectors through V2G, Energy Policy 36 (9) (2008) 3578e3587.
[34] B. Mathiesen, H. Lund, Comparative analyses of seven technologies to facili-tate the integration of fluctuating renewable energy sources, RenewablePower Generation IET 3 (2) (2009) 190e204.
[35] ENTSO-E: <www.entsoe.eu> (accessed 25.11.10).[36] HEP: <www.hep.hr/proizvodnja> (accessed 20.11.10).[37] D. Gere�s, Water resources and irrigation systems in coastal and karstic regions
of Croatia. in: N. O�zani�c, Benac, A. DeLuka Tiblja�s, I. Vrkljan (Eds.), Manual forthe Hydro-irrigation: Aspects of Water Management in Development of Irri-gation in the Coastal and Inland Croatian Karst. Faculty of Civil Engineering,University of Rijeka, Rijeka, Croatia, 2007, pp. 23e68 (in Croatian).
[38] International Energy Agency (IEA), Energy in the Western Balkans - The Pathto Reform and Reconstruction. International Energy Agency (IEA), Paris,France, 2008.
[39] R. Vailati, Electricity transmission in the energy community of South EastEurope, Utilities Policy 17 (2009) 34e42.
[40] H. Lund, EnergyPLAN - Advanced energy systems analysis Computer model,Users Manual Documentation Version 8.0. Aalborg University, Aalborg,Denmark, 2010.
[41] A. Ani�cVu�cini�c, A. Hublin, Nikola Ru�zinski, Greenhouse gases reduction throughwaste management in Croatia, Thermal Science 14 (3) (2010) 681e691.
[42] Ministry of Economy, Labour and Entrepreneurship, Republic of Croatia &United Nations Development Program, Green Paper-Update/Upgrade of theEnergy Strategy and of the Implementation Programme of the Republic ofCroatia. Ministry of Economy, Labour and Entrepreneurship and UnitedNations Development Programme, Zagreb, Croatia, 2008.
[43] M. Kirac, G. Kraja�ci�c, N. Dui�c, Planning energy sector development in Croatianagricultural sector following guidelines of the European Energy Policy "20-20-20". in: B. Jelavi�c (Ed.), 18th Forum: Energy Day in Croatia, Zagreb, Croatia(2009) CD proceedings.
[44] B. �Cosi�c, Z. Stani�c, N. Dui�c, Geographic distribution of economic potential ofagricultural and forest biomass residual for energy use: case study Croatia,Energy (2010). doi:10.1016/j.energy.2010.10.009.
[46] G. Grani�c, H. Bo�zi�c, D. Pe�sut, How to Address the challenges of the climatePreservation. in: B. Jelavi�c (Ed.), 18th Forum: Energy Day in Croatia, Zagreb,Croatia (2009) CD proceedings.
[47] JRC - European Commission, 2009 Technology Map of the European StrategicEnergy Technology Plan (SET-Plan). Plan. Joint Research Centre - EuropeanCommission, Luxembourg, EU, 2009, ISBN 978-92-79-14587-2.
[48] H.L. Lam, P.S. Varbanov, J.J. Kleme�s, Regional renewable energy and resourceplanning, Applied Energy 88 (2) (2011) 545e550.