Optimization of mechanical draft counter flow wet-cooling towers using a rigorous model Eusiel Rubio-Castro a , Medardo Serna-González a, * , José María Ponce-Ortega a , Miguel Angel Morales-Cabrera b a Chemical Engineering Department, Universidad Michoacana de San Nicolás de Hidalgo, Ciudad Universitaria, Edificio V1, Morelia, Michoacán 58060, Mexico b Chemical Engineering Department, Universidad Veracruzana, Poza Rica, Veracruz, Mexico article info Article history: Received 26 April 2011 Accepted 17 July 2011 Available online 22 July 2011 Keywords: Counter flow cooling towers Poppe method Merkel method Rigorous optimization abstract In this paper, an optimal design algorithm for mechanical draft counter flow wet-cooling towers based on the rigorous Poppe model and mixed-integer nonlinear programming (MINLP) is presented. Unlike the widely used Merkel method, the Poppe model takes into consideration the effects of the water loss by evaporation and the nonunity of the Lewis factor. As a result, the Poppe model is able to predict the performance of wet-cooling towers very accurately compared to the Merkel method. The optimization problem is formulated as an MINLP model by considering all the mass and energy balances, equations for physical properties, and empirical correlations for the loss and overall mass transfer coefficients in the packing region of the tower, in addition to feasibility constraints. The objective function to be minimized is the total annual cost, which includes capital and operating costs. The mathematical programming problem is solved with the GAMS software. Six case studies are used to show the application of the proposed algorithm. The case studies demonstrate that there can be large differences between the optimal designs based on the Poppe method and the Merkel method. Ó 2011 Elsevier Ltd. All rights reserved. 1. Introduction Along to the industrial history, the process engineers have looked for strategies and methodologies to minimize the process costs and to increase the profits. In this area, the mass [1] and thermal water integration [2,3] have represented an important role. Regarding to the thermal water integration, several strategies have been reported around the open re-circulating cooling water systems, because they are widely used to dissipate the low-grade heat of chemical and petrochemical process industries, electric- power generating stations, refrigeration and air conditioning plants. In all these systems, water is used to cool down the hot process streams, and then this water is cooled by evaporation and direct contact with air in a wet-cooling tower and recycled to the cooling network. Therefore, the cooling towers are very important industrial components and there are many references that present the fundamentals to understand these units [4e6]. The first practical theory of counter flow cooling towers was developed by Merkel [7]. In this theory, the water loss due to evaporation and the water-film heat-transfer resistance are neglected. In addition, a Lewis factor for moist air of unity is assumed. These assumptions allow the differential equations of the rigorous model for simultaneous heat and mass transfer processes occurring in cooling towers to be reduced to a single separable differential equation in terms of air enthalpy difference as the driving force. This method gives only the exit temperature of the water stream and the exit enthalpy of the air stream when it is provided with the inlet air and water conditions. In order to obtain the temperature and humidity of the outlet air, Merkel assumed that the air leaving the cooling tower is saturated with water vapor [6]. It is possible to extend Merkel’s enthalpy theory to include a finite liquid-side film resistance to heat transfer [8e12]. For typical operating conditions, however, the local bulk temperature of the water is seldom more than 0.3 K above the temperature of the air at the airewater interface [4]. Therefore, for the purpose of cooling-tower analysis it is safe to neglect the water-film resistance [4,5]. Over the years there have been a number of contributions on the literature for cooling towers that are based upon this assump- tion. Jaber and Webb [13] developed an effectiveness-number of transfer units (e-NTU) approach by utilizing the assumption of a linearized air saturation enthalpy. The effect of nonlinearity of the * Corresponding author. Tel.: þ52 443 3273584. E-mail address: [email protected](M. Serna-González). Contents lists available at ScienceDirect Applied Thermal Engineering journal homepage: www.elsevier.com/locate/apthermeng 1359-4311/$ e see front matter Ó 2011 Elsevier Ltd. All rights reserved. doi:10.1016/j.applthermaleng.2011.07.029 Applied Thermal Engineering 31 (2011) 3615e3628
Optimization of mechanical draft counter flow wet-cooling towers usinga rigorous model
Eusiel Rubio-Castro a, Medardo Serna-González a,*, José María Ponce-Ortega a,Miguel Angel Morales-Cabrera b
aChemical Engineering Department, Universidad Michoacana de San Nicolás de Hidalgo, Ciudad Universitaria, Edificio V1, Morelia, Michoacán 58060, MexicobChemical Engineering Department, Universidad Veracruzana, Poza Rica, Veracruz, Mexico
a r t i c l e i n f o
Article history:Received 26 April 2011Accepted 17 July 2011Available online 22 July 2011
1359-4311/$ e see front matter � 2011 Elsevier Ltd.doi:10.1016/j.applthermaleng.2011.07.029
a b s t r a c t
In this paper, an optimal design algorithm for mechanical draft counter flow wet-cooling towers basedon the rigorous Poppe model and mixed-integer nonlinear programming (MINLP) is presented. Unlikethe widely used Merkel method, the Poppe model takes into consideration the effects of the water lossby evaporation and the nonunity of the Lewis factor. As a result, the Poppe model is able to predict theperformance of wet-cooling towers very accurately compared to the Merkel method. The optimizationproblem is formulated as an MINLP model by considering all the mass and energy balances, equations forphysical properties, and empirical correlations for the loss and overall mass transfer coefficients in thepacking region of the tower, in addition to feasibility constraints. The objective function to be minimizedis the total annual cost, which includes capital and operating costs. The mathematical programmingproblem is solved with the GAMS software. Six case studies are used to show the application of theproposed algorithm. The case studies demonstrate that there can be large differences between theoptimal designs based on the Poppe method and the Merkel method.
� 2011 Elsevier Ltd. All rights reserved.
1. Introduction
Along to the industrial history, the process engineers havelooked for strategies and methodologies to minimize the processcosts and to increase the profits. In this area, the mass [1] andthermal water integration [2,3] have represented an important role.Regarding to the thermal water integration, several strategies havebeen reported around the open re-circulating cooling watersystems, because they are widely used to dissipate the low-gradeheat of chemical and petrochemical process industries, electric-power generating stations, refrigeration and air conditioningplants. In all these systems, water is used to cool down the hotprocess streams, and then this water is cooled by evaporation anddirect contact with air in a wet-cooling tower and recycled to thecooling network. Therefore, the cooling towers are very importantindustrial components and there are many references that presentthe fundamentals to understand these units [4e6].
The first practical theory of counter flow cooling towers wasdeveloped by Merkel [7]. In this theory, the water loss due to
zález).
All rights reserved.
evaporation and the water-film heat-transfer resistance areneglected. In addition, a Lewis factor for moist air of unity isassumed. These assumptions allow the differential equations of therigorous model for simultaneous heat and mass transfer processesoccurring in cooling towers to be reduced to a single separabledifferential equation in terms of air enthalpy difference as thedriving force. This method gives only the exit temperature of thewater stream and the exit enthalpy of the air stream when it isprovided with the inlet air and water conditions. In order to obtainthe temperature and humidity of the outlet air, Merkel assumedthat the air leaving the cooling tower is saturated with watervapor [6].
It is possible to extend Merkel’s enthalpy theory to includea finite liquid-side film resistance to heat transfer [8e12]. Fortypical operating conditions, however, the local bulk temperatureof the water is seldom more than 0.3 K above the temperature ofthe air at the airewater interface [4]. Therefore, for the purpose ofcooling-tower analysis it is safe to neglect the water-film resistance[4,5]. Over the years there have been a number of contributions onthe literature for cooling towers that are based upon this assump-tion. Jaber and Webb [13] developed an effectiveness-number oftransfer units (e-NTU) approach by utilizing the assumption ofa linearized air saturation enthalpy. The effect of nonlinearity of the
Rubio-Castro et al. / Applied Thermal Engineering 31 (2011) 3615e36283616
equilibrium enthalpy was considered by using an enthalpycorrection factor in the effectiveness definition only for the caseswith smaller air flow heat capacity rate. However, like Merkel, theyneglectedwater evaporation loss and assumed that the Lewis factorwas equal to unity. Nahavandi et al. [14], Osterle [15] and Braunet al. [16] proposed models that include the effect of the mass ofwater loss by evaporation on energy balance. Consequently, unlikethe Merkel method, these models provide the state of the airexiting the tower, not just its enthalpy, along with a more accuratevalue of the requiredMerkel number (which is similar to number oftransfer units e NTU). However, their results are only applicable forLewis factors equal to unity.
Sutherland [17] proposed a model that includes the effect ofwater loss by evaporation and sets the Lewis factor equal to 0.9.Comparing his results with those obtained from the Merkelmethod, he found that mechanical draught cooling towers can beundersized between 5% and 15% through the use of the Merkelmethod. Kloppers and Kröger [18] stated that Lewis factor maydeviate significantly from unity and can be in the range from 0.5 to1.3 for wet-cooling towers. Poppe and Rögener [19] developeda more complete and accurate model of a cooling tower, which iscommonly known as the Poppe method [18]. This methodconsiders the effects of Lewis factor and water evaporation on theair process states along the vertical length of the tower. The Lewisfactor for air/water mixtures is obtained from the equation given byBosnjakovic [20]. The Poppe method also accounts for the possi-bility of supersaturation of the moist air during the heat and masstransfer processes. In this method, the Merkel number for thecooling tower is obtained by solving numerically three simulta-neous differential equations governing heat and mass transfer andair flow in the tower fill. Kloppers and Kröger [18] have used thePoppe method to investigate the effect of the Lewis factor onperformance prediction of natural draft and mechanical draft wet-cooling towers. They found that as the Lewis factor increases, theheat rejection rate from the tower increases, with a correspondingincrease in air outlet temperature and a decrease in thewater outlettemperature. Also, they found that the influence of the Lewis factordiminishes when the inlet ambient temperature is relatively high.More recently, Ren [21] presented an analytical solution ofa detailed model for counter flow wet-cooling towers, which takesinto consideration the effects of Lewis factor and water evaporationas well as the heat-transfer resistance in the airewater interface.However, he used a linear function of the surface temperature forcalculating the humidity ratio of air in equilibrium with the watersurface. In a later work, Ren [22] used the perturbation technique todevelop another analytical solution for evaluating the thermalperformance of wet-cooling towers, but taking into considerationthe effect of nonlinearities of humidity ratio and enthalpy of air inequilibrium with water.
The Merkel [7], e-NTU [13] and the rigorous Poppe [18] methodsare the most popular approaches to address design and ratingcalculations of cooling towers. Kloppers and Kröger [6,23] havediscussed the differences between cooling tower results obtainedwith the rigorous Poppe method and Merkel and e-NTU approxi-mate methods, which are more frequently used because of itssimplicity. This comparative study shows that all methods predictpractically identical water outlet temperatures for mechanical andnatural draft towers; however, the computation of the water outlettemperature is improved if the water loss by evaporation isconsidered. Kloppers and Kröger [6] also made a comparisonbetween a large number of measured air outlet temperatures in thefill test facility at the University of Stellenbosch and the predictionsfrom Merkel, e-NTU, and Poppe approaches. The comparisonresults show that the measured outlet air temperatures and thevalues obtained by the Poppe method are in excellent agreement.
However, the Merkel and e-NTU methods do not predict the airoutlet temperature very accurately compared to the Poppemethod.On the other hand, Bourillot [24,25] found that the values ofevaporated water flow rate calculated from the Poppe methodagree well with available full scale cooling-tower test results. ThePoppe method, therefore, is an experimentally proven detailedmodel for reliable representation of wet-cooling towers that shouldbe employed for design applications where more accurate resultsare needed.
The optimal design of cooling towers is an industrially relevantproblem, in which a number of continuous and discrete variablesmust be considered simultaneously such as the wet-bulb temper-ature of the ambient air, water-to-air mass ratio, water outlettemperature, water inlet temperature, water loss by evaporation,fresh water consumption, type of draft, type of packing, tower fillheight, and cross-sectional area of the tower [26]. Also, the optimaldesign of cooling towers is subjected to a number of feasibilityconstraints such as minimum and maximum values of water-to-airmass ratios, water and air mass velocities, and so on. Past studies[26e29] to obtain the optimal economical design of counter flowwet-cooling towers are based on the Merkel or e-NTU approximatemethods. Consequently, they may lead to sub-optimal designs andpossible unreliable model predictions due to the errors introducedby neglecting the water loss by evaporation and assuming a Lewisfactor of unity.
The objective of this paper is to use the Poppemethod [18] for theeconomical optimization of mechanical draft counter flow wet-cooling towers. The optimization problem is formulated as anMINLP problem, which can be represented and optimized withGAMS/DICOPT [30]. The optimization is to be performed over thedesign and operating variables includingwater-to-airmass ratio, airmass flow rate, water inlet and outlet temperatures, towertemperature approach, type of packing, height and area of the towerpacking, total pressure drop of air flow, power consumption of thefan, fresh water consumption, outlet air conditions and Merkelnumber. The mass transfer and pressure drop characteristics of thetypes of packing considered are modeled with the empirical corre-lations obtained from experimentalmeasurements by Kloppers andKröger [31,32]. The objective function is defined as theminimizationof the total annual cost that includes the water consumption cost,power fan cost and capital cost of the cooling tower.
Six examples of application of the developed MINLP model arereported. Comparison of the so obtained results with thoseobtained by an approximate model based on the Merkel method,which has been fully presented by Serna-González et al. [26], showsthat large differences may arise between the optimal designs of thePoppe and Merkel methods. These results, as well as a descriptionof the model equations and numerical methods that form the basisfor the proposed MINLP formulation, are given below.
2. Problem statement
The problem addressed in this paper can be stated as follows.Given are the heat load to be removed in the cooling tower, the dry-and wet-bulb temperatures of the inlet air, the lower and upperlimits for the water outlet temperature and for the water inlettemperature, the minimum temperature approach, the minimumdifference between the dry-bulb and wet-bulb temperatures ateach integration interval to avoid the saturation of passing airthrough the fill, the fan efficiency as well as the economical infor-mation such as unit cost of electricity, unit cost of fresh water, fixedcooling-tower cost, incremental cooling-tower cost based on the airmass flow rate and yearly operating time. The problem thenconsists in determining the design details (make-up waterconsumption, air mass flow rate, state of the outlet air, type of
packing, packing height and tower cross-sectional area, cooling-tower approach and range, total pressure drop of the air stream,power consumption of the tower fan, and Merkel number) of thecounter flow cooling tower that satisfy the cooling requirementswith a minimum total annual cost.
3. Model formulation
The major equations for the heat and mass transfer in the fillsection and the design equations for the cooling tower are describedin this section. The subscripts used in the model formulation aredefined first: in (inlet), out (outlet), j (constants to calculate thetransfer coefficient), k (constants to calculate the loss coefficient), r(make-up), ev (evaporated water), d (drift), b (blowdown), m(average), w (water), a (dry-air), wb (wet-bulb), n (interval of fill),fi (fill), fr (cross-sectional),misc (miscellaneous), t (total), vp (velocitypressure), f (fan),ma (airevapormixture), e (electricity), s (saturated)and v (water vapor). In addition, the superscript i is used to denotethe type of fill and the scalar NTI represents the top interval of thepacking height. It should be noted that the parameters and variablesof the model are represented by italic letters. The nomenclaturesectionpresents the definition of the variables used in themodel andthe model formulation is described as follows.
3.1. Heat and mass transfer in the fill section for unsaturated air
According to the mathematical development of the Poppemethod given by Kloppers and Kröger [23], which is based on thecontrol volumes in the fill of a counter flow wet-cooling towershown in Figs. 1 and 2, the detailed steady-state mass and energybalance equations for unsaturated air can be written as
dwdTw
¼cpw
mw
ma
�ws;w �w
�ima;s;w � ima þ ðLef � 1Þima;s;w � ima �
�ws;w �w
�iv� �ws;w �w
�cpwTw
(1)
dima
dTw¼ mwcpw
ma
�1þ cpwTw
�ws;w �w
�ima;s;w � ima þ ðLef � 1Þima;s;w � ima �
�ws;w �w
�iv� �ws;w �w
�cpwTw
�(2)
and the transfer characteristic of the packing is given by
dMedTw
¼ cpwima;s;w � ima þ ðLef � 1Þima;s;w � ima �
�ws;w �w
�iv� �ws;w �w
�cpwTw
(3)
In above differential equations, Tw is the local bulk watertemperature, mw is the liquid water mass flow rate, w is themass-fraction humidity of the air stream, ima,s,w is the enthalpyof saturated air evaluated at the local bulk water temperature,ima is the enthalpy of the airewater vapor mixture per unit massof dry-air, iv is the enthalpy of the water vapor, ws,w is thesaturation value of the mass-fraction humidity of air evaluated tothe local bulk water temperature, cpw is the specific heat atconstant pressure of the liquid water, Me is the transfer coeffi-cient or Merkel number according to the Poppe method, Lef isthe Lewis factor, and ma is the mass flow rate of dry-air throughthe tower.
The Lewis factor is a dimensionless group that is defined asLef¼ h/hdcpa and it is an indication of the relative rates of heat andmass transfer in an evaporative process. According to Bosnjakovic[20], the Lewis factor for unsaturated air can be expressed as:
Lef ¼ 0:865�0:665�ws;wþ0:622wþ0:622
�1���
ln�ws;wþ0:622wþ0:622
��(4)
Other properties for air, water and airewater mixtures used areobtained from correlations given in Appendix A.
The ratio of the mass flow ratesmw/ma in Equation (1) and Equation(2) changes as the air moves toward the top of the fill. A massbalance for the control volume of a portion of the fill illustrated inFig. 3 yields the ratio of the mass flow rates at any position in thetower:
mw
ma¼ mw;in
ma
1� ma
mw;inðwout �wÞ
!(5)
where mw,in is the water mass flow rate entering to the coolingtower and wout is the mass-fraction humidity of the air leaving thecooling tower.
dz
mw+dmw
mw ma(1+w)
dmw
h(Tw-Ta)dA
ma(1+w+dw)ima+dima
ima
Fig. 2. Air-side control volume of the fill.
Rubio-Castro et al. / Applied Thermal Engineering 31 (2011) 3615e36283618
The Poppe model consists of the above set of coupled ordinarydifferential and algebraic equations, which can be solved simulta-neously to provide the air humidity, the air enthalpy, the watertemperature, the water mass flow rate and the Merkel numberprofiles in the cooling tower. Also, the state of the outlet air fromthe cooling tower can be fully determined by this model. TheMerkel model can be derived from the Poppe model by assuminga Lewis factor of unity (Lef¼ 1) and negligible evaporation of water,i.e., dmw¼ 0.
A model with ordinary differential equations and algebraicequations is quite complex for MINLP optimization purposes. Dueto this fact, the set of ordinary differential equations comprising thePoppe model is converted into a set of nonlinear algebraic equa-tions using a fourth-order RungeeKutta algorithm. The final alge-braic model is given in Appendix B.
264 Y1
ðsplash fillÞcj ¼ c1j ; j ¼ 1;.;5
375n
264 Y2
ðtrickle fillÞcj ¼ c2j ; j ¼ 1;.;5
375n
264 Y3
ðfilm fillÞcj ¼ c3j ; j ¼ 1;.;5
375
3.2. Design equations
In this section we present additional equations to complete themathematical model for the optimization of counter flow wet-cooling towers such as the heat load definition, the overall mass
Lfi
mw,in; Tw,in
mw,out; Tw,out
mw
ma;ima,in;win
ma;ima,out;wout
ma,ima,w
Fig. 3. Control volume of the fill.
balance for the water, empirical correlations for the loss and overallmass transfer coefficients in the packing region, and so on.
3.2.1. Heat loadThe heat transferred from thewater to the air stream (Q) is given
byEquation (6),which doesnot neglect thewater loss byevaporation
Q ¼ cpw;inmw;inTw;in � cpw;outmw;outTw;out (6)
where Tw,in and Tw,out are the inlet temperature and the outlettemperature of the water, respectively, cpw,in and cpw,out are thecorresponding liquid specific heats at constant pressure, respec-tively, and mw,out is the water outlet mass flow rate. In the aboveequation cpw is in kJ/kg K and Tw is in K.
An overall mass balance for the water gives
mw;out ¼ mw;in �maðwout �winÞ �mw;d (7)
where mw,d is the loss of water due to drift.
3.2.2. Transfer and loss coefficientsThe overall transfer coefficient of a counter flow wet-cooling
tower can be obtained using the following empirical correlation[31] (whose correlation coefficient (r2) is given in Table 1 accordingto the fill type).
Men¼NTI ¼ c1
mw;m
Afr
!c2 ma
Afr
!c3�Lfi�1þc4�
Tw;in�c5 (8)
where Afr is the packing area, Lfi is the height packing, c1, c2, c3, c4and c5 are constants that depend on the type of fill used, andmw,m isthe average value of the water mass flow rate. Thus,
mw;m ¼ mw;in þmw;out
2(9)
Next disjunction and its reformulation through the convex hulltechnique [33] is used for the optimal selection of fill type:
Here Y1, Y2 and Y3 are Boolean variables used to select the splash fill,trickle fill or film fill, respectively. Therefore, when a Booleanvariable is true its corresponding fill type is selected, but if it is falseits corresponding fill type is not selected. To reformulate the abovedisjunction into algebraic expressions, the convex hull reformula-tion is used [33], which includes a binary constraint to state thatonly one fill type (splash or trickle or film) can be selected,
where y1, y2 and y3 are the corresponding binary variables of theBoolean variables. Then, if a Boolean variable is true its corre-sponding binary variable is equal to one; and if the Boolean variableis false, then its binary variable is zero. In addition, the value of thecontinuous variables (cj) is expressed in terms of the disaggregatedvariables (cj1, cj2, cj3),
cj ¼ c1j þ c2j þ c3j ; j ¼ 1;.;5 (11)
and the next equation allows to activate the values for the constantsc1, c2, c3, c4 and c5 depending on the fill type,
cij ¼ aijyi; i ¼ 1;.;3; j ¼ 1;.;5 (12)
Table 1 shows the values for the constants aji for three types ofpacking [31].
The loss coefficient per meter depth of fill (Kfi) is used to esti-mate the pressure drop through the packing region. The empiricalcorrelation for Kfi for different types of packing is expressedas [32],
Kfi ¼"d1
mw;m
Afr
!d2 ma
Afr
!d3
þd4
mw;m
Afr
!d5 ma
Afr
!d6#Lfi (13)
The correlation coefficients for the above relationship for eachfill type are shown in Table 2. Following disjunction is used to selectthe value of the constants d1, d2, d3, d4, d5 and d6 depending on thefill type:
264 Y1
ðsplash fillÞdk ¼ d1k ; k ¼ 1;.;6
375n
264 Y2
ðtrickle fillÞdk ¼ d2k ; k ¼ 1;.;6
375n
264 Y3
ðfilm fillÞdk ¼ d3k ; k ¼ 1;.;6
375
Previous disjunction is reformulated with the convex hullreformulation [33] as follows:
dk ¼ d1k þ d2k þ d3k ; k ¼ 1;.;6 (14)
dik ¼ bikyi; i ¼ 1;.;3; k ¼ 1;.;6 (15)
where dk1, dk
2 and dk3 are the disaggregated variables for the
continuous variables dk. Values for the coefficients bki for three
different types of packing are shown in Table 2 [32].
3.2.3. Pressure drop of the air stream in the cooling towerAccording to Li and Priddy [34], the total pressure drop (DPt) of
the air stream in mechanical draft cooling towers is the sum of thestatic and dynamic pressure drops, DPvp. The first one includes the
pressure drop through the fill, DPfi, and the miscellaneous pressurelosses, DPmisc. The pressure drop through the fill is calculatedas [32]:
DPfi ¼ KfiLfimav2m2rmA2
fr
(16)
In this equation, the harmonic mean density of the moist airthrough the fill, rm, and the arithmetic mean airevapor mass flowrate, mavm, are calculated as follows
mavm ¼ mavin þmavout2
(17)
rm ¼ 1=ð1=rin þ 1=routÞ (18)
mavin ¼ ma þwinma (19)
mavout ¼ ma þwoutma (20)
where rin, rout, mavin and mavout are the density of the inlet andoutlet air, and the inlet and outlet arithmetic mean airevapor massflow rate, respectively.
The miscellaneous pressure drop can be directly calculatedusing the following equation [4,26]:
DPmisc ¼ 6:5mav2m2rmA2
fr
(21)
The dynamic pressure drop may be as much as 2/3 of the totalstatic pressure drop [34]. Using such an upper value, the dynamicpressure drop can be estimated as
DPvp ¼ ð2=3Þ�DPfi þ DPmisc
�(22)
Combining equations (16), (21) and (22), the total pressure dropof the air is given by
DPt ¼ 1:667�DPfi þ DPmisc
�(23)
3.2.4. Power consumptionThe power requirements for the cooling-tower fan (HP) can be
calculated by multiplying the total pressure drop times the volu-metric flow rate of the air stream, which depends on the localiza-tion of the fan. Therefore, for a forced mechanical draft wet-coolingtower, the power consumption can be calculated from [26]
HP ¼ mavinDPtrinhf
(24)
where hf is the fan efficiency.
3.2.5. Water consumptionIn cooling towers, the water is lost due to evaporation (mw,ev),
drift (mw,d), and blowdown (mw,b). Conservation of mass yields thefollowing relation for the evaporation rate of water
Rubio-Castro et al. / Applied Thermal Engineering 31 (2011) 3615e36283620
mw;ev ¼ maðwout �winÞ (25)
Table 3Cost coefficients CCTVk for each type of fill.
The mass flow rate of blowdown can be expressed as [26]
mw;b ¼ mw;r
ncycle�mw;d (26)
where ncycle is the number of cycles of concentration required toavoid salts deposition and typically takes a value between 2 and 4[34]. In an efficient design, the water loss by drift is 0.2% of the inletwater flow rate to the cooling tower [35]
mw;d ¼ 0:002mwi;n (27)
Combining Equations (25)e(27), the fresh water consumption(mw,r) is calculated as
mw;r ¼ ncyclemw;ev
ncycle � 1(28)
3.2.6. Feasibility constraintsFeasibility constraints and limits for the empirical correlations
are included in the model to ensure feasible and valid designs.In practice, the water outlet temperature should be at least
2.8 �C above site’s wet-bulb temperature [34],
Tw;out � Twb;in � 2:8 (29)
Since the governing equations are only valid for unsaturated air,a basic inequality constraint is that at no intermediate point in thepacking the wet-bulb temperature of the air should be higher thanthe dry-bulb temperature of the air. This constraint is expressed as
Ta;n � Twb;n þ DTTwb;n
Ta;n; n˛N; nsNTI (30)
where Ta,n is the dry-bulb temperature and Twb,n is the wet-bulbtemperature of the air in the interval n. DTTwb;n
Ta;nis a parameter that
represents a minimum difference (i.e., 0.001) between abovetemperatures in each interval and it is used for avoiding the satu-ration of the air in an intermediate point of the packing height ofthe cooling tower.
The temperature of the water leaving the cooling tower must belower than the coldest process temperature within the coolingwater network [26],
Tw;out � TMPO� DTMIN (31)
where TMPO is the outlet temperature of the coldest hot processstream in the cooling water network, and DTMIN is the minimumtemperature difference allowed between hot process streams andcooling water. It should be noted that TMPO must be greater thanTwb,in.
The temperature of the water entering the cooling tower mustbe lower than the highest process temperature within the coolingwater network [26],
Tw;in � TMPI� DTMIN (32)
where TMPI is the inlet temperature of the hottest hot processstream in the cooling network.
At the same time, to avoid fouling, scaling and corrosion the inlettemperature of the water should not be greater than 50 �C [36],
Tw;in � 50 �C (33)
Practical bounds on the ratio of the mass flow rates mw/ma aregiven by [5]:
0:5 � mw;m
ma� 2:5 (34)
The empirical correlations for the transfer and loss coefficientsare restricted by the following bounds on the water and air massflow rates [31,32],
2:90 � mw;m
Afr� 5:96 (35)
1:20 � ma
Afr� 4:25 (36)
3.2.7. Objective functionThe objective function of the MINLP model is to minimize the
total annual cost, TAC, which is the sum of the annualized capitalcost, CAP, and the operating cost, COP,
TAC ¼ KFCAPþ COP (37)
where KF is the factor used to annualize the capital costs.Fresh water (i.e. make-up water) consumption and power
requirements determine the operating cost, which can be writtenas follows:
COP ¼ HYcuwmw;r þ HYcueHP (38)
where HY is the yearly operating time, cuw is the unit cost of freshwater and cue is the unit cost of electricity.
The capital cost for the cooling tower is calculated through anempirical correlation that is expressed in terms of the fixed cooling-tower cost (CCTF), the tower fill volume cost (CCTV) and the towercost based on air mass flow rate (CCTMA) [27],
CAP ¼ CCTF þ CCTVAfrLfi þ CCTMAma (39)
The cost term CCTV depends on the type of packing; therefore,the next disjunction and its reformulation through the convex hulltechnique [33] is used:
24 Y1
ðsplash fillÞCCTV ¼ C1
CTV
35n
24 Y2
ðtrickle fillÞCCTV ¼ C2
CTV
35n
24 Y3
ðfilm fillÞCCTV ¼ C3
CTV
35
CCTV ¼ C1CTV þ C2
CTV þ C3CTV (40)
CiCTV ¼ eiyi; i ¼ 1;.;3 (41)
Here CCTV1 , CCTV2 and CCTV
3 are the disaggregated variables of CCTV.Common values for the constants ei are presented in Table 3.
The proposed MINLP model is given by equations (6)e(41) andthe equations presented in the Appendix A and Appendix B. Theserelationships were codified in the GAMS optimization package [30]and the problem was solved using the solver DICOPT. It should benoted that the proposed MINLP problem is non-convex; therefore,the solutions that are obtained can be regarded only as localminima for the total annual cost problem depending of the startingpoint. Thus, it is important to account with good initial guesses forthe optimization variables that can be obtained by simulation of
a given unit. Also, the proposed optimization model is based on therigorous Poppe method which provides accurate results respect toexperimental measurements [6,24,25].
4. Results and discussion
To show the application of the proposed model, six case studiestaken from Serna-González et al. [26] were considered. For allexamples, the values for the parameters HY, KF, ncycles, cuw, cue, CCTF,CCTMA, hf, DT
Twb;n
Ta;n, ifgwo and Pt, are 8150 h/year, 0.2983 year�1, 4,
In all calculations, if less than 20 intervals are used, the resultsbecome sensitive to the number of intervals. Therefore, the cooling-tower packing has been divided into 25 intervals to discretize theordinary differential equations for all the case studies. With thisnumber of intervals, the rigorous Poppe method gives the resultsshown in Table 4. Comparing these results with those obtainedfrom the Merkel method [26], which also are shown in Table 4, wesee that both methods select the film packing as the optimum typeof filling material in all cases. Also, both methods provide for allcases optimal values of the outlet temperature of the water equal tothe upper bound on Tw,out given by constraint (31). Therefore, thereis no difference in the optimal values of the cooling-tower approach(Tw,out� Twb,in) predicted by both models. It is worth noting that, ingeneral, as the cooling-tower approach is reduced, the tower sizeand cost increase exponentially [26]. This explains the fact that, inall cases, the optimum values of the tower approach are given bythe difference between the coldest process temperature of thecooling water network that the cooling tower is serving and theminimum temperature difference, i.e., Tw,out¼ TMPO�DTMIN.
All the cases show that using the Merkel method to solve theoptimization problem results in an overestimation of the temper-ature of the air stream leaving the cooling tower. Taking case 1 as anexample, it can be seen that the difference in Ta,out calculated by theMerkel method and the Poppe method is 24.38% of the Merkelvalue. The other cases present a similar behavior. The averagedifference in Ta,out for the six cases is 26.72% and the maximumdifference is 41.66% (for case 5). This significant discrepancy is inlarge part due to the difference in the way that Ta,out is calculated inthe two methods. As already mentioned above, the effect of waterloss by evaporation is neglectedwhenmodeling the performance ofcooling towers with Merkel method. As a result, in this approachonly the outlet temperature of the water stream and the exitenthalpy of the air stream can be predicted. Nevertheless, thedetermination of the density and mass-fraction humidity of theoutlet air is of prime importance when predicting the performanceof the whole mechanical draft cooling unit [26]. The Merkelmethod, therefore, requires the additional assumption that the airat the top of the fill is saturated with water vapor to enable theapproximate air outlet temperature to be calculated [6,26]. Then,this temperature is used to obtain the approximate exit density andmass-fraction humidity of the air. Knowing these properties, it ispossible to estimate the total pressure drop of the air passingthrough the tower (Equation (23)) and the water loss by evapora-tion (Equation (25)) that are required for the optimal design ofmechanical draft towers. It should be noted that the approximateoutlet temperature of the air is calculated from the exit enthalpythat is obtained from an overall energy balance, which also ignoresthe effect of the reduction of water flow rate by evaporation [6,26].In contrast to the procedure described above, when using thePoppemethod for optimal design of a cooling tower, the full state ofthe outlet air in terms of enthalpy and mass-fraction humidity canbe determined without using any of the simplifying assumptions of
Merkel [6]. Thus, the optimal value of the air outlet temperature isvery sensitive to the model used.
It is worthwhile to note here that the predicted andmeasured airoutlet temperatures for several experimental fill performance testsare compared by Kloppers and Kröger [6]. These authors showedthat the Merkel method might lead to significant discrepanciesbetween predicted and experimental air outlet temperatures,especially when the actual outlet air is unsaturated, because of theseveral assumptions in which it relies. On the other hand, the airoutlet temperatures predicted by the Poppemethod agree verywellwith the field test results. This gives us an idea of how closely thePoppe model represents the conditions prevailing in a real wet-cooling tower. Furthermore, predictions from the Poppe formula-tion result in values of water evaporation rates that are in goodagreement with full scale cooling-tower test results [24,25]. Thus,thismodel can be usedwith confidence during the optimal design ofmechanical draft counter flow wet-cooling towers.
Our finding that the Poppemethod gives lower optimal values ofthe make-up water cost compared with the Merkel calculations forall the cases in Table 4 is thus not surprising. Two interrelatedfactors explain this decrease. First, a smaller temperature of the airleaving the fill reduces the mass-fraction humidity of that stream,which also reduces the value of (wout�win) in Equation (25), that is,the evaporation rates. For example, it can be seen for case 1 thatmw,e given by the Merkel method is 1.156 kg/s versus 0.8425 kg/s asdetermined by the Poppemethod. Second, lower values of the freshwater consumption are associated with a decrease in the water lossby evaporation (Equation (28)).
Considering the inlet water mass flow rate for all the cases, theaverage optimal water loss by evaporation is 2.5% for the Poppemethod and 4.34% for the Merkel method. The optimal make-up(i.e., fresh) water for the cooling tower is usually a little bit higherthan this value for both methods because of the additional waterloss due to blowdown and drift loss. Again, as noted previously, thedifference in evaporated water mass flow rates estimated by thePoppe method and the Merkel method is due to the difference inthe way that Ta,out is calculated, which in turn affects all optimaldesign and operation variables of wet-cooling towers such as thecooling range, total pressure drop of the air, tower height and so on.
As the calculations show for all the cases, both methods areconsistent in predicting that the optimum performance occurswhen the cooling-tower range (Tw,in�Tw,out) is greater than thetower approach. However, in contrast to the Merkel method thatgives the higher hot water temperature, Tw,in¼TMPI�DTMIN, it isinteresting to see that the optimal values of the water inlettemperature predicted by the Poppe method are always lower thanthe upper bound on Tw,in. This situation yields large differences inthe optimal cooling ranges of the water calculated by the twomethods. For example, the difference between the optimal coolingranges predicted by the Merkel method and the Poppe methodamounts to about 24% of the Merkel value for case 1. From theresults in Table 4, one can obtain that the average of such differenceis 41.14%, while the maximum difference is 73.86% for case 5. Thelarge discrepancy between Merkel and Poppe cooling ranges in thecooling-tower optimization is mainly due to the large discrepancyin the air outlet temperature. For fixed heat load and water outlettemperature, this can be explained from the fact that a decrease inthe air outlet temperature obtained by the Poppe method is asso-ciated with a lower exit enthalpy of the air and, thus, gives a lowerwater inlet temperature to satisfy the overall energy balance.
As can be seen from Table 4, some of the remaining results arefairly close in comparison and others are quite different. We havefound that, in general, the Poppe method predicts greater values ofthe entering water mass flow rate and lower values of the water todry-air mass flow ratio than the Merkel method. It should be
Table 4Comparison of Poppe optimal solution with Merkel optimal solution for each case study.
remembered that the value of mw,m/ma reduces from the top to thebottom of the tower for Poppe method, whereas it is a constant forMerkel method. On the other hand, the increase in mw,in is simplydue to the fact that the quantity of water circulated is inverselyproportional to the cooling range for a given heat load (Equation(6)). Thus, in general, the reduction in the optimal cooling rangegiven by the Poppe method yields an increase in the inlet watermass flow rate. In addition, since mechanical draft cooling towersare designed for mw,m/ma ratios ranging from 0.5 to 2.5 (Equation(34)), the increase in mw,in also increases the optimal air mass flowrate given by the Poppe method. Thus, the Poppe method provideshigher fan energy consumption and, consequently, fan power costthan the Merkel method. However, the operating costs (the make-up water cost plus the fan power cost) calculated by the Poppemethod are lower than the ones obtained with the Merkel methodexcept for case 5. Thus, in general, the lower values of evaporationrates and, consequently, the decrease in the make-up water costpredicted by the Poppe method has a more important impact onthe operating costs than the increase in the air mass flow rate.
All the cases show that using the Merkel method results in theoverestimation of the fill height. It can be seen in Table 4 that theaverage difference between the optimal fill height predicted by theMerkel method and the rigorous solutions of Poppe model is0.795 m for case 3 and the largest difference is 3.25 m for case 5.The relative error, (Lfi,M� Lfi,P)/Lfi,M, varies from 69.21% to 126.32%.Therefore, the errors in height of the tower packing caused byMerkel assumptions are significant. As a consequence, the Merkelmethod also predicts considerably higher Merkel numbers, ortransfer characteristics, than the Poppe method in all cases, exceptfor case 4 where the Merkel number is slightly over-predicted(3.15%) by the Merkel method compared with the Poppe method.The absolute average difference between the Merkel numbers,predicted by the two methods, is more than 38% with the Poppemethod as a basis. Thus, in general, according to the Poppe model,the optimal cooling towers provided by the Merkel method areover-sized in terms of theMerkel number and fill height. Onemightargue, consequently, that the Merkel method could be of value inobtaining conservative optimal designs for mechanical draft wet-cooling towers.
It should be noted that the reduction in the Merkel number andpacking height, according to the Poppe method, does not neces-sarily minimize the capital costs as it is shown for the cases 1, 2, 5and 6 in Table 4. The reason for this result is the manner in whichthe capital costs are calculated. For preliminary designs, usually thecapital cost model is a function only of the height of the towerpacking. In situations like this, the cooling tower that features theminimum fill height will therefore have the minimum capital cost,even if it uses more fill area and air mass flow rate than others.However, in reality, the fill volume (which is the product of theheight and the cross-sectional area of the tower packing) and theair mass flow rate play a role in the capital cost of a wet-coolingtower. For this reason we use a more detailed and more realisticcorrelation for capital costs that considers these factors (Equation(39)). Furthermore, as it was noted above, the decrease in thecooling range has the effect of increasing the entering water massflow rate, with corresponding increases in the air mass flow rateand the fill volume for accomplishing the required cooling duty.This explains that the capital costs obtainedwith the Poppemethodfor the cases 1, 2, 5 and 6 are higher than those predicted by theMerkel method when the detailed costing method is used. It isremarkable that the capital costs of the cases 1 and 6, predicted bythe two methods, are quite similar; however, the difference in thecapital cost predicted by the Poppemethod and theMerkel methodis significant in the cases 2 (45.1%) and 5 (46.6%). The reason for thislarge difference in predicted capital costs is that the Merkel results
for the cooling ranges of the cases 2 and 5 are considerably higher(213.9% and 282.6%, respectively) than those predicted by thePoppe method. For case 1, this large discrepancy in the coolingrange can be explained by the reduction in the dry-bulb tempera-ture of the inlet air at a constant wet-bulb temperature which, inturn, involves a decrease in potentials of the air for evaporation (i.e.,Ta,in�Twb,in and ws,w,in�win). On the other hand, for case 5 this isbecause the decrease in TMPO at a constant wet-bulb temperatureof the entering air yields a reduction in the optimal tower approach,which also decreases the driving forces in the tower [26]. However,these situations are not properly handled by the Merkel methodand, consequently, have a great influence on the relative differencebetween the optimal cooling ranges (i.e., outlet air temperatures)predicted by the Merkel and the Poppe methods.
As shown in Table 4, the Merkel predicted total annual cost islarger than the Poppe method predictions for the cases 1 (5.45%), 3(16.39%), 4 (12.6%) and 6 (13.86%). On the other hand, for the cases 2and 5, the predicted total annual cost is about 12% and 28% larger,respectively, in the Poppe method than the Merkel results, whichagain is due to the considerably larger optimal cooling range pre-dicted by the Merkel method.
In the Merkel method the Lewis factor has been assumed to beunity. However, it can also be observed in Table 4 that this is onlyapproximately true. For the six cooling towers considered in thisstudy, the resulting average Lewis factors from the Poppe methodrange between 0.9112 and 0.9268. For each case, the average Lewisfactor is estimated as the average value between the inletand outlet water conditions, Lefm¼ 0.5(Lefinþ Lefout). Therefore,according to this work, an assumed Lewis factor of about 0.92 maybe more appropriate than unity. It is important to note thatSutherland [17] used a Lewis factor of 0.9 in his tower performanceanalysis; this figure is very close to the optimal average values ofthe Lewis factor predicted by the Poppemethod for the examples inthis work.
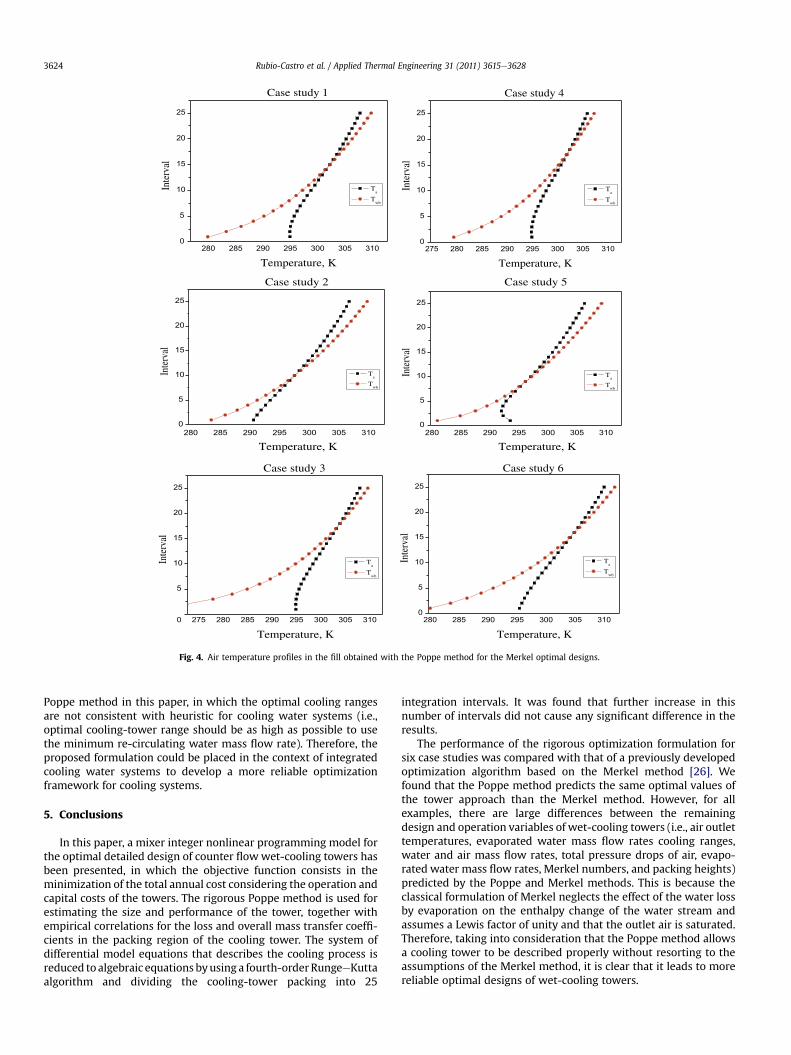
Each of the optimal designs calculated by the Merkel methodwas simulated using the rigorous Poppe method to assess itsperformance. Some results of the performance tests are shown inFig. 4, in which for each case in Table 4 is plotted the number ofintegration intervals (i.e. height of the tower packing) versus thedry- and wet-bulb temperature of the air streams along the towerheight. As can be seen from this figure for each case, the airtemperatures increase continuously as they approach the top of thetower. It is interesting to see that at an intermediate point of thetower height there is an intersection of the Ta and Twb curves, whichindicates that the air stream reaches the point of saturationaccording to the Poppe method. In addition, above this point Twb isless than Ta, which indicates that the air stream is supersaturatedaccording to the Poppe method. Therefore, the simulation resultsshow that the air at the outlet of the fill is supersaturated for all thecases in Table 4. The assumption of Merkel that the outlet air issaturated with water vapor, regarding the calculation of the outletair temperature, is thus not valid according to the Poppe method.This follows the conclusion presented above that the Merkelmethod does not predict accurately the air outlet temperatureparticularly when the ambient air gets warmer and drier [6].
Finally, it should be noted that usual preliminary design practiceof cooling water systems is largely based on the minimum use ofcoolingwater (i.e., the highest feasible cooling range), in an attemptto quickly obtain optimal configurations of these systems [37].However, Ponce-Ortega et al. [2,38,39] have showed that only usingthe minimum water flow rate does not necessarily give theminimum total annual cost, since the capital costs of coolers andcooling towers must also be considered to find the correct trade-offbetween all the costs involved in the optimization of cooling watersystems. This point is reinforced by the results obtained from the
280 285 290 295 300 305 3100
5
10
15
20
25
Case study 1
Inte
rval
Temperature, K
T
T
280 285 290 295 300 305 3100
5
10
15
20
25
Case study 2
Inte
rval
Temperature, K
T
T
275 280 285 290 295 300 305 3100
5
10
15
20
25
Case study 3
Inte
rval
Temperature, K
T
T
275 280 285 290 295 300 305 3100
5
10
15
20
25
Case study 4
Inte
rval
Temperature, K
T
T
280 285 290 295 300 305 3100
5
10
15
20
25
Case study 5
Inte
rval
Temperature, K
T
T
280 285 290 295 300 305 3100
5
10
15
20
25
Case study 6
Inte
rval
Temperature, K
T
T
Fig. 4. Air temperature profiles in the fill obtained with the Poppe method for the Merkel optimal designs.
Rubio-Castro et al. / Applied Thermal Engineering 31 (2011) 3615e36283624
Poppe method in this paper, in which the optimal cooling rangesare not consistent with heuristic for cooling water systems (i.e.,optimal cooling-tower range should be as high as possible to usethe minimum re-circulating water mass flow rate). Therefore, theproposed formulation could be placed in the context of integratedcooling water systems to develop a more reliable optimizationframework for cooling systems.
5. Conclusions
In this paper, a mixer integer nonlinear programming model forthe optimal detailed design of counter flowwet-cooling towers hasbeen presented, in which the objective function consists in theminimization of the total annual cost considering the operation andcapital costs of the towers. The rigorous Poppe method is used forestimating the size and performance of the tower, together withempirical correlations for the loss and overall mass transfer coeffi-cients in the packing region of the cooling tower. The system ofdifferential model equations that describes the cooling process isreduced to algebraic equations byusing a fourth-order RungeeKuttaalgorithm and dividing the cooling-tower packing into 25
integration intervals. It was found that further increase in thisnumber of intervals did not cause any significant difference in theresults.
The performance of the rigorous optimization formulation forsix case studies was compared with that of a previously developedoptimization algorithm based on the Merkel method [26]. Wefound that the Poppe method predicts the same optimal values ofthe tower approach than the Merkel method. However, for allexamples, there are large differences between the remainingdesign and operation variables of wet-cooling towers (i.e., air outlettemperatures, evaporated water mass flow rates cooling ranges,water and air mass flow rates, total pressure drops of air, evapo-rated water mass flow rates, Merkel numbers, and packing heights)predicted by the Poppe and Merkel methods. This is because theclassical formulation of Merkel neglects the effect of the water lossby evaporation on the enthalpy change of the water stream andassumes a Lewis factor of unity and that the outlet air is saturated.Therefore, taking into consideration that the Poppe method allowsa cooling tower to be described properly without resorting to theassumptions of the Merkel method, it is clear that it leads to morereliable optimal designs of wet-cooling towers.
Authors acknowledge the financial support from the Council ofScientific Research of the Universidad Michoacana de San Nicolásde Hidalgo under project 20.1.
Appendix A. Thermophysical properties
We have used the following reliable airewater thermodynamicproperty equations in the rigorous model of the cooling tower thatwere taken from Kröger [40]. All temperatures are expressed inKelvin.
� Enthalpy of the airewater vapormixture per unitmass of dry-air
ima ¼ cpaðTa � 273:15Þ þwhifgwo þ cpvðTa � 273:15Þ
i(A.1)
� Enthalpy of the water vapor
iv ¼ ifgwo þ cpv;wðTw � 273:15Þ (A.2)
� Enthalpy of saturated air evaluated at water temperature
ima;s;w ¼ cpa;wðTw � 273:15Þ þws;w
hifgwo
þ cpv;wðTw � 273:15Þi
(A.3)
� Specific heat at constant pressure at Tþ 273.15/2
cpa ¼ 1:045356�103�3:161783�10�1T þ7:083814
�10�4T2�2:705209�10�7T3 (A.4)
� Specific heat of saturated water vapor at Tþ 273.15/2
Appendix B. System of nonlinear algebraic equations
Based on the work of Kloppers and Kröger [23], the differentialequations of the Poppe model have been discretized using thefourth-order RungeeKutta algorithm as described below:
It should be noted that the governing differential equations(Equations (1)e(3)) depend on the water temperature, the mass-fraction humidity and the air enthalpy. This can be represented asfollows,
dwdTw
¼ f ðima;w; TwÞ (B.1)
dima
dTw¼ f ðima;w; TwÞ (B.2)
dMedTw
¼ f ðima;w; TwÞ (B.3)
According to the RungeeKutta algorithm, the packing height ofthe cooling tower is divided into N finite intervals, with the samewater temperature change (DTw) that is obtained by
DTw ¼ Tw;in � Tw;out
N(B.4)
The simultaneous discretization approach for optimization ofwet-cooling towers is depicted in Fig. B1 for a cooling tower withfive intervals. Furthermore, every interval is subdivided into threeelements, as shown in Fig. B2 for interval 1. Using the nomenclatureof these figures, the set of ordinary differential equationscomprising the cooling-tower model is approximated at eachinterval by the following set of algebraic equations [23]:
Fig. B1. Simultaneous discretization approach for optimizing counter flowwet-coolingtowers using the Poppe method.
Rubio-Castro et al. / Applied Thermal Engineering 31 (2011) 3615e36283626
imanþ1 ¼ iman þ�Kðnþ1;1Þ þ 2Kðnþ1;2Þ þ 2Kðnþ1;3Þ þ Kðnþ1;4Þ
�.6
(B.6)
Menþ1 ¼ Men þ�Lðnþ1;1Þ þ 2Lðnþ1;2Þ þ 2Lðnþ1;3Þ þ Lðnþ1;4Þ
�.6
(B.7)
where
Jðnþ1;1Þ ¼ DTw$f ðTwn ; iman ;wnÞ (B.8)
level 0
level 1
J(1,1),K(1,1),L(1,1)
J(1,2),K(1,2),L(1,2)
J(1,3),K(1,3),L(1,3)
J(1,4),K(1,4),L(1,4)
Interval 1
Tw(1)=Tw(2,1), ima(1)=ima(2,1),w(1)=w(2,1)
Two=Tw(1,1), imai=ima(1,1),wi=w(1,1)
Fig. B2. Subdivision of interval 1 of the fill.
Kðnþ1;1Þ ¼ DTw$gðTwn ; iman ;wnÞ (B.9)
Lðnþ1;1Þ ¼ DTw$hðTwn ; iman ;wnÞ (B.10)
Jðnþ1;2Þ ¼ DTw$f�Twn þ
DTw2
; iman þKðnþ1;1Þ
2;wn þ
Jðnþ1;1Þ2
�(B.11)
Kðnþ1;2Þ ¼ DTw$g�Twn þ
DTw2
; iman þKðnþ1;1Þ
2;wn þ
Jðnþ1;1Þ2
�(B.12)
Lðnþ1;2Þ ¼ DTw$h�Twn þ
DTw2
; iman þKðnþ1;1Þ
2;wn þ
Jðnþ1;1Þ2
�(B.13)
Jðnþ1;3Þ ¼ DTw$f�Twn þ
DTw2
; iman þKðnþ1;2Þ
2;wn þ
Jðnþ1;2Þ2
�(B.14)
Kðnþ1;3Þ ¼ DTw$g�Twn þ
DTw2
; iman þKðnþ1;2Þ
2;wn þ
Jðnþ1;2Þ2
�(B.15)
Lðnþ1;3Þ ¼ DTw$h�Twn þ
DTw2
; iman þKðnþ1;2Þ
2;wn þ
Jðnþ1;2Þ2
�(B.16)
Jðnþ1;4Þ ¼ DTw$f�Twn þ DTw; iman þ Kðnþ1;3Þ;wn þ Jðnþ1;3Þ
�(B.17)
Kðnþ1;4Þ ¼ DTw$g�Twn þ DTw; iman þ Kðnþ1;3Þ;wn þ Jðnþ1;3Þ
�(B.18)
Lðnþ1;4Þ ¼ DTw$h�Twn þ DTw; iman þ Kðnþ1;3Þ;wn þ Jðnþ1;3Þ
�(B.19)
In above equations, J, K and L represent the recurrence relations todetermine the changes of the air mass-fraction humidity, airenthalpy and Merkel number, respectively, corresponding to eachincremental change in water temperature according to the fourth-order RungeeKutta algorithm.
Equations (B.4)e(B.19) can be applied to each interval of thetower including the bottom (interval 1) and top (interval NTI)sections of the tower, where boundary conditions are given as
It should be noted that the properties of the water and airewater vapor mixture and moist air, i.e., heat capacity, dry-bulbtemperature, wet-bulb temperature of air, mass-fraction humidityor air, are needed at each interval of the cooling tower. Theseproperties are obtained from the property equations given inAppendix A.
A set of simultaneous algebraic equations are thus created thatmust be included in the proposed MINLP model for optimizingmechanical draft wet-cooling towers.
Nomenclature
VariablesAfr cross-sectional packing area, m2
CAP capital cost, US$/yearCCTV
i disaggregated variables for the capital cost coefficients ofcooling towers
COP annual operating cost, US$/yearcj variables for Me calculationcji disaggregated variables for Me calculationcpa specific heat of air, J/kg Kcpv specific heat of saturated water vapor, J/kg Kcpw specific heat of liquid water, J/kg Kcpw,in specific heat of liquid water at the inlet of cooling tower,
J/kg Kcpw,out specific heat of liquid water at the outlet of cooling tower,
J/kg Kdk variables used in the calculation of the loss coefficientdki disaggregated variables for the calculation of the loss
coefficientHP power fan, hpima enthalpy of the airewater vapor mixture per unit mass of
dry-air, J/kg dry-airima,sw enthalpy of saturated air evaluated at water temperature,
J/kg dry-airiv enthalpy of the water vapor, J/kg dry-airJ recurrence relation for calculating the incremental
change of the air humidityK recurrence relation for calculating the incremental
change of the air enthalpyKfi loss coefficient in the fill, m�1
Kmisc component loss coefficient, dimensionlessL recurrence relation for calculating the incremental
change of the Merkel numberLfi fill height, mLef Lewis factor, dimensionlessma air mass flow rate, kg/s
mavin inlet airevapor flow rate, kg/smavm mean airevapor flow rate, kg/smavout outlet airevapor flow rate, kg/sMe Merkel number or transfer characteristic, dimensionlessmw water mass flow rate, kg/smw,b mass flow rate of blowdown, kg/smw,d mass flow rate of drift loss of water, kg/smw,ev mass flow rate of evaporated water, kg/smw,in inlet water mass flow rate to the cooling tower, kg/smw,m average water mass flow rate, kg/smw,out outlet water mass flow rate from the cooling tower, kg/smw,r make-up water mass flow rate, kg/sPv,wb saturated vapor pressure, PaTa dry-bulb air temperature, �C or KTAC total annual cost, US$/yearTa,n dry-bulb air temperature in the integration intervals, �C
or KTw water temperature, �C or KTwb wet-bulb temperature of the air, �C or KTw,n wet-bulb temperature of the air in the integration
intervals, �C or KTw,in water inlet temperature, �C or KTw,out water outlet temperature, �C or Kw mass-fraction humidity of air stream, kg of water/kg of
dry-airwin outlet mass-fraction humidity of air stream, kg of water/
kg of dry-airws,w saturated mass-fraction humidity at water temperature,
kg of water/kg of dry-airDPt total pressure drop of air, PaDPvp dynamic pressure drop, PaDPfi fill pressure drop, PaDPmisc miscellaneous pressure drop, Parm harmonic mean density of airewater vapor mixtures,
kg/m3
rout outlet air density, kg/m3
Parametersaji disaggregated coefficients for the estimation of Me
bki disaggregated coefficients for the estimation of loss
coefficientc1ec5 correlation coefficients for the estimation of MeCCTF fixed cooling-tower cost, US$CCTMA incremental cooling-tower cost based on air mass flow
rate, US$ s/kgCCTV incremental cooling-tower cost based on tower fill
volume, US$/m3
cue unit cost of electricity, US$/kW-hcuw unit cost of make-up water, US$/kgd1ed6 correlation coefficients for the estimation of loss
coefficient, dimensionlessDTMIN minimum allowable temperature difference, �C or Kei coefficient cost for different fill typesHY yearly operating time, hr/yearifgwo latent heat of water, J/kgKF annualization factor, year�1
ncycles number of cycles of concentration, dimensionlessPt total pressure, PaQ heat load, W or kWTa,in dry-bulb air temperature of the air entering the cooling
tower, �C or KTMPI inlet temperature of the hottest hot process stream, �C or
KTMPO outlet temperature of the coldest hot process stream, �C
or K
Rubio-Castro et al. / Applied Thermal Engineering 31 (2011) 3615e36283628
Twb,in wet-bulb temperature of the air entering the coolingtower, �C or K
win inlet mass-fraction humidity of air stream, kg of water/kgof dry-air
hf fan efficiency, dimensionlessrin inlet air density, kg/m3
Binary variablesyk used to select the type of fill
Subscriptsa dry-airb blowdownd drifte electricityev evaporated waterf fanfi packing or fillfr cross-sectionalin inletj constants for calculating the transfer coefficient
depending on the fill type, j¼ 1, ., 5k constants for calculating the loss coefficient depending on
the fill type, k¼ 1,.,6m averagema airevapor mixturemisc miscellaneousn number of intervalout outletr make-up (i.e. fresh)s saturatedt totalv water vaporvp velocity pressurew waterwb wet-bulb temperature
Superscriptsi fill type, i¼ 1, 2, 3j constants in the fill type, j¼ 1,., 5k constants in the fill type, k¼ 1,., 6
References
[1] E. Rubio-Castro, J.M. Ponce-Ortega, F. Nápoles-Rivera, M.M. El-Halwagi,M. Serna-González, A. Jiménez-Gutiérrez, Water integration of eco-industrialparks using a global optimization approach, Industrial and EngineeringChemistry Research 49 (20) (2010) 9945e9960.
[2] J.M. Ponce-Ortega, M. Serna-González, A. Jiménez-Gutiérrez, Optimizationmodel for re-circulating cooling water systems, Computers and ChemicalEngineering 34 (2) (2010) 177e195.
[3] E. Rubio-Castro, M. Serna-González, J.M. Ponce-Ortega, Optimal design ofeffluent-cooling systems using a mathematical programming model, AppliedThermal Engineering 30 (14e15) (2010) 2116e2126.
[4] A.E. Mills, Basic Heat and Mass Transfer. Prentice Hall, USA, 1999.[5] J.R. Singham, Cooling towers, in: Heat Exchanger Design Handbook. Hemi-
Poppe, and e-NTU methods of analysis, Journal of Engineering for GasTurbines and Power 127 (1) (2005) 1e7.
[7] F. Merkel, Verdunstungskühlung, VDI Zeitchrift Deustscher Ingenieure 70(1926) 123e128.
[8] D.R. Baker, H.A. Shryock, A comprehensive approach to the analysis of coolingtower performance, ASME Journal of Heat Transfer 83 (3) (1961) 339e349.
[9] I.L. Maclaine-cross, P.J. Banks, A general theory of wet surface heat exchangersand its application to regenerative cooling, ASME Journal of Heat Transfer 103(3) (1981) 579e585.
[10] T.J. Marseille, J.S. Schliesing, D.M. Bell, B.M. Johnson, Extending cooling towerthermal performance prediction using a liquid-side film resistance model,Heat Transfer Engineering 12 (3) (1991) 19e30.
[11] J.R. Khan, S.M. Zubair, An improved design and rating analysis of counterflow wet cooling towers, ASME Journal of Heat Transfer 123 (4) (2001)770e778.
[12] H.T.A. El-Dessouky, A. Al-Haddad, F. Al-Juwayhel, A modified analysis ofcounter flow wet cooling towers, ASME Journal of Heat Transfer 119 (3)(2007) 617e626.
[13] H. Jaber, R.L. Webb, Design of cooling towers by the effectiveness-NTUmethod, ASME Journal of Heat Transfer 111 (4) (1989) 837e843.
[14] A.N. Nahavandi, R.M. Kershah, B.J. Serico, The effect of evaporation losses inthe analysis of counterflow cooling towers, Nuclear Engineering and Design32 (1) (1975) 29e36.
[15] F. Osterle, On the analysis of counter-flow cooling towers, InternationalJournal of Heat and Mass Transfer 34 (4e5) (1991) 1313e1316.
[17] J.W. Sutherland, Analysis of mechanical-draught counterflow air/water cool-ing towers, ASME Journal of Heat Transfer 105 (8) (1983) 576e583.
[18] J.C. Kloppers, D.G. Kröger, The Lewis factor and its influence on the perfor-mance prediction of wet-cooling towers, International Journal of ThermalSciences 44 (9) (2005) 879e884.
[19] M. Poppe, H. Rögener, Berechnung von Rückkühlwerken. VDI-Wärmeatlas,1991, pp. Mi 1eMi 15.
[20] F. Bosnjakovic, Technische Thermodinamik. Theodor Steinkopf, Dresden,1965.
[21] C. Ren, An analytical approach to the heat and mass transfer processes incounterflow cooling towers, ASME Journal of Heat Transfer 128 (11) (2006)1142e1148.
[22] C. Ren, Corrections to the simple effectiveness-NTU method for counterflowcooling towers and packed bed liquid desiccanteair contact systems, Inter-national Journal of Heat and Mass Transfer 51 (1e2) (2008) 237e245.
[23] J.C. Kloppers, D.G. Kröger, A critical investigation into the heat and masstransfer analysis of counterflow wet-cooling towers, International Journal ofHeat and Mass Transfer 48 (3e4) (2005) 765e777.
[24] C. Bourillot, Teferi, Numerical Model for Calculating the Performance of anEvaporative Cooling Tower EPRI Report CS-3212-SR. Electric Power ResearchInstitute, Palo Alto, 1983.
[25] C. Bourillot, On the Hypothesis of Calculating the Water Flowrate Evaporatedin a Wet Cooling Tower EPRI Report CS-3144-SR. Electric Power ResearchInstitute, Palo Alto, 1983.
[26] M. Serna-González, J.M. Ponce-Ortega, A. Jiménez-Gutiérrez, MINLP optimi-zation of mechanical draft counter flow wet-cooling towers, Chemical Engi-neering Research and Design 88 (5e6) (2010) 614e625.
[27] M. Kintner-Meyer, A.F. Emery, Cost-optimal design for cooling towers, ASH-RAE Journal 37 (4) (1995) 46e55.
[28] M.S. Söylemez, On the optimum sizing of cooling towers, Energy Conversionand Management 42 (7) (2001) 783e789.
[29] M.S. Söylemez, On the optimum performance of forced draft counter flowcooling towers, Energy Conversion and Management 45 (15e16) (2004)2335e2341.
[30] A. Brooke, D. Kendrick, A. Meeraus, GAMS User’s Guide. The Scientific Press,USA, 2006.
[31] J.C. Kloppers, D.G. Kröger, Refinement of the transfer characteristic correlationof wet-cooling tower fills, Heat Transfer Engineering 26 (4) (2005) 35e41.
[32] J.C. Kloppers, D.G. Kröger, Loss coefficient correlation for wet-cooling towerfills, Applied Thermal Engineering 23 (17) (2003) 2201e2211.
[33] A. Vicchietti, S. Lee, I.E. Grossmann, Modeling of discrete/continuous optimi-zation problems characterization and formulation of disjunctions and theirrelaxations, Computers and Chemical Engineering 27 (3) (2003) 433e448.
[34] K.W. Li, A.P. Priddy, Power Plant System Design. JohnWiley & Sons, USA, 1985.[35] F.N. Kemmer, The NALCO Water Handbook. McGraw-Hill, USA, 1988.[36] J.M. Douglas, Conceptual Design of Chemical Processes. McGraw-Hill, New
York, USA, 1988.[37] J.K. Kim, R. Smith, Cooling water system design, Chemical Engineering Science
56 (12) (2001) 3641e3658.[38] J.M. Ponce-Ortega, M. Serna-González, A. Jiménez-Gutiérrez, MINLP synthesis
of optimal cooling network, Chemical Engineering Science 62 (21) (2007)5728e5735.
[39] J.M. Ponce-Ortega, M. Serna-González, A. Jiménez-Gutiérrez, A disjunctiveprogramming model for simultaneous synthesis and detailed design of cool-ing network, Industrial and Engineering Chemistry Research 48 (6) (2009)2991e3003.