Page 1
University of Wollongong University of Wollongong
Research Online Research Online
University of Wollongong Thesis Collection 2017+ University of Wollongong Thesis Collections
2018
Applying a self-regulation framework to an ageing context: The role of Applying a self-regulation framework to an ageing context: The role of
psychosocial mechanisms in relationships between self-perceptions of psychosocial mechanisms in relationships between self-perceptions of
ageing and mental health ageing and mental health
Louise Jane Turner University of Wollongong Follow this and additional works at: https://ro.uow.edu.au/theses1
University of Wollongong University of Wollongong
Copyright Warning Copyright Warning
You may print or download ONE copy of this document for the purpose of your own research or study. The University
does not authorise you to copy, communicate or otherwise make available electronically to any other person any
copyright material contained on this site.
You are reminded of the following: This work is copyright. Apart from any use permitted under the Copyright Act
1968, no part of this work may be reproduced by any process, nor may any other exclusive right be exercised,
without the permission of the author. Copyright owners are entitled to take legal action against persons who infringe
their copyright. A reproduction of material that is protected by copyright may be a copyright infringement. A court
may impose penalties and award damages in relation to offences and infringements relating to copyright material.
Higher penalties may apply, and higher damages may be awarded, for offences and infringements involving the
conversion of material into digital or electronic form.
Unless otherwise indicated, the views expressed in this thesis are those of the author and do not necessarily Unless otherwise indicated, the views expressed in this thesis are those of the author and do not necessarily
represent the views of the University of Wollongong. represent the views of the University of Wollongong.
Recommended Citation Recommended Citation Turner, Louise Jane, Applying a self-regulation framework to an ageing context: The role of psychosocial mechanisms in relationships between self-perceptions of ageing and mental health, Doctor of Philosophy thesis, School of Psychology, University of Wollongong, 2018. https://ro.uow.edu.au/theses1/397
Research Online is the open access institutional repository for the University of Wollongong. For further information contact the UOW Library: [email protected]
Page 2
Applying a self-regulation framework to an ageing context:
The role of psychosocial mechanisms in relationships between
self-perceptions of ageing and mental health
This thesis is presented as part of the requirements for the degree of
DOCTOR OF PHILOSOPHY (Clinical Psychology)
from the
UNIVERSITY OF WOLLONGONG
by
Louise Jane Turner, BPsyc. (Hons)
School of Psychology
2018
Page 3
i
THESIS CERTIFICATION
I, Louise Jane Turner, declare that this thesis submitted in fulfilment of the
requirements for the conferral of the degree Doctor of Philosophy (Clinical
Psychology), from the University of Wollongong, is wholly my own work unless
otherwise referenced or acknowledged. This document has not been submitted for
qualifications at any other academic institution.
Louise Jane Turner
29th
March 2018
Page 4
ii
ACKNOWLEDGEMENTS
This research has been conducted with the support of the Australian Government
Research Training Program Scholarship.
Firstly, I wish to acknowledge my supervisors, both past and current – Dr Leonie
Miller, Professor Peter Caputi, Professor Craig Gonsalvez, and the late Professor
Donald Iverson. The support, guidance, patience, and encouragement that each one of
these individuals provided to me at different points throughout my thesis journey were
invaluable.
I also wish to express my gratitude to all of the administration staff in the School of
Psychology, who provided much help and support over the years.
This research would not have been possible without the participants, all of who showed
genuine interest in this project and provided their own time willingly. I am grateful to
each and every one of them.
A special thank you to my fellow postgraduate students: April, Natalie, Anna, Uwana,
Karin, and Brie. I feel privileged to have shared this experience with each of you and
am grateful for your enduring friendships.
I could not have completed this journey without the love and support of all my family
and friends; these relationships have sustained me. A special mention to several people
who showed unwavering belief in me and were always there to keep me on track– Mum,
Dad, Kathryn, Kristen, Cathryn, and Zoe – thank you.
Most of all, to my husband, Martin, whose unconditional love and support (plus bucket
loads of patience) helped me to keep things in perspective and motivated me to stick
with my goals. I am looking forward to spending more time with you and our little
bundle of energy, Henry!
Page 5
iii
This thesis is dedicated to the memory of my Nanna, Shirley Lucy Knott
(1921 – 2009).
Page 6
iv
LIST OF ABBREVIATIONS
AAQ Attitudes to Ageing Questionnaire
ABS Australian Bureau of Statistics
AIHW Australian Institute of Health and Welfare
ANOVA Analysis of variance
APQ Ageing Perceptions Questionnaire
ATOA-PGC Attitudes Towards Own Aging – Philadelphia Geriatric Center
CSM Common-Sense Model
DALY Disability-adjusted life years
SPA Self-perceptions of ageing
TILDA The Irish Longitudinal Study on Ageing
WHO World Health Organization
Page 7
v
TABLE OF CONTENTS
THESIS CERTIFICATION ............................................................................................ i
ACKNOWLEDGEMENTS ............................................................................................ ii
LIST OF ABBREVIATIONS ....................................................................................... iv
TABLE OF CONTENTS ................................................................................................ v
LIST OF FIGURES ....................................................................................................... xi
LIST OF TABLES ........................................................................................................ xii
ABSTRACT .................................................................................................................. xiv
Chapter 1 Introduction ................................................................................................... 1
1.1 Background ........................................................................................... 2
1.2 Definition of self-perceptions of ageing (SPA) .................................... 3
1.2.1 Situating SPA within broader field of subjective ageing ......... 4
1.3 General rationale ................................................................................... 6
1.4 Research aims and questions ................................................................ 8
1.5 Thesis structure ..................................................................................... 9
Chapter 2 Foundational concepts ................................................................................ 13
2.1 Introduction ......................................................................................... 14
2.2 Health .................................................................................................. 14
2.2.1 Conceptualisations of health ................................................... 14
2.2.2 Determinants of health ........................................................... 16
2.2.3 Mental health .......................................................................... 18
2.3 The successful ageing paradigm ......................................................... 22
2.4 Self-regulation .................................................................................... 26
2.5 Summary ............................................................................................. 28
Chapter 3 A theoretical framework for investigating SPA ....................................... 29
3.1 Introduction ......................................................................................... 30
3.2 The formation of SPA ......................................................................... 30
Page 8
vi
3.3 Self-regulation in the context of ageing .............................................. 31
3.4 A self-regulation model for health and illness .................................... 32
3.4.1 Illness perceptions have content and structure ....................... 34
3.4.2 Illness perceptions guide coping responses ............................ 36
3.4.3 Self-attributes can moderate the self-regulation process ........ 38
3.5 Proposed application of CSM framework to SPA .............................. 39
3.5.1 Dimensions of SPA within CSM framework ......................... 39
3.5.2 Related ageing constructs ....................................................... 40
3.6 Measurement of SPA dimensions ....................................................... 42
3.7 Summary ............................................................................................. 44
Chapter 4 Psychosocial factors and mental health: An overview ............................ 46
4.1 Introduction ......................................................................................... 47
4.2 Psychosocial constructs (proposed mediating and moderating
variables) ............................................................................................. 48
4.2.1 Coping .................................................................................... 48
4.2.2 Social networks ...................................................................... 54
4.2.3 Dispositional traits .................................................................. 56
4.3 Mental health constructs (proposed dependent variables) .................. 60
4.3.1 Psychological distress ............................................................. 60
4.3.2 Subjective wellbeing .............................................................. 62
4.4 Summary ............................................................................................. 65
Chapter 5 Self-perceptions of ageing: A literature review ........................................ 67
5.1 Introduction ......................................................................................... 68
5.2 Associations between SPA dimensions and mental health ................. 69
5.2.1 Identity dimension .................................................................. 69
5.2.2 Timeline dimension ................................................................ 71
5.2.3 Consequences dimension ........................................................ 73
5.2.4 Control dimension .................................................................. 75
5.2.5 Emotional representations dimension ..................................... 76
5.3 Individual differences in SPA ............................................................. 78
5.3.1 Sociodemographic characteristics and SPA ........................... 79
Page 9
vii
5.3.2 Subjective health status and SPA ........................................... 82
5.3.3 Coping and SPA ..................................................................... 85
5.3.4 Dispositional traits and SPA ................................................... 88
5.4 Psychological pathways between SPA and mental health .................. 92
5.4.1 Coping mechanisms as mediating variables ........................... 95
5.4.2 Dispositional traits as moderating variables ........................... 97
5.5 Conclusion ........................................................................................ 101
Chapter 6 Clinical implications: Current findings and future directions ............. 103
6.1 Introduction ....................................................................................... 104
6.2 Changing SPA: Findings from brief intervention studies ................. 104
6.3 Future directions for clinical intervention ........................................ 106
6.4 Considerations for the application of interventions .......................... 107
6.5 Summary and conclusions ................................................................ 108
Chapter 7 Methodology .............................................................................................. 110
7.1 Introduction ....................................................................................... 111
7.2 Research questions ............................................................................ 111
7.3 Research design ................................................................................ 111
7.4 Participants and procedure ................................................................ 113
7.4.1 Time 1 ................................................................................... 113
7.4.2 Time 2 ................................................................................... 116
7.5 Materials ........................................................................................... 119
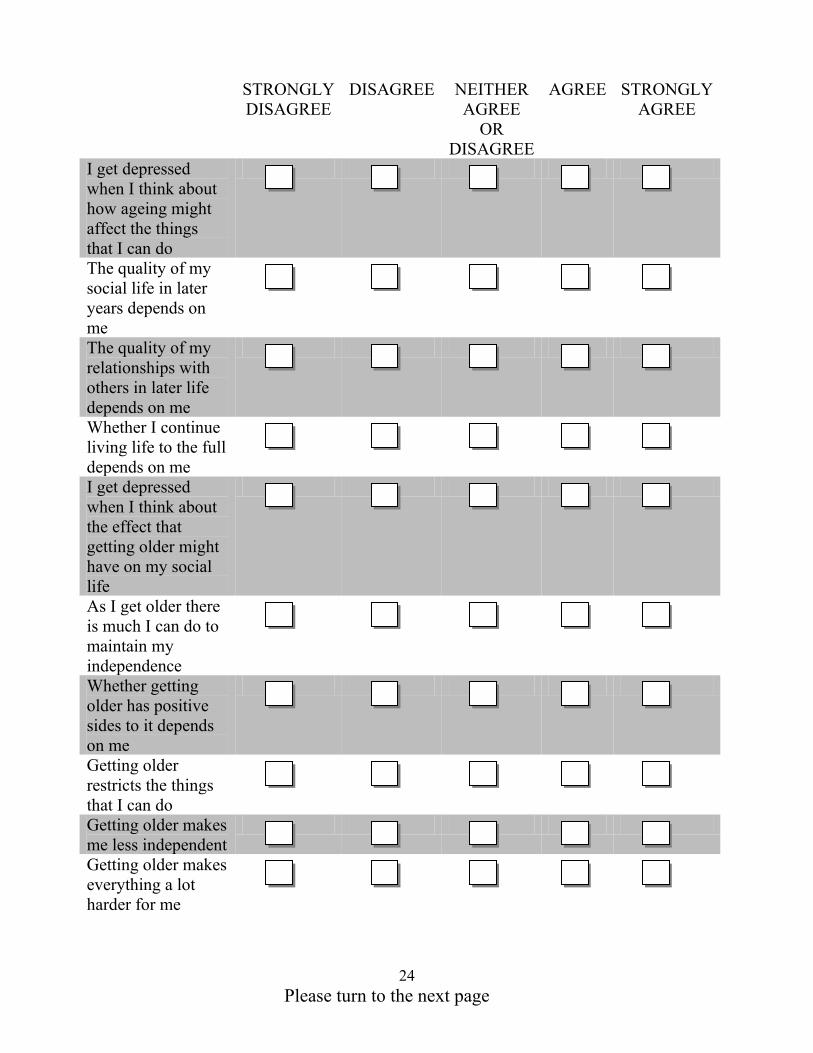
7.5.1 Ageing Perceptions Questionnaire ....................................... 119
7.5.2 BriefCOPE Inventory ........................................................... 120
7.5.3 Duke Social Support Index–Short Version .......................... 121
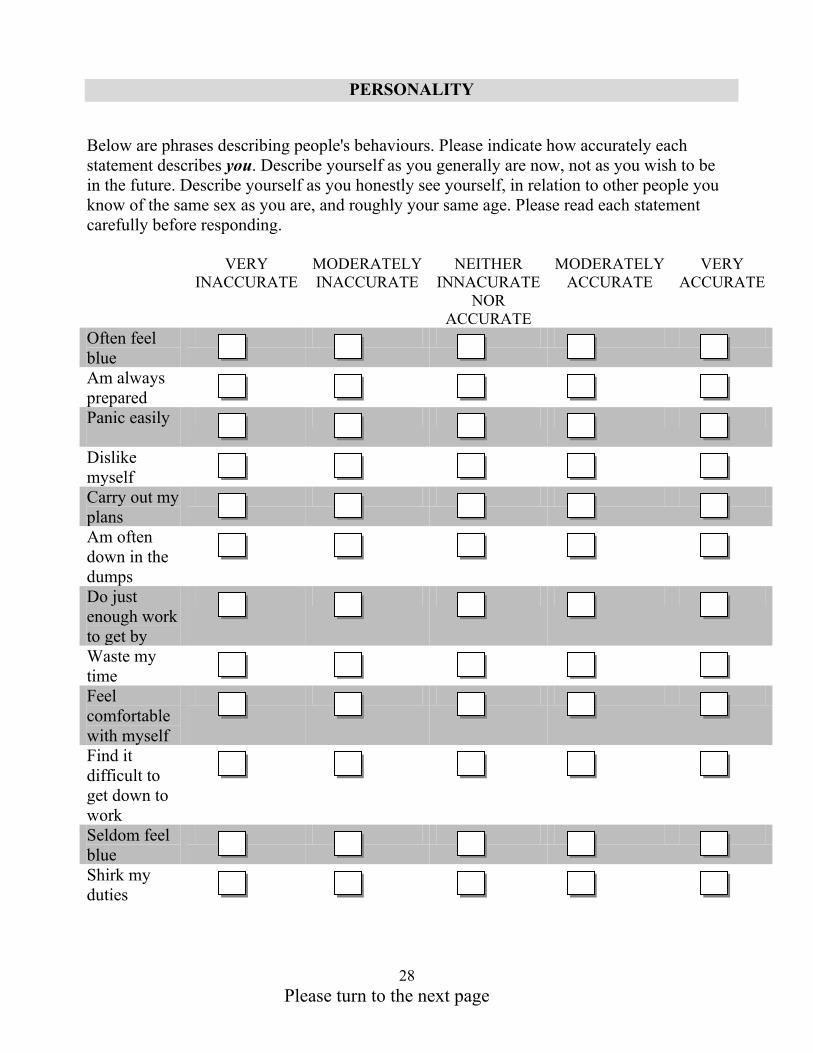
7.5.4 Personality factor domains of the International Personality
Item Pool (IPIP) .................................................................... 121
7.5.5 Life Orientation Test-Revised .............................................. 122
7.5.6 Depression, Anxiety, Stress Scales–Short Version .............. 122
7.5.7 CASP-12 ............................................................................... 123
7.5.8 Positive and Negative Affect Schedule ................................ 123
7.5.9 Satisfaction with Life Scale .................................................. 124
Page 10
viii
7.5.10 Subjective indicators of health status ................................... 124
7.5.11 The Social Readjustment Rating Scale ................................. 125
7.6 Missing data and incompletion ......................................................... 125
7.7 Data analysis ..................................................................................... 128
Chapter 8 Applying a self-regulation model to investigate SPA: Evidence from
Australia and overseas .......................................................................... 130
8.1 Introduction ....................................................................................... 131
8.2 Hypotheses ........................................................................................ 133
8.3 Method .............................................................................................. 134
8.4 Results ............................................................................................... 134
8.5 Discussion ......................................................................................... 140
8.6 Conclusion ........................................................................................ 147
Chapter 9 A cross-sectional investigation of individual differences in SPA: The role
of sociodemographic characteristics and subjective health status .... 148
9.1 Introduction ....................................................................................... 149
9.2 Hypotheses ........................................................................................ 151
9.3 Method .............................................................................................. 151
9.4 Results ............................................................................................... 152
9.4.1 SPA and age ......................................................................... 153
9.4.1 SPA and gender .................................................................... 156
9.4.2 SPA and educational attainment ........................................... 156
9.4.3 SPA and income level .......................................................... 156
9.4.4 SPA and partner status .......................................................... 157
9.4.5 SPA and self-rated health status ........................................... 157
9.4.6 SPA and number of chronic medical conditions .................. 158
9.5 Discussion ......................................................................................... 159
9.6 Conclusion ........................................................................................ 166
Chapter 10 A cross-sectional investigation of the relationships between SPA and
mental health in older Australian adults ............................................. 167
10.1 Introduction ....................................................................................... 168
10.2 Hypotheses ........................................................................................ 170
10.3 Method .............................................................................................. 171
Page 11
ix
10.4 Results ............................................................................................... 173
10.4.1 Relationships between SPA and mental health .................... 173
10.4.2 Relationships between SPA and coping ............................... 175
10.4.3 Relationships between SPA and dispositional traits ............ 177
10.4.4 Pattern of correlations across self-rated health and
chronological age groups ...................................................... 177
10.5 Discussion ......................................................................................... 181
10.6 Conclusion ........................................................................................ 189
Chapter 11 An investigation of SPA and mental health in older Australian adults
cross-sectionally and across time: The indirect effects of coping ..... 190
11.1 Introduction ....................................................................................... 191
11.2 Hypotheses ........................................................................................ 193
11.3 Method .............................................................................................. 193
11.3.1 Analysis of data .................................................................... 194
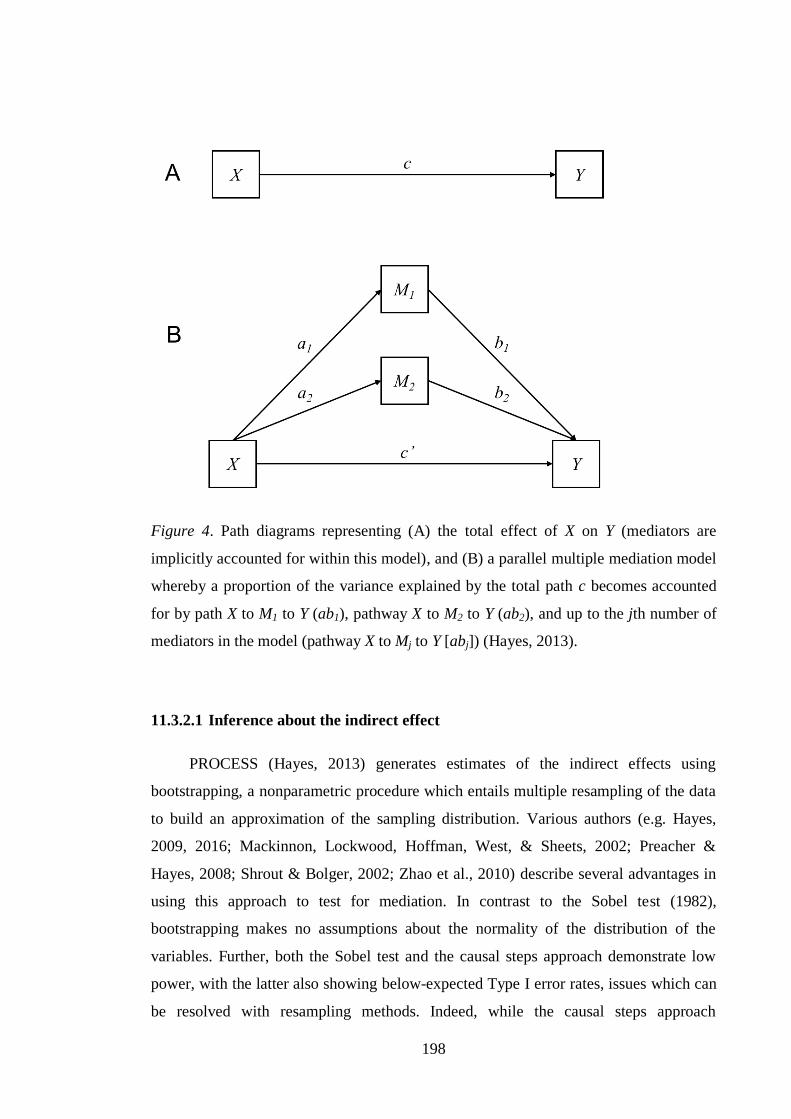
11.3.2 Examination of the indirect effects ....................................... 197
11.4 Results ............................................................................................... 202
11.4.1 Cross-sectional multiple mediation analyses ........................ 205
11.4.2 Within-subjects multiple mediation analyses ....................... 221
11.5 Discussion ......................................................................................... 225
11.6 Conclusion ........................................................................................ 232
Chapter 12 A cross-sectional investigation of SPA and mental health in older
Australian adults: The moderating effects of disposition .................. 233
12.1 Introduction ....................................................................................... 234
12.2 Hypotheses ........................................................................................ 235
12.3 Method .............................................................................................. 236
12.3.1 Analysis of data .................................................................... 236
12.4 Results ............................................................................................... 239
12.4.1 Moderation analyses ............................................................. 242
12.5 Discussion ......................................................................................... 246
12.6 Conclusion ........................................................................................ 250
Chapter 13 General discussion .................................................................................. 251
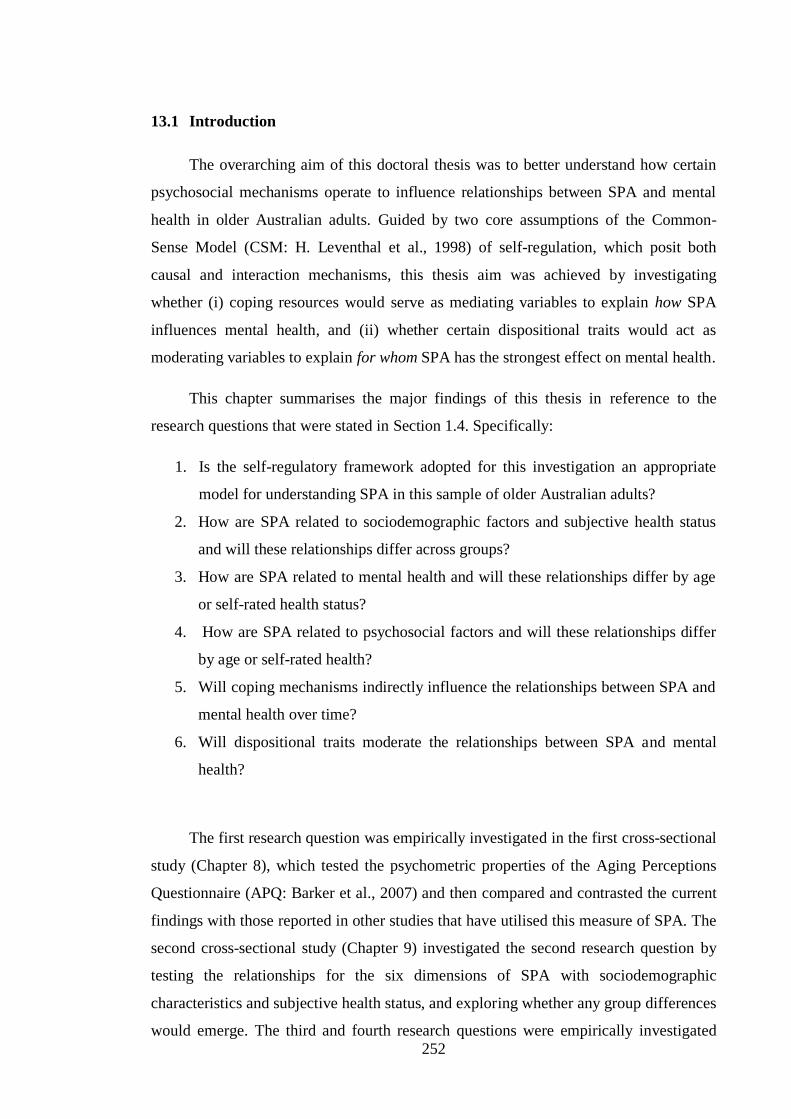
13.1 Introduction ....................................................................................... 252
Page 12
x
13.2 Empirical findings of this thesis ....................................................... 253
13.2.1 Utilising a self-regulation framework to investigate correlates
of SPA .................................................................................. 253
13.2.2 Assumptions of the CSM framework applied to an ageing
context .................................................................................. 258
13.3 Theoretical implications ................................................................... 261
13.4 Clinical application ........................................................................... 263
13.5 Limitations ........................................................................................ 264
13.6 Conclusion ........................................................................................ 267
References ................................................................................................................. 269
Appendices ................................................................................................................. 320
Appendix A: Information flyer for participating organisations ................. 321
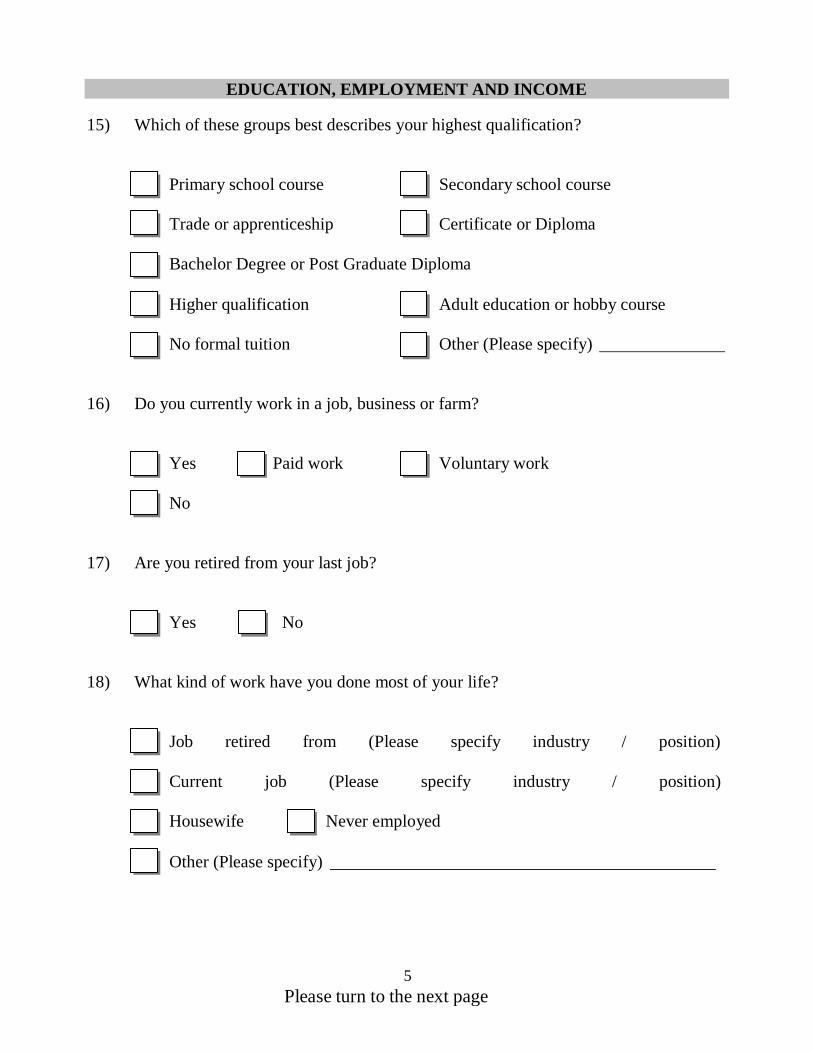
Appendix B: Sample questionnaire booklet (Time 1) ................................ 323
Appendix C: Participant information sheet ................................................ 366
Appendix D: Sample questionnaire booklet (Time 2) ............................... 369
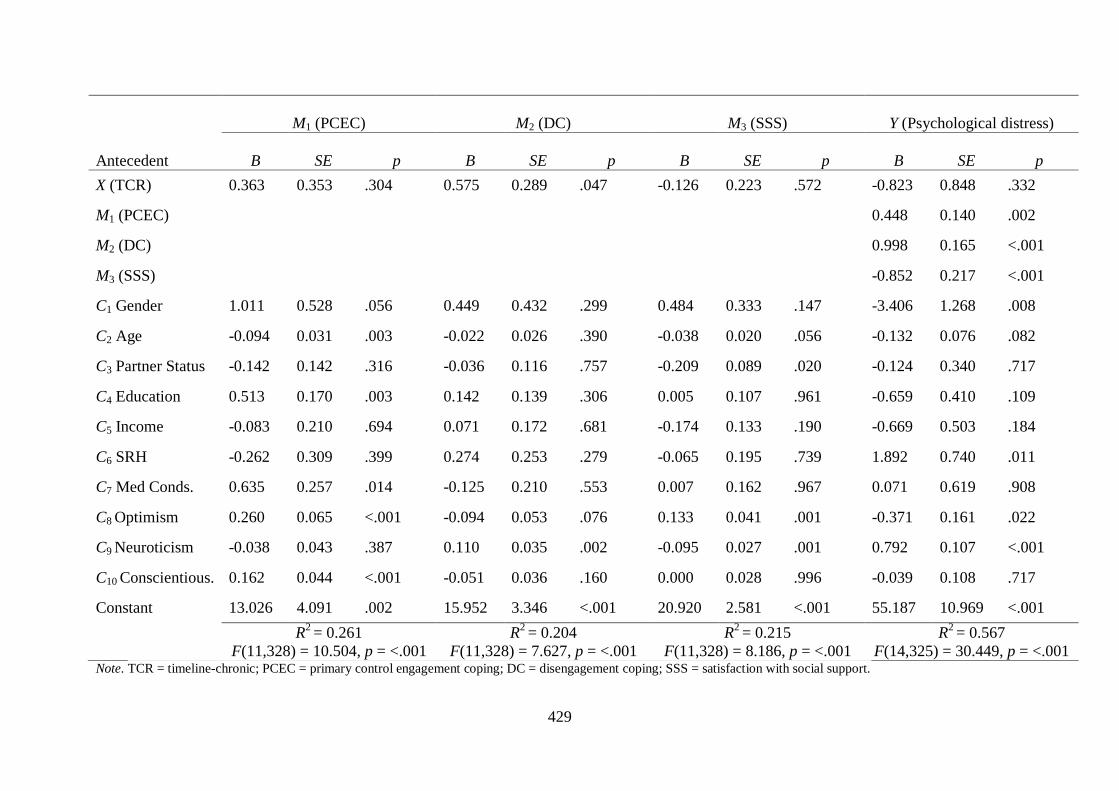
Appendix E: Model summary information for mediation models (Time 1)
.......................................................................................................... 414
Appendix F: Model summary information for mediation models (Time 2)
.......................................................................................................... 435
Appendix G: Model summary information for moderation models .......... 441
Page 13
xi
LIST OF FIGURES
Figure 1 Schematic representation of the Common-Sense Model (CSM) of illness
representations……………………………………………………........ 33
Figure 2 Visual representation of the zero-order correlations for the APQ
subscales with mental health and psychosocial variables by self-rated
health status and age groups................................................................ 179
Figure 3 Conceptual diagram of the mediation model whereby coping mechanisms
indirectly influence the relationship between SPA and mental health. 196
Figure 4 Path diagrams representing a parallel multiple mediation model……. 198
Figure 5 Path diagram representing the multiple mediation models predicting life
satisfaction........................................................................................... 207
Figure 6 Path diagram representing the multiple mediation models predicting
positive affect....................................................................................... 210
Figure 7 Path diagram representing the multiple mediation models predicting
quality of life........................................................................................ 213
Figure 8 Path diagram representing the multiple mediation models predicting
psychological distress.......................................................................... 217
Figure 9 Path diagrams representing a simple moderation model..................... 238
Figure 10 Conditional effects of the APQ dimensions on mental health at different
levels of the dispositional trait variables.............................................. 244
Page 14
xii
LIST OF TABLES
Table 1 Definitions for higher order coping categories....................................... 50
Table 2 Participant sociodemographic and health status characteristics for Time 1
and Time 2............................................................................................ 117
Table 3 Missing values for psychosocial and mental health variables at Time 1
and Time 2…………………………………………………………… 127
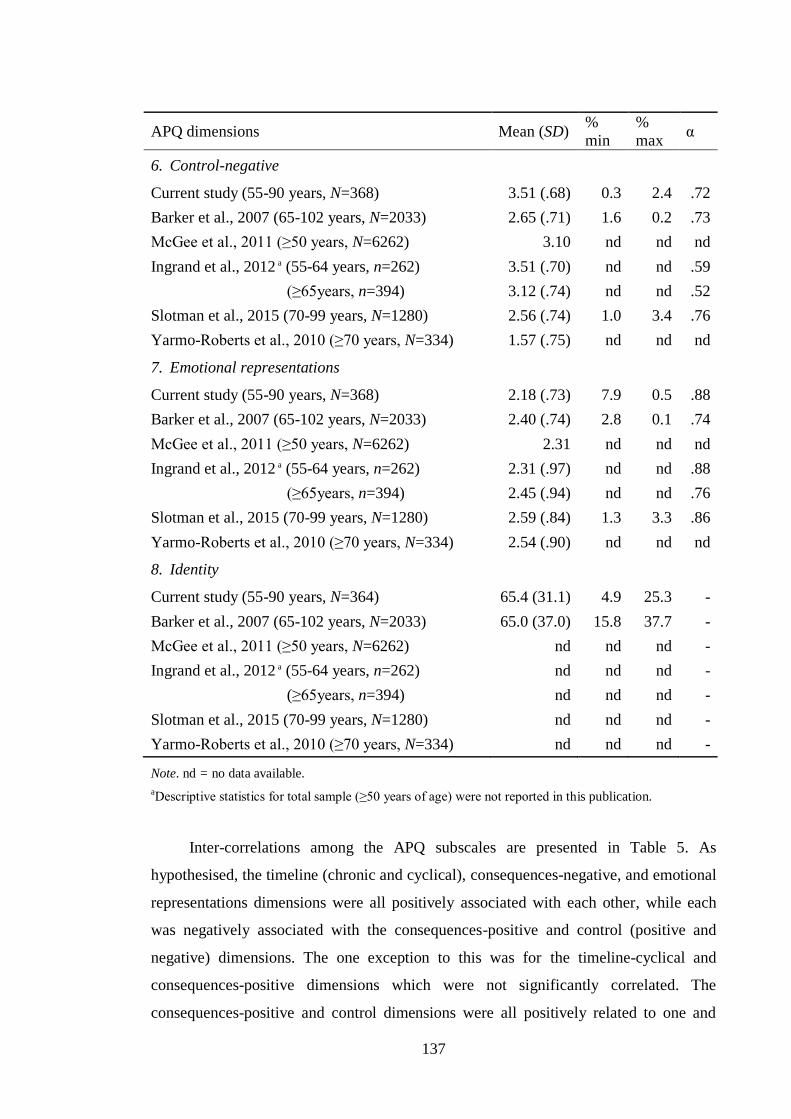
Table 4 Descriptive statistics for the APQ subscales........................................ 135
Table 5 Inter-correlations among the APQ subscales........................................ 139
Table 6 Descriptive statistics for the APQ subscales by sociodemographic and
subjective health characteristics............................................................ 154
Table 7 Zero-order correlations between the APQ subscales and mental health
variables................................................................................................ 174
Table 8 Partial correlations between the APQ subscales with PANAS-NA and
DASS scales.......................................................................................... 175
Table 9 Zero-order correlations between the APQ subscales and psychosocial
variables................................................................................................ 176
Table 10 Descriptive statistics and zero-order correlations for all of the mediation
model variables at Time 1 and Time 2................................................. 203
Table 11 Indirect effects and confidence intervals for models predicting life
satisfaction............................................................................................ 208
Table 12 Indirect effects and confidence intervals for models predicting positive
affect.................................................................................................... 211
Table 13 Indirect effects and confidence intervals for models predicting quality of
life......................................................................................................... 214
Page 15
xiii
Table 14 Indirect effects and confidence intervals for models predicting
psychological distress........................................................................... 218
Table 15 Pairwise contrasts of the specific indirect effects................................ 219
Table 16 Residualised change scores and scale score ranges for the mediation
model variables..................................................................................... 222
Table 17 Descriptive statistics and zero-order correlations for all of the moderation
model variables..................................................................................... 241
Page 16
xiv
ABSTRACT
Population ageing is placing ever-increasing and unprecedented demands on
societies, and the health and wellbeing of older adults is now regarded as a key issue for
policy makers and health service providers alike. Over the past three decades, there has
been a discernible shift away from decline models of ageing and an increased research
focus on what distinguishes those older adults who age well from those who are less
proficient at adapting to age-related changes. This research is situated broadly within
the field of successful ageing. One potentially important psychological marker of
successful ageing that has received growing attention from researchers in recent years,
and which is often conceptualised as a process underpinning self-regulatory abilities, are
older adults’ self-perceptions of ageing (SPA). While the research to have emerged
from this field has provided some substantial insights into the adaptive processes of
ageing, there remain significant gaps in our knowledge. In particular, the pathways
between SPA and mental health are currently poorly understood. Despite the empirical
evidence regarding the numerous contextual and individual variables which inform and
shape the multiple facets of SPA and health independently, investigations into the
mechanistic pathways between ageing experiences and mental health have been scarce.
This doctoral thesis sought to address these gaps in knowledge by adopting a self-
regulation framework to examine relationships between SPA and mental health. The
overarching aim of this research was to better understand how certain psychosocial
mechanisms, specifically, coping and dispositional traits operate to influence the
relationships between SPA and mental health functioning. A secondary aim of this
research was to establish whether the self-regulation framework which was originally
applied to the field of health and illness (i.e. the Common-Sense Model: CSM) would
be an appropriate conceptual framework for examining SPA in a group of older,
community-dwelling Australian adults. Participants (N = 368) aged 55 years and over
were asked to complete survey questionnaires at two time points (with a 12-month lag)
Page 17
xv
which included a range of measures to assess SPA and psychosocial functioning. SPA
were measured with the Ageing Perceptions Questionnaire (APQ), a multidimensional
instrument which was informed by the CSM but applied to an ageing context. In the
first three studies of this thesis, all of which utilised survey data from Time 1 of the
repeated measures design, relationships between SPA and key sociodemographic,
subjective health, psychosocial, and mental health variables were examined. Drawing
on several core assumptions of the CSM, this thesis then examined whether coping
resources would mediate the relationships between SPA and mental health over time
(study four), and whether certain dispositional traits would moderate these relationships
(study five). The repeated measures survey data from both time points were utilised in
study four, while study five was investigated cross-sectionally with the Time 1 survey
data.
The first three cross-sectional studies of this thesis provided preliminary evidence
that (i) the CSM is an appropriate framework for investigating SPA in older, Australian
adults, (ii) very little variance in SPA is accounted for by individual differences in
sociodemographic factors whereas self-rated health status is moderately related to many
of the SPA dimensions, and (iii) SPA are meaningfully related to mental health and
psychosocial factors in a common-sense fashion. In general, participants in this study
rated their SPA and mental health favourably, and were found to be a fairly well-
resourced and well-functioning segment of the older Australian adult population.
Extending on the findings from the first three studies, the fourth and fifth studies, which
were exploratory in nature, provided preliminary partial support for the assumptions of
the CSM, when applied to an ageing context. Specifically, coping resources were found
to indirectly influence relationships between SPA and coping. The relationships
observed between the various dimensions of SPA and coping conformed to the
common-sense patterns which the CSM posits and a number of different mediation
patterns were detected across both waves of the study. Further, dispositional traits were
found to moderate relationships between a number of the SPA dimensions and two
measures of mental health.
Page 18
xvi
While many of the relationships from study four did not appear to hold over time
when changes within individuals were examined, and further, the size of the effects
observed in studies four and five were not large, these findings need to be interpreted
within the broader context of the current study sample. Overall, the findings from this
thesis provide novel insights into the mechanistic pathways between SPA and mental
health within independent, community-dwelling older Australian adults, all of which
have important theoretical and clinical implications. Because of the exploratory nature
of these investigations, the results must be treated as speculative at this stage. However,
confirmatory investigations are warranted to establish these relationships and extend on
this research. Possible future avenues of research are presented. These include exploring
the mediating role of social mechanisms in greater depth and examining how
interactions among personality traits moderate mediated pathways between SPA and
mental health.
Page 19
1
Chapter 1 Introduction
Page 20
2
1.1 Background
The ageing process entails numerous inherent changes which may have a direct
effect on adaptation (P. B. Baltes & Baltes,1990; Whitbourne, 2000). Gains and losses
in adaptive ability occur concurrently throughout the lifespan, both within and across
biological and cultural domains of functioning (P. B. Baltes, Lindenberger, &
Staudinger, 2006; Uttal & Perlmutter, 1989). However, as older adults age and face an
increasingly broader range of biological and social constraints on their life course
trajectory, the ratio of developmental gains and losses will inevitably become less
favourable (P. B. Baltes, 2006; Schulz & Heckhausen, 1996). Nonetheless, recent
research (e.g. Jeste et al., 2013) has revealed that older adults often demonstrate better
mental health functioning than their younger counterparts despite these age-related
challenges, a phenomenon that has been referred to as the paradox of ageing (Mroczek
& Kolarz, 1998; Villar, 2011). Indeed, contemporary investigations into ageing have
now shifted away from decline and loss models and are instead focussed on factors
which may contribute to how successfully people age, both at the individual and
societal levels (Wurm, Wolff, & Schüz, 2014). One psychological measure of healthy or
successful ageing that has received a great deal of interest in recent years and which
may be conceptualised as an indicator of adaptation to age-related changes is older
peoples’ self-perceptions of ageing (Bryant et al., 2012; Levy, Slade, & Kasl, 2002;
Sargent-Cox, Anstey, & Luszcz, 2012a).
A growing body of evidence (e.g. Bode, Taal, Westerhof, van Gessel, & van de
Laar, 2012; Bryant et al., 2012; Hess, Auman, Colcombe, & Rahhal, 2003; Jang, Poon,
Kim, & Shin, 2004; Kotter-Grühn et al., 2009; Lai, 2009; Levy & Myers, 2004; Levy et
al., 2002; Robertson, King-Kallimanis, & Kenny, 2015; Sargent-Cox, Anstey, &
Luszcz, 2012b; Sarkisian, Prohaska, Wong, Hirsch, & Mangione, 2005; Sindi et al.,
2012; Steverink, Westerhof, Bode, & Dittmann-Kohli, 2001; Weltzien, 2007; Wu, Wei,
Sun, & Wu, 2016; Wurm & Benyamini, 2014; Wurm, Tomasik, & Tesch-Römer, 2010)
suggests that subjective experiences of age and ageing are associated with a range of
health-related factors. Given the dynamic nature of self-perceptions of ageing
(hereinafter referred to as SPA), there is scope for implementing clinical interventions
aimed at altering the negative subjective views of ageing associated with poorer health
Page 21
3
outcomes (Barker, O’Hanlon, McGee, Hickey, & Conroy, 2007; Sargent-Cox et al.,
2012b). Yet to date, few attempts at instigating change in SPA via targeted strategies
have been effective (Kotter-Grühn, 2015).
While the evidence for associations between SPA and health is compelling,
several recent studies (Sargent-Cox et al., 2012b; Wurm, Tesch-Römer, & Tomasik,
2007) have suggested that SPA have a stronger influence on health than vice versa. That
is, SPA may play an instrumental role in driving health changes, much more so than
health changes impact on SPA (Wurm, Warner, Ziegelmann, Wolff, & Schüz, 2013).
Further, it is likely that other psychosocial mechanisms are implicated in either
mediating or moderating these relationships. At this point in time, only a handful of
studies have sought to investigate psychosocial mechanisms which might impact on the
relationship between SPA and mental health (as reviewed in Chapter 5). Such gaps in
knowledge within this relatively new field of enquiry may account for some of the less
than favourable outcomes when negative SPA have been targeted for intervention. The
development of any future interventions that will result in meaningful clinical outcomes
therefore necessitates further research into SPA, to elucidate the construct more fully
and to understand the role that other intervening factors may play in the relationship
between SPA and health-related outcomes.
1.2 Definition of self-perceptions of ageing (SPA)
SPA reflect the experiences, beliefs, and expectations that one holds about their
own age and the ageing process, as distinct from chronological age or societal
perceptions of ageing (Kotter-Grühn, 2015; Levy, Slade, & Kasl, 2002). The terms
personal views of ageing, personal experiences of ageing, and self-views of ageing are
also found within the literature to describe this construct however for consistency, the
term SPA is adopted for use in this thesis. SPA are understood to comprise multiple
dimensions which reflect both negative and positive ageing experiences (Barker et al.,
2007). There are numerous individual, contextual, and socio-cultural factors which
inform how an individual conceptualises their own ageing experience (Levy, 2003;
Steverink et al., 2001) however it is widely acknowledged that age stereotypes play a
significant role in the formation of SPA (Levy, 2009). The theoretically informed SPA
dimensions that will be explored within this thesis and how SPA are understood to be
constructed are described at length in Chapter 3.
Page 22
4
1.2.1 Situating SPA within broader field of subjective ageing
While SPA are a relatively new construct, with the largest proportion of research
accumulating over the past two decades, various other terms have been employed within
the literature over the past fifty years or more to describe subjective constructions of age
and ageing1 (Diehl et al., 2014; Kotter-Grühn, 2015). This has created a degree of
conceptual confusion, as researchers have not consistently applied the same terms to the
same types of ageing experiences. Further, measures that have been employed within
empirical investigations of SPA have been used to assess other age and ageing
constructs which has further blurred conceptual boundaries (Diehl et al., 2014). It is
therefore important that the manner in which these constructs will be operationalised
within this thesis, are outlined.
The term subjective ageing has the longest history and is frequently employed as
an umbrella term which comprises SPA, age identity, and other personal experiences of
ageing (Diehl, Wahl, Brothers, & Miche, 2015; Kotter-Grühn, 2015; Westerhof et al.,
2014). Subjective age and age identity are terms that are often used interchangeably to
reflect how an individual experiences their age (Montepare, 2009), which is generally
measured unidimensionally as the discrepancy between felt and chronological age
(Westerhof et al., 2014). However, other measures of subjective age (e.g. desired- or
ideal-age, look- or physical-age, act- or do-age, interest-age) reveal the
multidimensional nature of this construct (Kotter-Grühn, 2015; Montepare, 2009;
Teuscher, 2009). Diehl and colleagues (2014) have argued that subjective age and age
identity should be treated as two distinct concepts as they have different theoretical
origins: the former referring to how old an individual feels, based largely on
psychological and physical stimuli, and the latter referring to an individual’s subjective
sense of age, derived primarily through social experiences and identification with a
particular group, reflecting the sociological roots from which the construct is derived.
However, very few studies have applied such a distinction. Attitudes toward one’s own
ageing (ATOA), is another construct that has been used within the literature for many
1 See Diehl et al. (2015) for a brief historical overview on the various subjective ageing constructs as they
have been explored across different disciplines, along with the challenges and recent attempts at
integrating the constructs within a unified framework of the ageing self.
Page 23
5
decades as both synonymous with, and as a component of, SPA. It is generally
understood to reflect an individual’s satisfaction with their own ageing and expectations
about future ageing (O’Hanlon & Coleman, 2008; Westerhof et al., 2014). While it is
conceptualised as a multidimensional construct, the most widely used measure of
ATOA (see Chapter 3 for outline of measures) is unidimensional (Diehl et al., 2014). As
satisfaction with ageing has also been conceptualised within some research as a
dimension of SPA, along with the subjective age construct (Kotter-Grühn & Hess,
2012; Kotter-Grühn et al., 2009), the same measure that assesses ATOA has been
applied widely to studies of SPA (Kleinspehn-Ammerlahn, Kotter-Grühn, & Smith,
2008). Several other constructs have recently emerged2 however these are not
incorporated within any of the empirical studies reviewed in this thesis, and will
therefore not be described further.
While SPA operate at a pre-conscious, implicit level, they can be processed at a
conscious, explicit level when the context is self-relevant (Levy, 1996, 2009), as
becomes the case when people age. As such, it has been suggested that it is an
especially meaningful subjective ageing construct to explore, being described as the
“foundation upon which retrievable knowledge about one’s own aging process is based”
(Diehl et al., 2014, p. 100). This thesis operationalises SPA as comprising multiple,
theoretically defined dimensions, some of which are related to the constructs of
subjective age and satisfaction with ageing (see Chapter 3 for how these constructs are
related to the specific SPA dimensions being investigated within this thesis). Thus, the
terms subjective age and satisfaction with ageing will be used henceforth as reflecting
dimensions of SPA, and more specifically, subjective age will be used instead of age
identity while satisfaction with ageing will be used rather than the term ATOA.
2 The terms Awareness of Age-Related Change (AARC) and Awareness of Ageing (AoA) have recently
been proposed by Diehl and colleagues in an attempt to develop a more coherent and integrative
conceptual framework for examining the ageing self. The former refers to “all those experiences that
make a person aware that his or her behaviour, level of performance, or ways of experiencing his or her
life have changed as a consequence of growing older” (Diehl & Wahl, 2010, p. 340). The latter is
described as a superordinate construct, which comprises several related concepts, including SPA (Diehl et
al., 2014).
Page 24
6
1.3 General rationale
With the global population ageing, the health and wellbeing of older adults are now
regarded as key issues for researchers, policy makers and health service providers alike.
Australia has one of the highest life expectancies in the world which, coupled with low
fertility rates, means that the nation’s older population is increasing both in absolute
numbers and proportionally. Forecasts indicate that the number of Australians aged 65
years and over will increase from 2.7 million to 6.3 million over the next two decades,
accounting for 24 percent of the total population (Australian Institute of Health and
Welfare [AIHW], 2007). Across this same time period, considerable shifts within the
different older age strata will also occur as the ‘Baby Boomer’ generation, defined as
those born roughly between the years 1946 and 1965 (Australian Bureau of Statistics
[ABS], 2009), ages. It is anticipated that the number of adults aged 85 years and older
will grow at a faster rate than any other age group, increasing from 1.6 percent to 4.2
percent of the total population by 2036 (AIHW, 2014). These statistics present
significant challenges in real terms for current and future generations. An ageing
population has implications not only for the social, political, and economic development
of nations, but the health and wellbeing of older adults are also tied to the issue of
human rights (United Nations, Department of Economic and Social Affairs [UN
DESA], 2013).
While lifespans have increased at a population level, this does not speak to what has
been termed the healthspan, that is, disability free years of life (Depp & Jeste, 2006;
Depp, Vahia, & Jeste, 2010). Nor does extended life necessarily align with improved
quality of life. Presently, there are significant gaps in our knowledge regarding mental
health and wellbeing in older adults. Further research is required in order to inform
policy making decisions regarding, among other things, preventative health care and
implementation of efficacious, evidence-based interventions for older Australians. To
date, a compelling body of evidence linking SPA to mental health in older adult
populations has been published (see Chapter 5 for review) and the empirical findings
have been fairly unanimous; SPA are important for the mental health and wellbeing of
older adults. Nonetheless, there remain many questions to answer about SPA before
clinical treatments may be meaningfully realised. Two questions in particular have
provided the rationale for this thesis.
Page 25
7
The first and foremost question of interest regards the role that psychosocial
mechanisms may play in influencing the relationship between SPA and mental health. It
is widely recognised that both health and SPA are uniquely dependent on a range of
individual and contextual factors (Levy, 2003; Wurm et al., 2013) and that such factors
are in turn likely to influence the SPA-mental health relationship. Yet despite the
probability of psychosocial factors exerting an influence on this relationship, very few
researchers have sought to examine whether such factors might be mediating or
moderating the SPA-mental health association. Only a handful of studies (e.g. Hubley &
Hultsch, 1994; Levy, Slade, & Kasl, 2002; Levy, Slade, Kunkel, & Kasl, 2002; Sargent-
Cox et al., 2012a; Wurm & Benyamini, 2014; Wurm et al., 2013) have investigated
psychological pathways for the SPA-health association. Of these studies (see Chapter 5
for details), three focussed on the physical or functional health domains (i.e. mental
health was not explored). Further, those which included a measure of mental health as
the outcome variable did not explore SPA as a multidimensional construct. That is, SPA
were measured as either subjective age or physical losses associated with ageing. As so
few studies have been carried out in this area, there remain substantial gaps in our
understanding about how specific psychosocial mechanisms operate to influence the
SPA-mental health dynamic.
The second question which has motivated this thesis goes more broadly to whether a
self-regulation framework might be useful for conceptualising and examining the
experience of ageing within older, community-dwelling Australian adults. SPA are
understood to be a multidimensional construct however much of the research findings
stem from investigations which have used either unidimensional measures of SPA (for
example, satisfaction with ageing), or global evaluations, such as positive (e.g. growth)
and negative (e.g. physical declines) SPA (Barker et al., 2007). This is largely
attributable to the various conceptual approaches applied to the study of SPA, as briefly
outlined in Section 1.2.1. Further, while SPA are often conceptualised as a process
underpinning adaptation, and therefore an indicator of self-regulation and successful
ageing (Kleinspehn-Ammerlahn et al., 2008), such concepts were not incorporated into
any unified theoretical approach until very recently.
Barker and colleagues (2007) proposed a framework for conceptualising the
experience of ageing by adopting a self-regulation model which was originally applied
to experiences of illness and health. While this framework, and the multidimensional
Page 26
8
instrument (i.e. the Ageing Perceptions Questionnaire [APQ]: Barker et al., 2007) which
was developed from the theory (both of which are described in Chapter 3) has now been
applied to a number of studies overseas (e.g. European countries), it has received less
attention in Australia. Indeed, to the best of our knowledge, the APQ (Barker et al.,
2007) has only been adopted in one Australian study (i.e. Yarmo-Roberts et al., 2010)
where five of its subscales were included in a test battery of scales targeting care
package recipients. However, the population characteristics described within that study
(see Chapter 7 for participant characteristics) has differed from many of those described
overseas. Specifically, the sample comprised only frail older people living in the
community. At this point in time, it is unclear whether there might be similarities or
differences in SPA, as measured by the APQ, between a broader sample of community-
dwelling older Australians and their overseas counterparts, especially given that the
socio-cultural factors which inform SPA may produce cross-cultural differences
between the cohorts.
1.4 Research aims and questions
The overall aim of this thesis, motivated by the substantial gaps in knowledge
which currently exist in this field, is to better understand how certain psychosocial
mechanisms operate to influence the SPA-mental health relationship in older Australian
adults. Specifically, this thesis aims to understand whether coping resources might
account for how SPA influences mental health (i.e. as mediating variables), and whether
dispositional traits may help to explain for whom SPA has the strongest effect on mental
health (i.e. as moderating variables) (Hayes, 2013; Mackinnon & Luecken, 2008).
It is a further aim of this thesis to test whether a self-regulation model which has
recently been applied to the context of ageing, could be utilised to study SPA in older,
community-dwelling Australians. One of the core assumptions of this self-regulation
model (described at length in Chapter 3) is that coping mediates the relationship
between illness perceptions and adjustment to illness. Further, self-attributes such as
personality may moderate the self-regulation process (H. Leventhal, Leventhal, &
Contrada, 1998). Utilising this theoretical framework will enable the core aim of this
thesis, specifically, understanding the role of coping and personality in the SPA-mental
health relationship, to be explored while also testing whether a self-regulation model is
useful for examining the multidimensional nature of SPA in older, community-dwelling
Page 27
9
Australian adults. Individual differences in sociodemographic and subjective health
factors will also be examined to identify whether patterns of SPA in older Australian
adults replicate those reported elsewhere.
This thesis therefore aims to address the following research questions:
1. Is the self-regulatory framework adopted for this investigation an appropriate
model for understanding SPA in this sample of older Australian adults?
2. How are SPA related to sociodemographic factors (e.g. age, gender, income) and
subjective health status and will these relationships differ across groups?
3. How are SPA related to mental health and will these relationships differ by age
or self-rated health status?
4. How are SPA related to psychosocial factors (e.g. social support, generalised
optimism) and will these relationships differ by age or self-rated health?
5. Will coping mechanisms indirectly influence the relationships between SPA and
mental health over time?
6. Will dispositional traits moderate the relationships between SPA and mental
health?
1.5 Thesis structure
Prior to presenting and discussing the empirical findings of this thesis, it is first
appropriate to outline where this research is situated within the broader fields of health
and ageing. Chapter 2 provides the contextual landscape for investigating SPA in this
thesis. Specifically, this chapter summarises the ways in which health more generally
has been conceptualised within the literature and the frameworks which have been
developed in order to clarify and categorise health determinants, before describing how
mental health in particular is conceptualised within this thesis. As the SPA concept is
situated more broadly within the field of successful ageing and is understood to
underpin self-regulatory processes, the various ways in which these concepts have been
defined within the literature are also described before articulating how they will be
conceptualised within this body of work.
Chapter 3 provides an overview of the theoretical framework which has been
adopted to investigate SPA within this thesis and its application to an ageing context.
Specifically, the self-regulation framework employed to investigate ageing experiences
Page 28
10
in this thesis was originally applied to the field of health and illness. As such, a brief
overview of the model’s core features as initially conceived are outlined, before
describing how this framework is applied to an ageing context in order to investigate the
multiple dimensions of SPA. Further, because many of the studies reviewed in this
thesis have not utilised this self-regulation framework to investigate SPA, this chapter
also summarises the different ways in which ageing experiences have been
conceptualised and measured within the literature, and how these in turn relate to the
multiple dimensions of SPA as understood within the self-regulatory framework.
Finally, this chapter outlines how SPA will be measured in this thesis.
Chapter 4 focusses on the mental health and psychosocial variables of interest for
this thesis, with particular reference to older populations. The constructs of coping and
disposition are treated as mediating and moderating variables, respectively, in the
current body of work. As both of these constructs stem from extensive fields of
research, it is first necessary to summarise the various ways in which they have been
conceptualised before outlining how they will be defined in the current thesis. Further,
the mental health indicators, namely, psychological distress and subjective wellbeing
are defined, and the research in these areas as it pertains to older populations is briefly
summarised.
A comprehensive review of the literature regarding SPA and mental health in
older populations is provided in Chapter 5. Relationships between the SPA dimensions
and mental health are the focus for the first section of this chapter. This is followed by a
review of the findings regarding individual differences in SPA, in particular, the ways in
which sociodemographic characteristics, subjective health status, coping, and
dispositional traits have been found to relate to ageing experiences. The final section of
this chapter addresses the area of research which is most germane to this thesis; that is,
the psychological pathways between SPA and mental health. Chapter 6 focusses on the
current (albeit limited) research findings from intervention studies which have sought to
change SPA. Several possible avenues for future treatment approaches are presented
while considerations regarding the application of such treatments are also discussed.
The research methodology is outlined in Chapter 7. This includes descriptions of
the research design, sample characteristics, research procedure, and the measures
Page 29
11
utilised in the sample surveys at both Time 1 and Time 2. The ways in which missing
data was handled and the type of data analyses performed are also described.
Chapters 8 - 12 address separate research questions (presented as studies 1 - 5) yet
are not a series of discrete studies per se as they utilise the same participant survey data
acquired over two waves of data collection (repeated measures design). However, the
research questions are considered separately because the premise of each is derived
from the conclusions of the preceding study. In Chapter 8, the first research question
outlined in Section 1.4 is addressed by testing the psychometric properties of the APQ
(Barker et al., 2007) and then examining how these findings relate to those reported
from other studies which have also utilised this measure of SPA. Chapters 9 and 10 deal
with the research questions 2 – 4. Specifically, these cross-sectional investigations
examine how SPA are related to the sociodemographic, subjective health, mental health,
and psychosocial variables of interest, and explores how group differences might affect
these relationships. The statistically significant results from each of these studies are
stated and the implications of the findings discussed.
Chapters 11 and 12 (research questions 5 and 6, respectively) address the central
aim of this thesis. Specifically, the question of whether the relationships between SPA
and mental health will be indirectly influenced by coping mechanisms is first tested
cross-sectionally in a series of exploratory mediation analyses (Chapter 11).
Residualised change scores for the SPA, coping, and mental health variables are then
assessed to determine change within individuals. These change scores are utilised in a
second series of mediation analyses (at 12-month follow up) to assess the pattern of
these relationships over time. Chapter 12 targets the question of whether dispositional
traits moderate the relationships between SPA and mental health. In particular, this
chapter explores how neuroticism interacts with the SPA dimensions to predict life
satisfaction, and how generalised optimism interacts with the SPA dimensions to predict
psychological distress. The results from these exploratory investigations are stated and
considerations for future research are discussed.
The General Discussion in Chapter 13 summarises the key research findings of
this thesis and then follows this up with a discussion of the theoretical and clinical
implications of the findings. Strengths and limitations of the thesis are discussed and
Page 30
12
possible future research avenues which could extend on these doctoral research findings
are identified. The conclusion to this thesis is then stated.
Page 31
13
Chapter 2 Foundational concepts
Page 32
14
2.1 Introduction
The experiences, beliefs, and expectations that one holds about their own age and
the ageing process are not only informed by, and constructed from multiple factors (as
described in Section 3.2) but are also situated within a much broader framework of
health and ageing. This aim of this chapter is to provide the contextual landscape for the
investigation of SPA by briefly outlining the related concepts of mental health,
successful ageing, and self-regulation. It is not the intent to review these concepts at
length (which is far beyond the reach of this thesis) but rather, to broadly discuss how
they have been conceptualised within the literature.
Given the associations found between SPA and health (see Chapter 5), this
chapter aims to clarify what is meant by the term health by first outlining some of the
key models of health more broadly, including a description of health determinants (as
distinguished from health) before discussing how mental health in particular (which is
the focus of this work) will be conceptualised within this thesis. Further, SPA are
considered a measure of successful ageing, and consequently, a brief overview of the
definitions currently employed in the successful ageing literature will be discussed, and
the definition this thesis speaks broadly to will be articulated. Finally, the conceptual
framework being employed to investigate SPA within this thesis (see Chapter 3), and
the psychosocial mechanisms (i.e. coping and dispositional traits: described in Chapter
4) hypothesised to indirectly influence the relationship between SPA and mental health,
all go to broader self-regulatory processes of adaptation. Therefore, this chapter will
conclude with an overview of the concept of self-regulation and the definition which is
most pertinent to this study.
2.2 Health
2.2.1 Conceptualisations of health
The current generation of older adults are living longer than any of their
predecessors, yet such increases in longevity do not necessarily equate to improved
health outcomes. Health is a complex, multi-faceted construct that has been interpreted
in various forms across different individuals and cultures (AIHW, 2014). However, four
models for conceptualising heath have been particularly dominant: the biomedical
model, the holistic model, the wellness model, and the environmental/ecological model
Page 33
15
(Larson, 1999). While there remains debate about what exactly constitutes good versus
poor health, there is general consensus that the biomedical approach, which focusses on
the presence or absence of disease or disability alone, is too narrow a definition to
adequately encapsulate the concept. For instance, it has been criticised on the grounds
that it does not accommodate emotional, psychological, or social problems well, it de-
emphasises preventative medicine, and it largely ignores the social determinants of
health and illness, instead treating people (or disease) in isolation to their environment
(Larson, 1999). Further, this approach stresses objective measures of health at the
expense of subjective meaning.
In 1946, the World Health Organization (WHO) proposed a more holistic
approach, defining health as “…a state of complete physical, mental and social well-
being and not merely the absence of disease” (WHO, 1946, p. 1). This definition, while
recognising that living disease free is not a sufficient condition for health, has also
received several criticisms. First, in contrast to the biomedical model, the WHO
definition has been described as too broad, not taking into account different cultural
definitions of health. Second, its terms (e.g. wellbeing and social wellbeing) have been
disparaged for being too vague or poorly defined and therefore problematic for
measurement (although some note that this criticism refers more to the subjective nature
of assessment rather than lack of wellbeing measures) Third, it has been heavily
criticised on the grounds that it is both unrealistic and unnecessary to live in a complete
state of wellbeing to be healthy. This is particularly salient when considering ageing in
the 21st century, whereby chronic (not acute) illness and disability is largely the norm,
given increasing lifespans. Indeed, chronic disease, which accumulates over years and is
therefore most prevalent in older adults, is a leading cause of disability in Australia, and
accounted for 90 percent of all deaths in 2011 (AIHW, 2014). Fourth, it is now
understood that health is a process rather than a fixed state; health is held to be dynamic
in nature (M. Huber et al., 2011; Larson, 1999). Despite these and other criticisms, the
holistic model remains one of the most popular approaches to defining health.
Since the 1970’s, individual, cultural and ecological factors have been
incorporated into models of health to provide a more complex and comprehensive
picture. These models recognise that people do not live in vacuums, but that health is
shaped and determined by multiple interactions between social-environmental factors
and mind and body variables. The wellness model, which was advanced in the 1986
Page 34
16
Ottawa Charter for Health Promotion (Nutbeam, 1998), goes to health promotion and
maintenance. Health is framed as a resource which comprises psychological, social,
spiritual, and contextual dimensions. Similarly, the environmental/ecological model
emphasises adaptation to environmental (e.g. physical, social) surroundings (Larson,
1999). These frameworks recognise the multiple levels of influence on health, with
particular emphasis on environmental and policy contexts of behaviour (Sallis, Owen, &
Fisher, 2008). While there are advantages in both of these models, namely, they
recognise the importance of including other domains of functioning (e.g. psychological,
social) while acknowledging the complex interaction among the multiple factors (e.g.
biological, psychological, socio-cultural, environmental) (AIHW, 2014), they have also
been criticised for being too broad, using ambiguous terms, and not clearly
distinguishing between the concept of health and determinants of health.
The concept of health has evolved over many years, and to date, a consensus on a
uniform definition remains elusive. Nonetheless, each model described above has
contributed to its development, and going forward, will likely (perhaps with the
exception of the biomedical model) be incorporated into newer definitions of health
(Larson, 1999). The wellness and ecological models are perhaps most germane to this
thesis, as they emphasise the importance of viewing health on a spectrum, while also
recognising it as a dynamic resource, with temporal shifts across the different
dimensions. This is an especially relevant issue when examining the health of older
adults, whereby decreases in some areas of health may be compensated for in other
areas, or equally, cause impairment in other areas of health. Both of these effects were
shown in one prospective population-based study of 889 older English adults (Prince,
Harwood, Thomas, & Mann, 1998). Disability (primarily physical handicap) was found
to be a predictor of depression, highlighting how one dimension of health can impair
another. Poor social engagement was also identified as a direct risk factor for increased
depression however with increased social contact the excess risk was reduced. In this
instance, social contact played a buffering role: a psychosocial health resource which in
part compensated for losses in the physical domain.
2.2.2 Determinants of health
In simplest terms, health determinants are those factors which either enhance or
threaten the health status of an individual or society more broadly (WHO, 2004). At any
Page 35
17
point throughout an individual’s lifetime, his or her health status will be influenced by a
multitude of variables which might serve to increase the risk for experiencing poor
health or illness, or to protect against such occurrences. The scope for analysis of health
determinants is large, ranging from molecular through to societal level factors (AIHW,
2014), and as a consequence, research on the topic has been drawn from multiple
disciplines. The interplay amongst the various biological, behavioural, environmental,
socioeconomic, social and psychological determinants to produce health-related
outcomes is also significantly complex, akin to the complex nature of health more
generally. In efforts to understand the contributions, both distal and proximal, that these
determinants have for particular health outcomes, and to explore the inter-relationships
between the various factors, a number of conceptual frameworks (e.g. AIHW, 2014;
Dahlgren & Whitehead, 2007; Shi & Zhong, 2014; Solar & Irwin, 2010) have been
developed to aid in the clarification and categorisation of the determinants of health.
Such frameworks reflect current understandings about health, namely, that factors
which determine the health status of individuals and populations3 operate within
complex systems and across multiple tiers. The understanding that human gene
expression is shaped by exogenous social-environmental factors is now generally
accepted (Cole, 2014) and models around the social determinants of health have been
widely adopted. Broadly, they specify connected yet distinct layers of influence on
health (Dahlgren & Whitehead, 2007), from the innate makeup of the individual (e.g.
sex, genetics), through to individual lifestyle (e.g. behaviours, psychology), community
(e.g. socioeconomic environments, health care services, social network), and broad
societal levels (e.g. economy, policies, culture, norms). Of particular interest for policy
makers and health service providers is the question of which modifiable factors to target
through intervention to produce the most desirable health outcomes. Certain innate
3 Arah (2009) argues that the concepts of individual and population health are not “identifiable or even
definable without informative contextualization within the other” (p. 235). That is, they operate in a
largely relative and dynamic manner over the life course to determine the health of both the collective and
the individuals who comprise the collective. In his article, Arah summarises two distinct positions on
population health; one which views it as a “summary of health, aggregated across individuals within a
population” (p. 238) and the other which views it as “the indivisible health experience of a collective of
individuals, where this collective is taken to be distinguishable from a mere collection or summation of
individuals” (p. 239). The second position is one which informs the understanding of health in this thesis.
Given the complex and dynamic interplay of causal factors which shape health over the life course,
individual and population health can be understood as complementary concepts.
Page 36
18
characteristics of the individual (i.e. genetics) are deemed ‘fixed factors’ (Dahlgren &
Whitehead, 2007) insofar as they are generally outside of any control. There is,
nonetheless, significant scope for intervention across the layers, whether by the
individual (e.g. behavioural change) or collectively (e.g. structural changes to
environment or socioeconomic situations), although the latter does require policy and
economic reforms that are generally beyond the control of the individual (Shi & Zhong,
2014). Central to implementing the most effective interventions, however, is identifying
which factors have the greatest influence on particular health outcomes, and how these
interact with one and another within and across the layers of influence.
2.2.3 Mental health
Mental health has been defined as:
A state of well-being in which an individual realizes his or her own abilities, can
cope with the normal stresses of life, can work productively and fruitfully, and is
able to make a contribution to his or her community (WHO, 2004, p. 12).
This conceptualisation of mental health not only acknowledges positive processes
(e.g. realising one’s potential) and resources (e.g. coping) for psychological and
emotional functioning4, it also views mental health as central to an individual’s
wellbeing. Indeed, it is often argued that “there is no health without mental health”
(WHO, 2005, p. 11), as mental, physical, and social health and wellbeing are
fundamentally and inextricably linked (i.e. interdependent). Notably, the WHO
definition of mental health makes no reference to mental illness. While the terms mental
health and mental illness (or disorder) are often bandied around interchangeably in the
public domain, current research (e.g. Greenspoon & Saklofske, 2001; Keyes, 2005;
Westerhof & Keyes, 2010) suggests that they are two related yet distinct constructs, the
former focussing on subjective wellbeing and the latter on psychopathology. Within this
framework, it is still possible to experience high levels of mental health with a mental
illness or conversely, to experience low levels of mental health with no mental illness
(Wang, Zhang, & Wang, 2011). Viewing mental health and illness on separate continua,
4 The terms psychological health, emotional health, and mental health will be used interchangeably
hereinafter.
Page 37
19
each of which generates their own positive and negative states, facilitates greater
understanding about the complexities associated with mental functioning. Further,
recognising mental health and illness as discrete constructs is not merely an academic
exercise. Poor subjective wellbeing, even in the absence of a mental disorder, can leave
people vulnerable to developing mental illness at a later stage (Wang et al., 2011),
possibly through increased functional impairment and psychological distress.
Consequently, another key indicator of mental health, in addition to subjective
wellbeing, is psychological distress (Drapeau, Marchand, & Beaulieu-Prévost, 2011).
Psychological distress is a rather ambiguous term (see Section 4.3.1) and consequently,
its relationship to mental health and illness has been the subject of great debate within
the literature. Some researchers (e.g. Mirowsky & Ross, 2002) conceive psychological
distress as sitting on a continuum with mental health (while viewing disorder as a
socially constructed term to benefit the psychiatric and pharmaceutical industries: see
Mirowsky, 2007). Other researchers (e.g. Wheaton, 2007) contend that it sits on the
same continuous distribution as mental disorder. Another position (e.g. Horwitz, 2007;
Wakefield, Schmitz, First, & Horwitz, 2007) is that psychological distress and mental
disorder sit on discrete continua. Payton (2009) empirically tested these various theories
and reported that each (i.e. mental health, mental disorder, and psychological distress)
are discrete concepts however psychological distress was related to both the other two
constructs. The association between these concepts is an ongoing debate which has yet
to be resolved. Nonetheless, within this body of work, both subjective wellbeing and
psychological distress are viewed as key measures of mental health because both
attempt to capture how people are able to realise their potential, cope with everyday
stressors, work productively, and contribute to their communities (i.e. the WHO
definition of mental health). Thus, an optimal state of mental health would be measured
as high subjective wellbeing and low psychological distress.
Determinants of mental health are numerous and, as with health determinants in
general (described above), comprise multiple social, psychological, and biological
factors which operate across multiple tiers (e.g. individual, local, societal). Some of
these factors, for instance, socioeconomic pressures (e.g. poverty, poor access to
education), discrimination and social exclusion, poor access to health services, violence
and human rights violations (WHO & Calouste Gulbenkian Foundation, 2014), are less
easily modified by any one individual, instead requiring concerted political, economic,
Page 38
20
and social reforms. Yet there are also many factors which may be modifiable by the
individual to influence mental health and wellbeing. Identifying which of these are more
readily amenable to change is therefore an important goal for researchers.
The task of identifying mental health determinants in older populations can be
somewhat more complex than in younger populations because health is a process which
occurs over a lifetime (Aldwin, Spiro, & Park, 2006). That is, current mental health
status will be influenced by recent experiences and conditions, as well as the cumulative
effects of experiences over a lifetime (WHO & Calouste Gulbenkian Foundation, 2014).
Further, this lifetime of experiences leads to significant heterogeneity within older
populations (WHO, 2015), which has been one of the criticisms aimed at the successful
ageing paradigm more generally (as discussed in Section 2.3). Nonetheless, while
research (e.g. Lowsky, Olshansky, Bhattacharya, & Goldman, 2014) recognises the
inter-individual heterogeneity in ageing and health in older age cohorts and
increasingly, that chronological age is not a good marker of either per se, there will also
be a degree of homogeneity given the parameters of development across the life course.
As Schulz and Heckhausen (1996) observe, biological development does follow a
sequential pattern, with resources resembling an inverted U-shape (e.g. cognitive and
physical abilities increasing during childhood, plateauing in adulthood, and decreasing
in older age). Thus, examining the role of specific modifiable determinants of mental
health in older people is a meaningful task. Psychosocial mechanisms (e.g. personality,
coping, and belief structures: discussed in Chapters 3 and 4) have been identified as
such, and therefore warrant further attention by researchers.
Unfortunately, the personal, social and economic cost of poor mental health
functioning is likely underestimated by policy makers due to the attention directed
towards disease states. Governments utilise estimates of disease burden as a tool for
quantifying population health needs, developing policy, service planning, and funding
allocation (AIHW, 2014). In many respects, this has been beneficial for the mental
health sector, as national and global data both highlight the considerable contribution
that mental disorder independently make towards disease burden. For example, the most
recent Global Burden of Disease Study (GBD 2010: Whiteford et al., 2013) estimated
Page 39
21
that mental and substance use disorders accounted for 7.4 percent of disease burden
worldwide, placing fifth in terms of global disability-adjusted life years (DALYs5) and
being the leading cause of non-fatal disease burden. Depressive disorders contributed
the highest proportion of the total burden of mental disorder, followed by anxiety
disorders. The AIHW (2016) has recently published data from the 2011 Australian
Burden of Disease Study. Consistent with global trends, mental and substance use
disorders ranked third (12 percent of total DALYs) in the top five most burdensome
groups of diseases, and were the greatest contributor to non-fatal burden. Such data
cannot be ignored by governments. Yet they do not capture the losses associated with
poor mental health indicators such as low wellbeing or psychological distress. This is
meaningful in the context of current research findings, which suggest that while older
cohorts may experience less mental illness than their younger counterparts, they may
also report lower wellbeing on certain measures (e.g. Westerhof & Keyes, 2010).
While the focus of this thesis is mental health in older adults, implicit in this body
of work is the understanding of the complex interplay between mental health and the
other health domains. Physical disease and disability become more prevalent as
individuals age, particularly among the ‘oldest-old’ cohort (80+ years). Increasing age is
also associated with some declines in physical and cognitive health (Schulz &
Heckhausen, 1996), as well as other age-related social health losses, for example,
bereavement or changes in social roles (e.g. caregiver to recipient of care, employee to
retiree etc.). Such changes in physical or social health domains may influence mental
health in multiple direct and indirect ways, for example, by influencing the individual’s
perceptions of their ageing selves which in turn may influence other health factors. At
present, however, there is sparse and often contradictory evidence around the mental
health functioning in older populations, and the relationships between the
interdependent health components. To this end, there has been a rapid growth in studies
looking to establish what differentiates those older adults who report good mental health
5 A health gap measure adopted for the first Global Burden of Disease (GBD) study (Murray & Lopez,
1996). It is a measure of the gap between “current health status and an ideal health situation where the
entire population lives to an advanced age, free of disease and disability” (UN DESA, 2013, p. 83). It is
calculated as the sum of Years of Life Lost (YLL) to premature mortality and Years Lived with Disability
(YLD). One DALY represents the loss of one year of a healthy life (Ferrari et al., 2013).
Page 40
22
and wellbeing from those that do not. Much of this research sits within the broader field
of successful ageing.
2.3 The successful ageing paradigm
Over the past three decades, there has been a marked shift away from
unidimensional decline models of ageing and a proliferation of theories around the
successful ageing paradigm6 (e.g. P. B. Baltes & Baltes, 1990; Carstensen, 1991;
Charles & Piazza, 2009; Kahana & Kahana, 1996; Labouvie-Vief, 2009; D. J. Martin &
Gillen, 2013; Rowe & Kahn, 1987, 1997; Schulz & Heckhausen, 1996) which has
enabled researchers from various disciplines to explore ageing through a more nuanced
lens. Nevertheless, despite best efforts, there is no unanimous agreement on a definition
of successful ageing, as evidenced in one review (Depp & Jeste, 2006) that identified 29
different definitions across 28 studies. What is generally agreed upon is that longevity
itself is not a sufficient marker of successful ageing. Given that chronic illness has now
overtaken acute illness as a leading health threat within Australia and other developed
nations (AIHW, 2014) yet the maximum lifespan has remained fairly consistent, it has
been hypothesised that it is possible to postpone the disabling effects of disease and
disability through lifestyle, thereby compressing morbidity7 to the end stages of life
(Fries, 1980). Several longitudinal studies of ageing from across the world (for instance,
the Berlin Aging Study and the MacArthur study of aging) have provided some support
for this hypothesis, reporting that alongside increased longevity, there has been a
significant reduction in the functional decline of older adults over the last 30 years
6 Various other labels have been used to describe similar phenomena within the literature, including
optimal ageing, active ageing, ageing well, positive ageing, competent ageing, robust ageing and healthy
ageing (Depp et al., 2010; Montross et al., 2006; Renehan et al., 2012; Schulz & Heckhausen, 1996;
Villar, 2011). 7 Fries (1980)described two sets of observations as informing his compression of morbidity (COM)
hypothesis. First, that while average lifespans have increased, the maximum lifespan has remained
constant (at around 90-100 years of age: Cutler, 1990). Thus, life is finite. Fries described how biological
resources which serve to maintain a state of homeostasis within human organisms show an almost linear
decline after people reach the age of 30. Therefore, while natural death is possible at the end of a
disability free life, a disease process still occurs to break down biological structures within organisms.
Second, that chronic disease and other markers of ageing may be postponed or modified through factors
such as better access to health care, lifestyle factors (i.e. increased physical activity), and preventative
medicine. Fries specified some caveats to his hypothesis, mentioning factors such as war, economic
depression, and natural disaster as influencing lifespan and quality of life. However, in recent decades,
other factors have emerged which will likely influence our ability to compress the length of functional
disability (Mor, 2005), most notably, the emerging global obesity epidemic, which is now a major health
problem in both developed and developing nations (Caballero, 2007).
Page 41
23
(Bowling & Dieppe, 2005; Mor, 2005). While there remains debate around whether
disability can truly be postponed (see Mor, 2005), the compression of illness to the end
of long lives may be one biological marker of successful ageing which is somewhat
attainable. Yet many, including older populations themselves, have argued that this in
itself may not provide a complete picture of successful ageing.
Two key approaches for investigating the successful ageing paradigm have
emerged in recent years; biomedical models that adopt objective criteria to assess the
state of ageing, and psychosocial models which focus on the adaptive processes of
ageing (von Faber et al., 2001). Arguably, the most influential biomedical approach was
proposed by Rowe and Kahn (1987, 1997) who reasoned that dividing older populations
into pathologic versus normal groups imposes serious limitations, not only because it
fails to recognise heterogeneity within the non-pathologic group but also because, by
emphasising normality, it implies that this group is at low risk and that many changes
are age-determined, natural, and thus, for the most part, non-modifiable. Instead, Rowe
and Kahn (1987) argued that distinguishing groups within the non-diseased population
as usual (non-pathologic but at high risk of disease and disability) and successful (non-
pathologic and at low risk of disease and disability) allows researchers to explore the
differences between these groups and to establish where intervention (e.g. modification
of lifestyle) might be most beneficial for usual agers. Rowe and Kahn developed criteria
for successful ageing which included three core components: (i) low probability of
disease and disease risk-factors, (ii) high cognitive and physical functioning, and (iii)
active engagement with life (1997).
The Rowe-Kahn definition of successful ageing has been employed extensively in
studies of successful ageing over the intervening decades (Andrews, Clark, & Luszcz,
2002) however it has not been without its critics. One argument is that this set of largely
medically defined criteria emphasises individual lifestyle while neglecting broader
contextual factors such as those identified within a social determinants of health
framework (Katz & Calasanti, 2014: see Section 2.2.2). In doing so, it shifts
responsibility for outcomes on to the individual, overlooking the importance of, among
other things, social structural inequalities. This has led some to characterise Rowe and
Page 42
24
Kahn’s criteria as elitist (Lupien & Wan, 2004). Further, it has been argued that only a
minority of older adults will meet these restrictive criteria for success, which in effect
labels large proportions of older adults who do not fit the criteria as failures8, a criticism
which has also been directed at the successful ageing paradigm more generally (Katz &
Calasanti, 2014). A number of other concerns around Rowe and Kahn’s criteria for
successful ageing have been raised within the literature (for reviews, see Katz &
Calasanti, 2014; Scheidt, Humpherys, & Yorgason, 1999) however three are
particularly salient to this thesis.
The first core argument against adopting a solely biomedical approach is that the
views of older adults themselves tend to be overlooked (Phelan, Anderson, LaCroix, &
Larson, 2004). If definitions employed for successful ageing are incongruent with the
views of the population it is investigating, this is problematic for implementing
effective, meaningful interventions. In studies where subjective views of older adults
are included, many rate themselves as having aged successfully, despite only a minority
meeting the Rowe-Kahn criteria (Bowling & Dieppe, 2005; Strawbridge, Wallhagen, &
Cohen, 2002). Further, when asked what defines success, many older adults emphasise
psychosocial factors such as social functioning and wellbeing (Phelan et al., 2004; von
Faber et al., 2001). A second criticism goes to the question of how realistic it is for
older people to live completely free of disease or some impairment in physical function.
Studies of centenarians suggest that this criticism is justified as it is extraordinarily
difficult, if not impossible to reach the limits of old age without disease or some degree
of disability (Young, Frick, & Phelan, 2009). The third criticism of the Rowe-Kahn
criteria that speaks to this thesis is that it largely ignores developmental perspectives on
ageing, which suggest that, rather than merely maintaining one’s health status that was
established during earlier life stages, older age is also a time of adaptation, in which
both losses and gains may co-occur (Villar, 2011). By contrast to the biomedical
approach, psychosocial approaches view ageing as a dynamic process of adaptation in
which subjective experiences are recognised (Bowling & Dieppe, 2005; Villar, 2011).
8 Kahn (2004) notes that success is a matter of degree, and therefore limitations in one of the three
domains specified in the Rowe and Kahn model does not necessarily diminish one’s capacity for ageing
successfully. Kahn elaborates by stating that to “succeed is to flourish, not necessarily to attain
perfection…Less than perfection is not a failure” (p. 3).
Page 43
25
Many of the successful ageing models that recognise the importance of
psychosocial factors, including the ability to adapt to evolving circumstances, stem from
broader lifespan theories of development (e.g. P. B. Baltes & Baltes, 1990;
Brandtstädter & Rothermund, 2002; Heckhausen & Schulz, 1995; Schulz &
Heckhausen, 1996). While these theories diverge on issues such as which processes are
relevant for adaptation and how these work (Villar, 2011), or in what context they
actually are adaptive, they all share the view that there are two fundamental
requirements of developmental regulation; namely, that goal investment needs to be
selective and that failure and loss are met with compensatory means (Heckhausen,
Wrosch, & Schulz, 2010). These two processes operate across the life course however
they are especially salient for determining how well an individual ages. This is because,
while developmental plasticity occurs across the entire life course, it is bound by
increasing biological vulnerability and associated losses in finite internal and external
resources as people age (P. B. Baltes, Staudinger, & Lindenberger, 1999). Selectively
choosing which goals to pursue enables more efficient use of resources in order that
levels of functioning are either maintained or enhanced (Heckhausen et al., 2010;
Lupien & Wan, 2004). In response to setbacks, losses, and failures, compensation
strategies enable the individual to maintain functioning through, for instance,
substituting the means by which to reach a goal, readjustment of the goal, or
counteracting against negative affect and self-evaluation induced by failure (P. B. Baltes
et al., 2006; Heckhausen et al., 2010).
Together, these self-regulatory processes help people to age successfully by
maximising gains and minimising losses (P. B. Baltes & Baltes, 1990). Psychosocial
theories in general, however, are not without their limitations, particularly as they often
exclude biological and cognitive criteria (Lupien & Wan, 2004). Indeed, the different
approaches might best be thought of as complementary (Depp et al., 2010), whereby
successful ageing is recognised as both a state and a process. The WHO includes
aspects of both approaches into their definition of active ageing, including the “process
of optimizing opportunities for health…to enhance quality of life” and the realisation of
“potential for physical, social, and mental well-being throughout the life course” (WHO,
2002, p. 12).
The successful ageing paradigm has played an important role in expanding ideas
about ageing, regardless of the approach applied to the research. Certainly, there is an
Page 44
26
argument for the inclusion of both objective and subjective evaluations. However, the
aim of this thesis is to explore a specific psychological measure of successful ageing,
namely, SPA (see Chapter 3), and its relationship to other psychosocial variables (i.e.
coping and disposition: described in Chapter 4) and mental health. Depp et al. (2010)
cite a number of reasons why an increased focus on psychosocial health for successful
ageing is warranted. It is generally understood that psychological constructs are fairly
amenable to change and that psychosocial resources may strengthen adaptive processes.
As such, increasing our knowledge about how such constructs relate to mental health
and the underlying processes will pave the way for developing and implementing more
efficacious treatments to enhance the lives of older adults. However, perhaps more
importantly, older adults themselves frequently identify psychological rather than
physical constructs as phenotypes of successful ageing. As such, this may have greater
predictive validity for how older populations adapt to age-related challenges, that is, as
self-regulating organisms.
2.4 Self-regulation
To function effectively when faced with changing environmental demands
requires the ability to actively adapt cognitions, emotions, and behaviours to meet a
desired outcome (Cameron & Leventhal, 2003). It is this ability to self-regulate that
affords humans an “adaptive edge” over other species (Zimmerman, 2005, p. 13). While
self-regulation is understood to play a vital role in our adaptive abilities, Boekaerts,
Pintrich, and Zeidner, (2005) observe that it has been a challenging construct to define
theoretically. As such, the literature is vast and replete with different definitions drawn
from across a variety of disciples. What is generally agreed upon is that much of human
behaviour is intrinsically purposeful and goal directed (E. A. Leventhal, Brissette, &
Leventhal, 2003). Self-regulation is therefore best defined as an umbrella term which
describes the various volitional processes involved in pursuing and attaining goals
(Mann, de Ridder, & Fujita, 2013).
The basic features of all self-regulation theories include goal setting, goal striving,
feedback loops, and self-appraisal (Wrosch, Dunne, Scheier, & Schulz, 2006; Zeidner,
Boekaerts, & Pintrich, 2005). While goal constructs may differ slightly depending on
the conceptual approach, theorists generally converge on the idea that goals energise
and direct efforts towards a desired outcome which is meaningful to the individual (de
Page 45
27
Ridder & de Wit, 2006). Beyond these basic tenets, however, there are many differences
among the major theoretical approaches to self-regulation. Various definitions focus on
singular traits, abilities, or stages of competence (Zimmerman, 2005). For instance,
stage theories of change (e.g. the Transtheoretical Model: Prochaska & DiClemente,
1984) posit that people transition through various distinct stages in order to effect
behaviour change. Some have argued that the terms used for these models are rather
ambiguous, and they do not clearly articulate the change process or strategies for goal
pursuit (de Ridder & de Wit, 2006). Another example, albeit one currently under great
scrutiny (see Carter, Kofler, Forster, & McCullough, 2015; Carter & McCullough,
2013, 2014; Job, Dweck, & Walton, 2010; Lurquin et al., 2016), is found in the strength
model of self-control (Baumeister, Bratlavsky, Muraven, & Tice, 1998; Baumeister,
Vohs, & Tice, 2007; Muraven & Baumeister, 2000; Muraven, Tice, & Baumeister,
1998) which defines self-regulation as the ability to exert self-control, a limited resource
in itself that becomes depleted through any act of self-control. Thus, the availability of
self-regulatory resources for any other self-control task is diminished. Numerous other
theories of self-regulation can be found within the literature, stemming from a broad
range of disciplines. For an overview of some of these different approaches, see
Boekaerts, Pintrich, and Zeidner (2005).
The self-regulation theory adopted for this thesis (detailed in Chapter 3) goes to a
social cognitive process approach. Unlike the examples noted above, social cognitive
perspectives define self-regulation as cognitive and affective processes that operate in
parallel to govern a myriad of inter-reacting and inter-relating personal, behavioural,
and environmental variables (Haug, Musil, Warner, & Morris, 1998; Zimmerman,
2005). Personal agency, notably intentionality, forethought, self-reactiveness, and self-
reflection, is a core feature of such process definitions (Bandura, 2001). While social
cognitive approaches describe internal processes of the self as the principal motivating
determinants for controlling behaviour (H. Leventhal et al., 1998), it is recognised that
these are contextually-related self-processes (Bandura, 2001). Specifically, individuals
cannot be disassociated from their broader socio-cultural contexts as self-regulatory
processes operate within these contexts (Woo & Frisbie, 2004). Further, in contrast to
the strength model definition, process definitions are able to account for how people
may self-regulate to one type of performance but fail to do so for another (Zimmerman,
2005). Nonetheless, for older adults, dysfunctions in self-regulating to challenges
Page 46
28
associated with their own ageing experiences may result in knock-on effects to other
areas of functioning, such as mental health, which in turn may translate to less healthy
or successful ageing outcomes.
2.5 Summary
Over the years, numerous definitions of health have been proposed, reflecting the
complex and multifaceted nature of the construct. Contemporary conceptualisations
recognise that health is a dynamic resource in which multiple, interrelating dimensions
are shaped and determined by interactions with broader social-environmental systems.
The focus of this thesis is the domain of mental health (also referred to within the
literature as psychological health or emotional health) rather than disease states (mental
illness). Psychosocial mechanisms have been identified as important determinants of
mental health as they may be more readily modifiable at the individual level than other
factors, such as socioeconomic conditions which require more societal level structural
changes. Further, older adults themselves emphasise the importance of psychosocial
factors in adapting to age-related challenges and demands, which is an important
consideration for the current investigation and to the concept of successful ageing more
broadly.
Examining the influence of psychosocial factors on mental health, via direct and
indirect pathways, is important for expanding our (currently limited) knowledge base
regarding mental health functioning in older populations. Further, because
psychological constructs are generally considered amenable to change and may
strengthen adaptive processes such as self-regulating abilities, shedding light on how
these mechanisms operate to influence mental health is necessary to ensure that any
clinical treatments or preventative health measures developed in the future are
efficacious. Chapter 3 outlines the specific theoretical framework which has been
adopted for this thesis to examine such self-regulatory processes in the context of
ageing. This model informs how SPA are conceptualised and measured within the
current body of work.
Page 47
29
Chapter 3 A theoretical framework for investigating SPA
Page 48
30
3.1 Introduction
The aim of this chapter is to provide an overview of the theoretical framework
adopted to investigate SPA within the current study. The first section of this chapter will
describe how SPA are formed and shaped, and how this may be understood within a
social cognitive approach to self-regulation. This is followed with a brief outline of the
specific self-regulation model adopted for this thesis as it was initially conceived and
applied to the field of health and illness. Originating over three decades ago, this
particular model provides a very detailed framework for studying health and illness
behaviour, having been updated and reorganised by the authors over subsequent years
(H. Leventhal et al., 2012). At the core, it describes three stages of the self-regulatory
process (i.e. illness perceptions, coping procedures, and appraisal). However, the full
model as applied to health and illness is not relevant to the current study of SPA, and as
such, an abridged description of the model is provided. For a comprehensive account of
the model for health and illness, see H. Leventhal et al. (2012) and H. Leventhal et al.
(1998).
The final sections of this chapter focus on the ways in which this particular model
of self-regulation is applied to field of ageing, and how SPA are measured. More
specifically, as the self-regulation model focusses on particular dimensions of SPA,
these will be described and any related or overlapping dimensions (see Section 1.2.1)
will also be discussed and defined for this body of work. Further, the instruments that
have been most commonly used to assess the various dimensions will be outlined before
justifying the selection of and describing the instrument adopted for use in the current
study (which was developed in tandem with the theoretical framework utilised for this
thesis).
3.2 The formation of SPA
There are multiple individual (e.g. personality traits, values, somatic experiences)
and socio-cultural (e.g. societal structures, cultural norms, mass media) factors which
inform how an individual conceptualises their own ageing experience (Levy, 2003;
Steverink et al., 2001; Westerhof & Wurm, 2015) however it is widely acknowledged
that age stereotypes play a significant role in the formation of SPA. Drawing on several
decades of research regarding beliefs about older adults, Levy’s (2009) stereotype
Page 49
31
embodiment theory outlines how age stereotypes (e.g. helpless, frail, wise) are
internalised from a very young age, often operating outside of conscious awareness, and
gain salience from self-relevance when the individual begins to identify as the old
‘other’. It is at this point, Levy contends, that age stereotypes are assimilated into one’s
self-concept and can be termed SPA (2009).
The stereotype embodiment theory (Levy, 2009) holds that age stereotypes utilise
psychological, behavioural, and physiological pathways to exert their influence.
Empirical support for each of these pathways has been found. For instance, the
psychological pathway has been demonstrated across numerous studies (e.g. Abrams et
al., 2008; Abrams, Eller, & Bryant, 2006; Barber & Mather, 2013; Coudin &
Alexopoulos, 2010; Eibach, Mock, & Courtney, 2010; Hess & Hinson, 2006; Horton,
Baker, Pearce, & Deakin, 2008; Kotter-Grühn & Hess, 2012; Levy & Leifheit-Limson,
2009; Levy, Zonderman, Slade, & Ferreira, 2012; Levy, 1996; Mazerolle, Régner,
Morisset, Rigalleau, & Huguet, 2012; Pinquart, 2002) where older people have been
primed with either positive or negative stereotypes about ageing. These primes have, in
turn, influenced performance on a range of cognitive and physical tasks, as well as on
other areas of functioning, some of which operate outside of an individual’s awareness
(see, for example, the Levy, Hausdorff, Hencke, and Wei (2000) study where priming
with positive ageing stereotypes was associated with reduced cardiovascular stress).
Such studies demonstrate the robust and, at times insidious nature of age stereotypes
that inform how people perceive and interpret their own ageing. For a comprehensive
review of ageing stereotypes and their influence on the health of older adults, see
Dionigi (2015).
3.3 Self-regulation in the context of ageing
As described in Section 2.4, a social cognitive approach to self-regulation
recognises that while goals are self-generated, they are guided by the need for the
individual to adapt to the environment, and are therefore influenced by a range of
contextual factors outside of the self (Bandura, 2001; H. Leventhal et al., 1998). Within
this framework, subjective experiences of ageing reflect a dynamic interplay between
self and socio-cultural factors (Steverink et al., 2001), whereby SPA are not only shaped
by a range of intrapersonal and interpersonal factors but also shape how an individual
approaches their own ageing and further lifespan development (Westerhof & Wurm,
Page 50
32
2015). Cross-cultural studies (e.g. Levy, Ashman, & Slade, 2009; Westerhof & Barrett,
2005: see Chapter 5) demonstrate that SPA does vary according to how societies value
older people and the ageing process. Yet there is also significant variation within shared
socio-cultural environments in terms of how people assign meaning to their experiences
of getting older and how they manage the challenges or demands associated with the
process (Levy, 2009). Process models of self-regulation recognise the dynamic
interactions between the ageing self and the environment. At the same time, they are
able to account for the cognitive and emotional processes within the self that determine
the adaptive resources available for coping with, and adjusting to age-related
challenges. As such, they are especially useful frameworks for investigating SPA.
3.4 A self-regulation model for health and illness
One particularly influential social cognitive model that has been applied to the
field of health and illness is the Common-Sense Model9 (CSM: H. Leventhal, Meyer, &
Nerenz, 1980; H. Leventhal, Nerenz, & Steele, 1984). The CSM is described as a
perceptual-cognitive model of self-regulation (H. Leventhal et al., 1998), the origins of
which stems from earlier lines of research into health behaviour and fear arousal (see
Brownlee, Leventhal, & Leventhal, 2005). This model holds that when an individual
perceives relevant, health-related stimuli, a representation of danger (cognitive
representation) and a representation of the fear this danger elicits (affective
representation) are activated in parallel to process this illness-related information, which
in turn is integrated into a personally meaningful conceptualisation of the illness, or
illness perceptions. This conceptualisation is then understood to guide coping and
adjustment to the illness (Benyamini, 2011; Hagger & Orbell, 2003) (see Figure 1 for a
schematic representation of this model). The CSM specifies that the self-regulating
processes are constantly interacting with, and processing information from a cultural
9 The CSM has been referred to within the literature by different names, including the parallel processing
model, the self-regulation model (SRM), the model of illness cognition, mental representations in health
and illness, and common-sense representation of illness danger. H Leventhal and colleagues (2012) state
that the various name changes across the years reflect “the evidence and insights into the mechanisms
underlying response to health information” that have contributed to the “evolution of the CSM as a
framework for understanding how people adapt to health threats in settings ranging from hospitals to
clinics and the home” (p. 3).
Page 51
33
and social context (Diefenbach & Leventhal, 1996). For instance, social comparison is
one source of information that may be incorporated into the illness perception, thereby
updating existing knowledge about an illness and possibly altering the affective
response (i.e. social comparison may reduce or increase the perceived threat depending
on how favourable the comparison is). However, while the self-regulating system is
operating in a dynamic fashion within these contexts, people are not viewed as passive
recipients of socio-cultural structures but rather, as active agents (H. Leventhal et al.,
1998) who are “producers as well as products of social systems” (Bandura, 2001, p. 1).
Figure 1. This schematic representation (adapted from Hagger & Orbell, 2003) depicts
Leventhal et al.’s (1980) Common-Sense Model of illness representations.
Page 52
34
Akin to the formation of SPA, illness perceptions are understood to be informed
by multiple factors, including cultural and social messages, medical authorities or
significant others, and personal experiences with the illness. This information may be
concrete (i.e., perceptual processing of somatic change) or abstract (i.e., conceptual
processing of cultural input), and influences not only the illness representations but also
the coping behaviours and strategies selected (Hagger & Orbell, 2003; Schiaffino,
Shawaryn, & Blum, 1998). Further, attributes of the self (e.g. age, personality) may
define risk of illness and moderate the self-regulation process (Diefenbach & Leventhal,
1996; H. Leventhal et al., 1998). The manner in which illness is construed and the
subsequent behavioural response will shift over time (Petrie & Weinman, 2006)
according to whether symptoms worsen or improve, and whether these symptoms can
be treated effectively (H. Leventhal et al., 1998). The appraisal process occurs across
both the cognitive and emotional pathways between illness perceptions, coping
responses, and outcomes. This demonstrates the dynamic nature of illness perceptions
which can accommodate new information while discarding or adapting existing
information that no longer fits the illness experience (Benyamini, 2011; Hale, Treharne,
& Kitas, 2007; H. Leventhal, Weinman, Leventhal, & Phillips, 2008).
Several properties distinguish the CSM from other models of self-regulation
(Brownlee et al., 2005). Those distinctions that are also relevant to the study of SPA are
described here.
3.4.1 Illness perceptions have content and structure
The CSM posits specific content for each of the five core dimensions of illness
perceptions which investigations (e.g. Lau, Bernard, & Hartman, 1989; Lau & Hartman,
1983; Meyer, Leventhal, & Gutmann, 1985) have found empirical support for10
. These
dimensions are labelled identity, cause, consequences, timeline, and control. Identity
refers to the name or label (e.g. diabetes, flu) of the health threat and the experience of
symptoms (e.g. blurry vision, cough, fatigue). Cause reflects how an individual
10 More recently, the dimension of illness coherence, which reflects how an individual assesses the
coherence or usefulness of his or her illness perception, has been included in a revised measure of IP (see
Moss-Morris et al., 2002). However, this dimension is not applicable to SPA and was not included in the
adapted framework for ageing described below.
Page 53
35
attributes responsibility for the illness (e.g. poor diet, stress) while consequences,
whether imagined or real, reflect the individual’s understanding about how the illness
will impact on their overall functioning (e.g. disability, occupational, impairment,
death). The expected or perceived onset and duration of an illness, as well as the time
for recovery, is reflected by timeline. This dimension can be further categorised along
acute, cyclical, or chronic timelines depending on the pattern of symptoms experienced
or the existing schemata for the illness. The control dimension reflects the degree to
which an individual believes the illness can be prevented, managed, or cured, whether
via bodily defences or medical / personal interventions. The content of illness
cognitions can be described both normatively and at an individual level (H. Leventhal,
Forster, & Leventhal, 2007; H. Leventhal et al., 1998). Further, emotional
representations of an illness (e.g. fear, distress) are processed in parallel to these illness
cognitions. These core dimensions are components of a generic underlying structure of
illness perceptions having been described as the “basic building blocks of illness
representations” (Heijmans & de Ridder, 1998, p. 486).
While the structure and content of illness perception profiles will vary across
illnesses and individuals (depending on chronicity and symptomology), a number of
reviews (e.g. Hagger & Orbell, 2003; Scharloo & Kaptein, 1997) report a consistent and
logical pattern of inter-correlations among the core dimensions. Specifically, the
identity dimension is strongly and negatively related to the control dimension while
being positively related to chronic timeline and consequences. As such, people who
perceive an illness as highly symptomatic also perceive less control, greater chronicity,
and more serious consequences, while those with a weaker illness identity are more
likely perceive greater levels of control over an illness, less chronicity, and less serious
consequences for their lifestyle (Hagger & Orbell, 2003). The findings that perceived
control and perceived consequences are significant determinants of medical,
psychological, and behavioural outcomes is congruent with a ‘common-sense’
interpretation of illness. Individuals who believe they can control a situation so that it
has less impact on their daily functioning are more likely to adapt proficiently to meet
their desired outcomes.
Page 54
36
3.4.2 Illness perceptions guide coping responses
In addition to specifying distinct illness dimensions, the CSM is also
distinguished from other models of self-regulation because of its explicit focus on the
role of coping (de Ridder & de Wit, 2006). There are numerous coping responses which
go to managing health threats, from general coping strategies (e.g. problem-focussed
coping) to more illness-specific responses (e.g. short term actions such as annual
medical check-ups or longer term actions such as managing lifestyle) (Hagger & Orbell,
2003; H. Leventhal et al., 2012). A key assumption of the CSM is that illness
perceptions guide action plans for coping, by defining the threat and activating
motivational processes for action (H. Leventhal et al., 2012). For example, Prohaska,
Keller, Leventhal, and Leventhal (1987) conducted a series of experimental studies and
reported that greater symptom severity (i.e. identity dimension) was associated with
greater emotional distress and an increased likelihood of engaging in a wider array of
coping behaviours, such as seeking support from friends and medical professionals.
However, when symptoms were perceived to be related to age (i.e. cause dimension),
people indicated a greater likelihood of engaging in more passive coping responses such
as reduced emotional distress and a decreased tendency to take action. E. A. Leventhal,
Easterling, Leventhal, and Cameron (1995) found that if symptoms were recognised as
belonging to a treatable illness (i.e. control dimension), older adults were more likely to
access medical care faster. Similar findings demonstrating the relationship between
illness perceptions and coping responses selected for action have been reported across
the literature (for a summary, see Hagger & Orbell, 2003).
The CSM assumes a causal relationship where illness perceptions influence
coping responses in proportion to the perceived severity of the illness (Hagger & Orbell,
2003) which in turn influences adjustment to the illness. However, despite the explicit
role assigned to coping within the CSM, the empirical evidence has been mixed, with
only a small number of cross-sectional studies (e.g. Carlisle, John, Fife-Schaw, &
Lloyd, 2005; Evans & Norman, 2009; Gray & Rutter, 2007; Knibb & Horton, 2008;
Rutter & Rutter, 2002; Singh, 2011) finding support for the mediation effect. In their
meta-analytic review of the CSM, Hagger and Orbell (2003, pp. 179-180) cite a number
of possible explanations for these limited findings. First, the lack of longitudinal designs
in the study of illness perceptions and coping negate any judgements regarding the
direction of causality. Second, the ways in which coping is conceptualised and assessed
Page 55
37
vary greatly from study to study (see Section 4.2.1 for a description of the many ways in
which coping has been conceptualised within the literature). For instance, some
researchers focus on generic coping measures while others include illness-specific
assessments, which will greatly affect the magnitude of the correlations reported
between illness perceptions and coping across studies. Third, because appraisals of
outcomes may modify illness perceptions through feedback effects, the original
mediating relationship specified may be confounded. And fourth, it may be possible that
the effects of illness perceptions on adjustment are exacerbated or hindered by coping,
suggesting a moderating effect rather than mediation. These issues will only be resolved
through further research.
Interestingly, the authors of a more recent meta-analysis which examined 31
published studies that had adopted the CSM (Dempster, Howell, & McCorry, 2015)
raised the possibility that the most common measure of illness perceptions may actually
be capturing elements of coping which are then confounded with the responses from the
coping measures. They reference an earlier study of theirs (Dempster & McCorry, 2012)
which assessed the factor structure of the revised Illness Perceptions Questionnaire
(IPQ-R: Moss-Morris et al., 2002) and questioned whether both the consequences and
emotional representations subscales were actually measuring an appraisal of coping
resources. If this is the case, then there is a sound argument for treating coping as a
moderator in the illness perceptions-illness outcomes relationship. However, Dempster
and colleagues (2015) also reported that thus far, very few changes have been observed
longitudinally in either illness perceptions or coping. It is therefore equally plausible
that coping responses do behave as mediating variables but that this occurs so rapidly
that it has been difficult to capture. Adding some weight to this possibility is a study
which assessed the illness perception-coping-outcomes (health-related quality of life)
pathway using both quantitative and qualitative assessment methods. Singh (2011)
reported that the survey data resulted in only weak mediation effects for coping,
whereas the open-ended interviews, which were able to tap into the processes in a much
more in-depth and substantive manner, revealed how participants understanding of an
illness guided their selection of coping strategy which then linked to the illness outcome
(and appraisal of the outcome).
In contrast to the meta-analytic results reported by Hagger and Orbell (2003),
Dempster and colleagues (2015) reported that coping variables, specifically, avoidant or
Page 56
38
disengagement coping, tended to be stronger predictors of illness outcomes (as
measured by emotional distress and wellbeing) than illness perceptions. In cases where
mediation was not found, avoidant-related coping strategies had not been included for
analysis. Several other noteworthy points were raised by Dempster et al. (2015)
including the fact that many studies of illness perceptions either exclude coping
altogether or treat it as a covariate. Further, when the role of coping is examined, it is
frequently tested with regression analysis where illness perceptions are entered into the
model first. In these instances, coping is interpreted as explaining little of the variance
in the outcome measures (in contrast to when it is entered first and then explains a
considerable amount of the variance). The conclusions drawn from this meta-analysis
were not, however, entirely different to those reached by Hagger and Orbell (2003).
That is, the authors surmised that further clarity is required in regards to the role of
coping in the illness perception-illness outcome relationship, and more longitudinal
research in particular is needed to resolve the current uncertainty.
3.4.3 Self-attributes can moderate the self-regulation process
Another feature of the CSM is its recognition that self-regulatory processes
involved in the appraisal of health threats which then guide coping and adjustment do
not occur within a vacuum (Diefenbach & Leventhal, 1996). While not entirely unique
to the CSM, as social cognitive approaches in general acknowledge that self-regulation
is a contextually-related self-process (as discussed in Section 2.4), the role of individual,
social, and cultural context is emphasised within this theoretical framework. As
Diefenbach and Leventhal (1996) underscore, illness-related information is processed
by individuals “with a specific history, a set of personality dispositions or traits, and in
an interpersonal, and cultural context” (p. 23). These factors not only help to define risk
but may also affect and moderate the entire process of self-regulation (H. Leventhal et
al., 1998). Chronological age is one indicator which has been shown to moderate
aspects of the self-regulation process, for instance, symptom appraisal and care-seeking
(e.g. E. A. Leventhal, Leventhal, Schaefer, & Easterling, 1993; E. A. Leventhal et al.,
1995). A number of researchers have also reported that optimism moderates the
pathways between illness perceptions and outcomes (e.g. Hurt et al., 2014; Karademas,
Kynigopoulou, Aghathangelou, & Anestis, 2011). The role of optimism is discussed
Page 57
39
further in Section 5.4.2 however overall, the moderating role of such dispositional
factors have been under-researched (Hurt et al., 2014).
3.5 Proposed application of CSM framework to SPA
As outlined in Chapter 1, it has been difficult to synthesise the findings which
have emerged from within the field of subjective ageing, and more specifically, for
SPA. This has been in part due to conceptual and measurement issues. SPA have often
been treated within research as a unidimensional construct despite general consensus
that it is multidimensional. Further, until quite recently, there had not been any
meaningful attempt to develop a theoretical framework which might aide in a more
systematic approach to the investigation of SPA.
Barker and colleagues (2007) proposed that applying a self-regulation framework
for examining adaptation to ageing experiences could be useful. Unlike illness or other
health threats, ageing is a normal developmental process that one anticipates.
Nevertheless, the ageing process does entail change and many challenges which the
individual must adapt to in order to age well or successfully (Schulz & Heckhausen,
1996). Such challenges place demands upon the self-regulating resources of the
individual, and as such, ageing itself can be viewed as a potential stressor. It has been
argued that adopting the CSM and building upon its principles to investigate SPA
provides a theoretical framework for studying multiple dimensions of ageing
experiences within the context of self-regulation. Further, the CSM is consistent with
psychosocial models of successful ageing and many lifespan developmental approaches
which emphasise the agentic perspective. That is, the individual is viewed as a
“common-sense ‘scientist’ trying to make sense of his/her world” (Barker et al., 2007,
“Discussion,” para. 9) who is actively engaged in self-regulatory processes which go to
maximising gains and minimising losses (P. B. Baltes & Baltes, 1990), albeit in an
increasingly complex landscape as age progresses.
3.5.1 Dimensions of SPA within CSM framework
Following a review of the literature relating to SPA, Barker and colleagues (2007)
proposed that the CSM dimensions described for experiences of illness could also be
translated into an ageing context. The CSM dimensions have been described by Barker
et al. (2007) as relating to the experiences of ageing in the following ways. Identity
Page 58
40
refers to the beliefs an individual develops about their own ageing within the context of
health-related changes or physical decline. The timeline dimension reflects the
awareness of ageing over time, which may be experienced as either chronic (i.e. a
chronic awareness of one’s age or the ageing process) or cyclical (i.e. variations in the
awareness of ageing). The consequences dimension reflects beliefs regarding the
influence ageing will have on the individual across various life domains, and is further
divided into positive and negative consequences of ageing. The dimension of control
refers to the beliefs an individual holds regarding how they manage their own
experiences of ageing. It comprises two sub-dimensions, namely, control over positive
experiences, and control over negative experiences, of ageing. Finally, the emotional
representations dimension refers to the negative emotional responses which are
generated to the ageing process. The cause dimension described for illness perceptions
is not specifically addressed within the framework as applied to an ageing context (or
discussed within the publication by Barker et al.) however it is somewhat captured in
the identity dimension, as outlined in Section 3.6. Utilising the multiple CSM
dimensions allows for greater specificity in investigating SPA which in turn, provides
for a more nuanced and comprehensive analysis of ageing experiences (Barker et al.,
2007).
3.5.2 Related ageing constructs
As outlined in Section 1.2.1, various other terms have been employed within the
literature to describe ageing experiences which are related to, or overlap with the SPA
dimensions described by Barker and colleagues (2007). The literature reviewed within
this thesis (see Chapter 5) includes studies which have employed a number of these
different terms or constructs (along with different measurement scales: see Section 3.6),
and it is therefore important to clarify how they link to the SPA dimensions described in
Section 3.5.1.
The concept of age attributions has received a good deal of attention within the
fields of both ageing and illness perceptions. Age attributions refer to the tendency to
blame declines in physical or cognitive health on the ageing process rather than on
medical conditions or other health determinants (Levy et al., 2009; Sarkisian, Liu,
Ensrud, Stone, & Mangione, 2001). The question of what to assign somatic changes or
problems to (i.e. old age or illness) is a multifaceted one for older adults. As E. A.
Page 59
41
Leventhal and Crouch (1997) observe, older adults experience more bodily symptoms
than their younger counterparts and they need to detect and evaluate every new
symptom against a backdrop of greater and more complex somatic activity. Further,
both the biological changes associated with ageing, and the chronic illnesses that
become more common as people age, develop gradually and make detection of
symptoms more difficult. These factors are further compounded by the socio-cultural
contexts in which humans operate. Negative stereotypes (e.g. to be old is to be ill) about
ageing are internalised by older adults and this effects how they perceive somatic bodily
changes (Stewart, Chipperfield, Perry, & Weiner, 2012). Thus, distinguishing between
illness and age-related changes becomes a much more convoluted process for older
adults, and can have serious consequences for the mental health and wellbeing of the
individual (as discussed in Section 5.2.1). This concept maps onto the identity
dimension described in Section 3.5.1.
Both subjective age and satisfaction with ageing have been described as
dimensions of SPA, and for the most part, both have been treated as unidimensional
constructs within studies (although, as noted in Section 1.2.1, multidimensional
conceptions of subjective age have been proposed). Subjective age refers to how old or
young an individual experiences themselves to be (Montepare, 2009) which is related to
the concept of how aware an individual is of their own age and the ageing process over
time (i.e. the timeline dimension). Overall ageing satisfaction refers to the level of
satisfaction that an individual feels in regards to perceived age-related changes (Kotter-
Grühn et al., 2009) and is most closely associated with the consequences dimension.
Satisfaction with ageing is a general, unidimensional construct which offers either a
positive or negative view of ageing. Other approaches (e.g. Keller, Leventhal, & Larson,
1989; Steverink et al., 2001; Wurm et al., 2007) view personal experiences of ageing as
multidimensional and domain specific, comprising both positive (e.g. continued growth,
increased freedom) and negative (e.g. physical and social losses) evaluations. They
focus on the ways in which ageing is believed to influence life across different domains
(i.e. consequences dimension), and how an individual believes they can manage these
various experiences (i.e. control dimension).
As underlined by Diehl and colleagues (2015), most of these subjective ageing
constructs are little more than brief definitions because until recently, there had been a
distinct lack of theorising on the phenomena of subjective ageing. In their review, Diehl
Page 60
42
et al. (2015) describe the 1980s and most of the 1990s as a “period of disinterest” (p. 5)
in which very little theoretical or empirical developments occurred in the field of
subjective ageing (the historical reasons for this are outlined by Diehl et al., 2015).
Whether due to the increased focus on objective, performance-based measures of
functional status in gerontology research during this period, or as a consequence of the
theoretical disinterest, more sophisticated approaches to measuring the multiple
dimensions of ageing experiences were lacking up until the past decade or so (Diehl et
al., 2015). Thus, a number of the studies reviewed in this thesis (see Chapter 5) have
utilised older measures which tend to reflect unidimensional or global
conceptualisations of SPA. The following section provides a brief summary of these
measures along with some of the more recent multidimensional instruments before
describing the measure adopted for the current study.
3.6 Measurement of SPA dimensions
Clearly, the manner in which SPA are measured is defined by how it is
conceptualised. Where studies have focussed on single dimensions of the ageing
experience, such as subjective age or satisfaction with ageing, unidimensional measures
have been employed. The most common approach to assessing subjective age, for
instance, is to ask older adults the simple question “How old do you feel?” (i.e. felt age)
and then calculate the difference between this and their actual chronological age (Diehl
et al., 2014; Westerhof & Wurm, 2015). Along the same line, people may be asked what
their ideal age is, or which age group they most identify with (Diehl et al., 2015). The
predominant instrument used to assess ageing satisfaction has been the Attitudes
Towards Own Aging (ATOA) subscale of the Philadelphia Geriatric Center (PGC)
Morale Scale (Lawton, 1975). In contrast to assessments of subjective age, the ATOA
subscale explicitly measures how older individuals evaluate overall satisfaction with
their own age and ageing (Kleinspehn-Ammerlahn et al., 2008) by rating statements
such as “Things keep getting worse as I get older” and “I am as happy now as when I
was younger” (Lawton, 1975). Scores are calculated to provide either a positive or
negative evaluation of ageing satisfaction. A number of other measures have been
employed within studies where SPA are conceptualised as comprising both positive and
negative dimensions. The Personal Experiences of Aging Scale (PEAS: Steverink et al.,
2001), the Attitudes to Aging Questionnaire (AAQ: Laidlaw, Power, Schmidt, &
Page 61
43
WHOQOL-OLD Group, 2007), and the AgeCog Scales (Wurm et al., 2007) each assess
ageing experiences across various domains. Specifically, ageing is viewed as being
associated with losses (i.e. physical and psychosocial) and gains (i.e. continued growth,
ongoing development, self-knowledge). These scales evaluate SPA in terms of the
extent to which they are positive or negative.
While each of the aforementioned measures have sound psychometric properties
and have been very useful for capturing certain aspects of SPA, Barker and colleagues
(2007) have observed that instruments which focus on single dimensions or global
evaluations of SPA are not adequate to capture the multi-faceted and complex
experiences of ageing. Instead, they contend that to provide a more nuanced and
comprehensive understanding of SPA, a multidimensional and theory-based instrument
that logically organises the multiple dimensions that have often been studied
independently would enable greater opportunity to systematically examine SPA. To this
end, Barker and colleagues developed a multidimensional measure of SPA in tandem
with their adopting the CSM as a framework to interpret and understand ageing
experiences.
Building upon this theoretical framework, the 32-item Ageing Perceptions
Questionnaire (APQ: Barker et al., 2007) was constructed with eight subscales (along
the dimensions outlined in Section 3.5.1). While the APQ does not include a cause
subscale per se, the identity subscale asks respondents to assess whether any health-
related changes they have experienced might be caused by age (Sexton, King-
Kallimanis, Morgan, & McGee, 2014). However, this scale does not assess whether
individuals might attribute other factors (e.g. lifestyle) as causing, for instance,
acceleration in the ageing process (see Section 5.3.1 whereby the authors from one
study concluded that theories of accelerated or premature ageing may have accounted
for some of the findings). Focus groups were used initially to assess both the relevance
of the CSM for examining ageing experiences and item content validity, and following
preliminary testing, the scale was evaluated with a large (N=2,033) representative
sample of community-dwelling older Irish adults. The APQ was found to possess good
psychometric properties (Barker et al., 2007).
Since its publication, the APQ has been used to assess SPA in older adults from a
number of countries. It has been most widely adopted in Ireland, its country of origin,
Page 62
44
largely for research stemming from the Irish Longitudinal Study on Ageing (TILDA)
and related research programmes (Freeman et al., 2016; Heraty & McCarthy, 2015;
Hickey et al., 2010; Robertson & Kenny, 2016a, 2016b; Robertson, King-Kallimanis, et
al., 2015; Robertson, Savva, King-Kallimanis, & Kenny, 2015; Villiers-Tuthill, Copley,
McGee, & Morgan, 2016). The APQ has also been utilised in an Iranian study
(Masoudnia, 2016), several Chinese studies (Hou et al., 2016; Wu et al., 2016), and in a
Dutch investigation of ethnic differences in SPA (Cramm & Nieboer, 2017). Further,
several language versions have been developed, including Chinese (Chen, Hu, Zhu, Li,
& Zhou, 2015), French (Ingrand et al., 2012), Brazilian (Ferreira, Neves, & Tavares,
2014), Dutch (Slotman, Cramm, & Nieboer, 2015), and Turkish (Slotman, Cramm, &
Nieboer, 2017). Both the Dutch and the Turkish language versions (APQ-S) were
shortened to include 21-items along the seven original views about ageing dimensions
(excluding the identity dimension). Despite the increasing popularity of the APQ, there
has been only one published Australian study which has utilised the measure (i.e.
Yarmo-Roberts et al., 2010).
More recently, a brief version of the APQ (B-APQ: Sexton et al., 2014) has been
published11
. The authors of this more concise version of the scale contend that it has an
improved fit compared to the original APQ, comprising five scales rather than the eight
described above. In particular, both the identity and the timeline cyclical subscales have
been excluded from the measure, the former due to its high ceiling effect (i.e. further
analyses revealed that large proportions of respondents were attributing health-related
changes to ageing), and the latter because it was found to be less relevant to ageing
experiences than illness and therefore was of little theoretical value. In addition, the
negative consequences and control negative subscales were combined to provide an
overall negative ageing perceptions dimension (Sexton et al., 2014, p. 10).
3.7 Summary
The views that individuals develop about their own age and ageing reflect a
dynamic interplay between self and socio-cultural factors. Situating SPA within a
process orientated self-regulatory framework recognises that while people have agency
11 The B-APQ had not been published at the time of data collection for the current study.
Page 63
45
over their experiences and are actively goal-driven, they do not generate views about
their ageing experiences within a vacuum. Rather, the ageing self and the environment
are understood to interact in a complex and dynamic fashion. Adopting the CSM as a
framework for investigating SPA is especially useful as it acknowledges the
complexities associated with ageing experiences which are multidimensional and
multifaceted. Further, utilising this framework to inform how SPA are measured enables
a much more cohesive and systematic approach for researchers to investigate these
experiences including how they may influence other areas of functioning (e.g. mental
health, coping: see Chapter 5).
The central aim of this thesis is to explore the relationships between the multiple
dimensions of SPA (as measured with the APQ) and mental health status. More
specifically, drawing on a number of the theoretical assumptions of the CSM (described
in Sections 3.4.2 and 3.4.3), this thesis aims to understand the role that coping resources
and dispositional traits might play in the SPA-mental health relationship (as outlined in
Section 1.4). It is therefore important to clarify how each of the mental health and
psychosocial variables of interest will be conceptualised within this thesis. Thus,
Chapter 4 outlines the definitions and conceptualisations of each and also briefly
summarises the findings that are specific to older populations on each of these
measures.
Page 64
46
Chapter 4 Psychosocial factors and mental health: An
overview
Page 65
47
4.1 Introduction
As outlined in Section 1.3, the central purpose of this thesis is to investigate the
role that psychosocial mechanisms may play in influencing the relationship between
SPA and mental health in older, community-dwelling Australian adults. A core
assumption of the CSM is that coping mediates the relationship between illness
perceptions and adjustment to illness (H. Leventhal et al., 2012). Drawing on this
theoretical model, Barker and colleagues (2007) have suggested that SPA may also
guide coping and adjustment to one’s own age and the ageing process. This has
provided the rationale for studying coping as a possible mediating variable within the
current study (see Chapter 11). Further, the CSM recognises that self-attributes such as
personality may moderate the self-regulation process (H. Leventhal et al., 1998).
Personality is one source of individual difference which has been found to account for
variations in SPA (as discussed in Chapter 5) and which likely impacts on the
relationship between SPA and mental health. Therefore, an examination of whether
dispositional traits may have a moderating influence on this pathway is also warranted
(see Chapter 12). The theoretical rationale for examining coping and dispositional traits
as mediating and moderating variables will be explored further in Chapter 5. Yet how
these variables are conceptualised is significant in terms of understanding the roles they
may play in the pathway between SPA and mental health. The fields of coping and
personality are both extensive and as such, the first section of this chapter will describe
how they are conceptualised within this thesis.
The psychological and emotional health variables chosen for examination within
this thesis go to the conceptualisation of mental health described in Section 2.2.3.
Specifically, subjective wellbeing and psychological distress are viewed as key
indicators of mental health. Both measures go to the WHO (2004) definition of mental
health which has been adopted for this thesis. These variables are investigated as
dependent variables in Chapters 11 and 12 where the pathways between SPA and
mental health are explored. The associations between these variables and SPA will be
reviewed at length in Chapter 5. The aim of the second section of this chapter, therefore,
is to provide definitions of these constructs and to briefly summarise the findings that
are pertinent to older populations in regards to these specific mental health indicators.
Page 66
48
4.2 Psychosocial constructs (proposed mediating and moderating variables)
4.2.1 Coping
Coping has been defined as the “constantly changing cognitive and behavioural
efforts to manage the specific external and/or internal demands that are appraised as
taxing or exceeding the resources of the person” (Lazarus & Folkman, 1984, p. 141).
This widely used definition goes to a process approach, which assumes that coping
responses are dynamic in nature and volitional, and hence, largely driven by
environmental demands rather than stable coping styles or dispositions (Carver, Scheier,
& Weintraub, 1989; Yancura & Aldwin, 2008). That is not to say that people do not
develop habitual ways of coping which may influence their response to a novel stressor
(Carver & Scheier, 1994). As Schwarzer and Schwarzer (1996) observe, using
standardised instruments to measure individual differences in coping implies that people
can be characterised by preferred coping styles (i.e. moderate degree of stability), and
further, that people do develop a number of person-dependent strategies which they
reapply at different occasions (i.e. moderate degree of generality). However, coping is
not fixed in the sense that people will, at various points across their lifespan, assess how
best to cope after they have appraised an event (for example, as threatening or benign)
and appraised the extent of their coping resources (Amirkhan & Auyeung, 2007),
dependent on situational factors and developmental changes. Compas, Connor-Smith,
Saltzman, Thomsen, and Wadsworth (2001) characterise coping succinctly as “a subset
of broader self-regulatory processes” which “draw on and are constrained by the
biological, cognitive, social and emotional development of the individual” (p. 89).
Given the vast array of coping mechanisms (i.e. strategies, responses, resources)
identified, many attempts have been made to develop a cohesive structure of coping, for
example, classification by purpose, meaning or functional value (Schwarzer &
Schwarzer, 1996). Yet to date, there has been little consensus among researchers as to
how to best organise these ways of coping into higher order categories. Indeed, in one
review, more than 100 category systems were identified, of which no two had the same
set of categories (Skinner, Edge, Altman, & Sherwood, 2003). It is neither the aim nor
intent of this thesis to comprehensively review the literature regarding the numerous
coping structures or the problems associated with the lack of consistency within the
field (see Compas et al., 2001, and Skinner et al., 2003 for in-depth reviews). However,
Page 67
49
before summarising how coping will be treated within this body of work, a brief
overview of some of the most utilised higher order coping dimensions, a number of
which have been incorporated into the studies reviewed in Chapter 5, will be described.
These descriptions are intended to help clarify why the coping responses in the current
study were categorised as they were, as distinct from other, related categories, and
where they are situated within the broader system of coping.
One of the ways in which coping has been categorised is according to its function,
and the most common functional distinction has been between problem- versus
emotion-focussed coping (e.g. Folkman & Lazarus, 1980). The former includes
strategies directed at changing the stressful event (e.g. problem-solving, direct action)
while the latter includes strategies that regulate distressing emotional responses to the
stressor (e.g. social withdrawal, distraction) (Folkman, Lazarus, Pimley, & Novacek,
1987; Zimmer-Gembeck & Skinner, 2016). Another means of categorising ways of
coping has been by the mode or method of responses, for instance, active versus
passive, cognitive versus behavioural, and approach versus avoidance (e.g. Roth &
Cohen, 1986) (see Table 1 for definitions of the various higher order coping categories
described here). The approach-avoidance distinction is perhaps the most widely used
among these, whereby the orientation of the person either toward or away from the
threat is the defining feature distinguishing the two categories (Skinner et al., 2003).
Approach coping tends to share a similar set of coping responses to problem-focussed
coping (i.e. cognitive and behavioural efforts to manage the stressor), whereas
avoidance coping includes cognitive or behavioural responses that aid in avoiding the
distressing event (Zimmer-Gembeck & Skinner, 2016). Some researchers (e.g. Moos &
Holahan, 2003) make further distinctions by combining the dimensions, for instance,
specifying cognitive approach and behavioural approach from cognitive avoidance and
behavioural avoidance. A related classification is that of engagement and
disengagement coping. This distinction also goes toward orientation yet while the
avoidance dimension represents only one way of disengaging from the stressor,
disengagement coping includes a broader assortment of responses that are not purely
avoidant (Compas et al., 2001), for example, emotional venting.
Page 68
50
Table 1
Definitions for higher order coping categories
Coping Dimension Source Definition
Problem- versus Emotion-focussed Folkman and
Lazarus (1980)
Focussed efforts aimed at managing or altering a stressful person-environment
interaction (i.e. targets external demands of stressor) versus efforts to regulate the
negative emotional responses that arise from the stressor (i.e. targets internal
demands of stressor)
Active versus Passive Ebata and
Moos (1991)
Cognitive or behavioural efforts directly targeting a stressor for the purpose of
understanding and resolving/controlling problem versus cognitive or behavioural
attempts to withdraw from, or surrender to a stressor or its implications
Approach versus Avoidance Roth and
Cohen (1986)
Purposeful efforts which are oriented towards the demands of a stressor versus
efforts which are oriented away from the demands of a stressor These two coping
processes are understood to operate in a complementary way
Engagement versus
Disengagement
Connor-Smith
and Flachsbart
(2007)
A variation of the approach/avoidance distinction which is broader in scope i.e.
encompasses more ways of disengaging from stressors and their consequences
Primary versus Secondary control Heckhausen
and Schulz
(1995)
Active attempts to manage or alter stressors in the external environment (or related
emotions) versus attempts to manage or alter aspects of the self to fit with current
circumstances. These two processes are understood to operate in a synergistic
fashion
Assimilation and Accommodation Brandtstädter
and Renner
(1990)
Active efforts to adjust developing life circumstances to personal preferences/goals
and activity to adjust personal preferences/goals to situational constraints. These two
independent processes operate in tandem, with the former reflecting intentional
agency and the latter regulating action when intentional goal pursuit is constrained
by situations or resources
Page 69
51
While there is merit in each of the dimensions presented in Table 1, confirmatory
factor analyses have demonstrated that none of these theoretically derived distinctions
adequately captures the structure of coping alone (Connor-Smith & Flachsbart, 2007).
In their comprehensive review, Skinner and colleagues (2003) argue that because all
ways of coping are multidimensional and all serve multiple functions, distinctions based
on single functions or topological features (e.g. modes and methods) are not
theoretically useful as higher order categories (although they are all important in the
construction of a coping hierarchy). Instead, it has been argued that in order to meet the
criteria (of which seven are identified in the Skinner et al. (2003) review) for any good
taxonomy, lower order ways of coping need to be organised into higher order categories
according to action types, that is, higher classes of action which reflect multiple
topological features and serve multiple functions (Skinner et al., 2003; Zimmer-
Gembeck & Skinner, 2016).
The most common distinction between coping action types is that of primary and
secondary control coping (or assimilation and accommodation: see Brandtstädter &
Renner, 1990). Primary control coping refers to attempts to change the external world
“through typical problem-focused, active, and approach ways of coping” while
secondary control coping “refers to strategies that allow people to accommodate to
events, placing less effort on trying to change them” (Zimmer-Gembeck & Skinner,
2016, p. 7). Some authors (e.g. Thompson, Cheek, & Graham, 1988; Weisz, 1990) note
a conceptual similarity between problem- and emotion-focussed coping and primary-
secondary control coping distinctions, respectively, based on the similar processes
involved. However, Heckhausen and Schulz (1995) emphasise the target (i.e. external
world vs. self) of primary-secondary control, not the cognitions or actions involved.
While various researchers have adopted the primary-secondary control distinction
in their models of coping, Heckhausen and Schulz (1995) highlight the role of these
dimensions from a lifespan perspective. Specifically, the authors argue that secondary
control strategies not only serve a compensatory function when primary control has
failed but also “foster primary control directly by managing its selectivity” (p. 286),
which is consistent with most lifespan developmental theories, as outlined in Section
2.3. This conceptualisation suggests that, rather than being opposing processes,
Page 70
52
successful optimisation of development requires a balance between primary and
secondary control strategies which shifts over the life course depending on variation in
opportunities and constraints (Heckhausen et al., 2010). However, adults across all age
cohorts strive for primary control when it is available (Heckhausen & Schulz, 1995). In
a similar vein, assimilation and accommodation coping (Brandtstädter & Renner, 1990)
which were developed from an action theoretical perspective on successful ageing, are
also held to operate synergistically (Skinner et al., 2003).
Within the current thesis, distinctions among coping responses are made
according to whether they reflect primary or secondary control coping. Both types are
comprised of responses reflecting an orientation towards the stressor (and are therefore
subsumed under the engagement coping category). However, as this distinction does not
capture some lower order ways of coping “that are more passive, are actively
disengaged, or active but not intentional” (Skinner et al., 2003, p. 230), a further
distinction is made for those responses that go towards orienting away from the stressor,
which will be categorised as disengagement coping. Very broadly, coping strategies
which go towards controlling or adjusting to a stressor (i.e. engagement) have generally
been associated with better mental health outcomes across all age groups, while
strategies which help to disengage from the stressor have been related to poorer
outcomes (Carver & Connor-Smith, 2010). However, a range of contextual and
situational factors influence these relationships to determine whether one type of coping
is more adaptive over another at a particular point in time (Amirkhan & Auyeung, 2007;
Boehmer, 2007).
Given that coping is considered a foundational concept (Trouillet, Gana, Lourel,
& Fort, 2009) within all theories of successful ageing, which each emphasising its
important yet complex role, there have been surprisingly few empirical investigations of
coping in older populations. Further, the available research has produced rather
inconsistent results regarding age-related differences in coping. For instance, some
findings point to a decrease in problem-focussed strategies as people age (e.g. Folkman
et al., 1987) whereas others have reported that this type of coping is maintained or
engaged more often with increasing age (e.g. Aldwin, Sutton, Chiara, & Spiro, 1996;
Amirkhan & Auyeung, 2007; Folkman et al., 1987). Several investigators (e.g. Diehl,
Coyle, & Labouvie-Vief, 1996; Folkman et al., 1987) have reported that older adults use
more passive, emotion-focussed or avoidant coping than their younger counterparts. In
Page 71
53
their review of primary-secondary control striving, Heckhausen et al. (2010) describe
very mixed findings for primary control (i.e. evidence for stability, increases, and
decreases across age) yet more consistent evidence for increases in the use of secondary
control coping as people age. Despite the divergent findings, it appears (based on very
limited evidence) that the coping mechanisms employed by older adults work as
effectively as they do in younger cohorts (Aldwin et al., 1996).
Overall, the inconsistent findings regarding age-related differences are in part due
to the ways in which coping is conceptualised and measured, and the heavy reliance on
cross-sectional data (Carver et al., 1989; George, 2005). However, other factors also
complicate matters. For instance, some evidence suggests that it is not age per se that
affects coping abilities, but differences in situational and contextual factors, such as the
types of stressors or challenges experienced (e.g. controllability and/or duration of
stressor) or coping resources available to the individual (e.g. Trouillet et al., 2009). To
some extent, this view has been challenged by lifespan theorists (e.g. P. B. Baltes &
Baltes, 1990; Brandtsädter & Rothermund, 1994, 2002; Heckhausen & Schulz, 1995)
who argue that rather than age-related deficits in control, older adults adjust their goals
and expectations to changing opportunities (an accommodative or secondary control
strategy) in order to maintain control capacity. That older people often perceive
themselves as maintaining primary control as they age, despite the various biological,
cognitive, and social constraints that they will experience, and often do not identify
declining control until very old age, suggests that they are not only using secondary
control coping effectively (Heckhausen & Schulz, 1995) but that their appraisals of
stressful situations may differ from that of younger adults.
Indeed, while a number of other complicating factors have been addressed by
theorists within the field, it is perhaps the way that older adults appraise stressors before
engaging in coping that is the most salient of these factors for the current body of work.
Specifically, how an older individual perceives their own age and the ageing process
may guide the selection of coping responses to exert an effect on their overall health and
wellbeing. To date, few studies have tested whether coping mediates relationships
between stressors and health outcomes (George, 2005).
Page 72
54
4.2.2 Social networks
Individuals live within social networks which are comprised of both structural and
functional characteristics (Ashida & Heaney, 2008; S. Cohen, 2004; George, 2005;
Taylor, 2011). The structural characteristics (e.g. social integration, network size and
density) relates to “the extent (of)….social connections” (Seeman, 1996, p. 442). This
may include active engagement in activities and social relationships or it may reflect a
sense of belonging (S. Cohen, 2004). The functional characteristics (e.g. social support,
social engagement) can be defined as “emotional, informational, or practical
(instrumental) assistance from significant others, such as family members, friends, or
coworkers; (and that) support actually may be received from others or simply perceived
to be available when needed” (Thoits, 2010, p. S46).
Social networks are often conceived of as a personal coping resource which helps
an individual to navigate potential stressors via one of two hypothesised pathways: by
limiting or eliminating the negative influence of stress on health (i.e., stress-buffer
hypothesis) or by promoting positive psychological states, thereby strengthening one’s
ability to manage stressors (i.e., direct-effect hypothesis) (S. Cohen, 2004; House,
Landis, & Umberson, 1988). Support for both of these effects, albeit it to varying
degrees, has been reported in studies of social networks and health in older adults
(Russell & Cutrona, 1991; Tajvar, Fletcher, & Grundy, 2016). Kawachi and Berkman
(2001) observe that the two pathways are not discordant as they may act differentially
on the various social network dimensions to influence health and other stressors.
Keyes (1998) argues that social wellbeing is critical for optimal functioning and
mental health. As older populations face a range of age-related stressors such as
declining social networks and increasing risk of morbidity and mortality for themselves
and their loved ones, social factors are believed to play an especially important role for
adjustment to these challenges (Pachana, Smith, Watson, Mclaughlin, & Dobson, 2008;
White, Philogene, Fine, & Sinha, 2009). For instance, while the link between social
support and depression has been widely reported across all age groups (Turner &
Brown, 2010), decreasing social networks and isolation are understood to be strongly
associated with depressive symptoms in older adults (Kawachi & Berkman, 2001). In
one review (e.g. Gariépy, Honkaniemi, & Quesnel-Vallée, 2016), over 90 percent of the
33 studies included found that various aspects of social networks, such as spousal and
Page 73
55
friendship support, were protective from depression (although it is noteworthy that most
of these studies were cross-sectional). Russell and Cutrona (1991) investigated the role
of perceived social support in the process of coping with stressful experiences within a
group of older adults. They reported that deficits in social support not only had a direct
effect on levels of depression but also an indirect effect through increasing the
likelihood of minor stressful events (although social support did not buffer the effects of
stressful events on later depression). Perceived social support has also been found to
mediate the relationship between physical function and quality of life indicators such as
depressive symptoms and life satisfaction (e.g. Newsom & Schulz, 1996).
However, stage of life is one of several factors which determine how the costs and
benefits of social factors are distributed across populations (Kawachi & Berkman, 2001)
and there is compelling evidence that social factors can have little, or even detrimental
effects on the health of older people. As an example, while the need for instrumental
support may increase as people age and require greater assistance to manage physical
health needs, some research suggests that this type of support may also have a negative
effect on the mental health of older adults for a number of reasons, including a loss of
independence (Ashida & Heaney, 2008). In particular, it has been reported that support
provided by the children of older adults may actually serve to increase a loss of
autonomy and self-efficacy, and subsequently increase feelings of helplessness, all of
which have been identified as risks for depression (Gariépy et al., 2016; Kawachi &
Berkman, 2001).
In a very recent systematic review (Tajvar et al., 2016) which, to our knowledge,
is the only review to have focussed exclusively on the effects of social support on the
mental health of older adults, the evidence was found to be mixed and therefore
inconclusive at this point in time. Tajvar and colleagues (2016) drew several
conclusions from their research. Overall, they reported that while social factors
demonstrate a moderate influence on the mental health of older people, with evidence
pointing towards more helpful rather than harmful effects, there is currently a dearth of
studies which have examined these associations exclusively in older cohorts. Further,
the available evidence is complicated by a range of conceptual and methodological
issues, such as the various ways in which social networks are defined, the lack of
instruments which capture the different dimensions of social networks (i.e. structural
versus functional) across different contexts (i.e. more relevant stressors for older
Page 74
56
populations), and a sparsity of prospective research designs. Thus, there remain many
gaps in our knowledge regarding the relationship between social factors and mental
health in older adults and much more research is required. Within the current body of
work, social networks will be explored as a coping resource and will include both
structural (i.e. social interaction) and functional (i.e. satisfaction with social support)
dimensions.
4.2.3 Dispositional traits
Broadly, personality is understood to reflect individual differences in thoughts,
affect, and behaviours that remain relatively stable over time and consistent across
situations (Roberts, Wood, & Caspi, 2008; Specht et al., 2014). Arguably one of the
most enduring debates within the field of personality was centred on the question of
continuity versus change in adulthood, which arose in part out of how relative stability
was defined. While the crux of this debate has largely been resolved through theoretical
and empirical work to have emerged in recent decades (Diehl & Hooker, 2013), with
most researchers converging on the position that personality is more malleable into
adulthood than once believed, the more complex and nuanced questions to have
followed (i.e. the who, what, when, where, why, and how of continuity and change)
have only generated great interest in recent years. While it is beyond the scope of this
thesis to review the literature that pertains to these questions, it is necessary to provide
an overview of the topic as it speaks to the way in which personality is conceptualised
and studied within this thesis.
Most contemporary approaches to personality research support an integrative
framework which incorporates a range of variables, the most fundamental and basic of
which are dispositional traits (Chapman, Hampson, & Clarkin, 2014; McAdams &
Olson, 2010). These dispositions are organised hierarchically, with broad traits (or
domains) subsuming more narrow and specific traits (or facets) (McCrae, 2010).
Theories of personality development across the life course have historically focussed on
either genetic (e.g. intrinsic maturational processes) or environmental (e.g. life events,
society/culture) factors. Current perspectives, however, are leaning towards a complex
interaction of these factors when assessing continuity and change, although the various
theories propose different processes and give different weight to biological and
environmental determinants (Specht et al., 2014; Specht, Egloff, & Schmukle, 2011)
Page 75
57
(for an interesting read that explores how genes are intrinsically dynamic in transactions
with the environment, see Roberts and Jackson's (2008) article on sociogenomic
personality psychology). Indeed, it is becoming increasingly apparent that the process-
orientated mechanisms through which continuity and change might occur are not only
complex but often subtle (see Roberts et al. (2008) for a review of this topic). Caspi and
Roberts (2001) state that “mechanisms of continuity and change are not simply the flip
side of the same coin…these are often separate mechanisms that can work at any time to
engender continuity and change” (p. 62).
The multiple indices12
used for tracking continuity and change (Roberts &
Mroczek, 2008) and the divergent causal interpretations drawn from the same data
(Costa & McCrae, 2006; Roberts, Walton, & Viechtbauer, 2006a) have undoubtedly
contributed to the very different conclusions reached about the malleability of
dispositional traits. For instance, longitudinal investigations of rank-order consistency
demonstrate moderate to substantial stability over many decades (Hooker & McAdams,
2003; Roberts & DelVecchio, 2000). By contrast, multiple cross-sectional and
longitudinal investigations (e.g. Helson & Kwan, 2000; Mroczek & Spiro, 2003;
Pedersen & Reynolds, 2002; Roberts, Robins, Caspi, & Trzesniewski, 2003; Roberts,
Walton, & Viechtbauer, 2006b; Small, Hertzog, Hultsch, & Dixon, 2003; Specht et al.,
2011) provide strong evidence of mean-levels of trait change well into adulthood and
older age, on both population- and individual-level indices. These findings are thus
consistent with a lifespan developmental approach (e.g. P. B. Baltes et al., 1999; Schulz
& Heckhausen, 1996; Sneed & Whitbourne, 2005) which views psychological
development as an adaptive process that extends across the entire life course.
Acknowledging the possibility of dispositional trait change in older adults has important
implications given that personality is associated with numerous life domains (Roberts et
al., 2006b). There is now ample evidence of the associations between mental health and
12 There are multiple statistical approaches which have been adopted to investigate continuity and change
in longitudinal personality research. Roberts et al. (2008, p. 376) organise these indices with a two-by-two
table. At the base of this table is structural continuity (i.e. similar factor structures over time and across
age groups). Within the table, the dimensions are organised as follows: whether the development of a
characteristic is investigated at the individual or population level, and whether the focus is on absolute or
relative standing on the dimension. For example, rank-order consistency refers to a population level
investigation of relative ranking of individuals, while population level examination of absolute change is
referred to as mean-level change. At the individual level, ipsative consistency and individual differences
in change refer to tracking continuity and change in relative or absolute terms, respectively.
Page 76
58
dispositional traits (Diener, Oishi, & Lucas, 2003; McHugh & Lawlor, 2012) although
understanding these relationships requires further investigation. Given the dynamic
relationships observed thus far between personality and health, it has been argued that
aspects of the self-system (e.g. self-perceptions, self-regulatory processes) also need to
be examined within this framework (Hooker, 1992).
One of the most influential trait theories to have emerged within the field is the
Big Five factors of personality (Costa & McCrae, 1992) which delineates a five-factor
structure of personality traits that are understood to account for the differences in
personality across individuals. Each of these broad dispositional traits - extraversion,
neuroticism, agreeableness, conscientiousness, and openness to experience - subsume
more specific facets which contain both common and specific variance (McCrae, 2010)
and each have been associated with health-related behaviours and outcomes (Chapman
et al., 2014). However, in terms of mental health and successful ageing, two of the Big
Five traits have particular salience, namely, conscientiousness and neuroticism
(Friedman, Kern, Hampson, & Duckworth, 2014; Friedman & Kern, 2014; Poon et al.,
2010; Srivastava & Das, 2013). Another personality dimension that has been of
particular interest to researchers exploring healthy ageing in recent years is that of
dispositional optimism (Carver & Scheier, 2014; Steptoe, Wright, Kunz-Ebrecht, &
Iliffe, 2006).
Conscientiousness goes to a range of constructs that facilitate task- and goal-
directed behaviour, such as impulse control, planning and prioritising tasks, orderliness,
delayed gratification, forethought, and the tendency to follow socially prescribed norms
and rules (John, Oliver & Srivastava, 1999; Roberts, Lejuez, Krueger, Richards, & Hill,
2014). Unsurprisingly, numerous studies have found that conscientiousness is
negatively related to risky health-related behaviours while being positively related to
health enhancing behaviours (Bogg & Roberts, 2004). However, emerging evidence
suggests that the pathways between conscientiousness and health are not well
understood and that closer examination is warranted (Friedman et al., 2014; Shanahan,
Hill, Roberts, Eccles, & Friedman, 2014), especially in older adults given the
implications for the healthy ageing paradigm.
By contrast to conscientiousness, neuroticism, which is defined as negative
emotionality including anxiety, nervousness, irritability, sadness, worry, and tenseness
Page 77
59
(Goldberg, 1993; John, Oliver & Srivastava, 1999), is positively related to a range of
poorer health outcomes (Lahey, 2009; Siedlecki, Tucker-Drob, Oishi, & Salthouse,
2008). Research indicates that conscientiousness tends to increase across adulthood,
while neuroticism tends to decrease (Mroczek & Spiro, 2003; Roberts et al., 2003).
However, there is also evidence of an increase in neuroticism again in the very old
(Small et al., 2003). Some authors (e.g. Ready, Åkerstedt, & Mroczek, 2012) have
reported that neuroticism is more strongly associated with poor emotional outcomes for
older than younger individuals, and that as older adults with higher neuroticism have a
more simplified emotional structure (i.e. less independence among negative and positive
affect), they may be at a greater risk for developing depression.
Dispositional optimism is understood to reflect positive expectations about the
future across different life domains (Scheier & Carver, 1985). Unlike the Big Five traits,
the dispositional optimism construct was developed within a general self-regulatory
framework, whereby positive expectancies are believed to increase efforts to attain
desired outcomes or goals (Solberg Nes & Segerstrom, 2006). Various attempts have
been made to fit optimism into the Big Five structure, with some researchers (e.g.
Marshall, Wortman, Kusulas, Hervig, & Vickers, 1992) finding that it is linked to
neuroticism and extraversion, and further, that this is indicative that dispositional
optimism is actually capturing two separate constructs (i.e. pessimism and optimism).
Others, meanwhile, have reported that agreeableness and conscientiousness explain
additional variance in dispositional optimism, over and above traits neuroticism and
extraversion (e.g. Kam & Meyer, 2012), and further, that when the item valence effect
was controlled for, patterns of relationships between optimism and pessimism with
extraversion and neuroticism were greatly reduced, thereby supporting a unidimensional
construct (e.g. Sharpe, Martin, & Roth, 2011)
Within the current study, dispositional optimism is treated as a unidimensional
construct although this issue is still unresolved within the field. While efforts continue,
neatly capturing dispositional optimism within the Big Five trait framework remains
elusive. Carver & Scheier (2014) suggest that it might be more useful to conceptualise
the Big Five factors as reflecting domains of content (i.e. the ‘what’ of human motives)
while thinking of optimism as an expectancy-incentive motivational construct, whereby
individuals are motivated to go toward goals because they are confident of what the
result will be (i.e. part of the ‘how’ of human motives). While this construct is
Page 78
60
associated with various health-related variables, including psychological health and
wellbeing (Glaesmer et al., 2012) and has been shown to guide more adaptive forms of
coping (Aspinwall, 2005; Conversano et al., 2010), very few researchers have examined
dispositional optimism exclusively in older adults (Steptoe et al., 2006).
Finally, of particular interest for this thesis is the distinction between naturalistic
trait change and trait change resulting from intentional, focussed interventions. The
trends observed above (i.e. naturalistic reductions in neuroticism and increases in
conscientiousness as people age) have been well documented across multiple studies.
However, intentional change refers to the targeting of one or more broad traits or facets
identified as problematic by an individual who is willing to engage in treatment and
desires change. Even those researchers (e.g. McCrae & Costa, 1994) who believe that
personality is largely stable after the age of 30 years in healthy populations concede that
long-term, intensive psychotherapies can be an agent of change in non-healthy
populations (i.e. disordered personalities). However, less research has focussed on
intentional personality change in healthy adults until quite recently. The limited results
from studies whereby dispositional traits were targeted for change via psychotherapy
(including short-term therapies) in non-personality disordered cohorts have been
promising (Chapman et al., 2014). Other short-term treatment programmes, such as
personality change coaching (e.g. L. S. Martin, Oades, & Caputi, 2014) have also
proved efficacious in changing targeted dispositional facets in healthy populations,
although the longer term effects of these interventions are unclear. Further, intentional
trait change has been observed within older age groups (e.g. Białas, 2009; Jackson, Hill,
Payne, Roberts, & Stine-Morrow, 2012). In sum, short-term interventions aimed at
facilitating dispositional trait change in healthy, older populations is not an entirely
unrealistic proposition although whether the outcomes are meaningful or long-lasting is
undetermined.
4.3 Mental health constructs (proposed dependent variables)
4.3.1 Psychological distress
Psychological distress is a rather ambiguous term which has been vigorously
debated within the literature. It has been conceptualised in a variety of ways, including
as an emotional disturbance that may impair social functioning and daily living, as a
Page 79
61
diagnostic criterion for certain psychiatric disorders and a marker of symptom severity
for others, and as a normal, short-lived emotional response to stressful situation or event
(Drapeau et al., 2011; Phillips, 2009). Despite these differing perspectives which go
largely to informing issues around diagnosis and clinical intervention, psychological
distress is generally held to reflect a state of emotional disturbance characterised by
symptoms of anxiety and depression, which may also be linked to somatic symptoms
(Drapeau et al., 2011; Goulia et al., 2012). As outlined in Chapter 2, psychological
distress is treated as one measure of mental health.
In the main, it is understood that anxiety and depressive disorders are less
common in older age cohorts (Bryant, Jackson, & Ames, 2008; Fiske & Jones, 2005)
however there is much less clarity around the prevalence of subthreshold levels (Jorm,
2000; Snowdon, 2001). This is largely attributable to the many conceptual,
methodological, and measurement issues across studies (Karel, 1997), including
different case definitions (Blazer, 2003; Bryant et al., 2008; O’Connor, 2006) and age-
bias in measurement (Jorm, 2000). For instance, there is evidence to suggest that older
adults report less psychological symptoms (e.g. sadness, hopelessness, worry) than
physical or somatic complaints (Bryant et al., 2008; Gum, McDougal, McIlvane, &
Mingo, 2009). Further, psychological distress is more likely to co-exist with declines in
physical health (Beekman et al., 1997), possibly in response to changes in physical
functioning. Thus, teasing out differences between symptoms of physical and mental
health in older adults becomes a much greater challenge, particularly in the oldest age
groups (Blazer, 2000).
These issues have resulted in considerable variation in the rates of prevalence
reported (e.g. Beekman, Copeland, & Prince, 1999; Bryant et al., 2008). In one review
of the literature from over almost 30 years, the figures for anxiety symptoms reported in
community samples of older adults ranged from 15 percent to 52.3 percent (Bryant et
al., 2008). A national health survey carried out in Australia (ABS, 2015) found that
around 73% of older Australian adults typically report lower levels of psychological
distress than their younger counterparts. Examination of age group differences (e.g.
Fiske, Gatz, & Pedersen, 2003; Jorm, 2000; Jorm et al., 2005; Paul, Ayis, & Ebrahim,
2006; Schieman, Van Gundy, & Taylor, 2001; Snowdon, 2001) have produced further
inconsistencies, with studies variously reporting increases, decreases, U-shaped trends,
or stability in psychological distress as people age. What is not in contention is the
Page 80
62
devastating effects of anxiety and depression symptoms on the overall health and
wellbeing of older adults. The prognosis when older people experience these symptoms
is often poorer than for younger people, as subthreshold levels are frequently
underdiagnosed and undertreated, despite impairing other areas of health as consistently
as clinical levels of depression and anxiety (Bryant et al., 2012; Chachamovich, Fleck,
Laidlaw, & Power, 2008). A range of factors have been hypothesised to play into
symptoms of psychological distress being overlooked in older populations.
Disturbingly, there is some evidence to suggest that negative stereotypes of ageing have
perpetuated beliefs, by both lay and medical persons alike that symptoms of anxiety or
depression are a ‘normal’ part of ageing13
(Law, Laidlaw, & Peck, 2010; Levy, 2003).
4.3.2 Subjective wellbeing
Subjective wellbeing has been defined as “an umbrella term for different
valuations that people make regarding their lives, the events happening to them, their
bodies and minds, and the circumstances in which they live” (Diener, 2006, p. 400).
Broadly, subjective wellbeing is the subjective indicator for quality of life and, as
outlined in Section 2.2.3, is also used as a marker of mental health (Diener, 2000;
Vanhoutte, 2012). Two conceptual approaches have emerged from the subjective
wellbeing research: the hedonic (i.e., happiness and life satisfaction; Diener, 2000) and
the eudaimonic (i.e. self-realisation, meaning, and control over one’s life; Ryan & Deci,
2001; Waterman, 1993). The former comprises both cognitive and emotional
components, namely, the evaluation of life satisfaction and positive (i.e. happiness) and
negative (i.e. suffering) affect, while the latter is comprised of constructs that reflect
positive functioning, such as autonomy, control, and self-realisation (Vanhoutte, 2012).
While these two approaches have emerged from differing traditional perspectives, there
is empirical evidence to suggest that subjective wellbeing is a multidimensional
13 In recent years, there have been concerted public policy efforts in Australia to challenge ageing and
mental health stereotypes. As an example, beyondblue (a national, not-for-profit mental health
organisation that was developed as a joint initiative of the Australian federal, state, and territory
governments) commenced a national awareness campaign which promoted the message that depression
and anxiety are not normal parts of the ageing process. This particular campaign involved widespread
advertising and large scale information and resource dissemination throughout community programmes
across multiple sites (Carnell, 2012).
Page 81
63
construct and that both the hedonic and eudaimonic approaches are complementary
(Ryan & Deci, 2001; Vanhoutte, 2012).
Anecdotally, it might be assumed that health or other age-related losses would
cause deleterious effects on the overall levels of subjective wellbeing in older people.
While individual differences such as disposition and stressful life events may influence
the state of wellbeing (Scheibe & Carstensen, 2010), there is evidence to suggest that
older adults experience stable or reasonably high levels of subjective wellbeing on some
measures, even when faced with objective stressors such as physical health declines and
social losses (e.g. Carstensen, Pasupathi, Mayr, & Nesselroade, 2000; Charles,
Reynolds, & Gatz, 2001; Kessler & Staudinger, 2009; Mroczek & Kolarz, 1998). These
positive subjective evaluations of psychological health by older adults, even when there
are objective markers of decline or illness that intuitively might predict psychological
distress, have been dubbed the paradox of ageing or the wellbeing paradox (Mroczek &
Kolarz, 1998). Certainly, research indicates that negative affect decreases over the
lifetime with the rate of decline slowing after 60 years of age (Carstensen et al., 2000;
Charles et al., 2001; Kunzmann, Little, & Smith, 2000).
In regards to life satisfaction, the picture is a little less clear. Researchers have
reported quite mixed findings, such as negative, positive, and no associations between
age and life satisfaction (Mroczek & Spiro, 2005). Drawing on a survey of almost
60,000 adults from across 40 countries, Diener and Suh (1998) concluded that life
satisfaction remained stable or even trended upwards into older age. Where stability has
been reported, the reasons for it (especially in the face of increasing objective stressors
such as poor physical health) are not yet entirely understood. One possibility is that
older people adjust their goals and expectations as they age, in line with lifespan
theories of development, and accommodative / secondary control coping, as outlined in
Sections 2.3 and 4.2.1, respectively. Another possibility is that cohort effects influence
how satisfied people are with their lives, that is, generations with lower expectations
may be more easily satisfied (Diener & Suh, 1998).
Findings concerned with positive affect have been even more ambiguous. While
some researchers (e.g. Carstensen et al., 2000; Charles et al., 2001; Mroczek & Kolarz,
1998) report stability or slight increases in positive affect as people age, others (e.g.
Diener & Suh, 1998; Lucas & Gohm, 2000) report that older people experience less
Page 82
64
positive affect than their younger counterparts. It has been argued that methodological
factors such as cohort effects, rather than age, may again explain the divergent findings
(Diener & Suh, 1998). For instance, those born in the earlier parts of the 20th
century
(dubbed the G.I. and Silent Generations) may have lower expectations regarding levels
of happiness in older age than the Baby Boomers which were raised in an era that
promised greater prosperity than any previous generation had experienced. Given the
current economic uncertainty, alongside other far-reaching factors such as climate
change, it is likely that future generations of older adults (e.g. Generation X, born
between the mid 1960’s and the late 1970’s) may appraise their subjective wellbeing
quite differently to that of earlier generations. Other factors may also be at play. In a
cross-sectional analysis of 516 older participants from the Berlin Aging Study,
Kunzmann et al. (2000) reported that age per se does not influence decline in positive
affect but that health restraints do.
Ryff (1989) examined age differences in eudaimonic subjective wellbeing and
reported that while some components are influenced by age (e.g. environmental
mastery, purpose in life), others show no age differences (e.g. self-acceptance, positive
relations). In particular, purpose in life and autonomy were found to peak in middle-age
and then decline. Similarly, Jivraj, Nazroo, Vanhoutte, and Chandola (2014) reported
that autonomy and self-actualisation initially increase with age and then decline among
the oldest-old. However, they also noted that low levels of subjective wellbeing are not
caused by these age differences per se as other contextual factors (e.g. poor health and
widowhood) influence how one rates their subjective wellbeing, even amongst the older
cohorts. A similar conclusion has been reached by other researchers. For instance,
Siegrist and Wahrendorf (2009) studied data obtained from the Survey of Health,
Ageing and Retirement in Europe (SHARE), which included 15,000 retired older people
from across 14 European countries. Across the domains of control, autonomy, self-
realisation, and pleasure, they reported that there were more within-country differences
than between-countries, and that the variability within-countries related to
socioeconomic status and participation in socially productive activities.
Despite there being a large body of empirical and theoretical work relating to
subjective wellbeing more broadly (i.e. across different age groups), there are still
significant gaps in our knowledge regarding how the hedonic and eudaimonic aspects of
this construct operate in older populations. While a number of factors, such as cohort
Page 83
65
effects, poor physical health, and engagement in social activity have been cited as
possible reasons for the divergent findings, it also appears that goal and expectation
adjustment may also play a role in the ways that people appraise their subjective
wellbeing in later years. Unfortunately, the different dimensions of subjective wellbeing
have generally been studied in isolation from each other rather than as complementary
constructs within the same studies. As both hedonic and eudaimonic aspects of
subjective wellbeing provide meaningful yet distinct information about the mental
health functioning of an individual, they will both be examined concurrently within this
current study.
4.4 Summary
The fields of coping and personality are both steeped in long histories and
subsequently, the literature regarding these types of individual differences is both
complex and broad in scope. Coping has been conceptualised as a stable (dispositional)
style and as a process, however there is a general consensus that coping is much less
stable than personality (Carver & Connor-Smith, 2010). Within the current body of
work, coping is conceptualised as a resource which enables the operation of broader
self-regulatory processes. Insofar as numerous ways of coping have been identified, the
availability of these coping mechanisms to any one individual is dependent on a range
of situational and developmental factors (Compas et al., 2001). Notwithstanding the
debate regarding change and continuity within the personality literature and the
potentially promising findings regarding intentional dispositional trait change in
healthy, adult populations, the constructs of interest for this thesis, namely
conscientiousness, neuroticism, and dispositional optimism are nonetheless recognised
as moderately stable traits. Unfortunately, despite a wide body of evidence linking
coping and personality to health-related variables, very few researchers have sought to
examine associations between these variables and mental health specifically in older
adult populations.
Finally, it is noteworthy that for older adults, the greatest concentration of
research has been around mental illness as opposed to mental health (see Section 2.2.3
for the distinction between these two labels). While various conceptual and
methodological issues cloud the findings regarding outcomes on the different measures
of mental health, it is especially noteworthy that there has been a paucity of research
Page 84
66
which has focussed exclusively on the mental health of older populations. The focus of
chapter 5, therefore, is to review the available research regarding mental in older adults
as it relates to SPA, including individual differences in SPA and psychosocial
mechanisms which may explain the pathways between ageing experiences and mental
health.
Page 85
67
Chapter 5 Self-perceptions of ageing: A literature review
Page 86
68
5.1 Introduction
Over the past several decades, investigators have examined the relationship
between SPA and a range of health-related variables. Numerous cross-sectional and
longitudinal studies have reported that SPA are associated with physical and functional
health (e.g. Bode et al., 2012; Demakakos, Gjonca, & Nazroo, 2007; Levy, Slade, &
Kasl, 2002; Moser, Spagnoli, & Santos-Eggimann, 2011; Robertson, Savva, et al., 2015;
Sargent-Cox et al., 2012b; Wurm et al., 2007), cognitive function (e.g. Hess et al., 2003;
Levy, 1996; Robertson & Kenny, 2016b; Robertson, King-Kallimanis, et al., 2015),
various health behaviours including diet, exercise, and medication adherence (e.g. Hou
et al., 2016; Levy & Myers, 2004; Sarkisian et al., 2005; Villiers-Tuthill et al., 2016;
Weltzien, 2007; Wu et al., 2016; Wurm et al., 2010), and longevity and mortality (e.g.
Kotter-Grühn et al., 2009; Levy & Myers, 2005; Levy, Slade, Kunkel, et al., 2002;
Maier & Smith, 1999; Sargent-Cox, Anstey, & Luszcz, 2014). Further, these
associations are not insubstantial. For example, one longitudinal study reported that
SPA had a greater impact on survival, increasing lifespan by seven and a half years,
than gender, socioeconomic status, loneliness, and functional health (Levy, Slade,
Kunkel, et al., 2002).
This body of work continues to grow as researchers embark on more sophisticated
explorations of the processes that might explain these relationships. However, the
objective of this thesis is to examine the relationship between SPA and mental health in
older, community-dwelling Australian adults, specifically focussing on a select group of
psychosocial variables (as outlined in Chapter 4) which have either been empirically or
theoretically associated with this ageing construct. As such, the first section of this
chapter focusses exclusively on research findings pertaining to associations between
SPA and mental health variables, in particular across the APQ defined, or conceptually
related dimensions of SPA (see Section 3.5.1). The next section of this chapter reviews
the evidence regarding individual differences in SPA, specifically, differences in
sociodemographic characteristics, subjective health status, coping mechanisms, and
dispositional traits (see rationale for reviewing these individual difference variables in
Section 5.3). The final section of this chapter reviews the literature regarding
psychological pathways between SPA and mental health. As noted across many of the
studies included in this review, the relationships between the various SPA dimensions
Page 87
69
and health are complex, and are likely due to numerous intervening mechanisms which
have yet to be examined. While a number of studies have assessed the physiological or
behavioural pathways between ageing experiences and health, or have modelled SPA as
the outcome variable, the focus of this study (as iterated above) is the potential role that
psychosocial mechanisms play in either explaining the relationship from SPA to mental
health, or in influencing the strength of these associations.
5.2 Associations between SPA dimensions and mental health
While subjective experiences of ageing have been the focus of many
investigations which have explored physical, cognitive, and behavioural health in older
populations, the relationship between SPA and mental health has only garnered
attention in very recent years. Indeed, while less modifiable social determinants of
mental health in older adults (for example, gender and chronological age) have been
examined at length, much less is currently known about the influence of an older
person’s SPA on their mental health status (Lai, 2009). As might be expected, findings
to date (e.g. Bryant et al., 2012; Lai, 2009; Sindi et al., 2012; Steverink et al., 2001;
Wurm & Benyamini, 2014) indicate that people who hold more positive perceptions
about their own age and the ageing process are more likely to report less psychological
distress (i.e. symptoms of anxiety / depression) and greater levels of subjective
wellbeing or quality of life. Yet the multifaceted nature of the ageing experience is only
revealed in part by global evaluations or unidimensional conceptualisations of SPA,
especially when assessing relationships among the different dimensions and mental
health. The following is a review of the multiple dimensions of SPA as defined within a
self-regulation framework of ageing (i.e. the identity, timeline, consequences, control,
and emotional representations dimensions). Studies which have used concepts related to
these dimensions (see Section 3.5.2) are also included for review.
5.2.1 Identity dimension
Distinguishing between changes in health that are associated with illness versus
those that are associated with ageing becomes a greater challenge for older adults who
make such determinations amidst a background of increasingly complex somatic
activity (E. A. Leventhal & Crouch, 1997). Over the years, various researchers (e.g.
Gjørup, Hendriksen, Lund, & Strømgard, 1987; Gump et al., 2001; Keller, Leventhal,
Prohaska, & Leventhal, 1989; E. A. Leventhal, 1984; Levy et al., 2009; Prohaska et al.,
Page 88
70
1987; Sarkisian, Hays, & Mangione, 2002; Sarkisian et al., 2001; Weltzien, 2007;
Wurm et al., 2013) have explored the role age attributions (or ageing along the identity
dimension) play in the health and wellbeing of geriatric populations. Attributing health-
related changes or physical decline to ageing has been shown to influence decisions
regarding physician consultations (Morgan, Pendleton, Clague, & Horan, 1997), coping
strategies (Wurm et al., 2013), and the use of preventative health measures (Weltzien,
2007).
While less is known about the direct association between the identity dimension
and mental health status, there is evidence that old age attributions are associated with
more perceived physical health symptoms (Stewart et al., 2012). The hypothesis (Levy,
2003) that age stereotypes (e.g. to be old is to be physically ill) are internalised and then
applied to the self as one ages may not just affect the physical health of the individual
but may also extend to accepting the accompanying decline in mental health as part of
old age. For instance, Law and colleagues (2010) found support for Blanchard’s (1992)
understandability phenomenon which holds that older adults believe depression is a
normal consequence of ageing and as such, does not warrant the same clinical
management which younger adults experiencing depression might expect to receive.
This belief was found to exist for both depressed and non-depressed older adults,
although largely within the oldest-old age cohort.
The role that age attributions exert on mental health is likely influenced by
contextual factors. For instance, it has been found that older adults with multiple
illnesses who have access to above-average primary care report more positive SPA than
those who did not receive the same level of care (Wurm et al., 2014). One possible
explanation may be that if older adults feel a greater sense of security in their care and
therefore better able to cope with the challenges of illness, they may also be less likely
to attribute symptoms of their illness to their own ageing for which intervention would
be of little use. Cultural factors should also be considered. Levy and her associates
(2009) found that while age attributions made by older Americans were linked to worse
functional health, the inverse was true of their older Japanese counterparts. While
Japanese participants made more age attributions than the Americans, they also
experienced more positive outcomes than the latter, which the authors surmised may
reflect greater interdependence among the Japanese generations, and by extension,
greater coping capacity around health problems within the older generations. Birth
Page 89
71
cohort effects may also play a role, with those older adults born post 1945 (i.e. Baby
Boomers) asserting a less passive stance and more positive attitudes towards their
overall health than previous generations (Löckenhoff, Hsiao, Kim, & Swarts, 2016),
which in turn may influence their beliefs about their own ageing in the context of
health-related changes.
5.2.2 Timeline dimension
The vast majority of studies (both cross-sectional and longitudinal) which have
investigated subjective age, that is, ageing beliefs which are related to the timeline
dimension (e.g. Barak, 1987; Demakakos, Hacker, & Gjonca, 2006; Gana, Alaphilippe,
& Bailly, 2004; Hubley & Hultsch, 1994; Hubley & Russell, 2009; Kaufman & Elder,
2002; Kleinspehn-Ammerlahn et al., 2008; Kotter-Grühn & Hess, 2012; Montepare &
Lachman, 1989; Öberg & Tornstam, 2001; Rubin & Berntsen, 2006; Teuscher, 2009)
report that both older men and women report feeling younger than their chronological
ages. Further, perhaps as a result of the increased globalisation of Westernised values,
or perhaps due to a host of other factors (e.g. increasing economic prosperity, greater
access to health care), this finding appears fairly universal. That is, older adults from
across countries which are as culturally diverse as, for example, Brazil, China, Nigeria,
or Switzerland, generally feel younger than their chronological age (Barak, 2009).
When subjective age has been measured as a multidimensional construct14
, some
different patterns begin to emerge between the various dimensions and mental health.
For example, Keyes and Westerhof (2012) examined how experiences of feeling
younger (i.e. discrepancy between felt age and chronological age) and wanting to be
younger (i.e. discrepancy between ideal age and chronological age) influenced the
construct of flourishing mental health (FMH), as measured by high levels of positive
affect or life satisfaction and high levels of positive functioning. Differential
relationships were found for the felt age and ideal age dimensions, with the former
being related to an increased odds in FMH, and the latter related to a deceased risk of
FMH. However, most of the studies reviewed in this body of work treat subjective age
as how old the individual feels (unidimensional) and on this measure alone, the findings
14 Within the current review, where multidimensional measures of subjective age have been examined
will be highlighted for the reader. All other references to subjective age refer to the unidimensional
measure (i.e. felt age: see Section 3.5).
Page 90
72
have been fairly consistent. That is, people report feeling younger than their
chronological ages.
How older adults perceive the temporal facets of their own age and ageing has
been associated with a number of measures of mental health. Chronic awareness of
one’s own ageing has been associated with higher depression scores (e.g. Barker et al.,
2007) and poorer quality of life or subjective wellbeing (e.g. Hickey et al., 2010; Keyes
& Westerhof, 2012; Stephan, Caudroit, & Chalabaev, 2011). Westerhof and Barrett
(2005) assessed subjective age in the United States (US) and Germany, and found that a
more youthful identity was associated with higher levels of subjective wellbeing in both
countries, even after controlling for a range of sociodemographic and health variables.
However, they also reported some cultural differences. Specifically, while there were no
differences in regards to the associations between the positive facets of subjective
wellbeing (i.e. positive affect, life satisfaction) and subjective age, the association
between negative affect and subjective wellbeing only held for the US sample. The
authors concluded that both the similarities and differences could be explained by a self-
enhancement strategy which serves to negate the internalisation of ageist stereotypes
(i.e. feeling younger is a positive illusion that promotes subjective wellbeing). While
positive illusions about one’s age may enhance the positive aspects of subjective
wellbeing in both cultures, it could also be protecting against high levels of negative
affect in the US, which is a more individualistic and youth-oriented society than
Germany.
Interestingly, some research suggests that one ageing dimension has the potential
to influence the strength of another ageing dimension on mental health. Mock and
Eibach (2011) used longitudinal data to assess the influence of attitudes toward ageing
(a related concept of the consequences dimension) on the relationship between
subjective age and wellbeing. They reported that while older subjective age did predict
poorer psychological wellbeing, as measured by lower life satisfaction and higher
negative affect, attitudes towards aging moderated this relationship. Specifically, those
with less favourable ageing attitudes experienced lower wellbeing scores whereas no
relationship was found between feeling older and wellbeing when people held more
positive ageing attitudes. This research suggests that the relationships between the
temporal aspects of ageing and mental health are not straightforward; rather, there are
complex interactions among the ageing dimensions themselves. It should be noted,
Page 91
73
however, that middle-aged participants (minimum age of 40 years) were also included
in this 10-year longitudinal study at the first wave of data collection, with a mean age of
53 years. Other research (e.g. Nilsson, Sarvimäki, & Ekman, 2000) has highlighted the
meaningful differences among young-old people who feel old versus those who feel old
in the latest stages of life.
5.2.3 Consequences dimension
Both positive and negative stereotypes of ageing reinforce ageist beliefs and
therefore both have the potential to cause harm. However, within Westernised cultures
in particular, the majority of stereotypes of ageing are negative, thereby reinforcing the
notion that old age is a period of decline that is characterised by, for instance, poor
physical and mental health, dependency, uselessness, and loneliness (Dionigi, 2015).
Ageing is bound by increasing biological vulnerability (P. B. Baltes et al., 1999) which
is inevitably associated with a number of losses as people age. These losses, when
coupled with the internalisation of negative age stereotypes (Levy, 2009) can serve to
create negative expectations regarding the consequences of ageing which can be
extremely detrimental to the mental health of older adults. How an older adult views the
consequences of their own age and the ageing process has been associated with
symptoms of depression, anxiety, emotional functioning, subjective wellbeing and
quality of life (e.g. Barker et al., 2007; Hickey et al., 2010; Hubley & Russell, 2009;
Kavirajan et al., 2011; Sarkisian et al., 2005; Steverink et al., 2001). To our knowledge,
these relationships have yet to be examined longitudinally so no inferences can be
drawn regarding the direction of causality.
The relationships reported between consequences of ageing and mental health
varies, in part as a function of the ways in which each is conceptualised and measured
but also due a number of other contextual factors. For instance, when measured as
satisfaction with ageing (i.e. a unidimensional appraisal of how satisfied older adults are
with the perceived age-related changes occurring in their life), some authors report that
older adults are able to remain positive about their ageing, while others report that older
age is related to more negative assessments of ageing which in turn is related to poorer
mental health. Kotter-Grühn and Hess (2012) found that participants of all ages (18-92
years) were relatively satisfied with their ageing process, including those in the oldest
age brackets. They concluded that this may reflect older adults’ ability to self-regulate
Page 92
74
to any potential negative age-related shifts (although no mental health measures were
included in the study). In contrast, Kavirajan and colleagues (2011) reported that older
age was related to more negative assessments of age. However, the sample in the latter
study consisted of women only, which may account partly for the difference in findings
on the same measure (see Section 5.3.1 for differences by sociodemographic factors).
Steverink et al. (2001) examined the ageing experiences of physical decline,
social loss, and continuous growth, all of which can be assessed as consequences of
ageing. They reported that while physical decline did not appear to influence life
satisfaction, it was related to the affective components of subjective wellbeing.
Steverink and colleagues suggested that this may have been due to measurement (i.e.
life satisfaction being a global assessment of satisfaction with one’s life while positive
and negative affect are state measures) however life satisfaction was significantly
related to both social loss and continuous growth. This suggests that both of these
negative and positive consequences of ageing are considered important for life
satisfaction but that physical decline is considered less important for this facet of mental
health. One possibility may be that if older adults consider physical decline an
inevitable consequence of ageing (as discussed in Section 5.2.1), it may have less
impact on their overall assessment of satisfaction with life while still influencing their
affective wellbeing. Another interesting finding to emerge from this study was the
positive relationship between continuous growth (positive consequences) and negative
affect. The authors speculated that this may be due to the relationship between
continuous growth and being open to new opportunities, which would include being
exposed to both positive and negative experiences.
Barker et al. (2007) and Hickey et al. (2010) have also reported relationships
between the consequences dimension with quality of life and depression, respectively.
Hickey and colleagues reported that the consequences-positive dimension was
positively related to quality of life however no relationship was found for the
consequences-negative dimension, suggesting that quality of life is not influenced by
poor expectations of the ageing process. The finding by Steverink and colleagues (2001)
that one of the negative consequences (i.e. social loss) was related to life satisfaction
may be due to the different ways in which these constructs have been measured. That is,
Steverink et al. measured the experience of ageing across the specific domain of social
loss while Hickey and colleagues employed the APQ, which measures consequences
Page 93
75
more broadly. Further, the quality of life measure used by the latter researchers assessed
multiple life areas that were nominated by the individual as being most important to
their wellbeing (as opposed to the unidimensional life satisfaction measure). Barker and
colleagues assessed the relationship between depressive symptoms and the APQ defined
consequences dimension and reported that more negative perceived consequences of
ageing were associated with higher depression scores, while more positive perceived
consequences of ageing were associated with lower depression scores. Thus, the
relationships between the different markers of mental health (i.e. wellbeing and
depressive symptoms) and how older adults experience the consequences of their own
age and the ageing process do differ.
5.2.4 Control dimension
A cursory check of the literature reveals the numerous ways in which the
construct of control has been labelled and defined over the years, including (but not
limited to) personal control, locus of control, primary or secondary control, assimilation
and accommodation, expectancy of control, self-efficacy, and mastery. Unfortunately,
this has given rise to much conceptual confusion, with control and coping constructs
often overlapping erroneously (see Skinner, 1996, for integrative framework of control
constructs). Indeed, a number of the concepts found within the control literature refer to
coping responses, which are discussed in Section 4.2.1 (see Section 5.3.3 for review of
coping and SPA). While control beliefs more broadly and their influence on health in
older adults has been the focus of a good portion of this research, empirical
investigations around beliefs regarding control over the positive and negative
experiences of ageing specifically (as measured by the APQ), and the association to
mental health in particular have been scarce.
Barker and colleagues (2007) reported that control over ageing experiences was
significantly related to depression, however this relationship only held for control over
positive experiences. Control over negative experiences was not related to depressive
symptoms. Hickey and colleagues (2010) found the same pattern when examining the
relationship to quality of life. That is, higher perceived control over the positive
experiences of ageing was positively related to quality of life but no relationship was
observed for the control-negative dimension. One plausible explanation for this finding
may be that if older adults view the negative experiences of ageing as uncontrollable,
Page 94
76
they will not engage in any attempts to exert control. This may serve as an adaptive
strategy because resources are not needlessly exhausted and thus, mental health remains
unaffected. Alternatively, if no efforts are made to control negative experiences which
are potentially dangerous (e.g. symptoms of a serious physical illness), it is possible that
such experiences then influence other domains of functioning, which in turn influence
mental health. As both of the aforementioned studies were cross-sectional in design,
however, it is not possible to ascertain whether these variable patterns change over time.
For instance, whether changes in control positive is associated with changes in
depressive symptoms, or whether relationships between control negative and mental
health actually exist but were obscured by other effects (e.g. time period or cohort
effects) which could not be detected in a cross-sectional sample. What is pertinent for
the current study is that these relationships, both direct and indirect (see Section 5.4
which reviews psychological pathways) need further clarification.
5.2.5 Emotional representations dimension
Negative emotional responses generated to the experience of age and the ageing
process, including feelings of fear, worry, anger, and sadness, have recently been
demonstrated to link to mental health states more broadly. Barker et al. (2007) reported
that emotional representations of ageing, as measured by the APQ, was associated with
higher depression scores, while Hickey and colleagues (2010) found that negative
emotions specifically related to age and ageing are also related to poorer quality of life
overall. Research in this area is limited and what has been done tends to focus on the
associations between other dimensions of SPA and distressing emotional states
generated towards ageing (and more often, how these relationships influence physical
health and functional states).
Montepare and Lachman (1989) investigated subjective age (see Section 5.2.2),
fears of ageing and life satisfaction in males and females between the ages of 14 and 83
years. They reported that for older men and women, there was little relationship
between younger subjective age and personal fears of ageing (whereas there was a
relationship for younger participants). Yet while younger subjective age was not
associated with fears about one’s own ageing in the older adults, older women with
younger subjective ages still experienced lower life satisfaction. This suggests that
factors other than this particular negative emotional response to ageing influence life
Page 95
77
satisfaction. Indeed, Kotter-Grühn (2015) asserts that the study by Montepare and
Lachman (1989) is one among several that demonstrate no or only weak associations
between younger subjective ages and personal fears of ageing. By contrast, several
qualitative studies (e.g. Craciun, 2011; Nilsson et al., 2000) indicate that older adults
who feel old (i.e. older subjective ages) did experience feelings of fear along with
anxiety, insecurity, loneliness, and lack of purpose.
It is also probable that negative emotional responses generated to one’s own
ageing are influenced by various other contextual factors including physical health
status, culture, and sociodemographic characteristics (as discussed in Sections 5.3.1 and
5.3.2). For example, Kwak, Ingersoll-Dayton, and Burgard (2014) examined
relationships between SPA, receipt of care, and depressive symptoms in a longitudinal
study involving 5938 non-institutionalised participants. They found that older adults
who received greater amounts of care were more vulnerable to experiencing negative
perceptions of their own ageing, and that these negative SPA mediated the relationship
between receipt of care and depressive symptoms. Kwak and colleagues suggested that
negative emotions generated to ageing may result when an older person becomes the
recipient of care because this threatens the identity of the person as autonomous and
self-reliant, features which are particularly valued within Westernised cultures.
In sum, empirical research regarding associations between the multiple
dimensions of SPA and mental health variables is limited. There is some evidence to
suggest that attributing more physical health related changes to ageing, being more
chronically aware of ageing, perceiving more negative and less positive consequences
of ageing, perceiving less control over the positive experiences of ageing, and
generating more negative emotional responses to the experience of age and ageing may
all contribute to poorer mental health functioning. However, much of the available
evidence stems from studies which have investigated concepts that, while related to the
APQ defined dimensions of SPA, do not map directly onto the identity, timeline,
consequences, control, and emotional representations dimensions (as described in
Chapter 3). Only a handful of studies have used the CSM self-regulation framework to
examine how SPA might impact on mental health. The findings along the
consequences, control, and emotional representations dimensions in particular have
tended to differ as a function of how SPA and mental health have been measured.
Further, these relationships have not been tested longitudinally which has precluded
Page 96
78
conclusions about how these relationships may behave over time. Finally, it appears that
a range of contextual factors (e.g. societal and cultural norms and expectations,
availability of health care, generational effects) may also be contributing to the
inconsistencies within the literature.
Despite the dearth of research focussing on the associations between SPA and
mental health, and the various conceptual and methodological issues which influence
how the findings have been interpreted, the currently limited evidence suggests that the
multiple dimensions of SPA relates to the psychological health and wellbeing of older
adults in meaningful and substantive ways. Given such associations, researchers have
been especially interested in understanding potential sources of stable differences
among the perceptions that older people develop towards their own age and ageing
experiences. Understanding where differences in SPA lie is important for a number of
reasons, not least of which is, that it may potentially inform clinical decisions and
treatment options for mental health problems in older adults (as discussed in Chapter 6).
5.3 Individual differences in SPA
A number of cross-sectional and longitudinal studies have revealed considerable
individual differences in SPA however the findings regarding the sources of this
heterogeneity have been fairly inconsistent (Kleinspehn-Ammerlahn et al., 2008).
Sociodemographic characteristics and health status have received a sizeable portion of
the attention by researchers. Differences across sociodemographic factors in particular
have been difficult to establish and as such, warrant further examination (see Section
7.4 for participant sociodemographic and health status characteristics measured for
examination within this thesis). While there appear to be stronger links between SPA
and health status, the relationships have varied in part as a function of the ways in which
both have been measured. Within this thesis, the focus is on subjective indicators of
health, in particular self-rated health and self-reported medical conditions (the latter
reflects subjective reports rather than verified objective data – see Section 7.5.10 for a
description of how these variables are measured). As these subjective indicators of
health are understood to play an important role in SPA, they will be explored further
here.
Page 97
79
Psychosocial factors are another source of individual difference which may
influence how older adults perceive their own ageing experiences. Certainly, as one’s
own age and the ageing process goes to self-identity more broadly and is understood to
place demands (both internal and external) on the individual that might be appraised as
taxing on personal resources, psychosocial mechanisms such as coping and personality
are likely implicated in the differences observed in SPA within older populations. It is
therefore somewhat surprising that these psychosocial variables have garnered much
less interest from researchers exploring differences in SPA. It is feasible that the extent
to which factors outside of the self (e.g. demographic characteristics) have been
explored relative to factors within the self (e.g. dispositional traits) as sources of
individual difference in SPA is a consequence of the ways in which SPA have been
conceptualised. For instance, Hubley and Hultsch (1994) have suggested that one
assumption that underlies much of the research on subjective age (certainly in past
decades) reflects a symbolic-interactionist approach, and as such, a large portion of the
research has centred on societal factors. Nonetheless, this is an evolving area of enquiry
and the evidence (albeit limited) for direct associations between SPA and coping or
disposition that has accumulated is reviewed below.
5.3.1 Sociodemographic characteristics and SPA
As socio-cultural factors are understood to play a critical role in the construction
of SPA, it would be reasonable to conclude that individual differences in
sociodemographic characteristics might explain a significant amount of the variance in
SPA. However, the available evidence suggests otherwise, with most sociodemographic
factors being only weakly associated with SPA, if at all (Stephan, Demulier, &
Terracciano, 2012). While there do appear to be associations between an individual’s
perception of their ageing experiences and the types of opportunities their personal
situation may have afforded them throughout their lifespan, the findings are mixed
regarding the direction and strength of these associations. Further, various
methodological issues (for instance, measurement differences and fewer longitudinal
explorations of these complex relationships) have complicated findings. It has thus been
harder to establish whether sociodemographic variables are acting as predictors, or
whether they serve to moderate or mediate the relationships between SPA and
outcomes.
Page 98
80
Gender differences have been identified in a number of studies with very mixed
results. McGee and colleagues (2011) used the APQ to assess the SPA dimensions of
timeline, consequences, and control in an older Irish sample and found that, in general,
women reported more positive SPA than their male counterparts. Specifically, on the
timeline dimension, women identified going through more phases of feeling old than
men, however the latter were more likely to perceive their ageing chronically and
therefore hold less youthful identities than their female counterparts. Female
participants also described having more control over the positive aspects of the ageing
process, perceiving more positive consequences of ageing, including personal growth,
and holding less perceived negative consequences associated with their ageing, relative
to the male participants. Similar findings were reported in a German study which
included 4838 participants between the ages of 40 and 85 years. The authors of this
study (Steverink et al., 2001) reported that female participants experienced more
continuous growth than men, while the latter reported greater social losses as a result of
their ageing. Interestingly, there were no gender differences in terms of ageing
experienced as physical decline, a dimension of SPA that is held to reflect losses in
vitality and health. Both men and women who reported lower subjective health
experienced greater physical decline associated with ageing.
By contrast, other studies (e.g. Kleinspehn-Ammerlahn et al., 2008; Kotter-Grühn
et al., 2009) have reported that women experience poorer SPA, as measured by lower
ageing satisfaction and older physical age. This has been interpreted as women
experiencing changes in their appearance more negatively than men. Indeed, one theory
holds that a more youthful physical age reflects a denial of ageing which might be
viewed as an adaptive process for ageing successfully (Montepare, 2009). However,
such conclusions should be treated with caution. Neither of the aforementioned studies
looked at the effects of subjective age on life satisfaction. A study by Montepare and
Lachman (1989) which did include life satisfaction found that older women who
reported older subjective ages actually experienced more adaptive outcomes whereas no
such relationship was found for the male participants.
The inconsistencies across studies may also reflect other factors, such as culture
and ethnicity, rather than gender differences per se. For instance, the theory that holding
a more youthful self-identity acts as a self-enhancing illusion (see Section 5.2.2) may be
particularly salient for women within Westernised cultures that often perpetuate a
Page 99
81
double standard of ageing (Kite, Stockdale, Whitley, & Johnson, 2005). That is, the
physical appearance of older women is judged more negatively than that of older men.
Such double standards may go some way to explaining the gender differences observed
in physical age. In one cross-cultural investigation, older American women were found
to hold more apprehension over their appearance than their male counterparts, a finding
that was not replicated in an older South Korean sample (Yun & Lachman, 2006). In
general, however, very little or no gender differences have been reported by other
investigators (e.g. Barak, Mathur, Lee, & Zhang, 2001; Barak & Stern, 1986;
Henderson, Goldsmith, & Flynn, 1995; Montepare & Lachman, 1989; Pinquart &
Sörensen, 2001; Rubin & Berntsen, 2006).
Drawing definitive conclusions about chronological age differences in SPA have
also been difficult It is widely recognised that significant heterogeneity occurs within
older populations, and while increasing age may be associated with a host of losses and
constraints (P. B. Baltes & Baltes, 1990), such developmental challenges are not unique
to older populations, as they occur throughout the life course (O’Hanlon & Coleman,
2008). Nonetheless, general patterns have been observed for differences in SPA as
people age. Across three age cohorts (50-64, 65-74, and 75 plus years), inter-individual
differences for the SPA dimensions of timeline, consequences, and control have been
reported (McGee et al., 2011). This study concluded that as people aged they became
more aware of their own ageing and the negative consequences of the process, while
also experiencing less control over those consequences. Similar patterns of decreasing
positive and increasing negative SPA as ageing progresses have been reported in other
cross-sectional investigations (e.g. Connidis, 1989; Steverink et al., 2001). Longitudinal
investigations reveal changes over time, both within and between subjects, with older
cohorts reporting feeling physically older (i.e. reduced discrepancy between physical
age and actual age) and decreased satisfaction with ageing (Kleinspehn-Ammerlahn et
al., 2008; Kotter-Grühn et al., 2009).
As with gender, however, age per se may not be what drives declines in positive
SPA. Poor health and other health-related factors often explain a large amount of the
variance across SPA dimensions (e.g. Hubley & Russell, 2009; Kleinspehn-Ammerlahn
et al., 2008; Kotter-Grühn et al., 2009; Teuscher, 2009). Bode and colleagues (2012)
investigated the SPA dimensions of physical decline, social loss, and continued growth,
in both a patient (rheumatic disease) and a non-patient group. Both samples exhibited
Page 100
82
similar age differences across two of the three dimensions except for the physical
decline scale. Within the patient group, the middle-aged participants (40-54 years) who
experienced the same level of physical decline as their older counterparts (55-85 years)
reported feeling much older than those of the same age who rated their physical ageing
experiences more favourably. The authors concluded that these results appear to support
a theory of accelerated or premature ageing in people living with challenging health
conditions, such as chronic disease and disability (which goes to the identity dimension
whereby negative changes to health or physical losses are attributed to the ageing
process: See Section 5.2.1).
Various other sociodemographic characteristics (e.g. relationship status, education
level, employment status, income) have been linked to differences observed in SPA
(e.g. Bryant et al., 2012; Demakakos et al., 2006; Jang et al., 2004; McGee et al., 2011;
Steverink et al., 2001). Lower socioeconomic status, which is often measured as low
income and less education, has been consistently associated with older subjective age
(Barrett, 2003). Yet, as with gender and chronological age, it appears that none of these
associations are especially strong on their own, particularly when health or cultural
factors are considered simultaneously. Barrett (2003) explored the association between
socioeconomic status and subjective age further by examining various health
dimensions as possible mediating variables. Health inequalities were found to shape
subjective age, especially negative views of future health which had the largest
mediating effect between older subjective age and lower socioeconomic group. While
the cross-sectional nature of this study inhibited any causal interpretation of the data, it
does provide further evidence of the important role of contextual factors in relationships
between sociodemographic variables and SPA.
5.3.2 Subjective health status and SPA
Subjective evaluations of health are recognised as important markers of overall
health and wellbeing in older adults. One of the most widely utilised subjective
measures is global self-rated health which typically consists of a single item asking
respondents to rate their current health (i.e. from “poor” to “excellent”: see Section
7.5.10). While self-rated health is associated with objective indicators of health such as
functional health status, morbidity, and mortality (e.g. Berg, Hassing, Thorvaldsson, &
Johansson, 2011; Idler & Benyamini, 1997; Idler & Kasl, 1995; Leibson et al., 1999;
Page 101
83
Menec & Chipperfield, 1997), it is nonetheless capturing a unique aspect of health
which is distinct from objective evaluations. Indeed, subjective and objective health
appears to share only five percent to 30 percent common variance (see Pinquart, 2001,
for meta-analysis). This is evidenced by the finding across numerous studies that as
people age, the association between subjective health and physical or functional health
decreases, with the oldest age brackets demonstrating the weakest associations
(Pinquart, 2001). Yet despite some degree of physical or functional health decline, on
average, those in younger old age cohorts report fairly positive self-rated health which
declines most strongly in the old-old (Rook, Charles, & Heckhausen, 2011), albeit at a
slower rate than which physical health declines (Jylhä, 2009)15
. Further, it appears that
as people move from young-old (i.e. 60-75 years) to old-old (75+ years) age, the
relationship between subjective health and mental health increases (French, Sargent-
cox, & Luszcz, 2012; Pinquart, 2001). This suggests that psychological factors,
including how older adults perceive their own ageing experiences, are associated with
subjective evaluations of health.
Various researchers (e.g. Barak & Stern, 1986; Barrett, 2003; Bowling, See-Tai,
Ebrahim, Gabriel, & Solanki, 2005; Demakakos et al., 2007; Hubley & Hultsch, 1994;
Hubley & Russell, 2009; Kaufman & Elder, 2003; Rubin & Berntsen, 2006; Steverink
et al., 2001) have reported associations between self-rated health and subjective age,
whereby feeling younger than one’s age is related to better perceived health. McGee and
colleagues (2011) also found that temporal aspects of the ageing experience was related
15 It has been suggested that a weakening association between self-rated health and physical health as
people age might be explained by factors such as social comparison with same-aged peers (i.e.
normalisation of physical impairment or chronic illness) and adaptation to physical health burdens over
time (French et al., 2012; Jylhä, 2009). While self-rated health is one of the most widely used measures of
health for which there is an abundance of empirical evidence, most researchers concede that it remains
one of the most poorly understood (Jylhä, 2009). The associations between self-rated health and health
outcomes are undoubtedly influenced by a multitude of contextual and methodological factors. For
instance, the ways in which the question is framed (e.g. global, self-comparative, or comparative with
same-age peers) and the response options of the question have been found to influence perceptions of
health differentially (Sargent-Cox, Anstey, & Luszcz, 2008). Further, self-ratings of health are understood
to reflect a complicated cognitive process (Idler, 1992) which involves different stages of assessment.
Jylhä (2009) observes that self-rated health “…constitutes a cross-road between the social world and
psychological experiences on the one hand, and the biological world, on the other” (p. 308). The author
goes on to propose a conceptual model which distinguishes the stages involved in individual health
evaluation. In brief, this model incorporates contextual factors such as conceptualisations of health (i.e.
taking into account how cultural and historical variations are evaluated and integrated into personal
history and knowledge of health and illness), individual differences (e.g. social reference groups, personal
health history, disposition), and cultural expectations and norms.
Page 102
84
to self-rated health, with higher scores on both of the APQ timeline dimensions (i.e.
chronic and cyclical) among older adults who rated their health less favourably. Further,
the strength of this relationship is influenced by age. Stephan, Demulier, et al. (2012)
examined whether chronological age moderated the relationship between self-rated
health and subjective age in a sample (N=1016) of adults ranging in age from 18 to 91
years. They found that while higher ratings of self-assessed health was related to
younger subjective ages in the middle-aged and older age cohorts, there was no such
relationship for younger age groups. This finding highlights the importance of
examining health and their psychological correlates within a lifespan developmental
framework, as the meaning of health and ageing beliefs varies as a function of where
someone is situated in their life course.
For the other APQ defined dimensions of SPA, McGee et al. (2011) reported that
more positive experiences of ageing (i.e. higher scores on the control and consequences-
positive dimensions, and lower scores on the consequences-negative dimension) were
associated with higher ratings of subjective health. Interestingly, in another study
(Bryant et al., 2012) where SPA were measured as psychosocial growth (on the AAQ:
see Section 3.6), higher scores on this positive ageing dimension were associated with
poorer self-rated health, as measured by the SF-12 physical component summary. The
authors of this research suggested that people who had experienced greater levels of
poor health may need to generate effective coping responses in order to build greater
resilience. While Bryant and colleagues did not speculate any further, it may be that
more adaptive coping responses then positively influences ageing experiences despite
the maintenance of negative self-ratings of health.
Page 103
85
Another subjective indicator of health that has been linked to SPA is self-reported
chronic medical conditions16
. Chronic medical conditions are most prevalent in older
populations, as they accumulate over years. Further, they are a leading cause of
disability in Australia (AIHW, 2014) and therefore have the potential to severely limit
daily functioning. Both cross-sectional and longitudinal studies (e.g. Demakakos et al.,
2007; Jang et al., 2004; Kleinspehn-Ammerlahn et al., 2008; Slotman, Cramm, &
Nieboer, 2017) have reported that more self-reports of chronic illness or disability is
associated with more negative SPA. However, this association is not clear cut. Wurm
and colleagues (2014) demonstrated the important role that contextual factors play
within this relationship. In their analysis of almost four and a half thousand German
adults (ranging from 40-85 years of age, with a mean of 62 years), they found that
district-level primary care supply buffered the relationship between health problems (as
measured by the number of self-reported chronic condition) and SPA. Specifically, even
when people identified living with higher disease burden, access to good quality
primary health care reduced negative SPA, as compared to those who did not have
access to such care.
5.3.3 Coping and SPA
Ageing is associated with various biological, cognitive, and social constraints that
might be appraised as stressful or taxing on the individual and which may subsequently
activate the coping process. As described in Section 4.2.1, individuals engage in a vast
array of coping mechanisms when faced with demands that exceed the resources of their
person (Lazarus & Folkman, 1984). For instance, substance use is one form of coping
that is often categorised as disengagement from the stressor.
16 Self-reports of the incidence of chronic medical conditions are frequently referred to as objective
markers of health within research designs. However, empirical investigations (e.g. Bergmann, Jacobs,
Hoffmann, & Boeing, 2004; Merkin et al., 2007; Okura, Urban, Mahoney, Jacobsen, & Rodeheffer, 2004)
which have examined self-reported medical diagnoses alongside medical and physician-rated data suggest
that accuracy of such self-reports varies by type and severity of the disease, by mode of data collection
(e.g. interviewer versus survey questionnaire), and by the populations being assessed. For instance, older
adults have been found to underreport existing medical conditions (Wu, Li, & Ke, 2000). These measures
are subject to a high degree of response error (Baker, Stabile, & Deri, 2004) and the data obtained is
rarely verified with clinical data. As such, self-reported chronic medical conditions are conceptualised as
a subjective marker of health within this body of work.
Page 104
86
In a large national sample of older adults (N=6576) drawn from TILDA, Villiers-
Tuthill and colleagues (2016) examined the associations between SPA and two key
health behaviours, namely smoking and alcohol consumption. The authors suggested
that engagement in such behaviours appears to be a coping mechanism in this group of
older adults. Results from this study indicated that more negative perceptions of ageing,
for example, stronger emotional representations and a chronic awareness of ageing (i.e.
timeline) were associated with increased use of both smoking and drinking harmful
levels of alcohol. On the other hand, the risk of concurrent smoking and harmful
drinking decreased with greater endorsement of items which measured positive
consequences of ageing. However, the findings from this study also point to a complex
relationship between SPA and substance use. Insofar as negative SPA were associated
with increased smoking and drinking, it was also found that a greater sense of control
over both positive and negative ageing experiences actually increased the risk for use of
both substances. Villiers-Tuthill et al. surmised that the influence of the control
dimensions could be accounted for by a bias to evaluate the risks optimistically in the
belief that future ageing could nonetheless be controlled. Holding such beliefs may
subsequently increase the risk for engaging in dangerous health behaviours. Overall,
this study highlights the different and sometimes counterintuitive ways in which the
various SPA dimensions relate to coping.
Robertson and Kenny (2016a) also utilised data from TILDA to investigate the
relationship between social engagement (predominantly capturing the structural
components of social networks) and SPA over two time points. Social factors are a
personal coping resource that are recognised as having at least a moderate influence on
the mental health of older people (Tajvar et al., 2016). Robertson and Kenny’s study,
which employed the Brief-APQ (Sexton et al., 2014: outlined in Section 3.6), found that
the perceptions an individual holds regarding their own age and the ageing process
appeared to influence social behaviour in later life, although in differing ways across the
various SPA dimensions. Of particular note was the influence of the control dimensions.
Specifically, it was observed that perceptions of less control over the negative and
positive aspects of ageing at baseline, was associated with declines in social
engagement at follow-up two years later. This finding provides tentative support for the
important role that the control over one’s own ageing plays in older adults’ abilities or
willingness to engage in particular coping strategies, such as remaining actively
Page 105
87
involved in community and leisure pursuits. Further, being chronically aware of one’s
own ageing was associated with greater disengagement from friends and family.
Interestingly, while SPA appeared to play a role in disengagement from social factors
over two years, it was not related to increasing social engagement despite participant
reports of an increase in engagement over the same time period. However, SPA were
only measured at baseline and given the dynamic nature of this construct, a different
picture may have emerged had these been measured alongside change in social activity
during the second wave of assessment.
Other studies which have examined the relationship between temporal aspects of
the ageing experience and coping are found within the literature, although many of these
have not focussed exclusively on older populations. In one longitudinal study
(Boehmer, 2007) of cancer patients (age range 22-86 years with a mean age of 63 years)
subjective age was found to be related to coping post-surgery at both the one and six
month follow ups. Specifically, patients who held younger subjective age identities
reported less use of avoidance-oriented coping strategies (e.g. denial) and more
meaning-focussed strategies (e.g. acceptance). Furthermore, changes on the subjective
age dimension influenced the type of coping strategies adopted, with those who felt
younger at the six month follow up versus the one month follow up increasing the use
of meaning-focussed coping, whereas those whose subjective age remained stable or
increased over time (i.e. felt older) employed more avoidance-oriented strategies six
months post-surgery. Boehmer concluded that this finding highlights that subjective age
feeds back on the coping strategies adopted by cancer patients. Indeed, there is evidence
from several longitudinal investigations which suggests that SPA may be an antecedent
of coping (Westerhof et al., 2014). Unfortunately, Boehmer’s study did not distinguish
between age groups to determine whether there might have been any differences in the
subjective age-coping relationships between younger versus older adults.
In an exploratory study involving 32 community-dwelling older adults, Keller,
Leventhal, and Larson (1989) found that while participants reported that the changes
associated with ageing were overwhelmingly negative, they were still able to maintain a
positive view of their ageing experiences if they believed they were able to cope
successfully. The coping strategies that the participants described through interview,
such as maintenance, compensation, and alteration to meaning were consistent with a
lifespan developmental perspective where self-regulatory processes such as goal re-
Page 106
88
adjustment enable individuals to view their own ageing, and that of others favourably.
In a similar vein, Wurm and colleagues (2013) found evidence that negative SPA
impedes the use of self-regulatory coping strategies of selection, optimization, and
compensation (this study is reviewed further in Section 5.4). Certainly, the evidence to
date demonstrates that individual differences in coping are related to SPA. Yet this line
of enquiry is still in its infancy and requires further research to understand the processes
at play more clearly.
5.3.4 Dispositional traits and SPA
Personality is another psychosocial construct which has received limited attention
by researchers investigating SPA. To our knowledge, there have been no studies which
have examined the relationship between personality and the APQ defined dimensions of
SPA. However, conceptually related dimensions of SPA have been examined. Stephan,
Demulier, et al. (2012) explored the relationships between all of the Big Five factors of
personality and subjective age but did so with a sample (N=1016) spanning the adult
lifespan (age range 18-91 years, mean age 49.5 years) to assess whether chronological
age would moderate any relationships. While extraversion and openness to experience
were positively associated with subjective age in the older cohorts, no such relationships
were found for conscientiousness, agreeableness, and neuroticism. Stephan and
colleagues suggested that both extraversion and openness to experience comprise facets
which are also characteristic of typical younger individuals (e.g. sociability, energy,
keenness to explore new ideas and experiences) and therefore it was unsurprising that
older individuals with these traits would feel younger than their chronological age.
However, the finding that conscientiousness and neuroticism in particular were
unrelated to subjective age in older adults is interesting. The authors speculated that
conscientious people may be more predisposed to identify with their own age group
because of the ageing stereotypes which prescribe ageing norms. While no conclusions
were drawn for the null findings regarding neuroticism, it is possible that the temporal
aspects of SPA are less relevant to those with a general propensity to experience
negative emotionality than other aspects of the ageing experience which were
unexplored within this study. Further, neuroticism can manifest in various ways (e.g.
avoidance, catastrophising) and may differentially influence how old or young an
individual feels.
Page 107
89
In contrast to the cross-sectional study of Stephan, Demulier, et al. (2012), Knoll,
Rieckmann, Scholz, and Schwarzer (2004) investigated the relationship between
conscientiousness and subjective age longitudinally in a sample of French cataract
surgery patients (age range 38-92 years, mean age 71 years) and found that older
patients who were higher in conscientiousness reported feeling younger. Specifically,
those high in conscientiousness with greater changes in visual acuity post-surgery
reported feeling younger over time, that is, at both pre- and post-surgery. Even in the
cases where surgery had little effect on vision and there was no change in subjective age
between the different time points, conscientious individuals still reported feeling
younger (at the same level) at both points in time. By comparison, despite great
improvement in visual acuity, those low in conscientiousness reported feeling older
post-surgery. A number of possibilities were raised by the authors to account for this
finding, one of which goes to conscientious individuals holding more realistic
expectations about surgical interventions. Yet the various ways in which SPA have been
conceptualised and measured has produced some inconsistencies in the available
evidence. For instance, while Knoll and colleagues reported that the more youthful
subjective ages of the highly conscientious individuals served to protect them from any
functional limitations associated with their health, others have found that characteristics
which define conscientiousness, such as the tendency to rigidly follow prescribed
norms, may be associated with more maladaptive levels of functioning as people age.
Shenkin et al. (2014) explored personality as an antecedent of SPA in a sample of
older, community-dwelling British adults (N=792) drawn from the Lothian Birth Cohort
1936. Measures of personality (along the Big Five factors) were taken when participants
were 70 years of age and the AAQ (Laidlaw et al., 2007: described in Chapter 3) which
measures ageing experiences across several life domains was administered to
participants five years later. The authors reported that conscientiousness (along with the
other four personality variables) was related to each of the life domains in directions
that might be expected. Specifically, more positive SPA in domains of physical change
and psychological growth were associated with high conscientiousness while the
domain of psychosocial loss was associated with low conscientiousness. These findings,
however, contrast with those reported by Bryant and colleagues (2014) who also
employed the AAQ. In their longitudinal study comprising older Australian adults
(N=421), they reported a negative association between conscientiousness and
Page 108
90
psychological growth. The psychological growth domain has a positive focus, reflecting
gains in wisdom and growth associated with ageing. It might be expected that
conscientious individuals, who tend to adapt to changes associated with health by
engaging in more positive health behaviours, would also be able to adapt to ageing-
related challenges and therefore view their own ageing as a time of growth. This,
however, was not found in this cohort of older adults which is somewhat concerning
given the associations reported elsewhere (see Section 5.2) between positive SPA and
better mental health. Alongside measurement issues, it is possible that other
considerations, such as cultural variations (i.e. French, British and Australian settings)
and participant characteristics (i.e. clinical versus non-clinical) influenced the
differential pattern of results reported in these studies.
Discrepancies are also found across studies which have explored the neuroticism-
SPA relationship. On the subjective age dimension, some investigators (e.g. Canada,
Stephan, Caudroit, & Jaconelli, 2013; Kotter-Grühn et al., 2009) have reported that high
neuroticism is related to feeling older while others (e.g. Hubley & Hultsch, 1994;
Stephan, Demulier, et al., 2012) have found no relationship. When measured as a
multidimensional construct, Hubley and Hultsch (1994) found that ideal age but not felt
age was associated with neuroticism. Thus, feeling younger or older than one’s
chronological age was inconsequential for those with a tendency to experience greater
levels of negative emotions but a desire to be younger was not. The authors reflected
that this may indicate that older adults attribute gains to youth which are no longer
available to themselves.
Jang and colleagues (2004) measured SPA in community-dwelling older Korean
adults with the ATOA subscale of the PGC (Lawton, 1975: refer to Section 3.6). This
measure largely reflects ageing satisfaction and is somewhat related to the APQ-
consequences dimension. They reported that, even after controlling for the effects of
sociodemographic and health-related factors, high levels of neuroticism were associated
with negative SPA. Kotter-Grühn et al. (2009) also found an association between
neuroticism and ageing satisfaction on the same measure. Thus, as might be expected,
people who were predisposed to experience greater levels of negative emotions were
also less likely to be satisfied with their experience of the ageing process. Similarly,
Shenkin and colleagues (2014) found that neuroticism was negatively related to more
positive aspects of ageing (i.e. the psychological growth and physical change domains
Page 109
91
of the AAQ) while being positively associated with psychosocial loss. Yet while Bryant
and colleagues (2014) reported that neuroticism was related to less positive attitudes
toward old age as a time of psychological growth, in contrast to the findings reported by
Shenkin et al., it was completely unrelated to the other two ageing domains (i.e.
psychosocial loss and physical change). This is a somewhat curious finding and is
suggestive that other factors that were not assessed within the study, such as the ability
of older adults to adapt to current circumstances, may be influencing the relationship.
Although there is a scarcity of research regarding SPA and the Big Five factors of
personality including conscientiousness and neuroticism, investigation into associations
between SPA and dispositional optimism is almost negligible. This is particularly
surprising as dispositional optimism reflects positive expectations about the future more
generally while one’s beliefs about their own ageing, in part, reflects expectations about
future ageing, taking into account past and present views of the process. Whether one is
likely to ascribe somatic change to ageing rather than an illness, whether one feels that
they will have control over their own ageing experiences, or how one understands the
consequences of ageing, for instance, all go to future (and current) expectations about
age and ageing. Further, SPA and optimism have both been associated with a numerous
health-related variables, yet whether there might be relationships among these variables
has barely been touched upon. Teuscher (2009) conducted a study to test a number of
theoretical explanations (i.e. motivational approach versus information-processing
approach) regarding the almost universal experience of older people feeling younger
than their chronological age. Optimism was examined because it is correlated with self-
enhancement (motivational approach) and the author wished to test whether it also
correlated with subjective age. She found that older adults with more youthful identities
did indeed score higher in optimism. The one other study to have addressed this
association was undertaken by Wurm and Benyamini (2014) who examined whether
optimism moderated the effects of negative SPA on health outcomes. This study is
reviewed in the following section of this chapter.
To summarise, sociodemographic characteristics have received the lion’s share of
attention by researchers interested in where differences in SPA may lie. Despite these
research endeavours, however, the findings have been far from unanimous. Other
individual and contextual factors are reported to explain a significant amount of the
variance across the SPA dimensions over and above individual differences in, for
Page 110
92
example, gender, age, or socioeconomic status. Indeed, it appears that the influence of
sociodemographic factors is modest at best. That markers of subjective health status are
associated with SPA is unsurprising given that health and ageing are so inextricably
connected. While the vast majority of research has observed this relationship with the
unidimensional measure of subjective age, a more interesting and complex picture
emerges when multiple dimensions are included in analyses. Further, other factors such
as chronological age and access to health care have been found to moderate these
associations.
Unfortunately, how individual differences in both coping and dispositional traits
may influence SPA is less clear at this point in time because they have garnered much
less research interest. It appears, based on the few studies which have examined
relationships among coping mechanisms and the APQ defined dimensions of SPA, that
the dimensions relating to control over ageing experiences has particular salience for the
types of coping that older adults will adopt. No studies have employed the APQ to
examine possible associations with personality traits. On the published evidence, there
does appear to be some trend towards high levels of conscientiousness and optimism
relating to positive SPA, and high levels of neuroticism relating to negative SPA.
However as with the research on coping, the limited findings vary according to the
measures of SPA employed across studies and other contextual factors.
5.4 Psychological pathways between SPA and mental health
As highlighted in Section 5.2 of this chapter, the relationships between
dimensions of SPA and mental health appear complex and it is improbable that they
would be explained by a simple mechanism. It is increasingly evident that there are
numerous contextual and individual factors which not only influence the dynamic
constructs of health (see determinants of health in Sections 2.2.2 and 2.2.3) and SPA
discretely but which are also likely to operate as underlying mechanisms to influence
the SPA-mental health relationship. Nonetheless, at this point in time, there is
insufficient data to support this assumption. To date, investigations which have explored
potential pathways between SPA and health in general are few and far between, and
even fewer have examined mental health specifically. Further, while it is understood
that SPA can influence health through physiological, behavioural, and psychological
pathways (Levy, 2009; Westerhof et al., 2014; Wurm et al., 2013), the effects of
Page 111
93
psychological mechanisms have received much less attention by researchers. This last
point alone is particularly intriguing given that psychosocial factors have been identified
as some of the more dynamic and thus modifiable determinants of health. It has been
reported that individual differences in psychological resources do influence differences
in the physical function-SPA relationship (Sargent-Cox et al., 2012a) yet there remain
significant gaps in our knowledge regarding which psychological factors are most likely
to impact on the relationship between SPA and mental health.
The key objective of this thesis is to investigate psychosocial pathways between
the multiple dimensions of SPA and mental health, specifically, to examine the roles
that coping and personality may play. Regrettably, as iterated in Section 5.2,
associations between SPA and mental health only began in earnest quite recently and
subsequently, there is a dearth of published studies which have explored possible
psychosocial pathways between these constructs. The brevity of the following review is
a reflection of this. The studies included hereinafter are limited to those which have
examined coping or personality as variables which either contributes towards explaining
the relationship between SPA and mental health or alternatively, which influence the
strength of this association. Further, none of the studies discussed in this section of the
review have employed a self-regulatory framework to test the multiple dimensions of
SPA. That is, we have been unable to find any studies which have tested the SPA-
psychosocial-mental health pathway by employing the APQ (Barker et al., 2007). A
final key point to address before discussing the findings goes to the direction of the
SPA-mental health relationship.
Establishing the direction of causality had been a somewhat difficult task until
quite recently with the introduction of more sophisticated statistical modelling
techniques (Sargent-Cox et al., 2012b). Clarity regarding the temporal relationship is
not only important for advancing our knowledge of ageing experiences and
subsequently expanding current life span theories of development but also has profound
implications from a clinical perspective. On the one hand, if SPA have a greater impact
on health than vice versa, then it would make more sense to focus clinical resources on
primarily targeting negative stereotypes of ageing, at the level of the individual and
more broadly within society. On the other hand, if health is an antecedent of SPA, then
resources might be better utilised by addressing current health needs more directly (e.g.
Page 112
94
adaptive strategies) rather than attempting to shift the way ageing is perceived (Wurm
et al., 2007).
According to Levy’s (2009) stereotype embodiment theory (see Section 3.2), SPA
are constructed through a lifetime of exposure to ageing stereotypes alongside personal
expectations and experiences. Ageing stereotypes are understood to be internalised from
a very young age and gain salience from self-relevance as people age. Because these
stereotypes amass across a lifetime and are assimilated into one’s self-concept, Levy
and colleagues contend that SPA have a greater effect on health than vice versa, as
earlier longitudinal investigations (e.g. Levy, Slade, & Kasl, 2002; Levy, Slade, Kunkel,
et al., 2002) appeared to suggest. Nevertheless, as Sargent-Cox and colleagues (2012b)
observe, hypotheses that physical health changes might drive SPA or that both
constructs share a common mechanism (e.g. generalised optimism, control beliefs)
which allows them to co-vary together across time are equally conceivable. For
example, it is plausible that the concept of old person takes the form of the ‘other’ until
such a time as a health-related event leads a person to identify with it, perhaps at a point
in time when the individual comes to know the fallibility of their own physical state.
Certainly there is empirical evidence (e.g. Bryant et al., 2014; Jang et al., 2004; Sargent-
Cox et al., 2012a) demonstrating a degree of reciprocity among health and ageing
experiences.
However, more recent longitudinal studies from Australia (Sargent-Cox et al.,
2012b) and Germany (Wurm et al., 2007) have tested the causal direction of the
relationship by using cross-lagged panel analyses. The findings from these
investigations lend considerable weight to the position that SPA does indeed have a
stronger impact on health than vice versa. To our knowledge, only two other
longitudinal investigations (Wurm & Benyamini, 2014; Wurm et al., 2013: reviewed
below) have explored mechanisms which influence the relationship between SPA and a
specific measure of mental health, although the direction of these relationships were not
tested. Nonetheless, on the basis of the proposed theoretical framework (Levy, 2009)
and the empirical findings reported by Sargent-Cox et al. (2012b) and Wurm et al.
(2007), SPA are treated as an antecedent to mental health within the current study (see
Chapters 11 and 12).
Page 113
95
5.4.1 Coping mechanisms as mediating variables
A central premise of the CSM is that illness perceptions guide coping and
adjustment to illness (H. Leventhal et al., 1984: refer to Chapter 3). Specifically,
Leventhal and colleagues proposed a mediation model whereby the cognitive and
emotional representations of illness experience which are elicited by health-related
stimuli is incorporated into a personally meaningful representation of a particular illness
(i.e. illness perception). This perception of illness then influences the type of coping
strategy selected, which in turn influences how well an individual adjusts to a specific
illness or health threat (Hagger & Orbell, 2003). This self-regulation model posits a
dynamic process of appraisal and feedback, whereby evaluations of success (i.e.
whether symptoms improve or worsen over time) may result in changes to the illness
perceptions and/or coping strategies (Dempster et al., 2015; H. Leventhal et al., 2008).
There does appear to be a common-sense pattern of relationships between illness
perceptions and coping responses. In Hagger and Orbell’s (2003) meta-analysis of 45
empirical studies which had employed the CSM framework, a stronger illness identity, a
more chronic awareness of illness, and a belief that an illness has severe consequences
were positively related to more avoidant and emotionally expressive coping strategies.
By contrast, a greater sense of control over illness experiences was related to more
active or problem-focussed strategies. Investigations into the associations between
coping and SPA (refer to Section 5.3.3) have been scarcer however the available
evidence suggests a similar pattern of relationships to those found for illness
perceptions and coping.
While some cross-sectional research has found evidence for coping mediating the
relationship between illness perceptions and illness outcomes, no mediation effects have
been observed within longitudinal studies (Dempster et al., 2015). There remain many
inconsistencies within the literature (possible explanations for theses inconsistencies are
outlined in Section 3.4.2) and researchers agree that the role of coping in the area of
illness perceptions requires further attention. Despite the mixed empirical findings
reported within the illness perceptions literature, however, the current study has drawn
on the CSM as a theoretical framework for examining SPA in older adults. Barker and
colleagues (2007) have suggested that SPA may also guide coping and adjustment to
one’s own age and the ageing process. This has provided the rationale for studying
coping as a possible mediating variable within the current study.
Page 114
96
To date, only one study has specifically examined the role that coping
mechanisms play in the relationship between SPA and mental health. Wurm et al.
(2013) assessed whether the use of selection, optimization, and compensation (SOC: P.
B. Baltes & Baltes, 1990) strategies might explain the effects of SPA on health and
wellbeing variables, including life satisfaction over time. The SOC model is a
developmental lifespan approach which explains how older people allocate resources
(i.e. cognitive, social, or functional) for managing age-related gains and losses (Charles
& Carstensen, 2009). Within this framework for successful ageing, selection is an
accommodative process (see Table 1) which involves the selective pursuit of goals and
outcomes, while optimisation (i.e. refining or maintaining the means or resources to
achieving desired goals / avoiding undesirable goals) and compensation (i.e. a
functional response to losses in goal-relevant resources) are assimilative processes (P.
B. Baltes et al., 1999; P. B. Baltes et al., 2006; Skinner et al., 2003). More specifically,
Wurm and colleagues were interested in understanding the impact of SPA on the use of
SOC strategies in situations where a serious health event (SHE) might or might not have
occurred.
The authors (Wurm et al., 2013) of this study measured one dimension of SPA,
namely, ageing as being associated with physical losses (Steverink et al., 2001: outlined
in Section 3.6). The sample comprised 309 older adults (65+ years of age) drawn from
the German Ageing Study who identified as having multiple illnesses. Moderated
mediation analyses were run on data collected from two time points over a six month
period. The following findings were reported. Negative SPA at the first time point was
related to a decreased use of SOC strategies at the second time point. Further, negative
SPA served as a moderator in the relationship between an SHE and SOC use. That is, in
the event of an SHE, older adults increased their use of SOC strategies compared to
those who had not experienced such an event, and further, those with less negative SPA
increased their use of SOC strategies more so than those with more negative SPA.
While negative SPA were not directly associated with life satisfaction (as it was with
physical functioning and self-rated health, the other two dependent variables measured),
SOC strategy use did mediate the relationship between negative SPA after an SHE and
life satisfaction, with those reporting more negative SPA also reporting lower life
satisfaction via a reduction in the use of adaptive coping strategies.
Page 115
97
Overall, the study by Wurm and colleagues (2013) provides some extremely
valuable insights into the role of coping mechanisms within the dynamic SPA-health
relationship over time (albeit limited to the two time points). Further, it offers some
direction for possible points of intervention (e.g. addressing negative ageing beliefs
directly, behaviour change through coping mechanisms) to support older adults who are
experiencing poor mental health. However, as the authors themselves noted, a limitation
of this investigation is that only negative SPA, as measured by ageing associated with
physical losses, was examined. Given the multidimensional nature of SPA, a more
nuanced picture might emerge if multiple aspects of the ageing experience were
examined concurrently. Further, as coping encompasses such a broad array of
responses, it would be useful to extend on this initial study to examine whether other
aspects of coping might also underpin the relationships between SPA and mental health
(beyond the one measure of life satisfaction). Finally, while this study sheds light on the
use of coping strategies in the event of an SHE, it would also be informative to examine
potential pathways between SPA and mental health in older populations who have not
recently experienced an acute or serious incident but who still face challenges or
stressors associated with their own age and the ageing process.
5.4.2 Dispositional traits as moderating variables
Hooker and McAdams (2003) state that, with the exception of structural aspects,
“personality is arguably the driving force behind all antecedents of successful aging” (p.
296). SPA are a specific psychological marker of successful ageing (Lupien & Wan,
2004) and the assertion that personality may be guiding these ageing experiences is
augmented by several recent longitudinal investigations which examined antecedents of
SPA (e.g. Bryant et al., 2014; Shenkin et al., 2014). For instance, Shenkin and
colleagues reported that dispositional traits were the strongest predictors of ageing
experiences and attitudes (as measured by the AAQ domains) over and above other life
course factors such as demographics, cognition, and physical function. Therefore, it is
entirely probable that characteristic traits of an individual will also influence the
relationships observed between SPA and mental health, such as those discussed in
previous sections of this review. Certainly, the CSM specifically posits that because
self-regulation occurs within a personal and social context, aspects of the self (including
personality) may moderate the self-regulation process (H. Leventhal et al., 1998). There
Page 116
98
is little empirical evidence to draw upon at this stage however it is plausible that the
more stable dispositional traits have a moderating effect on the association between the
more malleable construct of SPA and mental health. While there is evidence on some
indices that personality is more malleable than it was once thought to be (as discussed in
Chapter 4), there are still many questions that have yet to be answered in regards to
intentional personality change, for instance, the strength and endurance of any observed
effects. As such, it might be useful to focus on the more modifiable variables within
pathways between SPA and mental health (see Chapter 6 for clinical implications).
As with coping, research regarding the role that dispositional traits may play in
the path between SPA and mental health has been sparse. Wurm and Benyamini (2014)
are a few of the researchers to have turned their attention to this topic. Again, drawing
on data from the German Ageing Survey and focussing on one aspect of SPA (ageing as
associated with physical losses), the authors sought to test whether an optimistic outlook
might moderate the effect of negative SPA on a number of health variables including
depressive symptoms. Data was collected at two time points, with over 6200 adults (age
range 40-85 years, mean age 61.5 years) participating in the first wave, 64 percent of
whom were assessed again at time two. Over the three year period, negative SPA
explained worsening depressive symptoms (along with deterioration on the other two
health variables, namely self-rated health and physical functioning). However, these
levels of deterioration were slowed in highly optimistic individuals; that is, optimism
buffered the effects of negative SPA on depression. While this study included both
middle-aged and older adults, differences were not observed between the cohorts. The
findings reported by Wurm and Benyamini have significant clinical implications. These
are discussed in Section 6.3. Unfortunately, as with other investigations reported in this
section, only the one measure of mental health was included in this study alongside one
dimension of SPA. Thus, while it contributes enormously to the (currently very bare)
field, it provides limited information for the current study.
There do not appear to be any other studies of ageing experiences and mental
health which have examined the role of optimism, nor any which have used the CSM as
a framework for exploring the moderating role of personality on the SPA-mental health
relationship. However, there have been a number of researchers (e.g. Hurt et al., 2014;
Karademas et al., 2011) who have recently explored these pathways within the illness
perceptions literature. For instance, in a sample of adults (mean age 59 years) with
Page 117
99
chronic cardiovascular disease, Karademas and colleagues employed the CSM
framework to first examine whether health status (physical functioning, emotional
wellbeing, and self-rated health) mediated the relationship between illness perceptions
and illness-related helplessness (an indicator of ‘end-stage’ appraisal of outcomes).
Each of the health variables was found to mediate the relationships across varying
dimensions. The authors then examined whether optimism might moderate any of these
pathways. The overall finding was that high levels of optimism protected people from
experiencing helplessness, even in those with low levels of health. Interestingly,
however, it was reported that an optimistic outlook not only interrupted the cycle of
negative illness perceptions but also weakened the effects of positive illness
perceptions, a finding that was unexpected. The authors suggested that one explanation
for this finding is that optimistic individuals are guided more by their generalised
expectations than by specific illness-related information or current health status.
Investigations such as this one are informative for the current study in that they have
adopted the CSM to explore the role of personality. However, SPA and illness
perceptions underpin discrete aspects of the self, and as such, personality is likely to
impact on each in unique ways.
The only other published study which has assessed dispositional traits (along the
Big Five factors) as moderating variables in the SPA-mental health association is that
by Hubley and Hultsch (1994). In this instance, SPA were measured as both felt and
ideal age (i.e. subjective age dimensions). The authors assessed these effects in 355
community-dwelling older adults between the ages of 55 and 85 years, and reported that
while none of the trait variables moderated the felt age-wellbeing relationship,
neuroticism (and openness to experience) did impact the relationship between ideal age
and affective states. This finding demonstrates the importance of examining multiple
dimensions of the ageing experience when seeking to understand not only their
relationships to mental health variables but also the impact that other aspects of self
may have on these relationships. Unfortunately, whether the other personality variable
of interest for the current study, that is, conscientiousness, might attenuate or intensify
the SPA-mental health relationship has not been considered within the literature. Knoll
et al. (2004) reported a moderating effect for conscientiousness on the pathway between
functional health and subjective age but this study does not speak to mental health
functioning as driven by ageing experiences.
Page 118
100
A very recent study (O’Shea, Dotson, & Fieo, 2016) has also looked at whether
SPA and self-efficacy might serve to mediate the relationship between personality
(along the Big Five factors) and depressive symptoms. Drawing on Hooker and
McAdam’s (2003) six-foci model of personality, O’Shea and colleagues conceptualised
SPA as a process or state of personality. The six-foci framework, which stems from
developmental systems theory, integrates processes and structures of personality across
different levels and assumes that each level is linked in complex and dynamic ways.
O’Shea et al. hypothesised that the relationship between trait-based aspects of self and
depressive symptoms would be mediated by other processes of personality (i.e. SPA
and self-efficacy). In a cross-sectional sample (N=3507) of older American adults who
were part of a larger national longitudinal study, the authors reported that SPA (as
measured by an eight-item scale developed specifically for the longitudinal study
survey) mediated the effects of both neuroticism and conscientiousness (and
extraversion) on depressive symptoms. Further, the indirect effects of SPA on the
neuroticism-depression pathway were especially noteworthy, being stronger than the
indirect effects of self-efficacy. Along a similar line, SPA have also been found to
mediate the relationship between neuroticism and self-rated health (Moor, Zimprich,
Schmitt, & Kliegel, 2006).
In sum, while it is highly probable that multiple mechanisms are involved in the
relationship between SPA and mental health, and further, that there is a strong
theoretical rationale for investigating potential pathways between these two constructs,
there is currently a dearth of research on this topic. The only published study to have
explored and found evidence to support the hypothesis that coping strategies mediate
the relationship between SPA and a measure of mental health is that of Wurm and
colleagues (2013). Similarly, only two studies were found, which specifically examined
whether dispositional traits served to moderate the relationship between SPA and
measures of mental health. Of the studies which examined pathways, none have
employed the self-regulation framework which guides the current body of work. As
such, there are many more questions which have yet to be answered regarding how the
multiple dimensions of SPA (as defined by the APQ) might differentially influence
mental health through coping, or how personality variables might impact on these
distinct relationships. Further, the aforementioned studies have not focussed on mental
health specifically and consequently, multiple indicators of this aspect of health have
Page 119
101
been absent within the study designs. Certainly, the available evidence is promising yet
it is clear that further empirical studies are required to elucidate how SPA might exert
an influence on the mental health of older adults.
5.5 Conclusion
Despite the limited number of studies which have addressed relationships between
the multiple dimensions of SPA and mental health, and even fewer which have
specifically examined SPA within the CSM framework, the overall evidence suggests
that SPA relates to the psychological health and wellbeing of older adults in substantive
and meaningful ways. At this point in time, the evidence is mixed regarding the
influence of individual differences and there are significant gaps in the literature
regarding the role that psychosocial mechanisms may play in the pathway between SPA
and mental health. What is demonstrated throughout this review, however, is that SPA
are highly sensitive to a variety of contextual and situational factors, which serves to
emphasise the ways in which these ageing experiences are shaped by a range of
intrapersonal and interpersonal factors. Greater clarity regarding how such factors
operate and the processes which contribute to older adults ageing awareness is, as Diehl
and colleagues (2015) observe, “fundamentally important for understanding the ageing
self and its expectations, goals, actions, and identity processes” (p. 17).
The truism that population ageing is placing ever-increasing and unprecedented
demands on societies needs to be met with evidence-based policy and practice which
support older adults to age in a healthy way, promoting wellbeing and maintenance of
independence. Given that SPA are an indicator of successful ageing which can serve to
either foster growth or impose constraints on the developmental trajectory of the
individual, there is an imperative to better understand how these ageing experiences
operate to influence health and wellbeing. Ultimately, a better understanding of how the
SPA-mental health dynamic operates will help to inform and guide clinical
interventions aimed at maximising gains and minimising losses in the later stages of
life. As discussed in the following chapter, while there is scope for clinical treatment to
target SPA for change, evidence for longer-term effects are at present unknown. Chapter
6 outlines some of the preliminary evidence which has emerged from brief intervention
studies that have attempted to change SPA, as well as highlighting other potential
Page 120
102
avenues for tackling the effects of less favourable views of ageing and some important
considerations regarding the implication of such treatment.
Page 121
103
Chapter 6 Clinical implications: Current findings and
future directions
Page 122
104
6.1 Introduction
The aim of this chapter is to provide a summary of the current research findings
from intervention studies that have sought to change SPA; either directly, by targeting
negative ageing cognitions, or indirectly, by employing other strategies which may
promote more favourable views of ageing. Possible future directions for clinical
intervention are briefly outlined, along with several other factors which warrant further
consideration by researchers seeking to develop interventions aimed at changing SPA.
6.2 Changing SPA: Findings from brief intervention studies
Various experimental studies (see Dionigi, 2015, and Levy, 2009, for reviews of
this research) have demonstrated how priming negative or positive ageing stereotypes,
either implicitly or explicitly, effects the performance of older adults on a range of
measures (e.g. physical and cognitive health, physiological states). However, to date,
only a handful of studies have attempted to change SPA, with varying degrees of
success. For example, Kotter-Grühn and Hess (2012) hypothesised that priming people
with positive and negative stereotypes of ageing would lead to more positive and
negative views of SPA, respectively. Specifically, they assessed how subjective age and
satisfaction with ageing would be affected in adults (age range 18-92 years) when
primed with images (e.g. smiling versus sad/grumpy faces) and descriptions (e.g.
active/full of life versus senile/lonely) of older people. The researchers were surprised
to find that priming with positive SPA actually had a counterintuitive effect, that is,
middle aged and older adults in good health did not feel more satisfied with their ageing
and further, felt older after the experimental manipulation. Kotter-Grühn and Hess
suggested that these effects might be accounted for by upward social comparisons
whereby the individual’s own positive self-perception is challenged when presented
with images of happy, healthy same-aged adults. As was expected, younger
participants’ subjective age was unaffected by any prime.
Social comparison effects have also been observed in experimental studies where
SPA have reportedly changed in a more positive direction. A number of researchers
(e.g. Miche & Wahl, 2013; Stephan, Chalabaev, Kotter-Grühn, & Jaconelli, 2012) have
provided favourable feedback to participants following prescribed tasks to assess how
this influences SPA. When participants are informed that they have performed better on
Page 123
105
these tasks than many of their same-aged peers or even made less mistakes than younger
participants, they reported younger subjective ages post-test compared to pre-test. Other
types of interventions have also been shown to increase positive SPA in older adults.
For instance, in a randomised controlled trial, Wolff, Warner, Ziegelmann, and Wurm
(2014) included a ‘views-on-ageing’ component within an intervention designed to
increase physical activity in older adults. In addition to behaviour change techniques to
encourage physical activity, one out of the three groups of participants also received the
ageing views intervention which included information about the positive aspects of
ageing, and techniques to identify and challenge negative thoughts about ageing. The
authors reported that the group that had received the full intervention had more positive
attitudes towards their own ageing after the 10-month trial, and further, that these
attitudes were related to an increase in physical activity. Conversely, a number of
exercise intervention studies (e.g. Klusmann, Evers, Schwarzer, & Heuser, 2012;
Sarkisian, Prohaska, Davis, & Weiner, 2007) of varying durations have demonstrated
that perceptions of one’s own ageing become more positive when activity levels are
increased.
The results from these preliminary studies appear to suggest that SPA are
amenable to change via various strategies, including the provision of positive social
comparison feedback, dissemination of information relating to the positive aspects of
ageing, training in how to identify and challenge negative thoughts and beliefs (i.e.
cognitive-behavioural techniques), and lifestyle changes such as increasing physical
activity. However, at this point in time, there is no available data to illustrate the longer-
term effects of such interventions, or who might benefit the most from treatment
(Kotter-Grühn, 2015). SPA are informed, in part, by broader societal views and
expectations of ageing (i.e. ageing stereotypes). Societal views on ageing, particularly
within individualistic, capitalist economies where older people are treated as either a
drain on society or, alternatively, as a consumer target for marketing (e.g. anti-ageing
industry) are unlikely to change in the short-term. While concerted public policy efforts
may go some way to tackling ageist beliefs more broadly, societal views of ageing
remain, for the most part, largely negative. As people are embedded within this broader
social context, it is likely that changing SPA and further, maintaining these effects over
the long-term will present a serious challenge.
Page 124
106
6.3 Future directions for clinical intervention
Given the potential problem of targeting SPA for change in isolation, another
approach to treating the negative effects on mental health through SPA might be to
instead target psychosocial factors which are found to influence this relationship.
Psychological constructs are generally considered amenable to change and may
strengthen adaptive processes. Should SPA be found to guide coping, and coping in turn
influence mental health in older adults, one option may be to focus interventions
primarily on the coping resources and abilities of the individual with specific regard to
ageing experiences. As an adjunct to targeting coping, other strategies which have
already been identified as potentially beneficial for increasing positive perceptions of
the ageing experience (e.g. challenging negative thoughts of ageing, or disabusing
people of ageing misconceptions) might be integrated into the treatment. Further
research to establish what role coping might play in the SPA-mental health relationship
is needed first to assess whether this may be a viable treatment option.
Knowledge about who might benefit the most from such treatments could also
guide clinical decisions in terms of where resources should be directed and the types of
treatment approaches to implement. For instance, if certain dispositional traits are
identified as influencing the strength of the SPA-mental health relationship in a way
which results in more negative outcomes for the individual, one option may be to focus
on modifying facets of the trait (see Section 4.2.3 which describes some promising
results for trait change in healthy populations). Wurm and Benyamini (2014) found that
optimism buffered the adverse effects of SPA on depressive symptoms and suggested
that one approach to treatment might be to teach skills which promote a more optimistic
outlook. Greater optimism is associated with the use of more adaptive coping strategies
(Aspinwall, 2005; Conversano et al., 2010) so increasing positive expectations about the
future might support coping resources. While personality traits are still understood to be
less malleable than other psychological variables, particularly along the Big Five
factors, knowledge about their potential impact on the relationship between SPA and
mental health could be a useful tool for clinical assessment and for tailoring treatment
programmes to enhance outcomes for older adults. However, it would be premature to
apply this clinically at present. A priority at this point in time is to empirically establish
what, if any role personality plays in the pathway between SPA and mental health.
Page 125
107
6.4 Considerations for the application of interventions
As highlighted throughout the review in Chapter 5, the dynamic relationships
observed between the multiple dimensions of SPA and mental health, are complex and
multifaceted. In considering the implications for intervention, therefore, there is an
imperative for researchers first and foremost to examine these relationships in sufficient
depth so that the nature of the problem, and hence the features of intervention (i.e.
approach and design) most likely to be of benefit, is indicated. Insofar as empirical
investigations have contributed invaluable insights into the relationship between SPA
and mental health (and health more broadly), the heavy reliance on correlational data
has been problematic for establishing directionality between the variables or
ascertaining how other variables of interest (for example, psychosocial factors) might be
influencing these pathways. If the goal of patients and clinicians alike is to decrease
emotional suffering and/or improve subjective wellbeing, a clear understanding of how
the variables influence one and another is necessary for determining where to focus
clinical resources. While several recent longitudinal investigations (reviewed in Section
5.4) have illuminated the question of directionality to some degree, at least for the SPA-
physical health relationship, more research designs which look at the cause-effect and
time-ordered relationships for SPA and mental health are needed.
A number of other salient points have been raised regarding our current
understanding of ageing experiences and how these might influence potential avenues
for intervention. Kotter-Grühn (2015) poses the very pertinent question of whether the
goal of changing negative SPA, for instance, implementing strategies designed to make
older adults feel younger, is actually implying that there is something wrong with
holding negative or, some might argue, more realistic SPA. Further, if SPA are to be
addressed clinically, the ways in which these ageing experiences are conceptualised
may need to be revised. Dimensions of SPA that are deemed both positive and negative
have been linked to poorer mental health functioning. For instance, while a younger
subjective age is generally framed as a positive SPA, it has been associated with
negative mental health states (e.g. Montepare & Lachman, 1989) while feeling older is
not necessarily any more detrimental for wellbeing than feeling younger (e.g. Mock &
Eibach, 2011). Dionigi (2015) observes that the tendency to express a positive-negative
binary in studies of ageing stereotypes can obscure the complexities of the effects on
Page 126
108
older adults. Likewise, viewing dimensions of SPA as either having a positive or
negative valence effectively masks the complexities of these ageing experiences in older
adults, and how in turn they may be influencing mental health. These are just several
points which warrant further consideration when considering treatment pathways.
6.5 Summary and conclusions
In very recent years, researchers have turned their attention to the question of
whether less favourable perceptions of one’s own age and ageing can be altered through
intervention. While various priming experiments have demonstrated that negative or
positive ageing stereotypes can influence the performance of older adults on a range of
functional measures, only a handful of researchers have attempted to change SPA
through experimental manipulation. These studies have produced some inconsistent
findings; there is evidence to suggest that priming older adults with more favourable
ageing stimuli may, in some instances, result in older adults experiencing greater
dissatisfaction with ageing than prior to intervention. While other studies provide
preliminary evidence that strategies for changing SPA including positive social
comparison feedback, cognitive-behavioural techniques, and lifestyle factors such as
physical activity may serve to make older adults feel younger or to have more positive
attitudes towards ageing, there is currently no empirical data regarding the longer-term
effects of such treatments. What’s more, there are broader ethical questions around
changing SPA which have yet to be fully explored. For instance, is the goal of making
people feel younger actually reinforcing societal stereotypes of ageing that there is
something wrong with older age? And given that individuals are embedded within a
broader social context, is it helpful or even realistic for individuals to challenge personal
ageing beliefs when negative societal views of ageing are still likely to impact on their
daily lives? These are just some of the many questions which undoubtedly need
attention before meaningful and enduring clinical treatments might be implemented.
Another important consideration for treatment development and efficacy goes to
the ways in which SPA have been conceptualised and measured within the literature. As
highlighted in Chapter 3, until quite recently, there had been a distinct lack of theorising
on subject ageing constructs (Diehl et al., 2015) which may account for some of the less
sophisticated approaches to measuring SPA over the years. While SPA are now
recognised as a complex, multidimensional construct, a number of measures still reflect
Page 127
109
the tendency to view ageing experiences as either positive or negative, or as a global
evaluation. Such conceptualisations mask the complexities of SPA and in turn, their
relationship to mental health or other variables which might play a role in these
relationships. By contrast, viewing SPA within a self-regulation framework allows for a
shift away from binary notions of ageing experiences, which potentially limits treatment
options and efficacy, and instead enables the multifaceted nature of SPA to be
approached as a process underpinning adaptation. This is congruent with lifespan
theories which acknowledge the ageing process as a normal developmental period
characterised by both gains and losses. Indeed, successful ageing more broadly speaks
to how well an older individual will adapt to such gains and losses.
Applying a self-regulation framework to examine the complex relationships
between SPA and mental health is also useful for examining how other psychosocial
mechanisms may influence these pathways. Given that psychosocial factors are
amenable to change, identifying which variables influence the SPA-mental health
dynamic may prove promising for addressing the effects of less favourable ageing
experiences indirectly. For instance, clinical treatments might target coping responses
around age-related beliefs which may strengthen adaptive responses and in turn
influence SPA. Equally, if certain dispositional traits are identified as influencing the
strength of the SPA-mental health relationship in a way which results in more negative
outcomes for the individual, another potential avenue for intervention may be to focus
on modifying facets of the trait. Given the vast array of possible mechanisms which
might be implicated in the SPA-mental health dynamic, and our currently limited
knowledge about such relationships, there is a clear need for further research. The
remaining chapters of this thesis address this need by empirically investigating the
relationships between SPA and mental health in a cohort of older, Australian adults, and
examining the role that psychosocial mechanisms play in these relationships.
Page 128
110
Chapter 7 Methodology
Page 129
111
7.1 Introduction
This chapter describes how the research questions, initially outlined in Section 1.4
will be investigated within this thesis. Specifically, the research design and data
collection methods are described first, before an overview of the participant
characteristics and research procedure is provided. The survey questionnaires which
were utilised for the first wave (Time 1) and second wave (Time 2) of data collection
are described and details regarding their psychometric properties are presented. Finally,
the data handling and analysis methods are explained.
7.2 Research questions
The research questions which this thesis aims to address were initially outlined in
Section 1.4. To reiterate:
1. Is the self-regulatory framework adopted for this investigation an appropriate
model for understanding SPA in this sample of older Australian adults?
2. How are SPA related to sociodemographic factors and subjective health status
and will these relationships differ across groups?
3. How are SPA related to mental health and will these relationships differ by age
or self-rated health status?
4. How are SPA related to psychosocial factors and will these relationships differ
by age or self-rated health?
5. Will coping mechanisms indirectly influence the relationships between SPA and
mental health over time?
6. Will dispositional traits moderate the relationships between SPA and mental
health?
7.3 Research design
To address the research questions (see Section 7.2), a quantitative research design
was implemented which included both cross-sectional and repeated measures survey
data. Survey data was collected at two time points; Time 1 between August 2011 and
March 2012, and Time 2 between April and August, 2013. The data was collected at
both time points included the same measures with one exception; an additional measure
was added to the second survey (as described in Section 7.4). Participants were
recruited via three key streams from across the Australian regions of the Illawarra and
Page 130
112
south Sydney: community and medical organisations/facilities (e.g. University of the
Third Age17
, retirement communities, recreational clubs etc.), social media advertising,
and press release.
The first stage of the recruitment process entailed contacting the community and
medical organisations/facilities via telephone with a brief explanation of the research
aims and participant requirements. The target demographic was older adults (55 years of
age and over) living in the community and therefore the range of organisations/facilities
selected for contact were ones which catered to, or comprised this population. The
organisations/facilities that agreed to participate (n = 16) were given the option of either
distributing an information sheet (Appendix A) and contact information of the
researcher out directly to their members/clients, displaying an information leaflet with
researcher contact information in their offices or newsletter, or to have information
about the project presented by the researcher at a meeting facilitated by the
organisation/facility. The presentation provided group members information about the
project background, aims, participant requirements, confidentiality and consent.
Immediately following the presentation, interested individuals were supplied with a
form requesting their contact information for survey distribution. Individuals were able
to complete the form at the time, or take it home to complete and return via postal mail.
Two hundred and fifty-five individual members or clients expressed an interest in
participating.
While participants were being recruited from across community and medical
organisations/facilities, an advertisement for participation was placed with the social
media website Facebook. This advertisement specifically targeted the older
demographic within the specified regions of Australia. Facebook users who were
interested in participating were not required to contact the researcher directly as a link to
the online survey platform was incorporated into the advertisement. In all, 185
17 The Third Age has been defined as "the period in life of active retirement" (Oxford English Dictionary,
2017). Universities of the Third Age (U3As) are not-for-profit, voluntary organisations that operate
globally (having stated in France in 1968) to provide low-costs educational programmes for older adults
in this phase of their lives. The organisation states that they are “basically self-help groups built on the
premise that collectively older people have the skills and knowledge to provide learning opportunities
(education) for themselves” (The U3A Network NSW, 2017).
Page 131
113
Facebook users responded to the advertisement by clicking on the link to the online
survey platform.
The final stage of recruitment comprised a press release which was distributed
across the Illawarra region of New South Wales. The initial release was posted on the
University of Wollongong website via the media department and local media outlets
were alerted to the release. Three local radio stations and one television outlet contacted
the researcher for interviews about the project which were produced for their news
features. This resulted in 126 expressions of interest to participate.
In total, 566 individuals expressed an initial interest in participating in the
research by either requesting a survey to complete or by accessing the online survey
directly via social media. Sixty-one of these initial interests failed to respond after
survey materials were distributed while another three reported that they were unable to
complete the survey due to life stressors (e.g. illness). One hundred and thirty-four
returned surveys were missing substantial data, either due to participants failing to
complete a number of the measures in their entirety or to most measures missing a large
number of items. These surveys were therefore excluded from the study.
7.4 Participants and procedure
7.4.1 Time 1
The final sample comprised 368 (65.02%) older, community-dwelling adults, all
of whom self-selected into the study. Participants were considered eligible for the study
if they were: 55 years of age and over, English speaking, and had no or negligible
cognitive impairment (self-declared). Of the 368 participants, 254 (69%) were female,
and the average age was 67.91 years (range 55 – 90). The sample characteristics are
shown in Table 2.
The demographic profile of this sample of older adults is mostly consistent with
the ABS 2011 Census date for older people (defined as 65 years of age and over) (ABS,
2012) on a number of measures. At the time of the 2011 Census, older women
significantly outnumbered older men (54% of all aged 65 years and over, and 66% for
85 years and over), and the majority of older people were married (57%), identified as
religious or having connection with some form of spiritualty (81%), and identified as
Page 132
114
having been born in Australia (64%). However, closer to 86% of participants in this
study reported being born in Australia and 5% reported being born in the United
Kingdom (compared to 11% nationally). The older people in the current study were also
more educated (37% holding degrees compared to around 28% nationally), were more
likely to have no religious affiliation or spiritual beliefs (18.8% compared to 10%
nationally), and had higher rates of divorce and separation compared to the national
population of older adults (22% and 12%, respectively). Taken as a whole, the older
people in the current study had higher income levels than the national income levels of
older adults. The majority of participants in the current study (comprising 28%)
reported weekly incomes (in Australian dollars) of between $377 and $754, while the
next largest group (comprising 21%) reported weekly incomes between $754 and
$1132. By contrast, in the 2011 Census, around 53% of Australian adults over 65 years
of age were reporting incomes between $200 and $400 per week (consistent with a
government age pension).
Several key factors, however, are likely to contribute to the discrepancies found
between the demographic profile of the current study participants (i.e. the total sample
characteristics) and older adults nationally. The current study included participants who
were 55 to 64 years of age (i.e. those born between 1946 and 1956, comprising the
largest proportion of the Baby Boomer generation) when Time 1 data was collected in
2011/2012. By contrast, the ABS defines older adults as 65 years of age and older. At
the time of the 2011 Census, only the first year of the Baby Boomer cohort were
included in the data for older adults. Given the inclusion of a younger generation of
older adults in this study, a larger proportion of these participants (around 29%) were
still in the labour force (compared to 12% reported in the 2011 Census data). However,
as noted in the summary of the 2016 Census data for older people (ABS, 2016), over the
past three Censuses, the proportion of people in the labour force aged 65 years and over
has been steadily increasing, from 9.4% in 2006 to 14% in 2016. Further, in 2016, 21%
of people aged 65-74 years (i.e. Baby Boomers) were still working when Census data
was collected This trend suggests that the number of older adults in the labour force will
continue to grow as the proportion of people aged 55 to 64 years has also increased over
the last three Censuses.
Analysis of income level by retirement status reveals figures for the current
study are more consistent with the national Census data. That is, older retired adults
Page 133
115
reported weekly income levels of between $200 and $400 per week, while those still in
the workforce reported income levels consistent with the broader Australian adult
population. Further, the Baby Boomer generation differs markedly on a range of
economic, social, and cultural factors from previous generations (Hugo, 2014).
Compared to their predecessors, Baby Boomers are more highly educated (19% have
attained a Bachelor degree or higher), are more likely to report no religious affiliation or
spiritual beliefs, and have higher rates of divorce and separation. The demographic
profile of the Baby Boomer generation is also more complicated because of the
considerable variation within it, much more so than previous generations (Hugo, 2014).
When these factors are taken into consideration, the demographic profiles of older
adults in the current study (across the older adult age strata) appear more consistent with
the demographic profiles of older Australian adults nationally. However, any inference
that this sample of older adults is representative of older Australian adults more broadly
is limited by the statistical methodology applied to the survey data. Specifically, the
information collected was not statistically adjusted to compensate for the over-or under-
representation of a particular population subgroup in the sample. As such, potential
biases within the sample design, for instance, self-selection and differential non-
response biases were not addressed.
Each participant completed a survey which captured aspects of psychological
health and wellbeing (see Time 1 Measures). Surveys were available in both paper and
web-based formats, and participants were given the option of completing either one or
the other according to their preference. Survey completion time was approximately 45
minutes. The paper version consisted of a survey booklet (Appendix B), a participant
information sheet (Appendix C), and a postage-paid return envelope. All the booklets
were coded for anonymity. Printed on the front of each booklet was the participant
name, and for this reason, clear instructions were included to remove the perforated
front page before returning the completed survey via post. Consent to participate was
implied if the completed survey was returned (as outlined in the participant information
sheet). Participants that selected to complete the web-based version were forwarded a
link to the online survey platform (Qualtrics) via email or were directed to the site via
the social media platform. Before participants were able to complete the online survey,
they were instructed to read the participant information (Appendix C) and were only
able to progress to the survey questionnaires after they had provided consent to
Page 134
116
participate. The measures in the online version had to be completed in full for
participants to progress to the next measure. The survey data was collected and stored in
a separate file to the contact information to ensure anonymity.
Reminder letters and emails were sent to participants who had not returned their
surveys after two months. Sixty participants returned the survey with missing data
despite attempting to complete each of the questionnaires. Follow up letters and emails
were sent to these participants requesting that they complete the measures, of which 47
responded. Data from the 13 participants who did not respond was excluded from the
study. It was not possible to contact all of the participants who completed the survey
online via the social media platform as they were not required to supply contact
information. This resulted in the loss of 16 participants who completed the Time 1
survey and who were unable to be contacted at follow up. At the end of each survey,
participants were asked to indicate whether (i) they would be willing to participate in
future phases of the research, and (ii) whether they wished to be contacted with the final
group results at the completion of the study. Further participation was incentivised (see
Appendix B for details).
The study procedure was reviewed and approved by the University’s Human
Research Ethics Committee (HREC).
7.4.2 Time 2
Twelve months after the Time 1 data collection was finalised, the participants that
had agreed to be contacted for future phases of the research (N=327) were once again
sent the survey via their preferred format (i.e. paper or web-based). Two hundred and
fifty-five (77.98%) surveys were returned, some of which contained missing data. The
procedure for Time 2 data collection was the same as at Time 1. Reminder letters were
sent out two months after the initial surveys were sent and any missing data was
followed-up. Participants were asked to complete all the same measures that they had at
Time 1. One additional measure was included to assess stressful life events that may
have occurred to participants between the two data collection points (see Section
7.5.11).
Page 135
117
Table 2
Participant sociodemographic and health status characteristics for Time 1 and Time 2
Table 2 continued over page
Time 1 Time 2
Characteristic N N
Mean age (SD) / Range 368 67.91 (8.29) / 55-90 235 69.59 (8.12) / 56-91
55-64 133 59.39 (3.25) 67 60.10 (3.19)
65-74 153 68.89 (2.71) 106 69.42 (2.75)
75 and over 82 79.90 (3.73) 61 80.26 (4.05)
Gender (%) 368 235
Female 254 69.0 164 69.8
Highest level of education (%) 364 234
Up to secondary school 87 23.6 62 26.5
Trade/Cert./Diploma 141 38.3 87 37.2
Bachelor degree/Post-graduate
diploma/degree 136 37.0 85 36.3
Total income AUD dollars (%) 355 226
Less than or equal to $20,000 75 20.4 39 17.3
$20,001-$60,000 181 49.2 128 56.6
More than or equal to $60,001 99 26.9 59 26.1
Partner status (%) 366 234
Partnered (married or de facto) 213 57.9 137 58.5
Divorced/Separated 82 22.3 42 17.9
Widowed 54 14.7 43 18.4
Never married 17 4.6 12 5.1
Page 136
118
The final sample comprised 235 (63.85%) of the older adults who had participated
at Time 1. See Table 2 for sample characteristics at Time 2. Descriptive statistics
revealed negligible characteristic or health-related differences (e.g. in terms of age,
subjective ratings of health, levels of psychological distress, SPA assessment) between
the group who ceased participation after Time 1 and the group that participated in both
waves of the study (i.e. Time 1 and Time 2).
Time 1 Time 2
Characteristic N N
Ethnicity (%) 365 234
Australian 318 86.4 207 88.5
Aboriginal and / or
Torres Strait Islander 1 0.3 1 0.4
British 20 5.4 11 4.7
Other European 9 2.4 6 3.8
Asian 2 0.5 0 0
Other 15 4.1 9 3.8
Religion (%) 365 233
Religious 169 45.9 104 44.6
Non-religious but spiritual 127 34.5 86 36.9
Non-religious 69 18.8 43 18.5
Self-rated health (%) 366 232
Excellent 56 15.2 31 13.4
Very good 154 41.8 99 42.7
Good 111 30.2 77 33.2
Fair 36 9.8 23 9.9
Poor 9 2.4 2 0.9
Chronic medical conditions (%) 368 235
None 50 13.6 32 13.6
One 68 18.5 54 23.0
Two 102 27.7 59 25.1
Three or more 148 40.2 90 38.3
Page 137
119
7.5 Materials
The survey that participants were asked to complete at Time 1 consisted of a
range of measures to assess SPA and psychosocial functioning (see Appendix B for all
questionnaire items). As the current study was part of a larger longitudinal project on
Healthy Ageing at the University of Wollongong, data was also collected for another
measure that was not utilised in the current study. Specifically, participants completed a
measure of illness perceptions alongside measures that were included in the current
investigation. As shown in Appendix B participants were asked to complete one of the
two versions of the Illness Perceptions Questionnaire (IPQ). If they subjectively
identified as living with an illness or medical condition/s, they were asked to complete
the Revised Illness Perception Questionnaire (IPQ-R: Moss-Morris et al., 2002). If they
subjectively identified as living without an illness or medical condition/s, they were
asked to complete the Revised Healthy Illness Perception Questionnaire (IPQ-RH:
Figueiras & Alves, 2007).
At Time 2, participants were asked to complete another survey which comprised
the same range of measures given at Time 1. However, one additional measure, the
Social Readjustment Rating Scale (SRRS: Holmes & Rahe, 1967) was included at Time
2 (see Appendix D) to determine whether participants had experienced any stressful life
events in the intervening twelve months.
7.5.1 Ageing Perceptions Questionnaire
The Ageing Perceptions Questionnaire (APQ: Barker et al., 2007) was
administered to assesses the subjective experience of ageing. The APQ is a self-report
measure that comprises eight subscales based on the common-sense model of self-
regulation (H. Leventhal et al., 1980; H. Leventhal et al., 1984). Seven subscales
containing 32-items measure the following views about ageing: timeline-chronic (the
extent to which awareness of one’s age or ageing is chronic in nature, e.g. “I always
classify myself as old”), timeline-cyclical (the extent to which one experiences variation
in awareness of ageing, e.g. “I go through phases of feeling old”), consequences-
positive (beliefs about the positive consequences of ageing on one’s life across a variety
of domains, e.g. “As I get older I get wiser”), consequences-negative (beliefs about the
Page 138
120
negative consequences of ageing on one’s life across a variety of domains, e.g. “Getting
older makes everything a lot harder for me”), control-positive (beliefs about personal
control over positive experiences to ageing, e.g. “The quality of my social life in later
years depends on me”), control-negative (beliefs about personal control over negative
experiences to ageing, e.g. “Immobility in later life is not up to me”), and emotional
representations (negative emotional responses generated to one’s own ageing, e.g. “I
get depressed when I think about getting older”). For these seven subscales, items are
rated on a 5-point scale ranging from 1 (strongly disagree) to 5 (strongly agree). Higher
scores indicate greater endorsement of a specific ageing perception. The eighth
subscale, identity, measures experience of health-related changes. The percentage of
health-related change attributed to ageing is calculated by dividing changes attributed to
ageing by health-related changes experienced (out of a possible 17 listed) and
multiplying this figure by 100. In a sample of 2033 community-dwelling older adults,
the APQ demonstrated good internal reliability (α value for subscales were all above .70
and typically exceeded .80) and good construct validity (Barker et al., 2007). In the
current study, α values ranged between .71 and .88.
7.5.2 BriefCOPE Inventory
The BriefCOPE Inventory (Carver, 1997) is a 28-item multidimensional self-
report measure that was administered to assess the different ways in which participants
respond to stress. The measure comprises 14 scales of two items each to capture
different coping styles. A dispositional measure was obtained by asking participants
what they usually do when confronted with difficult or stressful events in their life and
responses were rated on a 4-point Likert scale (1=I usually don’t do this at all; 4=I
usually do this a lot). Carver (1997) reported that the BriefCOPE Inventory has
adequate levels of internal consistency with α values ranging from .50 to .90. Based on
the theoretical and empirical literature (see Section 4.2.1.), the 14 subscales were
grouped according to orientation (engagement versus disengagement), and a further
distinction for the engagement coping responses was made according to action type,
namely, primary and secondary control coping. Specifically, coping responses were
classified as follows: primary control engagement (active coping, instrumental support,
emotional support, planning), secondary control engagement (acceptance, humour,
positive reframing, religion, self-distraction), and disengagement (behavioural
Page 139
121
disengagement, denial, self-blame, substance use, venting). Cronbach’s alpha
coefficients for the three coping categories in the current study were .85, .70, and .69
respectively.
7.5.3 Duke Social Support Index–Short Version
The abbreviated Duke Social Support Index (DSSI: Koenig et al., 1993) was
administered to assess how much social activity participants engage in, and how valued
they feel within their social networks. The 11-item DSSI is a shorter version of the
original 35-item self-report scale (Blazer, Hybels, & Hughes, 1990) and comprises two
subscales: social interaction (4-items) and satisfaction with social support (7-items).
Sample items include “Do you feel you have a definite role (place) in your family and
among your friends?” and “Other than members of your family, how many persons in
your local area do you feel you can depend on or feel very close to?” Participants were
asked to respond on Likert type scales. In this study, Cronbach’s alpha coefficients for
social interaction and social satisfaction were .61 and .84, respectively.
Goodger, Byles, Higganbotham, and Mishra (1999) tested the validity and
reliability of the 11-item DSSI within an older Australian population and for the overall
index reported a strong internal consistency (α = .77), good test-retest reliability (r
values range from .70 to .81), and good construct validity. However, for the social
interaction and social satisfaction subscales, they reported Cronbach’s alpha coefficients
as .58 and .80, respectively. They argued that the modest alpha score for the social
interaction subscale probably reflects its length (i.e. 4-items) rather than a tendency for
unreliability and that “moderate levels of internal consistency are considered acceptable
where the aim is to preserve content validity for the purposes of inferential testing” (p.
263). Thus, despite the moderate alpha coefficient for social interaction in the current
sample, the subscale was retained.
7.5.4 Personality factor domains of the International Personality Item Pool
(IPIP)
The International Personality Item Pool (IPIP) is a public domain pool of
(currently) over 3000 concisely worded phrases that assess personality attributes
(Goldberg et al., 2006). Using the IPIP, Goldberg (1992) compiled five, 10-item scales
Page 140
122
that conform well and compare favourably to the domain scales of the NEO-PI-R (Costa
& McCrae, 1992). Two of these five scales were administered to participants as part of
the survey, the items of which were rated on a 5-point scale, serving as measures of
neuroticism and conscientiousness. The IPIP website (http://ipip.ori.org/: see Goldberg
et al., 2006) has described the reliability and validity of these scales. The neuroticism
scale has an alpha coefficient of .86 while the conscientiousness scale has an alpha
coefficient of .81. Further, both scales were highly correlated with the NEO-PI-R (r =
.82 and .79). The neuroticism and conscientiousness scales, respectively, contain such
positively scored items as “I panic easily” and “I make plans and stick to them” and
such reverse-scored items as “I seldom feel blue” and “I waste my time”. Both the
neuroticism (α =.86) and conscientiousness (α = .81) scales demonstrated strong internal
consistency in the current study.
7.5.5 Life Orientation Test-Revised
The Life Orientation Test (LOT-R: Scheier, Carver, & Bridges, 1994) was
included to assess individual differences in generalised optimism. The LOT-R is a brief,
6-item measure which captures dispositional optimism on a continuum. On a 5-point
Likert scale (1=I disagree a lot; 5=I agree a lot) participants were asked to rate the
extent to which they agreed with a statement (e.g. “I rarely count on good things
happening to me”). In one review (Glaesmer et al., 2012) the psychometric properties of
the LOT-R were assessed to be satisfactory, with the Cronbach’s alpha coefficients of
reliability for optimism at .70. The LOT-R was also found to have good convergent
validity, correlating with other health-related variables. The Cronbach’s alpha
coefficient for optimism in this study was .81.
7.5.6 Depression, Anxiety, Stress Scales–Short Version
The Depression, Anxiety, Stress Scales (DASS21: (Lovibond & Lovibond,
1995) is a 21-item self-report measure which measures the negative emotional states of
depression (e.g. dysphoria and sadness), anxiety (e.g. physiological arousal and fear),
and stress (e.g. states of tension and stress). Participants were asked to rate how much
each statement applied to them over the past week on a 4-point scale (0 = did not apply
to me at all; 3 = applied to me very much, or most of the time). The DASS-21 was
administered to provide a measure of psychological distress so the scores from each of
Page 141
123
the three subscales were summed to provide a composite distress score. The DASS21
demonstrated strong internal consistency (α = .94) and good convergent and
discriminate validity in a population of older primary care patients (Gloster et al., 2008).
In the current study, the measure demonstrated strong internal consistency for each of
the three subscales (.88, .76, and .83 for depression, anxiety, and stress, respectively)
and for the composite measure of distress (α = .92).
7.5.7 CASP-12
The CASP-12 (Wiggins, Netuveli, Hyde, Higgs, & Blane, 2008) is a quality of
life measure specifically developed for use in older adults. The original CASP-19
(Hyde, Wiggins, Higgs, & Blane, 2003) specified four domains, namely, control (C),
autonomy (A), self-realisation (S), and pleasure (P), all of which are markers of
eudaimonic subjective wellbeing. However, Wiggins et al. (2008) reported that the
shorter 12-item version, which combines the domains of ‘control’ and ‘autonomy’ to a
single factor (CA), has stronger measurement properties. Cronbach’s alpha coefficients
were reported for CA, S, and P as .67, .73, and .78 respectively (Wiggins et al., 2008).
The CA domain comprises 6-items, while the S and P domains comprise 3-items each.
Participants were asked to rate the degree to which each item applied to them on a 4-
point Likert scale (1=never; 4=often). Higher values suggest greater levels of quality of
life. In the current study, Cronbach’s alpha for the CA, S, and P subscales were .75, .81,
and .78, respectively. These three subscales were summed to provide a total quality of
life score, which demonstrated strong internal consistency (α = .83).
7.5.8 Positive and Negative Affect Schedule
To assess hedonic subjective wellbeing, two measures were employed.
Subjective wellbeing is widely recognised as encompassing both affective states and a
cognitive evaluation of one’s life (Dolan & Metcalfe, 2012; National Research Council,
2013; Pavot & Diener, 1993). To assess general affective states, the Positive and
Negative Affect Schedule (PANAS: Watson, Clark, & Tellegen, 1988) was utilised. The
PANAS is a 20-item measure which comprises 10-items for positive affect (e.g.
interested) and 10-items for negative affect (e.g. distressed). Participants were asked to
respond on a 5-point Likert scale (1=very slightly or not at all; 5=extremely) the degree
to which they experienced this affect in general. The positive (PA) and negative (NA)
Page 142
124
scales were assessed separately as they do not share a linear relationship and it is
possible to lose valuable information about the two types of affect if combined into a
global score (Diener, 2000). Test-retest reliability for the PANAS range from .30 to .71,
and the PA and NA scales are reported to have high internal consistency (α = .84 to .90)
(Watson et al., 1988). Support for the PANAS as a viable measurement of positive and
negative affect in older adults has been reported (Kercher, 1992). In the current
investigation, the PA and NA scales both demonstrated strong reliability (α values of
.91 and .87 respectively).
7.5.9 Satisfaction with Life Scale
The Satisfaction with Life Scale (SWLS: Diener, Emmons, Larsen, & Griffin,
1985) was used to assess the cognitive component of subjective wellbeing. The SWLS
is a 5-item, global measure of subjective wellbeing which asks participants to respond
to statements (e.g. “In most ways my life is close to ideal”) on a 7-point Likert scale
where 1=strongly disagree and 7=strongly agree. Higher scores indicate greater
satisfaction with life. The SWLS has good test-retest reliability (r =.82) and internal
consistency (α = .87) (Diener et al., 1985). The SWLS also has sound correlations with
other measures of life satisfaction/happiness (Diener, Inglehart, & Tay, 2013; Pavot &
Diener, 1993). Cronbach’s alpha coefficient was .88 in the current study.
7.5.10 Subjective indicators of health status
Participants were asked to respond to two types of subjective indicators of health
status, namely, self-rated health and the number of chronic health conditions for which
they had received a diagnosis by a medical professional. Global self-rated health is
understood to stem from a cognitive process that is both subjective and contextual
(Jylhä, 2009) and it integrates various health states, including mental, physical, social
and functional health; that is, it provides a holistic view from a subjective stance. Self-
rated health has been used extensively within health and clinical research, and has been
found to be both a valid and reliable means of assessing overall health, particularly
within older populations (Ocampo, 2010). Participants were asked “How would you rate
your health at the current time?” with response options ranging from excellent to poor
on a 5-point scale. In terms of self-reported medical conditions, participants were
provided with a list of common chronic conditions (see survey booklet in Appendix B)
Page 143
125
and were asked to indicate if any applied to them (i.e. “Have you ever been told by a
doctor or other health professional that you had any of the following?”).
7.5.11 The Social Readjustment Rating Scale
At Time 2, the 30-item Social Readjustment Rating Scale (SRRS: Holmes &
Rahe, 1967) was included in the survey to assess whether participants had experienced
any stressful life events over the preceding twelve months. This measure assigns
different weights for stress to different life events. Scores for each stressful life event
identified are summed, with higher scores indicating higher susceptibility to stress-
induced health problems. Four categories are specified by Holmes and Rahe (1967): (i)
No significant problem, (ii) Mild stress and a 35% chance of illness or health change,
(iii) Moderate stress and a 50% chance of illness or health change, and (iv) Major stress
and an 80% chance of illness or health change. For certain questions, the wording was
adjusted slightly to account for an older cohort (e.g. “pregnancy” became “pregnancy of
a family member”). A relatively recent study (Scully, Tosi, & Banning, 2000)
concluded that life events are useful predictors of stress-related outcomes and that the
SRRS remains a viable tool for assessing such events. For the current study, the
inclusion of the SRRS was primarily for the purpose of identifying changes in life
circumstances that may have occurred between Time 1 and Time 2 (rather than a
measure of susceptibility to health problems per se).
7.6 Missing data and incompletion
One means of minimising missing data was incorporated into the study design.
The online survey responders were required to complete all items for a measure in order
to progress to the start of the next measure (see Section 7.4). As a core objective of the
investigation was to examine SPA, the decision was taken to exclude those surveys that
did not provide a complete measure of SPA, that is, those with an incomplete APQ
(Barker et al., 2007). The one exception to this was for the identity subscale of the APQ
which was assessed differently to the other seven subscales. Four surveys that had
complete data for the seven subscales but were missing data for the identity subscale
were still included in the final analysis. Some missing values on the APQ were allowed
as the scoring protocol enabled computation of a final score for each subscale with one
or two missing items. The other measures of psychosocial and mental health functioning
Page 144
126
also contained some missing values. See Table 3 for percentage of missing values for
each variable at Time 1 and Time 2.
Ageing research is beset by a number of unique methodological challenges which
may result in missing data (Hardy, Allore, & Studenski, 2009; Quinn, 2010). For
instance, it is feasible that functional health limitations may have impeded some study
participants from completing all of the questionnaires in full (i.e. survey too lengthy).
Another possibility for missing values goes to the sensitivity of the data being captured
(i.e. mental health) which some of the sample may have felt too invasive or
embarrassing to respond to. It has been demonstrated that older adults are more likely to
decline answering questions compared to younger adults (Quinn, 2010). Feedback from
a number of participants in the current study indicated that they also had some difficulty
reading from the survey booklet which may have resulted in missing items. Many of the
measures allowed for some missing values and a final score could be calculated. As
outlined in Section 7.4, where possible, follow up letters and emails were sent to
participants who had missed items and the majority of these returned a complete data
set after receiving this notification. The few that did not respond were excluded from
further analyses as too many values were missing to replace with imputed data (i.e. over
50%).
Page 145
127
Table 3
Missing values for psychosocial and mental health variables at Time 1 and Time 2
% Missing values
Variable Time 1 Time 2
Primary control engagement coping 0 0
Secondary control engagement coping .3 0
Disengagement coping .3 0
Social interaction 1.9 1.3
Satisfaction with social support .3 0
Conscientiousness .8 2.1
Neuroticism .8 .9
Generalised optimism .3 0
Psychological distress 2.2 .4
Quality of life .8 1.3
Positive affect .8 .4
Negative affect .8 .4
Life satisfaction 1.4 0
The minor variation in sample size across the different analyses is the result of
some of the participants not completing all of the psychosocial functioning
questionnaires, or not providing sociodemographic data which were included in the
mediation analyses as covariates. The SPSS script for mediation analysis (described
below) was not able to accommodate any missing cases. In these instances, the cases
deleted listwise were minimal (a maximum of 28 out of 368 cases) and as such, no
action was taken to adjust this. The majority of the incomplete surveys which were
excluded from analyses contained too much missing data (i.e. over 50%) to be
meaningful, and many of these participants could not be contacted (i.e. they linked to
the online survey platform anonymously via the social media advert). However, a small
Page 146
128
number of incomplete surveys were included if only one measure of psychosocial
functioning was omitted.
7.7 Data analysis
All analyses were conducted using IBM SPSS version 21. Two-tailed analyses
with an alpha level of .05 were carried out. Prior to conducting analyses, the scales used
for analysis were screened for normality of distribution and the presence of outliers.
Standardised z-scores in excess of ± 3.29 are considered outliers (Tabachnick & Fidell,
2007). This criterion was applied to the APQ subscales as well as the psychosocial and
mental health variables of interest. For the Time 1 data, twenty-six outliers were
detected in total across all the variables while a further eleven outliers were present
within the Time 2 data. A visual examination of the boxplots demonstrated six extreme
outliers across two variables. Skewness and kurtosis were calculated for each variable
and histograms were visually inspected. With the exception of the two variables (i.e.
psychological distress and disengagement coping) with the extreme outliers, all of the
variables met the assumption of normality. When the six extreme outliers were removed
from the data, scale scores at both Time 1 and Time 2 satisfied the assumption of
normality. Thus, parametric tests were used in Chapters 8 – 10. The method used for the
mediation and moderation analyses (Chapters 11 – 12) makes no assumptions about the
normality of the sampling distribution.
Cross-sectional analyses were conducted for studies in Chapters 8 - 10 and 12,
while Chapter 11 utilised the repeated measures data (Time 1 and Time 2). The research
questions outlined in Section 1.4 were examined with the following statistical tests:
1. Descriptive statistics were obtained for the sociodemographic and subjective
health characteristics, and for each measure of psychosocial functioning;
2. Pearson correlation coefficients were calculated to explore the inter-correlations
among the APQ subscales, and to test the relationships between the APQ
subscales and sociodemographic characteristics, subjective health ratings, and
other measures of psychosocial functioning in Chapters 8 - 10;
3. An independent sample t-test and ANOVA were applied to test for group
differences on the APQ across sociodemographic and subjective health variables
in Chapter 9;
Page 147
129
4. To estimate the direct and indirect effects of SPA on mental health through
coping over time (mediation), and the causal interaction effects of disposition on
the SPA-mental health relationship (moderation), the PROCESS macro for
SPSS developed by Hayes (2013) was adopted. There are a number of
advantages in using this approach for mediation and moderation, which are
described at length in Chapters 11 and 12.
Page 148
130
Chapter 8
Applying a self-regulation model to investigate
SPA: Evidence from Australia and overseas
Page 149
131
8.1 Introduction
The aim of the present study was to investigate whether the self-regulation
framework which was originally applied to the field of health and illness (i.e. the CSM:
H. Leventhal et al., 1980; H. Leventhal et al., 1984) would be an appropriate conceptual
framework for examining SPA in this sample of older, community-dwelling Australian
adults (refer to Section 7.4.1 for sample characteristics). As discussed in Chapters 1 and
3, SPA comprises multiple dimensions which reflect the complex and multifaceted
experience of age and the ageing process (Barker et al., 2007). Within the published
literature, however, SPA have often been treated as either a unidimensional construct or
as a global evaluation along specific domains of functioning. While studies which have
adopted these conceptualisations of SPA have provided invaluable insights into some
aspects of the ageing experience, the tendency to focus on single dimensions of SPA or,
alternatively, accentuate a positive-negative binary of the construct likely masks the
complexity and the nuances of these ageing experiences. By contrast, placing SPA
within a self-regulation framework, which recognises the dynamic interactions between
the ageing self and the environment, enables subjective experiences of ageing to instead
be viewed as a process underpinning adaptation. Further, this conceptualisation of SPA
aligns with process models of successful ageing, which underscore the importance of
self-regulation in maximising gains and minimising losses in development (see Chapter
2).
Barker and colleagues (2007) have suggested that the CSM is a useful theoretical
model to apply to the field of ageing because it provides a self-regulation framework in
which to examine multiple dimensions of the ageing experience. While illness and
ageing are distinct constructs, both are associated with a range of challenges which
require processes of adaptation for an individual to function. As iterated in Chapter 3,
adopting this existing theoretical framework and applying it to an ageing context
enables researchers to examine SPA in greater specificity and in a more systematic
fashion. Barker et al. (2007) utilised this self-regulation framework to develop a
psychometrically sound and theory-driven instrument for assessing the multiple
dimensions of SPA. Specifically, the authors of the APQ (Barker et al., 2007) have
described the SPA dimensions along the five core CSM dimensions of identity,
timeline, consequences, control, and emotional representations. However, the items of
Page 150
132
the APQ diverge from those of the illness-focused instrument which also drew on the
CSM (i.e. the IPQ-R: Moss-Morris et al., 2002) because of the inclusion of positive
aspects of the ageing process (e.g. items relating to the positive consequences of ageing,
or control over positive aspects of the process).
Since its publication, the APQ had been employed in various international studies
(refer to Section 3.6) to assess the ageing experiences of older adults. However, at the
time of writing, the APQ had only been employed in one Australian study (i.e. Yarmo-
Roberts et al., 2010) which assessed ageing beliefs in a sample of frail, older adults
receiving Australian government-funded care packages. These care packages are aimed
at individuals who, without such provisions, would be unable to live unassisted within
the community. For instance, participant’s in the Yarmo-Roberts et al. (2010) study
were described as having permanent care givers and a large percentage were found to be
experiencing poor health and other age-related declines (e.g. high rates of physical and
cognitive decline, depression, low rates of social networks etc.). The mean age of the
cohort was also considerably older than those reported overseas, as might be expected
given that recipients of care are generally in the oldest-old age bracket.
By contrast, the majority of international research to have utilised the APQ has
investigated SPA within broader samples of community-dwelling older adults. That is,
participants in many of the overseas studies, including those discussed in this chapter,
were randomly selected from private residences, with eligibility for inclusion being age-
based (e.g. over 50 or 70 years of age, depending on the study) rather than functional
health status. Indeed, frail older adults have possibly been under-represented in many of
these studies as aged care facilities and similar institutions were generally excluded
from participation. While participants in the current study share similar demographic
characteristics to older adults described in international studies, most notably for age,
gender, and marital status distributions (for example, see Kearney et al. (2011) and
McGee et al. (2005) for demographic characteristics of Irish participants), across
different cultural settings, some variation in the expression of SPA have been reported.
To date, there is no available data regarding SPA as measured with the APQ within a
broader sample of community-dwelling older Australians (see Section 7.4.1 for an
overview of this study’s participant characteristics and how this sample compares to
Australian Census data for older adults).
Page 151
133
Thus, to assess whether the CSM would be an appropriate framework for
investigating SPA in older, community-dwelling Australian adults, this study tested
whether the findings for the current cohort would largely replicate those reported
elsewhere. Specifically, the psychometric properties reported for the APQ in studies
published overseas were used to compare with, and contrast to the current findings if (i)
the original version of the APQ (Barker et al., 2007) had been employed (rather than
abbreviated versions, as described in Section 3.6), (ii) the majority of the dimensions
had been tested, with the exception of the identity dimension, as only the Barker et al.
(2007) study reported on the experience of health-related changes, and (iii) the sample
of community-dwelling older adults being assessed shared similar characteristics to
those described in the current study. That is, participants were not only representative of
a subset of the older population (e.g. patient groups). As an adjunct to the main aim of
the first study, the findings published by Yarmo-Roberts et al. (2010) were examined
alongside the findings from the current cohort to gauge where similarities and
differences would exist among these two groups of older Australian participants.
8.2 Hypotheses
Based on previous findings reported for older community-dwelling adults from
Ireland (Barker et al., 2007; McGee et al., 2011), France (Ingrand et al., 2012), and the
Netherlands (Slotman et al., 2015), the following hypotheses were made:
1. Mean scores for the APQ dimensions in the current cohort of older
Australian adults will be consistent with those reported in international
samples of community-dwelling older cohorts. Specifically, the control-
positive and consequences-positive dimensions will have higher mean
scores, and the timeline and emotional representations dimensions will
have lower mean scores. Mean scores for the control-negative and
consequences-negative dimensions will be closer to the centre of the scale.
2. Alpha coefficients for the APQ subscales will mostly replicate those
reported in international studies, that is, higher coefficients for the
timeline, consequences-negative, control-positive, and emotional
representations dimensions.
3. The inter-correlations among the APQ dimensions will be largely
consistent with those reported for the international cohorts, that is, a
Page 152
134
logical, common-sense pattern of relationships in line with the theoretical
framework from which it is derived. Specifically, the subscales reflecting
more negative aspects of ageing (i.e. the timeline, consequences-negative,
emotional representations, and identity dimensions) will be positively
correlated with each other, while being negatively correlated with the
subscales reflecting more positive aspects of ageing (i.e. the control and
consequences-positive dimensions). The control (positive/negative) and
consequences-positive dimensions will be positively correlated with each
other.
8.3 Method
A full explanation of the participant information, research procedure, and analysis
methods are described in Chapter 7. In brief, this first study used the APQ (Barker et al.,
2007) as a measure of SPA, as detailed in Section 7.5.1 (see Appendix B for the APQ
items). Higher scores on each of the views about ageing subscales indicate greater
endorsement of the SPA dimension while a higher score for the identity subscale
indicates health-related changes being attributed to ageing. A cross-sectional analysis of
the Time 1 data was conducted to test the hypotheses described in Section 8.2.
Cronbach’s alpha was calculated to assess the internal consistency of the seven views
about ageing subscales. To assess the APQ subscale distributions and determine if there
were any floor or ceiling effects, mean scores and standard deviations were calculated
and histograms were visually inspected. Finally, Pearson’s correlation coefficients were
calculated to determine construct validity.
8.4 Results
Descriptive statistics for the average scores, subscale distribution, and internal
reliability for each of the APQ subscales are provided in Table 4. The mean scores for
each of the views about ageing dimensions were largely consistent with those reported
in international studies of older adults, particularly for the timeline (chronic and
cyclical), consequences (positive and negative), and emotional representations
dimensions. For the current study, average scores for both the control-positive (M=4.17)
and control-negative (M=3.51) dimensions were only slightly higher than for most of
the other studies. The average score for the identity dimension was also consistent with
Page 153
135
that reported by Barker et al. (2007). While there was no obvious floor or ceiling effects
for the seven subscales reflecting views about ageing, as indicated by the score response
frequencies and visual examination of the histograms, a ceiling effect was exhibited for
the identity subscale, akin to the finding reported by Barker and colleagues (2007). The
identity subscale was negatively skewed (skewness = -.45), with 25.3% of participants
attributing health-related changes to ageing. Finally, Cronbach’s alpha coefficients for
the current study were largely consistent with those reported elsewhere, ranging from
.71 to .88. The one notable exception was for the control-positive dimension which
demonstrated greater reliability (α = .85) in the current study than for any of the other
studies described here. All of the subscales had less than 1.4% missing data.
Similarities and differences were also observed between mean scores for
participants in the current study and those of older, frail Australian adults reported by
Yarmo-Roberts et al. (2010). The latter provided no data for the timeline dimensions
however the average scores for the consequences-positive dimension were relatively
comparable to the scores found for the current study cohort. By contrast, mean scores
on the two control dimensions were higher in the current study, markedly so for the
control-negative dimension, while being lower on the consequences-negative and
emotional representations dimensions.
Table 4
Descriptive statistics for the APQ subscales
APQ dimensions Mean (SD) %
min
%
max α
1. Timeline-chronic
Current study (55-90 years, N=368) 2.71 (.77) 2.4 0.8 .84
Barker et al., 2007 (65-102 years, N=2033) 2.90 (.87) 1.8 0.8 .86
McGee et al., 2011 (≥50 years, N=6262) 2.66 nd nd nd
Ingrand et al., 2012 a (55-64 years, n=262) 2.35 (.82) nd nd .77
(≥65years, n=394) 3.02 (.97) nd nd .80
Slotman et al., 2015 (70-99 years, N=1280) 3.42 (.83) 2.7 0.8 .85
Yarmo-Roberts et al., 2010 (≥70 years, N=334) nd nd nd nd
Table 4 continued over page
Page 154
136
APQ dimensions Mean (SD) %
min
%
max α
2. Timeline-cyclical
Current study (55-90 years, N=368) 2.61 (.79) 5.2 0.3 .86
Barker et al., 2007 (65-102 years, N=2033) 2.70 (.82) 2.4 0.2 .89
McGee et al., 2011 (≥50 years, N=6262) 2.70 nd nd nd
Ingrand et al., 2012 a (55-64 years, n=262) 2.47 (1.01) nd nd .88
(≥65years, n=394) 2.88 (1.09) nd nd .86
Slotman et al., 2015 (70-99 years, N=1280) 2.90 (.84) 0.6 3.8 .84
Yarmo-Roberts et al., 2010 (≥70 years, N=334) nd nd nd nd
3. Consequences-positive
Current study (55-90 years, N=368) 3.83 (.58) 0.5 6.3 .71
Barker et al., 2007 (65-102 years, N=2033) 3.70 (.59) 0.2 2.6 .64
McGee et al., 2011 (≥50 years, N=6262) 3.78 nd nd nd
Ingrand et al., 2012 a (55-64 years, n=262) 3.37 (.84) nd nd .75
(≥65years, n=394) 3.22 (.81) nd nd .63
Slotman et al., 2015 (70-99 years, N=1280) 3.40 (.76) 3.5 0.8 .74
Yarmo-Roberts et al., 2010 (≥70 years, N=334) 3.65 (.80) nd nd nd
4. Consequences-negative
Current study (55-90 years, N=368) 2.82 (.73) 1.1 0.3 .82
Barker et al., 2007 (65-102 years, N=2033) 3.40 (.74) 0.2 1.8 .80
McGee et al., 2011 (≥50 years, N=6262) 2.91 nd nd nd
Ingrand et al., 2012 a (55-64 years, n=262) 2.44 (.93) nd nd .82
(≥65years, n=394) 3.47 (1.04) nd nd .83
Slotman et al., 2015 (70-99 years, N=1280) 3.30 (.76) 0.8 1.9 .81
Yarmo-Roberts et al., 2010 (≥70 years, N=334) 3.76 (.65) nd nd nd
5. Control-positive
Current study (55-90 years, N=368) 4.17 (.52) 0.3 15.5 .85
Barker et al., 2007 (65-102 years, N=2033) 3.80 (.54) 0.2 2.2 .80
McGee et al., 2011 (≥50 years, N=6262) 3.93 nd nd nd
Ingrand et al., 2012 a (55-64 years, n=262) 4.10 (.55) nd nd .62
(≥65years, n=394) 3.87 (.72) nd nd .70
Slotman et al., 2015 (70-99 years, N=1280) 3.76 (.64) 2.6 0.9 .78
Yarmo-Roberts et al., 2010 (≥70 years, N=334) 3.78 (.60) nd nd nd
Table 4 continued over page
Page 155
137
APQ dimensions Mean (SD) %
min
%
max α
6. Control-negative
Current study (55-90 years, N=368) 3.51 (.68) 0.3 2.4 .72
Barker et al., 2007 (65-102 years, N=2033) 2.65 (.71) 1.6 0.2 .73
McGee et al., 2011 (≥50 years, N=6262) 3.10 nd nd nd
Ingrand et al., 2012 a (55-64 years, n=262) 3.51 (.70) nd nd .59
(≥65years, n=394) 3.12 (.74) nd nd .52
Slotman et al., 2015 (70-99 years, N=1280) 2.56 (.74) 1.0 3.4 .76
Yarmo-Roberts et al., 2010 (≥70 years, N=334) 1.57 (.75) nd nd nd
7. Emotional representations
Current study (55-90 years, N=368) 2.18 (.73) 7.9 0.5 .88
Barker et al., 2007 (65-102 years, N=2033) 2.40 (.74) 2.8 0.1 .74
McGee et al., 2011 (≥50 years, N=6262) 2.31 nd nd nd
Ingrand et al., 2012 a (55-64 years, n=262) 2.31 (.97) nd nd .88
(≥65years, n=394) 2.45 (.94) nd nd .76
Slotman et al., 2015 (70-99 years, N=1280) 2.59 (.84) 1.3 3.3 .86
Yarmo-Roberts et al., 2010 (≥70 years, N=334) 2.54 (.90) nd nd nd
8. Identity
Current study (55-90 years, N=364) 65.4 (31.1) 4.9 25.3 -
Barker et al., 2007 (65-102 years, N=2033) 65.0 (37.0) 15.8 37.7 -
McGee et al., 2011 (≥50 years, N=6262) nd nd nd -
Ingrand et al., 2012 a (55-64 years, n=262) nd nd nd -
(≥65years, n=394) nd nd nd -
Slotman et al., 2015 (70-99 years, N=1280) nd nd nd -
Yarmo-Roberts et al., 2010 (≥70 years, N=334) nd nd nd -
Note. nd = no data available.
aDescriptive statistics for total sample (≥50 years of age) were not reported in this publication.
Inter-correlations among the APQ subscales are presented in Table 5. As
hypothesised, the timeline (chronic and cyclical), consequences-negative, and emotional
representations dimensions were all positively associated with each other, while each
was negatively associated with the consequences-positive and control (positive and
negative) dimensions. The one exception to this was for the timeline-cyclical and
consequences-positive dimensions which were not significantly correlated. The
consequences-positive and control dimensions were all positively related to one and
Page 156
138
another. These results are broadly consistent with the findings reported elsewhere. In the
current study, the only dimension significantly associated with the identity dimension
was control-negative (r = .14, p = .008), in contrast to the findings reported by Barker et
al. (2007). All inter-correlations were substantially less than .85 (the largest value being
.58), indicating discriminant validity among the subscales (Kline, 2011).
Page 157
139
Table 5
Inter-correlations among the APQ subscales
Correlations
Variable Study 1 2 3 4 5 6 7
1. IDEN
2. TCR Current (2012, N=368) .04
Barker et al. (2007, N=2033) .14**
Sexton et al. (2014, N=6718) nd
Slotman et al. (2015, N=1280) nd
3. TCY Current (2012, N=368) -.01 .39**
Barker et al. (2007, N=2033) .15** .50**
Sexton et al. (2014, N=6718) nd .50
Slotman et al. (2015, N=1280) nd .49**
4. PCSQ Current (2012, N=368) -.01 -.12* -.09
Barker et al. (2007, N=2033) .01 -.07** -.08**
Sexton et al. (2014, N=6718) nd -.04* -.04**
Slotman et al. (2015, N=1280) nd .23** .11**
5. NCSQ Current (2012, N=368) .02 .52** .43** -.21**
Barker et al. (2007, N=2033) .26** .55** .42** -.09**
Sexton et al. (2014, N=6718) nd .56** .52** -.11**
Slotman et al. (2015, N=1280) nd .55** .57** .15**
6. PCON Current (2012, N=368) -.02 -.25** -.23** .27** -.33**
Barker et al. (2007, N=2033) -.10** -.34** -.24** .28** -.32**
Sexton et al. (2014, N=6718) nd -.08** -.05** .40** -.15**
Slotman et al. (2015, N=1280) nd .06 -.06* .28** .03
7. NCON Current (2012, N=368) -.14** -.42** -.35** .21** -.48** .40**
Barker et al. (2007, N=2033) -.15** -.41** -.32** .06** -.53** .26**
Sexton et al. (2014, N=6718) nd .42** .35** -.10** .57** -.18**
Slotman et al. (2015, N=1280) nd -.44** -.38** -.15** -.55** -.08**
8. ER Current (2012, N=368) -.02 .46** .58** -.25** .53** -.41** -.39**
Barker et al. (2007, N=2033) -.12** .53** .65** -.14** .44** -.37** -.38**
Sexton et al. (2014, N=6718) nd .54** .69** -.11** .55** -.11** .42**
Slotman et al. (2015, N=1280) nd .44** .71** .10** .56** -.06* -.44**
Note. TCR = timeline-chronic; TCY = timeline-cyclical; PCSQ = consequences-positive; NCSQ =
consequences-negative; PCON = control-positive; NCON = control-negative; ER = emotional
representations; nd = no data available.
*p ˂ .05, **p ˂. 01.
Page 158
140
8.5 Discussion
The current study sought to establish whether the CSM would be an appropriate
conceptual framework for examining SPA in older, community-dwelling Australian
adults. The original version of the APQ was administered in full to participants to assess
its psychometric properties. The findings from this investigation were largely consistent
with those reported in international studies. That is, in this cohort of older Australians,
the APQ views about ageing subscales demonstrated good psychometric properties and
the pattern of relationships among the dimensions were, to a large extent, comparable to
those found for older adults in European countries. These findings provide further
support for the multidimensional structure of SPA and suggest that the CSM, when
applied to an ageing context, is a theoretically sound framework to adopt for the
investigation of SPA in older Australian adult populations.
Overall, participants reported being slightly more chronically aware of their age
and ageing rather than experiencing variations in awareness of it. For example, the
highest proportion of participants (46%) agreed or strongly agreed that they are
conscious of getting older all the time and are always aware of the fact that they are
getting older. By contrast, the highest proportion of respondents disagreed on each of
the timeline-cyclical items, indicating that fewer participants experienced going through
phases or cycles of age awareness than being constantly mindful of it. However, the
mean scores for both the timeline subscales were close to the centre of the scale which
suggests that participants did not perceive the temporal aspect of their ageing strongly.
These findings are largely consistent with those reported in the international studies,
with some minor differences only. For instance, participants in the McGee et al. (2011)
study, which included adults aged 50 years and over (i.e. five years younger than the
starting age for inclusion within the other studies examined) were slightly more aware
of variations in ageing rather than being constantly aware of it. The same pattern was
observed for the younger cohort (55-64 years) in the French (Ingrand et al., 2012) study.
As discussed in Chapter 5, different patterns have emerged along the timeline
dimensions whereby a more chronic awareness of ageing has been associated with
increasing chronological age. While it is likely that awareness of ageing is driven by
other contextual factors (e.g. poor health, changes to social roles) rather than by
chronological age per se, people in the earlier stages of older adulthood (i.e. 50-69 years
Page 159
141
of age) may experience less losses to their independence or constraints to their
functioning than those in the later stages (i.e. 75 years and older) and therefore
experience more variation in age awareness. Group differences are explored further in
Chapter 9.
On average, participants perceived the consequences of ageing quite favourably,
particularly along the consequences-positive dimension. To illustrate, over 81% agreed
or strongly agreed that they continue to grow as a person as they get older, while close
to 86% agreed or strongly agreed that as they get older they appreciate things more.
Indeed, compared to their international counterparts, this cohort of Australian
participants had the highest mean score for the consequences-positive dimension, even
more so than the younger French participants in the Ingrand et al. (2012) study,
indicating that many of them view ageing as a time of personal development. With the
exception of the younger French cohort, participants in the current study also had the
lowest mean score for the consequences-negative subscale when compared to the
international cohorts. While the mean score suggests that participants in this study did
not feel strongly either way that ageing is associated with negative consequences, the
subscale items provided a more nuanced perspective on the findings. Specifically, while
half of the participants agreed that ageing restricts what they can do and 39% agreed
that ageing reduces the number of activities they can participate in, the greatest
proportion of participants disagreed that ageing makes them less independent (51%),
makes everything a lot harder for them (50%), or limits their ability to cope well with
problems that arise (62%). Thus, while it appears that this cohort of older Australians
acknowledge certain limitations associated with getting older, many of which are
reinforced by ageist messages which filter through the Australian social landscape, these
findings also suggest that they feel able to manage and adapt to such perceived age-
related challenges.
Perceptions of control over both the positive and negative aspects of ageing were
high among this cohort of Australian older adults. The mean score for the control-
positive dimension was higher than any reported overseas, with large proportions (over
90%) of participants agreeing or strongly agreeing with each of the subscale item
statements. For instance, 93% endorsed the statement that the quality of their
relationships in later life depends on them, while 94% agreed that the positive side to
ageing depends on them. These findings, however, are not entirely unique as
Page 160
142
participants in all of the international studies also largely endorsed these statements.
Further, even older, frail Australian adults (Yarmo-Roberts et al., 2010: findings
discussed further below) were more prone to agree that they had control over the
positive experiences of ageing. The authors of the Brief-APQ (B-APQ: Sexton et al.,
2014) have speculated that the control-positive subscale may be capturing something
beyond control beliefs given the language used for the items (i.e. “depends on me”
versus “control over”). If this is the case, it may account for the trend among different
populations of older adult to rate this subscale in the affirmative. It is beyond the scope
of this thesis to postulate what other, if any, constructs might be captured on this
measure however further investigation into this may prove interesting.
The findings for the control-negative subscale were slightly more intriguing; with
the exception of the younger French cohort (Ingrand et al., 2012) who had the same
mean score, this group of older Australians tended to report more control over negative
aspects of their ageing than the older overseas participants. While just under half agreed
that they could not control slowing down with age, the majority (80%) disagreed that
mobility in later life is not up to them while a further 77% disagreed that they have no
control over the effects that ageing has on their social life. The demographic
characteristics of the participants (see Section 7.4.1) may partly account for these more
optimistic appraisals of control. For instance, compared to their international
counterparts and Australian Census data, the Australian participants in this study were,
on average, more highly educated while a higher number of participants were still
working and had higher incomes than was found in the national Census. It is likely that
such socioeconomic resources, to some degree, contribute to a greater sense of control
and independence when reflecting on declines in social or physical functioning in later
life. Further, the majority of participants who self-selected into this study were already
actively engaged in community activities, having been recruited from various social and
community organisations. As such, it is possible that this motivation to engage coupled
with experiences of community support may bolster greater perceptions of control in the
face of age-related challenges. Finally, some cross-cultural differences may be at play
although it is more difficult to gauge where such differences might lie. Future research
with other groups of older Australians and their overseas counterparts will be required
to systematically examine cross-cultural variations in SPA.
Page 161
143
The lowest mean score on any of the APQ subscales was found for the emotional
representations dimension, whereby the highest proportion of participants (between
58% and 85% across the five items) overwhelmingly disagreed that they feel depressed,
worried, or angry when they think about getting older or how ageing might impact on
various domains of their lives. While there was also a trend for older European adults to
disagree that they had strong emotional responses to ageing, the mean score for the
current study was even lower than those reported overseas. It is possible that the group
of older adults in the current study experience good mental health overall. Alternatively,
this finding may indicate that negative affect is not generated to the ageing process
itself. On the whole, however, the mean score for this subscale along with those of the
other views about ageing subscales were comparable to those found for the international
studies. Each subscale also demonstrated acceptable internal consistency, as indicated
by all the Cronbach’s alpha scores being above .71. However, this was not the case for
the identity subscale. While the mean score for the identity subscale was consistent with
that reported by Barker and colleagues (2007), there did appear to be a ceiling effect,
which was also reported by Barker et al. The largest proportion of respondents
attributed health-related changes they had experienced to their ageing which suggests
that this subscale of the APQ may be problematic for capturing beliefs about ageing in
the context of health. The authors of the Brief-APQ (Sexton et al., 2014) excluded this
identity subscale from the short version for this reason (despite not assessing it in their
own study).
Finally, mean scores for the consequences, control, and emotional representations
subscales of the APQ in this cohort of older Australian adults were compared to those
reported in a cohort of older, frail Australian adults. The most notable differences found
between participants in the Yarmo-Roberts et al. (2010) study and those in the current
study were for the consequences-negative and control-negative dimensions.
Specifically, frail older adults were much more likely to perceive ageing as having a
negative impact on their life and were much less likely to perceive control over the
negative aspects of ageing than the current study participants. Given that the
participants in the Yarmo-Roberts et al. (2010) study were described as being unable to
live within the community without care service provision, having experienced
considerable health declines and other age-related losses, these findings on the
consequences and control dimensions are not unexpected.
Page 162
144
A more noteworthy finding is that emotional responses to ageing for the frail
older Australians in the Yarmo-Roberts et al. (2010) study were not markedly different
to those of older Australian adults in this study or of the international participants
discussed. On the one hand, receipt of care might be understood as a loss to
independence by the individual. If the older person subscribes to pervasive, largely
Westernised negative age stereotypes, for instance, that greater reliance on others makes
them a burden, this might threaten their self-identity which in turn may generate more
negative emotions to ageing. Kwak et al. (2014: see Section 5.2.5) found support for
such an effect. On the other hand, it is equally plausible that the utilisation of care
services which enable an individual to remain in their family home and maintain
familiar patterns of life might actually serve to bolster a faltering sense of autonomy and
self-reliance which ill health and other age-related declines may threaten. That there
was only minor difference on the emotional representations dimension across these two
distinct groups of older Australian adults suggests that affect generated to one’s own
ageing, much like subjective evaluations of health, are more closely aligned with the
personal circumstances of every individual rather than objective markers of decline.
Specifically, whether an individual feels able to cope with and adapt to challenging life
circumstances.
With the exception of the identity subscale, the inter-correlations among the APQ
subscales in the current study largely replicated the findings reported in the international
studies, providing support for the construct validity of the measure. The CSM posits a
logical, common-sense pattern of relationships among the dimensions and as
hypothesised, this logical pattern of relationships was found among the APQ views
about ageing subscales. That is, participants in the current study who were more aware
of the temporal aspects of their age and ageing (be it chronically or cyclically) also
ascribed more negative consequences to ageing and generated a higher degree of
negative emotions to their ageing. By contrast, older adults who perceived more control
over their ageing experiences were also more likely to attribute positive consequences to
ageing. Further, they were less likely to perceive ageing as being associated with
negative consequences and were less likely to perceive the temporal aspects or generate
negative affect to their ageing experiences. Barker and colleagues (2007) were the only
other researchers to test the identity subscale however they did find that this dimension
was related to most of the other SPA dimensions, with the exception of the
Page 163
145
consequences positive dimension. By contrast, the only significant association for
identity within the current study was with the control-negative dimension, which was of
low magnitude. Given the already questionable internal consistency of the identity
subscale, as evidenced by the ceiling effect found, excluding this dimension from
further analyses is warranted.
Also, contrary to the Irish and Dutch studies, no relationship was found in the
current study between the consequences-positive and timeline-cyclical subscales. While
there were significant relationships between the timeline-cyclical and the remaining
views about ageing subscales, the decision was made to remove this dimension from
further testing in this thesis for a number of reasons. First, there was only a marginal
difference between the two timeline dimension mean scores. Participants reported
slightly more chronic awareness of their ageing, yet neither of the temporal dimensions
was perceived strongly either way. Second, a longitudinal study design would be
necessary to really gauge any meaningful effects of the cyclical dimension. In
developing their 5-factor version of the APQ, Sexton et al. (2014) suggested that
variation in awareness over time is more applicable to the CSM of illness given the
various experiences of illness (e.g. acute versus chronic conditions). However, it may
have less theoretical grounding within an ageing context and indeed, Barker et al.
(2007) acknowledged that there was little empirical evidence to support the concept of
cyclicality within an ageing context. Sexton and colleagues excluded this subscale from
the brief version of the APQ. The developers of the shorter 7-factor version of the APQ
(Slotman et al., 2015), however, retained the timeline-cyclical subscale, arguing that
interesting information might be lost by excluding it. Specifically, as situations evolve
over time, such fluctuations in awareness of ageing may become more pronounced
which in turn influences other areas of functioning. It is therefore a potentially
interesting avenue to explore in future. However, as multiple time points would be
required to examine such changes and testing the two timeline dimensions in the current
study would be superfluous, only the timeline-chronic dimension will be examined in
subsequent studies in this thesis.
While all other inter-correlations in the current study were consistent with those
reported by Barker and colleagues (2007), both the Slotman et al. (2015) and Sexton et
al. (2014) studies demonstrated some findings that were less consistent with the
systematic pattern of relationships usually found for the CSM. Slotman and colleagues
Page 164
146
(2015) reported that Dutch participants who attributed more positive consequences to
ageing were also more likely to perceive less control over negative experiences of
ageing, attribute more negative consequences to ageing, and generate more negative
emotional responses to ageing. The authors of the Dutch study speculated that these
contradictory findings may reflect some cross-country instability in the construct,
particularly given recent reforms to aged care within the Netherlands whereby the
burden of costs have shifted from the state to the individual. It is possible that the
findings in the current study reflect, to some degree, more accessible public health and
aged care services in Australia. It is equally plausible that there are other specific and as
yet unexplored cultural factors which inform how older Dutch adults perceive their own
ageing. Within the Sexton et al. (2014) study, the direction of relationships among the
control-negative and other subscales were in the opposite direction to those found in
both the current study and by Barker et al. (2007). Sexton and colleagues did not
speculate on this finding however the shorter version of the APQ which they developed
combined both the control negative and consequences negative dimensions to capture
an overall negative ageing perceptions related primarily to physical decline.
Several important limitations should be considered when interpreting the findings
of this study. As data was collected by a non-probability sampling method, it is not
possible to generalise these findings to the older Australian adult population. While
participants in the current study shared a number of sociodemographic characteristics
with their national counterparts, particularly along age and gender distributions reported
in Census data, all of the demographics were allowed to vary. Participants in the current
study were more likely to hold degrees, to be in the labour force, and to have higher
incomes than older Australians more generally. As discussed in Chapter 7, some of
these discrepancies may be accounted for by the fact that over a third of participants in
the current study were Baby Boomers compared to the 2011 Census data for older
adults where very few of that generation was included. Every effort was made to recruit
a broad sample of older adults however the under-representation of lower
socioeconomic segments of the older adult population meant that the composition of the
final sample demonstrated a degree of homogeneity. On the one hand, this is a
limitation of the design which points to possible self-selection and non-response biases
that potentially influenced the results. On the other hand, as SPA are a relatively new
field of enquiry that has not been explored extensively within a self-regulation
Page 165
147
framework, the homogeneity of the sample in this initial study provides cleaner data
without the additional variance from other factors. Future considerations for data
collection could include more targeted strategies, for instance, recruitment via General
Practice sites or community aged care service providers, to reach a broader group of
older participants.
The findings reported here are also limited by the cross-sectional design of the
study. Inferences regarding the dynamic nature of SPA cannot be made without being
able to assess possible changes in ageing experiences across time. Given that health
status and other age-related factors can shift so rapidly within older age groups,
particularly amongst the oldest-old, and that such factors have been associated with
SPA (see Chapters 9 and 10), capturing ageing experiences at just one time point limits
any conclusions that can be drawn. A longitudinal design in future investigations would
extend the current findings to provide a more comprehensive understanding of how
older Australians experience their own ageing.
8.6 Conclusion
This study provides preliminary evidence that the CSM is an appropriate
conceptual framework for examining SPA in older, community-dwelling Australian
adults. To the best of our knowledge, this is the first Australian study to have tested the
original version of the APQ in full among a broader cohort of community-dwelling
older adults. Overall, the results suggest that, as a whole, this group of older Australian
adults perceive their ageing fairly optimistically which may be indicative of some
adaptive abilities. However, the final sample characteristics demonstrate that the older
adults who participated in this study are also a fairly well-resourced group of people.
While participation in this study was not restricted by functional health status and care
needs, some segments of the older population were under-represented. Thus, a closer
examination of individual differences in SPA is warranted to gauge the degree of
influence that such factors may have. Specifically, the following chapter examines
group differences in SPA by sociodemographic characteristics and subjective health
status.
Page 166
148
Chapter 9
A cross-sectional investigation of individual
differences in SPA: The role of sociodemographic
characteristics and subjective health status
Page 167
149
9.1 Introduction
The previous study demonstrated that the APQ is a psychometrically sound
measure for capturing the ageing experiences of older Australian adults within a self-
regulation framework. As discussed in Chapter 8, the only subscale of the APQ with
questionable psychometric properties within this cohort of older adults was for the
identity dimension, which demonstrated a ceiling effect and was thus excluded from
further analyses. The timeline-cyclical subscale was also excluded from subsequent
studies within this thesis. The decision to remove this subscale from further analysis
was based on a number of considerations, as outlined at length in Section 8.5. In brief,
the inclusion of two measures of timeline in the context of ageing was found to be
superfluous for the current study aims, and fluctuations in awareness of ageing in
particular was found to be less meaningful for the current cohort of older adults.
Further, the applicability of the construct (i.e. cyclicality) to an ageing context and
utility within studies with less than three time points has been questioned by other
researchers (e.g. Sexton et al., 2014; Slotman et al., 2015). The remaining six subscales
of the APQ have been adopted to examine the common-sense representations of ageing
(SPA) within all of the following studies in this thesis.
The current study seeks to examine how individual differences in
sociodemographic factors and subjective health status might influence ageing beliefs.
As discussed in Chapter 5, empirical evidence from both cross-sectional and
longitudinal studies have demonstrated a considerable degree of heterogeneity in how
one perceives their own age and ageing yet the findings regarding the sources of
individual difference in SPA have been mixed. Sociodemographic characteristics and
subjective health status are factors which have received considerable attention by
researchers however to date there has not been a great deal of consensus regarding the
degree of influence that such variables exert on SPA. For instance, some research (e.g.
McGee et al., 2011; Steverink et al., 2001) suggests that women are more likely to hold
youthful identities and perceive their ageing as a time of personal growth compared to
men. By contrast, other studies (e.g. Kleinspehn-Ammerlahn et al., 2008; Kotter-Grühn
et al., 2009) have found that women are less satisfied with their ageing than their male
counterparts. Chronological age has also been associated with SPA, with various
researchers (e.g. Connidis, 1989; McGee et al., 2011; Steverink et al., 2001) describing
Page 168
150
patterns of decreasing positive and increasing negative ageing experiences as people
grow older. Yet there is mounting evidence (e.g. Kleinspehn-Ammerlahn et al., 2008;
Kotter-Grühn et al., 2009; Bode et al., 2012) to suggest that chronological age in and of
itself may only explain a small portion of the variance in certain dimensions of SPA.
Similarly, socioeconomic status and relationship status have been explored within the
literature and the results have been variable.
Evidence for relationships between subjective health status and various
dimensions of SPA have been slightly more compelling than those reported between
SPA and sociodemographic factors. For instance, multiple studies (e.g. Barak & Stern,
1986; Barrett, 2003; Bowling, See-Tai, Ebrahim, Gabriel, & Solanki, 2005; Demakakos
et al., 2007; Hubley & Hultsch, 1994; Hubley & Russell, 2009; Kaufman & Elder,
2003;Rubin & Berntsen, 2006; Steverink et al., 2001) have reported that feeling
younger than one’s actual age is related to better self-ratings of health while chronic
illness and disability have been associated with lower ageing satisfaction and being
more temporally aware of one’s own ageing (e.g. Demakakos et al., 2007; Jang et al.,
2004; Kleinspehn-Ammerlahn et al., 2008; Slotman, Cramm, & Nieboer, 2017).
However, the available evidence also suggests that the relationships observed between
SPA and subjective health or sociodemographic characteristics are influenced by a
range of methodological and contextual factors. For instance, differences in the
conceptualisation and measurement of SPA (outlined in Sections 3.5 and 3.6), objective
health status, access to adequate health care, coping abilities, and culture also exert an
effect on these relationships.
The aim of the current study was to establish how sociodemographic and
subjective health variables relate to ageing experiences in this sample of older,
community-dwelling Australian adults. As highlighted in Chapter 8 and in Section 7.4,
when taken as a whole, this group of older adults are a largely well-resourced subset of
the older Australian adult population who appear to view their ageing fairly
optimistically. Given that group differences in SPA have been observed in other
investigations, however, this study sought to determine not only which
sociodemographic and subjective health variables were associated with dimensions of
SPA and how strong these associations were but also whether any group differences
would emerge. Specifically, differences in age, gender, educational attainment, income
Page 169
151
level, partner status, self-rated health and number of chronic medical conditions were
explored.
9.2 Hypotheses
Drawing on the empirical literature reviewed in Sections 5.3.1 and 5.3.2, the
following hypotheses were made:
1. SPA (as measured with the six subscales of the APQ) will be moderately
associated with age and measures of subjective health while being only weakly
associated with the other sociodemographic variables (gender, educational
attainment, income level, and partner status).
2. Individual differences in SPA will be found. Specifically, ageing experiences
will be perceived more favourably (i.e. less chronic awareness of ageing, more
positive and less negative consequences attributed to ageing, more felt control
over ageing experiences, and less negative emotions generated to ageing) by
women, by the youngest-old cohort (i.e. Baby Boomers), by higher
socioeconomic status (i.e. higher income and higher levels of education)
participants, by participants in a marital or de facto relationship, and by
participants reporting more favourable subjective health ratings (self-rated health
and number of chronic medical conditions) than it is perceived in the other
cohorts.
9.3 Method
Participant information, research procedure, survey measures, and analysis
methods are described fully in Chapter 7. In short, this study involved a cross-sectional
analysis of the Time 1 APQ (Barker et al., 2007), sociodemographic, and health status
data to test the hypotheses outlined in Section 9.2 (refer to Table 2 in Section 7.4 for
total sample means and standard deviations). The group categories were organised as
follows. Age comprised three groups, namely youngest-old (55-64 years) who were
born between 1947 and1956, middle-old (65-74 years) who were born between 1937
and1946, and oldest-old (75 years and over) who were born between 1921 and 1936.
The highest level of educational attainment was organised into three categories. Group 1
(Up to secondary school) completed primary and/or secondary school, group 2 (Trade/
Cert. /Diploma) completed a trade/apprenticeship, certificate, or diploma, and group 3
Page 170
152
(Bachelor degree / Post-grad. diploma/degree) completed an academic degree. Total
income level (in Australian dollars) was also organised into three groups, specifically
group 1 (Less than or equal to $20,000), group 2 ($20,001-$60,000), and group 3 (More
than or equal to $60,001). Partner status consisted of four categories. Group 1
(Partnered) included those currently married or in de facto relationships, group 2
(Divorced / Separated), group 3 (Widowed), and group 4 (Never married). Self-rated
health status was organised into five groups (Excellent, Very good, Good, Fair, Poor)
and chronic medical conditions was organised into four groups according to the number
of conditions reported (0, 1, 2, 3 or more). Descriptive statistics for the groups are
provided in Table 6.
Pearson’s correlation coefficients were calculated to explore the strength of the
relationships between the cohort sociodemographic and health status characteristics (i.e.
age, gender, level of educational attainment, income level, partner status, self-rated
health status, and self-reported chronic medical conditions) and six subscales of the
APQ (i.e. timeline-chronic, consequences-positive, consequences-negative, control-
positive, control-negative, and emotional representations). As a general rule of thumb,
correlation coefficients around 0.1, 0.3, and 0.5 represent weak, moderate, and strong
associations, respectively (J. Cohen, 1998). Group differences were explored with an
independent samples t-test and one-way ANOVAs. The less biased effect size measures
of Hedges’ g and omega squared (ω2) were calculated to estimate the effects of the
group differences. It has been suggested that for ω2, values of .01, .06, and .14 represent
small, medium, and large effects, respectively, while for Hedges’ g, 0.2, 0.5, and 0.8
represent small, medium, and large effects, respectively (Ellis, 2010; Field, Miles, &
Field, 2013; C. Huber, 2013).
9.4 Results
Descriptive statistics for the APQ dimensions by sociodemographic and
subjective health status characteristics are presented in Table 6. A number of patterns
were observed for the groups, particularly for age and subjective health status.
Specifically, the numerically smallest means for the timeline-chronic and consequences-
negative subscales were found for the youngest age group, the group that rated their
health as ‘excellent’, and the group that reported nil chronic medical conditions. These
mean scores increased relative to the increases in age and decreasing subjective health
Page 171
153
evaluations, so that the oldest-old age group, the group that rated their health as ‘poor’,
and the group that reported 3 or more chronic medical conditions had the numerically
largest means. The converse patterns were observed for these groups on the
consequences-positive, control-positive, and control-negative subscales (i.e. largest
numerical means to smallest numerical means).
9.4.1 SPA and age
Age was significantly correlated with the timeline-chronic, r = .11, p = .040,
consequences-positive, r = -.21, p = <.001, consequences-negative, r = .22, p = <.001,
control-positive, r = -.11, p = .029, and control-negative, r = -.20, p = <.001
dimensions. No significant relationships were found for age with the emotional
representations dimension. A one-way ANOVA identified a significant effect of age on
consequences-positive, F(2,365) = 5.62, p = .004, ω2
= .17. Post-hoc analyses revealed
significant differences between the groups with the youngest-old age group (55-64
years) of participants holding stronger beliefs that ageing has positive consequences
than the oldest-old age group (75+ years) of participants. A significant effect of age on
consequences-negative was also found, F(2,365) = 8.94, p = <.001, ω2
= .20 with post-
hoc analyses identifying significant differences between the youngest-old age group and
the oldest-old age group, and also between the middle-old age group (65-74 years) and
the oldest-old age group. Specifically, the oldest group of participants reported stronger
beliefs that ageing has negative consequences than those in either of the two younger
cohorts, while those in middle-old age group reported slightly more negative beliefs for
consequences than those in youngest-old age group. Finally, a significant effect of age
on control-negative was identified, F(2,365) = 6.48, p = .002, ω2
= .17. Post-hoc
analyses revealed significant differences between the youngest-old and the oldest-old
participants, and between the middle-old and the oldest-old participants That is, as
people aged, they reported less perceived control over the negative experiences of
ageing.
Page 172
154
Table 6
Descriptive statistics for the APQ subscales by sociodemographic and subjective health status characteristics
TCR PCSQ NCSQ PCON NCON ER
Group categories n Mean (SD) Mean (SD) Mean (SD) Mean (SD) Mean (SD) Mean (SD)
Age(years)
55-64 133 2.65 (.76) 3.95 (.56) 2.68 (.72) 4.20 (.53) 3.63 (.67) 2.29 (.79)
65-74 153 2.71 (.76) 3.80 (.57) 2.79 (.73) 4.19 (.48) 3.52 (.65) 2.11 (.65)
75 and over 82 2.79 (.82) 3.70 (.59) 3.10 (.68) 4.06 (.58) 3.30 (.70) 2.14 (.77)
Gender
Female 254 2.64 (.76) 3.87 (.58) 2.77 (.73) 4.19 (.54) 3.56 (.64) 2.22 (.75)
Male 114 2.86 (.78) 3.75 (.57) 2.95 (.72) 4.10 (.48) 3.40 (.75) 2.11 (.69)
Highest level of educational attainment
Up to secondary school 87 2.63 (.80) 3.79 (.57) 2.77 (.81) 4.09 (.52) 3.38 (.72) 2.16 (.79)
Trade/Cert./Diploma 141 2.77 (.80) 3.78 (.59) 2.87 (.70) 4.06 (.47) 3.44 (.62) 2.26 (.69)
Bachelor degree/Post-grad. diploma/degree 136 2.71 (.72) 3.91 (.57) 2.82 (.72) 4.32 (.55) 3.66 (.70) 2.13 (.73)
Income (total AUD)
Less than or equal to $20,000 75 2.87 (.76) 3.80 (.60) 3.00 (.78) 4.06 (.47) 3.28 (.69) 2.33 (.81)
$20,001-$60,000 181 2.66 (.77) 3.78 (.55) 2.86 (.72) 4.15 (.50) 3.57 (.63) 2.18 (.74)
More than or equal to $60,001 99 2.63 (.75) 3.95 (.59) 2.61 (.69) 4.29 (.53) 3.61 (.73) 2.06 (.63)
Table 6 continued over page
Page 173
155
TCR PCSQ NCSQ PCON NCON ER
Group categories n Mean (SD) Mean (SD) Mean (SD) Mean (SD) Mean (SD) Mean (SD)
Partner status
Partnered (married or de facto) 213 2.65 (.72) 3.85 (.57) 2.77 (.70) 4.16 (.50) 3.54 (.66) 2.10 (.67)
Divorced/Separated 82 2.71 (.84) 3.89 (.62) 2.82 (.77) 4.24 (.51) 3.57 (.71) 2.27 (.82)
Widowed 54 2.87 (.83) 3.68 (.53) 2.98 (.80) 4.15 (.62) 3.40 (.72) 2.26 (.75)
Never married 17 3.02 (.75) 3.80 (.59) 2.96 (.62) 4.01 (.52) 3.29 (.61) 2.60 (.82)
Self-rated health
Excellent 56 2.44 (.79) 3.94 (.49) 2.35 (.67) 4.40 (.50) 3.92 (.60) 1.89 (.66)
Very good 154 2.52 (.73) 3.85 (.59) 2.69 (.67) 4.24 (.49) 3.57 (.66) 1.99 (.66)
Good 111 2.91 (.69) 3.78 (.58) 2.99 (.66) 4.09 (.46) 3.39 (.64) 2.32 (.62)
Fair 36 3.04 (.75) 3.78 (.53) 3.36 (.62) 3.91 (.37) 3.22 (.59) 2.74 (.72)
Poor 9 3.58 (.75) 3.67 (.93) 3.62 (.98) 3.44 (1.10) 2.89 (.83) 3.24 (1.12)
Chronic medical conditions (number)
0 50 2.46 (.73) 3.91 (.46) 2.58 (.72) 4.37 (.44) 3.78 (.70) 2.04 (.62)
1 68 2.54 (.68) 3.71 (.61) 2.68 (.65) 4.18 (.47) 3.52 (.68) 2.07 (.63)
2 102 2.74 (.73) 3.84 (.57) 2.75 (.74) 4.22 (.50) 3.64 (.60) 2.08 (.69)
3 of more 148 2.85 (.82) 3.85 (.60) 3.02 (.72) 4.06 (.56) 3.33 (.68) 2.35 (.81)
Note. TCR = timeline-chronic; PCSQ = consequences-positive; NCSQ = consequences-negative; PCON = control-positive; NCON = control-negative; ER = emotional
representations.
Page 174
156
9.4.1 SPA and gender
Gender was significantly correlated with the timeline-chronic, r = -.13, p = .010,
consequences-negative, r = -.11, p = .029, and control-negative, r = .11, p = .040
dimensions. There were no significant relationships between gender and the
consequences-positive, control-positive, or emotional representations dimensions.
Independent samples t-test was used to examine whether men and women would differ
on the SPA dimensions. Male participants reported more chronic awareness of their
own age and ageing than female participants, t(366) =2 .58, p = .010, g = 0.29. Male
participants also held stronger beliefs about the negative consequences of ageing than
the female participants, t(366) = 2.19, p = .029, g = 0.25. No other differences were
found for gender.
9.4.2 SPA and educational attainment
Level of education attained was significantly associated with the control-positive,
r = .17, p =.001, and control-negative, r = .17, p = .001 dimensions. A significant effect
of educational attainment on control-positive, F(2,361) = 10.22, p = <.001, ω2 = .22, and
control-negative, F(2,361) = 5.95, p = 003, ω2
=.16 was identified. Post-hoc analyses
revealed significant differences between group 1 (Up to secondary school) and group 3
(Bachelor degree/Post-grad. diploma/degree), and between group 2
(Trade/Cert./Diploma) and group 3 on both control dimensions. Specifically,
participants who had completed an academic degree perceived more control over both
the positive and negative experiences of ageing than that of the other two educational
attainment groups.
9.4.3 SPA and income level
Total income level was significantly associated with consequences-positive, r =
.12, p = .029, consequences-negative, r = -.22, p = <.001, control-positive, r = .17, p =
001, control-negative, r = .19, p = <.001, and emotional representations, r = -.14, p =
009. A one-way ANOVA identified a significant effect of income level on
consequences-negative, F(2,352) = 6.64, p = .001, ω2
= .18. Post-hoc analyses revealed
significant differences between group 1 (≤$20,000) and group 3 (≥$60,001), and
between group 2 ($20,001-$60,000) and group 3. That is, those who reported the
Page 175
157
highest levels of total income also reported feeling less negative consequences about
their own age and ageing than those groups who reported lower levels of total income.
A significant effect of income level on control-positive, F(2,352) = 4.81, p = .009, ω2
=.14, and on control-negative, F(2,352) = 6.38, p = .002, ω2
= .17, was also found. For
control positive, post-hoc analyses revealed significant differences between group 1 and
group 3, with those reporting the highest incomes also perceiving more control over the
positive experiences of ageing than those in the lowest income group. Finally,
significant differences on negative control were identified between group 1 and group 2,
and between group 1 and group 3. Specifically, participants who reported the lowest
level of total income also reported less perceived control over the negative experiences
of ageing than either of the other two income level groups.
9.4.4 SPA and partner status
Partner status was significantly correlated with timeline-chronic, r = .12, p = .023
and emotional representations, r = .15, p = .005. No relationships were found for the
consequences or control dimensions. There was a significant effect of partner status on
emotional representations, F(3,362) = 3.41, p = .018, ω2
= .14. Post-hoc analyses
revealed significant differences between group 1 (Partnered) and group 4 (Never
married), with older adults who had never been married reporting more negative
responses generated to the ageing process than those reported by older, partnered adults.
No other group differences emerged.
9.4.5 SPA and self-rated health status
Self-rated health status was significantly associated with timeline-chronic, r = .32,
p = <.001, consequences-negative, r = .42, p = <.001, control-positive, r = -.33, p =
<.001, control-negative, r = -.33, p = <.001, and emotional representations, r = .40, p =
<.001. A one-way ANOVA revealed a significant effect of self-rated health status on
timeline-chronic, F(3,361) = 11.68, p = <.001, ω2
= .32. Post-hoc analyses identified
significant differences between group 1 (Excellent) and groups 3 (Good), 4 (Fair), and 5
(Poor), and between group 2 (Very good) and groups 3, 4, and 5. That is, participants
who rated their health as either excellent or very good reported less chronic awareness
of their own age and ageing than groups that rated their health as good, fair, or poor. A
significant effect of self-rated health was also found for the consequences-negative,
Page 176
158
F(4,361) = 19.35, p = <.001, ω2
= .41, control-positive, F(4,361) = 12.08, p = <.001, ω2
= .33, and control-negative, F(4,361) = 11.22, p = <.001, ω2
= .32 dimensions. For
consequences-negative, post-hoc analyses revealed significant differences between
group 1 and groups 2, 3, 4, and 5. Differences also emerged between group 2 and
groups 3, 4, and 5, and between group 3 and 4. Specifically, participants who rated their
health as excellent reported less negative consequences to ageing than any of the other
groups. Those who rated their health as very good also reported less negative
consequences than groups which rated their health more negatively. Post-hoc analyses
on the control-positive dimension identified significant differences between group 1 and
groups 3, 4, and 5, between group 2 and groups 4 and 5, and between groups 3 and 5.
Perceptions regarding control over the positive experiences of ageing were highest for
the group that rated their health as excellent and decreased as self-ratings of health
decreased. Similarly, group differences were also found for the control-negative
dimension, between group 1 and groups 2, 3, 4, and 5, and between group 2 and groups
4 and 5. Those who rated their health more favourably perceived having greater control
over the negative experiences of ageing, which declined as their ratings of health
declined. Finally, a significant effect was found for emotional representations, F(4,361)
= 19.04, p = <.001, ω2
= .41. Differences emerged between group 1 and groups 3, 4, and
5, between group 2 and groups 3, 4, and 5, and between group 3 and groups 4 and 5.
That is, those who rated their health more favourably reported less negative emotional
responses to their ageing than groups which rated their health as worse. There were no
differences, however, between the groups which rated their health as either excellent or
very good.
9.4.6 SPA and number of chronic medical conditions
Self-reported chronic medical conditions was significantly correlated with
timeline-chronic, r = .19, p = <.001, consequences-negative, r = .23, p = <.001, control-
positive, r = -.18, p = <.001, control-negative, r = -.21, p = <.001, and emotional
representations, r = .16, p = .002. There was a significant effect of the number of
chronic medical conditions reported on timeline-chronic, F(3,364) = 4.70, p = .003, ω2 =
.17. Post-hoc analyses revealed significant differences between group 1 (0 medical
conditions) and group 4 (3or more medical conditions), and between group 2 (1 medical
condition) and group 4. That is, the groups that reported living with either zero or one
Page 177
159
medical condition also reported being less chronically aware of their own age and
ageing that the group which identified living with three or more medical conditions. A
significant effect was also found for the consequences-negative dimension, F(3,364) =
7.18, p = <.001, ω2
= .22. Post-hoc analyses revealed significant differences between
group 1 and group 4, between group 2 and group 4, and between group 3 (2 medical
conditions) and group 4. As the number of chronic medical conditions increased, beliefs
about the negative consequences of ageing also increased. Significant effects were
found for both of the control dimensions. On the control-positive dimension, F(3,364) =
5.22, p = .002, ω2
= .18, post-hoc analyses revealed significant differences between
group 1 and group 4, whereby older adults reporting zero chronic medical conditions
perceived greater control over the positive experiences of ageing than older adults who
reported living with three or more medical conditions. On the control-negative
dimension, F(3,364) = 7.82, p = <.001, ω2
= .23, post-hoc analyses revealed significant
differences between group 1 and group 4, and between group 3 and group 4.
Specifically, participants who reported three or more chronic medical conditions also
perceived less control over the negative experiences of ageing than participants with
zero or two medical conditions. Finally, there was a significant effect of the number of
chronic medical conditions on emotional representations, F(3,364) = 4.53, p = .004, ω2
= .17. Post-hoc analyses revealed significant differences between group 1 and group 4,
between group 2 and group 4, and between group 3 and group 4. Older adults who
identified as living with three or more chronic medical conditions reported more
negative emotional responses to their own ageing than any of the groups that reported
fewer medical conditions.
9.5 Discussion
The present study sought to establish the relationships between the dimensions of
SPA and sociodemographic characteristics and subjective health status within this
sample of older, community-dwelling Australian adults. More specifically, the
overarching aim of this study was to determine the strength of any relationships found
and to examine where group differences in ageing experiences would emerge.
The main finding of this study was that individual differences in chronological
age, gender, educational attainment, income level, partner status, and subjective ratings
of health were all related to various dimensions of SPA. Furthermore, ageing
Page 178
160
experiences were perceived differently across the various cohorts. However, with the
exception of self-rated health, all of the associations were small, as indicated by the
small effect sizes (r <.22). This suggests that while sociodemographic factors play some
role in the perceptions that this older group of adults hold regarding their own ageing
experiences, a greater proportion of the variance in SPA is explained by other factors.
Self-rated health was the only variable within the current study which exhibited
moderate effect sizes for the relationship with SPA. While the finding for self-rated
heath is largely consistent with the literature, the weak association with age in particular
was less expected.
Although the correlations were small, chronological age was related to five out of
the six dimensions of SPA, the one exception being emotional representations. Where
correlations between age and SPA have been reported elsewhere, the findings have
differed from study to study. Steverink et al. (2001) measured ageing perceptions across
three distinct domains and reported that age was weakly associated with the SPA
dimension of social loss, while being strongly related to the physical decline and
continuous growth dimensions. Although this may reflect how different measures of
SPA influence the relationship with age, other studies which have used the same
measure have also produced differing results. For instance, Stephan, Demulier, et al.
(2012) and Canada et al. (2013) used the same measure of subjective age in their French
samples and reported a strong association with age, and nil association with age,
respectively. Thus, it appears likely that other factors (as discussed further below) may
partly account for the chronological age-SPA relationship.
While effect sizes vary, the direction of these relationships appears fairly uniform.
That is, there is a trend for decreasing positive and increasing negative SPA as people
age. This pattern also emerged in the current study. In line with the findings reported by
McGee and colleagues (2011), a chronic awareness of one’s own ageing and the
perception that age is associated with negative consequences increased across the age
cohorts, with the lowest mean scores being found for the youngest-old group and the
highest being observed for the oldest-old group. Conversely, mean scores for the more
positive appraisals of ageing, that is, perceptions that ageing is associated with positive
consequences and beliefs about control over both the positive and negative aspects of
ageing were highest for the youngest-old cohort and decreased across the other age
groups.
Page 179
161
Despite there being no correlation between age and negative emotions generated
to ageing, it is curious that those in the youngest cohort had the highest mean score on
this dimension, followed by those in the oldest group. As discussed in Chapter 8, it
appears that this dimension of SPA may be less affected by objective markers, for
instance, actual health status and chronological age while being more susceptible to
other contextual or cultural factors. To illustrate, it is possible that a transition from the
socially constructed notions of middle-age to older adult engenders a period of
reflection on what it might mean to be the ‘old other’. In an Australian society which
still largely perpetuates negative views about ageing, it is feasible that this process of
reflection generates negative emotions to ageing for people who have never previously
identified as ‘older’. Over time, people may adjust as personal experiences of ageing are
assimilated into the self-concept, thereby alleviating the initial feelings of fear, sadness,
or worry generated to age and ageing. Interestingly, Demakakos et al. (2006) found that
an individual’s actual age is strongly related to their beliefs regarding when old age
begins. More specifically, older adults in the youngest cohort of their study (i.e. 50-54
years) perceived old age as beginning in the late sixties whereas those in the oldest
cohort (80+ years) perceived it as starting around 75 years of age. While this was not
explored in the current study, it is possible that adjusting perceptions about the start of
old age serves as a self-enhancement strategy (Westerhof & Barrett, 2005: see Section
5.2.2) whereby maintaining a more youthful identity reduces negative affect associated
with ageing.
Age group differences were found for only three of the SPA dimensions, namely,
for perceptions regarding the positive and negative consequences of ageing and
perceptions of control over the negative aspects of ageing. More specifically, compared
to the middle-old and oldest-old cohorts, the youngest-old cohort (i.e. the Baby
Boomers) perceived their ageing more favourably in regards to the consequences of
getting older and how much control they would have over aspects such as independence
and the ability to cope with problems. Despite the observed differences in the current
study, however, the small magnitude of the relationships suggests that chronological age
may not be an especially meaningful individual difference in SPA for this group of
older Australians.
Other researchers (e.g. Bode et al., 2012; Hubley & Russell, 2009; Kleinspehn-
Ammerlahn et al., 2008; Kotter-Grühn et al., 2009; Teuscher, 2009) have suggested that
Page 180
162
health-related factors, including self-rated health which was found to account for a
larger proportion of the variance in SPA in the current study, are more likely to explain
differences in ageing beliefs than age per se. Further, alongside current health-related
factors, it is also possible that cohort effects exert some influence on these findings. The
youngest age cohort was comprised primarily of Baby Boomers, a generation of older
adults who differ markedly on a range of economic, cultural, and social indicators
compared to previous generations (Hugo, 2014). Unlike their predecessors, Baby
Boomers were the beneficiaries of increasing economic prosperity and largescale social
reforms such as free tertiary education and universal healthcare. Given that such factors
are understood to shape not only population health but also attitude and belief formation
in individuals (cumulative effects of multiple health determinants operating over time:
see Section 2.2.2 for a discussion on health determinants), it seems improbable that the
younger generation of older adults in the current study would not view their own ageing
in a distinctly different way to their own parent’s generation.
As hypothesised, the remaining sociodemographic variables of interest, namely,
gender, partner status, education and income levels were only weakly associated with
various dimensions of SPA and none were associated with all six subscales of the APQ.
Although the current findings point to a small relationship for a chronic awareness of
ageing with gender and partner status, the timeline-chronic dimension was unrelated to
education or income levels, two indicators of socioeconomic status. This finding is a
little surprising given that numerous other studies which have examined subjective age,
another temporal dimension of SPA, have consistently reported that feeling older than
one’s age is related to lower socioeconomic status (Barrett, 2003). The subjective age
and timeline-chronic dimensions do, however, capture differing aspects of temporal
ageing experiences, the former going to how old an individual feels and the latter to an
awareness of the process over time. This may partly account for no relationship being
found in the current study. Further, current income levels and education may not be
ideal markers of socioeconomic status, particularly within the older Australian
population. Recent Australian Census data (ABS, 2016) indicates that almost a third of
older Australian adults are asset rich but income poor. That is, despite low incomes,
many own their own homes outright which significantly reduces the burden of housing
costs which younger, low income households face. Home ownership and other asset
measures were not addressed in the current study. An additional consideration is that,
Page 181
163
given the size of the current sample, there may not have been enough statistical power
to detect the small amount of variance that education and income may have contributed
to the timeline dimension.
The perception that ageing is a time of personal growth and wisdom was related
to income but not to gender or education. Steverink and colleagues (2001) found that
women reported more continuous growth as they aged compared to men however no
such differences emerged in the current study. Indeed, the only differences found
between men and women in this study was that older men reported being more
chronically aware of their own ageing and perceived more negative consequences of
ageing than their female counterparts. Thus, despite living in a cultural environment that
extols the virtues of youth and where the anti-ageing industry frequently targets older
women in particular, it appears that this group of older Australian women view their
ageing more favourably than the male participants. The differences between the genders
were small, however, which replicates the findings reported elsewhere on multiple
measures of SPA (e.g. Barak, Mathur, Lee, & Zhang, 2001; Barak & Stern, 1986;
Henderson, Goldsmith, & Flynn, 1995; Montepare & Lachman, 1989; Pinquart &
Sörensen, 2001; Rubin & Berntsen, 2006).
The remaining group differences which emerged were less surprising given the
findings reported elsewhere (e.g. Bryant et al., 2012; Demakakos et al., 2006; Jang et
al., 2004; McGee et al., 2011; Steverink et al., 2001). Participants with higher levels of
education and higher incomes were more likely to perceive a sense of control over both
the positive and negative aspects of ageing than those with less education and lower
income. The highest income group also reported fewer perceptions about the negative
consequences of ageing. Further, participants who had never been married generated
more negative emotions to ageing than participants who were married. Nonetheless,
none of these sociodemographic characteristics was strongly related to the SPA
dimensions. It has been suggested that the relationship between higher income or
education and more favourable appraisals of ageing is consistent with the cumulative
advantage and disadvantage hypothesis, whereby higher socioeconomic status leads to
the accumulation of both material and psychosocial advantages (Barrett, 2003). If this is
the case, access to greater social support or other coping resources may help to buffer
negative social or cultural messages about ageing. Marriage may also provide additional
emotional or instrumental support which serves to buffer the negative effects of ageing
Page 182
164
or strengthen coping abilities to manage stressors (see Section 4.2.2 for a discussion on
the various ways in which social resources are understood to relate to stressors).
Of all the variables explored, self-rated health had the strongest relationship with
SPA. Both self-rated health and the number of chronic medical conditions which
participants reported had been diagnosed by a doctor or other health professional were
related to five out of the six SPA dimensions. The consequences-positive dimension,
that is, the perception that ageing is characterised as a time of growth, wisdom, and a
greater appreciation of things was unrelated to either measure of subjective health in the
current study. By contrast, Bryant and colleagues (2012) found that psychosocial
growth (as measured with the AAQ: see Section 3.6 for measures of SPA) was
negatively related to the physical component summary (PCS) of the SF-12 Health
Survey, another measure of self-rated health. However, this disparity across the studies
is not particularly startling given that the two measures of self-rated health are likely
capturing distinct health constructs. Sargent-Cox et al. (2008) found that the wording of
self-rated health items has a significant influence on health evaluations made by older
adults. In the current study, the global self-rated health measure makes no reference to
specific health domains and is therefore likely to capture a broader biopsychosocial
concept of health whereas the PCS items specifically references physical functioning.
The finding that subjective health was unrelated to perceptions regarding the positive
consequences of ageing while still being related to other positive appraisals of SPA
highlights the complex ways in different dimensions of SPA relate to health-related
variables.
Group differences in subjective rating of health were found for each of the related
SPA dimensions and a distinct pattern of differences emerged. Specifically, there were
significant differences between the groups that rated their health most favourably (i.e.
excellent or very good self-rated health and zero or one chronic medical conditions) and
the groups that rated their health less favourably (i.e. fair or poor self-rated health and
two or more chronic medical conditions). The groups that rated their health more
favourably on both measures reported more optimistic appraisals of their ageing
experiences than the groups which rated their health less favourably. This pattern of
relationships is consistent with findings reported in other studies (e.g. Barak & Stern,
1986; Barrett, 2003; Bowling, See-Tai, Ebrahim, Gabriel, & Solanki, 2005; Demakakos
et al., 2007; Hubley & Hultsch, 1994; Hubley & Russell, 2009; Jang et al., 2004;
Page 183
165
Kaufman & Elder, 2003; Kleinspehn-Ammerlahn et al., 2008; McGee et al., 2011;
Rubin & Berntsen, 2006; Slotman, Cramm, & Nieboer, 2017; Steverink et al., 2001) for
various measures of SPA.
The contrast between the two subjective health indicators used in the current
study is also noteworthy. The number of chronic medical conditions that were reported
by participants was only weakly associated with the SPA dimensions whereas the
correlations were stronger for the self-rated health -SPA relationships. One explanation
for this may lay in the management of chronic medical conditions. Wurm and
colleagues (2014) found that primary care supply buffered the relationships between the
number of self-reported chronic conditions and SPA in German older adults. While
Australia has high rates of hospital admissions for chronic conditions, particularly
asthma and chronic obstructive pulmonary disease, other conditions such as diabetes are
managed well through primary health care (Organisation for Economic Co-operation
and Development [OECD], 2015). The National Strategic Framework for Chronic
Conditions (Australian Health Ministers’ Advisory Council, 2017) includes a broad
range of programmes for the primary care management of chronic conditions which is
available to all Australian residents. Given the accessibility of these services, and the
fact that the older Australian adults in the current study could also be described as fairly
well-resourced cohort, it is possible that primary care moderates the relationship
between higher disease burden and SPA.
While it is not possible to generalise these findings to the older Australian
population due to the sampling method used, they do lend weight to the existing
evidence which suggests that sociodemographic variables explain only a small amount
of variance in ageing experiences while health-related factors such as self-rated health
play a larger role. The current findings, however, need to be interpreted with caution
given the cross-sectional design of the study. A longitudinal investigation would be
required to ensure that age and cohort effects were not confounded. Further, this design
limits any causal inferences. While self-rated health was moderately related to most of
the SPA dimensions explored, this study provides no insight into the direction of these
relationships. Finally, while no other cultural or contextual factors which may be
influencing these relationships, for instance, coping abilities or access to primary health
care, was explored in this study, an examination of such factors in future investigations
is warranted to determine how particular cohorts of older adults might be more
Page 184
166
vulnerable to negative SPA and how this might impact on their overall psychological
and emotional functioning.
9.6 Conclusion
To the best of our knowledge, this is the first Australian study to investigate how
the multiple dimensions of SPA within the CSM framework relate to sociodemographic
characteristics and subjective health status within a cohort of older Australian adults.
The results from this investigation suggest that both of these factors are related to some
degree to ageing experiences however self-rated health appears to play a larger role in
SPA than the other variables explored. Nonetheless, group differences for the other
sociodemographic variables did emerge. Ageing experiences were perceived more
favourably by the youngest age cohort, by women, by the married cohort, and by those
with higher levels of income and education.
The aim of Chapter 10 is to examine how SPA relates to psychological and
emotional health functioning. Specifically, relationships between SPA and mental
health, which is measured as psychological distress and subjective wellbeing in this
thesis, and between SPA and individual differences in coping and disposition will be
examined. Given the findings for self-rated health in the current chapter, this subjective
health indicator will also be utilised in Chapter 10 to explore whether there are different
patterns of relationships between SPA and psychological health by how individuals rate
their health. Further, while the findings have been mixed, chronological age has also
been identified within the literature as playing some role in the psychosocial and mental
health functioning of older adults. Thus, despite the weak age-SPA associations found
in the current study, the pattern of relationships between SPA and psychological health
will also be examined by age cohorts.
Page 185
167
Chapter 10
A cross-sectional investigation of the
relationships between SPA and mental health in
older Australian adults
Page 186
168
10.1 Introduction
The central aim of this study is to establish the relationships for SPA with the
mental health and psychosocial variables described in Chapter 4. Specifically, the two
indicators of mental health being examined include subjective wellbeing and
psychological distress while the psychosocial variables of interest include coping, social
networks, and dispositional traits. Chapter 9 demonstrated that individual differences in
sociodemographic factors were weakly associated with SPA in this cohort of older
Australian adults, while self-rated health demonstrated a moderate influence. Based on
these findings and those reported within the literature (reviewed in Sections 5.3.1 and
5.3.2), the only groups that will be explored within the current chapter are self-rated
health and chronological age. Chronological age was only weakly associated with each
of the SPA dimensions in this group of older adults yet as discussed in Chapter 4, it has
been identified within the literature as exerting some influence in the psychosocial and
mental health functioning of older adults. As the extent of this influence is poorly
understood, an examination of how chronological age may impact on the pattern of the
relationships between SPA with mental health and psychosocial factors is merited in the
current study.
Mental health is integral to an individual’s overall health and wellbeing which is
reflected in the dictum that “there is no health without mental health” (WHO, 2005, p.
11). More specifically, mental, physical, and social health are so inextricably linked,
often in complex and nuanced ways such that neglect in one area is likely also to have a
negative impact on another area of health. As discussed in Section 2.2, the most current
conceptualisations of health, for instance, the wellness or ecological models, emphasise
that health is a resource comprised of multiple, interacting dimensions. These models
stress health promotion and maintenance across the multiple health dimensions (Larson,
1999), recognising that numerous biological, behavioural, environmental, social, and
psychological factors operate in complex, cumulative ways across the lifespan to shape
health outcomes. By contrast, the biomedical model focusses primarily on biological
processes, emphasising the absence of disease and maintenance of physical and mental
functioning (Bowling & Dieppe, 2005; Larson, 1999) while largely ignoring
psychological, social, or environmental influences on optimal functioning. Given the
dominance of the biomedical model throughout most of the 20th
century, with its focus
Page 187
169
on pathological states of mental and physical functioning, it is not unsurprising that
there remain significant gaps in knowledge regarding mental health in older populations
(as opposed to mental illness: see Section 2.2.3 for how these related yet distinct
constructs are conceptualised).
Poor mental health (i.e. low subjective wellbeing and /or high psychological
distress) at any age is detrimental to the overall functioning of the individual, as well as
having broader social and economic effects within communities. However, it may be
especially devastating in older adults who are more likely than their younger
counterparts to have already experienced compromised resources due to, for instance,
declines in physical or cognitive health, or other age-related social losses. Further, even
in the absence of psychopathology, poor mental health can leave people vulnerable to
developing mental illness at a later stage (Wang et al., 2011). It is therefore important to
establish not only the rates of poor mental health in older populations but also which
modifiable factors might influence this aspect of health. The successful ageing paradigm
(refer to Section 2.3 for an overview of the various approaches) has provided a
framework for exploring such factors in older populations. Psychosocial theories of
successful ageing, in particular, stress the importance of self-regulatory processes of
adaptation which may help people to realise the potential for optimal levels of mental
health and wellbeing as they age. A growing body of research in this area is focussed on
understanding which psychosocial resources may help to strengthen these adaptive
processes.
The current evidence regarding the relationship between SPA, one psychological
measure of successful ageing, and mental health is limited. Moreover, only a handful of
investigations have utilised the CSM self-regulation framework to examine this
association. As reviewed at length in Section 5.2, the available evidence broadly
indicates that being more chronically aware of ageing, perceiving more negative and
less positive consequences of ageing, perceiving less control over the positive
experiences of ageing, and generating more negative emotional responses to the
experience of age and ageing may all contribute to poorer mental health functioning.
Yet there remain a number of inconsistencies within the literature. Insofar as the overall
findings suggest the multiple dimensions of SPA are related to the psychological health
and wellbeing of older adults in meaningful and substantive ways, the existing evidence
also indicates that the ageing construct is quite sensitive to a range of methodological
Page 188
170
and contextual factors. Among such factors are individual differences in psychosocial
functioning, which may explain some of the differences found within the literature
regarding how older adults perceive their own ageing experiences.
The roles that psychosocial resources play in an individual’s SPA have received
very little attention within the literature to date. Because investigations into the multiple
dimensions of SPA is a relatively new field of enquiry and many earlier approaches
centred on the influence of societal factors, this area of research is only now evolving.
Sections 5.3.3 and 5.3.4 review in detail the findings related to coping, including social
networks, and disposition (the rationale for including these measures of psychosocial
functioning is outlined in Sections 1.4 and 5.4). In brief, a limited number of studies
have investigated how coping relates to SPA, and out of these, only two (e.g. Robertson
& Kenny, 2016a; Villiers-Tuthill et al., 2016) measured ageing experiences with the
APQ. The findings from these investigations are suggestive of complex relationships
between different types of coping and the dimensions of control over ageing
experiences. To the best of our knowledge, no studies have investigated the personality-
SPA association within the CSM framework for ageing. Of the studies which have used
other measures of SPA, conscientiousness and optimism have been associated with
more positive SPA (e.g. Knoll et al., 2004; Shenkin et al., 2014; Teuscher, 2009), while
neuroticism has been linked to more negative SPA (e.g. Canada et al., 2013; Jang et al.,
2004; Shenkin et al., 2014). These relationships, however, appear quite sensitive to
various methodological and contextual factors as differential patterns have also been
reported (e.g. Bryant et al., 2014; Stephan, Demulier, et al., 2012).
10.2 Hypotheses
The following hypotheses were made by drawing on both the limited empirical
evidence reviewed within Sections 5.2, 5.3.3 and 5.3.4, and on the theory underpinning
the CSM framework for ageing (refer to Chapter 3). Specifically:
1. Psychological distress and negative affect will be positively associated with the
timeline-chronic, consequences-negative, and emotional representations
dimensions while being negatively associated with the consequences-positive
and control dimensions.
Page 189
171
2. Life satisfaction, positive affect, and quality of life will be positively associated
with the consequences-positive and control dimensions, while being negatively
associated with the timeline-chronic, consequences-negative, and emotional
representations dimensions.
3. Engagement coping (i.e. primary control and secondary control) and stronger,
more personally satisfying social networks (i.e. social interaction and
satisfaction with social support) will be positively associated with more
favourable perceptions of ageing (i.e. consequences-positive and control
dimensions) while being negatively associated with less favourable perceptions
of ageing (i.e. timeline-chronic, consequences-negative, and emotional
representations. The converse pattern of relationships will be found for
disengagement coping and the SPA dimensions.
4. Conscientiousness and generalised optimism will be positively associated with
more favourable perceptions of ageing (i.e. consequences-positive and control
dimensions) while being negatively associated with less favourable perceptions
of ageing (i.e. timeline-chronic, consequences-negative, and emotional
representations. The converse pattern of relationships will be found for
neuroticism and the SPA dimensions.
5. Differences in the pattern of correlations between the SPA and mental health
variables will be found for the chronological age and self-rated health groups.
6. Differences in the pattern of correlations between the SPA and psychosocial
variables will be found for the chronological age and self-rated health groups.
10.3 Method
To test the hypotheses outlined in Section 10.2, the Time 1 data for chronological
age, self-rated health, and six subscales (timeline-chronic, consequences-positive,
consequences-negative, control-positive, control-negative, emotional representations) of
the APQ (Barker et al., 2007) that was employed in Chapter 9 was utilised. Table 2 (in
Chapter 7) and Table 6 (in Chapter 9) provide the descriptive statistics for these
variables. In addition, Time 1 measures which captured aspects of mental health and
psychosocial functioning was analysed (see Appendix B for all measure items).
In brief, the mental health variables of interest included psychological distress and
subjective wellbeing (see Sections 2.2.3 and 4.3 for definition of mental health in
Page 190
172
current thesis and application of these measures in older populations). As described
fully in Chapter 7, scores from the DASS21 (Lovibond & Lovibond, 1995) were
summed across the three subscales to provide a composite psychological distress score.
Two distinct conceptual approaches to subjective wellbeing were assessed. The SWLS
(Diener et al., 1985) and the PANAS (Watson et al., 1988) were used to assess hedonic
subjective wellbeing. The SWLS which is a measure of life satisfaction that captures
the cognitive component of hedonic wellbeing while the two PANAS subscales measure
the affective components, namely positive affect and negative affect. The CASP-12
(Wiggins et al., 2008), a quality of life measure specifically developed for use in older
populations, captures markers of eudaimonic subjective wellbeing. A composite score
was derived for quality of life by summing the three subscales of the CASP-12.
The psychosocial variables of interest included coping, social networks, and
dispositional traits. Social networks are conceptualised as a coping resource within this
study (see Section 4.2 for how each of these variables are conceptualised within this
thesis). As outlined in Chapter 7, four measures were used to assess psychosocial
functioning. The BriefCOPE Inventory (Carver, 1997) captured ways of coping along
14 scales, from which three coping categories were defined according to orientation and
action type. These comprised primary control engagement coping, secondary control
engagement coping, and disengagement coping. The abbreviated version of the DSSI
(Koenig et al., 1993) was employed to assess the structural (i.e. social interaction) and
functional (i.e. social support satisfaction) characteristics of social networks. The
dispositional traits of neuroticism and conscientiousness were assessed with two scales
derived from the IPIP (Goldberg, 1992) while generalised optimism was assessed with
the LOT-R (Scheier et al., 1994). The psychometric properties of each of these
measures are described in Chapter 7, along with participant information and research
procedure.
A cross-sectional analysis of the data was conducted. Pearson’s correlation
coefficients were calculated to explore the strength of the relationships for SPA with the
mental health and psychosocial variables for the entire sample. Further, as both the
PANAS-NA and DASS-21 are measures of distress, partial correlations coefficients
were calculated to assess the size of the unique portion of variance that each contributed
to the relationships with the APQ subscales. To limit Type I error rates, α levels were
adjusted to the more stringent rejection criterion of .001 (Gravetter & Wallnau, 2013)
Page 191
173
for all multiple correlation coefficients. Correlation coefficients around 0.1, 0.3, and 0.5
represent weak, moderate, and strong associations, respectively (J. Cohen, 1998).
Finally, the pattern of these relationships was explored across chronological age and
self-rated health groups.
10.4 Results
Table 7 and Table 9 provide the descriptive statistics for the mental health and
psychosocial variables. On average, higher scores were found for measures of life
satisfaction, positive affect and quality of life, while lower scores were found for both
negative affect and psychological distress. Mean scores for coping indicated
substantially greater use of primary control engagement coping and secondary control
engagement coping strategies compared to disengagement coping strategies. To
illustrate, over 71% of participants were more likely than not to engage in primary
control engagement coping strategies, while 51% were more likely than not to utilise
secondary control engagement coping strategies. Only 2.5% of participants reported
utilising disengagement coping strategies regularly. On average, participants were
satisfied with their social networks. Finally, a large proportion of the sample was higher
in conscientiousness and generalised optimism compared to the dispositional trait of
neuroticism.
10.4.1 Relationships between SPA and mental health
Correlation coefficients for the APQ subscales with the mental health variables
are presented in Table 7. With the exception of the consequences-positive subscale,
which was unrelated to life satisfaction, negative affect, and psychological distress, the
associations between the APQ subscales and each of the five measures of mental health
were significant. Further, the direction of these relationships was as expected. That is,
both of the control subscales of the APQ were positively related to life satisfaction,
positive affect, and quality of life, while being negatively associated with the timeline-
chronic, consequences-negative, and emotional representations subscales.
Consequences-positive was also positively related to life satisfaction and positive affect
although was unrelated to either measure of distress at the significance level of .001.
Conversely, negative affect and psychological distress were positively associated with
the timeline-chronic, consequences-negative and emotional representations subscales
Page 192
174
while being negatively related to the control subscales. However, only consequences-
negative and emotional representations demonstrated moderate effect sizes (r ≥ .30)
across all of the mental health variables. The strongest effect size was found for the
emotional representations subscale. As negative emotional responses generated in
response to ageing increased, quality of life decreased (r = -.54, p = <.001). Positive
affect was the only mental health variable which exhibited a moderate association with
all of the APQ subscales (between .33 and .44).
Table 7
Zero-order correlations between the APQ subscales and mental health variables
Variable N M SD TCR PCSQ NCSQ PCON NCON ER
LS 363 25.46 6.35 -.29*** .16 -.33*** .33*** .24*** -.44***
PA 365 3.59 0.70 -.33*** .37*** -.42*** .43*** .33*** -.44***
NA 365 1.52 0.54 .33*** -.08 .31*** -.16*** -.24*** .45***
QoL 365 38.49 6.53 -.41*** .21*** -.48*** .43*** .39*** -.54***
PD 360 55.17 12.73 .28*** -.14 .40*** -.33*** -.25*** .48***
Note. TCR = timeline-chronic; PCSQ = consequences-positive; NCSQ = consequences-negative; PCON
= control-positive; NCON = control-negative; ER = emotional representations; LS = life satisfaction; PA
= positive affect; QoL = quality of life; PD = psychological distress.
***p ≤ .001.
Partial correlation coefficients were computed for the APQ dimensions and
negative affect, after controlling for the psychological distress scores. As shown in
Table 8, all of the six relationships between negative affect and the APQ dimensions
were non-significant. By contrast, when the influence of negative affect was removed,
three of the five relationships between psychological distress and the APQ dimensions
which had been significant in the bivariate correlation analysis retained significance (at
the .001 significance level). While the effect sizes for each of these relationships
decreased (compared to the bivariate correlation coefficients), the correlation
coefficients for psychological distress with the control-positive and emotional
representations dimensions were still moderate while the psychological distress and
Page 193
175
consequences-negative relationship was approaching .30. As a consequence, the
PANAS-NA scale was excluded from further analyses.
Table 8
Partial correlations for the APQ subscales with PANAS-NA and DASS-Total
Variable N TCR PCSQ NCSQ PCON NCON ER
Negative affecta
365 .16 .02 .04 .08 -.04 .12
Psychological
distressb 360 .12 -.12 .29*** -.31*** -.17 .33***
Note. TCR = timeline-chronic; PCSQ = consequences-positive; NCSQ = consequences-negative; PCON
= control-positive; NCON = control-negative; ER = emotional representations.
a Controlling for psychological distress;
b Controlling for negative affect.
***p ≤ .001.
10.4.2 Relationships between SPA and coping
For the five coping variables, the direction of the relationships conformed to
expectations. With the exception of disengagement coping, measures of coping were
positively associated with the consequences-positive and control subscales while being
negatively associated with the timeline-chronic, consequences-negative, and emotional
representations subscales. The opposite directions were found for the disengagement
coping-APQ associations. Table 9 provides correlation coefficients for the APQ
subscales with measures of psychosocial functioning.
Page 194
176
Table 9
Zero-order correlations between the APQ subscales and psychosocial variables
Variable N M SD TCR PCSQ NCSQ PCON NCON ER
PCEC 368 23.07 4.80 -.15 .24*** -.19*** .34*** .23*** -.29***
SCEC 367 25.55 4.84 -.08 .24*** -.10 .20*** .08 -.16
DC 367 16.11 3.62 .29*** -.18*** .22*** -.09 -.19*** .32***
SI 361 9.00 1.65 -.25*** .09 -.26*** .19*** .17*** -.28***
SSS 367 18.44 2.89 -.26*** .21*** -.34*** .27*** .27*** -.36***
CON 365 37.73 6.51 -.35*** .17*** -.38*** .32*** .25*** -.40***
NEU 365 22.35 7.43 .36*** -.22*** .37*** -.32*** -.23*** .63***
OPT 367 22.67 4.90 -.43*** .17*** -.43*** .42*** .38*** -.50***
Note. TCR = timeline-chronic; PCSQ = consequences-positive; NCSQ = consequences-negative; PCON
= control-positive; NCON = control-negative; ER = emotional representations; PCEC = primary control
engagement coping; SCEC = secondary control engagement coping; DC = disengagement coping; SI =
social interaction; SSS = satisfaction with social support; CON = conscientiousness; NEU = neuroticism;
OPT = generalised optimism.
***p ≤ .001.
Satisfaction with social support was related to all six subscales of the APQ while
primary control engagement coping was related to five of the six dimensions (the one
exception being for the timeline-chronic dimension). For primary control engagement
coping, the only moderate effect size was found with the control-positive subscale
however the correlation coefficient for emotional representations (r = -.29, p = <.001)
was approaching the same magnitude. Satisfaction with social support was moderately
associated with both the consequences-negative and emotional representations
subscales. Weaker association were found for the other dimensions yet the magnitude of
the control subscales with satisfaction with social support was also approaching
moderate levels (r = -.27, p = <.001, for both positive and negative control dimensions).
Secondary control engagement coping was weakly related to two of the six APQ
Page 195
177
subscales, and was the only coping scale which was unrelated to the consequences-
negative, control-negative, and emotional representations dimensions. The social
interaction subscale was associated with five of the six APQ subscales however
magnitudes for all of the correlation coefficients were weak.
10.4.3 Relationships between SPA and dispositional traits
As demonstrated in Table 9, all three measures of disposition were related to all
the APQ subscales. Conscientiousness and generalised optimism were positively related
to the consequences-positive and control dimensions while being negatively related to
the timeline-chronic, consequences-negative, and emotional representations dimensions.
The reverse pattern of relationships was found for the neuroticism and APQ subscales.
With a few exceptions, the magnitude of the relationships between the APQ subscales
and dispositional trait scales was generally moderate to large. However, the
consequences-positive subscale was only weakly associated with all three dispositional
traits, while control-negative was weakly associated with conscientiousness and
neuroticism (while being moderately associated with generalised optimism). The
coefficients for the emotional representation subscale with both neuroticism and
optimism demonstrated the strongest magnitudes (r = .63, p = <.001, r = -.50, p =
<.001, respectively).
10.4.4 Pattern of correlations across self-rated health and chronological age
groups
Correlations for the APQ subscales with the mental health and psychosocial
variables by self-rated health and chronological age is represented visually in heat maps
(see Figure 2). Only those mental health or psychosocial variables with moderate to
strong associations (≥ .30) with at least one of the APQ dimensions was retained.
Neither secondary control engagement coping nor social interactions reached this
magnitude threshold and were thus excluded from all further analyses.
As shown in Figure 2a, some differences in the pattern of correlations for SPA-
mental health were found between the self-rated health groups however there was no
consistency in where these differences emerged. Likewise, the pattern of correlations
for SPA and the psychosocial variables (see Figure 2b) generally demonstrated some
minor but inconsistent differences across the self-rated health groups. There were,
Page 196
178
however, a number of spuriously-large correlation coefficients (ranging from .67 to .93)
for the group that rated their health poorly, indicating that the data is unreliable.
Specifically, the sample size for the group that rated their health as poor was extremely
small (n = 9: see Table 6 for sample size of each group) which increases the likelihood
of obtaining spuriously-large, unstable correlation coefficients. Correlation coefficients
for sample sizes under 100 are less trustworthy (Hole, 2015) and therefore combining
the group that rated their health as poor with the group that rated their health as fair (n =
36) was unlikely to produce more reliable results and thus was not performed. The
group that rated their health as excellent was also small (n = 56). The likely influence of
sample size suggests that the current findings relating to self-rated health need to be
treated circumspectly.
Across the three age cohorts (see Table 6 for sample sizes), there was some
variability in the patterns of correlations between SPA and mental health (refer to
Figure 2c for visual representation) however these differences were minor. Further,
there were no clear linear patterns for the effect sizes across the age groups. For the
relationships between SPA with positive affect and quality of life, the direction and
strength of the correlation coefficients were very similar across the three age cohorts.
Significant and moderate correlation coefficients were found for the timeline-LS
relationships in the two younger age cohorts where no significant relationship was
detected for the oldest cohort. For life satisfaction, there were also significant
relationships with the consequences-negative, consequences-positive, and control-
negative dimensions for the two youngest groups which were not found for the oldest
group, although the effect sizes for the consequences-positive dimension in particular
were small. The smaller sample size of the oldest age group (n = 82) may have
influenced some of these findings however overall, any differences in the patterns of
correlations were minimal. Likewise, any differences in how the relationships between
the APQ and psychosocial scales (see Figure 2d) behaved across the three age cohorts
were small and inconsistent.
Page 198
180
Figure 2. Visual representation of the zero-order correlations for the APQ subscales with (A) the mental health variables and (B) the
psychosocial variables by self-rated health groups, and with (C) the mental health variables and (D) the psychosocial variables (D) by age
groups.
Note. TCR = timeline-chronic; PCSQ = consequences-positive; NCSQ = consequences-negative; PCON = control-positive; NCON = control-negative; ER = emotional
representations; LS = life satisfaction; PA = positive affect; QoL = quality of life; PD = psychological distress; PCEC = primary control engagement coping; DC =
disengagement coping; SSS = satisfaction with social support; NEU = neuroticism; CON = conscientiousness; OPT = generalised optimism. Excellent (n = 56); Very
Good (n = 154); Good (n = 111); Fair (n = 36); Poor (n = 9); 55-64 (n = 133); 65-74 (n = 153); 75+ (n = 82).
Page 199
181
10.5 Discussion
The aim of the current study was to establish how mental health and psychosocial
functioning is associated with SPA in this cohort of older, Australian adults. This is the
first Australian study to assess these relationships within the CSM framework for
ageing and contributes to the currently limited body of work regarding mental health
and SPA more generally. The findings for both subjective wellbeing and psychological
distress were largely consistent with the existing empirical literature although there
were some notable differences with the two other studies that had utilised the same
measure of SPA as the current study. Each of the coping and dispositional trait variables
was also associated with some aspect of SPA yet a number of these relationships,
particularly for the coping variables, were weaker than anticipated.
As expected, higher psychological distress and negative affect was positively
associated with a more chronic awareness of ageing, the perception that ageing is
associated with more negative consequences, and increased negative emotional
responses generated to the ageing process. Both measures of distress were also
negatively related to the perception of control over one’s ageing experiences. Further,
many of these associations demonstrated moderate effect sizes. No relationship was
found, however, between either measure of distress and the consequences-positive
dimension. The only other study (i.e. Barker et al., 2007) to have examined how these
dimensions of SPA relate to distress did report that lower depression scores were
associated with an increased perception of positive ageing consequences. While Barker
and colleagues (2007) adopted a different measure to determine levels of depression, it
was a comparable scale to the one used in the current study and thus is unlikely to
account for the divergent finding. It is possible, however, that the larger sample size in
the Barker et al. study (N = 2033) increased statistical power and was therefore able to
detect statistically significant results that went undetected in the current study.
Perceptions that ageing is associated with positive consequences were positively
related to positive affect and quality of life however only the former demonstrated a
moderate relationship. The magnitude of the relationship for consequences-positive
with quality of life was small which suggests that, for this group of older adults, other
factors are contributing to these measures of wellbeing. The lower effect size for the
Page 200
182
quality of life measure in particular was a little surprising given that the CASP (Wiggins
et al., 2008) is a measure of eudaimonic wellbeing and much like the consequences-
positive subscale of the APQ, captures aspects of self-development. However, unlike
other conceptualisations of eudiamonic wellbeing (e.g. Ryan & Deci, 2001; Ryff &
Keyes, 1995) found within the literature, the approach underpinning the CASP also
incorporates an aspect of hedonic wellbeing, namely pleasure (Vanhoutte, 2012).
Indeed, the CASP and the SWLS (Diener et al., 1985) are highly correlated instruments
(Sim, Bartlam, & Bernard, 2011; Vanhoutte, 2012). While these variations between the
consequences-positive dimension and the two measures of subjective wellbeing appear
minor, they do highlight how the various dimensions of SPA differentially relate to
distinct aspects (i.e. affective and eudaimonic) of wellbeing, as reported elsewhere (e.g.
Hickey et al., 2010; Steverink et al., 2001; Westerhof & Barrett, 2005).
Positive affect was the only mental health variable to have moderate relationships
with all of the SPA dimensions which might indicate that pleasure or happiness is
associated with ageing experiences more broadly whereas distress is more specific to
certain perceptions of ageing. Nonetheless, with the exception of the consequences-
positive dimension, quality of life was also moderately related to each of the SPA
dimensions. Indeed, these relationships were stronger than any of the others found in the
current study, particularly for the emotional representations and consequences-negative
dimensions. Interestingly, Hickey and colleagues (2010) reported no association
between quality of life and attributing negative consequences to ageing which contrasts
sharply with the negative relationship in the current study (which was approaching a
strong magnitude). One explanation for this may lie in the different quality of life
measures employed. In contrast to the current study survey measure, Hickey et al.
adopted an individualised approach, asking participants to nominated life areas that they
identified as influencing their quality of life and then rating their current status in each
area. Other factors, such as culture, may also account for this difference, underscoring
the need for further research in this area.
Another difference which emerged between the current study and others which
have utilised the APQ as a measure of SPA were on the control-negative dimension.
Specifically, perceptions of control over negative aspects of ageing (e.g. issues related
to mobility or social functioning) were negatively related to psychological distress while
being positively related to quality of life in this group of older Australian adults. By
Page 201
183
contrast, neither Barker et al. (2007) nor Hickey et al. (2010) found these associations in
their Irish samples. As highlighted in Chapters 8 and 9, the current study participants
are a fairly independent, well-resourced group of individuals, the largest proportion of
who perceive control over both negative and positive aspects of ageing. It is therefore
unsurprising that any perceived losses to control would relate to mental health
functioning. However, it is feasible that cultural or methodological factors (e.g. different
measures of distress and wellbeing) played some role in these divergent results. As
discussed in Section 5.2.4, if negative aspects of ageing are viewed as outside of one’s
control, it is possible that no attempts are made to manage such factors. One the one
hand, acceptance of negative aspects of ageing could be viewed as an adaptive response
because resources are not exhausted when there is a possibility of failure and as such,
mental health is preserved. One the other hand, such acceptance could also be
potentially maladaptive if manageable declines are not addressed and result in further
health complications or social isolation, in turn negatively impacting on mental health.
A longitudinal research design would be required to explore how such relationships
operate to influence health over time.
The consequences-negative and emotional representations dimensions
demonstrated moderate relationships with all of the mental health variables, consistent
with a number of other studies (e.g. Barker et al., 2007; Craciun, 2011; Hickey et al.,
2010; Kavirajan et al., 2011; Steverink et al., 2001). Control over positive ageing
experiences was also moderately related to distress and subjective wellbeing, the one
exception being for negative affect, which showed only a weak association. For the
most part, negative affect (PANAS-NA) demonstrated slightly weaker relationships
with the SPA dimensions than psychological distress (DASS-total). Partial correlation
analyses determined that all of the associations between negative affect and SPA
disappeared when controlling for psychological distress, which was not the case for the
latter when controlling for negative affect. Based on these findings, it was determined
that negative affect would be excluded from all further analyses.
Overall, this group of older Australian adults were much more likely to utilise
coping strategies which oriented them toward the stressor, whether actively attempting
to manage the problems in their environments or altering aspects of themselves to fit
with the circumstances. This is suggestive of a degree of psychological flexibility,
which some argue is a “key ingredient to psychological health” (Kashdan & Rottenberg,
Page 202
184
2010, p. 866). Generally, participants indicated higher use of primary control over
secondary control strategies, while only a very small percentage identified regular use
of avoidance or disengagement type coping strategies, which are often considered
maladaptive forms of coping (Carver & Connor-Smith, 2010) (distinctions between
coping strategies are discussed at length in Section 4.2.1).
As this was a cross-sectional study, it was not possible to assess the stability of
these different types of coping. However, in one review (Heckhausen et al., 2010)
secondary control coping was reported to increase as people aged. Further, because
many older people might not recognise declines in control until very old age, it is
possible that perceptions of more primary control actually reflects the very effective use
of secondary control, which fosters primary control (Heckhausen & Schulz, 1995). One
of the drawbacks of this study, however, is that coping mechanisms were not explored
qualitatively. This could have provided a more detailed picture of the coping styles,
particularly as the mean age of this cohort (68 years) may have influenced how stressors
were appraised in the first instance. Finally, the majority of participants reported
generally satisfying social networks, both in terms of how socially integrated they felt
and also their perceptions of satisfaction with social support. These social connections
and peer support are likely to normalise potential age-related problems and may also
serve as a problem-solving resource.
Despite there being very little empirical evidence to draw upon regarding coping
and SPA in older adults, and even less so for SPA as measured with the APQ, the
direction of the relationships found in the current study were largely consistent with the
limited findings reported within the literature. In general, engagement coping strategies
which reflect the self-regulatory processes of selection and compensation were
positively associated with more favourable SPA while being negatively related to less
favourable SPA. This pattern of relationships was also reported by Keller, Leventhal,
Prohaska, et al. (1989) and Wurm et al. (2013), albeit with different measures to those
used in the current study. Further, much like the finding by Boehmer (2007) that older
subjective age was associated with the increased use of avoidance-oriented coping
strategies, disengagement coping was related to a more chronic awareness of ageing in
the current study. While Boehmer’s (2007) investigation focussed on cancer patients
spanning the adult lifespan and did not explore age group differences, accelerated
ageing has been reported in younger patient groups (e.g. Bode et al., 2012). The similar
Page 203
185
findings between the current study and those reported for the cancer patients of all age
groups lends further weight to the position (e.g. Trouillet et al., 2009) that appraisals of
situational or contextual factors has a greater influence on choice of coping strategies
than chronological age per se.
To the best of our knowledge, only two other studies have investigated how
coping relates to the SPA dimensions as measured with the APQ (as discussed in
Section 5.3.3). Villiers-Tuthill and colleagues (2016) examined a type of disengagement
coping, namely, substance use (i.e. nicotine and alcohol) and reported that increased
usage of such coping mechanisms were associated with stronger negative emotions
generated to ageing and a more chronic awareness of ageing. However, they also
reported that these behaviours were related to a greater sense of control over the ageing
process. The authors surmised that the positive association between the control
dimensions and substance use may reflect a bias to evaluate the risks optimistically in
the belief that future ageing could nonetheless be controlled. By contrast,
disengagement coping in the current study, while also being positively related to the
timeline-chronic and emotional representations dimensions, was negatively associated
with the control-negative dimension while being unrelated to control over positive
experiences of ageing. This is yet another indication that the current study participants
are a fairly well-functioning group of older adults.
The discrepancy between the current findings and those reported by Villiers-
Tuthill et al. (2016) might be explained by a number of factors, including socio-cultural
influences. Australia has been at the forefront of anti-tobacco campaigns globally, with
national campaigns warning about the harms of smoking as early as the 1970’s. Older
Australian adults have been exposed to these messages over many decades which are
now reflected in the lower prevalence of tobacco use by middle-aged and older adults
nationally (Scollo & Winstanley, 2017). While messages regarding the dangers of
excessive alcohol use have been slower to filter through to the general public, with
around 16% of older Australians still drinking above the recommended guidelines
(AIHW, 2017), there is a growing awareness that such substances can be detrimental to
healthy ageing. Indeed, while substance use was clustered with several other strategies
into the one disengagement coping category in the current study, the majority of
participants (76%) reported minimal use of alcohol and tobacco and were instead more
prone to venting or self-blame as a means of disengagement. As discussed in Chapter 4,
Page 204
186
while all of these coping strategies may serve a similar function (i.e. avoidance or
disengagement from the stressor), they nonetheless have unique associations to health.
Thus, the ways in which the coping strategies were categorised is also likely to have
influenced the different findings between the two studies.
While the direction of the relationships found for coping with SPA in the current
study were as hypothesised, the small magnitude for many of the observed associations
were nonetheless unexpected. Across the five coping variables, only four relationships
were of a moderate strength (although there were a number that were approaching this
magnitude). In their longitudinal analysis of social engagement and SPA, Robertson and
Kenny (2016a) suggested that perceptions of control over the negative and positive
aspects of ageing played an important role in older adults’ levels of social engagement,
for instance, involvement in community and leisure pursuits (i.e. similar to the construct
of social integration in the current study). These social behaviours were assessed twice
over a two year period and it was found that disengagement at follow-up was associated
with less control over ageing. While the current study was cross-sectional and therefore
did not examine change, the positive associations between social integration and the two
control dimensions were quite small among this group of older adults. Indeed, all of the
associations for social integration and secondary control coping with the SPA
dimensions were weak (and only two significant relationships were detected for
secondary control coping) which suggests that these relationships may not be especially
important or even clinically relevant for this cohort of older adults. Given these findings
and the large number of variables already under investigation in the current study, the
decision was made to remove these two coping variables from further analyses (in
Chapter 11).
In contrast to the findings for the coping variables, each of the dispositional traits
assessed had, by and large, moderate to strong associations with the various dimensions
of SPA. The few exceptions to this were on the consequences-positive and control-
negative dimensions which demonstrated slightly smaller effect sizes. As hypothesised,
both conscientiousness and generalised optimism were positively associated with
perceptions that older age is a time of personal development and that it is possible to
have control over both the negative and positive aspects of ageing. These dispositional
traits were also negatively associated with being chronically aware of ageing, perceiving
more negative consequences with ageing and generating more negative emotions to
Page 205
187
ageing. As reviewed in Section 5.3.4, while these relationships have not been tested
elsewhere with the APQ, related SPA constructs have been assessed and many of the
findings reported (e.g. Knoll et al., 2004; Shenkin et al., 2014; Teuscher, 2009; Wurm &
Benyamini, 2014) are consistent with those found in the current study. That is, higher
levels of conscientiousness and optimism are associated with less negative evaluations
of ageing experiences (e.g. lower subjective age, psychosocial growth).
Yet not all researchers have found these associations. Conscientiousness, in
particular, has been shown to have quite an interesting relationship to the various
dimensions of SPA. For instance, Stephan, Demulier, et al. (2012) reported that it was
unrelated to subjective age (i.e. feeling older or younger than one’s chronological age)
in French older adults while in an Australian study (i.e. Bryant et al., 2014),
conscientiousness was negatively associated with psychological growth. While it is
likely that some of the differences observed across studies reflect measurement and
other contextual or cultural variations, it is also probable that the various ways in which
dispositional traits manifest themselves might explain some of the inconsistencies
within the literature. For instance, a positive relationship with psychosocial growth
might reflect facets of conscientiousness like forethought or planning, to help the
individual adapt to evolving age-related factors in a personally meaningful way that
promotes development. Equally, the tendency to subscribe to social norms and rules,
another facet of conscientiousness, might result in individuals viewing ageing as a time
of decline and loss (i.e. subscribing to socially-pervasive, negative age stereotypes).
Given the findings in the current study, it is possible that the more conscientious
individuals are less rigid or inflexible in regards to the application of socially prescribed
norms and are able to adapt more readily to their ageing-related experiences. It is also
possible that the different ways in which neuroticism manifests itself might also account
for some of the discrepancies that have been reported across studies for the neuroticism-
SPA relationship. In general, however, higher levels of neuroticism have been linked to
less favourable perceptions of ageing (e.g. Canada et al., 2013; Jang et al., 2004; Kotter-
Grühn et al., 2009; Shenkin et al., 2014). This was also the case in the current study
along the APQ dimensions of SPA. Indeed, the strongest relationship for any of the
dispositional traits was found for neuroticism. Specifically, higher levels of neuroticism
were related (not surprisingly) to higher levels of negative emotions generated to
ageing.
Page 206
188
Finally, the pattern of correlations observed for SPA with both the mental health
and psychosocial variables were not markedly different among the age or self-rated
health groups. While there was some variability across the groups, these were fairly
minor and inconsistent. Further, for self-rated health in particular, the findings were
questionable given the smaller sample sizes of subgroups. Individual differences such as
self-rated health have been identified as having meaningful effects on SPA (as reported
in the literature and also identified in Chapter 9). However, based on the current sample
size and characteristics, sociodemographic and subjective health factors will not be
examined further within this thesis.
As with the findings reported in Chapter 8 and 9, the sampling method used in the
current study precludes any generalisation of the findings to the older Australian
population. Nonetheless, they do provide a snapshot of how the mental and
psychosocial functioning in this group of older Australians relates to ageing
experiences. While longitudinal research would provide a much more meaningful
picture as to how these relationships operate together over time to influence outcomes,
this is the first Australian study to have examined such relationships within the CSM
framework. As such, this study provides some important preliminary evidence which
contributes to the currently limited research regarding mental health and SPA more
generally. An important limitation of this study more broadly goes to the way in which
data was collected. As outlined in Section 7.6, there are a number of methodological
challenges which are unique to ageing research (Hardy et al., 2009; Quinn, 2010) and
which may have played out in this study. For instance, it is possible that embarrassment
or privacy concerns influenced how some of the participants responded on the mental
health questionnaires, particularly for those in the older age groups whose perceptions
of mental health may have been influenced by negative social messages over many
decades. It is also possible that cohort effects played out in how stressors were
appraised and coping utilised. Future research in this area might therefore benefit by
incorporating more qualitative measures of mental health and coping to navigate some
of the issues around data sensitivity and to tease apart individual interpretations of
coping.
Page 207
189
10.6 Conclusion
Overall, this cohort of older, community-dwelling Australian adults appears to be
well-functioning, certainly in regards to their mental and social health. Despite over 68
percent reporting at least two or more diagnosed medical chronic conditions (see
Chapter 9 for summary of this data), the majority also reported low levels of
psychological distress and high levels of subjective wellbeing. Thus, in spite of age-
related declines in physical functioning, subjective ageing experiences and mental
health appear relatively unaffected, which may be indicative of adaptive processes at
play. While the current study findings suggest a meaningful relationship between SPA
and mental health, it is improbable that other mechanisms would not be influencing
these associations, whether by intervening in the pathway or by buffering the
associations. The theoretical model driving this thesis has provided the rationale for
examining coping as one mechanism which may indirectly influence these associations
(in Chapter 11) and personality as another variable which may moderate the SPA-
mental health relationship (in Chapter 12).
Many of the relationships between indicators of coping and SPA were much
weaker than anticipated, in contrast to the more stable personality variables, which
demonstrated much stronger relationships to personal ageing experiences.
Consequently, it was decided that a number of the coping variables should be excluded
from further assessment (i.e. those that did not have at least one relationship to an SPA
dimension that was of a moderate effect size). Despite the size of the remaining coping-
SPA relationships, however, it is still possible that these variables indirectly influence
the relationships found between SPA and mental health. Indeed, as outlined at length in
Chapter 11, it is still possible for a variable to indirectly effect the relationship between
X and Y, without a statistically significant relationship between the independent variable
(SPA) and mediating variable (coping). As such, primary control engagement coping,
disengagement coping, and satisfaction with social support will be examined as possible
mediating variables in Chapter 11.
Page 208
190
Chapter 11
An investigation of SPA and mental health in
older Australian adults cross-sectionally and
across time: The indirect effects of coping
Page 209
191
11.1 Introduction
The overarching aim of this thesis, as outlined in Section 1.4, is to better
understand how psychosocial mechanisms operate to influence the SPA-mental health
relationship in older Australian adults. The findings from Chapters 8 and 10 have
illustrated that, taken as a whole, the current study participants perceive their ageing
quite favourably and also experience relatively good mental health, as indicated by
higher scores on the subjective wellbeing measures and lower scores for psychological
distress. While poor health undoubtedly influences how one perceives their own ageing,
the theoretical contention (e.g. Levy, Slade, & Kasl, 2002; Levy, Slade, Kunkel, et al.,
2002) that it is SPA that actually drives health changes rather than vice versa has been
bolstered by several empirical investigations (e.g. Sargent-Cox et al., 2012b, Wurm et
al., 2007) over the past decade. Thus, favourable ageing experiences in the current
group of older Australians are likely to be contributing to their experiencing higher
levels of mental health. However, while establishing this relationship between SPA and
mental health is important for helping researchers to make predictions, it does not help
to explain the relationships and therefore increase our knowledge in a practical or
meaningful way. One means of understanding these relationships better is to investigate
the potential underlying mechanisms (G. W. Cheung & Lau, 2008).
To date, there have been very few investigations around the role that psychosocial
mechanisms may play. Coping, in particular, has received very little attention from
researchers, despite coping abilities reflecting broader self-regulatory processes and
being generally considered a cornerstone of successful ageing (Compas et al., 2001;
Trouillet et al., 2009). As outlined in Chapter 3, the theoretical model adopted to
investigate SPA (i.e. the CSM: H. Leventhal et al., 2008) within the current study was
originally applied to the fields of health and illness. A core assumption of the CSM is
that coping mediates the relationship between illness perceptions and adjustment to
illness. While ageing is a normal developmental process that is anticipated, unlike
health threats or illness, the process nevertheless entails change and challenges which
individuals must adapt to if they are to age well (Schulz & Heckhausen, 1996). It is
therefore possible that SPA influences mental health indirectly through coping
mechanisms.
Page 210
192
Empirical support for the explicit claim about a causal chain of events between
illness perceptions, coping, and adjustment has not been overwhelming. Indeed, as
discussed in Section 3.4.2, only a small number of cross-sectional studies have reported
mediation effects and researchers have conceded that much more work is required in the
area to establish whether these effects are stable across time. To the best of our
knowledge, only one study (i.e. Wurm et al., 2013) has explored the role that coping
mechanisms play in the SPA-mental health relationship. As reviewed in Chapter 5,
Wurm and colleagues reported that people who experienced a serious health event were
more likely to increase their use of selection, optimization, and compensation (SOC)
strategies for leading a healthy lifestyle compared to those who had not experienced
such events which in turn influenced life satisfaction. While negative SPA (as measured
with the one dimension of physical losses) was especially detrimental when people had
experienced a serious health event, more negative SPA were nonetheless associated
with decreased use of SOC strategies among all participants. This suggests that while
health threats may activate coping responses more readily because of salience gained
through self-relevance, SPA still guides coping even when the use of such strategies is
not prompted by an immediate threat to the self.
The current study seeks to examine whether other types of coping may influence
the relationship between SPA (as conceptualised within the CSM framework) and
mental health in this group of fairly well-functioning older Australian adults over time.
This study is exploratory because these relationships are not known. That is, the six
subscales of the APQ which were identified as psychometrically sound in Chapter 8 and
that capture multiple dimensions of ageing experiences have not been utilised in
previous research to test how they might influence different measures of mental health
through various coping responses. Because of the number of SPA (six) and mental
health (four) variables, a total of 24 models will be tested. While we are very aware of
the problems associated with conducting multiple tests, we are only interested in
examining patterns in relationships at this early stage of investigation with the intent
that future, confirmatory studies will be guided by the findings. This issue is addressed
further in Section 11.5.
Page 211
193
11.2 Hypotheses
The hypotheses formulated for this two-wave exploratory study are guided by one
other study to have tested the relationship between a single dimension of SPA and life
satisfaction through coping mechanisms (i.e. Wurm et al., 2013) and by the findings
reported in the illness perceptions literature (see Sections 3.4.2 and 5.4.1). Specifically,
Hagger and Orbell’s (2003) meta-analysis reported a common-sense pattern of
relationships between illness perceptions and coping responses, whereby less favourable
illness perceptions were positively related to more avoidant and emotionally expressive
coping strategies, and more favourable illness perceptions were positively related to
more active or problem-focussed strategies. Drawing on this limited evidence, the
following hypotheses were made:
1. Coping mechanisms (i.e. primary control engagement coping, disengagement
coping, and social support satisfaction) will indirectly influence the
relationships between the multiple dimensions of SPA and mental health (i.e.
psychological distress, life satisfaction, positive affect, and quality of life) at
Time 1.
2. The relationships observed in the cross-sectional investigation (Time 1) will
hold when the change-scores (i.e. changes within-subjects) are tested in the
follow-up mediation analyses.
3. There will be a common-sense pattern of relationships between SPA and
coping mechanisms, whereby less favourable ageing experiences (i.e.
timeline-chronic, consequences-negative, and emotional representations) will
be positively related to disengagement coping, and negatively related to
primary control engagement coping and social support satisfaction.
Conversely, more favourable ageing experiences (i.e. consequences-positive
and control) will be positively related to primary control engagement coping
and social support satisfaction, and negatively related to disengagement
coping.
11.3 Method
To address the research questions outlined in Section 11.2, a two-wave study with
a time lag of 12 months was conducted. A full explanation of participant information,
Page 212
194
survey measures, and research procedure are described in Chapter 7. In brief, six
subscales of the APQ were used to assess SPA. Mental health was assessed with four
scales, namely, the SWLS (Diener et al., 1985), the PANAS-PA (Watson et al., 1988),
the CASP-12 (Wiggins et al., 2008), and the DASS21 (Lovibond & Lovibond, 1995).
As described in Chapter 7, the subscales of both the CASP and the DASS were summed
to provide composite scores of quality of life and psychological distress, respectively.
The three measures of coping included primary control engagement coping,
disengagement coping, and satisfaction with social support, and were assessed with the
BriefCOPE Inventory (Carver, 1997) and the DSSI (Koenig et al., 1993). The same
measures used at Time 1 were also used at Time 2 with one exception. At Time 2, the
Social Readjustment Rating Scale (SRRS: Holmes & Rahe, 1967) was also utilised to
assess whether participants had experienced any stressful life events over the preceding
twelve months. This measure was not used as a substitute for any of the Time 1
measures but was an additional measure. As outlined in Section 7.5.11, four stress
categories are derived from the SRRS raw scores: no significant problems, mild stress,
moderate stress, and major stress. Percentages were derived for this categorical data.
11.3.1 Analysis of data
The descriptive statistics (means, standard deviations) and correlation coefficients
for the continuous Time 1 and Time 2 variables are presented in Table 10. The six
dimensions of SPA (timeline-chronic, consequences-positive, consequences-negative,
control-positive, control-negative, emotional representations) were treated as the
independent variables (IVs) while the four measures of mental health (life satisfaction,
positive affect, quality of life, psychological distress) were treated as the dependent
variables (DVs). The three measures of coping (primary control engagement coping,
disengagement coping, and satisfaction with social support) were the mediating
variables (MVs). The hypothesised direction of these relationships was guided by
theory (H. Leventhal et al., 2008; Levy, 2009) and two longitudinal empirical
investigations (i.e. Sargent-Cox et al., 2012b; Wurm et al., 2007) which tested causal
directions using cross-lagged panel analyses (see Section 5.4 for a review of the
theoretical basis and empirical findings).
Correlations among the SPA, coping, and mental health variables within the total
sample were calculated using Pearson’s correlations. To control for Type I error, the
Page 213
195
multiple correlation coefficients were tested at the two-tailed significance level that was
less than or equal to .001 (Gravetter & Wallnau, 2013). For the Time 1 (cross-sectional)
data, parallel multiple mediation analyses were conducted to examine the pathways
between the SPA dimensions and mental health through coping mechanisms which
were tested individually and comparatively (i.e. the total and indirect effects). The
conceptual representation of this path model is shown in Figure 3. Personality,
sociodemographic, and subjective health-related characteristics were included as
covariates in the models. As recommended by Hayes (2013), inference for indirect
effects was based on bias-corrected 95% bootstrap confidence intervals (CIs) derived
from 10,000 bootstrap samples. If the CI did not include zero, the indirect effect was
significantly different from zero at p <.05, supporting a claim of mediation (Hayes,
2013, 2016; Zhao, Lynch, & Chen, 2010). A difference in significance of the specific
indirect effects does not provide evidence that the effects are significantly different form
each other. To examine this, pairwise contrasts of all the specific indirect effects in each
model were also calculated. Bias-corrected bootstrap CIs for pairwise comparisons were
generated and those that did not contain zero were evidence for the two specific indirect
effects being statistically different from one and another.
Page 214
196
Figure 3. A conceptual representation of the mediation models predicting mental health,
whereby SPA exerts an influence on mental health functioning indirectly through
coping mechanisms.
The first set of multiple mediation analyses which were conducted in this study
were based on cross-sectional data (Time 1). A central aim of the current study,
however, was to determine if any effects observed at Time 1 would hold over time
(within-subjects). Thus, change scores were calculated using both the Time 1 and Time
2 data to extend on the cross-sectional results by testing whether the significant effects
would replicate longitudinally. There are a number of options (e.g. differences score,
analysis of covariance) available for calculating change in two-wave regression models.
In the current study, residualised change scores (i.e. difference between the observed
score at Time 2 and the predicted score at Time 2) were calculated for the SPA, coping,
and mental health variables. As described by MacKinnon (2008), this method adjusts
for baseline differences and is less problematic for reliability than difference scores. The
residualised change scores were computed by regressing Time 2 scores on Time 1
scores to obtain the predicted Time 2 scores. The Time 2 predicted scores were then
subtracted from the actual Time 2 score to provide the residualised change scores. The
relation between the two measures across time is thus removed (MacKinnon, 2008).
Page 215
197
Prior to conducting any tests of mediation at Time 2, means and standard
deviations were calculated of the change scores and scatterplots of the associations
between change scores for the SPA variables and change scores for the coping variables
were visually inspected to assess the variability in the residualised change scores. Time
1 versus Time 2 correlations were also calculated among the SPA, coping, and mental
health variables using Pearson’s correlations to test the fluidity of the constructs over
time. The residualised change scores were then used to test for mediation in the same
manner that the Time 1 data was analysed. Finally, to examine whether recent stressful
life events were related to any observed changes in SPA, coping, or mental health,
Pearson’s correlations were calculated for the residualised change scores with the four
SRRS categories.
11.3.2 Examination of the indirect effects
The PROCESS macro (model 4) for SPSS (Hayes, 2013) was employed to test for
mediation in the current study. Mediation occurs when an independent variable (X)
affects a dependent variable (Y) through one or more intervening variables, or mediators
(M). A number of terms are used to describe these associations. As illustrated in Figure
4, the total effect (c path) represents the effect of X on Y without controlling for M. In a
simple mediation model, X can be apportioned into its direct effect (c' path) and its
indirect effect on Y through M (path ab). That is, a proportion of the variance explained
by pathway c can be accounted for by the effect of X on M (path a) and the effect of M
on Y partialling out the effect of X (path b). The total effect can therefore be expressed
as c = c' + ab. In a parallel multiple mediation model with j intervening variables, the
indirect effect of X on Y through a particular M is termed the specific indirect effect
while the summed set of specific indirect effects is termed the total indirect effect. That
is, the proportion of the variance explained by the total pathway c can be accounted for
by the effect X on Y through M1 (path a1b1), the effect of X on Y through M2 (path a2b2),
and up to the jth number of mediators in the model. The total indirect effect is expressed
as c - c' (Hayes, 2009; Preacher & Hayes, 2008).
Page 216
198
Figure 4. Path diagrams representing (A) the total effect of X on Y (mediators are
implicitly accounted for within this model), and (B) a parallel multiple mediation model
whereby a proportion of the variance explained by the total path c becomes accounted
for by path X to M1 to Y (ab1), pathway X to M2 to Y (ab2), and up to the jth number of
mediators in the model (pathway X to Mj to Y [abj]) (Hayes, 2013).
11.3.2.1 Inference about the indirect effect
PROCESS (Hayes, 2013) generates estimates of the indirect effects using
bootstrapping, a nonparametric procedure which entails multiple resampling of the data
to build an approximation of the sampling distribution. Various authors (e.g. Hayes,
2009, 2016; Mackinnon, Lockwood, Hoffman, West, & Sheets, 2002; Preacher &
Hayes, 2008; Shrout & Bolger, 2002; Zhao et al., 2010) describe several advantages in
using this approach to test for mediation. In contrast to the Sobel test (1982),
bootstrapping makes no assumptions about the normality of the distribution of the
variables. Further, both the Sobel test and the causal steps approach demonstrate low
power, with the latter also showing below-expected Type I error rates, issues which can
be resolved with resampling methods. Indeed, while the causal steps approach
Page 217
199
advocated by Baron and Kenny (1986) has been (and remains) one of the most widely-
used methods, it is no longer regarded as the optimal test for indirect effects. A key
criticism is that an indirect effect is inferred logically by estimating the individual paths
of the model and assessing whether these meet certain statistical criteria to establish
mediation. Specifically, to establish mediation:
1. X must be significantly related to Y (path c)
2. X must be significantly related to M (path a)
3. M must be significantly related to Y when X is statistically controlled (path b)
4. The effect of X on Y controlling for M (path c') is closer to zero than is X’s
effect without controlling for M (path c).
The causal steps approach holds that if the first three criteria are met, partial
mediation is indicated and if all four criteria are established, M completely mediates the
X-Y relationship. Should any of these steps not be met, further testing for indirect effects
ceases. However, contemporary approaches to mediation are now focussed on the
quantification of the indirect effect of X on Y, that is, whether ab differs from zero. It is
not necessary for the individual paths a and b to be statistically significant, nor even to
establish an association between X and Y as a precondition for examining the indirect
effects (see Hayes, 2009; MacKinnon, Krull, & Lockwood, 2000; Rucker, Preacher,
Tormala, & Petty, 2011; Zhao et al., 2010). While it may still be conceptually useful to
test for the X-Y relationship (Shrout & Bolger, 2002), a “failure to test for indirect
effects in the absence of a total effect can lead [researchers] to miss some potentially
interesting, important, or useful mechanisms by which X exerts some kind of effect on
Y” (Hayes, 2009, p. 415). Hayes (2016) argues convincingly that common-sense
principles of inference support this modern approach to testing for indirect effects. For
instance, empirical claims should be based on the minimum number of inferential tests
required for support and on the quantification of the effect which is most germane to the
claim (i.e. ab, not a and b).
A step-by-step procedure for classifying and interpreting the types of mediation
and non-mediation is provided by Zhao and colleagues (2010). The results in the current
study are interpreted within this framework. In the first instance, the indirect effect (path
ab) is inspected for significance. A significant indirect effect (ideally using the more
powerful bootstrap test) is the only requirement to demonstrate mediation. This
Page 218
200
approach holds that the X-Y test is never relevant to establishing mediation. The second
step determines whether the direct effect of X on Y is significant. By this approach,
Zhao et al. (2010, p. 200) identified three patterns which are consistent with mediation
(i.e. 1 to 3) and two which are consistent with non-mediation (i.e. 4-5):
1. Complementary mediation: the indirect effect and direct effect are both significant
and point in the same direction (overlaps with ‘partial mediation’ term)
2. Competitive mediation: the indirect effect and direct effect are both significant and
point in opposite directions.
3. Indirect-only mediation: the indirect effect is significant but the direct effect is not
(overlaps with ‘full mediation’ term).
4. Direct-only non-mediation: the direct effect is significant but the indirect is not.
5. No-effect non-mediation: neither the direct effect nor indirect effect is significant.
Each of these patterns has implications for theory, which are addressed in the
discussion of the current findings. Further, for multiple mediation analyses such as
those being conducted in the current study, Hayes (2013) describes a number of
paradoxical inconsistencies which may occur, for instance, finding that one or more
specific indirect effects is different from zero when the total indirect effect is not. A
number of scenarios may account for such findings (for a discussion of these, refer to
Hayes, 2013). What is pertinent to the current study is that the total indirect effect has
little theoretical value on its own as different coping mechanisms may act differentially
on relationships between SPA and mental health. Therefore, as suggested by Hayes
(2013), inference and interpretation of the mediation models in the current study are
focussed on the direct and specific indirect effects rather than the total indirect effects.
11.3.2.2 A note on effect size measures for mediation
The quantification of effect size in the context of mediation models is an evolving
area that is still in its infancy (Hayes, 2013, 2016). For a detailed discussion on this
topic, see Preacher and Kelley (2011). Given the complexity of the primary effect of
interest (i.e. the indirect effect, which is the product of two or multiple regression
coefficients), none of the classic effect size measures can be applied (Preacher &
Kelley, 2011). Within the literature, the most popular means of conveying effect size for
mediation has been the use of verbal descriptors such as complete or partial mediation,
Page 219
201
in line with Baron and Kenny’s (1986) causal steps approach. However, it has been
argued that such descriptions have little conceptual value and should be abandoned
altogether. Thus, these terms will not be used when presenting results in the current
study. For a critique of these concepts, see Hayes (2009, 2013), Preacher and Kelley
(2011), and Rucker et al. (2011).
In addition to the unstandardised metrics which are discussed below, PROCESS
(Hayes, 2013) generates a further six measures of effect size. Two of these measures,
namely, the proportion of variance in Y explained by the indirect effect (R2med:
Fairchild, MacKinnon, Taborga, & Taylor, 2009) and kappa-squared (κ²: Preacher &
Kelley, 2011) are only generated for single mediation models18
with no covariates and
were therefore not applicable to the current study. Two ratio measures of effect size are
also generated. These measures quantify the relative magnitude of the indirect effect to
either the total effect (PM: Alwin & Hauser, 1975) or the direct effect (RM: Sobel, 1982).
Both of these measures suffer from a number of limitations, not least of which is their
highly unstable nature. In simulation studies, MacKinnon and colleagues (Mackinnon,
1994; Mackinnon, Warsi, & Dwyer, 1995) provide evidence that both PM and RM
measures have excessive bias in small samples, large variance over repeated samples,
and should not be trusted as the size of an indirect effect unless the sample sizes are
large (N > 500 and 2000, respectively). Given these, and other limitations discussed
elsewhere (e.g. Preacher & Kelley, 2011; Hayes, 2013), neither ratio measure was
assessed within the current study.
The final two measures of effect size generated by PROCESS are the partially
standardised indirect effect (abps) and the completely standardised indirect effect (abcs)
(e.g. MacKinnon, 2008; M. W. L. Cheung, 2009). Some researchers strongly encourage
the practice of using standardised effect sizes because of the belief that it enables greater
comparison of effects across populations or studies where researchers have employed
different metrics (Preacher & Kelley, 2011). However, Hayes (2013) recommends
reporting unstandardised effects, arguing that standardisation merely “changes one
arbitrary measurement scale into another arbitrary scale, and because standardized
18 κ² has been utilised as an effect size measure for multiple mediation models however a recent review
(Wen & Fan, 2015) has raised questions about its appropriateness for any mediation models. Specifically,
the authors found that the definition of kappa-squared is mathematically incorrect.
Page 220
202
effects are scaled in terms of variability in the sample, they are not comparable across
studies…regardless of whether the same measurement scales are used” (p. 200). In the
current study, all metrics are reported in their unstandardised (B) form, whereby ab is
interpreted as the amount by which Y is predicted to increase or decrease indirectly
through M per a unit change in X (Preacher & Kelley, 2011).
11.4 Results
Descriptive statistics and correlations among each SPA (IVs), coping (MVs), and
mental health (DVs) variable being tested in the mediation analyses are shown in Table
10. The correlations between SPA and the coping mechanisms (path a), and between
SPA and mental health (c' path) are as reported in Chapter 10. The correlations between
the three coping variables and the four mental health variables (path b) were all
statistically significant (at the .001 α level) and the largest effect sizes were found for
associations between satisfaction with social support and each of the mental health
variables. At Time 2, most of the relationships between the MVs and DVs were still
significant and were of a similar magnitude to those found at Time 1. Two exceptions
were found; the disengagement coping-positive affect and primary control engagement
coping-psychological distress relationships did not reach the .001 significance
thresholds. The Time 2 associations between the IVs and MVs, and the IVs and DVs
were also of a similar magnitude to those found at Time 1 however a number of them
were no longer significant. Specifically, the relationships for consequences-positive
with quality of life, disengagement coping, and satisfaction with social support found at
Time 1 were no longer significant. Neither consequences-negative nor control-negative
was significantly related to primary control engagement coping at Time 2.
Page 221
203
Table 10
Descriptive statistics and zero-order correlations for all of the mediation model variables at Time 1 and Time 2
Correlations
Variable
M SD N 1 2 3 4 5 6 7 8 9 10 11 12 13
M 2.81 3.81 2.89 4.19 3.63 2.19 25.26 38.57 3.62 55.34 22.83 15.71 18.39
SD 0.78 0.65 0.81 0.54 0.75 0.75 6.12 6.30 0.75 12.55 4.47 3.34 2.92
N 235 235 235 235 235 235 235 232 234 234 235 235 235
1. TCR 2.71 0.77 368 -.12 .52*** -.18 -.45*** .43*** -.26*** -.41*** -.36*** .31*** -.14 .37*** -.24***
2. PCSQ 3.83 0.58 368 -.12 -.17 .31*** .10 -.23*** .03 .14 .29*** -.06 .27*** .00 .18
3. NCSQ 2.82 0.73 368 .52*** -.21*** -.35*** -.47*** .57*** -.27*** -.51*** -.40*** .36*** -.10 .26*** -.29***
4. PCON 4.17 0.52 368 -.25*** .27*** -.33*** .35*** -.29*** .25*** .37*** .32*** -.22*** .31*** -.01 .24***
5. NCON 3.51 0.68 368 -.42*** .21*** -.48*** .40*** -.37*** .23*** .36*** .26*** -.23*** .18 -.23*** .21***
6. ER 2.18 0.73 368 .46*** -.25*** .53*** -.41*** -.39*** -.43*** -.48*** -.39*** .50*** -.20*** .37*** -.33***
7. LS 25.46 6.35 363 -.29*** .16 -.33*** .33*** .24*** -.44*** .57*** .39*** -.49*** .25*** -.26*** .46***
8. QoL 38.49 6.53 365 -.41*** .21*** -.48*** .43*** .39*** -.54*** .63*** .57*** -.58*** .28*** -.32*** .47***
9. PA 3.59 0.70 365 -.33*** .37*** -.42*** .43*** .33*** -.44*** .47*** .57*** -.36*** .45*** -.18 .43***
10. PD 55.92 14.53 360 .28*** -.14 .40*** -.33*** -.25*** .48*** -.48*** -.54*** -.38*** -.17 .43*** -.47***
11. PCEC 23.07 4.80 368 -.15 .24*** -.19*** .34*** .23*** -.29*** .25*** .37*** .46*** -.17*** .07 .36***
12. DC 16.18 3.82 367 .29*** -.18*** .22*** -.09 -.19*** .32*** -.20*** -.26*** -.17*** .45*** .00 -.29***
13. SSS 18.44 2.89 367 -.26*** .21*** -.34*** .27*** .27* -.36* .47* .46* .48* -.38* .39* -.19*
Page 222
204
Note. Correlations for Time 1 are below the diagonal. Correlations for Time 2 are above the diagonal (in bold). TCR = timeline-chronic; PCSQ = consequences-
positive; NCSQ = consequences-negative; PCON = control-positive; NCON = control-negative; ER = emotional representations; LS = life satisfaction; QoL = quality
of life; PA = positive affect; PD = psychological distress; PCEC = primary control engagement coping; DC = disengagement coping; SSS = satisfaction with social
support.
***p ≤ .001.
Page 223
205
Results are described for those mediation models with significant direct and
indirect effects, consistent with the approaches described by Zhao and colleagues (2010)
and Hayes (2013). All model coefficients have been reported in their unstandardised
metric (as recommended by Hayes, 2013). Table 16 provides the range of scale scores.
11.4.1 Cross-sectional multiple mediation analyses
As PROCESS (Hayes, 2013) allows for one IV and one DV per model, 24 parallel
multiple mediation analyses were conducted using ordinary least squares (OLS) path
analysis. Results for each of the 24 models have been collapsed into four Figures (5 - 8)
to visually represent the pathways between SPA and coping (a paths); coping and
mental health controlling for SPA (b paths); the total effect of SPA on mental health (c
paths); and the direct effect of SPA on mental health, controlling for coping (c' paths).
The control variables included age, gender, partner status, education level, income level,
self-rated health, number of self-reported medical conditions, optimism, neuroticism,
and conscientiousness. The bootstrap point estimates and confidence intervals for the
total and specific indirect effects are presented in Tables 11 - 14. All pairwise contrasts
are presented in Table 15. Tables containing regression coefficients, standard errors, and
model summary information (including covariates) for each of the models with
significant indirect effects are presented in Appendix E.
11.4.1.1 Indirect effects models predicting life satisfaction
For life satisfaction, a number of mediation patterns were observed for the SPA
models, as shown in Table 11 and Figure 5. For the consequences-negative model, the
total indirect effect was statistically significant, as CIs for the point estimates did not
cross zero. An examination of the specific indirect effects indicated that the association
between consequences-negative and life satisfaction was driven by satisfaction with
social support, controlling for the other coping mechanisms. The strongest effect found
for any of the models was the total indirect effect in this model (B = -.43, CI95 = -0.856,
-0.138), indicating that scores for life satisfaction are predicted to decrease by 43% of a
point (on the 7-point Likert scale) indirectly through the combined effect of the
mediating variables for every 1 point score change in consequences-negative (see Table
16 for scale ranges). Comparisons of the specific indirect effects (see Table 15) showed
that effects through satisfaction with social support were significantly different to
Page 224
206
effects through either primary control engagement coping or disengagement coping
mechanisms. The direct effects in this model were non-significant, indicating indirect-
only mediation.
For three other models, indirect-only mediation was also found (the total indirect
effects were non-significant however significant specific indirect were found).
Timeline-chronic exerted an effect on life satisfaction indirectly through disengagement
coping, holding the other mediating variables constant, while emotional representations
influenced life satisfaction through satisfaction with social support, holding the other
mediating variables constant. The effects of control-negative on life satisfaction
occurred through two of the mechanistic pathways, that is, disengagement coping and
satisfaction with social support. For both the control-negative and emotional
representations models, comparisons among the specific indirect effects provided
evidence that effects through satisfaction with social support were significantly different
to effects through either of the other two coping mechanisms.
A complementary mediation model was also found. Control-positive exerted an
effect on life satisfaction indirectly through disengagement coping, holding the other
mediating variables constant. The direct effect was significant, with a sign pointing in
the same direction as that found for the specific indirect effect. The consequences-
positive model demonstrated a no-effect non-mediation pattern. The total amount of
variability in LS explained by each of the models was R2 = .49.
Page 225
207
Figure 5. Multiple mediation models testing coping variables as mediators between SPA and life satisfaction. Six independent models
predicting life satisfaction are represented in this single diagram.
Note. N = 340. Coefficients are unstandardised.
*p ˂ .05, **p ˂ .01, ***p ˂ .001.
Page 226
208
Table 11
Indirect effects and 95% bias-corrected confidence intervals for models predicting life satisfaction
Note. N = 340. Coefficients are unstandardised. IV = independent variable; DV = dependent variable; SE = standard error; LLCI = bias corrected 95% lower limit
confidence interval; ULCI = bias corrected 95% upper limit confidence interval; TCR = timeline-chronic; PCSQ = consequences-positive; NCSQ = consequences-
negative; PCON = control-positive; NCON = control-negative; ER = emotional representations; PCEC = primary control engagement coping; DC = disengagement
coping; SSS = satisfaction with social support. 10,000 bootstrap samples. Significant indirect effects in bold.
aAdjusted for gender, age, partner status, education, income, self-rated health, number of self-reported medical conditions, optimism, neuroticism, and
conscientiousness.
***p ≤ .001.
IV Indirect effects (ab paths) Full DV
Model R2
Total
(ab)
PCEC
(a1b1)
DC
(a2b2)
SSS
(a3b3)
Ba(SE) LLCI ULCI B
a(SE) LLCI ULCI B
a(SE) LLCI ULCI B
a(SE) LLCI ULCI
TCR .01
(.19) -0.390 0.373
-.02
(.04) -0.151 0.027
.11
(.07) 0.006 0.314
-.08
(.17) -0.463 0.232
.49***
PCSQ .16
(.23) -0.253 0.648
-.06
(.08) -0.292 0.042
-.09
(.08) -0.307 0.009
.31
(.22) -0.048 0.814
.49***
NCSQ -.43
(.18) -0.856 -0.138
-.01
(.04) -0.150 0.033
.00
(.06) -0.112 0.123
-.42
(.16) -0.817 -0.157
.49***
PCON .37
(.27) -0.138 0.942
-.14
(.15) -0.496 0.080
.15
(.11) 0.001 0.457
.36
(.26) -0.092 0.914
.49***
NCON .21
(19) -0.145 0.594
-.02
(.04) -0.159 0.022
-.11
(.08) -0.365 -0.007
.34
(.17) 0.047 0.705
.49***
ER -.05
(.04) -0.145 0.015
.01
(.01) -0.007 0.053
.01
(.01) -0.010 0.050
-.07
(.04) -0.162 -0.006
.49***
Page 227
209
11.4.1.2 Indirect effects models predicting positive affect
As shown in Table 12 and Figure 6, mediation patterns were found for all of the
SPA models predicting positive affect. Timeline-chronic exerted an effect on positive
affect indirectly through the specific mechanism of disengagement coping, holding the
other mediating variables constant. There was no total indirect effect as the bias-
corrected 95% CIs did contain zero. The direct effect was also non-significant for this
model, indicating indirect-only mediation.
The remaining five models exhibited both statistically significant indirect effects
and direct effects, with signs pointing in the same direction, providing evidence for
complementary mediation. Specifically, for the control-positive model, the total indirect
effect was significant as CIs for the point estimates did not cross zero, and this was
driven by primary control engagement coping, controlling for the other two coping
mechanisms. No significant total indirect effects were found for the other SPA models.
The primary control engagement coping mechanism was also statistically significant in
the consequences-positive model, while consequences-negative, control-negative, and
emotional representations each indirectly influenced positive affect through satisfaction
with social support. There were a number of significant contrasts among the specific
indirect effects (see Table 15). For the control-negative, emotional representations and
both of the consequences models, effects through satisfaction with social support were
significantly different to effects through disengagement coping. Significant differences
were also found between the effects of primary control engagement coping and
disengagement coping for the consequences-positive model, and between the effects of
primary control engagement coping and satisfaction with social support for the
consequences-negative model.
While all the models demonstrated indirect effects, the effect sizes were
extremely small (see unstandardised coefficients in Table 12 and scale score ranges in
Table 16). For instance, the largest significant coefficient for any of the models showed
that the total indirect effect (B = .09, CI95 = 0.028, 0.156) in the control-positive model
represented under 10% of a point on the scale (range: 1 – 5). The total amount of
variance accounted for by each model overall ranged from R2
= .41 to .51.
Page 228
210
Figure 6. Multiple mediation models testing coping variables as mediators between SPA and positive affect. Six independent models
predicting positive affect are represented in this single diagram.
Note. N = 341. Coefficients are unstandardised.
*p ˂ .05, **p ˂ .01, ***p ˂ .001.
Page 229
211
Table 12
Indirect effects and 95% bias-corrected confidence intervals for models predicting positive affect
Note. N = 341. Coefficients are unstandardised. IV = independent variable; DV = dependent variable; SE = standard error; LLCI = bias corrected 95% lower limit
confidence interval; ULCI = bias corrected 95% upper limit confidence interval; TCR = timeline-chronic; PCSQ = consequences-positive; NCSQ = consequences-
negative; PCON = control-positive; NCON = control-negative; ER = emotional representations; PCEC = primary control engagement coping; DC = disengagement
coping; SSS = satisfaction with social support. 10,000 bootstrap samples. Significant indirect effects in bold.
aAdjusted for gender, age, partner status, education, income, self-rated health, number of self-reported medical conditions, optimism, neuroticism, and
conscientiousness.
***p ≤ .001.
IV Indirect effects (ab paths) Full DV Model R
2
Total (ab)
PCEC (a1b1)
DC
(a2b2) SSS
(a3b3)
Ba(SE) LLCI ULCI B
a(SE) LLCI ULCI B
a(SE) LLCI ULCI B
a(SE) LLCI ULCI
TCR .01
(.02) -0.032 0.056
.01
(.01) -0.006 0.033
.01
(.01) 0.000 0.032
-.01
(.02) -0.043 0.021
.47***
PCSQ .04
(.03) -0.009 0.095
.02
(.01) 0.003 0.055
-.01
(.01) -0.035 0.001
.03
(.02 -0.004 0.069
.51***
NCSQ -.03
(.02) -0.082 0.009
.01
(.01) -0.017 0.029
.00
(.01) -0.010 0.012
-.04
(.02) -0.076 -0.012
.48***
PCON .09
(.03) 0.028 0.156
.04
(.02) 0.014 0.086
.01
(.01) -0.004 0.044
.03
(.02) -0.007 0.088
.41***
NCON .03
(02) -0.018 0.075
.01
(.01) -0.009 0.031
-.01
(.01) -0.040 0.000
.03
(.02) 0.005 0.070
.47***
ER -.04
(.03) -0.100 0.002
-.02
(.01) -0.054 0.002
.00
(.01) -0.005 0.025
-.03
(.02) -0.073 -0.002
.48***
Page 230
212
11.4.1.3 Indirect effects models predicting quality of life
Several different patterns of mediation and non-mediation were observed across
the six SPA models predicting quality of life (refer to Table 13 and Figure 7).
Complementary mediation was identified for the control-negative, consequences-
negative, and emotional representations models as both statistically significant indirect
effects and direct effects were found, with signs pointing in the same direction. The CIs
for the point estimates of the total indirect effect paths for the latter two models were
found to be statistically different from zero, and satisfaction with social support was
driving this effect, controlling for the other coping mechanisms. While the total indirect
effect was non-significant, the control-negative dimension influenced quality of life
indirectly through satisfaction with social support, as evidenced by the bias-corrected
95% CIs not containing zero. Comparisons of the specific indirect effects for each
model revealed significant differences (refer to Table 15). For all three models, the
effects through disengagement coping were significantly different to effects through
satisfaction with social support. Also, for both the consequences-negative and control-
negative models, the effects through primary control engagement coping were
significantly different to the effects through satisfaction with social support.
The largest effect size for any of the models was found for the consequences-
negative model, where the coefficient for satisfaction with social support (B = -.27, CI95
= -0.541, -0.092) represented only 27% of a point on the scale (range 12 – 48). While
the control-positive model showed significant direct effects, there were no significant
indirect effects, indicating a direct-only non-mediation pattern. No effects were
observed for either the timeline-chronic or consequences-positive models. Overall, the
total amount of variability in QoL explained by the models ranged from R2
= .58 to .60.
Page 231
213
Figure 7. Multiple mediation models testing coping variables as mediators between SPA and quality of life. Six independent models
predicting quality of life are represented in this single diagram.
Note. N = 341. Coefficients are unstandardised.
*p ˂ .05, **p ˂ .01, ***p ˂ .001.
Page 232
214
Table 13
Indirect effects and 95% bias-corrected confidence intervals for models predicting quality of life
Note. N = 341. Coefficients are unstandardised. IV = independent variable; DV = dependent variable; SE = standard error; LLCI = bias corrected 95% lower limit
confidence interval; ULCI = bias corrected 95% upper limit confidence interval; TCR = timeline-chronic; PCSQ = consequences-positive; NCSQ = consequences-
negative; PCON = control-positive; NCON = control-negative; ER = emotional representations; PCEC = primary control engagement coping; DC = disengagement
coping; SSS = satisfaction with social support. 10,000 bootstrap samples. Significant indirect effects in bold.
aAdjusted for gender, age, partner status, education, income, self-rated health, number of self-reported medical conditions, optimism, neuroticism, and
conscientiousness.
***p ≤ .001.
IV Indirect effects (ab paths) Full DV Model R
2
Total (ab)
PCEC (a1b1)
DC
(a2b2) SSS
(a3b3)
Ba(SE) LLCI ULCI B
a(SE) LLCI ULCI B
a(SE) LLCI ULCI B
a(SE) LLCI ULCI
TCR -.02
(.14) -0.303 0.248
.02
(.03) -0.020 0.139
.03
(.04) -0.048 0.134
-.06
(.12) -0.316 0.171
.58***
PCSQ .23
(.17) -0.075 0.584
.03
(.07) -0.072 0.208
-.02
(.04) -0.167 0.033
.22
(.14) -0.033 0.544
.58***
NCSQ -.25
(.13) -0.542 -0.038
.01
(.04) -0.027 0.141
.00
(.02) -0.041 0.047
-.27
(.11) -0.541 -0.092
.60***
PCON .29
(.21) -0.115 0.720
.03
(.11) -0.189 0.271
.00
(.07) -0.140 0.149
.26
(.18) -0.064 0.653
.59***
NCON .22
(13) -0.021 0.517
.01
(.03) -0.020 0.125
-.03
(.05) -0.154 0.046
.24
(.12) 0.040 0.517
.58***
ER -.24
(.14) -0.573 -0.003
-.02
(.05) -0.198 0.049
.01
(.03) -0.024 0.124
-.23
(.13) -0.533 -0.016
.59***
Page 233
215
11.4.1.4 Indirect effects models predicting psychological distress
For psychological distress, three patterns consistent with mediation were
identified across the six SPA models (see Table 14 and Figure 8). Non-significant direct
effects but statistically significant indirect effects (i.e. the CIs for the point estimates did
not cross zero) were found for the timeline-chronic, consequences-positive, and control-
negative models, suggesting indirect-only mediation. Both the timeline-chronic and
control-negative models exhibited significant total indirect effects which for the former,
was driven by disengagement coping, while for the latter, disengagement coping and
satisfaction with social support were both significant. No total indirect effect was found
for the consequences-positive model however this dimension influenced psychological
distress through primary control engagement coping, controlling for the other two
coping mechanisms. Further, an examination of the contrasts (Table 15) indicated that
for both the consequences-positive and control-negative models, the effects through
primary control engagement coping were significantly different to the effects through
disengagement coping and the effects through satisfaction with social support.
A competitive mediation pattern was found for the control-positive model, as both
the direct effect, total indirect effect, and specific indirect effects were statistically
significant however the sign for the direct effect pointed in the opposite direction to the
signs for the indirect effects. When the specific mechanistic pathways were examined, it
was revealed that the association between control-positive and psychological distress
was driven by both primary control engagement coping and disengagement coping,
controlling for satisfaction with social support. Comparisons of the specific indirect
effects for control-positive revealed that the effects through satisfaction with social
support were significantly different to effects through both primary control engagement
coping and disengagement coping.
Complementary mediation was indicated for both the consequences-negative and
emotional representations models. Both had significant direct effects and the bias-
corrected 95% CIs did not contain zero for the satisfaction with social support pathway.
Only one significant contrast emerged for the emotional representations model.
Specifically, the effects through primary control engagement coping were significantly
Page 234
216
different to the effects through satisfaction with social support. The total amount of
variability in psychological distress explained by the models ranged from R2
= .57 to
.58. Overall, the sizes of the significant indirect effects observed for each model were
extremely low, as demonstrated by the largest coefficient found for any of the models,
that is, the total indirect effect for the control-positive model (B = 1.28, CI95 = 0.148,
2.829). The scale scores ranged from 0 – 126 (see Table 16).
Page 235
217
Figure 8. Multiple mediation models testing coping variables as mediators between SPA and psychological distress. Six independent
models predicting psychological distress are represented in this single diagram.
Note. N = 340. Coefficients are unstandardised.
*p ˂ .05, **p ˂ .01, ***p ˂ .001.
Page 236
218
Table 14
Indirect effects and 95% bias-corrected confidence intervals for models predicting psychological distress
Note. N = 340. Coefficients are unstandardised. IV = independent variable; DV = dependent variable; SE = standard error; LLCI = bias corrected 95% lower limit
confidence interval; ULCI = bias corrected 95% upper limit confidence interval; TCR = timeline-chronic; PCSQ = consequences-positive; NCSQ = consequences-
negative; PCON = control-positive; NCON = control-negative; ER = emotional representations; PCEC = primary control engagement coping; DC = disengagement
coping; SSS = satisfaction with social support. 10,000 bootstrap samples. Significant indirect effects in bold.
aAdjusted for gender, age, partner status, education, income, self-rated health, number of self-reported medical conditions, optimism, neuroticism, and
conscientiousness.
***p ≤ .001.
IV Indirect effects (ab paths) Full DV Model R
2
Total (ab)
PCEC (a1b1)
DC
(a2b2) SSS
(a3b3)
Ba(SE) LLCI ULCI B
a(SE) LLCI ULCI B
a(SE) LLCI ULCI B
a(SE) LLCI ULCI
TCR .84
(.39) 0.212 1.787
.16
(.16) -0.090 0.570
.57
(.31) 0.122 1.393
.11
(.23) -0.311 0.627
.57***
PCSQ -.50
(.52) -1.644 0.420
.41
(.24) 0.067 1.078
-.49
(.36) -1.472 0.044
-.42
(.28) -1.118 0.037
.57***
NCSQ .62
(.41) -0.141 1.511
.10
(.17) -0.219 0.490
.01
(.30) -0.606 0.619
.51
(.24) 0.143 1.111
.57***
PCON 1.28
(.67) 0.148 2.829
.83
(.37) 0.265 1.786
.92
(.49) 0.211 2.251
-.47
(.34) -1.307 0.078
.57***
NCON -.93
(.52) -2.209 -0.145
.12
(.17) -0.151 0.533
-.61
(.42) -1.822 -0.085
-.45
(.26) -1.110 -0.060
.57***
ER .34
(.47) -0.507 1.387
-.34
(.26) -1.030 0.027
.24
(.33) -0.270 1.116
.44
(.25) 0.051 1.081
.58***
Page 237
219
Table 15
Pairwise contrasts of the specific indirect effects
IV Contrasts
Life satisfaction (N=340) Positive affect (N=341)
Quality of life (N=341) Psychological distress (N=340)
Ba(SE) LLCI ULCI B
a(SE) LLCI ULCI B
a(SE) LLCI ULCI B
a(SE) LLCI ULCI
TCR
C1
C2
C3
-.12(.09)
.06(.18)
.19(.18)
-0.371
-0.283
-0.136
0.000
0.439
0.589
.00(.01)
.02(.02)
.02(.02)
-0.023
-0.013
-0.012
0.024
0.051
0.056
-.00(.05)
.07(.12)
.07(.13)
-0.111
-0.166
-0.168
0.116
0.321
0.342
-.41(.34)
.06(.31)
.47(.40)
-1.240
-0.561
-0.217
0.143
0.702
1.389
PCSQ
C1
C2
C3
.03(.11)
-.37(.26)
-.41(.23)
-0.197
-0.955
-0.943
0.233
0.039
-0.027
.03(.01)
-.01(.02)
-.04(.02)
0.010
-0.049
-0.083
0.065
0.033
-0.003
.05(.08)
-.19(.16)
-.23(.15)
-0.082
-0.561
-0.566
0.229
0.079
0.024
.90(.40)
.82(.41)
-.07(.47)
0.282
0.178
-1.098
1.922
1.847
0.769
NCSQ
C1
C2
C3
-.01(.07)
.41(.17)
.42(.17)
-0.173
0.129
0.141
0.106
0.808
0.817
.01(.01)
.04(.02)
.04(.02)
-0.019
0.013
0.011
0.031
0.080
0.077
.01(.04)
.28(.11)
.27(.11)
-0.051
0.100
0.087
0.127
0.546
0.544
.08(.35)
-.41(.32)
-.49(.37)
-0.621
-1.162
-1.305
0.765
0.111
0.201
PCON
C1
C2
C3
-.29(.20)
-.50(.32)
-.21(.28)
-0.783
-1.206
-0.788
0.018
0.060
0.306
.03(.02)
.01(.03)
-.02(.03)
-0.010
-0.055
-0.077
0.077
0.060
0.029
.02(.14)
-.23(.23)
-.25(.19)
-0.253
-0.735
-0.662
0.291
0.153
0.094
-.09(.61)
1.31(.57)
1.40(.59)
-1.456
0.352
0.430
0.992
2.646
2.852
NCON
C1
C2
C3
.10(.09)
-.35(.18)
-.45(.18)
-0.027
-0.755
-0.868
0.359
-0.046
-0.140
.02(.01)
-.02(.02)
-.04(.02)
-0.002
-0.061
-0.086
0.046
0.007
-0.012
.04(.05)
-.23(.12)
-.26(.12)
-0.052
-0.519
-0.541
0.170
-0.022
-0.048
.73(.42)
.57(.34)
-.16(.51)
0.169
0.033
-1.410
1.876
1.382
0.644
ER
C1
C2
C3
-.01(.09)
.39(.22)
.40(.21)
-0.183
0.037
0.046
0.198
0.924
0.874
-.02(.01)
.01(.02)
.04(.02)
-0.058
-0.024
0.003
0.001
0.055
0.080
-.03(.06)
.21(.14)
.24(.13)
-0.197
-0.026
0.013
0.061
0.557
0.542
-.58(.41)
-.78(.41)
-.19(.40)
-1.581
-1.802
-0.915
0.081
-0.133
0.671
Page 238
220
Note. C1 = primary control engagement coping vs disengagement coping; C2 = primary control engagement coping vs social support satisfaction; C3 = disengagement
coping vs social support satisfaction. Coefficients are unstandardised. LLCI = bias corrected 95% lower limit confidence interval; ULCI = bias corrected 95% upper
limit confidence interval; TCR = timeline-chronic; PCSQ = consequences-positive; NCSQ = consequences-negative; PCON = control-positive; NCON = control-
negative; ER = emotional representations. 10000 bootstrap samples. Significant contrasts in bold.
aAdjusted for gender, age, partner status, education, income, self-rated health, number of medical conditions, optimism, neuroticism, and conscientiousness.
Page 239
221
11.4.2 Within-subjects multiple mediation analyses
Despite the small effect sizes, the cross-sectional investigation of the first wave of
data demonstrated a number of mediation patterns across the SPA models predicting
each mental health variable. While establishing a pattern of relationships at one point in
time is useful to establish mediation processes, it nonetheless precludes any inferences
about a causal process. As stated in Section 11.1, the theoretical framework which
guides this research makes explicit claims about a causal chain of events between the X,
M, and Y variables. At a minimum, two waves of data are required in order for a period
of time to elapse between the putative cause and its associated effect, thereby allowing
for the effect to occur (Preacher, 2015). To determine whether the patterns of mediation
identified in the cross-sectional investigation could be replicated over time within
individuals, multiple mediation analyses conducted on the change scores was necessary.
As described in Section 11.3, the residualised change scores were calculated using
both the Time 1 and Time 2 data for the SPA, coping, and mental health variables. As
shown in Table 2 (refer to Section 7.4), there was a 36% attrition rate between the first
and second waves of data collection; however the sample structure was not overly
distorted by the non-responders at Time 2 (as evidenced by the proportion of
participants across the sociodemographic subgroups which remained fairly stable over
time). Further, descriptive statistics revealed negligible characteristic or health-related
differences between the group who ceased participation after Time 1 and the group that
participated in both waves of the study (as reported in Section 7.4.2). Prior to
conducting the mediation analyses, the standard deviations (SDs) of the change scores
were examined against the range of values for each scale (see Table 16), along with a
visual examination of the scatterplots, to assess the spread of the data around the mean.
While the mean scores of zero indicated that, on average, there was no change in the
variables, the SDs provided evidence of a spread of scores in both directions. Test-retest
correlations were also conducted on each variable. The coefficients ranged from .47 to
.73, confirming the fluidity of the SPA, coping, and mental health constructs.
Page 240
222
Table 16
Residualised change scores and scale score ranges for the mediation model variables
Variable Mean SD N Residualised change scores Scale score range
Minimum Maximum
TCR 0.00 0.57 235 -1.66 1.65 1 - 5
PCSQ 0.00 0.56 235 -1.91 1.14 1 - 5
NCSQ 0.00 0.61 235 -1.98 1.71 1 - 5
PCON 0.00 0.47 235 -1.56 0.90 1 - 5
NCON 0.00 0.64 235 -1.83 1.77 1 - 5
ER 0.00 0.56 235 -1.38 1.89 1 - 5
PCEC 0.00 3.54 235 -9.04 11.88 8 - 32
DC 0.00 2.69 235 -5.29 9.91 10 - 40
SSS 0.00 2.10 235 -6.67 7.43 7 - 21
LS 0.00 4.22 233 -25.43 11.42 5 - 35
PA 0.00 0.60 234 -1.85 1.78 1 - 5
QoL 0.00 5.03 232 -22.33 19.32 12 - 48
PD 0.00 8.94 235 -23.32 45.08 0 - 126
Note. TCR = timeline-chronic; PCSQ = consequences-positive; NCSQ = consequences-negative; PCON
= control-positive; NCON = control-negative; ER = emotional representations; PCEC = primary control
engagement coping; DC = disengagement coping; SSS = satisfaction with social support; LS = life
satisfaction; PA = positive affect; QoL = quality of life; PD = psychological distress.
The residualised change scores for the SPA, coping, and mental health variables
were entered in the PROCESS macro (Hayes, 2013) to determine if changes in mental
health were related to changes in SPA through changes in coping. Across all 24 models
computed in the parallel multiple mediation analyses, only five demonstrated
statistically significant indirect effects for the change scores. Only results for the
significant effects are reported. Tables containing regression coefficients, standard
errors, and model summary information for each of these five models (including
covariates) are presented in Appendix F.
The multiple mediation analyses showed that change in consequences-positive
exerted an effect on change in life satisfaction (N = 221) through the combined effect of
Page 241
223
the change in the coping variables (B = .39, SE = .23, CI95 = 0.007, 0.917), as the CIs
for the point estimates did not cross zero. An examination of the specific mechanistic
pathways revealed that the association of change scores between consequences-positive
and life satisfaction was driven by primary control engagement coping (B = .32, SE =
.19, CI95 = 0.034, 0.774), controlling for shifts in the other two coping mechanisms. The
direct effect was not significant, indicating indirect-only mediation. Comparisons
among the specific indirect effects showed that the effect through changes in primary
control engagement coping were significantly different to the effect through changes in
disengagement coping (B = .36, SE = .20, CI95 = 0.036, 0.820). Of all the significant
change analyses, the consequences-positive predicting life satisfaction model showed
the largest effect size. Specifically, life satisfaction scores were predicted to increase by
36% of a point (on a 7-point Likert scale) indirectly through the combined effect of the
mediating variables for every 1 point score change in consequences-positive. No
significant effects were found for this model in the cross-sectional data.
For life satisfaction, significant specific indirect effects were also found for the
emotional representations model, since the bias-corrected 95% CIs did not contain zero.
Change in emotional representations influenced change in life satisfaction through
change in primary control engagement coping (B = -.26, SE = .16, CI95 = -0.624, -
0.019). In the cross-sectional analyses, there was a significant indirect effect for the
satisfaction with social support mechanism. For this change score model, the pattern of
mediation was indirect-only as the direct effect was non-significant. No significant
contrasts were observed for this model and the effect size was small.
Change in consequences-positive exerted an effect on change in positive affect (N
= 221) through the aggregate effect of change in the three coping variables (B = .07, SE
= .03, CI95 = 0.013, 0.149), as the CIs for the point estimates did not cross zero. An
examination of the specific indirect effects showed that the association of change scores
between consequences-positive and positive affect was driven by primary control
engagement coping (B = .06, SE = .03, CI95 = 0.016, 0.134), controlling for shifts in the
other two coping mechanisms. The direct effect was also significant (B = .17, SE = .07,
CI95 = 0.098, 0.380, t = 2.450, p = .015), indicating complementary mediation. The
significant effects through primary control engagement coping in this model were also
found in the cross-sectional results. Comparisons among the specific indirect effects for
the change score model showed that the effect through changes in primary control
Page 242
224
engagement coping were significantly different to the effect through changes in
disengagement coping (B = .07, SE = .03, CI95 = 0.018, 0.142).
For positive affect, indirect-only mediation was indicated for the control-positive
and emotional representations models as significant indirect effects but non-significant
direct effects were found for both. Change in control-positive influenced change in
positive affect through change in primary control engagement coping (B = .05, SE = .03,
CI95 = 0.000, 0.126), while change in emotional representations exerted an effect on
change in positive affect through the combined effect of the change in coping variables
(B = -.06, SE = .03, CI95 = -0.135, -0.015) which was driven by change in primary
control engagement coping (B = -.06, SE = .02, CI95 = -0.119, -0.019). The significant
effects observed for the control-positive change scores model was also detected in the
cross-sectional analyses. For the emotional representations model, only satisfaction with
social support indirectly influenced the relationship to positive affect in the cross-
sectional analysis. A number of significant contrasts were found for these change score
models.
The effect through changes in primary control engagement coping were
significantly different to the effect through changes in disengagement coping for both
the control-positive (B = .06, SE = .04, CI95 = 0.005, 0.149) and emotional
representations (B = -.05, SE = .03, CI95 = -0.111, -0.009) models. Also, the effect
through changes in primary control engagement coping were significantly different to
the effect through changes in satisfaction with social support for both control-positive
(B = .05, SE = .03, CI95 = 0.003, 0.128) and emotional representations (B = -.05, SE =
.03, CI95 = -0.114, -0.007). The effect sizes for the SPA models predicting changes in
positive affect were small, the largest of which represented 7% of a point (on a scale
ranging from 1 – 5).
Finally, the relationships between the change scores and recent stressful life
events were examined. For recent stressful life events, 81.7% of participants reported no
significant problems over the preceding 12 months, while 9.4% and 8.5% reported mild
and moderate stress, respectively. Only 0.4% of the sample reported experiencing major
stressful events in the 12 months between Time 1 and Time 2 data collection. No
significant relationships were found for stressful life events with any of the change in
coping or mental health variables. The only association found between stressful life
events and change in SPA were for the consequences-positive dimension and this
association was small (r = .18).
Page 243
225
11.5 Discussion
The present study sought to establish whether the relationships between SPA and
mental health would be indirectly influenced by psychosocial mechanisms, specifically,
by three different categories of coping resources. The findings from the cross-sectional
data indicated a number of different patterns of mediation; however the vast majority of
these relationships did not appear to hold over time when change within individuals was
assessed. A number of factors are likely to have influenced the current findings. These
are addressed following a discussion of the results.
The findings from the cross-sectional investigation provided partial support for
the first hypothesis outlined in Section 11.2. That is, coping mechanisms were found to
indirectly influence the relationships between the multiple dimensions of SPA and
mental health in this group of older adults at one time point. Indeed, the majority of the
models tested demonstrated patterns of mediation, according to Zhao et al.’s (2010)
criteria. For three of the mental health variables, indirect-only mediation was found for
a number of the SPA dimensions. This type of mediation pattern indicates that there is
evidence for the hypothesised mediator and there is unlikely to be an omitted mediator,
which overlaps with Baron and Kenny’s (1986) complete mediation descriptor. These
results are discussed first.
The associations for timeline-chronic with life satisfaction, positive affect, and
psychological distress were all indirectly influenced by disengagement coping
strategies. Specifically, being chronically aware of one’s own age and ageing did not
directly influence mental health status but exerted an influence on the amount to which
disengagement strategies were employed which in turn, influenced the degree to which
individuals experienced satisfaction with their lives, positive emotions, and
psychological distress. There are currently no other studies which have examined how
this form of coping (or indeed, either of the other two coping mechanisms investigated
in this study) may influence relationships between SPA and mental health. However,
there is a large body of evidence (as described in Section 5.2.2) which demonstrates that
older adults generally report feeling younger than their chronological age. It has been
suggested that a more youthful subjective age serves as a positive illusion which
promotes greater levels of mental health (Westerhof & Barrett, 2005). Given that (short
of death) ageing is an inevitable process, this self-enhancement strategy could be
conceptualised as a form of disengagement which enables individuals to distance
Page 244
226
themselves from the reality of advancing age. This is especially salient within a
Westernised cultural environment where older people are often devalued. In this
context, it is unsurprising that a chronic awareness of ageing influences mental health
through disengagement type mechanisms.
In the current study, disengagement coping also indirectly influenced
relationships between beliefs about control over the negative aspects of ageing and both
life satisfaction and psychological distress (in the absence of a direct effect). In the
short-term, it is likely that the use of such strategies, especially for independent and
well-functioning individuals, are adaptive because they help to protect against negative
affect or dissatisfaction with life that uncomfortable cognitions around losses to control
and independence might produce. However, in the face of more tangible and substantial
losses, avoidance is likely to become maladaptive. Within the illness perceptions
literature, disengagement coping has consistently been found to mediate relationships
between illness perceptions in those with chronic conditions and maladaptive outcomes
(Dempster et al., 2015) whereas the control dimension has been found to exert an
influence on better mental health functioning through more problem-focussed strategies
(Hagger & Orbell, 2003). While active attempts to manage or alter stressors in the
external environment were not found to influence these relationships in the current
study, it may be that considerable losses to control over negative ageing experiences
would need to be felt before more problem-focussed coping mechanisms were activated.
Although negative aspects of ageing might be managed through planning or active
coping strategies, it is also feasible that the ways in which SPA influence coping differs
from how illness perceptions have been shown to influence coping. Despite illness and
ageing being associated with a diversity of challenges which make demands on the
adaptive or coping resources of the individual, the two constructs have very discrete
meanings. Ageing is not a disease for which there is treatment or cure, and the process
is anticipated. Thus, the mechanistic pathways from SPA to mental health are likely to
be distinct from those reported in the illness perceptions literature. For example, social
support mechanisms have not been shown to greatly influence the illness perception-
illness outcome association. However, the cross-sectional findings in the current study
suggest that control over negative aspects of ageing as well as less favourable SPA,
such as negative emotions generated in response to the ageing process and beliefs that
ageing is associated with negative consequences do influence satisfaction with social
Page 245
227
support which in turn, influences life satisfaction (and psychological distress, in the case
of the control-negative model).
More specifically, less favourable SPA were related to less satisfaction with social
support whereas more favourable SPA were related to increased social support
satisfaction. Indeed, for all but one of the associations, a common-sense pattern of
relationships between the various SPA dimensions and the three coping mechanisms
were found, providing support for the third hypothesis. This is consistent with the
findings reported within the illness perceptions literature (Hagger & Orbell, 2003) and
confirms the “common-sensical connections” (H. Leventhal et al., 1998, p. 722)
between perceptions (of either illness or ageing) and coping, which the CSM posits. The
one exception, however, was for the control-positive dimension which was positively
related to disengagement coping. It is unclear why this control dimension should be
positively related to less adaptive coping strategies. It may be that, as suggested by
Sexton and colleagues (2014), this subscale of the APQ is actually capturing something
other than control beliefs which in turn influences disengagement coping type
responses.
Hagger and Orbell (2003) have suggested that people with illness are still likely to
seek social support but this coping behaviour may instead be determined by other
representational beliefs or social context. SPA may, therefore, represent one set of
beliefs which determines how social factors serve to influence mental health. It may be
that social mechanisms help to normalise less favourable ageing experiences (via social
comparison) or that social support promotes a sense of belonging and strengthens
psychological resilience for managing negative cognitions about ageing. It is also
plausible that social factors actually act as a problem-solving resource which helps
individuals to alter aspects of their own ageing experiences which are perceived as less
favourable. One way of teasing apart how social support mechanisms serve to underpin
the SPA-mental health relationships may be to include less generic survey measures of
coping which reference broader, non-specific sources of social support (Hagger &
Orbell, 2003) and utilise more qualitative measures which enable a more in-depth
understanding about how individuals use their social support resources. This might be
an interesting avenue for future researchers to explore.
While disengagement coping and satisfaction with social support were found to
exert effects for a number of the indirect-only mediation models, primary control
engagement coping strategies had less influence, being significant for only one of these
Page 246
228
models (i.e. consequences-positive and psychological distress). However, this coping
resource did demonstrate more influence within the complementary and competitive
mediation models. According to Zhao and colleagues (2010), these types of partial
mediation patterns suggest that while the mediating variables are consistent with the
theoretical framework, there might be additional omitted mediators. For instance,
perceptions of control over positive aspects of ageing and beliefs that ageing is
associated with positive consequences were both found to influence positive affect
through two distinct pathways: directly from the SPA dimensions themselves and
indirectly through primary control engagement strategies. However, it is likely that
other types of coping which were not examined in the current study also mediate these
relationships. It may be, for example, that secondary control or accommodative coping
(i.e. compensation strategies) which are understood to work with primary control
strategies in a synergistic fashion, also operate as a mechanistic pathway between SPA
and positive affect.
There appeared to be some consistency for the models which demonstrated these
partial mediation effects. For instance, where negative aspects of ageing were
considered, be it for control, consequences, or emotional responses, satisfaction with
social support was found to partially explain the relationships to quality of life, positive
affect, and psychological distress. This suggests that social networks are important for
determining how the less favourable aspects of ageing are being managed by the older
adults within the current study. Given the possible existence of some omitted variables
in these models, however, future research that seeks to examine different types of
coping mechanisms can be guided by the signs of the direct effects found in the current
study models (which indicates the sign of an omitted indirect path: Zhao et al., 2010).
For example, for the control-negative model predicting quality of life, the direct effect
was positively signed, which suggests that more adaptive forms of coping might also be
contributing to the control-quality of life relationship and might be considered for
further investigation. Equally, while the direct-only non-mediation which was found for
the control-positive-quality of life model indicates that the theoretical assumption
regarding coping may be flawed, the positive sign of the direct effect might still provide
future investigators some guidance around the type of mechanisms which might
indirectly influence this relationship. For the cross-sectional analyses, only three out of
the 24 models examined demonstrated no-effect non-mediation, indicating that the
Page 247
229
theoretical framework employed was incorrect and may therefore not be worth pursuing
in future investigations.
Whereas common-sense patterns of relationships were observed between the SPA
dimensions and coping mechanisms, some of the relationships from coping to mental
health were less expected. For instance, more active forms of coping were positively
related to psychological distress for the control-positive and consequences-positive
dimensions, while increased use of disengagement coping strategies were related to less
life satisfaction and positive affect in several models. However, as discussed below,
these findings (which demonstrated very small effect sizes) are most likely due to the
characteristics of the sample. That is, there were very low levels of psychological
distress across the group. Further, as discussed earlier, it is feasible that disengaging
from thoughts about ageing in populations which are not experiencing significant age-
or health-related threats is actually protective for the mental health of the individual.
Despite the mediation patterns observed in the cross-sectional analyses, however,
the overwhelming majority of these relationships were not found at follow-up. Indeed,
when changes within individuals were examined in the second set of mediation
analyses, only two of the models (i.e. predicting positive affect) which demonstrated
indirect effects at Time 1 remained stable. A further two models which had
demonstrated significant indirect effects at the first time point (i.e. emotional
representations predicting positive affect and life satisfaction) also demonstrated
significant indirect effects when the change scores were analysed however through
different coping mechanisms. A fifth model, specifically, the positive-consequences
model predicting life satisfaction, revealed an indirect-only mediation pattern when the
change scores were analysed whereas no significant effects had been observed at Time
1. Finally, there was almost no association between recent stressful life events and the
change variables.
Taken at face value, the current findings might appear to suggest that these
relationships do not hold over time when change within the individual is examined. If
this is truly the case, then interventions designed to target coping resources for
managing the negative effects of ageing experiences (as suggested in Chapter 6) would
demonstrate limited efficacy and resources would be better spent on developing and
implementing other forms of treatment. However, there are several indicators, from both
within the current study and from the broader literature which suggest a more cautious
approach to the interpretation of the current findings. It is still plausible that the patterns
Page 248
230
of mediation found in the cross-sectional analyses do hold across time but were not
detected in the current study due to a variety of factors. The following section briefly
addresses these factors, some of which were unique to this study and a number of which
generalise to other studies which have also tested the hypothesised causal chain of
events between perceptions, coping, and mental health.
The current study sample size and characteristics are very likely to have
influenced the current results. The final sample was fairly homogenous and consisted of
a largely independent, well-functioning, well-resourced group of older adults. Almost
74 percent of participants at Time 2 were under the age of 75 years and a substantial
proportion (91%) reported no or only mild stress associated with life events that may
have occurred between the first and second waves of data collection. SPA and coping
mechanisms are hypothesised to be activated by meaningful health- or other age-related
events which give particular salience to one’s own ageing beliefs. Given the absence of
such events for the majority of these participants, in addition to the short timeframe in
which they were assessed, it is not entirely surprising that (i) the magnitude of the effect
sizes found for all of the mediation models were small, and (ii) that meaningful
differences were not observed at follow-up. Statistical power for detecting small
changes is also likely to have been compromised by the smaller sample size at Time 2.
The ways in which the sample size and makeup may have limited the current findings
are discussed further in Chapter 13.
Indeed, given that significant indirect effects were observed at all in the current
study, and that several of these effects did hold across time despite the make-up and size
of the sample suggests that coping might be a viable mechanistic pathway through
which SPA indirectly influences mental health. It is conceivable that by extending on
the current research and examining how these relationships unfold in other older adult
populations, for instance, in lower socioeconomic groups or in populations where health
threats are more imminent, stronger and more enduring effects might be found. This
may be one consideration for future research. Drawing on observations from the illness
perceptions literature, the ways in which coping is measured may also need to be
considered in future studies. For instance, as discussed at length in Chapter 4, there are
numerous ways in which coping is conceptualised and measured, which may partly
account for the mixed findings reported in the illness perceptions literature. Wurm and
colleagues (2013) identified that a specific coping mechanism, that is, the use of SOC
strategies for leading a healthy lifestyle, helped to explain the effects of negative SPA
Page 249
231
on health. By contrast, the current study utilised more generic measures of coping, none
of which were focussed on coping in the context of ageing.
In their meta-analytic review of illness perceptions and coping, Dempster and
colleagues (2015) suggested that the small changes observed longitudinally in both
illness perceptions and coping may be a reflection of mediation processes occurring in
such a brief period of time that it is very difficult, if not impossible to capture. It is
possible that similar difficulties will arise for investigations of the SPA-coping
relationship. However, Singh (2011) found that while survey data detected only small
mediation effects, qualitative measures tapped into the processes in a much more in-
depth and substantive manner, revealing how an understanding of an illness guided the
selection of coping strategy which then linked to the illness outcome (and appraisal of
the outcome). It is possible that quantitative measures, such as the ones adopted for the
current study, are too insensitive to capturing meaningful change. The adoption of open-
ended interviews may prove more sensitive to differences and thus provide a clearer
indication of the ways in which coping serves to influence the SPA-mental health
relationship.
There were a number of other limitations for the current study which also need to
be acknowledged. For instance, because this study was purely observational, all of the
associations in the mediation models were susceptible to confounding and
epiphenomenal associations which potentially threatened the validity of any causal
claims. While statistical controls were applied to the models, it does not entirely
eliminate other potential sources of confounding or epiphenomenal associations (Hayes,
2013). Further, time constraints associated with this project prohibited examination of
change over a longer timeframe (i.e. years) which may also have hindered the capture of
meaningful difference in any of the variables tested in the mediation analyses. This last
issue is discussed further in Chapter 13.
However, perhaps the most significant challenge was the inclusion of a large
number of variables and the potential problems associated with not controlling for the
multiple tests (i.e. possibility of false-positive results). Insofar as we are aware of these
issues, because of the exploratory nature of this study, strictly adjusting for multiple
comparisons is less critical (Althouse, 2016; Rothman, 1990). While the theoretical
basis for examining these mediation pathways was sound, drawing on a core assumption
of the self-regulation model which informed how SPA were conceptualised in the
current study, there was insufficient preliminary evidence within the SPA literature to
Page 250
232
focus in on certain dimensions of SPA or aspects of mental health. Thus, because of the
number of unadjusted tests, all of the positive results in the current study must be
treated as speculative at this stage. Future confirmatory investigations, which might be
guided by the current study results, will be required in order to establish these
relationships.
11.6 Conclusion
The current study sought to examine whether certain coping mechanisms would
influence the relationships between multiple dimensions of SPA and multiple measures
of mental health in a group of older, community-dwelling Australian adults. The
mediation models analysed in the present study were based on the theoretical model of
self-regulation that was originally applied to the field of health and illness and which
has been adapted to investigate SPA in more recent years. To the best of our knowledge,
this is the first study to test whether certain psychosocial resources might indirectly
influence the relationships between ageing experiences (as measured with the APQ) and
mental health. The findings from this exploratory study offer some interesting
preliminary insights into the role that coping plays especially given the limited research
within this area. Despite the small effect sizes and the limited evidence for the stability
of these effects in the current study, the mediation patterns which were found are
theoretically feasible and indicate that further research in this area is warranted,
particularly within older populations that are less well-functioning and independent.
The clinical implications regarding the current findings are discussed in Chapter
13. Another core aim of this thesis, however, is to examine whether personality may
moderate relationships between SPA and mental health (again, drawing on the self-
regulation framework which suggests that aspects of the self may moderate the self-
regulation process: H. Leventhal et al., 1998). The following chapter (12) examines
whether any evidence for these moderating effects is present in the data set.
Page 251
233
Chapter 12
A cross-sectional investigation of SPA and mental
health in older Australian adults: The
moderating effects of disposition
Page 252
234
12.1 Introduction
The aim of this final study was to establish whether dispositional traits might
influence the relationship between SPA and mental health in this group of older,
community-dwelling Australian adults. If, as Hooker and McAdams (2003) suggest,
personality is a key driving force behind all antecedents of successful ageing, then it is
highly probable that dispositional traits determine not only how ageing experiences are
perceived (e.g. Bryant et al., 2014; Shenkin et al., 2014) but also influence how SPA
drives the various aspects of mental health.
The CSM posits that the self-regulation process is likely to be moderated by
aspects of the self (H. Leventhal et al., 1998). More specifically, Leventhal and
colleagues have argued that the process whereby coping mediates the association
between illness perceptions and outcomes is moderated by factors such as personality
(i.e. moderated mediation or conditional process analysis: Hayes, 2013). A preliminary
examination of the current data set using conditional process modelling, however, did
not result in any significant findings. As discussed in Chapter 11, the makeup of the
current study sample (i.e. relatively small sample of largely independent, well-
functioning individuals) is likely to have influenced the mediation study results.
Unsurprisingly, more complex models that incorporate both multiple mediating and
moderating variables require even larger sample sizes than would be required for testing
mediation or moderation independently. Thus, while it is still theoretically feasible that
personality moderates the SPA-coping-mental health chain of events, it is very likely
that the current study sample was too small to detect these processes. Given the sample
size limitations, the present study instead focussed on whether two dispositional traits in
particular would moderate relationships between multiple dimensions of SPA (as
conceptualised within the CSM framework) and a select number of mental health
variables.
As discussed in Chapter 5, only one study has examined the influence of
neuroticism on the relationship between SPA (specifically, subjective age) and mental
health. Hubley and Hultsch (1994) reported that the association between a desire to be
younger and affective states was influenced by neuroticism although they did not report
how varying levels of neuroticism might differently influence the relationship. Although
there are no other studies to draw upon which have investigated these pathways, we
Page 253
235
were interested in whether neuroticism might influence the association between SPA
and life satisfaction. Life satisfaction is a reflective appraisal of one’s life more broadly
(Diener, 2006) which is understood to be determined by a host of factors beyond health
and independence (Good, La Grow, & Alpass, 2011; Siedlecki et al., 2008). This aspect
of subjective wellbeing was chosen in particular given the sociodemographic and health
characteristics of the current group of older adults. Further, as discussed in Chapter 4,
neuroticism has consistently been linked to lower levels of life satisfaction across the
lifespan (Siedlecki et al., 2008) and is likely to influence how people manage age-
related changes.
As detailed in Section 5.4.2, while the empirical evidence is limited, higher levels
of optimism have been found to protect against the detrimental effects (including higher
levels of depressive symptoms) of less favourable perceptions of ageing (e.g. Wurm &
Benyamini, 2014) and illness (e.g. Hurt et al., 2014; Karademas et al., 2011). Within the
illness perceptions literature, it has also been reported that higher levels of optimism
actually weaken the positive effects of more favourable illness beliefs on outcomes
(Karademas et al., 2011), a finding that was unanticipated. The current study sought to
establish whether similar patterns would be observed between SPA and psychological
distress in the current group of older adults when generalised optimism was treated as
the moderating variable.
12.2 Hypotheses
Based on the empirical evidence reviewed in Section 5.4.2 and on evidence
regarding neuroticism and life satisfaction more broadly within older populations (as
discussed in Chapter 4), the following hypotheses were made:
1. Neuroticism and generalised optimism will moderate associations for SPA with
life satisfaction and psychological distress, respectively.
2. Higher levels of neuroticism will dampen the positive associations between
more favourable perceptions of ageing (i.e. consequences-positive and control)
and life satisfaction.
3. Higher levels of neuroticism will exacerbate the negative associations between
less favourable perceptions of ageing (i.e. timeline-chronic, consequences-
negative, and emotional representations) and life satisfaction.
Page 254
236
4. Higher levels of generalised optimism will buffer the positive associations
between less favourable perceptions of ageing (i.e. timeline-chronic,
consequences-negative, and emotional representations) and psychological
distress.
5. Higher levels of generalised optimism will dampen the negative associations
between more favourable perceptions of ageing (i.e. consequences-positive and
control) and psychological distress.
12.3 Method
The hypotheses outlined in Section 12.2 were addressed with a cross-sectional
analysis of the Time 1 data. The participant information, research procedure, and survey
measures are described in Chapter 7. In short, six subscales (timeline-chronic,
consequences-positive, consequences-negative, control-positive, control-negative,
emotional representations) of the APQ (Barker et al., 2007) were used to assess SPA
while two measures were used to assess mental health. Specifically, life satisfaction and
psychological distress were measured with the SWLS (Diener et al., 1985) and the
DASS21 (Lovibond & Lovibond, 1995), respectively. Further, two disposition measures
were utilised. Neuroticism was assessed with a scale derived from the IPIP (Goldberg,
1992) while generalised optimism was assessed with the LOT-R (Scheier et al., 1994).
12.3.1 Analysis of data
Descriptive statistics and correlation coefficients for all of these variables are
presented in Table 17. Sociodemographic and subjective health-related variables were
used as covariates (see Table 2 in Chapter 7 for the descriptive statistics for these
variables).The six dimensions of SPA (timeline-chronic, consequences-positive,
consequences-negative, control-positive, control-negative, emotional representations)
were treated as the independent variables (IVs) in all of the models. The two measures
of mental health (life satisfaction, psychological distress) were treated as the dependent
variables (DVs) while the dispositional traits of neuroticism and generalised optimism
were entered in the analyses as the moderating variables (MVs). As stated in Chapter
11, the hypothesised direction of the relationship between SPA and mental health was
guided by both theory (H. Leventhal et al., 2008; Levy, 2009) and empirical evidence
(i.e. Sargent-Cox et al., 2012b; Wurm et al., 2007).
Page 255
237
Correlations among the SPA, dispositional traits, and mental health variables were
calculated using Pearson’s correlations. To control for Type I error, the multiple
correlation coefficients were tested at the two-tailed significance level that was less than
or equal to .001 (Gravetter & Wallnau, 2013). Moderation analyses were conducted in
SPSS using the PROCESS macro (model 1) developed by Hayes (2013). As outlined in
Chapter 11, PROCESS is a path analysis tool which estimates model coefficients using
ordinary least squares (OLS) regression. In a conceptual model of moderation, an
independent variable (X) exerts a causal influence on a dependent variable (Y) but this
effect is dependent or conditional in some way (i.e. variation in the size or sign of
effect) on the moderating variable (M). Statistically, a linear moderation model is
represented as:
Ŷ = iY + b1X + b2M + b3XM + eY
Where Ŷ is the estimated value of Y, iY is equal to the intercept of the regression line, eY
is the error in the estimation of the M and Y variables, and b1, b2, and b3 are the
regression coefficients for each variable in the model. XM is the interaction term which
is constructed as the product of X and M (Hayes, 2013, 2012, 2016). According to
Hayes (2013), a significant association between X and Y is not required in order for X’s
effect to be moderated. This approach was used to test whether the magnitude of the
SPA dimensions’ effects on mental health would be influenced by dispositional traits.
The conceptual and statistical diagrams representing this pathway are shown in Figure
9.
Page 256
238
Figure 9. Path diagrams representing (A) a conceptual model of moderation, whereby X
exerts a causal influence on Y but this effect is conditional on M, and (B) a statistical
model of moderation, whereby the interaction term (XM) is constructed as the product
of X and M, providing a measure of the moderation effect (Hayes, 2013).
More specifically, as the six dimensions of SPA were assessed independently, 12
moderation analyses were conducted to explore (i) each of the SPA variables and
neuroticism as predictors of life satisfaction, and (ii) each of the SPA variables and
optimism as predictors of psychological distress. PROCESS (Hayes, 2013)
simultaneously models multiple conditional effects and provides bias-corrected 95%
bootstrap confidence intervals (CIs) to guide inference. The advantages to using
bootstrapping are described in Section 11.3.2. For the current analyses, 10,000 bootstrap
samples were requested and the covariates (i.e. age, gender, partner status, education
level, income level, self-rated health, and number of self-reported medical conditions) in
each model were entered as covariates of both M and Y variables. All of the independent
variables and interaction terms were mean centred. If the CI for the interaction effect
Page 257
239
(b3) did not cross zero, X’s effect on Y was understood to vary as a function of M, thus
supporting a claim of moderation. PROCESS also generates the proportion of the total
variance in the outcome which is uniquely attributable to the interaction (∆R2) (Hayes,
2012), providing a measure of the effect size when the interaction is added to the model.
A finding of a moderation effect does not delineate the point at which the effect of
the moderator is no longer significant. To establish where in the distribution of the
moderator that SPA had an effect on mental health and where it did not, additional
inferential tests were carried out. Specifically, for models which demonstrated
significant interactions, the conditional effects were probed at different levels of the
moderator using simple slopes analysis. As the moderator variables are continuous, the
conditional values of neuroticism and generalised optimism were selected according to
the recommendation of Cohen and colleagues (J. Cohen, Cohen, West, & Aiken, 2003).
That is, estimates of the conditional effect of X on Y were computed for when M was
equal to the mean, when M was one standard deviation below the mean, and when M
was one standard deviation above the mean, representing average, relatively low and
relatively high levels, respectively, of neuroticism and generalised optimism (Hayes,
2013).
Fritz and Arthur (2017) outline four types of moderation effects. Specifically,
when the regression coefficients for the IV (X) and interaction term (XM) have opposite
signs, increasing values of the moderator result in a decreasing effect of the IV on the
DV (Y). This will produce either a buffering (i.e. harmful relationship is decreased) or
dampening (i.e. beneficial relationship is decreased) interaction effect. By contrast,
when regression coefficients of the IV and interaction term share the same sign (either
positive or negative), increasing values of the moderator serve to increase the effect of
the IV on the DV. This interaction can be viewed as either synergistic (i.e. beneficial
relationship is increased) or exacerbating (i.e. harmful relationship is increased).
12.4 Results
Descriptive statistics and correlations for each variable being tested are shown in
Table 17. The correlations for SPA with mental health and the dispositional traits are
reported in Chapter 10. As expected, the relationships between the mental health and
dispositional trait variables were all significant (at the .001 α level) and demonstrated
Page 258
240
strong effect sizes. Life satisfaction was negatively related to neuroticism while being
positively related to generalised optimism. Conversely, psychological distress was
positively related to neuroticism while being negatively related to generalised optimism.
Page 259
241
Table 17
Descriptive statistics and zero-order correlations for all of the moderation model variables
Note. TCR = timeline-chronic; PCSQ = consequences-positive; NCSQ = consequences-negative; PCON = control-positive; NCON = control-negative; ER = emotional
representations; LS = life satisfaction; PD = psychological distress; NEU = neuroticism; OPT = generalised optimism.
***p ≤ .001.
Correlations
Variable M SD N 1 2 3 4 5 6 7 8 9
1. TCR 2.71 0.77 368
2. PCSQ 3.83 0.58 368 -.12
3. NCSQ 2.82 0.73 368 .52*** -.21***
4. PCON 4.17 0.52 368 -.25*** .27*** -.33***
5. NCON 3.51 0.68 368 -.42*** .21*** -.48*** .40***
6. ER 2.18 0.73 368 .46*** -.25*** .53*** -.41*** -.39***
7. LS 25.46 6.35 363 -.29*** .16 -.33*** .33*** .24*** -.44***
8. PD 55.92 14.53 360 .28*** -.14 .40*** -.33*** -.25*** .48*** -.45***
9. NEUR 22.35 7.43 365 .36*** -.22*** .37*** -.32*** -.23*** .63*** -.55*** .64***
10. OPT 22.67 4.90 367 -.43*** .17*** -.43*** .42*** .38*** -.50*** .51*** -.51*** -.58***
Page 260
242
12.4.1 Moderation analyses
As stated in Section 12.3.1, 12 moderation analyses were conducted using
PROCESS (Hayes, 2013). The first six models tested each of the SPA variables
independently as the IVs and neuroticism as the MV as predictors of life satisfaction
(DV) and the next six models tested each of the SPA variables independently (IVs) and
generalised optimism (MV) as predictors of psychological distress (DV). Only
significant results are reported here. The full model summary information (including
covariates) for each of the models with significant interaction effects are presented in
Appendix G. All model coefficients have been reported in their unstandardised (B)
metric (as recommended by Hayes, 2013).
12.4.1.1 Linear models predicting life satisfaction from SPA and neuroticism
Six separate models were tested; one for each of the SPA subscales. The overall
models for timeline-chronic (F(10, 332) = 18.47, p < .001, R2 = .37), consequences-
positive (F(10, 332) = 19.32, p < .001, R2 = .37), consequences-negative (F(10, 332) =
20.36, p < .001, R2 = .38), and emotional representations (F(10, 332) = 19.59, p < .001,
R2 = .38) were significant, each accounting for between 37% and 38% of the overall
variance in life satisfaction scores. However, no significant interaction effects were
found between these four SPA subscales and neuroticism. That is, neuroticism was not a
significant moderator of the associations between these dimensions of SPA and life
satisfaction. Therefore, we focus on the results for the two control dimensions of SPA.
The overall model for control-positive was significant, (F(10, 332) = 27.22, p <
.001) and explained 42% of the variance in life satisfaction. Control-positive was an
independent predictor of life satisfaction (B = 2.06, SE = .64, t(9, 333) = 3.20, CI95 =
0.796, 3.332) and there was a significant interaction between control-positive and
neuroticism (B = .20, SE = .06, t(10, 332) = 3.34, CI95 = 0.082, 0.317, ∆R2 = .02). That
is, the moderation component of this model explained 2% of the variance in life
satisfaction scores. When the conditional effect of control-positive on life satisfaction
was probed, significant positive relationships were found at both moderate and high
levels of neuroticism (B = 3.53, SE = .78, t(10, 332) = 4.54, CI95 = 2.000, 5.055). At low
levels of neuroticism, there was no moderating effect (B = 0.60, SE = .78, t(10, 332) =
0.77, CI95 = -0.939, 2.140). As illustrated in Figure 10a, at high levels of neuroticism,
Page 261
243
the association between perceptions of control over the positive aspects of ageing and
life satisfaction was enhanced (i.e. synergistic interaction). While low levels of
neuroticism were associated with the highest life satisfaction scores, this association
remained fairly stable whether at relatively low or high levels of control-positive. That
is, the relationship between control-positive and life satisfaction was not significantly
different from zero for individuals with low levels of neuroticism.
For control-negative, the overall model was significant, (F(10, 332) = 25.56, p <
.001) and accounted for 38% of the variance in life satisfaction. Control-negative was
not a significant independent predictor of life satisfaction however a significant
interaction between control-negative and neuroticism was found (B = 0.10, SE = .05,
t(10, 332) = 2.07, CI95 = 0.005, 0.191) in which the moderation component of the model
explained 1% of the variance in life satisfaction scores (∆R2 = .01). Further inspection
of the conditional effect of control-negative on life satisfaction revealed a significant
positive relationship at high levels of neuroticism (B = 1.44, SE = .72, t(10, 332) = 2.00,
CI95 = 0.025, 2.851) but non-significant positive relationships at moderate (B = .72, SE
= .52, t(10, 332) = 1.38, CI95 = -0.304, 1.749) and low (B = .01, SE = .52, t(10, 332) =
0.01, CI95 = -1.012, 1.025) levels of neuroticism. As shown in Figure 10b, a synergistic
interaction effect was found whereby the relationship between perceptions of control
over negative aspects of ageing and life satisfaction was enhanced for people with high
levels of neuroticism. The relationship was not significantly different from zero for
individuals with low and moderate levels of neuroticism.
Page 262
244
Figure 10. Conditional effect of control-positive on life satisfaction (A) and control-
negative on life satisfaction (B) at different levels of neuroticism, and of control-
positive on psychological distress (C) and emotional representations on psychological
distress (D) at different levels of generalised optimism.
Note. N = 343 (Panels A and B). N = 340 (Panel C). N = 339 (Panel D). All analyses adjusted for gender,
age, partner status, education, income, self-rated health, and number of self-reported medical conditions.
12.4.1.2 Linear models predicting psychological distress from SPA and optimism
A separate model for each of the SPA subscales was tested. The overall models
for timeline-chronic (F(10, 330) = 14.29, p < .001, R2 = .37), consequences-positive
(F(10, 330) = 12.52, p < .001, R2 = .37), consequences-negative (F(10, 330) = 15.21, p
< .001, R2 = .38), and control-negative (F(10, 330) = 13.02, p < .001, R
2 = .37) were
significant, with each model explaining between 37% and 38% of the overall variance
in psychological distress scores. No significant interaction effects, however, were found
between these four SPA dimensions and generalised optimism. However, interaction
effects were found for relationships between two of the SPA subscales and
psychological distress.
Page 263
245
The overall model for control-positive was significant, (F(10, 330) = 14.08, p <
.001), accounting for 38% of the variance in psychological distress. Control-positive
was not a significant independent predictor of psychological distress however there was
an interaction between control-positive and generalised optimism (B = .46, SE = .18,
t(10, 330) = 2.55, CI95 = 0.104, 0.809, ∆R2 = .01). The moderation component of the
model explained 1% of the variance in psychological distress scores. When the
conditional effect was scrutinised, a significant negative relationship was found between
control-positive and psychological distress when generalised optimism was low (B = -
4.24, SE = 1.62, t(10, 330) = -2.61, CI95 = -7.423, -1.049) but no moderating effect was
observed when generalised optimism was at moderate (B = -2.04, SE = 1.19, t(10, 330)
= -1.69, CI95 = -4.382, 0.308) or high (B = .16, SE = 1.31, t(10, 330) = 0.12, CI95 = -
2.409, 2.734) levels (as illustrated in Figure 10c). Specifically, the association between
control over the positive aspects of ageing and psychological distress was found only
for individuals with low levels of generalised optimism. At moderate and high levels of
generalised optimism, the relationship between control-positive and psychological
distress was not significantly different from zero. Thus, higher levels of generalised
optimism dampen the positive effect that increased perceptions of control over ageing
experiences has on levels of psychological distress.
For emotional representations, the overall model was significant, (F(10, 330) =
18.07, p < .001) and explained for 41% of the variance in psychological distress.
Emotional representations was an independent predictor of psychological distress (B =
3.55, SE = .94, t(9, 329) = 3.77, CI95 = 1.696, 5.396) and there was a significant
interaction between emotional representations and generalised optimism (B = -.33, SE =
.13, t(10, 330) = -2.59, CI95 = -0.577, -0.079, ∆R2 = .01), whereby the moderation
component of the model explained 1% of the variance in psychological distress scores.
Further inspection of the conditional effect of emotional representations on
psychological distress revealed significant positive relationships at low (B = 5.13, SE =
1.17, t(10, 330) = 4.37, CI95 = 2.819, 7.434) and moderate levels of generalised
optimism but a non-significant positive relationship at high levels of generalised
optimism (B = 1.96, SE = 1.07, t(10, 330) = 1.84, CI95 = -0.135, 4.064). That is, the
association between negative emotional responses generated to ageing and
psychological distress was strongest in individuals with low or moderate levels of
Page 264
246
generalised optimism. However, high levels of generalised optimism buffered this
association (see Figure 10d).
12.5 Discussion
The aim of the present study was to establish whether the dispositional traits of
neuroticism and generalised optimism would moderate the effects of SPA on life
satisfaction and psychological distress, respectively. To the best of our knowledge, this
is the first study to have examined these pathways within the CSM framework for
ageing and therefore contributes to the currently limited knowledge base regarding how
personality influences the associations between SPA and mental health. As
hypothesised, both neuroticism and generalised optimism did moderate a number of the
relationships between the SPA dimensions and mental health. While the findings
regarding the influence of generalised optimism on the SPA-psychological distress
relationships were consistent with previous research, those found for the moderating
role of neuroticism were a little more intriguing.
Out of the six SPA models tested, only perceptions of control over both the
positive and negative aspects of ageing were identified as interacting with neuroticism
to influence levels of life satisfaction. The control-positive dimension was an
independent predictor of life satisfaction and, as expected, individuals who reported less
neurotic traits and perceived greater control over the positive aspects of ageing had the
highest levels of life satisfaction. While control-negative did not independently predict
life satisfaction, individuals with lower levels of neuroticism were also found to have
the highest life satisfaction scores (regardless of how much control they perceived over
negative aspects of ageing). These findings were unsurprising given the literature
regarding neuroticism and its health correlates in both younger and older adult
populations (e.g. Lahey, 2009; Ready et al., 2012). What was surprising, however, was
that contrary to the hypothesis that higher levels of neuroticism would weaken
associations between more favourable perceptions of ageing and life satisfaction, the
positive relationships between the two control dimensions and life satisfaction were
actually enhanced by higher levels of neuroticism.
Higher levels of neuroticism have been strongly linked to a wide range of poorer
mental health outcomes (Lahey, 2009) and has been one of the few consistently robust
Page 265
247
markers of lower life satisfaction (Siedlecki et al., 2008). The finding that higher levels
of negative emotionality actually enhanced the positive effects of SPA on life
satisfaction therefore seems counterintuitive. However, a number of researchers have
suggested that associations between health and neuroticism are actually more complex
than our current understanding suggests and that more sophisticated investigations
which examine multiple causal and interacting mechanisms are needed to better grasp
these relationships (Friedman & Kern, 2014; Yap, Anusic, & Lucas, 2012). Indeed,
there is a growing body of work which suggests that in certain circumstances, higher
levels of neuroticism may actually be beneficial for health and wellbeing (Chapman,
Roberts, & Duberstein, 2011; Friedman, 2000; Weston & Jackson, 2015). One
interesting avenue of research which has now opened up focusses on how the various
personality traits interact with one and another to better predict health outcomes.
A number of studies have reported that higher levels of neuroticism paired with
higher levels of conscientiousness, a combination that has been termed healthy
neuroticism, is protective against harmful health behaviours and outcomes (e.g.
Terracciano & Costa, 2004; Turiano et al., 2012; Turiano, Mroczek, Moynihan, &
Chapman, 2013; Vollrath & Torgersen, 2002; Weston & Jackson, 2015). Two and
three-way interactions among the traits of conscientiousness, extraversion, and
neuroticism have also been found to protect against psychological distress disorders,
depending on the various combinations (e.g. Dinovo & Vasey, 2011; Naragon-Gainey
& Simms, 2017; Vasey et al., 2013; Verstraeten, Vasey, Raes, & Bijttebier, 2009). For
instance, greater vigilance about health threats (i.e. high neuroticism) coupled with
planning and other goal-directed behaviours (i.e. high conscientiousness) might
mobilise individuals to seek treatment sooner than individuals low in conscientiousness.
The mental health risks associated with negative emotionality might also be minimised
in individuals who are more social, assertive, and open to experiencing positive
emotions (i.e. high extraversion). While these studies are not specific to older
populations, they nonetheless offer some insight into the different ways in which people
high in neuroticism may respond to health-related information.
Participants in the current study were found to be a fairly well functioning group
of individuals (as reported in Chapters 8-11) which lends weight to the possibility that
very few would be high in negative emotionality while being low on other dispositional
traits. While levels of extraversion were not assessed in the current study, the majority
Page 266
248
of participants were actively engaged in, and satisfied with, their social networks. It is
therefore plausible that a substantial proportion of the study participants might also be
high in levels of extraversion. Mean levels of neuroticism were not high for this group
of older adults (see Chapter 10) however this is not an especially uncommon finding for
older populations. Various studies have shown that neuroticism decreases (and
conscientiousness increases) as people age (Leszko, Elleman, Bastarache, Graham, &
Mroczek, 2015; Mroczek & Spiro, 2003). However, given the lower levels of
neuroticism overall and the fairly small sample size, the finding that even a small
amount of variance is explained by neuroticism does suggest that further examination of
these pathways are warranted. In particular, future research might examine how various
combinations of these personality traits interact to influence how perceived control over
factors such as social life, independence, and mobility relates to mental health in less-
well functioning segments of the older adult population.
As expected, generalised optimism buffered the positive relationship between
negative emotional responses generated to ageing and psychological distress. This is
consistent with the finding reported by Wurm and Benyamini (2014) where higher
levels of optimism attenuated the positive relationship between perceptions of age-
related physical losses and depressive symptoms. Similar findings have also been
reported in the illness perceptions literature (e.g. Hurt et al., 2014; Karademas et al.,
2011). For the current study, at all levels of optimism, fewer feelings of depression and
anger when thinking about getting older were associated with less psychological distress
more generally. However, as negative emotional responses to thoughts of ageing
increased, only those with high levels of optimism maintained low levels of distress.
Given that higher levels of generalised optimism represent a general propensity to
expect good rather than bad outcomes, it is unsurprising that future oriented thoughts
about ageing would generate fewer negative emotional responses in this group of
individuals. However, this general propensity to expect positive outcomes may also
account for the finding that higher levels of optimism weakened the positive effect of
more favourable SPA on psychological distress.
While perceptions of control over the negative aspects of ageing were negatively
related to psychological distress for people with lower levels of generalised optimism,
this was not the case for those with moderate to high levels of the dispositional trait.
Karademas and colleagues (2011) reported a similar phenomenon whereby high levels
Page 267
249
of optimism actually weakened the effects of positive illness perceptions on levels of
helplessness. The authors speculated that one explanation for this counterintuitive
finding is that optimistic individuals are guided more by their generalised expectations
than by specific illness-related information or current health status. Along the same line,
it may be that for the current group of older adults with higher levels of optimism, age-
related information is less meaningful than general expectations of good outcomes
which motivate efforts to attain desired goals or outcomes (Solberg Nes & Segerstrom,
2006). As generalised optimism is understood to guide more adaptive self-regulatory
responses to prevent or limit adverse outcomes (Aspinwall, 2005; Conversano et al.,
2010), it might be informative to explore its influence on relationships between SPA
and mental health in other older adult populations who are facing more objective
stressors than the current group of participants.
A significant limitation for the current study was that it was constrained by its
smaller sample size which, as described more fully in Chapter 13, was due to a lack of
access to a larger pool of older adults. Detecting moderation effects in particular
requires high statistical power because interaction effects generally explain much less
variance than main effects (Fritz & Arthur, 2017). It is probable that a larger sample
size resulting in increased statistical power would have produced a larger number of
stronger effects than were found in this study. Indeed, both the sample size and makeup
are likely to account not just for the current findings but also for the lack of any
conditional process effects (as described in Section 12.1). While the amount of variance
explained by each of the moderators in the current study was small, the findings
nonetheless demonstrate that personality does influence how older adults’ perceptions
of their own ageing relate to mental health indicators. It therefore remains theoretically
feasible that the assumptions of the CSM model (i.e. moderated-mediation processes)
might be relevant to an aging context. Future researchers with larger study samples and
a less homogenous group of older adults might therefore explore how generalised
optimism and other personality variables moderate relationships between SPA and
coping and how this in turn influences mental health outcomes.
The same methodological limitations that were outlined in Chapters 8 – 10 apply
to the current study. The sampling method used means that the findings cannot be
generalised to the older Australian population. Ideally, these relationships would be
explored over time to examine how they might change, and for whom, when older
Page 268
250
adults are faced with increasing age- and health-related stressors. The current study
findings suggest, however, that both neuroticism and generalised optimism deserve
greater attention. Examining the effects of other dispositional traits that were not
examined in the current study, such as conscientiousness and extraversion could also be
potentially theoretically interesting. Extraversion was not assessed in this cohort of
older adults and the decision to not explore conscientiousness further in this study was
guided by multiple comparisons protocol. Further, as discussed in Chapter 10, cohort
effects and the method of data collection may have potentially limited this study,
particularly given issues around data sensitivity for older populations and self-report
measures. These issues are discussed further in Chapter 13.
12.6 Conclusion
The current study aimed to establish whether neuroticism and generalised
optimism would influence relationships between the six dimensions of SPA (as
measured with the APQ) and two mental health indicators, namely, life satisfaction and
psychological distress. To the best of our knowledge, this is the first study to have
investigated these relationships. While the effects found were small, they nonetheless
provide some direction for future researchers who might wish to examine similar
relationships in other, possibly less well-functioning segments of the older adult
population. It is quite probable that the characteristic makeup of this group of older
adults limited and shaped the overall findings. However, understanding how
psychosocial mechanisms operate to influence health and wellbeing in well-functioning
older populations, that is, successful agers, is increasingly important. As argued in
Chapter 2, the aim of geriatric researchers whose focus is on lifespan development and
successful ageing is to establish what amenable factors differentiates those older adults
who report good mental health and wellbeing from those that do not.
Thus, this study (along with the studies in Chapter 8 -11) provides some
preliminary evidence regarding how the various dimensions of ageing not only relate to
mental health functioning in successful agers, but also influence and interact with other
key psychosocial mechanisms which may be amenable to change. The clinical
implications of all the findings reported within this thesis are discussed in Chapter 13
along with future directions for this avenue of research.
Page 269
251
Chapter 13
General discussion
Page 270
252
13.1 Introduction
The overarching aim of this doctoral thesis was to better understand how certain
psychosocial mechanisms operate to influence relationships between SPA and mental
health in older Australian adults. Guided by two core assumptions of the Common-
Sense Model (CSM: H. Leventhal et al., 1998) of self-regulation, which posit both
causal and interaction mechanisms, this thesis aim was achieved by investigating
whether (i) coping resources would serve as mediating variables to explain how SPA
influences mental health, and (ii) whether certain dispositional traits would act as
moderating variables to explain for whom SPA has the strongest effect on mental health.
This chapter summarises the major findings of this thesis in reference to the
research questions that were stated in Section 1.4. Specifically:
1. Is the self-regulatory framework adopted for this investigation an appropriate
model for understanding SPA in this sample of older Australian adults?
2. How are SPA related to sociodemographic factors and subjective health status
and will these relationships differ across groups?
3. How are SPA related to mental health and will these relationships differ by age
or self-rated health status?
4. How are SPA related to psychosocial factors and will these relationships differ
by age or self-rated health?
5. Will coping mechanisms indirectly influence the relationships between SPA and
mental health over time?
6. Will dispositional traits moderate the relationships between SPA and mental
health?
The first research question was empirically investigated in the first cross-sectional
study (Chapter 8), which tested the psychometric properties of the Aging Perceptions
Questionnaire (APQ: Barker et al., 2007) and then compared and contrasted the current
findings with those reported in other studies that have utilised this measure of SPA. The
second cross-sectional study (Chapter 9) investigated the second research question by
testing the relationships for the six dimensions of SPA with sociodemographic
characteristics and subjective health status, and exploring whether any group differences
would emerge. The third and fourth research questions were empirically investigated
Page 271
253
cross-sectionally in the third study (Chapter 10). This study examined relationships for
SPA with the mental health and psychosocial variables of interest, and examined
whether different patterns in these relationships would emerge for different age and self-
rated health status groups. The major findings from each of these preliminary studies
are summarised in Section 13.2.1.
The fifth and sixth research questions were addressed in studies four and five
(Chapters 11 and 12), respectively. A two-wave research design was employed in study
four to examine whether coping would mediate relationships between the six
dimensions of SPA and the four mental health indicators cross-sectionally, and further,
whether any patterns of mediation observed in the first phase of investigation would be
replicated during the second phase (12-month follow-up) when change in scores within-
individuals were assessed. The fifth and final cross-sectional study examined whether
two dispositional traits would, independently, moderate relationships among the six
SPA dimensions and two measures of mental health. Section 13.2.1 provides a summary
of the major findings from each of these studies.
Following a summary of the major research findings, which includes suggestions
for future research directions, the theoretical implications of this study are addressed.
This is followed by a brief discussion regarding the clinical applications of the current
findings and the thesis limitations. This chapter will close with the thesis conclusions.
13.2 Empirical findings of this thesis
13.2.1 Utilising a self-regulation framework to investigate correlates of SPA
Prior to the turn of this century, there had been a distinct lack of theorising on
subjective ageing constructs such as SPA (Diehl et al., 2015) and consequently, very
little development of more sophisticated measures to capture these ageing experiences.
SPA are often conceptualised as a process underpinning adaptation, and therefore an
indicator of self-regulation (Kleinspehn-Ammerlahn et al., 2008). In 2007, Barker and
colleagues proposed that the CSM self-regulation framework could be applied to an
ageing context to investigate SPA and they subsequently developed the APQ to capture
the multiple dimensions of ageing experiences. While this measure has been adopted
fairly broadly within Europe (as outlined in Section 3.6), it has received less attention
within Australia. Thus, this thesis examined whether the CSM would be an appropriate
Page 272
254
conceptual framework for investigating SPA in a sample of independent, community-
dwelling older Australian adults and further, how this conceptualisation of SPA might
relate to sociodemographic characteristics, mental health and other psychosocial factors
in this cohort of older adults.
The findings from the first study provide preliminary evidence that the CSM is a
suitable theoretical framework for investigating SPA in older Australian adults. Each of
the APQ views about ageing subscales demonstrated good internal consistency and the
mean scores were largely congruent with those reported in international studies. Further,
a consistent and logical pattern of relationships among the APQ subscales demonstrated
that individuals do form common-sense interpretations of their own ageing experiences,
akin to the processes involved in illness perception formation. That is, this group of
older adults were actively engaged in self-regulatory processes of their own ageing
experiences, all of which go to maximising gains and minimising losses (P. B. Baltes &
Baltes, 1990). Further, while cross-cultural differences were not examined in this thesis,
the findings revealed that the current group of older adults perceive their own ageing
experiences in a similar fashion to their overseas counterparts. Comparatively, the
current group of participants exhibited slightly more favourable SPA than the European
subjects however this is likely to be an artefact of the current sample characteristics
more so than cultural difference, particularly given the less favourable SPA reported by
Yarmo-Roberts et al. (2010) for frailer, less independent older Australian adults.
Overall, the APQ proved to be a sound instrument for capturing SPA; however,
future investigations might consider utilising the brief version of the APQ (B-APQ:
Sexton et al., 2014) rather than the original version. The current study found no
meaningful difference between the two timeline subscales (i.e. cyclical and chronic).
The concept of cyclicality in an ageing context is not especially theoretically robust.
Unlike many instances of illness, ageing is a unidirectional process and while awareness
of it may appear to fluctuate over time, it is more probable that any shifts in feeling
younger or older are confounded with other factors that heighten one’s sense of ageing,
such as illness. Further, while findings within the broader field of subjective ageing
have demonstrated that attributing health-related changes to ageing does have clinically
meaningful implications (as discussed in Section 5.2.1), the identity subscale of the
APQ was found to be a poor measure of this construct in the current sample. It was
unrelated to the majority of other APQ subscales and demonstrated a ceiling effect.
Page 273
255
Both of these subscales have been removed from the B-APQ. Nonetheless, future
researchers might consider developing a more psychometrically sound version of the
identity subscale given the concept’s clinical importance. For instance, the most
common measure of illness perceptions provides a list of possible causes for illness
which respondents may select from. In contrast, the APQ asks whether respondents
believe health changes experienced are only related to, or due to the fact, of ageing. It is
feasible that this single question might serve to prime responses in the affirmative.
The findings from the second study indicated that individual differences in
sociodemographic factors explained very little of the variance in SPA. While ageing
experiences were related to chronological age, gender, education, income, and partner
status, and further, differences were observed among the groups, the effects were very
small. It is very plausible, however, that the homogeneity of the current sample and
potential cohort effects (i.e. ‘Baby Boomers’ comprised over a third of the sample)
shaped these findings. Chronological age, in particular, has been identified in other
studies as exerting an influence on subjective ageing experiences. Indeed, the mean
scores from this study demonstrated trends of increasing negative and decreasing
positive views of ageing as people aged. However, given that almost three quarters of
the current study participants were under 75 years of age and many were well-resourced
(in terms of education and income), the current findings suggest that these relationships
may be less meaningful in more independent, ‘younger-old’ populations of older adults.
Subjective health indicators, and in particular, global ratings of self-rated health
accounted for more variance in SPA than any of the sociodemographic factors, which is
consistent with the existing literature. Unsurprisingly, those that rated their health more
favourably and reported fewer medical conditions also reported more favourable ageing
experiences whereas those who rated their health more poorly and identified more
chronic medical conditions reported less favourable SPA. However, the two subjective
health indicators did not exert the same degree of influence on SPA; the magnitude of
the relationships between self-rated health and SPA were much larger than those found
between SPA and the number of chronic medical conditions reported. This finding
might be indicative of good primary health care management of chronic illness in this
sample. This was not explored in the current study however could be an interesting
avenue for future research. It may also, however, indicate that SPA are less influenced
Page 274
256
by actual health status and more so by perceptions of health (much like self-rated health
is more weakly associated with physical health as people age).
Empirical investigations of relationships for SPA with mental health and other
psychosocial factors in older adults have been scarce. The third study, therefore,
provides novel insights into these relationships. Overall, measures of subjective
wellbeing and psychological distress were related to the various dimensions of SPA in
the directions that were expected. That is, more favourable SPA were positively related
to more optimal levels of mental health functioning while less favourable SPA were
related to less optimal levels of mental health functioning. In general, happiness was
related more broadly to ageing experiences in the current sample of older adults
whereas distress was more specific to certain ageing perceptions. Yet it was also clear
from these findings that on average, this group of older adults experience quite good
mental health. These preliminary findings raise several questions which future
investigators might explore further. For instance, would the pattern of these
relationships look quite different in less well-functioning segments of the older adult
population? And is it SPA driving mental health functioning or vice versa? Neither of
these questions was tested in this study. While other research (e.g. Sargent-Cox et al.,
2012b; Wurm et al., 2007) has provided some evidence of causality whereby SPA
drives changes in physical heath, it is still conceivable that mental health actually exerts
more influence on subjective ageing experiences. It would be particularly interesting to
test the direction of these relationships over time in a less homogenous sample of older
adults. More recent advances in modelling techniques, such as the bivariate dual change
score model utilised by Sargent-Cox et al. (2012b) could be employed to examine
causal direction.
The relationships found for SPA with coping resources and dispositional traits
also demonstrated common-sense patterns. That is, more favourable SPA were
associated with more adaptive forms of coping, higher levels of conscientiousness, and
generalised optimism, whereas disengagement coping and neuroticism were associated
with less favourable SPA. When patterns of correlations between SPA and all the other
variables were examined in different self-rated health and age cohorts, only minor and
inconsistent differences were observed. However, in light of the earlier findings for self-
rated health in particular, these results are more likely to have been shaped by the
current sample, both in terms of its size and makeup. Indeed, the finding that this group
Page 275
257
of older adults, on average, utilised more engagement versus disengagement type
coping strategies, were more socially engaged, and had lower levels of neuroticism,
points to quite high levels of psychological flexibility overall (Kashdan & Rottenberg,
2010). This study, therefore, provides a preliminary snapshot of how these relationships
operate in more well-functioning older adults which can serve as a foundation for future
studies investigating more diverse populations of older adults.
Taken together, the findings from each of these studies demonstrate that, even in
well-resourced and well-functioning groups of older adults, SPA are sensitive to factors
such as subjective health, coping, and personality, and further, is meaningfully related
to mental health functioning. Rates of chronic disease reported by participants in the
current study were substantial (i.e. 68% reporting at least two or more chronic medical
conditions) yet ageing experiences were, on average, more favourable. This observation
suggests that this group of older adults are able to self-regulate their ageing experiences,
even when faced with certain challenges (such as chronic illness) which could trigger
thoughts about more permanent loss. The majority of the current sample would not meet
the criteria of the biomedical approach to successful ageing (e.g. Rowe & Kahn, 1987)
due to the number of chronic illnesses present. From a psychosocial approach, however,
which views ageing as a process of adaptation (von Faber et al., 2001), they are
successful agers. The question then remains…what factors contribute to this ability to
self-regulate one’s experiences to ageing in the presence of chronic disease and other
age-related challenges, likely enabling the maintenance of more optimal levels of
mental health?
As discussed in Section 2.2.3, the determinants of mental health are numerous and
operate in complex ways. Undoubtedly, factors outside of the self, such as
socioeconomic pressures, social exclusion, and poor healthcare access play a significant
part. By and large, the current group of older adults were not faced with such
challenges. However, factors within the self, many of which are more readily
modifiable, have also been identified as significant contributors to mental health
functioning, and self-regulation abilities more broadly. Thus, extending on the findings
from the first three studies, the aim of studies four and five was to examine whether
coping mechanisms and dispositional traits served to influence how this group of older
adults self-regulated their ageing experiences and subsequently maintained high levels
of mental health.
Page 276
258
13.2.2 Assumptions of the CSM framework applied to an ageing context
Drawing on two core assumptions of the CSM (H. Leventhal et al., 1998) and
applying them to an ageing context, studies four and five sought to establish whether
coping resources would mediate relationships between SPA and mental health
functioning, and further, whether these relationships might be moderated by personality.
In its entirety, the theoretical process of self-regulation outlined by Leventhal and
colleagues (1998) reflects a conditional process model (i.e. moderated mediation:
Hayes, 2013), and such effects were not detected in a preliminary investigation of the
current data set. However, given that very large samples are required to detect these
effects in more complex statistical modelling such as conditional process, this was not
entirely surprising. Instead, we focussed on two separate studies of mediation and
moderation. These pathways have not previously been tested anywhere for the APQ-
defined dimensions of SPA and as such, these studies were exploratory. The findings
from these two empirical studies provide some novel and important considerations into
how psychosocial mechanisms influence SPA.
The findings from study four provide a number of interesting insights. First, the
pattern of the relationships between the various dimensions of SPA and different coping
mechanisms conformed to the common-sense patterns described within the illness
perceptions literature (Hagger & Orbell, 2003). Specifically, more favourable SPA were
positively related to what are often described as more adaptive forms of coping (in this
case, satisfaction with social support and primary control engagement coping).
Conversely, less favourable SPA were positively related to less adaptive coping
strategies (i.e. disengagement coping). This provides more evidence for the application
of the CSM to an ageing context.
Second, a number of different mediation patterns were detected in the cross-
sectional arm of the study. For the indirect-only mediation models, both satisfaction
with social support and disengagement coping played important roles in guiding how
certain dimensions of SPA influenced hedonic subjective wellbeing and psychological
distress. This type of mediation pattern provides evidence for these hypothesised coping
mechanisms and indicates that there is unlikely to be an omitted mediator. Social
mechanisms in particular demonstrated more robust associations with ageing
experiences. Future researchers might explore these relationships further among
Page 277
259
different groups of older adults, in particular, focussing in on more specific aspects of
social support. For instance, the current findings did not indicate who provided the
social support (see Section 4.2.2 for discussion on social support provision that may be
detrimental for mental health) or how this resource functioned, for instance, whether
psychological resilience was strengthened or ageing experiences normalised. Given the
evidence regarding the effects of social support on mental health in older adults more
generally is scant (Tajvar et al., 2016), a closer examination of the construct within this
mediation framework is warranted.
Social mechanisms were found to partially mediate relationships between SPA
and eudaimonic wellbeing, positive affect, and psychological distress. Primary control
engagement coping also played a role in these mediation models. Partial mediation
indicates that there may also be omitted mediation variables, and as such, future
researchers may use the current findings as a starting point to investigate other possible
mechanisms. In particular, it might be useful to look to lifespan theories of development
(e.g. P. B. Baltes & Baltes, 1990; Brandtstädter & Rothermund, 2002; Heckhausen &
Schulz, 1995; Schulz & Heckhausen, 1996) which focus on synergistic relationships
between selective and compensatory means of coping, processes which are especially
salient within older populations. Regardless of current health status, ageing increasingly
limits developmental plasticity and will influence the degree to which internal and
external resources are available over time (P. B. Baltes et al., 1999). It is therefore
important to establish how such mechanisms operate in more optimal agers so that these
findings can be utilised to address mental health problems in less well-functioning
populations.
A strength of study four goes to the two-wave study design employed. Because
change scores were utilised, we were able to examine how patterns of changes within
individuals on all measures influenced mediation patterns across time. Cross-sectional
data is often used to test for mediation effects despite mediation representing causal
processes. While including at least three or more time points is frequently recommended
within the literature, causality is often difficult to establish unequivocally in any design,
and therefore inferences about the findings are better guided by theory (Preacher &
Hayes, 2008). The current study was guided by a number of theories which hold that
SPA drives mental health (Levy, 2009) and that coping mediates the relationship
between illness perceptions and outcomes (H. Leventhal et al., 1998). Recent empirical
Page 278
260
findings regarding the directionality of the SPA-health relationship (e.g. Sargent-Cox et
al., 2012b, Wurm et al., 2007) also lend support to the inferences drawn from the
current findings. Assessing changes in SPA, coping, and mental health, however,
enabled greater scrutiny of the data to test the stability of the mediation effects observed
in the cross-sectional analyses.
The third key finding from study four is that very few mediation patterns which
were detected at Time 1 were found when changes within individuals were examined in
the second set of mediation analyses. Further, the size of the mediation effects observed
in analysis utilising both time points was not overwhelming. However, these findings
need to be interpreted within the context of the current sample makeup and size
(discussed further in Section 13.5). In light of the small sample size (for testing
mediation) and the high levels of psychological functioning observed in this group of
older adults (as found in the first three studies), the finding of any significant indirect
effects in the cross-sectional study, several of which did hold across time, suggests that
coping might still be a viable mechanistic pathway through which SPA affects mental
health. A number of other factors are very likely to have influenced the findings from
this study, which are discussed further in the limitations section of this chapter. Thus,
the mediation patterns which were found are theoretically feasible. Given the
preliminary and exploratory nature of this study, however, further research which
extends on these findings is warranted.
The findings from the fifth and final study of this thesis demonstrated that the
dispositional traits of neuroticism and generalised optimism do moderate relationships
between SPA and mental health however not necessarily in the ways that might be
expected, at least within this group of more well-functioning older adults. Higher levels
of generalised optimism were found to buffer the negative effect on emotional responses
generated to ageing on levels of psychological distress. As generalised optimism is
understood to guide more adaptive self-regulatory responses to prevent or limit more
negative outcomes (Aspinwall, 2005), this finding was not entirely surprising. However,
higher levels of this dispositional trait also weakened the negative association between
more favourable SPA (i.e. control over negative aspects of ageing) and higher levels of
psychological distress. These findings may be a function of the nature of generalised
optimism more broadly that can operate to limit adaptive functioning although further
examination of these relationships is needed.
Page 279
261
Possibly the more interesting finding to emerge from the final study was that
higher levels of neuroticism actually enhanced the positive effects of more favourable
SPA on life satisfaction. Higher levels of negative emotionality have often been
associated with poorer mental health more generally (Lahey, 2009). However, as
neuroticism tends to decrease with age (Leszko et al., 2015; Mroczek & Spiro, 2003), it
is possible that higher levels of this dispoitional trait in older adults is manageable,
relative to higher levels in younger populations. Further, more recent investigations in
the field of personality, which are focussing on how various combinations of personality
traits interact with one and another to influence health, may provide some explanation
for the current findings. In particular, the concept of healthy neuroticism (Weston &
Jackson, 2015), where high levels of neuroticism are paired with high levels of
conscientiousness, might explain the current findings. In light of this study’s sample
characteristics, this concept is not improbable. Yet as interactions among personality
traits were not examined in this thesis, such conclusions are purely speculative at this
stage. Nonetheless, it offers some potentially interesting avenues of investigation for
future research. For instance, the ways in which personality traits interact with each
other could be examined to assess how various combinations of these traits moderate
relationships between SPA and mental health, subject to the availability of data with
sufficient statistical power.
Much like study four, it is highly probable that the current sample characteristics
and size limited and shaped the overall findings of the final study. Taken together,
however, these two studies contribute some original and important information to the
field of subjective ageing that has potentially useful theoretical implications. Further,
these findings may also inform future clinical applications, particularly in terms of
resource allocation decisions. The following section of this chapter addresses these
issues.
13.3 Theoretical implications
The theoretical process of self-regulation which the CSM posits, when applied to
an ageing context, was only partially supported by the empirical evidence in this thesis.
Coping was found to mediate relationships between SPA and mental health and
personality was found to moderate the SPA-mental health relationship. However, very
few patterns of mediation appeared to hold over time, and the size of the effects
Page 280
262
observed in studies four and five were small. Because of the exploratory nature of these
investigations, many of the findings must be treated as speculative at this stage.
Confirmatory studies will be required in order to extend on the current findings and to
establish whether the theoretical grounds on which they were tested are sound. In
particular, future studies with adequate sample sizes and access to a broader pool of
older adults might examine how SPA influences social mechanisms and how this in turn
influences one or two indicators of mental health, or alternatively, examine how
personality moderates relationships between SPA and mental health in less well-
resourced segments of the older adult population.
As stated in Section 13.2.2, no significant conditional process effects were found
in a preliminary examination of the data. It is highly likely, however, that the current
study sample was too small and therefore lacking sufficient statistical power to detect
such effects. As described in Section 2.4, social cognitive models of self-regulation,
such as the CSM, recognise that self-regulation does not operate in a vacuum but is
instead a contextually-related self-process (Diefenbach & Leventhal, 1996). This has
been somewhat supported by empirical evidence in the illness perceptions literature,
where personality was found to moderate the mediated pathways between illness beliefs
and outcomes (e.g. Hurt et al., 2014; Karademas et al., 2011). Thus, despite there being
no evidence for moderated mediation processes in this thesis, there are still strong
theoretical grounds for examining such pathways in future studies which have adequate
sample sizes. Extending on this, future researchers might also look at including more
sophisticated concepts of personality within these frameworks (as outlined in Section
13.2.2) to gain a better understanding about how dimensions of this moderating variable
works to influence mediated pathways.
While the pathways discussed thus far warrant further investigation, there are also
other potential pathways between SPA and mental health. While inconsistent with the
theoretical framework adopted for this thesis, a number of other studies (i.e. Moor et al.,
2006; O’Shea et al., 2016) have reported that SPA mediates the relationship between
disposition and health (as described in Section 5.4.2). As discussed in Section 4.2.3,
there is now sufficient evidence to suggest that personality is more malleable into
adulthood than it was once believed. Further, while naturalistic trait change is fairly
well-documented, there is growing evidence that trait change may also result from
intentional, focussed interventions in both younger and older non-disordered
Page 281
263
populations (e.g. Bialas, 2009; Chapman et al., 2014; Jackson et al., 2012; L. S. Martin
et al., 2014). Thus, it is feasible that shifts in personality (both naturalistic and
intentional) might influence mental health through subjective ageing experiences.
Further, particularly for older adults experiencing more age-related stressors, social
support mechanisms might be examined as a possible moderator of these pathways (i.e.
where social mechanisms may buffer the detrimental effects of such stressors on ageing
experiences and mental health) (see stress-buffering hypothesis: Section 4.2.2).
What is very clear from the current thesis findings and from the limited evidence
within the field is that the role that psychosocial mechanisms in the SPA-mental
relationship are poorly understood at this early stage of enquiry and do deserve much
more attention by researchers. The following section briefly addresses what our current
understanding of these relationships might mean from a clinical perspective.
13.4 Clinical application
The findings from this doctoral thesis suggest that it would be premature to
specifically target SPA for intervention at present. At this point of investigation, we
have insufficient evidence to meaningfully understand the relationships between ageing
experiences and mental health functioning in order to identify opportunities for
intervention. While the findings from this thesis provide some interesting preliminary
insights into such mechanisms, they also clearly demonstrate that there are many gaps
in our current knowledge base. This may account for the varying degrees of success
which have been reported across studies which have attempted to experimentally
manipulate SPA (e.g. Kotter-Grühn & Hess, 2012; Miche & Wahl, 2013). Other
strategies for change have also been examined (e.g. social comparison feedback,
lifestyle changes, cognitive behavioural techniques) and while the preliminary evidence
from these studies has been promising, there is no data to support the longer term
efficacy of such interventions on SPA. Further, as discussed in Chapter 6, there are also
broader ethical questions around the issue of changing SPA which need to be addressed,
particularly given societal influences and stereotypes of ageing.
A benefit of viewing the multifaceted nature of SPA as a process underpinning
adaptation is that it acknowledges the ageing process as a normal developmental period
characterised by both gains and losses, and moves away from binary notions of SPA.
Page 282
264
This potentially expands possibilities for future treatment approaches. The current
findings are subject to confirmation, but offer some indication that social mechanisms
may play an especially important role underpinning relationships between SPA and
mental health. While more targeted treatment approaches may be some way off for
individuals who are experiencing their own ageing less well, incorporating therapeutic
techniques into a treatment plan which fosters an older patient’s engagement with social
networks or helps with the development of social skills would not be harmful. Indeed,
this treatment approach is already utilised broadly by clinicians. Equally, because
generalised optimism may buffer the detrimental effects of SPA, and is associated more
broadly with the use of adaptive coping strategies (Aspinwall, 2005; Conversano et al.,
2010), utilising therapeutic techniques which promote a more optimistic outlook might
also be considered by clinicians when an older patient presents with declining mental
health related to their ageing experiences. For instance, a recent meta-analysis (Malouff
& Schutte, 2016) found that the Best Possible Self intervention, which entails
developing goals for a best possible future self and then visualising that self, resulted in
greater increases in optimism than many other psychological techniques (e.g. self-
compassion training, cognitive-behavioural therapy).
Whether future treatment approaches target SPA directly or focus on other
psychosocial or behavioural mechanisms (or both, or neither) will need to be
determined by further research. However, the findings from this thesis appear to suggest
that individuals who hold more favourable views about their own ageing also
experience more optimal mental health functioning. While many of the current study
participants are living with chronic illness and possibly other age-related stressors, they
nonetheless appear to be very competent in self-regulating their own ageing experiences
and would be unlikely to benefit further from intervention. Any future considerations
regarding publicly funded treatment programmes would therefore need to take this into
account and focus more specifically on groups experiencing their ageing less well.
13.5 Limitations
This doctoral thesis has a number of important strengths. It is the first Australian
study to examine how SPA, when conceptualised within a self-regulation framework,
relates to key sociodemographic, subjective health, mental health and psychosocial
indicators. To the best of our knowledge, it is also the first study to investigate how
Page 283
265
potential underlying psychosocial mechanisms may serve to influence the relationship
between the CSM defined dimensions of SPA and mental health in a group of older,
community-dwelling adults. That is, to investigate two of the core assumptions of the
theoretical model that has guided this research. The inclusion of a two-wave study
design to examine mediation effects also served to strengthen the overall research
findings. However, given the preliminary and exploratory nature of these findings,
further research is needed to both extend on the current findings and to address the
limitations which were identified in the current study.
As highlighted in Chapter 11 (study four), one of the more significant challenges
for this thesis was the large number of variables being tested. The original APQ
includes eight subscales. After testing the psychometric properties of this scale in the
first study, two of these subscales were removed from further testing. Nonetheless,
because there have been no other studies which have examined how this measure of
SPA influences different aspects of mental health through coping, the remaining six
subscales were all included in the tests of mediation and moderation. Thus, as this was
an exploratory investigation, all of these measures were included in study four (although
the numbers of variables were limited in study five). Further, because we were more
interested in examining patterns in relationships at this early stage of investigation, the
multiple test of mediation were not adjusted. Multiple testing without adjustment can
lead to higher rates of Type I errors. Yet as some authors have argued (e.g. Althouse,
2016; Rothman, 1990), strictly adjusting for multiple comparisons is less critical in
exploratory studies. Future confirmatory studies which might be guided by the current
findings, however, could consider focussing on one or two of the SPA variables and a
single measure of mental health.
A major constraint for the current investigation was the lack of access to a large
pool of older subjects, for example, through the national or state electoral roll databases.
Every effort was made to recruit large numbers of participants from different segments
of the older adult population, for instance, through various community organisations,
social media, and press release. However, non-response was an issue which influenced
the final sample size during the first wave of data collection, which is not uncommon
for questionnaire surveys in general (Régnier-Loilier & Guisse, n.d.). Attrition is to be
expected with research designs that include two or more waves of data however the
reduction in sample size by 36 percent at Time 2 was likely to have compromised the
Page 284
266
statistical power to detect change in the mediation analyses across the two time points.
Relatively large sample sizes are required when testing for both mediation and
moderation effects (Fritz & Arthur, 2017; MacKinnon, 2008). Although attrition
processes can introduce potential biases into designs with more than one wave of data, it
is noteworthy that the sample structure was largely undistorted as a result of non-
response during the second wave of data collection. Further, the data collected was not
statistically adjusted to compensate for the over-or under-representation of a particular
population subgroup in the sample. As such, potential biases within the sample design,
for instance, self-selection and differential non-response biases were not addressed.
As highlighted throughout this thesis, the sample consisted of a fairly
homogenous group of older Australian adults who might best be described as well-
functioning and well-resourced, which may be indicative of self-selection biases. Given
that SPA and coping with age-related challenges are likely to be activated by more
serious health-related events in particular, it is possible that the current sample
characteristics resulted in true mediation effects going undetected. It is also feasible that
for certain participants who may not have been managing to self-regulate their
experiences to ageing so well, answering questions accurately about such experiences
was particularly unpleasant. In some instances, this may have actually prompted more
favourable (although less accurate) responses, which goes to some of the
methodological challenges in ageing research more generally, as discussed in Chapters
7 and 10. As it is not possible to generalise these findings to the older Australian
population, future investigations which target specific groups of older adults (e.g. lower
socioeconomic groups or those experiencing health-related events) will be needed to
extend on the current research. As observed in the first study, more targeted strategies,
for instance, recruitment via General Practice sites or community aged care service
providers might be considered for future data collection with the aim of reaching a more
diverse group of older adults.
Time constraints associated with this thesis may have hindered the capture of
meaningful difference in any of the variables tested in the mediation analyses. It is
conceivable that any health- or other age-related changes which may have occurred
between the two waves of data collection did not influence self-concept (for instance, by
raising questions about the fallibility of their own physical states) to the degree where
SPA became especially salient for this group of independent older adults. It is equally
Page 285
267
plausible that the 12 month time lag was too long to capture mediation processes when
they occurred. As MacKinnon (2008) observes, there is the potential to miss true
mediation in longitudinal designs if the time of measurement differs from the timing of
the mediated effect. Given the length of the current study survey, however, inserting
more measurement points across the 12 month data collection window was likely to
have resulted in higher rates of attrition which would have further compromised the
sample size. Given the potential importance of social mechanisms, however, future
researchers could consider a time difference that can capture definitive change in these
social networks.
Measurement issues also need to be considered in future research. For instance, as
discussed at length in Chapter 4, there are numerous ways in which coping is
conceptualised and measured, which may partly account for the mixed findings reported
in the illness perceptions literature. Wurm and colleagues (2013) identified that a
specific coping mechanism, namely, the use of SOC strategies for leading a healthy
lifestyle, helped to explain the effects of negative SPA on health. By contrast, the
current study utilised more generic measures of coping, none of which were focussed on
coping in the context of ageing. The use of qualitative measures may help to tap into
ageing experiences and coping processes in a more substantive manner (Singh, 2011).
One of the strengths of the current study was the accessibility of the survey, which was
made available in both web-and paper-based versions. However, the inferences drawn
from the data were based on self-report measures which are subject to a number of
biases. All of these factors, along with the limitations highlighted in each study chapter,
require consideration in future survey studies which investigate how psychosocial
mechanisms serve to influence the SPA-mental health relationship in older populations.
13.6 Conclusion
In conclusion, this doctoral thesis provides preliminary evidence that SPA, as
conceptualised within a self-regulation framework, is meaningfully related to
psychosocial and mental health factors in this group of older, community-dwelling
Australian adults. Many of these relationships had not been explored previously within
an Australian sample, and as such, this is the first study to test whether ageing
experiences reported by older adults overseas might also be replicated in Australia
within the context of the CSM. Further, the findings from this preliminary study offer
Page 286
268
some important and novel insights into how coping mechanisms might influence
relationships between SPA and mental health, and how certain dispositional traits
moderate these relationships. These relationships had not been tested previously and
therefore, this is the first study to provide some support to the theoretical process of
self-regulation which the CSM posits, when applied to an ageing context.
Page 287
269
References
Abrams, D., Crisp, R. J., Marques, S., Fagg, E., Bedford, L., & Provias, D. (2008).
Threat inoculation: Experienced and imagined inter-generational contact prevents
stereotype threat effects on older people’s math performance. Psychology and
Aging, 23(4), 934–939. doi.org/10.1037/a0014293
Abrams, D., Eller, A., & Bryant, J. (2006). An age apart: The effects of
intergenerational contact and stereotype threat on performance and intergroup bias.
Psychology and Aging, 21(4), 691–702. doi.org/10.1037/0882-7974.21.4.691
Aldwin, C. M., Spiro III, A., & Park, C. L. (2006). Health, behavior, and optimal aging.
In J. E. Birren & K. W. Schaie (Eds.), Handbook of the Psychology of Aging (6th
ed., pp. 85–104). Burlington, MA: Elsevier Academic Press.
doi.org/10.1016/B978-0-12-380882-0.00032-2
Aldwin, C. M., Sutton, K. J., Chiara, G., & Spiro, A. (1996). Age differences in stress,
coping, and appraisal: Findings from the Normative Aging Study. The Journals of
Gerontology: Series B: Psychological Sciences and Social Sciences, 51B(4), 179–
188. doi.org/10.1093/geronb/51B.4.P179
Althouse, A. D. (2016). Adjust for multiple comparisons? It’s not that simple. Annals of
Thoracic Surgery, 101(5), 1644–1645. doi.org/10.1016/j.athoracsur.2015.11.024
Alwin, D. F., & Hauser, R. M. (1975). The decomposition of effects in path analysis.
American Sociological Review, 40(1), 37–47. Retrieved from
http://www.jstor.org/stable/2094445
Amirkhan, J., & Auyeung, B. (2007). Coping with stress across the lifespan: Absolute
vs. relative changes in strategy. Journal of Applied Developmental Psychology,
28(4), 298–317. doi.org/10.1016/j.appdev.2007.04.002
Andrews, G., Clark, M., & Luszcz, M. (2002). Successful aging in the Australian
Longitudinal Study of Aging : Applying the MacArthur Model cross-nationally.
Journal of Social Issues, 58(4), 749–765. doi.org/https://doi.org/10.1111/1540-
4560.00288
Arah, O. A. (2009). On the relationship between individual and population health.
Medicine, Health Care and Philosophy, 12(3), 235–244. doi.org/10.1007/s11019-
Page 288
270
008-9173-8
Ashida, S., & Heaney, C. A. (2008). Differential associations of social support and
social connectedness with structural features of social networks and the health
status of older adults. Journal of Aging and Health, 20(7), 872–893.
doi.org/10.1177/0898264308324626
Aspinwall, L. G. (2005). The psychology of future-oriented thinking: From
achievement to proactive coping, adaptation, and aging. Motivation and Emotion,
29(4), 203–235. doi.org/10.1007/s11031-006-9013-1
Australian Bureau of Statistics. (2009). A picture of the nation: The statistician’s report
on the 2006 census. ABS, Canberra. (Vol. 36). doi.org/10.1016/j.icrp.2006.06.003
Australian Bureau of Statistics. (2012). Reflecting a Nation: Stories from the 2011
Census, 2012–2013 (Cat. No. 2071.0). ABS, Canberra. Retrieved from
http://www.abs.gov.au/ausstats/[email protected] /Previousproducts/2071.0Main
Features752012–2013
Australian Bureau of Statistics. (2015). National Health Survey: First Results, 2014-15
(Cat. No. 4364.0.55.001). ABS, Canberra. Retrieved from
http://www.abs.gov.au/ausstats/[email protected] /Lookup/by Subject/4364.0.55.001~2014-
15~Main Features~Psychological distress~16
Australian Bureau of Statistics. (2016). Household Income and Wealth, Australia, 2013-
14 (Cat. No. 6523.0). ABS, Canberra. Retrieved from
http://www.abs.gov.au/AUSSTATS/[email protected] /Lookup/6523.0Main+Features31201
3-14?OpenDocument
Australian Health Ministers’ Advisory Council (2017). National Strategic Framework
for Chronic Conditions. Australian Government, Canberra. Retrieved from
http://www.health.gov.au/internet/main/publishing.nsf/content/nsfcc
Australian Institute of Health and Welfare. (2007). Older Australia at a glance: 4th
edition (Cat. No. AGE 52). Canberra. Retrieved from
http://www.aihw.gov.au/WorkArea/DownloadAsset.aspx?id=6442454209
Australian Institute of Health and Welfare. (2014). Australia’s health 2014: The 14th
biennial health report of the Australian Institute of Health and Welfare (Series No.
14. Cat. No. AUS178). Canberra. Retrieved from
Page 289
271
http://www.aihw.gov.au/WorkArea/DownloadAsset.aspx?id=60129548150
Australian Institute of Health and Welfare. (2016). Australian Burden of Disease Study:
Impact and causes of illness and death in Australia 2011. Australian Burden of
Disease Study series no. 3. Cat. no. BOD 4. Canberra. https://doi.org/Australian
Burden of Disease Study series no. 3. BOD 4.
Australian Institute of Health and Welfare. (2017). Older Australia at a glance (web
report). Canberra. Retrieved from https://www.aihw.gov.au/reports/older-
people/older-australia-at-a-glance/contents/healthy-ageing/behavioural-risk-factors
Baker, M., Stabile, M., & Deri, C. (2004). What do self-reported, objective, measures of
health measure? The Journal of Human Resources, 39(4), 1067–1093.
doi.org/10.2307/3559039
Baltes, P. B. (2006). Facing our limits: Human dignity in the very old. Daedalus,
135(1), 32–39. doi.org/10.1162/001152606775321086
Baltes, P. B., & Baltes, M. M. (1990). Psychological perspectives on successful aging:
The model of selective optimization with compensation. In P. B. Baltes & M. M.
Baltes (Eds.), Successful aging: Perspectives from the behavioral sciences (pp. 1–
34). New York: Cambridge University Press.
doi.org/https://doi.org/10.1017/cbo9780511665684.003
Baltes, P. B., Lindenberger, U., & Staudinger, U. M. (2006). Life span theory in
developmental psychology. In R. M. Lerner (Ed.), Handbook of child psychology:
Vol. 1. Theoretical models of human development (6th ed., pp. 569–664). New
Jersey: John Wiley & Sons Ltd.
Baltes, P. B., Staudinger, U. M., & Lindenberger, U. (1999). Lifespan psychology:
Theory and application to intellectual functioning. Annual Review of Psychology,
50, 471–507. doi.org/10.1146/annurev.psych.50.1.471
Bandura, A. (2001). Social cognitive theory: An agentic perspective. Annual Review of
Psychology, 52, 1–26. doi.org/10.1146/annurev.psych.52.1.1
Barak, B. (1987). Cognitive age: A new multidimensional approach to measuring age
identity. The International Journal of Aging and Human Development, 25(2), 109–
128. doi.org/10.2190/RR3M-VQT0-B9LL-GQDM
Barak, B. (2009). Age identity: A cross-cultural global approach. International Journal
Page 290
272
of Behavioral Development, 33(1), 2–11. doi.org/10.1177/0165025408099485
Barak, B., Mathur, A., Lee, K., & Zhang, Y. (2001). Perceptions of age-identity: A
cross-cultural inner-age exploration. Psychology and Marketing, 18(10), 1003–
1029. doi.org/https://doi.org/10.1002/mar.1041
Barak, B., & Stern, B. (1986). Subjective age correlates: A research note. The
Gerontologist, 26(5), 571–578. doi.org/10.1093/geront/26.5.571
Barber, S. J., & Mather, M. (2013). Stereotype threat can both enhance and impair older
adults’ memory. Psychological Science, 24, 2522–2529.
doi.org/https://doi.org/10.1177/0956797613497023
Barker, M., O’Hanlon, A., McGee, H. M., Hickey, A., & Conroy, R. M. (2007). Cross-
sectional validation of the Aging Perceptions Questionnaire: A multidimensional
instrument for assessing self-perceptions of aging. BMC Geriatrics, 7(1), 1–13.
doi.org/10.1186/1471-2318-7-9
Baron, R. M., & Kenny, D. A. (1986). The moderator-mediator variable distinction in
social psychological research: Conceptual, strategic, and statistical considerations.
Journal of Personality and Social Psychology, 51(6), 1173–1182.
doi.org/10.1037/0022-3514.51.6.1173
Barrett, A. E. (2003). Socioeconomic status and age identity: The role of dimensions of
health in the subjective construction of age. The Journals of Gerontology. Series B,
Psychological Sciences and Social Sciences, 58(2), S101–S109.
doi.org/10.1093/geronb/58.2.S101
Baumeister, R. F., Bratlavsky, E., Muraven, M., & Tice, D. M. (1998). Ego-depletion:
Is the active self a limited resource? Journal of Personality and Social Psychology,
74, 1252–1265. doi.org/10.1037/0022-3514.74.5.1252
Baumeister, R. F., Vohs, K. D., & Tice, D. M. (2007). The strength model of self-
control. Current Directions in Psychological Science, 16, 351–355.
doi:10.1111/j.1467-8721.2007.00534.x
Beekman, A. T., Copeland, J. R., & Prince, M. J. (1999). Review of community
prevalence of depression in later life. British Journal of Psychiatry, 174, 307–311.
doi.org/10.1192/bjp.174.4.307
Beekman, A. T., Penninx, B. W., Deeg, D. J., Ormel, J., Braam, A. W., & van Tilburg,
Page 291
273
W. (1997). Depression and physical health in later life: results from the
Longitudinal Aging Study Amsterdam (LASA). Journal of Affective Disorders,
46(3), 219–231. doi.org/10.1016/S0165-0327(97)00145-6
Benyamini, Y. (2011). Health and illness perceptions. In H. S. Friedman (Ed.), The
Oxford Handbook of Health Psychology (pp. 280–293). New York: Oxford
University Press. doi.org/10.1093/oxfordhb/9780195342819.013.0013
Berg, A. I., Hassing, L. B., Thorvaldsson, V., & Johansson, B. (2011). Personality and
personal control make a difference for life satisfaction in the oldest-old: Findings
in a longitudinal population-based study of individuals 80 and older. European
Journal of Ageing, 8(1), 13–20. doi.org/10.1007/s10433-011-0181-9
Bergmann, M. M., Jacobs, E. J., Hoffmann, K., & Boeing, H. (2004). Agreement of
self-reported medical history: Comparison of an in-person interview with a self-
administered questionnaire. European Journal of Epidemiology, 19(5), 411–416.
doi.org/10.1023/B:EJEP.0000027350.85974.47
Bialas, A. (2009). Psychotherapy effectiveness and the possibility of personality traits
changes depending on the patients’ age. Archives of Psychiatry and
Psychotherapy, 11(1), 11–19.
Blanchard, M. (1992). The elderly. International Review of Psychiatry, 4, 251–255.
doi.org/10.3109/09540269209066325
Blazer, D. G. (2000). Reviews and Overviews Psychiatry and the Oldest Old. The
American Journal of Psychiatry, 157, 1915–1924.
doi.org/10.1176/appi.ajp.157.12.1915
Blazer, D. G. (2003). Depression in late life: Review and commentary. The Journals of
Gerontology Series A: Biological Sciences and Medical Sciences, 58A(3), 249–
265. doi.org/10.1093/gerona/58.3.M249
Blazer, D., Hybels, C., & Hughes, D. (1990). Duke Social Support Index. Princeton, NJ:
Educational Testing Service.
Bode, C., Taal, E., Westerhof, G. J., van Gessel, L., & van de Laar, M. V. (2012).
Aging & mental health experience of aging in patients with rheumatic disease : A
comparison with the general population. Aging and Mental Health, 16(5), 666–
672. doi.org/10.1080/13607863.2011.651438
Page 292
274
Boehmer, S. (2007). Relationships between felt age and perceived disability,
satisfaction with recovery, self-efficacy beliefs and coping strategies. Journal of
Health Psychology, 12(6), 895–906. doi.org/10.1177/1359105307082453
Boekaerts, M., Pintrich, P. R., & Zeidner, M. (Eds. ). (2005). Handbook of Self-
Regulation. San Diego: Academic Press.
Bogg, T., & Roberts, B. W. (2004). Conscientiousness and health-related behaviors: A
meta-analysis of the leading behavioral contributors to mortality. Psychological
Bulletin, 130(6), 887–919. doi.org/10.1037/0033-2909.130.6.887
Bowling, A., & Dieppe, P. (2005). What is successful ageing and who should define it?
BMJ, 331(7531), 1548–1551. doi.org/10.1136/bmj.331.7531.1548
Bowling, A., See-Tai, S., Ebrahim, S., Gabriel, Z., & Solanki, P. (2005). Attributes of
age-identity. Ageing and Society, 25(4), 479–500.
doi.org/10.1017/S0144686X05003818
Brandtsädter, J., & Rothermund, K. (1994). Self-percepts of control in middle and later
adulthood: Buffering losses by rescaling goals. Psychology and Aging, 9(2), 265–
273. doi.org/10.1037//0882-7974.9.2.265
Brandtstädter, J., & Renner, G. (1990). Tenacious goal pursuit and flexible goal
adjustment: Explication and age-related analysis of assimilative and
accommodative strategies of coping. Psychology and Aging, 5(1), 58–67.
doi.org/10.1037/0882-7974.5.1.58
Brandtstädter, J., & Rothermund, K. (2002). The life-course dynamics of goal pursuit
and goal adjustment: A two-process framework. Developmental Review, 22, 117–
150. doi.org/10.1006
Brownlee, S., Leventhal, H., & Leventhal, E. A. (2005). Regulation, self-regulation, and
construction of the self in the maintenance of physical health. In M. Boekaerts, P.
R. Pintrich, & M. Zeidner (Eds.), Handbook of Self-Regulation (pp. 369–416). San
Diego: Academic Press. doi.org/10.1016/b978-012109890-2/50041-x
Bryant, C., Bei, B., Gilson, K.-M., Komiti, A., Jackson, H., & Judd, F. (2014).
Antecedents of attitudes to aging: A study of the roles of personality and well-
being. The Gerontologist, Advance Ac(May 2), 1–11.
doi.org/10.1093/geront/gnu041
Page 293
275
Bryant, C., Bei, B., Gilson, K., Komiti, A., Jackson, H., & Judd, F. (2012). The
relationship between attitudes to aging and physical and mental health in older
adults. International Psychogeriatrics, 24(10), 1674–1683.
doi.org/10.1017/S1041610212000774
Bryant, C., Jackson, H., & Ames, D. (2008). The prevalence of anxiety in older adults:
Methodological issues and a review of the literature. Journal of Affective
Disorders, 109(3), 233–250. doi.org/10.1016/j.jad.2007.11.008
Caballero, B. (2007). The global epidemic of obesity: An overview. Annals of Saudi
Medicine, 29, 1–5. doi.org/10.1093/epirev/mxm012
Cameron, L. D., & Leventhal, H. (2003). Self-regulation, health, and illness: An
overview. In L. D. Cameron & H. Leventhal (Eds.), The self-regulation of health
and illness behaviour (pp. 1–13). London, UK: Routledge.
Canada, B., Stephan, Y., Caudroit, J., & Jaconelli, A. (2013). Personality and subjective
age among older adults: the mediating role of age-group identification. Aging &
Mental Health, 17(8), 1037–1043. doi.org/10.1080/13607863.2013.807420
Carlisle, A. C. S., John, A. M. H., Fife-Schaw, C., & Lloyd, M. (2005). The self-
regulatory model in women with rheumatoid arthritis : Relationships between
illness representations, coping strategies, and illness outcome. British Journal of
Health Psychology, 10, 571–587. doi.org/10.1348/135910705x52309
Carnell, K. (2012). Improving outcomes for older people with depression and anxiety
disorders. Retrieved from
http://www.nari.net.au/files/files/documents/2012_nari_annual_seminar_03_carnel
l_ao_kate_nari_improving_outcomes.pdf
Carstensen, L. L. (1991). Selectivity theory: Social activity in life-span context. Annual
Review of Gerontology and Geriatrics, 11, 195–217.
Carstensen, L. L., Pasupathi, M., Mayr, U., & Nesselroade, J. R. (2000). Emotional
experience in everyday life across the adult life span. Journal of Personality and
Social Psychology, 79(4), 644–655. doi.org/10.1037//0022-3514.79.4.644
Carter, E. C., Kofler, L. M., Forster, D. E., & McCullough, M. E. (2015). A series of
meta-analytic tests of the depletion effect: Self-control does not seem to rely on a
limited resource. Journal of Experimental Psychology: General, 144(4), 796–815.
Page 294
276
doi.org/10.1037/xge0000083
Carter, E. C., & McCullough, M. E. (2013). Is ego depletion too incredible? Evidence
for the overestimation of the depletion effect. Behavioral and Brain Sciences,
36(6), 683–684. doi.org/10.1017/s0140525x13000952
Carter, E. C., & McCullough, M. E. (2014). Publication bias and the limited strength
model of self-control: Has the evidence for ego depletion been overestimated?
Frontiers in Psychology. doi.org/10.3389/fpsyg.2014.00823
Carver, C. S. (1997). You want to measure coping but your protocol’s too long:
Consider the Brief COPE. International Journal of Behavioral Medicine.
doi.org/10.1207/s15327558ijbm0401_6
Carver, C. S., & Connor-Smith, J. (2010). Personality and coping. Annual Review of
Psychology, 61(1), 679–704. doi.org/10.1146/annurev.psych.093008.100352
Carver, C. S., & Scheier, M. F. (1994). Situational coping and coping dispositions in a
stressful transaction. Journal of Personality and Social Psychology, 66(1), 184–
195. doi.org/10.1037/0022-3514.66.1.184
Carver, C. S., & Scheier, M. F. (2014). Dispositional optimism. Trends in Cognitive
Sciences, 18(6), 293–299. doi.org/10.1016/j.tics.2014.02.003
Carver, C. S., Scheier, M. F., & Weintraub, J. K. (1989). Assessing coping strategies: A
theoretically based approach. Journal of Personality and Social Psychology, 56(2),
267–283. doi.org/10.1037//0022-3514.56.2.267
Caspi, A., & Roberts, B. W. (2001). Personality development across the life course :
The argument for change and continuity. Psychological Inquiry, 12(2), 49–66.
doi.org/10.1207/S15327965PLI1202_01
Chachamovich, E., Fleck, M., Laidlaw, K., & Power, M. (2008). Impact of major
depression and subsyndromal symptoms on quality of life and attitudes toward
aging in an international sample of older adults. The Gerontologist, 48(5), 593–
602. doi.org/10.1093/geront/48.5.593
Chapman, B. P., Hampson, S., & Clarkin, J. (2014). Personality-informed interventions
for healthy aging: Conclusions from a National Institute on Aging work group.
Developmental Psychology, 50(5), 1426–1441. doi.org/10.1037/a0034135
Chapman, B. P., Roberts, B., & Duberstein, P. (2011). Personality and Longevity:
Page 295
277
Knowns, Unknowns, and Implications for Public Health and Personalized
Medicine. Journal of Aging Research, 2011, 1–24. doi.org/10.4061/2011/759170
Charles, S. T., & Carstensen, L. L. (2009). Social and emotional aging. Annual Review
of Psychology, 61(1), 383–409. doi.org/10.1146/annurev.psych.093008.100448
Charles, S. T., & Piazza, J. R. (2009). Age differences in affective well-being: Context
matters. Social and Personality Psychology Compass, 3(5), 711–724.
doi.org/10.1111/j.1751-9004.2009.00202.x
Charles, S. T., Reynolds, C. A., & Gatz, M. (2001). Age-related differences and change
in positive and negative affect over 23 years. Journal of Personality and Social
Psychology, 80(1), 136–151. doi.org/10.1037/0022-3514.80.1.136
Chen, X., Hu, Y., Zhu, D., Li, J., & Zhou, L. (2015). Chinese version of the Aging
Perceptions Questionnaire (C-APQ): Assessment of reliability and validity. Aging
and Mental Health, 1–8. doi.org/10.1080/13607863.2015.1028332
Cheung, G. W., & Lau, R. S. (2008). Testing mediation and suppression effects of latent
variables. Organizational Research Methods, 11(2), 296–325.
doi.org/10.1177/1094428107300343
Cheung, M. W. L. (2009). Comparison of methods for constructing confidence intervals
of standardized indirect effects. Behavior Research Methods, 41(2), 425–438.
doi.org/10.3758/BRM.41.2.425
Cohen, J. (1998). Statistical power analysis for the behavioral sciences (2nd ed.). New
York, NY: Lawrence Erlbaum Associates. doi.org/10.1234/12345678
Cohen, J., Cohen, P., West, S. G., & Aiken, L. S. (2003). Multiple
regression/correlation analysis for the behavioral sciences (3rd ed.). Mahwah, NJ:
Lawrence Erlbaum.
Cohen, S. (2004). Social relationships and health. American Psychologist, 59(8), 676–
684. doi.org/10.1037/0003-066X.59.8.676
Cole, S. W. (2014). Human social genomics. PLoS Genetics, 10(8), 4–10.
doi.org/10.1371/journal.pgen.1004601
Compas, B. E., Connor-Smith, J., Saltzman, H., Thomsen, A. H., & Wadsworth, M. E.
(2001). Coping with stress during childhood and adolescence: Problems, progress,
and potential in theory and research. Psychological Bulletin, 127(1), 87–127.
Page 296
278
doi.org/10.1037/0033-2909.127.1.87
Connidis, I. A. (1989). The subjective experience of aging: Correlates of divergent
views. Canadian Journal on Aging, 8(492), 7–18.
doi.org/10.1017/S0714980800011168
Connor-Smith, J. K., & Flachsbart, C. (2007). Relations between personality and
coping: A meta-analysis. Journal of Personality and Social Psychology, 93(6),
1080–1107. doi.org/10.1037/0022-3514.93.6.1080
Conversano, C., Rotondo, A., Lensi, E., Della Vista, O., Arpone, F., & Reda, M. A.
(2010). Optimism and its impact on mental and physical well-being. Clinical
Psychology and Practice and Epidemiology in Mental Health, 6, 25–29.
doi.org/10.2174/1745017901006010025
Costa, P. T., & McCrae, R. R. (1992). Revised NEO Personality Inventory (NEO-PI–R)
and the NEO Five-Factor Inventory (NEO-FFI) professional manual. Odessa, FL:
Psychological Assessment Resources.
Costa, P. T., & McCrae, R. R. (2006). Age changes in personality and their origins:
Comment on Roberts, Walton, and Viechtbauer (2006). Psychological
Bulletinulletin, 132(1), 26–28. doi.org/10.1037/0033-2909.132.1.26
Coudin, G., & Alexopoulos, T. (2010). “Help me! I”m old!’ How negative aging
stereotypes create dependency among older adults. Aging and Mental Health,
14(5), 516–523. doi.org/10.1080/13607861003713182
Craciun, C. (2011). Successful aging-utopia or the result of lifelong learning? Meaning
and representations of ageing in romanian elderly. Ageing International, 37(4),
373–385. doi.org/10.1007/s12126-011-9131-2
Cramm, J. M., & Nieboer, A. P. (2017). Positive ageing perceptions among migrant
Turkish and native Dutch older people: a matter of culture or resources? BMC
Geriatrics, 17(1), 159. doi.org/10.1186/s12877-017-0549-6
Cutler, R. G. (1990). Evolutionary perspective of human longevity. In W. R. Hazzard,
R. Andres, E. L. Bierman, & J. P. Blass (Eds.), Principles of geriatric medicine
and gerontology (pp. 15–21). New York: McGraw-Hill.
Dahlgren, G., & Whitehead, M. (2007). Policies and strategies to promote social equity
in health. Background document to WHO – Strategy paper for Europe (Vol. 14).
Page 297
279
doi.org/978-91-85619-18-4
de Ridder, D. T. D., & de Wit, J. B. F. (2006). Self-regulation in health behavior:
Concepts, theories, and central issues. In D. T. D. de Ridder & J. B. F. de Wit
(Eds.), Self-regulation in health behavior (pp. 1–23). West Sussex, England: John
Wiley & Sons Ltd. doi.org/10.1002/9780470713150.ch1
Demakakos, P., Gjonca, E., & Nazroo, J. (2007). Age identity, age perceptions, and
health: Evidence from the English Longitudinal Study of Ageing. Annals Of The
New York Academy Of Sciences, 1114(1), 279–287.
doi.org/10.1196/annals.1396.021
Demakakos, P., Hacker, E., & Gjonca, E. (2006). Perceptions of ageing. In J. Banks, E.
Breeze, C. Lessof, & J. Nazroo (Eds.), Retirement, health and relationships of the
older population in England: The 2004 English Longitudinal Study of Ageing
(Wave 2) (pp. 339–366). London, UK: The Institute for Fiscal Studies.
Dempster, M., Howell, D., & McCorry, N. K. (2015). Illness perceptions and coping in
physical health conditions: A meta-analysis. Journal of Psychosomatic Research,
79(6), 506–513. doi.org/10.1016/j.jpsychores.2015.10.006
Dempster, M., & McCorry, N. K. (2012). The factor structure of the revised illness
perceptions questionnaire in a population of oesophageal cancer survivors. Psycho-
Oncology, 21(5), 524–530. doi.org/http://dx.doi.org/10.1002/pon.1927
Depp, C. A., & Jeste, D. V. (2006). Definitions and predictors of successful aging: A
comprehensive review of larger quantitative studies. American Journal of
Geriatric Psychiatry, 14(1), 6–20. doi.org/10.1176/foc.7.1.foc137
Depp, C., Vahia, I. V, & Jeste, D. (2010). Successful aging: Focus on cognitive and
emotional health. Annual Review of Clinical Psychology, 6, 19.1-19.24.
doi.org/10.1146/annurev.clinpsy.121208.131449
Diefenbach, M. A., & Leventhal, H. (1996). The common-sense model of illness
representation: Theoretical and practical considerations. Journal of Social Distress
and the Homeless, 5(1), 11–38. doi.org/10.1007/BF02090456
Diehl, M., Coyle, N., & Labouvie-Vief, G. (1996). Age and sex differences in strategies
of coping and defense across the life-span. Psychology and Aging, 11, 127–139.
doi.org/10.1037//0882-7974.11.1.127
Page 298
280
Diehl, M., & Hooker, K. (2013). Adult personality development: Dynamics and
processes. Research in Human Development, 10(1), 1–8.
doi.org/10.1080/15427609.2013.760256
Diehl, M. K., & Wahl, H. W. (2010). Awareness of age-related change: Examination of
a (mostly) unexplored concept. Journal of Gerontology: Social Sciences, 65B(3),
340–350. doi.org/10.1093/geronb/gbp110.
Diehl, M., Wahl, H., Brothers, A., & Miche, M. (2015). Subjective aging and awareness
of aging: Toward a new understanding of the aging self. Annual Review of
Gerontology and Geriatrics, 35(Research on subjective aging: New developments
and future directions), 1–28. doi.org/10.1891/0198-8794.35.1
Diehl, M., Wahl, H. W., Barrett, A. E., Brothers, A. F., Miche, M., Montepare, J. M., …
Wurm, S. (2014). Awareness of aging: Theoretical considerations on an emerging
concept. Developmental Review, 34(2), 93–113. doi.org/10.1016/j.dr.2014.01.001
Diener, E. (2000). Subjective well-being. The science of happiness and a proposal for a
national index. American Psychologist, 55(1), 34–43. doi.org/10.1037/0003-
066X.55.1.34
Diener, E. (2006). Guidelines for national indicators of subjective well-being and ill-
being. Journal of Happiness Studies, 7(4), 397–404. doi.org/10.1007/s10902-006-
9000-y
Diener, E., Emmons, R., Larsen, R., & Griffin, S. (1985). The Satisfaction With Life
Scale. Journal of Personality Assessment, 49(1), 71–75.
doi.org/10.1207/s15327752jpa4901_13
Diener, E., Inglehart, R., & Tay, L. (2013). Theory and validity of life satisfaction
scales. Social Indicators Research, 112(3), 497–527. doi.org/10.1007/s11205-012-
0076-y
Diener, E., Oishi, S., & Lucas, R. E. (2003). Personality, culture, and subjective well-
being: Emotional and cognitive evaluations of life. Annual Review of Psychology,
54, 403–425. doi.org/10.1146/annurev.psych.54.101601.145056
Diener, E., & Suh, E. M. (1998). Subjective wellbeing and age: An international
analysis. In K. W. Schaie & M. P. Lawton (Eds.), Annual Review of Gerontology
and Geriatrics, Volume 17, 1997: Focus on Emotion and Adult Development (pp.
Page 299
281
304–324). New York, NY: Springer Publishing Company.
Dinovo, S. A., & Vasey, M. W. (2011). Reactive and self-regulatory dimensions of
temperament: Interactive relations with symptoms of general distress and
anhedonia. Journal of Research in Personality, 45(5), 430–440.
doi.org/10.1016/j.jrp.2011.05.002
Dionigi, R. A. (2015). Stereotypes of aging: Their effects on the health of older adults.
Journal of Geriatrics, 2015(Article ID 954027), 1–9.
doi.org/10.1155/2015/954027
Dolan, P., & Metcalfe, R. (2012). Measuring subjective wellbeing: Recommendations
on measures for use by national governments. Journal of Social Policy, 41(2),
409–427. doi.org/10.1017/S0047279411000833
Drapeau, A., Marchand, A., & Beaulieu-Prévost, D. (2011). Epidemiology of
psychological distress. In L. L’Abate (Ed.), Mental illnesses - Understanding,
prediction and control (pp. 105–134). InTech Open Access Publisher.
doi.org/10.5772/30872
Ebata, A. T., & Moos, R. H. (1991). Coping and adjustment in distressed and health
adolescents. Journal of Applied Developmental Psychology, 12, 33–54.
doi.org/10.1016/0193-3973(91)90029-4
Eibach, R. P., Mock, S. E., & Courtney, E. A. (2010). Having a “senior moment”:
Induced aging phenomenology, subjective age, and susceptibility to ageist
stereotypes. Journal of Experimental Social Psychology, 46, 643–649.
doi.org/10.1016/j.jesp.2010.03.002
Ellis, P. D. (2010). The essential guide to effect sizes: Statistical power, meta-analysis,
and the interpretation of research results (1st ed.). Cambridge, UK: Cambridge
University Press.
Evans, D., & Norman, P. (2009). Illness representations, coping and psychological
adjustment to Parkinson’s disease. Psychology and Health, 24(10), 1181–1196.
doi.org/10.1080/08870440802398188
Fairchild, A. J., MacKinnon, D. P., Taborga, M. P., & Taylor, A. B. (2009). R2 effect-
size measures for mediation analysis. Behavior Research Methods, 41(2), 486–498.
doi.org/10.3758/BRM.41.2.486
Page 300
282
Ferrari, A. J., Charlson, F. J., Norman, R. E., Patten, S. B., Freedman, G., Murray, C. J.
L., Whiteford, H. A. (2013). Burden of depressive disorders by country, sex, age,
and year: Findings from the global burden of disease study 2010. PLOS Medicine,
10(11), 1–12. doi.org/10.1371/journal.pmed.1001547
Ferreira, L., Neves, A. N., & Tavares, M. (2014). Validity of body image scales for
Brazilian older adults. Motriz. Revista de Educacao Fisica, 20(4), 359–373.
doi.org/10.1590/S1980-65742014000400002
Field, A., Miles, J., & Field, Z. (2013). Discovering statistics using SPSS (3rd ed.).
London, UK: SAGE Publications. doi.org/10.1111/insr.12011_21
Figueiras, M. J., & Alves, N. C. (2007). Lay perceptions of serious illnesses: An
adapted version of the Revised Illness Perception Questionnaire (IPQ-R) for
healthy people. Psychology and Health, 22(2), 143–158.
doi.org/10.1080/14768320600774462
Fiske, A., Gatz, M., & Pedersen, N. L. (2003). Depressive symptoms and aging: The
effects of illness and non-health-related events. The Journals of Gerontology.
Series B, Psychological Sciences and Social Sciences, 58B(6), P320–P328.
doi.org/10.1093/geronb/58.6.p320
Fiske, A., & Jones, R. S. (2005). Depression. In M. M. Johnson (Ed.), The Cambridge
Handbook of Age and Ageing (pp. 245–251). Cambridge, UK: Cambridge
University Press.
Folkman, S., & Lazarus, R. S. (1980). An analysis of coping in a middle-aged
community sample. Journal of Health and Social Behavior, 21(3), 219–239.
doi.org/10.2307/2136617
Folkman, S., Lazarus, R. S., Pimley, S., & Novacek, J. (1987). Age differences in stress
and coping processes. Psychology and Aging, 2(2), 171–184.
doi.org/10.1037/0882-7974.2.2.171
Freeman, A. T., Santini, Z. I., Tyrovolas, S., Rummel-Kluge, C., Haro, J. M., &
Koyanagi, A. (2016). Negative perceptions of ageing predict the onset and
persistence of depression and anxiety: Findings from a prospective analysis of the
Irish Longitudinal Study on Ageing (TILDA). Journal of Affective Disorders, 199,
132–138. doi.org/10.1016/j.jad.2016.03.042
Page 301
283
French, D. J., Sargent-cox, K., & Luszcz, M. A. (2012). Correlates of subjective health
across the ageing lifespan: Understanding self-rated health in the oldest-old.
Journal of Aging and Health, 24(8), 1449–1469.
doi.org/10.1177/0898264312461151
Friedman, H., Kern, M. L., Hampson, S., & Duckworth, A. L. (2014). A new life-span
approach to conscientiousness and health: Combining the pieces of the causal
puzzle. Developmental Psychology, 50(5), 1377–1389. doi.org/10.1037/a0030373
Friedman, H. S. (2000). Long-term relations of personality and health: Dynamisms,
mechanisms, tropisms. Journal of Personality, 68(6), 1089–1107.
doi.org/10.1111/1467-6494.00127
Friedman, H. S., & Kern, M. L. (2014). Personality, well-being, and health. Annual
Review of Psychology, 65(1), 719–742. doi.org/10.1146/annurev-psych-010213-
115123
Fries, J. F. (1980). Aging, natural death, and the compression of morbidity. The New
England Journal of Medicine, 303(3), 245–250.
doi.org/10.1056/nejm198012043032317
Fritz, M. S., & Arthur, A. M. (2017). Moderator variables. In Oxford Research
Encyclopedia of Psychology (pp. 1–32).
doi.org/10.1093/acrefore/9780190236557.013.86
Gana, K., Alaphilippe, D., & Bailly, N. (2004). Positive illusions and mental and
physical health in later life. Aging & Mental Health, 8(1), 58–64.
doi.org/10.1081/13607860310001613347
Gariépy, G., Honkaniemi, H., & Quesnel-Vallée, A. (2016). Social support and
protection from depression: systematic review of current findings in Western
countries. The British Journal of Psychiatry, 209, 284–293.
doi.org/10.1192/bjp.bp.115.169094
George, L. K. (2005). Stress and coping. In M. M. Johnson (Ed.), The Cambridge
Handbook of Age and Ageing (pp. 292–300). Cambridge, UK: Cambridge
University Press.
Gjørup, T., Hendriksen, C., Lund, E., & Strømgard, E. (1987). Is growing old a disease?
A study of the attitudes of elderly people to physical symptoms. Journal of
Page 302
284
Chronic Diseases, 40(12), 1095–1098. doi.org/10.1016/0021-9681(87)90076-2
Glaesmer, H., Rief, W., Martin, A., Mewes, R., Brähler, E., Zenger, M., & Hinz, A.
(2012). Psychometric properties and population-based norms of the Life
Orientation Test Revised (LOT-R). British Journal of Health Psychology, 17(2),
432–445. doi.org/10.1111/j.2044-8287.2011.02046.x
Gloster, A. T., Rhoades, H. M., Novy, D., Klotsche, J., Senior, A., Kunik, M., …
Stanley, M. A. (2008). Psychometric properties of the Depression Anxiety and
Stress Scale-21 in older primary care patients. Journal of Affective Disorders,
110(3), 248–259. doi.org/10.1016/j.jad.2008.01.023
Goldberg, L. R. (1992). The development of markers for the big-five factor structure.
Psychological Assessment, 4(1), 26–42. doi.org/https://doi.org/10.1037//1040-
3590.4.1.26
Goldberg, L. R. (1993). The structure of phenotypic personality traits. The American
Psychologist. doi.org/10.1037/0003-066X.48.12.1302
Goldberg, L. R., Johnson, J. A., Eber, H. W., Hogan, R., Ashton, M. C., Cloninger, C.
R., & Gough, H. G. (2006). The international personality item pool and the future
of public-domain personality measures. Journal of Research in Personality, 40(1),
84–96. doi.org/10.1016/j.jrp.2005.08.007
Good, G. A., La Grow, S. J., & Alpass, F. M. (2011). A study of older adults:
Observation of ranges of life satisfaction and functioning. New Zealand Journal of
Psychology, 40(3), 96–103.
Goodger, B., Byles, J., Higganbotham, N., & Mishra, G. (1999). Assessment of a short
scale to measure social support among older people. Australian and New Zealand
Journal of Public Health, 23(3), 260–265. doi.org/10.1111/j.1467-
842x.1999.tb01253.x
Goulia, P., Papadimitriou, I., Machado, M. O., Mantas, C., Pappa, C., Tsianos, E., …
Hyphantis, T. (2012). Does psychological distress vary between younger and older
adults in health and disease? Journal of Psychosomatic Research, 72(2), 120–128.
doi.org/10.1016/j.jpsychores.2011.11.011
Gravetter, F. J., & Wallnau, L. B. (2013). Essentials of statistics for the behavioral
sciences (6th ed.). Belmont, CA: Wadsworth.
Page 303
285
Gray, S. E., & Rutter, D. R. (2007). Illness representations in young people with chronic
fatigue syndrome. Psychology and Health, 22(2), 159–174.
doi.org/http://dx.doi.org/10.1080/ 14768320600774595
Greenspoon, P. J., & Saklofske, D. H. (2001). Toward an integration of subjective well-
being and psychopathology. Social Indicators Research, 54(1), 81–108.
doi.org/10.1023/A:1007219227883
Gum, A. M., McDougal, S. J., McIlvane, J. M., & Mingo, C. A. (2009). Older adults are
less likely to identify depression without sadness. Journal of Applied Gerontology,
29(5), 603–621. doi.org/10.1177/0733464809343106
Gump, B. B., Matthews, K. A., Scheier, M. F., Schulz, R., Bridges, M. W., &
Magovern, Sr, G. J. (2001). Illness representations according to age and effects on
health behaviors following coronary artery bypass graft surgery. Journal of the
American Geriatrics Society, 49(3), 284–289. doi.org/10.1046/j.1532-
5415.2001.4930284.x
Hagger, M. S., & Orbell, S. (2003). A meta-analytic review of the common-sense model
of illness representations. Psychology and Health, 18(2), 141–184.
doi.org/10.1080/088704403100081321
Hale, E. D., Treharne, G. J., & Kitas, G. D. (2007). The common-sense model of self-
regulation of health and illness: How can we use it to understand and respond to
our patients’ needs? Rheumatology, 46(6), 904–906.
doi.org/10.1093/rheumatology/kem060
Hardy, S. E., Allore, H., & Studenski, S. A. (2009). Missing data: A special challenge in
aging research. Journal of the American Geriatrics Society, 57(4), 722–729.
doi.org/10.1111/j.1532-5415.2008.02168.x
Haug, M. R., Musil, C. M., Warner, C. D., & Morris, D. L. (1998). Interpreting bodily
changes as illness: A longitudinal study of older adults. Social Science and
Medicine, 46(12), 1553–1567. doi.org/10.1016/s0277-9536(98)00010-0
Hayes, A. F. (2009). Beyond Baron and Kenny: Statistical mediation analysis in the
new millennium. Communication Monographs, 76(4), 408–420.
doi.org/10.1080/03637750903310360
Hayes, A. F. (2012). PROCESS: A versatile computational tool for observed variable
Page 304
286
mediation, mod- eration, and conditional process modeling [White paper].
Retrieved from http://www.afhayes.com/ public/process2012.pdf
Hayes, A. F. (2013). Introduction to mediation, moderation, and conditional process
analysis : A regression-based approach (Methodolog). New York: Guilford
Publications.
Hayes, A. F. (2016). Regression-based statistical mediation and moderation analysis in
clinical research: Observations, recommendations, and implementation. Invited
Submission to Behaviour Research and Therapy, (August), 1–24.
doi.org/10.1089/ten.tea.2011.0018
Heckhausen, J., & Schulz, R. (1995). A life-span theory of control. Psychological
Review, 102(2), 284–304. doi.org/10.1037/0033-295X.102.2.284
Heckhausen, J., Wrosch, C., & Schulz, R. (2010). A motivational theory of life-span
development. Psychological Review, 117(1), 1–53. doi.org/10.1037/a0017668.A
Heijmans, M., & De Ridder, D. (1998). Structure and determinants of illness
representations in chronic disease: A comparison of Addison’s Disease and
Chronic Fatigue Syndrome. Journal of Health Psychology, 3(4), 523–537.
doi.org/10.1177/135910539800300406
Helson, R., & Kwan, V. S. Y. (2000). Personality development in adulthood: The broad
picture and processes in one longitudinal study. In S. Hampson (Ed.), Advances in
personality psychology (Vol. 1, pp. 77–106). Hove, England: Psychology Press.
Henderson, K. V, Goldsmith, R. E., & Flynn, L. R. (1995). Demographic characteristics
of subjective age. The Journal of Social Psychology.
doi.org/10.1080/00224545.1995.9712214
Heraty, N., & McCarthy, J. (2015). Unearthing psychological predictors of financial
planning for retirement among late career older workers: Do self-perceptions of
aging matter? Work, Aging and Retirement, 1(3), 274–283.
doi.org/10.1093/workar/wav008
Hess, T. M., Auman, C., Colcombe, S. J., & Rahhal, T. A. (2003). The impact of
stereotype threat on age differences in memory performance. Journal of
Gerontology: Psychological Sciences, 58(1), P3–P11.
doi.org/10.1093/geronb/58.1.P3
Page 305
287
Hess, T. M., & Hinson, J. T. (2006). Age-related variation in the influences of aging
stereotypes on memory in adulthood. Psychology and Aging, 21, 621–625.
doi.org/10.1037/0882-7974.21.3.621
Hickey, A., Hanlon, A. O., & McGee, H. (2010). Quality of life in community-dwelling
older people in Ireland: Association with ageing perceptions, physical health and
psychological well-being. The Irish Journal of Psychology, 31(3–4), 135–150.
doi.org/10.1080/03033910.2010.10446331
Holmes, T. H., & Rahe, R. H. (1967). The social readjustment rating scale. Journal of
Psychosomatic Research, 11(5), 213–218. doi.org/10.1016/0022-3999(67)90010-4
Hooker, K. (1992). Possible selves and perceived health in older adults and college
students. Journal of Gerontology: Psychological Sciences, 47(2), P85–P95.
doi.org/10.1093/geronj/47.2.p85
Hooker, K., & McAdams, D. P. (2003). Personality reconsidered: A new agenda for
aging research. The Journals of Gerontology. Series B, Psychological Sciences and
Social Sciences, 58(6), P296–P304. doi.org/10.1093/geronb/58.6.P296
Horton, S., Baker, J., Pearce, G. W., & Deakin, J. M. (2008). On the malleability of
performance: Implications for seniors. Journal of Applied Gerontology, 27(4),
446–465. doi.org/10.1177/0733464808315291
Horwitz, A. V. (2007). Distinguishing distress from disorder as psychological outcomes
of stressful social arrangements. Health:, 11(3), 273–289.
doi.org/10.1177/1363459307077542
Hou, Y., Zhang, D., Gu, J., Xue, F., Sun, Y., Wu, Q., … Wang, X. (2016). The
association between self-perceptions of aging and antihypertensive medication
adherence in older Chinese adults. Aging Clinical and Experimental Research,
28(6), 1113–1120. doi.org/10.1007/s40520-015-0516-z
House, J. S., Landis, K. R., & Umberson, D. (1988). Social relationships and health.
Science, 241(4865), 540–545.
Huber, C. (2013). Measures of effect size in Stata 13. Retrieved from
https://blog.stata.com/2013/09/05/measures-of-effect-size-in-stata-13/
Huber, M., Knottnerus, J. A., Green, L., van der Horst, H., Jadad, A. R., Kromhout, D.,
… Smid, H. (2011). How should we define health? BMJ (Clinical Research Ed.),
Page 306
288
343(9666), d4163. doi.org/10.1136/bmj.d4163
Hubley, A. M., & Hultsch, D. F. (1994). The relationship of personality trait variables
to subjective age identity in older adults. Research on Aging.
doi.org/10.1177/0164027594164005
Hubley, A. M., & Russell, L. B. (2009). Prediction of subjective age, desired age, and
age satisfaction in older adults: Do some health dimensions contribute more than
others? International Journal of Behavioral Development, 33(1), 12–21.
doi.org/10.1177/0165025408099486
Hugo, G. (2014). The demographic facts of ageing in Australia, Appendix Q for Aged
Care Financing Authority Second Annual Report. Retrieved from
https://agedcare.health.gov.au/ageing-and-aged-care-aged-care-reform-aged-care-
financing-authority/the-demographic-facts-of-ageing-in-australia
Hurt, C. S., Burn, D. J., Hindle, J., Samuel, M., Wilson, K., & Brown, R. G. (2014).
Thinking positively about chronic illness: An exploration of optimism, illness
perceptions and well-being in patients with Parkinson’s disease. British Journal of
Health Psychology, 19(2), 363–379. doi.org/10.1111/bjhp.12043
Hyde, M., Wiggins, R. D., Higgs, P., & Blane, D. B. (2003). A measure of quality of
life in early old age: The theory, development and properties of a needs satisfaction
model (CASP-19). Aging and Mental Health, 7(3), 186–194.
doi.org/10.1080/1360786031000101157
Idler, E. L. (1992). Self-assessed health and mortality: A review of studies. In S. Maes,
H. Leventhal, & M. Johnston (Eds.), International Review of Health Psychology
(pp. 33–54). Wiley.
Idler, E. L., & Benyamini, Y. (1997). Self-rated health and mortality: A review of
twenty-seven community studies. Journal of Health and Social Behavior, 38, 21–
37. doi.org/10.2307/2955359
Idler, E. L., & Kasl, S. V. (1995). Self-ratings of health: Do they also predict change in
functional ability? Journal of Gerontology: Social Sciences, 50B(6), 344–353.
doi.org/10.1093/geronb/50b.6.s344
Ingrand, I., Houeto, J. L., Gil, R., McGee, H., Ingrand, P., & Paccalin, M. (2012). The
validation of a French-language version of the Aging Perceptions Questionnaire
Page 307
289
(APQ) and its extension to a population aged 55 and over. BMC Geriatrics, 12(1),
17. doi.org/10.1186/1471-2318-12-17
Jackson, J. J., Hill, P. L., Payne, B. R., Roberts, B. W., & Stine-Morrow, E. A. L.
(2012). Can an old dog learn (and want to experience) new tricks? Cognitive
training increases openness to experience in older adults. Psychology and Aging,
27(2), 286–292. doi.org/10.1037/a0025918
Jang, Y., Poon, L. W., Kim, S.-Y., & Shin, B.-K. (2004). Self-perception of aging and
health among older adults in Korea. Journal of Aging Studies, 18(4), 485–496.
doi.org/10.1016/j.jaging.2004.06.001
Jeste, D. V, Salva, G. N., Thompson, W. K., Vahia, I. V, Glorioso, D. K., Martin, A. S.,
… Depp, C. A. (2013). Association between older age and more successful aging:
Critical role of resilience and depression. The American Journal of Psychiatry,
170(2), 188–196. doi.org/10.1176/appi.ajp.2012.12030386
Jivraj, S., Nazroo, J., Vanhoutte, B., & Chandola, T. (2014). Aging and subjective well-
being in later life. The Journals of Gerontology Series B: Psychological Sciences
and Social Sciences, 69(6), 930–941. doi.org/10.1093/geronb/gbu006
Job, V., Dweck, C. S., & Walton, G. M. (2010). Ego depletion-Is it all in your head?:
Implicit theories about willpower affect self-regulation. Psychological Science,
21(11), 1686–1693. doi.org/10.1177/0956797610384745
John, Oliver, P., & Srivastava, S. (1999). The big five trait taxonomy: History,
measurement, and theoretical perspectives. In L. A. Pervin & O. P. John (Eds.),
Handbook of personality: Theory and research (2nd ed., pp. 102–138). New York:
Guilford Press.
Jorm, A. F. (2000). Does old age reduce the risk of anxiety and depression? A review of
epidemiological studies across the adult life span. Psychological Medicine, 30, 11–
22. doi.org/10.1017/s0033291799001452
Jorm, A. F., Windsor, T. D., Dear, K. B. G., Anstey, K. J., Christensen, H., & Rodgers,
B. (2005). Age group differences in psychological distress: The role of
psychosocial risk factors that vary with age. Psychological Medicine, 35, 1253–
1263. doi.org/10.1017/s0033291705004976
Jylhä, M. (2009). What is self-rated health and why does it predict mortality? Towards a
Page 308
290
unified conceptual model. Social Science and Medicine, 69(3), 307–316.
doi.org/10.1016/j.socscimed.2009.05.013
Kahana, E., & Kahana, B. (1996). Conceptual and empirical advances in understanding
aging well through proactive adaptation. In V. L. Bengtson (Ed.), Adulthood and
aging: Research on continuities and discontinuities (pp. 18–41). New York, NY:
Springer Publishing Company.
Kahn, R. L. (2004). Successful aging: Myth or reality. The 2004 Leon and Josephine
Winkelman Lecture. University of Michigan School of Social Work.
Kam, C., & Meyer, J. P. (2012). Do optimism and pessimism have different
relationships with personality dimensions? A re-examination. Personality and
Individual Differences, 52(2), 123–127. doi.org/10.1016/j.paid.2011.09.011
Karademas, E. C., Kynigopoulou, E., Aghathangelou, E., & Anestis, D. (2011). The
relation of illness representations to the “end-stage” appraisal of outcomes through
health status, and the moderating role of optimism. Psychology and Health, 26(5),
567–583. doi.org/10.1080/08870441003653488
Karel, M. J. (1997). Aging and depression: Vulnerability and stress across adulthood.
Clinical Psychology Review, 17(8), 847–879. doi.org/10.1016/s0272-
7358(97)00053-6
Kashdan, T. B., & Rottenberg, J. (2010). Psychological flexibility as a fundamental
aspect of health. Clinical Psychology Review, 30(7), 865–878.
doi.org/10.1016/j.cpr.2010.03.001
Katz, S., & Calasanti, T. (2014). Critical perspectives on successful aging: Does it
“appeal more than it illuminates”? The Gerontologist, Advance online publication.
doi.org/10.1093/geront/gnu027
Kaufman, G., & Elder, G. H. (2002). Revisiting age identity: A research note. Journal
of Aging Studies, 16(2), 169–176. doi.org/10.1016/s0890-4065(02)00042-7
Kaufman, G., & Elder, G. H. (2003). Grandparenting and age identity. Journal of Aging
Studies, 17(3), 269–282. doi.org/10.1016/S0890-4065(03)00030-6
Kavirajan, H., Vahia, V, I., Thompson, W. K., Depp, C., Allison, M., & Jeste, D. V.
(2011). Attitude toward own aging and mental health in postmenopausal women.
Asian Journal in Psychiatry, 4(1), 26–30.
Page 309
291
doi.org/10.1016/j.ajp.2011.01.006.Attitude
Kawachi, I., & Berkman, L. F. (2001). Social ties and mental health. J Urban Health,
78(3), 458–467. doi.org/10.1093/jurban/78.3.458
Kearney, P. M., Cronin, H., O’Regan, C., Kamiya, Y., Savva, G. M., Whelan, B., &
Kenny, R. A. (2011). Cohort profile: The Irish Longitudinal Study on Ageing.
International Journal of Epidemiology, 40(4), 877–884. doi.org/10.1093/ije/dyr116
Keller, M. L., Leventhal, E. A., & Larson, B. (1989). Aging: The lived experience.
International Journal of Aging and Human Development, 29, 67–82.
doi.org/10.2190/deqq-aauv-nbu0-3rmy
Keller, M. L., Leventhal, H., Prohaska, T. R., & Leventhal, E. A. (1989). Beliefs about
aging and illness in a community sample. Research in Nursing and Health, 12(4),
247–255. doi.org/10.1002/nur.4770120407
Kercher, K. (1992). Assessing subjective well-being in the old-old: The PANAS as a
measure of orthogonal dimensions of positive and negative affect. Research on
Aging, 14(2), 131–168. doi.org/10.1177/0164027592142001
Kessler, E.-M., & Staudinger, U. M. (2009). Affective experience in adulthood and old
age: The role of affective arousal and perceived affect regulation. Psychology and
Aging, 24(2), 349–362. doi.org/10.1037/a0015352
Keyes, C. L. M. (1998). Social well-being. Social Psychology Quarterly, 61(2), 121–
140. doi.org/10.2307/2787065
Keyes, C. L. M. (2005). Mental illness and/or mental health? Investigating axioms of
the complete state model of health. Journal of Consulting and Clinical Psychology,
73(3), 539–548. doi.org/10.1037/0022-006X.73.3.539
Keyes, C. L. M., & Westerhof, G. J. (2012). Chronological and subjective age
differences in flourishing mental health and major depressive episode. Aging &
Mental Health, 16(1), 67–74. doi.org/10.1080/13607863.2011.596811
Kite, M. E., Stockdale, G. D., Whitley, B. E., & Johnson, B. T. (2005). Attitudes toward
younger and older adults: An updated meta-analytic review. Journal of Social
Issues, 61(2), 241–266. doi.org/10.1111/j.1540-4560.2005.00404.x
Kleinspehn-Ammerlahn, A., Kotter-Grühn, D., & Smith, J. (2008). Self-perceptions of
aging: Do subjective age and satisfaction with aging change during old age?
Page 310
292
Journal of Gerontology: Psychological Sciences, 63B(6), P377–P385.
doi.org/10.1093/geronb/63.6.p377
Kline, R. B. (2011). Principles and practice of structural equation modeling. New
York: Guilford Press.
Klusmann, V., Evers, A., Schwarzer, R., & Heuser, I. (2012). Views on aging and
emotional benefits of physical activity: Effects of an exercise intervention in older
women. Psychology of Sport and Exercise, 13(2), 236–242.
doi.org/10.1016/j.psychsport.2011.11.001
Knibb, R. C., & Horton, S. L. (2008). Can illness perceptions and coping predict
psychological distress amongst allergy sufferers? British Journal of Health
Psychology, 13, 103–119. doi.org/10.1348/135910706x173278
Knoll, N., Rieckmann, N., Scholz, U., & Schwarzer, R. (2004). Predictors of subjective
age before and after cataract surgery: Conscientiousness makes a difference.
Psychology and Aging, 19(4), 676–688. doi.org/10.1037/0882-7974.19.4.676
Koenig, H. G., Westlund, R. E., George, L. K., Hughes, D. C., Blazer, D. G., & Hybels,
C. (1993). Abbreviating the Duke Social Support Index for use in chronically ill
elderly individuals. Psychosomatics, 34(1), 61–69. doi.org/10.1016/s0033-
3182(93)71928-3
Kotter-Grühn, D. (2015). Changing negative views of aging: Implications for
intervention and translational research. Annual Review of Gerontology and
Geriatrics, 35(1), 167–186. doi.org/10.1891/0198-8794.35.167
Kotter-Grühn, D., & Hess, T. M. (2012). The impact of age stereotypes on self-
perceptions of aging across the adult lifespan. The Journals of Gerontology, Series
B: Psychological Sciences and Social Sciences, 67(5), 563–571.
doi.org/10.1093/geronb/gbr153.
Kotter-Grühn, D., Kleinspehn-Ammerlahn, A., Gerstorf, D., & Smith, J. (2009). Self-
perceptions of aging predict mortality and change with approaching death: 16-year
longitudinal results from the Berlin Aging Study. Psychology and Aging, 24(3),
654–667. doi.org/10.1037/a0016510
Kunzmann, U., Little, T. D., & Smith, J. (2000). Is age-related stability of subjective
well-being a paradox? Cross-sectional and longitudional evidence from the Berlin
Page 311
293
Aging Study. Psychology and Aging, 15(3), 511–526. doi.org/10.1037//0882-
7974.15.3.511
Kwak, M., Ingersoll-Dayton, B., & Burgard, S. (2014). Receipt of care and depressive
symptoms in later life: The importance of self-perceptions of aging. Journals of
Gerontology - Series B Psychological Sciences and Social Sciences, 69(2), 325–
335. doi.org/10.1093/geronb/gbt128
Labouvie-Vief, G. (2009). Cognition and equilibrium regulation in development and
aging. Restorative Neurology and Neuroscience, 27(5), 551–565.
doi.org/10.3233/RNN-2009-0512
Lahey, B. B. (2009). Public health significance of neuroticism. American Psychologist,
64(4), 241–256. doi.org/10.1037/a0015309
Lai, D. W. L. (2009). Older chinese’ attitudes toward aging and the relationship to
mental health: an international comparison. Social Work in Health Care,
48(December), 243–59. doi.org/10.1080/00981380802591957
Laidlaw, K., Power, M. J., Schmidt, S., & WHOQOL-OLD Group. (2007). The
attitudes to ageing questionnaire (AAQ): Development and psychometric
properties. International Journal of Geriatric Psychiatry, 22, 367–379.
doi.org/10.1002/gps1683
Larson, J. S. (1999). The Conceptualization of health. Medical Care Research and
Review, 56(2), 123–136. doi.org/10.1177/107755879905600201
Lau, R. R., Bernard, T. M., & Hartman, K. A. (1989). Further explorations of common-
sense representations of common illnesses. Health Psychology, 8(2), 195–219.
doi.org/10.1037//0278-6133.8.2.195
Lau, R. R., & Hartman, K. A. (1983). Common sense representations of common
illnesses. Health Psychology, 2(2), 167–185. doi.org/10.1037/0278-6133.2.2.167
Law, J., Laidlaw, K., & Peck, D. (2010). Is depression viewed as an inevitable
consequence of age? The “understandability phenomenon” in older people.
Clinical Gerontologist, 33(3), 194–209. doi.org/10.1080/07317111003773627
Lawton, M. P. (1975). The Philadelphia Geriatric Center Morale Scale: A revision.
Journal of Gerontology, 30(1), 85–89. doi.org/10.1093/geronj/30.1.85
Lazarus, R. S., & Folkman, S. (1984). Stress, appraisal, and coping. New York, NY:
Page 312
294
Springer.
Leibson, C. L., Garrard, J., Nitz, N., Waller, L., Indritz, M., Jackson, J., … Luepke, L.
(1999). The role of depression in the association between self-rated physical health
and clinically defined illness. The Gerontologist, 39(3), 291–298.
doi.org/10.1093/geront/39.3.291
Leszko, M., Elleman, L. G., Bastarache, E. D., Graham, E. K., & Mroczek, D. K.
(2015). Future directions in the study of personality in adulthood and older age.
Gerontology, 62(2), 210–215. doi.org/10.1159/000434720
Leventhal, E. A. (1984). Aging and the perception of illness. Research on Aging, 6(1),
119–135. doi.org/10.1177/0164027584006001007
Leventhal, E. A., Brissette, I., & Leventhal, H. (2003). The common-sense model of
self-regulation of health and illness. In L. Cameron & H. Leventhal (Eds.), The
self-regulation of health and illness behaviour (pp. 42–65). London: Routledge.
Leventhal, E. A., & Crouch, M. (1997). Are there differences in perceptions of illness
across the lifespan? In K. J. Petrie & J. Weinman (Eds.), Perceptions of health and
illness: Current research and applications (pp. 77–102). The Netherlands:
Harwood Acacdemic Publishers.
Leventhal, E. A., Easterling, D., Leventhal, H., & Cameron, L. (1995). Conservation of
energy, uncertainty reduction, and swift utilization of medical care among the
elderly: Study II. Medical Care, 33(10), 988–1000. doi.org/10.1097/00005650-
199510000-00002
Leventhal, E. A., Leventhal, H., Schaefer, P., & Easterling, D. V. (1993). Conservation
of energy, uncertainty reduction, and swift utilization of medical care among the
elderly. Journal of Gerontology, 48(2), 78–86. doi.org/10.1093/geronj/48.2.p78
Leventhal, H., Bodnar-Deren, S., Breland, J. Y., Hash-Converse, J., Phillips, L. A.,
Leventhal, E. A., & Cameron, L. D. (2012). Modeling health and illness behavior:
The approach of the Commonsense Model. In A. Baum, T. A. Revenson, & J.
Singer (Eds.), Handbook of Health Psychology (2nd ed., pp. 3–36). New York,
NY: Psychology Press.
Leventhal, H., Forster, R., & Leventhal, E. A. (2007). Self-regulation of health threats,
affect, and the self: Lessons from older adults. In C. M. Aldwin, C. L. Park, & A.
Page 313
295
Spiro III (Eds.), Handbook of Health Psychology and Aging (pp. 341–366).
Oxford, UK: Oxford University Press.
Leventhal, H., Leventhal, E. A., & Contrada, R. (1998). Self-regulation, health, and
behavior: A perceptual-cognitive approach. Psychology and Health, 13(4), 717–
733. doi.org/10.1080/08870449808407425
Leventhal, H., Meyer, D., & Nerenz, D. R. (1980). The common sense representation of
illness danger. In S. Rachman (Ed.), Contributions to Medical Psychology (pp. 7–
30). New York: Pergamon Press.
Leventhal, H., Nerenz, D. R., & Steele, D. F. (1984). Illness representations and coping
with health threats. In A. Singer & J. Singer (Eds.), A Handbook of Psychology and
Health (pp. 219–252). Hillsdale, NJ: Erlbaum.
Leventhal, H., Weinman, J., Leventhal, E. A., & Phillips, L. A. (2008). Health
psychology: The search for pathways between behavior and health. Annual Review
of Psychology, 59, 477–505. doi.org/10.1146/annurev.psych.59.103006.093643
Levy, B. R. (1996). Improving memory in old age through implicit self-stereotyping.
Journal of Personality and Social Psychology, 71(6), 1092–1107.
doi.org/10.1037/0022-3514.71.6.1092
Levy, B. R. (2003). Mind matters: Cognitive and physical effects of aging self-
stereotypes. The Journals of Gerontology, 58B(4), 203–211.
doi.org/10.1093/geronb/58.4.p203
Levy, B. R. (2009). Stereotype embodiment: A psychosocial approach to aging. Current
Directions in Psychological Science, 18(6), 332–336. doi.org/10.1111/j.1467-
8721.2009.01662.x
Levy, B. R., Ashman, O., & Slade, M. D. (2009). Age attributions and aging health:
Contrast between the United States and Japan. Journal of Gerontology:
Psychological Sciences, 64B(3), 335–338. doi.org/10.1093/geronb/gbp002
Levy, B. R., Hausdorff, J. M., Hencke, R., & Wei, J. Y. (2000). Reducing
cardiovascular stress with positive self-stereotypes of aging. Journal of
Gerontology: Psychological Sciences, 55B(4), 205–213.
doi.org/10.1093/geronb/55.4.p205
Levy, B. R., & Leifheit-Limson, E. (2009). The stereotype-matching effect: Greater
Page 314
296
influence on functioning when age stereotypes correspond to outcomes.
Psychology and Aging, 24(1), 230–233. doi.org/10.1037/a0014563
Levy, B. R., & Myers, L. M. (2004). Preventive health behaviors influenced by self-
perceptions of aging. Preventive Medicine, 39(3), 625–629.
doi.org/10.1016/j.ypmed.2004.02.029
Levy, B. R., & Myers, L. M. (2005). Relationship between respiratory mortality and
self-perceptions of aging. Psychology and Health, 20(5), 553–564.
doi.org/10.1080/14768320500066381
Levy, B. R., Slade, M. D., & Kasl, S. V. (2002). Longitudinal benefit of positive self-
perceptions of aging on functional health. The Journals of Gerontology, 57B(5),
409–417. doi.org/10.1093/geronb/57.5.p409
Levy, B. R., Slade, M. D., Kunkel, S. R., & Kasl, S. V. (2002). Longevity increased by
positive self-perceptions of aging. Journal of Personality and Social Psychology,
83(2), 261–270. doi.org/10.1037//0022-3514.83.2.261
Levy, B. R., Zonderman, A. B., Slade, M. D., & Ferreira, L. (2012). Memory shaped by
age stereotypes over time. Journals of Gerontology - Series B Psychological
Sciences and Social Sciences, 67(4), 432–436. doi.org/10.1093/geronb/gbr120
Löckenhoff, C. E., Hsiao, C., Kim, J., & Swarts, K. (2016). Adult age differences in
health-related decision-making: A primer. In M. Diefenbach, S. Miller-Halegoua,
& D. J. Bowen (Eds.), Handbook of Health Decision Science (pp. 145–156). New
York, NY: Springer.
Lovibond, S. H., & Lovibond, P. F. (1995). Manual for the Depression Anxiety Stress
Scales (2nd ed.). Sydney: Psychology Foundation. doi.org/10.1037/t01004-000
Lowsky, D. J., Olshansky, S. J., Bhattacharya, J., & Goldman, D. P. (2014).
Heterogeneity in healthy aging. Journals of Gerontology - Series A Biological
Sciences and Medical Sciences, 69(6), 640–649. doi.org/10.1093/gerona/glt162
Lucas, R. E., & Gohm, C. (2000). Age and sex differences in subjective well-being
across cultures. In E. Diener & E. M. Suh (Eds.), Subjective well-being across
nations and cultures (pp. 291–317). Cambridge, MA: MIT Press.
Lupien, S. J., & Wan, N. (2004). Successful ageing: From cell to self. Philosophical
Transactions of the Royal Society of London. Series B, Biological Sciences, 359,
Page 315
297
1413–1426. doi.org/10.1098/rstb.2004.1516
Lurquin, J. H., Michaelson, L. E., Barker, J. E., Gustavson, D. E., Von Bastian, C. C.,
Carruth, N. P., & Miyake, A. (2016). No evidence of the ego-depletion effect
across task characteristics and individual differences: A pre-registered study. PLoS
ONE, 11(2), 1–20. doi.org/10.1371/journal.pone.0147770
Mackinnon, D. P. (1994). Analysis of mediating variables in prevention and
intervention research. In A. Cázares & L. Beatty (Eds.), Scientific methods for
prevention intervention research (pp. 127–154). doi.org/10.1037/e495892006-009
MacKinnon, D. P. (2008). Introduction to statistical mediation analysis. New York,
NY: Lawrence Erlbaum Associates. doi.org/10.4324/9780203809556
MacKinnon, D. P., Krull, J. L., & Lockwood, C. M. (2000). Equivalence of the
mediation, confounding and suppression effect. Prevention Science, 1(4), 173–181.
doi.org/10.1023/A1026595011371
Mackinnon, D. P., Lockwood, C. M., Hoffman, J. M., West, S. G., & Sheets, V. (2002).
A comparison of methods to test mediation and other intervening variable effects.
Psychological Medicine, 7(1), 1–35. doi.org/10.1038/cdd.2010.172.MicroRNAs
Mackinnon, D. P., & Luecken, L. J. (2008). How and for whom? Mediation and
moderation in health psychology. Health Psychology, 27. doi.org/10.1037/0278-
6133.27.2(Suppl.).S99.How
Mackinnon, D. P., Warsi, G., & Dwyer, J. H. (1995). A simulation study of mediated
effect measures. Multivariate Behavioral Research, 30(1), 41–62.
doi.org/10.1207/s15327906mbr3001_3
Maier, H., & Smith, J. (1999). Psychological predictors of mortality in old age. Journals
of Gerontology: Psychological Sciences, 54B(1), 44–54.
doi.org/10.1093/geronb/54b.1.p44
Malouff, J. M., & Schutte, N. S. (2016). Can psychological interventions increase
optimism? A meta-analysis. The Journal of Positive Psychology, 12(6), 594-604.
doi.org/10.1080/17439760.2016.1221122
Mann, T., de Ridder, D., & Fujita, K. (2013). Self-regulation of health behavior: Social
psychological approaches to goal setting and goal striving. Health Psychology,
32(5), 487–498. doi.org/10.1037/a0028533
Page 316
298
Marshall, G. N., Wortman, C. B., Kusulas, J. W., Hervig, L. K., & Vickers, R. R.
(1992). Distinguishing optimism from pessimism – Relations to fundamental
dimensions of mood and personality. Journal of Personality and Social
Psychology, 62, 1067–1074. doi.org/10.1037//0022-3514.62.6.1067
Martin, D. J., & Gillen, L. L. (2013). Revisiting gerontology’s scrapbook: From
Metchnikoff to the spectrum model of aging. Gerontologist, 54(1), 51–58.
doi.org/10.1093/geront/gnt073
Martin, L. S., Oades, L. G., & Caputi, P. (2014). Intentional personality change
coaching: A randomised controlled trial of participant selected personality facet
change using the Five-Factor model of personality. International Coaching
Psychology Review, 9(2), 196–209. doi.org/10.1177/1523422313520194
Masoudnia, E. (2016). Perceptions and beliefs on aging and their impact on elderly
general health: An appraisal of self-regulation model. Iranian Journal of Ageing,
11(912), 310–321. doi.org/10.21859/sija-1102310
Mazerolle, M., Régner, I., Morisset, P., Rigalleau, F., & Huguet, P. (2012). Stereotype
threat strengthens automatic recall and undermines controlled processes in older
adults. Psychological Science, 23(7), 723–727.
doi.org/10.1177/0956797612437607
McAdams, D. P., & Olson, B. D. (2010). Personality development: Continuity and
change over the life course. Annual Review of Psychology, 61(1), 517–542.
doi.org/10.1146/annurev.psych.093008.100507
McCrae, R. R. (2010). The place of the FFM in personality psychology. Psychological
Inquiry, 21(1), 57–64. doi.org/10.1080/10478401003648773
McCrae, R. R., & Costa, P. T. (1994). The stability of personality: Observation and
evaluations. Current Directions in Psychological Science, 3(6), 173–175.
doi.org/10.1111/1467-8721.ep10770693
McGee, H., Morgan, K., Hickey, A., Burke, H., & Savva, G. (2011). Quality of life and
beliefs about ageing. (A. Barrett, G. Savva, V. Timonen, & R. A. Kenny, Eds.),
Fifty plus in Ireland 2011. First results from the Irish Longitudinal Study on
Ageing (TILDA). Dublin: Trinity College Dublin. Retrieved from
http://epubs.rcsi.ie/cgi/viewcontent.cgi?article=1047&context=psycholrep
Page 317
299
McGee, H., O’Hanlon, A., Barker, M., Hickey, A., Garavan, R., Conroy, R., … O’Neill,
D. (2005). One island – two systems: A comparison of health status and health and
social service use by community-dwelling older people in the Republic of Ireland
and Northern Ireland. Dublin. Retrieved from
https://epubs.rcsi.ie/cgi/viewcontent.cgi?article=1012&context=psycholrep
McHugh, J. E., & Lawlor, B. A. (2012). Social support differentially moderates the
impact of neuroticism and extraversion on mental wellbeing among community-
dwelling older adults. Journal of Mental Health, 21(5), 448–458.
doi.org/10.3109/09638237.2012.689436
Menec, V. H., & Chipperfield, J. G. (1997). The interactive effect of perceived control
and functional status on health and mortality among young-old and old-old adults.
The Journals of Gerontology, 52B(3), 118–126.
doi.org/10.1093/geronb/52b.3.p118
Merkin, S. S., Cavanaugh, K., Longenecker, J. C., Fink, N. E., Levey, A. S., & Powe,
N. R. (2007). Agreement of self-reported comorbid conditions with medical and
physician reports varied by disease among end-stage renal disease patients. Journal
of Clinical Epidemiology, 60(6), 634–642. doi.org/10.1016/j.jclinepi.2006.09.003
Meyer, D., Leventhal, H., & Gutmann, M. (1985). Common-sense models of illness:
The example of hypertension. Health Psychology, 4(2), 115–135.
doi.org/10.1037//0278-6133.4.2.115
Miche, M., & Wahl, H. W. (2013). “It’s because of my age”: The influence of
experimentally increased salience of age-related changes in cognitive functioning
on self- perceptions of aging. Poster presented at the 66th Annual Scientific
Meeting of the Gerontological Society of America. New Orleans, LA.
Mirowsky, J. (2007). The distribution’s tail: A comment. Health:, 11(3), 301–302.
doi.org/10.1177/1363459307077544
Mirowsky, J., & Ross, C. E. (2002). Measurement for a human science. Journal of
Health and Social Behavior, 43(2), 152–170. doi.org/10.2307/3090194
Mock, S. E., & Eibach, R. P. (2011). Aging attitudes moderate the effect of subjective
age on psychological well-being: Evidence from a 10-year longitudinal study.
Psychology and Aging, 26(4), 979–86. doi.org/10.1037/a0023877
Page 318
300
Montepare, J. M. (2009). Subjective age: Toward a guiding lifespan framework.
International Journal of Behavioral Development, 33(1), 42–46.
doi.org/10.1177/0165025408095551
Montepare, J. M., & Lachman, M. E. (1989). “You’re only as old as you feel”: Self-
perceptions of age, fears of aging, and life satisfaction from adolescence to old age.
Psychology and Aging, 4(1), 73–78. doi.org/10.1037//0882-7974.4.1.73
Montross, L. P., Depp, C., Daly, J., Reichstadt, J., Golshan, S., Moore, D., … Jeste, D.
V. (2006). Correlates of self-rated successful aging among community-dwelling
older adults. The American Journal of Geriatric Psychiatry, 14(1), 43–51.
doi.org/10.1097/01.JGP.0000192489.43179.31
Moor, C., Zimprich, D., Schmitt, M., & Kliegel, M. (2006). Personality, aging self-
perceptions, and subjective health: A mediation model. International Journal of
Aging and Human Development, 63(3), 241–257. doi.org/10.2190/akry-um4k-
pb1v-pbhf
Moos, R. H., & Holahan, C. J. (2003). Dispositional and contextual perspectives on
coping: Toward an integrative framework. Journal of Clinical Psychology, 59(12),
1387–1403. doi.org/10.1002/jclp.10229
Mor, V. (2005). The compression of morbidity hypothesis: A review of research and
prospects for the future. Journal of the American Geriatrics Society, 53(9
SUPPL.), 308–310. doi.org/10.1111/j.1532-5415.2005.53496.x
Morgan, R., Pendleton, N., Clague, J. E., & Horan, M. A. (1997). Older people’s
perceptions about symptoms. British Journal of General Practice, 47, 427–430.
Moser, C., Spagnoli, J., & Santos-Eggimann, B. (2011). Self-perception of aging and
vulnerability to adverse outcomes at the age of 65 – 70 years. The Journals of
Gerontology, Series B: Psychological Sciences and Social Sciences, 66(6), 675–
680. doi.org/10.1093/geronb/gbr052.
Moss-Morris, R., Weinman, J., Petrie, K., Horne, R., Cameron, L., & Buick, D. (2002).
The Revised Illness Perception Questionnaire (IPQ-R). Psychology and Health,
17(1), 1–16. doi.org/10.1080/08870440290001494
Mroczek, D. K., & Kolarz, C. M. (1998). The effect of age on positive and negative
affect : A developmental perspective on happiness. Journal of Personality and
Page 319
301
Social Psychology, 75(5), 1333–1349. doi.org/10.1037//0022-3514.75.5.1333
Mroczek, D. K., & Spiro, A. (2003). Modelling intraindividual change in personality
traits: Findings from the Normative Aging Study. Journal of Gerontology:
Psychological Sciences, 58B(3), 153–165. doi.org/10.1093/geronb/58.3.p153
Mroczek, D. K., & Spiro III, A. (2005). Change in life satisfaction during adulthood:
Findings from the Veterans Affairs Normative Aging Study. Journal of Personality
and Social Psychology, 88(1), 189–202. doi.org/10.1037/0022-3514.88.1.189
Muraven, M., & Baumeister, R. F. (2000). Self-regulation and depletion of limited
resources: Does self-control resemble a muscle? Psychological Bulletin, 126, 247–
259. doi.org/10.1037//0033-2909.126.2.247
Muraven, M., Tice, D. M., & Baumeister, R. F. (1998). Self-control as limited resource:
Regulatory depletion patterns. Journal of Personality and Social Psychology, 74,
774–789. doi.org/10.1037//0022-3514.74.3.774
Murray, C. J. L., & Lopez, A. D. (1996). The global burden of disease: a
comprehensive assessment of mortality and disability from diseases, injuries, and
risk factors in 1990 and projected to 2020. Harvard School of Public Health on
behalf of the World Health Organization and the World Bank.
Naragon-Gainey, K., & Simms, L. J. (2017). Three-way interaction of neuroticism,
extraversion, and conscientiousness in the internalizing disorders: Evidence of
disorder specificity in a psychiatric sample. Journal of Research in Personality, 70,
16–26. doi.org/10.1016/j.jrp.2017.05.003
National Research Council. (2013). Subjective wellbeing: Measuring happiness,
suffering, and other dimensions of experience. Panel on measuring subjective well-
being in a policy-relevant framework. (A. A. Stone & C. Mackie, Eds.).
Washington, DC: The National Academies Press.
Newsom, J. T., & Schulz, R. (1996). Social support as a mediator in the relation
between functional status and quality of life in older adults. Psychology and Aging,
11(1), 34–44. doi.org/10.1037//0882-7974.11.1.34
Nilsson, M., Sarvimäki, a, & Ekman, S. L. (2000). Feeling old: being in a phase of
transition in later life. Nursing Inquiry, 7(1), 41–49. doi.org/10.1046/j.1440-
1800.2000.00049.x
Page 320
302
Nutbeam, D. (1998). Health Promotion Glossary. World Health Organization.
doi.org/10.1093/heapro/13.4.349
O’Connor, D. W. (2006). Do older Australians truly have low rates of anxiety and
depression? A critique of the 1997 National Survey of Mental Health and
Wellbeing. Australian and New Zealand Journal of Psychiatry, 40(8), 623–631.
doi.org/10.1080/j.1440-1614.2006.01861.x
O’Hanlon, A., & Coleman, P. (2008). Attitudes towards aging: Adaptation,
development and growth into later years. In J. F. Nussbaum & J. Coupland (Eds.),
Handbook of communication and aging research (2nd ed., pp. 31–67). New Jersey:
Lawrence Erlbaum Associates, Inc.
O’Shea, D. M., Dotson, V. M., & Fieo, R. A. (2016). Aging perceptions and self-
efficacy mediate the association between personality traits and depressive
symptoms in older adults. International Journal of Geriatric Psychiatry.
doi.org/10.1002/gps.4584
Öberg, P., & Tornstam, L. (2001). Youthfulness and fitness — Identity ideals for all
ages? Journal of Aging and Identity, 6(1), 15–29.
doi.org/10.1023/A:1009524612420
Ocampo, J. M. (2010). Self-rated health: Importance of use in elderly adults. Colombia
Médica, 41(3), 275–289.
Okura, Y., Urban, L. H., Mahoney, D. W., Jacobsen, S. J., & Rodeheffer, R. J. (2004).
Agreement between self-report questionnaires and medical record data was
substantial for diabetes, hypertension, myocardial infarction and stroke but not for
heart failure. Journal of Clinical Epidemiology, 57(10), 1096–1103.
doi.org/10.1016/j.jclinepi.2004.04.005
Organisation for Economic Co-operation and Development. (2015). Health at a glance
2015: How does Australia compare? (Vol. 2013). doi.org/10.1787/health_glance-
2009-en
Pachana, N. A., Smith, N., Watson, M., Mclaughlin, D., & Dobson, A. (2008).
Responsiveness of the Duke Social Support sub-scales in older women. Age and
Ageing, 37(6), 666–672. doi.org/10.1093/ageing/afn205
Paul, C., Ayis, S., & Ebrahim, S. (2006). Psychological distress, loneliness and
Page 321
303
disability in old age. Psychology, Health and Medicine, 11(2), 221–232.
doi.org/10.1080/13548500500262945
Pavot, W., & Diener, E. (1993). Review of the Satisfaction With Life Scale.
Psychological Assessment, 5(2), 164–172. doi.org/10.1037//1040-3590.5.2.164
Payton, A. R. (2009). Mental health, mental illness, and psychological distress: Same
continuum or distinct phenomena? Journal of Health and Social Behavior, 50(2),
213–227. doi.org/10.1177/002214650905000207
Pedersen, N. L., & Reynolds, C. A. (2002). Stability and change in adult personality:
Genetic and environmental components. European Journal of Personality, 16, 77–
78. doi.org/10.1002/per.443
Petrie, K. J., & Weinman, J. (2006). Why illness perceptions matter. Clinical Medicine,
6(6), 536–539. doi.org/10.7861/clinmedicine.6-6-536
Phelan, E. A., Anderson, L. A., LaCroix, A. Z., & Larson, E. B. (2004). Older adults’
views of “successful aging” - How do they compare with researchers’ definitions?
Journal of the American Geriatrics Society, 52(2), 211–216.
doi.org/10.1111/j.1532-5415.2004.52056.x
Phillips, M. R. (2009). Is distress a symptom of mental disorders, a marker of
impairment, both or neither? World Psychiatry, 8(2), 91–92.
Pinquart, M. (2001). Correlates of subjective health in older adults: A meta-analysis.
Psychology and Aging, 16(3), 414–426. doi.org/10.1037//0882-7974.16.3.414
Pinquart, M. (2002). Good news about the effect of bad old age stereotypes.
Experimental Aging Research, 28, 317–336. doi.org/10.1080/03610730290080353
Pinquart, M., & Sörensen, S. (2001). Gender differences in self-concept and
psychological well-being in old age: A meta-analysis. The Journals of
Gerontology, 56B(4), 195–213. doi.org/10.1093/geronb/56.4.p195
Poon, L. W., Martin, P., Bishop, A., Cho, J., Da Rosa, G., Deshpande, N., … Miller, L.
S. (2010). Understanding centenarians’ psychosocial dynamics and their
contributions to health and quality of life. Current Gerontology and Geriatrics
Research, 2010. doi.org/10.1155/2010/680657
Preacher, K. J. (2015). Advances in mediation analysis: A survey and synthesis of new
developments. Annual Review of Psychology, 66, 825–852.
Page 322
304
doi.org/10.1146/annurev-psych-010814-015258
Preacher, K. J., & Hayes, A. F. (2008). Contemporary approaches to assessing
mediation in communication research. In A. F. Hayes, M. D. Slater, & L. B.
Snyder (Eds.), The Sage sourcebook of advanced data analysis methods for
communication research (pp. 13–54). Los Angeles: SAGE Publications.
Preacher, K. J., & Kelley, K. (2011). Effect size measures for mediation models:
Quantitative strategies for communicating indirect effects. Psychological Methods,
16(2), 93–115. doi.org/10.1037/a0022658
Prince, M. J., Harwood, R. H., Thomas, A., & Mann, A. H. (1998). A prospective
population-based cohort study of the effects of disablement and social milieu on
the onset and maintenance of late-life depression. The Gospel Oak Project VII.
Psychological Medicine, 28, 337–350. doi.org/10.1017/s0033291797006478
Prochaska, J. O., & DiClemente, C. C. (1984). The transtheoretical approach: Crossing
the traditional boundaries of therapy. Melbourne, Florida: Krieger Publishing
Company.
Prohaska, T. R., Keller, M. L., Leventhal, E. A., & Leventhal, H. (1987). Impact of
symptoms and aging attribution on emotions and coping. Health Psychology, 6(6),
495–514. doi.org/10.1037//0278-6133.6.6.495
Quinn, K. (2010). Methodological considerations in surveys of older adults: Technology
matters. International Journal of Emerging Technologies and Society, 8(2), 114–
133.
Ready, R. E., Åkerstedt, A. M., & Mroczek, D. K. (2012). Emotional complexity and
emotional well-being in older adults: Risks of high neuroticism. Aging and Mental
Health, 16(1), 17–26. doi.org/10.1080/13607863.2011.602961
Régnier-Loilier, A., & Guisse, N. (n.d.). Sample attrition and distortion over the waves
of the French Generations and Gender Survey. Ggp-I.Org, 2005, 1–31. Retrieved
from http://www.ggp-i.org/sites/default/files/technicalpapers/Regnier-
Lollier_and_Guisse_-_Sample_attrition_and_distortion_over_the_waves.pdf
Renehan, E., Dow, B., Lin, X., Blackberry, I., Haapala, I., Gaffy, E., … Hendy, S.
(2012). Healthy ageing literature review 2012. National Ageing Research Institute
(NARI) and Council on the Ageing (COTA) for the Victorian Department of
Page 323
305
Health. Melbourne, VIC. Retrieved from www.health.vic.gov.au/agedcare
Roberts, B. W., & DelVecchio, W. F. (2000). The rank-order consistency of personality
traits from childhood to old age: A quantitative review of longitudinal studies.
Psychological Bulletin, 126(1), 3–25. doi.org/10.1037//0033-2909.126.1.3
Roberts, B. W., & Jackson, J. J. (2008). Sociogenomic personality psychology. Journal
of Personality, 76(6), 1523–1544. doi.org/10.1111/j.1467-6494.2008.00530.x
Roberts, B. W., Lejuez, C., Krueger, R. F., Richards, J. M., & Hill, P. L. (2014). What
is conscientiousness and how can it be assessed? Developmental Psychology,
50(5), 1315–1330. doi.org/10.1037/a0031109
Roberts, B. W., & Mroczek, D. K. (2008). Personality trait change in adulthood.
Current Directions in Psychological Science, 17(1), 31–35.
doi.org/10.1016/j.pestbp.2011.02.012.Investigations
Roberts, B. W., Robins, R. W., Caspi, A., & Trzesniewski, K. (2003). Personality trait
development in adulthood. In J. Mortimer & M. Shanahan (Eds.), Handbook of the
life course (pp. 579–598). New York: Kluwer Academic.
Roberts, B. W., Walton, K. E., & Viechtbauer, W. (2006b). Patterns of mean-level
change in personality traits across the life course: A meta-analysis of longitudinal
studies. Psychological Bulletin, 132(1), 1–25. doi.org/10.1037/0033-2909.132.1.1
Roberts, B. W., Walton, K. E., & Viechtbauer, W. (2006a). Personality traits change in
adulthood: Reply to Costa and McCrae (2006). Psychological Bulletin, 132(1), 29–
32. doi.org/10.1037/0033-2909.132.1.29
Roberts, B. W., Wood, D., & Caspi, A. (2008). The development of personality traits in
adulthood. In O. P. John, R. Robins, & L. A. Pervin (Eds.), Handbook of
personality: Theory and research2 (3rd ed., pp. 375–398). New York, NY:
Guilford Press.
Robertson, D. A., & Kenny, R. A. (2016a). “I’m too old for that” - The association
between negative perceptions of aging and disengagement in later life. Personality
and Individual Differences, 100, 114–119. doi.org/10.1016/j.paid.2016.03.096
Robertson, D. A., & Kenny, R. A. (2016b). Negative perceptions of aging modify the
association between frailty and cognitive function in older adults. Personality and
Individual Differences, 100, 120–125. doi.org/10.1016/j.paid.2015.12.010
Page 324
306
Robertson, D. A., King-Kallimanis, B. L., & Kenny, R. A. (2015). Negative perceptions
of aging predict longitudinal decline in cognitive function. Psychology and Aging,
31(1), 71–81. doi.org/10.1037/pag0000061
Robertson, D. A., Savva, G. M., King-Kallimanis, B. L., & Kenny, R. A. (2015).
Negative perceptions of aging and decline in walking speed: A self-fulfilling
prophecy. PLoS ONE, 10(4), 1–17. doi.org/10.1371/journal.pone.0123260
Rook, K. S., Charles, S. T., & Heckhausen, J. (2011). Aging and health. In H. S.
Friedman (Ed.), The Oxford Handbook of Health Psychology (pp. 347–374). New
York: Oxford University Press.
https://doi.org/10.1093/oxfordhb/9780195342819.001.0001
Roth, S., & Cohen, L. J. (1986). Approach, avoidance, and coping with stress. American
Psychologist, 41(7), 813–819. doi.org/10.1037/0003-066X.41.7.813
Rothman, K. J. (1990). No adjustments are needed for multiple comparisons.
Epidemiology, 1(1), 43–46. doi.org/10.1097/00001648-199001000-00010
Rowe, J. W., & Kahn, R. L. (1987). Human aging: Usual and successful. Science, 237,
143–149. doi.org/10.1126/science.3299702
Rowe, J. W., & Kahn, R. L. (1997). Successful aging. The Gerontologist, 37(4), 433–
440. doi.org/10.1097/00006216-199923020-00016
Rubin, D. C., & Berntsen, D. (2006). People over forty feel 20% younger than their age:
Subjective age across the lifespan. Psychonomic Bulletin and Review, 13(5), 776–
780. doi.org/10.3758/bf03193996
Rucker, D. D., Preacher, K. J., Tormala, Z. L., & Petty, R. E. (2011). Mediation analysis
in social psychology: Current practices and new recommendations. Social and
Personality Psychology Compass, 5(6), 359–371. doi.org/10.1111/j.1751-
9004.2011.00355.x
Russell, D. W., & Cutrona, C. E. (1991). Social support, stress, and depressive
symptoms among the elderly: Test of a process model. Psychology and Aging,
6(2), 190–201. doi.org/10.1037/0882-7974.6.2.190
Rutter, C., & Rutter, D. (2002). Illness representation, coping and outcome in irritable
bowel syndrome (IBS). British Journal of Health Psychology, 7, 377–391.
doi.org/10.1348/135910702320645372
Page 325
307
Ryan, R. M., & Deci, E. L. (2001). On happiness and human potentials: A review of
research on hedonic and eudaimonic well-being. Annual Review of Psychology, 52,
141–166. doi.org/10.1146/annurev.psych.52.1.141
Ryff, C. D. (1989). Happiness is everything, or is it? Explorations on the meaning of
psychological well-being. Journal of Personality & Social Psychology, 57(6),
1069–1081. doi.org/10.1037//0022-3514.57.6.1069
Ryff, C. D., & Keyes, C. L. M. (1995). The structure of psychological well-being
revisited. Journal of Personality and Social Psychology, 69(4), 719–727.
doi.org/10.1037//0022-3514.69.4.719
Sallis, J. F., Owen, N., & Fisher, E. B. (2008). Ecological models of health behavior. In
Health Behavior and Health Education: Theory, Research, and Practice (pp. 465–
485). doi.org/10.7326/0003-4819-116-4-350_1
Sargent-Cox, K. A., Anstey, K. J., & Luszcz, M. A. (2008). Determinants of self-rated
health items with different points of reference. Implications for health
measurement of older adults. Journal of Aging and Health, 20(6), 739–761.
doi.org/10.1177/0898264308321035
Sargent-Cox, K. A., Anstey, K. J., & Luszcz, M. A. (2012a). Change in health and self-
perceptions of aging over 16 years: The role of psychological resources. Health
Psychology, 31(4), 423–432. doi.org/10.1037/a0027464
Sargent-Cox, K. A., Anstey, K. J., & Luszcz, M. A. (2012b). The relationship between
change in self-perceptions of aging and physical functioning in older adults.
Psychology and Aging, 27(3), 750–760. doi.org/10.1037/a0027578
Sargent-Cox, K. A., Anstey, K. J., & Luszcz, M. A. (2014). Longitudinal change of
self-perceptions of aging and mortality. Journals of Gerontology, Series B:
Psychological Sciences and Social Sciences, 69(2), 168–173.
doi.org/10.1093/geronb/gbt005.
Sarkisian, C. A., Hays, R. D., & Mangione, C. M. (2002). Do older adults expect to age
successfully? The association between expectations regarding aging and beliefs
regarding healthcare seeking among older adults. Journal of the American
Geriatrics Society, 50(11), 1837–1843. doi.org/10.1046/j.1532-5415.2002.50513.x
Sarkisian, C. A., Liu, H., Ensrud, K. E., Stone, K. L., & Mangione, C. M. (2001).
Page 326
308
Correlates of attributing new disability to old age. Journal of the American
Geriatrics Society, 49(2), 134–141. doi.org/10.1046/j.1532-5415.2001.49033.x
Sarkisian, C. A., Prohaska, T. R., Davis, C., & Weiner, B. (2007). Pilot test of an
attribution retraining intervention to raise walking levels in sedentary older adults.
Journal of the American Geriatrics Society, 55(11), 1842–1846.
doi.org/10.1111/j.1532-5415.2007.01427.x
Sarkisian, C. A., Prohaska, T. R., Wong, M. D., Hirsch, S., & Mangione, C. M. (2005).
The relationship between expectations for aging and physical activity among older
adults. Journal of General Internal Medicine, 20(10), 911–915.
doi.org/10.1111/j.1525-1497.2005.0204.x
Scharloo, M., & Kaptein, A. (1997). Measurement of illness perceptions in patients with
chronic somatic illness: A review. In K. J. Petrie & J. Weinman (Eds.), Perceptions
of health and illness: Current research and applications (pp. 103–145). The
Netherlands: Harwood Acacdemic Publishers.
Scheibe, S., & Carstensen, L. L. (2010). Emotional aging: Recent findings and future
trends. Journal of Gerontology: Psychological Sciences, 65B(2), 135–144.
doi.org/10.1093/geronb/gbp132.
Scheidt, R. J., Humpherys, D. R., & Yorgason, J. B. (1999). Successful aging: What’s
not to like? The Journal of Applied Gerontology, 18(3), 277–282.
doi.org/10.1177/073346489901800301
Scheier, M. F., & Carver, C. S. (1985). Optimism, coping, and health: Assessment and
implications of generalized outcome expectancies. Health Psychology, 4(3), 219–
247. doi.org/10.1037//0278-6133.4.3.219
Scheier, M. F., Carver, C. S., & Bridges, M. W. (1994). Distinguishing optimism from
neuroticism (and trait anxiety, mastery, and self-esteem): A reevaluation of the
Life Orientation Test. Jourmal of Personality and Social Psychology, 67(6), 1063–
1078. doi.org/10.1037//0022-3514.67.6.1063
Schiaffino, K. M., Shawaryn, M. A., & Blum, D. (1998). Examining the impact of
illness representations on psychological adjustment to chronic illnesses. Health
Psychology, 17(3), 262–268. doi.org/10.1037//0278-6133.17.3.262
Schieman, S., Van Gundy, K., & Taylor, J. (2001). Status, role, and resource
Page 327
309
explanations for age patterns in psychological distress. Journal of Health and
Social Behavior, 42(1), 80–96. doi.org/10.2307/3090228
Schulz, R., & Heckhausen, J. (1996). A life span model of successful aging. American
Psychologist, 51(7), 702–714. doi.org/10.1037//0003-066x.51.7.702
Schwarzer, R., & Schwarzer, C. (1996). A critical survey of coping instruments. In M.
Zeidner & N. S. Endler (Eds.), Handbook of coping: Theory, research,
applications (pp. 107–132). New York: John Wiley & Sons.
Scollo, M. M., & Winstanley, M. H. (2017). Tobacco in Australia: Facts and issues.
Melbourne, VIC: Cancer Council Victoria. Retrieved from Available from
www.TobaccoInAustralia.org.au
Scully, J. A., Tosi, H., & Banning, K. (2000). Life event checklists: Revisiting the
Social Readjustment Rating Scale after 30 years. Educational and Psychological
Measurement, 60(6), 864–876. doi.org/10.1177/00131640021970952
Seeman, T. E. (1996). Social ties and health: The benefits of social integration. Annals
of Epidemiology, 6(5), 442–451. doi.org/10.1016/S1047-2797(96)00095-6
Sexton, E., King-Kallimanis, B. L., Morgan, K., & McGee, H. (2014). Development of
the brief ageing perceptions questionnaire (B-APQ): A confirmatory factor
analysis approach to item reduction. BMC Geriatrics, 14, 44.
doi.org/10.1186/1471-2318-14-44
Shanahan, M. J., Hill, P. L., Roberts, B. W., Eccles, J., & Friedman, H. S. (2014).
Conscientiousness, health, and aging: The life course of personality model.
Developmental Psychology, 50(5), 1407–1425. doi.org/10.1037/a0031130
Sharpe, J. P., Martin, N. R., & Roth, K. A. (2011). Optimism and the Big Five factors of
personality: Beyond Neuroticism and Extraversion. Personality and Individual
Differences, 51(8), 946–951. doi.org/10.1016/j.paid.2011.07.033
Shenkin, S. D., Laidlaw, K., Allerhand, M., Mead, G. E., Starr, J. M., & Deary, I. J.
(2014). Life course influences of physical and cognitive function and personality
on attitudes to aging in the Lothian Birth Cohort 1936. International
Psychogeriatrics, 1–14. doi.org/10.1017/S1041610214000301
Shi, Y., & Zhong, S. (2014). From genomes to societies: A holistic view of
determinants of human health. Current Opinion in Biotechnology, 28, 134–142.
Page 328
310
doi.org/10.1016/j.copbio.2014.03.001
Shrout, P. E., & Bolger, N. (2002). Mediation in experimental and nonexperimental
studies: New procedures and recommendations. Psychological Methods, 7(4), 422.
doi.org/10.1037//1082-989x.7.4.422
Siedlecki, K. L., Tucker-Drob, E. M., Oishi, S., & Salthouse, T. A. (2008). Life
satisfaction across adulthood: Different determinants at different ages? The Journal
of Positive Psychology, 3(3), 153–164.
doi.org/10.1109/TMI.2012.2196707.Separate
Siegrist, J., & Wahrendorf, M. (2009). Participation in socially productive activities and
quality of life in early old age: Findings from SHARE. Journal of European Social
Policy, 19(4), 317–326. doi.org/10.1177/1350506809341513
Sim, J., Bartlam, B., & Bernard, M. (2011). The CASP-19 as a measure of quality of
life in old age: Evaluation of its use in a retirement community. Quality of Life
Research, 20(7), 997–1004. doi.org/10.1007/s11136-010-9835-x
Sindi, S., Juster, R. P., Wan, N., Nair, N. P. V, Ying Kin, N., & Lupien, S. J. (2012).
Depressive symptoms, cortisol, and cognition during human aging: The role of
negative aging perceptions. Stress, 15(2), 130–137.
doi.org/10.3109/10253890.2011.599047
Singh, R. (2011). Psychological model of illness. Newcastle upon Tyne: Cambridge
Scholars Publishing.
Skinner, E. A. (1996). A guide to constructs of control. Journal of Personality and
Social Psychology, 71(3), 549–570. doi.org/10.1037/0022-3514.71.3.549
Skinner, E. A., Edge, K., Altman, J., & Sherwood, H. (2003). Searching for the
structure of coping: A review and critique of category systems for classifying ways
of coping. Psychological Bulletin, 129(2), 216–269. doi.org/10.1037/0033-
2909.129.2.216
Slotman, A., Cramm, J. M., & Nieboer, A. P. (2015). Validation of the Dutch Aging
Perceptions Questionnaire and development of a short version. Health and Quality
of Life Outcomes, 13(1), 54. doi.org/10.1186/s12955-015-0248-y
Slotman, A., Cramm, J. M., & Nieboer, A. P. (2017). Validation of the Aging
Perceptions Questionnaire Short on a sample of community-dwelling Turkish
Page 329
311
elderly migrants. Health and Quality of Life Outcomes, 15(1), 42.
doi.org/10.1186/s12955-017-0619-7
Small, B. J., Hertzog, C., Hultsch, D. F., & Dixon, R. A. (2003). Stability and change in
adult personality over 6 years: Findings from the Victoria Longitudinal Study. The
Journals of Gerontology : Psychological Sciences, 58B(3), 166–176.
doi.org/10.1093/geronb/58.3.P166
Sneed, J. R., & Whitbourne, S. K. (2005). Models of the aging self. Journal of Social
Issues, 61(2), 375–388. doi.org/10.1111/j.1540-4560.2005.00411.x
Snowdon, J. (2001). Is depression more prevalent in old age? Australian and New
Zealand Journal of Psychiatry, 35(6), 782–787. doi.org/10.1046/j.1440-
1614.2001.00968.x
Sobel, M. (1982). Asymptotic confidence intervals for indirect effects in structural
equation models. In S. Leinhart (Ed.), Sociological Methodology (pp. 290–312).
San Francisco: Jossey-Bass.
Solar, O., & Irwin, A. (2010). A conceptual framework for action on the social
determinants of health. Social Determinants of Health Discussion Paper 2 (Policy
and Practice). doi.org/ISBN 978 92 4 150085 2
Solberg Nes, L. S., & Segerstrom, S. C. (2006). Dispositional optimism and coping: A
meta-analytic review. Personality and Social Psychology Review, 10(3), 235–251.
doi.org/10.1207/s15327957pspr1003_3
Specht, J., Bleidorn, W., Denissen, J. J. A., Hennecke, M., Hutteman, R., Kandler, C.,
… Zimmermann, J. (2014). What drives adult personality development? A
comparison of theoretical perspectives and empirical vvidence. European Journal
of Personality, 28(3), 216–230. doi.org/10.1002/per.1966
Specht, J., Egloff, B., & Schmukle, S. C. (2011). Stability and change of personality
across the life course: The impact of age and major life events on mean-level and
rank-order stability of the Big Five. Journal of Personality and Social Psychology,
101(4), 862–882. doi.org/10.1037/a0024950
Srivastava, K., & Das, R. C. (2013). Personality pathways of successful ageing.
Industrial Psychiatry Journal, 22(1), 1–3. doi.org/10.4103/0972-6748.123584
Stephan, Y., Caudroit, J., & Chalabaev, A. (2011). Subjective health and memory self-
Page 330
312
efficacy as mediators in the relation between subjective age and life satisfaction
among older adults. Aging & Mental Health, 15(4), 428–36.
doi.org/10.1080/13607863.2010.536138
Stephan, Y., Chalabaev, A., Kotter-Grühn, D., & Jaconelli, A. (2012). “Feeling
younger, being stronger”: An experimental study of subjective age and physical
functioning among older adults. Journals of Gerontology - Series B Psychological
Sciences and Social Sciences, 68(1), 1–7. doi.org/10.1093/geronb/gbs037
Stephan, Y., Demulier, V., & Terracciano, A. (2012). Personality, self-rated health, and
subjective age in a life-span sample: The moderating role of chronological age.
Psychology and Aging, 27(4), 875–880. doi.org/10.1037/a0028301
Steptoe, A., Wright, C., Kunz-Ebrecht, S. R., & Iliffe, S. (2006). Dispositional optimism
and health behaviour in community-dwelling older people: Associations with
healthy ageing. British Journal of Health Psychology, 11, 71–84.
doi.org/10.1348/135910705X42850
Steverink, N., Westerhof, G. J., Bode, C., & Dittmann-Kohli, F. (2001). The personal
experience of aging, individual resources, and subjective well-being. Journal of
Gerontology: Psychological Sciences, 56B(6), 364–373.
doi.org/10.1093/geronb/56.6.p364
Stewart, T. L., Chipperfield, J. G., Perry, R. P., & Weiner, B. (2012). Attributing illness
to “old age:” Consequences of a self-directed stereotype for health and mortality.
Psychology and Health, 27(8), 881–897. doi.org/10.1080/08870446.2011.630735
Strawbridge, W. J., Wallhagen, M. I., & Cohen, R. D. (2002). Successful aging and
well-being: Self-rated compared with Rowe and Kahn. The Gerontologist, 42(6),
727–733. doi.org/10.1093/geront/42.6.727
Tabachnick, B. G., & Fidell, L. S. (2007). Using multivariate statistics (5th ed.).
Boston: Allyn and Bacon/Pearson Education.
Tajvar, M., Fletcher, A., & Grundy, E. (2016). Exploring associations between social
support and mental health in older people : A systematic narrative review.
International Journal on Ageing in Developing Countries, 1(2), 174–193.
Taylor, S. E. (2011). Social support: A review. In H. S. Friedman (Ed.), The Oxford
Handbook of Health Psychology (pp. 189–214). New York: Oxford University
Page 331
313
Press.
Terracciano, A., & Costa, P. T. (2004). Smoking and the Five-Factor Model of
personality. Addiction, 99(4), 472–481. doi.org/10.1111/j.1360-0443.2004.00687.x
Teuscher, U. (2009). Subjective age bias: A motivational and information processing
approach. International Journal of Behavioral Development, 33(1), 22–31.
doi.org/10.1177/0165025408099487
Third Age (n.d.). In English Oxford Living Dictionaries (online). Retrieved from
https://en.oxforddictionaries.com/definition/third_age
Thoits, P. a. (2010). Stress and health: Major findings and policy implications. Journal
of Health and Social Behavior, 51(Extra Issue), S41–S53.
doi.org/10.1177/0022146510383499
Thompson, S., Cheek, P., & Graham, M. (1988). The other side of perceived control:
Disadvantages and negative effects. In S. Spacapan & S. Oskamp (Eds.), The
Social Psychology of Health (pp. 69–94). Beverly Hills, California: SAGE
Publications.
Trouillet, R., Gana, K., Lourel, M., & Fort, I. (2009). Predictive value of age for coping:
The role of self-efficacy, social support satisfaction and perceived stress. Aging
and Mental Health, 13(3), 357–366. doi.org/10.1080/13607860802626223
Turiano, N. A., Mroczek, D. K., Moynihan, J., & Chapman, B. P. (2013). Big 5
personality traits and interleukin-6: Evidence for “healthy Neuroticism” in a US
population sample. Brain, Behavior, and Immunity, 28, 83–89.
doi.org/10.1016/j.bbi.2012.10.020
Turiano, N. A., Pitzer, L., Armour, C., Karlamangla, A., Ryff, C. D., & Mroczek, D. K.
(2012). Personality trait level and change as predictors of health outcomes :
Findings from a national study of Americans (MIDUS). Personality Change and
Heath, 67(1), 4–12. doi.org/10.1093/geronb/gbr072.
Turner, R. J., & Brown, R. L. (2010). Social support and mental health. In T. L. Scheid
& T. N. Brown (Eds.), A Handbook for the Study of Mental Health: Social
Contexts, Theories, and Systems (2nd ed., pp. 200–212). New York: Cambridge
University Press. doi.org/10.1007/978-94-007-4276-5_25
United Nations, Department of Economic and Social Affairs, Population Division.
Page 332
314
(2013). World population ageing 2013. ST/ESA/SER.A/348. Retrieved from
http://scholar.google.com/scholar?hl=en&btnG=Search&q=intitle:World+Populati
on+Ageing+2013#7
Uttal, D. H., & Perlmutter, A. (1989). Toward a broader conceptualization of
development: The role of gains and losses across the life span. Developmental
Review, 9, 101–132. doi.org/10.1016/0273-2297(89)90025-7
Vanhoutte, B. (2012). Measuring subjective well-being in later life: A review. Retrieved
from http://www.cmist.manchester.ac.uk/medialibrary/archive-
publications/working-papers/2012/2012-06-Briefing wellbeing Bram
Vanhoutte_final.pdf
Vasey, M. W., Harbaugh, C. N., Lonigan, C. J., Phillips, B. M., Hankin, B. L., Willem,
L., & Bijttebier, P. (2013). Dimensions of temperament and depressive symptoms:
Replicating a three-way interaction. Journal of Research in Personality, 47(6),
908–921. doi.org/10.1016/j.jrp.2013.09.001.
Verstraeten, K., Vasey, M. W., Raes, F., & Bijttebier, P. (2009). Temperament and risk
for depressive symptoms in adolescence: Mediation by rumination and moderation
by effortful control. Journal of Abnormal Child Psychology, 37(3), 349–361.
doi.org/10.1007/s10802-008-9293-x
Villar, F. (2011). Successful ageing and development: The contribution of generativity
in older age. Ageing and Society, 32(7), 1087–1105.
doi.org/10.1017/S0144686X11000973
Villiers-Tuthill, A., Copley, A., McGee, H., & Morgan, K. (2016). The relationship of
tobacco and alcohol use with ageing self-perceptions in older people in Ireland.
BMC Public Health, 16, 1–10. doi.org/10.1186/s12889-016-3158-y
Vollrath, M., & Torgersen, S. (2002). Who takes health risks? A probe into eight
personality types. Personality and Individual Differences, 32(7), 1185–1197.
doi.org/10.1016/S0191-8869(01)00080-0
von Faber, M. A., Bootsma-van der Wiel, A., van Exel, E., Gussekloo, J., Lagaay, A.
M., van Dongen, E., … Westendorp, R. G. J. (2001). Successful aging in the oldest
old. Archives of Internal Medicine, 161, 2694–2700.
doi.org/10.1001/archinte.161.22.2694
Page 333
315
Wakefield, J. C., Schmitz, M. F., First, M. B., & Horwitz, A. V. (2007). Extending the
bereavement exclusion for major depression to other losses: Evidence from the
National Comorbidity Survey. Archives of General Psychiatry, 64(4), 433.
doi.org/10.1001/archpsyc.64.4.433
Wang, X., Zhang, D., & Wang, J. (2011). Dual-factor model of mental health: Surpass
the traditional mental health model. Psychology, 2(8), 767–772.
doi.org/10.4236/psych.2011.28117
Waterman, A. S. (1993). Two conceptions of happiness: Contrasts of personal
expressiveness (eudaimonia) and hedonic enjoyment. Journal of Personality and
Social Psychology, 64(4), 678–691. doi.org/10.1037//0022-3514.64.4.678
Watson, D., Clark, L. A., & Tellegen, A. (1988). Development and validation of brief
measures of positive and negative affect: The PANAS scales. Journal of
Personality and Social Psychology, 54(6), 1063–1070. doi.org/10.1037//0022-
3514.54.6.1063
Weisz, J. (1990). Development of control related beliefs, goals and styles in childhood
and adolescence: A clinical perspective. In J. Rodin, C. Schooler, & K. Schaie
(Eds.), Self-directedness: Cause and Effects Throughout the Life Course (pp. 103–
145). Hillsdale, NJ: Lawrence Erlbaum Associates.
Weltzien, M. (2007). A lifespan portrait of aging expectations and health behaviors.
UW-L Journal of Undergraduate Research, 1–5.
Wen, Z., & Fan, X. (2015). Monotonicity of effect sizes : Questioning kappa-squared as
mediation effect size measure. Psychological Methods, 20(2), 193–203.
doi.org/10.1037/met0000029
Westerhof, G. J., & Barrett, A. E. (2005). Age identity and subjective well-being: A
comparison of the United States and Germany. The Journals of Gerontology,
60B(3), S129–S136. doi.org/10.1093/geronb/60.3.s129
Westerhof, G. J., & Keyes, C. L. M. (2010). Mental illness and mental health: The two
continua model across the lifespan. Journal of Adult Development, 17(2), 110–119.
doi.org/10.1007/s10804-009-9082-y
Westerhof, G. J., Miche, M., Brothers, A. F., Barrett, A. E., Diehl, M., Montepare, J.
M., … Wurm, S. (2014). The influence of subjective aging on health and
Page 334
316
longevity: A meta-analysis of longitudinal data. Psychology and Aging, 29(4),
793–802. doi.org/10.1037/a0038016
Westerhof, G. J., & Wurm, S. (2015). Longitudinal research on subjective aging, health,
and longevity. Annual Review of Gerontology and Geriatrics, 145–166.
doi.org/10.1891/0198-8794.35.145
Weston, S. J., & Jackson, J. J. (2015). Identification of the healthy neurotic: Personality
traits predict smoking after disease onset. Journal of Research in Personality, 54,
61–69. doi.org/10.1016/j.jrp.2014.04.008
Wheaton, B. (2007). The twain meet: Distress, disorder and the continuing conundrum
of categories (comment on Horwitz). Health:, 11(3), 303–319.
doi.org/10.1177/1363459307077545
Whitbourne, S. K. (2000). The aging individual: Physical and psychological
perspectives (2nd ed.). New York, NY: Springer Publishing Company.
White, A. M., Philogene, G. S., Fine, L., & Sinha, S. (2009). Social support and self-
reported health status of older adults in the United States. American Journal of
Public Health, 99(10), 1872–1878. doi.org/10.2105/AJPH.2008.146894
Whiteford, H. A., Degenhardt, L., Rehm, J., Baxter, A. J., Ferrari, A. J., Erskine, H. E.,
… Vos, T. (2013). Global burden of disease attributable to mental and substance
use disorders: Findings from the Global Burden of Disease Study 2010. The
Lancet, 382(9904), 1575–1586. doi.org/10.1016/S0140-6736(13)61611-6
Wiggins, R. D., Netuveli, G., Hyde, M., Higgs, P., & Blane, D. (2008). The evaluation
of a self-enumerated scale of quality of life (CASP-19) in the context of research
on ageing: A combination of exploratory and confirmatory approaches. Social
Indicators Research, 89(1), 61–77. doi.org/10.1007/s11205-007-9220-5
Wolff, J. K., Warner, L. M., Ziegelmann, J. P., & Wurm, S. (2014). What do targeting
positive views on ageing add to a physical activity intervention in older adults?
Results from a randomised controlled trial. Psychology & Health, 29(8), 915–932.
doi.org/10.1080/08870446.2014.896464
Woo, H., & Frisbie, W. P. (2004). Self-regulated health behavior and chronic disease:
A longitudinal analysis of a healthy population (Working Paper Series). PRC
Working Paper Series 2004-2005. No. 04-05-04. Austin, TX: Population Research
Page 335
317
Center, University of Texas at Austin. doi.wiley.com/10.1111/j.1467-
629X.1980.tb00220.x
World Health Organization. (1946). Preamble to the Constitution of the World Health
Organization as adopted by the International Health conference. In New York, 19–
22 June, 1946 (pp. 1–18). New York: WHO. Retrieved from
http://www.who.int/about/mission/en/
World Health Organization. (2002). Active Ageing: A Policy Framework. A contribution
of the World Health Organization to the Second United Nations World Assembly
on Ageing, Madrid, Spain, April 2002. Geneva. doi.org/10.1080/713604647
World Health Organization. (2004). Promoting mental health: Concepts, emerging
evidence, practice: Summary report. (H. Herrman, S. Saxena, & R. Moodie, Eds.).
Geneva. doi.org/10.1111/j.1466-7657.2004.00268.x
World Health Organization. (2005). Mental health: Facing the challenges, building
solutions. Report from the WHO European Ministerial Conference. Copenhagen,
Denmark. Retrieved from
http://www.euro.who.int/__data/assets/pdf_file/0008/96452/E87301.pdf
World Health Organization. (2015). World report on ageing and health. Geneva.
doi.org/10.1017/CBO9781107415324.004
World Health Organization and Calouste Gulbenkian Foundation. (2014). Social
determinants of mental health. World Health Organization. Geneva.
doi.org/10.3109/09540261.2014.928270
Wrosch, C., Dunne, E., Scheier, M. F., & Schulz, R. (2006). Self-regulation of common
age-related challenges: Benefits for older adults’ psychological and physical
health. Journal of Behavioral Medicine, 29(3), 299–306. doi.org/10.1007/s10865-
006-9051-x
Wu, S. C., Li, C. Y., & Ke, D. S. (2000). The agreement between self-reporting and
clinical diagnosis for selected medical conditions among the elderly in Taiwan.
Public Health, 114(2), 137–142. doi.org/10.1038/sj.ph.1900627
Wu, X., Wei, D., Sun, B., & Wu, X. N. (2016). Poor medication adherence to
bisphosphonates and high self-perception of aging in elderly female patients with
osteoporosis. Osteoporosis International, 27(10), 3083–3090.
Page 336
318
doi.org/10.1007/s00198-016-3763-8
Wurm, S., & Benyamini, Y. (2014). Optimism buffers the detrimental effect of negative
self-perceptions of ageing on physical and mental health. Psychology and Health,
29(7), 832–848. doi.org/10.1080/08870446.2014.891737
Wurm, S., Tesch-Römer, C., & Tomasik, M. J. (2007). Longitudinal findings on aging-
related cognitions, control beliefs, and health in later life. Journal of Gerontology:
Psychological Sciences, 62B(3), 156–164. doi.org/10.1093/geronb/62.3.p156
Wurm, S., Tomasik, M. J., & Tesch-Römer, C. (2010). On the importance of a positive
view on ageing for physical exercise among middle-aged and older adults: Cross-
sectional and longitudinal findings. Psychology and Health, 25(1), 25–42.
doi.org/10.1080/08870440802311314
Wurm, S., Warner, L. M., Ziegelmann, J. P., Wolff, J. K., & Schüz, B. (2013). How do
negative self-perceptions of aging become a self-fulfilling prophecy? Psychology
and Aging, 28(4), 1088–1097. doi.org/10.1037/a0032845
Wurm, S., Wolff, J. K., & Schüz, B. (2014). Primary care supply moderates the impact
of diseases on self-perceptions of aging. Psychology and Aging, 29(2), 351–358.
doi.org/10.1037/a0036248
Yancura, L. A., & Aldwin, C. M. (2008). Coping and health in older adults. Current
Psychiatry Reports, 10(1), 10–15. doi.org/http://dx.doi.org/10.1007/s11920-008-
0004-7
Yap, S. C. Y., Anusic, I., & Lucas, R. E. (2012). Does personality moderate reaction
and adaptation to major life events? Evidence from the British Household Panel
Survey. Journal of Research in Personality, 46, 477–488.
doi.org/10.1016/j.jrp.2012.05.005
Yarmo-Roberts, D., Freak-Poli, R. L., Cooper, B., Noonan, T., Stolewinder, J., & Reid,
C. M. (2010). The heart of the matter: Health status of aged care clients receiving
home- and community-based care. Journal of Aging Research, 2010, Article ID
275303. doi.org/10.4061/2010/275303
Young, Y., Frick, K. D., & Phelan, E. A. (2009). Can successful aging and chronic
illness coexist in the same individual? A multidimensional concept of successful
aging. Journal of the American Medical Directors Association, 10(2), 87–92.
Page 337
319
doi.org/10.1016/j.jamda.2008.11.003
Yun, R. J., & Lachman, M. E. (2006). Perceptions of aging in two cultures: Korean and
American views on old age. Journal of Cross-Cultural Gerontology, 21(1–2), 55–
70. doi.org/10.1007/s10823-006-9018-y
Zeidner, M., Boekaerts, M., & Pintrich, P. . (2005). Self-regulation: Directions and
challenges for future research. In M. Boekaerts, P. R. Pintrich, & M. Zeidner
(Eds.), Handbook of self-regulation (pp. 749–768). San Diego: Academic Press.
Zhao, X., Lynch Jr., J. G., & Chen, Q. (2010). Reconsidering Baron and Kenny: Myths
and truths about mediation analysis. Journal of Consumer Research, 37(2), 197–
206. doi.org/10.1086/651257
Zimmer-Gembeck, M. J., & Skinner, E. A. (2016). The development of coping:
Implications for psychopathology and resilience. In Developmental
Psychopathology (3rd ed., Vol. 4, pp. 1–61).
doi.org/10.1017/CBO9781107415324.004
Zimmerman, B. J. (2005). Attaining self-regulation: A social cognitive perspective. In
M. Boekaerts, P. R. Pintrich, & M. Zeidner (Eds.), Handbook of Self-Regulation
(pp. 13–39). San Diego: Academic Press.
Page 339
321
Appendix A: Information flyer for participating organisations
Page 340
Would you be interested in participating in a study on healthy ageing?
Do you know of family or friends who might be interested?
Researchers at the University of Wollongong are seeking volunteers for a study of:
Age and illness self-perceptions in older adults
The purpose of this research is to examine how age and illness beliefs affect coping abilities and psychological adjustment as people age.
Establishing how such beliefs work is important because it will contribute to our understanding of the ageing individual and will improve the ways in which we manage the psychological health care needs of older people.
The information we collect will be used to help us understand how self-perceptions influence the psychological health and wellbeing of older people.
Participation will involve completing either a paper or online survey, details of which will be provided by the researcher (Louise Turner) to those who are interested. Survey completion takes approximately 45 minutes.
All completed surveys will go into a draw for a chance to win one of five Coles-Myer vouchers valued at $100.
You are eligible to participate if you are:
Aged 55 years or over Have no or negligible cognitive impairment
For more information about this study or to register your interest, please contact Louise Turner: (Ph) 4221 4164 or (Email) [email protected]
Page 341
323
Appendix B: Sample questionnaire booklet (Time 1)
Page 342
Dear Thank you for your interest in this study that is examining the effects of age and illness self-perceptions in older adults.
The research being conducted by researchers at the University of Wollongong is called Predictors of wellbeing and psychopathology in an ageing population: The effects of age and illness self-perceptions. The purpose of this research is to examine how illness and ageing beliefs affect coping abilities as people age, as well as how they relate to psychological health and wellbeing outcomes. We are interested in the opinions of all people aged 55 years and over even if you and your family members DO NOT have any illnesses. WE WOULD LIKE YOU TO: Complete the attached survey and return it to us in the enclosed, reply paid envelope. Please tear off this front page and retain for your own records. Alternatively, you may complete the survey online by emailing [email protected] for the online link. Please check that all pages of this survey have been completed before returning in the reply paid envelope. All completed surveys will go into the draw to win one of five Coles-Myer vouchers valued at $100. If you would like the chance to win one of these vouchers and would be happy to participate in future phases of this study, please provide consent where indicated at the end of this survey. Please read the separate, enclosed Participant Information Sheet carefully. If you have any queries about the research, you can contact Louise Turner on 4221 4164 or Associate Professor Craig Gonsalvez on 4221 3674. The information you provide in the survey is only identifiable by a code and as such, anonymity is assured. Please attempt to answer all of the questions to the best of your ability. If you have any concerns or complaints regarding the manner in which the research is or has been conducted, you can contact the Ethics Officer, Human Research Ethics Committee, Office of Research, University of Wollongong on 4221 4457. With kind regards,
Associate Professor Craig Gonsalvez School of Psychology University of Wollongong
Page 344
SURVEY OF ADULTS AGED 55 YEARS AND OVER
Please complete the following questionnaires to the best of your ability. If possible, answer all the questions by placing a tick in one box for each question unless otherwise stated.
Thank you very much for your time. 1) What is your gender? Male Female 2) How old are you today? (Age in years) 3) In which country were you born? 4) If you were not born in Australia, in what year did you arrive in Australia? 5) Which one of the following would you describe yourself as?
Australian Aboriginal Torres Strait Islander Aboriginal AND Torres Strait Islander English Irish Scottish Other European Asian Other (Please specify)
ABOUT YOU
Please turn to the next page
1
Page 345
2
Please turn to the next page
6) Do you speak a language at home other than English?
Yes (Please specify other language)
No 7) Which of the following would you describe yourself as?
Religious (belong to an organised religion e.g. Catholic / Anglican) Non-religious but spiritual Non-religious (e.g. atheist / agnostic)
8) If religious or spiritual, to what extent is your faith or spirituality an important part of
your daily life?
Very important Important Moderately important
Of little importance Unimportant 9) What is your current marital status?
Married DeFacto Separated Divorced Widowed Never Married
10) How long have you been of this marital status? (Please answer in number of years. If
less than one year, enter 0).
Page 346
3
Please turn to the next page
The next questions are about major events that sometimes take place during a person’s life. 11) Have you ever been a victim of a serious physical attack or assault at any time in
your life? Yes No 12) Have you ever had a life-threatening illness or accidental injury at any time of your
life?
Yes No 13) Apart from your husband / wife / partner, have you lost anyone close to you through
death in the last 3 years?
Yes (Please indicate their relationship to you)
No 14) During the last 3 years has anything else happened to you that upset you a lot that
you haven’t already answered?
Yes (Please specify)
No
LIFE EVENTS
Page 347
4
Please turn to the next page
EDUCATION, EMPLOYMENT AND INCOME
15) Which of these groups best describes your highest qualification?
Primary school course Secondary school course
Trade or apprenticeship Certificate or Diploma
Bachelor Degree or Post Graduate Diploma Higher qualification Adult education or hobby course No formal tuition Other (Please specify)
16) Do you currently work in a job, business or farm?
Yes Paid work Voluntary work
No 17) Are you retired from your last job?
Yes No 18) What kind of work have you done most of your life?
Job retired from (Please specify industry / position)
Current job (Please specify industry / position)
Housewife Never employed
Other (Please specify)
Page 348
5
Please turn to the next page
19) If more than one, please list the most significant jobs you’ve had throughout your life.
1
2
3
4
5
20) Which of these do you or your spouse currently receive as income? (Please tick all
that apply)
Wages or salary Superannuation Workers compensation
Income from your own business/partnership Disability support pension
Income from interest, dividends or rent Other pension Other (Please specify)
21) If we include the income from all these sources, and add all of your (and your
spouse's) earnings, in which of these groups would your total income be before tax or anything else is taken out?
Up to 5,000 dollars pa Between 5,001 & 20,000 dollars pa
Between 20,001 & 40,000 dollars pa Between 40,001 & 60,000 dollars pa
Between 60,001 & 80,000 dollars pa More than 80,000 dollars pa
Page 349
6
Please turn to the next page
HOUSING AND TRANSPORTATION
22) In what type of residential accommodation do you currently live?
House Home unit or flat Granny flat Self-contained unit Bed-sitters room Aged care facility
Other (Please specify type of accommodation)
23) How many people usually live with you?
None 1 2 3 4 >4 24) If you do live with others, please indicate what their relationship is to you (e.g.
partner, child etc.). 25) Do you drive a motor vehicle?
At least once a day Once or twice a week Once or twice a month Less than once or twice a month Never
26) What method of transportation do you use most often?
Private transportation Public transportation
Page 350
7
Please turn to the next page
YOUR HEALTH AND MEDICAL CONDITIONS
27) Have you consulted any of the following people about your health in the last 12 months? (Please tick all that apply)
General practitioner Specialist doctor Mental health practitioner Dental practitioner Allied health practitioner (e.g. physiotherapist, audiologist, podiatrist) District, home or community nurse Naturopath Traditional practitioner (e.g. Chinese medicine) Other (Please specify)
28) In the last 12 months, have you been in hospital at least overnight due to a medical
condition or an accident?
Yes No 29) Have you ever been told by a doctor or other health professional that you had any of
the following? (Please tick all that apply)
Cardiovascular problems (e.g. heart attack, angina, stroke, peripheral arterial disease, hypertension (high blood pressure), heart failure) Please specify
Chronic respiratory problems (e.g. chronic obstructive pulmonary disease (COPD), asthma, pulmonary hypertension, respiratory allergies) Please specify
Page 351
8
Please turn to the next page
Chronic infection (e.g. skin, kidney)
Please specify
Chronic neurological problems (e.g. Parkinson’s disease, Huntington’s disease, Alzheimer’s disease, multiple sclerosis, epilepsy) Please specify
Cancer or malignancy of any kind
Please specify
Diabetes
Arthritis or other joint problems
Vision or hearing problems (e.g. macular degeneration, hearing loss)
Mental health problems (e.g. depression, anxiety, stress)
Other condition/s
Please specify
30) How would you rate your health at the current time?
Excellent Very good Good Fair Poor
Page 352
9
Please turn to the next page
31) Do you feel that your health problems affect your ability to do the things you want to?
Not at all A little A great deal 32) Compared to people your own age, how do you rate your own health?
Better The same Worse
YOUR PERCEPTIONS OF ILLNESS AND AGEING
IMPORTANT
ONLY COMPLETE ONE OF THE ILLNESS PERCEPTION SECTIONS BELOW
Do you identify as having an illness or medical condition/s?
Yes Complete the ILLNESS PERCEPTIONS A SECTION ONLY (starting on page 10). After completion, GO TO THE AGEING PERCEPTIONS SECTION on page 23.
No Complete the ILLNESS PERCEPTIONS B SECTION ONLY (starting on page 16). After completion, GO TO THE AGEING PERCEPTIONS SECTION on page 23.
Page 353
10
Please turn to the next page
ILLNESS PERCEPTIONS A
OONNLLYY CCOOMMLLPPEETTEE TTHHIISS SSEECCTTIIOONN IIFF YYOOUU DDOO IIDDEENNTTIIFFYY AASS HHAAVVIINNGG AANN IILLLLNNEESSSS.. IIFF YYOOUU DDOO NNOOTT HHAAVVEE AANN IILLLLNNEESSSS,, SSTTAARRTT AATT PPAAGGEE 1166.. YOUR VIEWS ABOUT YOUR ILLNESS Listed below are a number of symptoms that you may or may not have experienced since your illness. Please indicate whether you have experienced any of these symptoms since your illness, and whether you believe that these symptoms are related to your illness. I have experienced this symptom since my illness (select as many as apply):
Pain Sore Eyes
Sore Throat Wheeziness
Nausea Headaches
Breathlessness Upset Stomach
Weight Loss Sleep Difficulties
Fatigue Dizziness
Stiff Joints Loss of Strength This symptom is related to my illness (select as many as apply):
Pain Sore Eyes
Sore Throat Wheeziness
Nausea Headaches
Breathlessness Upset Stomach
Weight Loss Sleep Difficulties
Fatigue Dizziness
Stiff Joints Loss of Strength
Page 354
11
Please turn to the next page
We are interested in your own personal views of how you now see your current illness. Please indicate how much you agree or disagree with the following statements about your illness by ticking the appropriate box.
STRONGLY DISAGREE DISAGREE
NEITHER AGREE OR DISAGREE
AGREE STRONGLY AGREE
My illness will last a short time
My illness is likely to be permanent rather than temporary
My illness will last for a long time
This illness will pass quickly
I expect to have this illness for the rest of my life
My illness is a serious condition
My illness has major consequences on my life
My illness does not have much effect on my life
My illness strongly affects the way others see me
My illness has serious financial consequences
My illness causes difficulties for those who are close to me
There is a lot which I can do to control my symptoms
Page 355
12
Please turn to the next page
STRONGLY DISAGREE
DISAGREE NEITHER AGREE OR DISAGREE
AGREE STRONGLY AGREE
What I do can determine whether my illness gets better or worse
The course of my illness depends on me
Nothing I do will affect my illness
I have the power to influence my illness
My actions will have no affect on the outcome of my illness
My illness will improve in time
There is very little that can be done to improve my illness
My treatment will be effective in curing my illness
The negative effects of my illness can be prevented (avoided) by my treatment
My treatment can control my illness
There is nothing which can help my condition
The symptoms of my condition are puzzling to me
My illness is a mystery to me
I don’t understand my illness
Page 356
13
Please turn to the next page
STRONGLY DISAGREE DISAGREE
NEITHER AGREE OR DISAGREE
AGREE STRONGLY AGREE
My illness doesn’t make any sense to me
I have a clear picture or understanding of my condition
The symptoms of my illness change a great deal from day to day
My symptoms come and go in cycles
My illness is very unpredictable
I go through cycles in which my illness gets better and worse
I get depressed when I think about my illness
When I think about my illness I get upset
My illness makes me feel angry
My illness does not worry me
Having this illness makes me feel anxious
My illness makes me feel afraid
Page 357
14
Please turn to the next page
CAUSES OF MY ILLNESS We are interested in what you consider may have been the cause of your illness. As people are very different, there is no correct answer for this question. We are most interested in your own views about the factors that caused your illness rather than what others including doctors or family may have suggested to you. Below is a list of possible causes for your illness. Please indicate how much you agree or disagree that they were causes for you by ticking the appropriate box. STRONGLY
DISAGREE DISAGREE NEITHER
AGREE OR
DISAGREE
AGREE STRONGLY AGREE
Stress or worry
Hereditary - it runs in my family
A Germ or virus
Diet or eating habits
Chance or bad luck
Poor medical care in my past
Pollution in the environment
My own behavior
My mental attitude e.g. thinking about life negatively
Family problems or worries caused my illness
Overwork
My emotional state e.g. feeling down, lonely, anxious, empty
Ageing
Page 358
15
Please turn to the next page
STRONGLY DISAGREE DISAGREE
NEITHER AGREE OR DISAGREE
AGREE STRONGLY AGREE
Alcohol
Smoking
Accident or injury
My personality
Altered immunity
In the table below, please list in rank-order the three most important factors that you now believe caused YOUR illness. You may use any of the items listed previously, or you may have additional ideas of your own. The most important causes for me:
1. _______________________________________
2. _______________________________________
3. _______________________________________
YYOOUU HHAAVVEE CCOOMMPPLLEETTEEDD TTHHEE IILLLLNNEESSSS PPEERRCCEEPPTTIIOONNSS SSEECCTTIIOONN.. PPLLEEAASSEE GGOO TTOO TTHHEE AAGGEEIINNGG PPEERRCCEEPPTTIIOONNSS SSEECCTTIIOONN OONN PPAAGGEE 2233..
Page 359
16
Please turn to the next page
ILLNESS PERCEPTIONS B
OONNLLYY CCOOMMLLPPEETTEE TTHHIISS SSEECCTTIIOONN IIFF YYOOUU DDOO NNOOTT IIDDEENNTTIIFFYY AASS HHAAVVIINNGG AANN IILLLLNNEESSSS.. IIFF YYOOUU DDOO HHAAVVEE AANN IILLLLNNEESSSS,, SSTTAARRTT AATT PPAAGGEE 1100.. YOUR VIEWS ABOUT HEART DISEASE Listed below are a number of symptoms that someone suffering from heart disease may or may not experience. Please indicate whether you believe people with heart disease experience any of these symptoms, and whether these symptoms are related to heart disease. Someone with heart disease may experience this symptom (select as many as apply):
Pain Sore Eyes
Sore Throat Wheeziness
Nausea Headaches
Breathlessness Upset Stomach
Weight Loss Sleep Difficulties
Fatigue Dizziness
Stiff Joints Loss of Strength
This symptom is related to heart disease (select as many as apply):
Pain Sore Eyes
Sore Throat Wheeziness
Nausea Headaches
Breathlessness Upset Stomach
Weight Loss Sleep Difficulties
Fatigue Dizziness
Stiff Joints Loss of Strength
Page 360
17
Please turn to the next page
We are interested in your own personal views of how you see heart disease. Please indicate how much you agree or disagree with the following statements about your illness by ticking the appropriate box. STRONGLY
DISAGREE DISAGREE NEITHER
AGREE OR
DISAGREE
AGREE STRONGLY AGREE
Heart disease will last a short time
Heart disease is likely to be permanent rather than temporary
Heart disease will last for a long time
Heart disease will pass quickly
Someone with heart disease is expected to have this illness for the rest of their life
Heart disease is a serious condition
Heart disease has major consequences on one’s life
Heart disease does not have much effect on one’s life
Heart disease strongly affects the way others see that person
Heart disease has serious financial consequences
Heart disease causes difficulties for those who are close to the person with the illness
Page 361
18
Please turn to the next page
STRONGLY DISAGREE
DISAGREE NEITHER AGREE
OR DISAGREE
AGREE STRONGLY AGREE
There is a lot which one can do to control his/her symptoms
What one does can determine whether his/her heart disease gets better or worse
The course of the illness depends on the person with heart disease
Nothing one does will affect his/her heart disease
One has the power to influence his/her heart disease
The actions of the person with heart disease will have no affect on the outcome of his/her illness
Heart disease will improve in time
There is very little that can be done to improve heart disease
Treatment will be effective in curing heart disease
The negative effects of heart disease can be prevented (avoided) by treatment
Page 362
19
Please turn to the next page
STRONGLY DISAGREE
DISAGREE NEITHER AGREE
OR DISAGREE
AGREE STRONGLY AGREE
Treatment can control heart disease
There is nothing which can help one’s condition
The symptoms of heart disease are puzzling to me
Heart disease is a mystery to me
I don’t understand heart disease
Heart disease doesn’t make any sense to me
I have a clear picture or understanding of heart disease
Symptoms of heart disease change a great deal from day to day
Symptoms of heart disease come and go in cycles
Heart disease is very unpredictable
One goes through cycles in which heart disease gets better and worse
I get depressed when I think about heart disease
When I think about heart disease I get upset
Page 363
20
Please turn to the next page
STRONGLY DISAGREE
DISAGREE NEITHER AGREE
OR DISAGREE
AGREE STRONGLY AGREE
Heart disease makes me feel angry
Heart disease does not worry me
Having this illness makes one feel anxious
Heart disease makes one feel afraid
CAUSES OF HEART DISEASE We are interested in what you consider may be the cause of heart disease. As people are very different, there is no correct answer for this question. We are most interested in your own views about the factors that cause heart disease rather than what others including doctors or family may have suggested to you. Below is a list of possible causes for heart disease. Please indicate how much you agree or disagree that they were causes for you by ticking the appropriate box. STRONGLY
DISAGREE DISAGREE NEITHER
AGREE OR
DISAGREE
AGREE STRONGLY AGREE
Stress or worry
Hereditary - it runs in the family
A Germ or virus
Diet or eating habits
Chance or bad luck
Poor medical care in one’s past
Pollution in the environment
Page 364
21
Please turn to the next page
STRONGLY DISAGREE
DISAGREE NEITHER AGREE
OR DISAGREE
AGREE STRONGLY AGREE
One’s own behavior
One’s mental attitude e.g. thinking about life negatively
Family problems or worries cause heart disease
Overwork
One’s emotional state e.g. feeling down, lonely, anxious, empty
Ageing
Alcohol
Smoking
Accident or injury
One’s personality
Altered immunity
Page 365
22
Please turn to the next page
In the table below, please list in rank-order the three most important factors that you now believe cause heart disease. You may use any of the items listed previously, or you may have additional ideas of your own. The most important causes:
1. _______________________________________
2. _______________________________________
3. _______________________________________
YYOOUU HHAAVVEE CCOOMMPPLLEETTEEDD TTHHEE IILLLLNNEESSSS PPEERRCCEEPPTTIIOONNSS SSEECCTTIIOONN.. PPLLEEAASSEE GGOO TTOO TTHHEE AAGGEEIINNGG PPEERRCCEEPPTTIIOONNSS SSEECCTTIIOONN OONN PPAAGGEE 2233..
Page 366
23
Please turn to the next page
PPLLEEAASSEE CCOOMMPPLLEETTEE TTHHEE RREEMMAAIINNIINNGG SSEECCTTIIOONNSS OOFF TTHHIISS BBOOOOKKLLEETT..
AGEING PERCEPTIONS
These questions assess your views and experiences of getting older. Since everyone is getting older, these questions can be answered by anyone of any age. There are no right or wrong answers – just your experiences and views. Even if the statement relates to something you do not often think about in relation to yourself, please try to give an indication of your views by answering every question. VIEWS ABOUT AGING We are interested in your own personal views and experiences about getting older. Please indicate your views on the following statements. STRONGLY
DISAGREE DISAGREE NEITHER
AGREE OR
DISAGREE
AGREE STRONGLY AGREE
I am conscious of getting older all of the time
I am always aware of my age
I always classify myself as old
I am always aware of the fact that I am getting older
I feel my age in everything that I do
As I get older I get wiser
As I get older I continue to grow as a person
As I get older I appreciate things more
Page 367
24
Please turn to the next page
STRONGLY DISAGREE
DISAGREE NEITHER AGREE
OR DISAGREE
AGREE STRONGLY AGREE
I get depressed when I think about how ageing might affect the things that I can do
The quality of my social life in later years depends on me
The quality of my relationships with others in later life depends on me
Whether I continue living life to the full depends on me
I get depressed when I think about the effect that getting older might have on my social life
As I get older there is much I can do to maintain my independence
Whether getting older has positive sides to it depends on me
Getting older restricts the things that I can do
Getting older makes me less independent
Getting older makes everything a lot harder for me
Page 368
25
Please turn to the next page
STRONGLY DISAGREE
DISAGREE NEITHER AGREE
OR DISAGREE
AGREE STRONGLY AGREE
As I get older I can take part in fewer activities
As I get older I do not cope as well with problems that arise
Slowing down with age is not something I can control
How mobile I am in later life is not up to me
I have no control over whether I lose vitality or zest for life as I age
I have no control over the effects which getting older has on my social life
I get depressed when I think about getting older
I worry about the effects that getting older may have on my relationships with others
I go through cycles in which my experience of ageing gets better and worse
My awareness of getting older comes and goes in cycles
Page 369
26
Please turn to the next page
STRONGLY DISAGREE
DISAGREE NEITHER AGREE
OR DISAGREE
AGREE STRONGLY AGREE
I feel angry when I think about getting older
I go through phases of feeling old
My awareness of getting older changes a great deal from day to day
I go through phases of viewing myself as being old
EXPERIENCE OF HEALTH-RELATED CHANGES The next list describes some health-related changes you may have experienced. Please indicate whether you have experienced these changes in the last 10 years and whether you believe that the changes experienced are specifically related to getting older or not. HAVE you experienced this change? (Select as many as apply).
Weight problems Cramps
Sleep problems Bone or joint condition
Back problems or slipped disc Cardiac or heart problems
Painful joints Ear or hearing problems
Not being mobile Vision and eyesight change
Loss of balance Respiratory problems
Loss of strength Foot problems
Slowing down Depression
Anxiety
Page 370
27
Please turn to the next page
In terms of the changes you HAVE experienced: Do you think this change is ONLY related to, or due to the fact that, you are getting older? (Select as many as apply).
Weight problems Cramps
Sleep problems Bone or joint condition
Back problems or slipped disc Cardiac or heart problems
Painful joints Ear or hearing problems
Not being mobile Vision and eyesight changes
Loss of balance Respiratory problems
Loss of strength Foot problems
Slowing down Depression
Anxiety
Page 371
28
Please turn to the next page
PERSONALITY
Below are phrases describing people's behaviours. Please indicate how accurately each statement describes you. Describe yourself as you generally are now, not as you wish to be in the future. Describe yourself as you honestly see yourself, in relation to other people you know of the same sex as you are, and roughly your same age. Please read each statement carefully before responding. VERY
INACCURATE MODERATELY INACCURATE
NEITHER INNACURATE
NOR ACCURATE
MODERATELY ACCURATE
VERY ACCURATE
Often feel blue
Am always prepared
Panic easily
Dislike myself
Carry out my plans
Am often down in the dumps
Do just enough work to get by
Waste my time
Feel comfortable with myself
Find it difficult to get down to work
Seldom feel blue
Shirk my duties
Page 372
29
Please turn to the next page
VERY INACCURATE
MODERATELY INACCURATE
NEITHER INNACURATE
NOR ACCURATE
MODERATELY ACCURATE
VERY ACCURATE
Have frequent mood swings
Don’t see things through
Rarely get irritated
Get chores done right away
Am not easily bothered by things
Make plans and stick to them
Am very pleased with myself
Pay attention to details
Page 373
30
Please turn to the next page
LIFE ORIENTATION
Please be as honest and accurate as you can throughout. Try not to let your response to one statement influence your responses to other statements. There are no "correct" or "incorrect" answers. Answer according to your own feelings, rather than how you think "most people" would answer. I
DISAGREE A LOT
I DISAGREE A LITTLE
I NEITHER AGREE
NOR DISAGREE
I AGREE
A LITTLE
I AGREE A LOT
In uncertain times, I usually expect the best
It's easy for me to relax
If something can go wrong for me, it will
I'm always optimistic about my future
I enjoy my friends a lot
It's important for me to keep busy
I hardly ever expect things to go my way
I don't get upset too easily
I rarely count on good things happening to me
Overall, I expect more good things to happen to me than bad
Page 374
31
Please turn to the next page
COPING ABILITIES
This questionnaire deals with ways people respond when they confront difficult or stressful events in their life. There are lots of ways to try to deal with stress. This questionnaire asks you to indicate what you generally do and feel when you experience stressful events. Obviously, different events bring out somewhat different responses, but think about what you usually do when you are under a lot of stress. Try to rate each item separately in your mind from the others. Choose your answers thoughtfully, and make your answers as true FOR YOU as you can. Please answer every item. There are no "right" or "wrong" answers, so choose the most accurate answer for YOU - not what you think "most people" would say or do. Indicate what YOU usually do when YOU experience a stressful event. I
USUALLY DON’T DO
THIS AT ALL
I USUALLY DO THIS A LITTLE
BIT
I USUALLY DO THIS A MEDIUM AMOUNT
I USUALLY DO THIS
A LOT
I turn to work or other activities to take my mind off things
I concentrate my efforts on doing something about the situation I'm in
I say to myself "this isn't real."
I use alcohol or other drugs to make myself feel better
I get emotional support from others
I give up trying to deal with it
I take action to try to make the situation better
I refuse to believe that it has happened
I say things to let my unpleasant feelings escape
I get help and advice from other people
I use alcohol or other drugs to help me get through it
I try to see it in a different light, to make it seem more positive
Page 375
32
Please turn to the next page
I USUALLY DON’T DO
THIS AT ALL
I USUALLY DO THIS A LITTLE
BIT
I USUALLY DO THIS A MEDIUM AMOUNT
I USUALLY DO THIS
A LOT
I criticize myself
I try to come up with a strategy about what to do
I get comfort and understanding from someone
I give up the attempt to cope
I look for something good in what is happening
I make jokes about it
I do something to think about it less, such as going to movies, watching TV, reading, daydreaming, sleeping, or shopping
I accept the reality of the fact that it has happened
I express my negative feelings
I try to find comfort in my religion or spiritual beliefs
I try to get advice or help from other people about what to do
I learn to live with it
I think hard about what steps to take
I blame myself for things that happened
I pray or meditate
I make fun of the situation
Page 376
33
Please turn to the next page
SOCIAL SUPPORT
These questions assess your level of social support satisfaction. Please give an indication of whether these questions are true for you or not. HARDLY
EVER SOME OF THE TIME
MOST OF THE TIME
Do you feel you have a definite role (place) in your family and among your friends?
Does it seem that your family and friends (i.e. people who are important to you) understand you?
Do you feel useful to your family and friends (i.e. people who are important to you)?
When you are talking with your family and friends, do you feel you are being listened to?
Do you know what is going on with your family and friends?
Can you talk about your deepest problems with at least some of your family and friends?
How satisfied are you with the kinds of relationships you have with your family and friends?
Very dissatisfied Somewhat dissatisfied Satisfied
These questions assess your level of social interaction. Please give an indication of whether these questions are true for you or not. Other than members of your family, how many persons in your local area do you feel you can depend on or feel very close to?
None 1-2 people More than 2 people
Page 377
34
Please turn to the next page
How many times during the past week did you spend time with someone who does not live with you, that is, you went to see them or they came to visit you or you went out together?
NONE ONCE TWICE THREE TIMES
FOUR TIMES
FIVE TIMES
SIX TIMES
SEVEN OR
MORE TIMES
How many times did you talk to someone, (friends, relatives or others) on the telephone in the past week (either they called you or you called them)?
NONE ONCE TWICE THREE TIMES
FOUR TIMES
FIVE TIMES
SIX TIMES
SEVEN OR
MORE TIMES
About how often did you go to meetings of clubs, religious meetings or other groups that you belong to in the past week?
NONE ONCE TWICE THREE TIMES
FOUR TIMES
FIVE TIMES
SIX TIMES
SEVEN OR
MORE TIMES
Page 378
35
Please turn to the next page
WELLBEING
This questionnaire consists of a number of words that describe different feelings and emotions. Read each statement and then mark the appropriate answer. Indicate to what extent you have felt this way in general, that is, how you feel on average. VERY
SLIGHTLY OR NOT AT ALL
A LITTLE
MODERATELY QUITE A BIT
EXTREMELY
Interested
Irritable
Distressed
Alert
Excited
Ashamed
Upset
Inspired
Strong
Nervous
Guilty
Determined
Scared
Attentive
Hostile
Page 379
36
Please turn to the next page
VERY SLIGHTLY
OR NOT AT ALL
A LITTLE
MODERATELY QUITE A BIT
EXTREMELY
Jittery
Enthusiastic
Active
Proud
Afraid
Page 380
37
Please turn to the next page
LIFE SATISFACTION
Below are five statements that you may agree or disagree with. Please indicate your agreement with each item by marking the appropriate field. Please be open and honest in your responding. 1 = STRONGLY DISAGREE 2 = DISAGREE 3 = SLIGHLTY DISAGREE 4 = NEITHER AGREE NOR DISAGREE 5 = SLIGHTLY AGREE 6 = AGREE 7 = STRONGLY AGREE
1 2 3 4 5 6 7
In most ways my life is close to ideal
The conditions of my life are excellent
I am satisfied with my life
So far I have gotten the important things I want in life
If I could live my life over, I would change almost nothing
Page 381
38
Please turn to the next page
QUALITY OF LIFE
Please read each of the following statements carefully. Indicate by marking the appropriate field how much the statement applies to you. There are no right and wrong answers. Do not spend too much time on any statement. NEVER SOMETIMES NOT
OFTEN OFTEN
My age prevents me from doing the things I would like to do
I feel that what happens to me is out of my control
I feel left out of things
I can do the things I want to do
I feel that I can please myself what I do
Shortage of money stops me from doing things I want to do
I look forward to each day
I feel that my life has meaning
I enjoy the things that I do
I feel full of energy these days
I feel that life is full of opportunities
I feel that the future looks good for me
Page 382
39
Please turn to the next page
MOOD
Please read each of the following statements carefully. Indicate by marking the appropriate field how much the statement applied to you over the past week. There are no right and wrong answers. Do not spend too much time on any statement. DID NOT
APPLY TO ME AT
ALL
APPLIED TO ME TO
SOME DEGREE, OR SOME OF THE
TIME
APPLIED TO ME A
CONSIDERABLE DEGREE, OR A GOOD PART OF
THE TIME
APPLIED TO ME VERY
MUCH, OR MOST OF THE
TIME I found it hard to wind down
I was aware of dryness of my mouth
I couldn't seem to experience any positive feeling at all
I experienced breathing difficulty (e.g. excessively rapid breathing, breathlessness in the absence of physical exertion)
I found it difficult to work up the initiative to do things
I tended to over-react to situations
I experienced trembling (e.g. in the hands)
I felt that I was using a lot of nervous energy
I was worried about situations in which I might panic and make a fool of myself
I felt that I had nothing to look forward to
I found myself getting agitated
I found it difficult to relax
I felt down-hearted and blue
Page 383
40
Please turn to the next page
DID NOT APPLY TO
ME AT ALL
APPLIED TO ME TO
SOME DEGREE, OR SOME OF THE
TIME
APPLIED TO ME A
CONSIDERABLE DEGREE, OR A GOOD PART OF
THE TIME
APPLIED TO ME VERY
MUCH, OR MOST OF THE
TIME I was intolerant of anything that kept me from getting on with what I was doing
I felt I was close to panic
I was unable to become enthusiastic about anything
I felt I wasn't worth much as a person
I felt that I was rather touchy
I was aware of the action of my heart in the absence of physical exertion (e.g. sense of heart rate increase, heart missing a beat)
I felt scared without any good reason
I felt that life was meaningless
Page 384
If you would like the chance to win one of five Coles-Myer vouchers valued at $100 and would be happy to participate in future phases of this study, please tick the box below (you will not suffer any adverse consequence should you choose not to participate in future phases of this study and you are able to opt out of this study at any time).
I consent to being contacted for future phases of this study and to go into the draw to win one of five Coles-Myer vouchers valued at $100.
The final results from this study will be made available to all participants. Please indicate whether you wish to receive this information.
I consent to being contacted with the final group results for this study.
You have completed the survey – thank you for your time.
Please tear off the front page of this booklet (with your contact details and the invitation to participate) and retain for your own records, along with the Participant
Information Sheet enclosed.
Please return the completed survey (including this page) in the reply paid envelope provided to:
Louise Turner School of Psychology
University of Wollongong
Page 387
366
Appendix C: Participant information sheet
Page 388
SCHOOL OF PSYCHOLOGY
PARTICIPANT INFORMATION SHEET
Predictors of wellbeing and psychopathology in an ageing population: The
effects of age and illness self-perceptions
Principal Investigator:
Associate Professor Craig Gonsalvez (Ph: 4221 3674) Email: [email protected]
Co-Investigators:
Ms Louise Turner (Ph: 4221 4164) Email: [email protected]
Associate Professor Peter Caputi (Ph: 4221 3717) Email: [email protected]
Professor Don Iverson (Ph: 4221 4677) Email: [email protected]
What is the purpose of this study?
Due to significant increases in the age of Australian and global populations, research is
currently underway to look at how we might best manage the health care needs of older
adults. The purpose of this research is to examine how illness and ageing beliefs affect
coping abilities as people age, as well as how they relate to psychological health and wellbeing outcomes. Currently there is limited information regarding how illness and ageing
beliefs interact with one and another, or their relationships to psychological health factors in
older people. Establishing how such beliefs work is important because it will contribute to
our understanding of the ageing individual and will improve the ways in which we manage
the psychological health care needs of older people.
Who can participate?
Men and women aged 55 years and over are able to participate in this study. We are seeking
people with, and without, chronic illness/s.
What does research participation entail?
You may participate by completing the survey that will take approximately 45 minutes to
complete. There is no time limit imposed for completing the survey and you are free to take
as many breaks as you require.
If you would be happy to take part in stage two of this study, you will be asked to provide
your contact details. You may then be contacted in 12 months and asked to complete the
same surveys again. Data information will be de-identified and is separate to the contact
information you may provide.
You are free to withdraw your participation in this study at any time by contacting Louise
Turner. You will not suffer any adverse consequence should you choose to not participate or
withdraw your data from the study.
Page 389
Risks/benefits
All completed surveys will go into the draw to win one of five Coles-Myer vouchers valued
at $100. If you would like a chance to win one of these vouchers and are happy to participate
in future phases of this study, you will be asked to submit your contact information where
indicated at the end of this survey. Fields relevant for identification will be made available
to the Chief Researcher only, for the purpose of contacting you for stage two of this study.
This information will be deleted once you have been contacted about the second survey.
None of the tests will cause physical discomfort however some of the questions may be
uncomfortable for some participants. You will be asked to complete the survey to the best of
your ability however if it will be possible to skip certain questions if you feel uncomfortable
answering them.
Confidentiality/Privacy
All information collected will be kept secure and identified by a code rather than by your
actual name. Identifying information will be deleted after stage two data collection, so
anonymity of the data is ensured. Nothing which identifies individual participants will be
published.
Providing consent
By completing and returning the survey booklet in this mail-out, your consent will be
implied. If you do not consent to participating in this study, or being contacted for future
phases of this study, please do not respond to this request for participation in this study.
Feedback/Results
The results from the overall study will be made available to all participants if consent is
provided. As the results of this study will be used as part of the requirements for the
completion of Louise Turner’s PhD thesis at the University of Wollongong, the findings will
be submitted for publication in a number of peer-reviewed academic journals and presented at national or international scientific conferences.
Complaints
If you have any concerns about the conduct of the study, or your rights as a study
participant, you may contact the University of Wollongong Ethics Officer on (02) 4221
4457.
Contacts
If you have any questions about this research or would like more information about the
procedures, please feel free to contact the Chief Researcher Craig Gonsalvez or the Co-
Investigator Louise Turner (details above).
Thank you for your interest in this study.
Page 390
369
Appendix D: Sample questionnaire booklet (Time 2)
Page 391
Dear
Thank you for agreeing to participate in the second phase of this study that is examining
the effects of age and illness self-perceptions in older adults.
The research being conducted by researchers at the University of Wollongong is called
Predictors of wellbeing and psychopathology in an ageing population: The effects of age and illness self-perceptions. The purpose of this research is to examine how illness
and ageing beliefs affect coping abilities as people age, as well as how they relate to
psychological health and wellbeing outcomes.
We are interested in any changes you may have experienced since completing the first
survey. This survey contains the same questionnaires that you would have completed in
the first survey. In addition, you will be asked to complete a questionnaire that will help
us to identify any life events that may have happened to you over the past 12 months.
WE WOULD LIKE YOU TO: Complete the attached survey IN FULL and return
it to us in the enclosed, reply paid envelope. Please tear off this front page and retain
for your own records.
Please check that all pages of this survey have been completed before returning in
the reply paid envelope.
As you have agreed to participate in the second phase of the study, you will go into the
draw to win one of five Coles-Myer vouchers valued at $100.
Please read the separate, enclosed Participant Information Sheet carefully. If you have
any queries about the research, you can contact Louise Turner on 4221 4164 or Associate
Professor Craig Gonsalvez on 4221 3674. The information you provide in the survey is
only identifiable by a code and as such, anonymity is assured. Please attempt to answer
all of the questions to the best of your ability.
If you have any concerns or complaints regarding the manner in which the research is or
has been conducted, you can contact the Ethics Officer, Human Research Ethics
Committee, Office of Research, University of Wollongong on 4221 4457.
With kind regards,
Associate Professor Craig Gonsalvez
School of Psychology
University of Wollongong
Page 393
SURVEY OF ADULTS AGED 55 YEARS AND OVER
Please complete the following questionnaires to the best of your ability.
You will have already answered most of these questions when completing the first
survey.
PLEASE ATTEMPT TO COMPLETE ALL OF THESE QUESTIONS AGAIN FOR THIS SECOND SURVEY.
If possible, answer all the questions by placing a tick in one box for each
question unless otherwise stated.
Thank you very much for your time.
Page 394
RECENT LIFE EVENTS
Look over the events listed below. Please indicate if any of these events have happened to
you over the past 12 months only.
Death of a spouse Divorce Marital separation Death of a close family member
Personal injury or illness Marriage Marital reconciliation Change in health of family member Pregnancy of family member Gain of new family member Job change Change in financial status Death of a close friend
Mortgage / loan of major purchase Foreclosure of mortgage / loan Change in responsibilities of your job Son or daughter leaving home
Trouble with in-laws Outstanding personal achievement Spouse begins / stops work outside home Revision of personal habits Trouble with boss Change in work hours / conditions Change in residence Change in sleeping habits Change in eating habits Vacation (holiday) Christmas Minor violations of law
1
Please turn to the next page
Increase in arguments with significant
other
Page 395
2
Please turn to the next page
ABOUT YOU
1) What is your gender? Male Female
2) How old are you today? (Age in years)
3) In which country were you born?
4) If you were not born in Australia, in what year did you arrive in Australia?
5) Which one of the following would you describe yourself as?
Australian Aboriginal Torres Strait Islander
Aboriginal AND Torres Strait Islander English Irish
Scottish Other European Asian
Other (Please specify)
6) Do you speak a language at home other than English?
Yes (Please specify other language)
No
7) Which of the following would you describe yourself as?
Religious (belong to an organised religion e.g. Catholic / Anglican)
Non-religious but spiritual
Non-religious (e.g. atheist / agnostic)
Page 396
3
Please turn to the next page
8) If religious or spiritual, to what extent is your faith or spirituality an important part of
your daily life?
Very important Important Moderately important
Of little importance Unimportant
9) What is your current marital status?
Married DeFacto Separated Divorced
Widowed Never Married
10) How long have you been of this marital status? (Please answer in number of years. If
less than one year, enter 0).
Page 397
4
Please turn to the next page
LIFE EVENTS
The next questions are about major events that sometimes take place during a person’s life.
11) Have you ever been a victim of a serious physical attack or assault at any time in
your life?
Yes No
12) Have you ever had a life-threatening illness or accidental injury at any time of your
life?
Yes No
13) Apart from your husband / wife / partner, have you lost anyone close to you through
death in the last 3 years?
Yes (Please indicate their relationship to you)
No
14) During the last 3 years has anything else happened to you that upset you a lot that
you haven’t already answered?
Yes (Please specify)
No
Page 398
5
Please turn to the next page
EDUCATION, EMPLOYMENT AND INCOME
15) Which of these groups best describes your highest qualification?
Primary school course Secondary school course
Trade or apprenticeship Certificate or Diploma
Bachelor Degree or Post Graduate Diploma
Higher qualification Adult education or hobby course
No formal tuition Other (Please specify)
16) Do you currently work in a job, business or farm?
Yes Paid work Voluntary work
No
17) Are you retired from your last job?
Yes No
18) What kind of work have you done most of your life?
Job retired from (Please specify industry / position)
Current job (Please specify industry / position)
Housewife Never employed
Other (Please specify)
Page 399
6
Please turn to the next page
19) If more than one, please list the most significant jobs you’ve had throughout your
life.
1
2
3
4
5
20) Which of these do you or your spouse currently receive as income? (Please tick all
that apply)
Wages or salary Superannuation Workers compensation
Income from your own business/partnership Disability support pension
Income from interest, dividends or rent Other pension
Other (Please specify)
21) If we include the income from all these sources, and add all of your (and your
spouse's) earnings, in which of these groups would your total income be before tax or
anything else is taken out?
Up to 5,000 dollars pa Between 5,001 & 20,000 dollars pa
Between 20,001 & 40,000 dollars pa Between 40,001 & 60,000 dollars pa
Between 60,001 & 80,000 dollars pa More than 80,000 dollars pa
Page 400
7
Please turn to the next page
HOUSING AND TRANSPORTATION
22) In what type of residential accommodation do you currently live?
House Home unit or flat Granny flat
Self-contained unit Bed-sitters room Aged care facility
Other (Please specify type of accommodation)
23) How many people usually live with you?
None 1 2 3 4 >4
24) If you do live with others, please indicate what their relationship is to you (e.g.
partner, child etc.).
25) Do you drive a motor vehicle?
At least once a day Once or twice a week
Once or twice a month Less than once or twice a month
Never
26) What method of transportation do you use most often?
Private transportation Public transportation
Page 401
8
Please turn to the next page
YOUR HEALTH AND MEDICAL CONDITIONS
27) Have you consulted any of the following people about your health in the last 12
months? (Please tick all that apply)
General practitioner Specialist doctor
Mental health practitioner Dental practitioner
Allied health practitioner (e.g. physiotherapist, audiologist, podiatrist)
District, home or community nurse
Naturopath Traditional practitioner (e.g. Chinese medicine)
Other (Please specify)
28) In the last 12 months, have you been in hospital at least overnight due to a medical
condition or an accident?
Yes No
29) Have you ever been told by a doctor or other health professional that you had any of
the following? (Please tick all that apply)
Cardiovascular problems (e.g. heart attack, angina, stroke, peripheral arterial
disease, hypertension (high blood pressure), heart failure)
Please specify
Chronic respiratory problems (e.g. chronic obstructive pulmonary disease
(COPD), asthma, pulmonary hypertension, respiratory allergies)
Please specify
Page 402
9
Please turn to the next page
Chronic infection (e.g. skin, kidney)
Please specify
Chronic neurological problems (e.g. Parkinson’s disease, Huntington’s disease,
Alzheimer’s disease, multiple sclerosis, epilepsy)
Please specify
Cancer or malignancy of any kind
Please specify
Diabetes
Arthritis or other joint problems
Vision or hearing problems (e.g. macular degeneration, hearing loss)
Mental health problems (e.g. depression, anxiety, stress)
Other condition/s
Please specify
30) How would you rate your health at the current time?
Excellent Very good Good Fair Poor
Page 403
10
Please turn to the next page
31) Do you feel that your health problems affect your ability to do the things you want
to?
Not at all A little A great deal
32) Compared to people your own age, how do you rate your own health?
Better The same Worse
YOUR PERCEPTIONS OF ILLNESS AND AGEING
IMPORTANT
ONLY COMPLETE ONE OF THE ILLNESS PERCEPTION SECTIONS BELOW
Do you identify as having an illness or medical condition/s?
Yes Complete the ILLNESS PERCEPTIONS A SECTION ONLY (starting on
page 10). After completion, GO TO THE AGEING PERCEPTIONS
SECTION on page 23. You will be asked to identify which illness is most
distressing for you at this point in time.
No Complete the ILLNESS PERCEPTIONS B SECTION ONLY (starting on
page 16). After completion, GO TO THE AGEING PERCEPTIONS
SECTION on page 23.
Page 404
11
Please turn to the next page
ILLNESS PERCEPTIONS A
OONNLLYY CCOOMMLLPPEETTEE TTHHIISS SSEECCTTIIOONN IIFF YYOOUU DDOO IIDDEENNTTIIFFYY AASS HHAAVVIINNGG AANN
IILLLLNNEESSSS.. IIFF YYOOUU DDOO NNOOTT HHAAVVEE AANN IILLLLNNEESSSS,, SSTTAARRTT AATT PPAAGGEE 1166..
Please list the illness which is most distressing for you:
Listed below are a number of symptoms that you may or may not have experienced since
your illness. Please indicate whether you have experienced any of these symptoms since
your illness, and whether you believe that these symptoms are related to your illness.
I have experienced this symptom since my illness (select as many as apply):
Pain Sore Eyes
Sore Throat Wheeziness
Nausea Headaches
Breathlessness Upset Stomach
Weight Loss Sleep Difficulties
Fatigue Dizziness
Stiff Joints Loss of Strength
This symptom is related to my illness (select as many as apply):
Pain Sore Eyes
Sore Throat Wheeziness
Nausea Headaches
Breathlessness Upset Stomach
Weight Loss Sleep Difficulties
Fatigue Dizziness
Stiff Joints Loss of Strength
Page 405
12
Please turn to the next page
We are interested in your own personal views of how you now see your current illness.
Please indicate how much you agree or disagree with the following statements about your
illness by ticking the appropriate box.
My illness will last
a short time
My illness is likely
to be permanent
rather than
temporary
My illness will last
for a long time
This illness will
pass quickly
I expect to have this
illness for the rest
of my life My illness is a
serious condition
My illness has
major consequences
on my life
My illness does not
have much effect on
my life
My illness strongly
affects the way
others see me
My illness has
serious financial
consequences My illness causes
difficulties for those
who are close to me
There is a lot which
I can do to control
my symptoms
STRONGLY
DISAGREE DISAGREE
NEITHER
AGREE
OR
DISAGREE
AGREE
STRONGLY
AGREE
Page 406
13
Please turn to the next page
What I do can
determine whether
my illness gets
better or worse
The course of my
illness depends on
me
Nothing I do will
affect my illness
I have the power to influence my illness
My actions will
have no affect on
the outcome of my
illness
My illness will
improve in time
There is very little
that can be done to
improve my illness
My treatment will
be effective in
curing my illness
The negative effects
of my illness can be
prevented (avoided)
by my treatment
My treatment can
control my illness
There is nothing
which can help my
condition The symptoms of
my condition are
puzzling to me
My illness is a
mystery to me
I don’t understand
my illness
STRONGLY
DISAGREE
DISAGREE NEITHER
AGREE
OR
DISAGREE
AGREE STRONGLY
AGREE
Page 407
14
Please turn to the next page
My illness doesn’t
make any sense to
me
I have a clear
picture or
understanding of
my condition
The symptoms of
my illness change a
great deal from day
to day
My symptoms come
and go in cycles
My illness is very
unpredictable
I go through cycles
in which my illness
gets better and
worse
I get depressed
when I think about
my illness
When I think about
my illness I get
upset My illness makes
me feel angry
My illness does not
worry me
Having this illness
makes me feel
anxious
My illness makes
me feel afraid
STRONGLY
DISAGREE DISAGREE
NEITHER
AGREE
OR
DISAGREE
AGREE
STRONGLY
AGREE
Page 408
15
Please turn to the next page
CAUSES OF MY ILLNESS
We are interested in what you consider may have been the cause of your illness. As people
are very different, there is no correct answer for this question. We are most interested in
your own views about the factors that caused your illness rather than what others including
doctors or family may have suggested to you. Below is a list of possible causes for your
illness. Please indicate how much you agree or disagree that they were causes for you by
ticking the appropriate box.
Stress or worry
STRONGLY
DISAGREE
DISAGREE NEITHER
AGREE
OR
DISAGREE
AGREE STRONGLY
AGREE
Hereditary - it runs
in my family
A Germ or virus
Diet or eating habits
Chance or bad luck Poor medical care
in my past
Pollution in the
environment
My own behavior My mental attitude
e.g. thinking about
life negatively
Family problems or
worries caused my
illness
Overwork My emotional state
e.g. feeling down,
lonely, anxious,
empty
Ageing
Page 409
16
Please turn to the next page
Alcohol
STRONGLY
DISAGREE DISAGREE
NEITHER
AGREE
OR
DISAGREE
AGREE
STRONGLY
AGREE
Smoking
Accident or injury
My personality Altered immunity
In the table below, please list in rank-order the three most important factors that you now
believe caused YOUR illness. You may use any of the items listed previously, or you may
have additional ideas of your own.
The most important causes for me:
1.
2.
3.
YYOOUU HHAAVVEE CCOOMMPPLLEETTEEDD TTHHEE IILLLLNNEESSSS PPEERRCCEEPPTTIIOONNSS SSEECCTTIIOONN.. PPLLEEAASSEE
GGOO TTOO TTHHEE AAGGEEIINNGG PPEERRCCEEPPTTIIOONNSS SSEECCTTIIOONN OONN PPAAGGEE 2233..
Page 410
17
Please turn to the next page
ILLNESS PERCEPTIONS B
OONNLLYY CCOOMMLLPPEETTEE TTHHIISS SSEECCTTIIOONN IIFF YYOOUU DDOO NNOOTT IIDDEENNTTIIFFYY AASS HHAAVVIINNGG AANN
IILLLLNNEESSSS.. IIFF YYOOUU DDOO HHAAVVEE AANN IILLLLNNEESSSS,, SSTTAARRTT AATT PPAAGGEE 1100..
YOUR VIEWS ABOUT HEART DISEASE
Listed below are a number of symptoms that someone suffering from heart disease may or
may not experience. Please indicate whether you believe people with heart disease
experience any of these symptoms, and whether these symptoms are related to heart disease.
Someone with heart disease may experience this symptom (select as many as apply):
Pain Sore Eyes
Sore Throat Wheeziness
Nausea Headaches
Breathlessness Upset Stomach
Weight Loss Sleep Difficulties
Fatigue Dizziness
Stiff Joints Loss of Strength
This symptom is related to heart disease (select as many as apply):
Pain Sore Eyes
Sore Throat Wheeziness
Nausea Headaches
Breathlessness Upset Stomach
Weight Loss Sleep Difficulties
Fatigue Dizziness
Stiff Joints Loss of Strength
Page 411
18
Please turn to the next page
We are interested in your own personal views of how you see heart disease. Please indicate
how much you agree or disagree with the following statements about your illness by ticking
the appropriate box.
Heart disease will
last a short time
Heart disease is
likely to be
permanent rather
than temporary
Heart disease will
last for a long time
Heart disease will
pass quickly
Someone with heart
disease is expected
to have this illness
for the rest of their
life
Heart disease is a
serious condition
Heart disease has
major consequences
on one’s life
Heart disease does
not have much
effect on one’s life
Heart disease
strongly affects the
way others see that
person
Heart disease has
serious financial
consequences
Heart disease
causes difficulties
for those who are
close to the person
with the illness
STRONGLY
DISAGREE
DISAGREE NEITHER
AGREE
OR
DISAGREE
AGREE STRONGLY
AGREE
Page 412
19
Please turn to the next page
There is a lot which
one can do to
control his/her
symptoms
What one does can
determine whether
his/her heart disease
gets better or worse
The course of the
illness depends on
the person with
heart disease
Nothing one does
will affect his/her
heart disease
One has the power
to influence his/her
heart disease The actions of the
person with heart
disease will have no
affect on the
outcome of his/her
illness
Heart disease will
improve in time
There is very little
that can be done to
improve heart
disease
Treatment will be
effective in curing
heart disease
The negative effects
of heart disease can
be prevented
(avoided) by
treatment
STRONGLY
DISAGREE
DISAGREE NEITHER
AGREE
OR
DISAGREE
AGREE STRONGLY
AGREE
Page 413
20
Please turn to the next page
Treatment can
control heart
disease
There is nothing
which can help
one’s condition
The symptoms of
heart disease are
puzzling to me
Heart disease is a
mystery to me
I don’t understand
heart disease
Heart disease
doesn’t make any
sense to me
I have a clear
picture or
understanding of
heart disease
Symptoms of heart
disease change a
great deal from day
to day
Symptoms of heart
disease come and
go in cycles
Heart disease is
very unpredictable
One goes through
cycles in which
heart disease gets
better and worse
I get depressed
when I think about
heart disease
When I think about
heart disease I get
upset
STRONGLY
DISAGREE
DISAGREE NEITHER
AGREE
OR
DISAGREE
AGREE STRONGLY
AGREE
Page 414
21
Please turn to the next page
Heart disease makes
me feel angry
Heart disease does
not worry me
Having this illness
makes one feel
anxious
Heart disease makes
one feel afraid
STRONGLY
DISAGREE
DISAGREE NEITHER
AGREE
OR
DISAGREE
AGREE STRONGLY
AGREE
CAUSES OF HEART DISEASE
We are interested in what you consider may be the cause of heart disease. As people are
very different, there is no correct answer for this question. We are most interested in your
own views about the factors that cause heart disease rather than what others including
doctors or family may have suggested to you. Below is a list of possible causes for heart
disease. Please indicate how much you agree or disagree that they were causes for you by
ticking the appropriate box.
Stress or worry
STRONGLY
DISAGREE
DISAGREE NEITHER
AGREE
OR
DISAGREE
AGREE STRONGLY
AGREE
Hereditary - it runs
in the family
A Germ or virus
Diet or eating habits
Chance or bad luck Poor medical care
in one’s past
Pollution in the
environment
Page 415
22
Please turn to the next page
One’s own behavior
STRONGLY
DISAGREE
DISAGREE NEITHER
AGREE
OR
DISAGREE
AGREE STRONGLY
AGREE
One’s mental
attitude e.g.
thinking about life
negatively
Family problems or
worries cause heart
disease
Overwork One’s emotional
state e.g. feeling
down, lonely,
anxious, empty
Ageing
Alcohol
Smoking
Accident or injury
One’s personality Altered immunity
Page 416
23
Please turn to the next page
In the table below, please list in rank-order the three most important factors that you now
believe cause heart disease. You may use any of the items listed previously, or you may
have additional ideas of your own.
The most important causes:
1.
2.
3.
YYOOUU HHAAVVEE CCOOMMPPLLEETTEEDD TTHHEE IILLLLNNEESSSS PPEERRCCEEPPTTIIOONNSS SSEECCTTIIOONN.. PPLLEEAASSEE
GGOO TTOO TTHHEE AAGGEEIINNGG PPEERRCCEEPPTTIIOONNSS SSEECCTTIIOONN OONN PPAAGGEE 2233..
Page 417
24
Please turn to the next page
PPLLEEAASSEE CCOOMMPPLLEETTEE TTHHEE RREEMMAAIINNIINNGG SSEECCTTIIOONNSS OOFF TTHHIISS BBOOOOKKLLEETT..
AGEING PERCEPTIONS
These questions assess your views and experiences of getting older. Since everyone is
getting older, these questions can be answered by anyone of any age. There are no right or
wrong answers – just your experiences and views. Even if the statement relates to
something you do not often think about in relation to yourself, please try to give an
indication of your views by answering every question.
VIEWS ABOUT AGING
We are interested in your own personal views and experiences about getting older. Please
indicate your views on the following statements.
I am conscious of
getting older all of
the time
I am always aware
of my age
I always classify
myself as old
I am always aware
of the fact that I am
getting older
I feel my age in
everything that I do
As I get older I get
wiser
As I get older I
continue to grow as
a person
As I get older I
appreciate things
more
STRONGLY
DISAGREE
DISAGREE NEITHER
AGREE
OR
DISAGREE
AGREE STRONGLY
AGREE
Page 418
25
Please turn to the next page
I get depressed
when I think about
how ageing might
affect the things
that I can do
The quality of my
social life in later
years depends on
me
The quality of my
relationships with
others in later life
depends on me
Whether I continue
living life to the full
depends on me
I get depressed
when I think about
the effect that
getting older might
have on my social
life
As I get older there
is much I can do to
maintain my
independence
Whether getting
older has positive
sides to it depends
on me
Getting older
restricts the things
that I can do
Getting older makes
me less independent
Getting older makes
everything a lot
harder for me
STRONGLY
DISAGREE
DISAGREE NEITHER
AGREE
OR
DISAGREE
AGREE STRONGLY
AGREE
Page 419
26
Please turn to the next page
As I get older I can
take part in fewer
activities
As I get older I do
not cope as well
with problems that
arise
Slowing down with
age is not
something I can
control
How mobile I am in
later life is not up to
me
I have no control
over whether I lose
vitality or zest for
life as I age I have no control
over the effects
which getting older
has on my social
life
I get depressed
when I think about
getting older
I worry about the
effects that getting
older may have on
my relationships
with others
I go through cycles
in which my
experience of
ageing gets better
and worse
My awareness of
getting older comes
and goes in cycles
STRONGLY
DISAGREE
DISAGREE NEITHER
AGREE
OR
DISAGREE
AGREE STRONGLY
AGREE
Page 420
27
Please turn to the next page
I feel angry when I
think about getting
older
I go through phases
of feeling old
My awareness of
getting older
changes a great deal
from day to day
I go through phases
of viewing myself
as being old
STRONGLY
DISAGREE
DISAGREE NEITHER
AGREE
OR
DISAGREE
AGREE STRONGLY
AGREE
EXPERIENCE OF HEALTH-RELATED CHANGES
The next list describes some health-related changes you may have experienced. Please
indicate whether you have experienced these changes in the last 10 years and whether you
believe that the changes experienced are specifically related to getting older or not.
HAVE you experienced this change? (Select as many as apply).
Weight problems Cramps
Sleep problems Bone or joint condition
Back problems or slipped disc Cardiac or heart problems
Painful joints Ear or hearing problems
Not being mobile Vision and eyesight change
Loss of balance Respiratory problems
Loss of strength Foot problems
Slowing down Depression
Anxiety
Page 421
28
Please turn to the next page
In terms of the changes you HAVE experienced: Do you think this change is ONLY related
to, or due to the fact that, you are getting older? (Select as many as apply).
Weight problems Cramps
Sleep problems Bone or joint condition
Back problems or slipped disc Cardiac or heart problems
Painful joints Ear or hearing problems
Not being mobile Vision and eyesight changes
Loss of balance Respiratory problems
Loss of strength Foot problems
Slowing down Depression
Anxiety
Page 422
29
Please turn to the next page
PERSONALITY
Below are phrases describing people's behaviours. Please indicate how accurately each
statement describes you. Describe yourself as you generally are now, not as you wish to be
in the future. Describe yourself as you honestly see yourself, in relation to other people you
know of the same sex as you are, and roughly your same age. Please read each statement
carefully before responding.
Often feel
blue
Am always
prepared
Panic easily
VERY INACCURATE
MODERATELY INACCURATE
NEITHER INNACURATE
NOR
ACCURATE
MODERATELY ACCURATE
VERY ACCURATE
Dislike
myself
Carry out my
plans
Am often
down in the
dumps
Do just
enough work
to get by
Waste my
time
Feel
comfortable
with myself
Find it
difficult to
get down to
work
Seldom feel
blue
Shirk my
duties
Page 423
30
Please turn to the next page
Have
frequent
mood swings
Don’t see
things
through
Rarely get
irritated
Get chores
done right
away
Am not
easily
bothered by
things
Make plans
and stick to
them
Am very
pleased with
myself
Pay attention
to details
VERY
INACCURATE
MODERATELY
INACCURATE
NEITHER
INNACURATE NOR
ACCURATE
MODERATELY
ACCURATE
VERY
ACCURATE
Page 424
31
Please turn to the next page
LIFE ORIENTATION
Please be as honest and accurate as you can throughout. Try not to let your response to one
statement influence your responses to other statements. There are no "correct" or
"incorrect" answers. Answer according to your own feelings, rather than how you think
"most people" would answer.
In uncertain times, I
usually expect the best
It's easy for me to relax
I
DISAGREE
A LOT
I
DISAGREE
A LITTLE
I NEITHER
AGREE
NOR
DISAGREE
I
AGREE
A
LITTLE
I
AGREE
A LOT
If something can go
wrong for me, it will
I'm always optimistic
about my future
I enjoy my friends a lot
It's important for me to
keep busy
I hardly ever expect
things to go my way
I don't get upset too
easily
I rarely count on good
things happening to me
Overall, I expect more
good things to happen
to me than bad
Page 425
32
Please turn to the next page
COPING ABILITIES
This questionnaire deals with ways people respond when they confront difficult or stressful
events in their life. There are lots of ways to try to deal with stress. This questionnaire asks
you to indicate what you generally do and feel when you experience stressful events.
Obviously, different events bring out somewhat different responses, but think about what
you usually do when you are under a lot of stress.
Try to rate each item separately in your mind from the others. Choose your answers
thoughtfully, and make your answers as true FOR YOU as you can. Please answer every
item. There are no "right" or "wrong" answers, so choose the most accurate answer for
YOU - not what you think "most people" would say or do. Indicate what YOU usually do
when YOU experience a stressful event.
I turn to work or other activities to
take my mind off things
I concentrate my efforts on doing
something about the situation I'm in
I say to myself "this isn't real."
I
USUALLY
DON’T DO
THIS AT
ALL
I
USUALLY
DO THIS
A LITTLE
BIT
I
USUALLY
DO THIS A
MEDIUM
AMOUNT
I
USUALLY
DO THIS
A LOT
I use alcohol or other drugs to make
myself feel better
I get emotional support from others
I give up trying to deal with it
I take action to try to make the
situation better
I refuse to believe that it has
happened
I say things to let my unpleasant
feelings escape
I get help and advice from other
people
I use alcohol or other drugs to help
me get through it
I try to see it in a different light, to make it seem more positive
Page 426
33
Please turn to the next page
I criticize myself
I
USUALLY
DON’T DO
THIS AT
ALL
I
USUALLY
DO THIS
A LITTLE
BIT
I
USUALLY
DO THIS A
MEDIUM
AMOUNT
I
USUALLY
DO THIS
A LOT
I try to come up with a strategy
about what to do
I get comfort and understanding
from someone
I give up the attempt to cope I look for something good in what is
happening
I make jokes about it I do something to think about it less,
such as going to movies,
watching TV, reading,
daydreaming, sleeping, or shopping
I accept the reality of the fact that it
has happened
I express my negative feelings I try to find comfort in my religion
or spiritual beliefs
I try to get advice or help from other
people about what to do
I learn to live with it
I think hard about what steps to take I blame myself for things that
happened
I pray or meditate I make fun of the situation
Page 427
34
Please turn to the next page
SOCIAL SUPPORT
These questions assess your level of social support satisfaction. Please give an indication of
whether these questions are true for you or not.
Do you feel you have a definite role
(place) in your family and among your
friends?
Does it seem that your family and
friends (i.e. people who are important to
you) understand you?
Do you feel useful to your family and
friends (i.e. people who are important to
you)?
When you are talking with your family
and friends, do you feel you are being
listened to?
Do you know what is going on with your
family and friends?
Can you talk about your deepest
problems with at least some of your
family and friends?
HARDLY
EVER
SOME OF
THE TIME
MOST OF
THE TIME
How satisfied are you with the kinds of relationships you have with your family and
friends?
Very dissatisfied Somewhat dissatisfied Satisfied
These questions assess your level of social interaction. Please give an indication of whether
these questions are true for you or not.
Other than members of your family, how many persons in your local area do you feel you
can depend on or feel very close to?
None 1-2 people More than 2 people
Page 428
35
Please turn to the next page
How many times during the past week did you spend time with someone who does not
live with you, that is, you went to see them or they came to visit you or you went out
together?
NONE ONCE TWICE THREE
TIMES
FOUR
TIMES
FIVE
TIMES
SIX
TIMES
SEVEN
OR
MORE
TIMES
How many times did you talk to someone, (friends, relatives or others) on the
telephone in the past week (either they called you or you called them)?
NONE ONCE TWICE THREE
TIMES
FOUR
TIMES
FIVE
TIMES
SIX
TIMES
SEVEN
OR
MORE
TIMES
About how often did you go to meetings of clubs, religious meetings or other groups
that you belong to in the past week?
NONE ONCE TWICE THREE
TIMES
FOUR
TIMES
FIVE
TIMES
SIX
TIMES
SEVEN
OR
MORE
TIMES
Page 429
36
Please turn to the next page
WELLBEING
This questionnaire consists of a number of words that describe different feelings and
emotions. Read each statement and then mark the appropriate answer. Indicate to what
extent you have felt this way in general, that is, how you feel on average.
Interested
VERY
SLIGHTLY
OR NOT
AT ALL
A
LITTLE
MODERATELY QUITE
A BIT
EXTREMELY
Irritable
Distressed
Alert
Excited
Ashamed
Upset
Inspired
Strong
Nervous
Guilty
Determined
Scared
Attentive
Hostile
Page 430
37
Please turn to the next page
Jittery
VERY
SLIGHTLY
OR NOT
AT ALL
A
LITTLE
MODERATELY QUITE
A BIT
EXTREMELY
Enthusiastic
Active
Proud Afraid
Page 431
38
Please turn to the next page
LIFE SATISFACTION
Below are five statements that you may agree or disagree with. Please indicate your
agreement with each item by marking the appropriate field. Please be open and honest in
your responding.
1 = STRONGLY DISAGREE
2 = DISAGREE
3 = SLIGHLTY DISAGREE
4 = NEITHER AGREE NOR DISAGREE
5 = SLIGHTLY AGREE
6 = AGREE
7 = STRONGLY AGREE
1 2 3 4 5 6 7
In most ways my
life is close to ideal The conditions of
my life are
excellent I am satisfied with
my life So far I have gotten
the important
things I want in life If I could live my
life over, I would
change almost
nothing
Page 432
39
Please turn to the next page
QUALITY OF LIFE
Please read each of the following statements carefully. Indicate by marking the appropriate
field how much the statement applies to you. There are no right and wrong answers. Do not
spend too much time on any statement.
My age prevents me from doing
the things I would like to do
I feel that what happens to me is
out of my control
I feel left out of things
NEVER SOMETIMES NOT
OFTEN
OFTEN
I can do the things I want to do
I feel that I can please myself what
I do
Shortage of money stops me from
doing things I want to do
I look forward to each day
I feel that my life has meaning
I enjoy the things that I do
I feel full of energy these days
I feel that life is full of
opportunities
I feel that the future looks good for
me
Page 433
40
Please turn to the next page
MOOD
Please read each of the following statements carefully. Indicate by marking the appropriate
field how much the statement applied to you over the past week. There are no right and
wrong answers. Do not spend too much time on any statement.
I found it hard to wind down
DID NOT
APPLY TO
ME AT
ALL
APPLIED
TO ME TO
SOME
DEGREE,
OR SOME
OF THE
TIME
APPLIED TO ME
A
CONSIDERABLE
DEGREE, OR A
GOOD PART OF
THE TIME
APPLIED
TO ME
VERY
MUCH,
OR MOST
OF THE
TIME
I was aware of dryness of my
mouth
I couldn't seem to experience
any positive feeling at all
I experienced breathing
difficulty (e.g. excessively rapid
breathing, breathlessness in the
absence of physical exertion)
I found it difficult to work up
the initiative to do things
I tended to over-react to
situations
I experienced trembling (e.g. in the hands)
I felt that I was using a lot of
nervous energy
I was worried about situations
in which I might panic and
make a fool of myself
I felt that I had nothing to look
forward to
I found myself getting agitated
I found it difficult to relax
I felt down-hearted and blue
Page 434
41
Please turn to the next page
I was intolerant of anything that
kept me from getting on with
what I was doing
I felt I was close to panic
DID NOT
APPLY TO
ME AT
ALL
APPLIED
TO ME TO
SOME
DEGREE,
OR SOME
OF THE
TIME
APPLIED TO ME
A
CONSIDERABLE
DEGREE, OR A
GOOD PART OF
THE TIME
APPLIED
TO ME
VERY
MUCH,
OR MOST
OF THE
TIME
I was unable to become
enthusiastic about anything
I felt I wasn't worth much as a
person
I felt that I was rather touchy I was aware of the action of my
heart in the absence of physical
exertion (e.g. sense of heart rate
increase, heart missing a beat)
I felt scared without any good
reason
I felt that life was meaningless
Page 435
If you indicated (on the first survey booklet) that you would like to be contacted
with the final group results for this study, you will receive information
regarding the findings in the near future.
By completing this second survey, you have now gone into the draw to win one
of five Coles-Myer vouchers valued at $100.
You have completed the survey – thank you for your time.
Please tear off the front page of this booklet (with your contact details and the
invitation to participate) and retain for your own records, along with the Participant
Information Sheet enclosed.
Please return the completed survey (including this page) in the reply paid
envelope provided to:
Louise Turner School of
Psychology University of
Wollongong
Page 438
414
Appendix E: Model summary information for mediation models (Time 1)
Page 439
415
M1 (PCEC)
M2 (DC)
M3 (SSS)
Y (Life satisfaction)
Antecedent
B
SE
p
B
SE
p
B
SE
p
B
SE
p
X (TCR) 0.371 0.353 .295 0.577 0.289 .047 -0.127 0.222 .567 -0.356 0.395 .368
M1 (PCEC) -0.050 0.066 .447
M2 (DC) 0.184 0.077 .018
M3 (SSS) 0.626 0.102 <.001
C1 Gender 0.996 0.529 .061 0.451 0.433 .298 0.511 0.333 .126 -1.737 0.592 .004
C2 Age -0.096 0.031 .003 -0.023 0.026 .380 -0.038 0.020 .053 0.086 0.035 .016
C3 Partner Status -0.138 0.142 .332 -0.033 0.116 .774 -0.203 0.089 .023 -0.393 0.158 .014
C4 Education 0.521 0.170 .002 0.145 0.139 .295 0.010 0.107 .925 0.129 0.191 .502
C5 Income -0.064 0.210 .760 0.078 0.171 .648 -0.164 0.132 .213 0.156 0.233 .503
C6 SRH -0.237 0.308 .443 0.287 0.252 .254 -0.040 0.194 .838 -0.668 0.343 .052
C7 Med Conds. 0.632 0.257 .014 -0.124 0.210 .555 0.011 0.162 .944 -0.366 0.289 .206
C8 Optimism 0.256 0.065 <.001 -0.096 0.053 .071 0.132 0.041 .001 0.324 0.075 <.001
C9 Neuroticism -0.035 0.043 .420 0.110 0.036 .002 -0.096 0.027 .001 -0.197 0.050 <.001
C10 Conscientious. 0.167 0.044 <.001 -0.049 0.036 .174 0.003 0.028 .918 -0.015 0.050 .769
Constant 12.855 4.087 .002 15.855 3.341 <.001 20.713 2.573 <.001 10.404 5.096 .042
R2 = 0.259
F(11,328) = 10.431, p = <.001
R2 = 0.206
F(11,328) = 7.721, p = <.001
R2 = 0.217
F(11,328) = 8.245, p = <.001
R2 = 0.487
F(14,325) = 22.055, p = <.001 Note. TCR = timeline-chronic; PCEC = primary control engagement coping; DC = disengagement coping; SSS = satisfaction with social support.
Page 440
416
M1 (PCEC)
M2 (DC)
M3 (SSS)
Y (Life satisfaction)
Antecedent
B
SE
p
B
SE
p
B
SE
p
B
SE
p
X (NCSQ) 0.214 0.373 .568 0.008 0.307 .979 -0.677 0.232 .004 -0.319 0.421 .449
M1 (PCEC) -0.049 0.066 .461
M2 (DC) 0.176 0.077 .022
M3 (SSS) 0.617 0.103 <.001
C1 Gender 0.945 0.527 .074 0.334 0.433 .441 0.457 0.327 .163 -1.695 0.588 .004
C2 Age -0.095 0.032 .003 -0.016 0.026 .546 -0.027 0.020 .169 0.087 0.036 .015
C3 Partner Status -0.120 0.141 .395 -0.005 0.116 .968 -0.208 0.087 .018 -0.412 0.157 .009
C4 Education 0.528 0.170 .002 0.171 0.140 .222 0.032 0.105 .760 0.127 0.191 .508
C5 Income -0.034 0.208 .870 0.123 0.171 .474 -0.180 0.129 .165 0.126 0.232 .588
C6 SRH -0.258 0.318 .417 0.325 0.261 .214 0.100 0.197 .613 -0.621 0.354 .081
C7 Med Conds. 0.652 0.257 .012 -0.103 0.211 .627 -0.013 0.160 .934 -0.390 0.289 .178
C8 Optimism 0.249 0.064 <.001 -0.114 0.053 .032 0.120 0.040 .003 0.327 0.074 <.001
C9 Neuroticism -0.031 0.043 .479 0.120 0.035 .001 -0.091 0.027 .001 -0.200 0.050 <.001
C10 Conscientious. 0.164 0.044 <.001 -0.058 0.036 .107 -0.006 0.027 .817 -0.015 0.050 .771
Constant 13.268 4.084 .001 17.185 3.355 <.001 21.850 2.537 <.001 10.556 5.170 .042
R2 = 0.257
F(11,328) = 10.336, p = <.001
R2 = 0.196
F(11,328) = 7.270, p = <.001
R2 = 0.236
F(11,328) = 9.194, p = <.001
R2 = 0.487
F(14,325) = 22.022, p = <.001 Note. NCSQ = consequences-negative; PCEC = primary control engagement coping; DC = disengagement coping; SSS = satisfaction with social support.
Page 441
417
M1 (PCEC)
M2 (DC)
M3 (SSS)
Y (Life satisfaction)
Antecedent
B
SE
p
B
SE
p
B
SE
p
B
SE
p
X (PCON) 1.762 0.499 .001 0.920 0.414 .027 0.587 0.318 .066 1.598 0.571 .005
M1 (PCEC) -0.080 0.065 .224
M2 (DC) 0.159 0.076 .038
M3 (SSS) 0.615 0.101 <.001
C1 Gender 0.768 0.517 .139 0.253 0.430 .556 0.486 0.330 .141 -1.760 0.581 .003
C2 Age -0.083 0.031 .007 -0.012 0.025 .653 -0.037 0.020 .058 0.086 0.035 .014
C3 Partner Status -0.148 0.138 .287 -0.020 0.115 .865 -0.219 0.088 .014 -0.443 0.156 .005
C4 Education 0.442 0.168 .009 0.121 0.140 .385 -0.027 0.107 .800 0.047 0.190 .804
C5 Income -0.049 0.204 .810 0.116 0.170 .497 -0.179 0.130 .171 0.117 0.229 .610
C6 SRH 0.015 0.308 .961 0.445 0.256 .083 0.027 0.197 .891 -0.486 0.346 .161
C7 Med Conds. 0.589 0.253 .021 -0.133 0.210 .527 -0.012 0.161 .939 -0.414 0.286 .148
C8 Optimism 0.209 0.063 .001 -0.133 0.053 .012 0.124 0.040 .002 0.309 0.074 <.001
C9 Neuroticism -0.017 0.042 .693 0.127 0.035 <.001 -0.094 0.027 .001 -0.192 0.049 <.001
C10 Conscientious. 0.147 0.043 .001 -0.065 0.036 .067 0.001 0.027 .984 -0.017 0.049 .724
Constant 7.222 4.344 .097 13.809 3.607 <.001 18.252 2.769 <.001 4.753 5.270 .368
R2 = 0.284
F(11,328) = 11.821, p = <.001
R2 = 0.208
F(11,328) = 7.827, p = <.001
R2 = 0.224
F(11,328) = 8.601, p = <.001
R2 = 0.490
F(14,325) = 23.031, p = <.001 Note. PCON = control-positive; PCEC = primary control engagement coping; DC = disengagement coping; SSS = satisfaction with social support.
Page 442
418
M1 (PCEC)
M2 (DC)
M3 (SSS)
Y (Life satisfaction)
Antecedent
B
SE
p
B
SE
p
B
SE
p
B
SE
p
X (NCON) 0.300 0.378 .429 -0.629 0.309 .043 0.539 0.236 .023 0.120 0.427 .779
M1 (PCEC) -0.053 0.066 .417
M2 (DC) 0.180 0.077 .021
M3 (SSS) 0.627 0.102 <.001
C1 Gender 0.885 0.527 .094 0.407 0.430 .345 0.474 0.329 .150 -1.674 0.588 .005
C2 Age -0.087 0.032 .006 -0.025 0.026 .338 -0.032 0.020 .105 0.083 0.036 .020
C3 Partner Status -0.114 0.141 .417 -0.015 0.115 .895 -0.200 0.088 .023 -0.409 0.157 .010
C4 Education 0.519 0.171 .003 0.210 0.139 .133 -0.029 0.107 .788 0.108 0.193 .575
C5 Income -0.034 0.208 .870 0.119 0.170 .485 -0.171 0.130 .189 0.130 0.232 .574
C6 SRH -0.167 0.312 .592 0.235 0.255 .358 0.030 0.195 .876 -0.675 0.347 .053
C7 Med Conds. 0.642 0.257 .013 -0.095 0.210 .650 0.000 0.161 .999 -0.379 0.289 .190
C8 Optimism 0.235 0.065 <.001 -0.095 0.053 .075 0.119 0.041 .004 0.332 0.075 <.001
C9 Neuroticism -0.030 0.043 .491 0.123 0.035 .001 -0.101 0.027 <.001 -0.203 0.050 <.001
C10 Conscientious. 0.157 0.044 <.001 -0.052 0.036 .149 -0.001 0.027 .970 -0.010 0.050 .844
Constant 12.762 4.184 .003 19.214 3.417 <.001 18.692 2.613 <.001 9.289 5.185 .074
R2 = 0.258
F(11,328) = 10.373, p = <.001
R2 = 0.206
F(11,328) = 7.739, p = <.001
R2 = 0.228
F(11,328) = 8.810, p = <.001
R2 = 0.486
F(14,325) = 21.953, p = <.001 Note. NCON = control-negative; PCEC = primary control engagement coping; DC = disengagement coping; SSS = satisfaction with social support.
Page 443
419
M1 (PCEC)
M2 (DC)
M3 (SSS)
Y (Life satisfaction)
Antecedent
B
SE
p
B
SE
p
B
SE
p
B
SE
p
X (ER) -0.690 0.413 <.001 0.261 0.340 .443 -0.571 0.259 .028 -0.439 0.465 .346
M1 (PCEC) -0.057 0.066 .385
M2 (DC) 0.181 0.077 .019
M3 (SSS) 0.621 0.102 <.001
C1 Gender -0.961 0.524 .067 0.317 0.431 .462 0.571 0.328 .083 -1.627 0.587 .006
C2 Age -0.093 0.031 .003 -0.015 0.026 .557 -0.041 0.019 .035 0.080 0.035 .024
C3 Partner Status -0.094 0.141 .506 -0.014 0.116 .902 -0.189 0.088 .034 -0.397 0.158 .012
C4 Education 0.542 0.168 .001 0.169 0.139 .224 0.009 0.106 .934 0.120 0.191 .528
C5 Income -0.008 0.208 .968 0.112 0.171 .514 -0.151 0.130 .246 0.146 0.232 .530
C6 SRH -0.114 0.312 .715 0.290 0.257 .260 0.032 0.195 .869 -0.632 0.348 .070
C7 Med Conds. 0.600 0.258 .020 -0.086 0.212 .687 -0.032 0.162 .847 -0.404 0.290 .164
C8 Optimism 0.223 0.065 .001 -0.106 0.053 .047 0.118 0.041 .004 0.324 0.075 <.001
C9 Neuroticism 0.002 0.046 .974 0.109 0.038 .005 -0.074 0.029 .012 -0.185 0.053 .001
C10 Conscientious. 0.158 0.043 <.001 -0.058 0.036 .108 0.003 0.027 .915 -0.009 0.050 .852
Constant 14.906 4.055 <.001 16.754 3.340 <.001 21.396 2.542 <.001 10.572 5.120 .040
R2 = 0.263
F(11,328) = 10.638, p = <.001
R2 = 0.198
F(11,328) = 7.337, p = <.001
R2 = 0.227
F(11,328) = 8.770, p = <.001
R2 = 0.487
F(14,325) = 22.066, p = <.001 Note. ER = emotional representations; PCEC = primary control engagement coping; DC = disengagement coping; SSS = satisfaction with social support.
Page 444
420
M1 (PCEC)
M2 (DC)
M3 (SSS)
Y (Positive affect)
Antecedent
B
SE
p
B
SE
p
B
SE
p
B
SE
p
X (TCR) 0.367 0.353 .302 0.576 0.288 .046 -0.125 0.222 .573 -0.073 0.045 .104
M1 (PCEC) 0.027 0.007 <.001
M2 (DC) 0.017 0.009 .054
M3 (SSS) 0.058 0.012 <.001
C1 Gender 1.040 0.528 .050 0.458 0.431 .289 0.488 0.332 .143 -0.113 0.067 .093
C2 Age -0.096 0.031 .002 -0.023 0.026 .378 -0.038 0.020 .054 -0.009 0.004 .026
C3 Partner Status -0.130 0.141 .359 -0.032 0.115 .781 -0.207 0.089 .021 -0.012 0.018 .511
C4 Education 0.526 0.170 .002 0.146 0.138 .291 0.007 0.107 .947 0.014 0.022 .534
C5 Income -0.053 0.209 .799 0.080 0.171 .640 -0.170 0.132 .198 -0.038 0.026 .150
C6 SRH -0.203 0.306 .508 0.292 0.250 .244 -0.057 0.193 .769 -0.073 0.039 .061
C7 Med Conds. 0.640 0.257 .013 -0.123 0.210 .557 0.008 0.162 .963 -0.013 0.033 .703
C8 Optimism 0.255 0.065 <.001 -0.096 0.053 .070 0.132 0.041 .001 0.017 0.009 .048
C9 Neuroticism -0.037 0.043 .389 0.110 0.035 .002 -0.095 0.027 .001 -0.007 0.006 .245
C10 Conscientious. 0.170 0.044 <.001 -0.048 0.036 .176 0.001 0.028 .964 0.027 0.006 <.001
Constant 12.577 4.080 .002 15.814 3.330 <.001 20.856 2.568 <.001 1.675 0.577 .004
R2 = 0.263
F(11,329) = 10.658, p = <.001
R2 = 0.206
F(11,329) = 7.741, p = . <.001
R2 = 0.215
F(11,329) = 8.204, p = <.001
R2 = 0.471
F(14,326) = 20.719, p = <.001 Note. TCR = timeline-chronic; PCEC = primary control engagement coping; DC = disengagement coping; SSS = satisfaction with social support.
Page 445
421
M1 (PCEC)
M2 (DC)
M3 (SSS)
Y (Positive affect)
Antecedent
B
SE
p
B
SE
p
B
SE
p
B
SE
p
X (PCSQ) 0.957 0.419 .023 -0.488 0.345 .159 0.491 0.264 .064 0.263 0.052 <.001
M1 (PCEC) 0.022 0.007 .002
M2 (DC) 0.020 0.008 .019
M3 (SSS) 0.055 0.011 <.001
C1 Gender 0.885 0.521 .090 0.379 0.429 .377 0.474 0.328 .150 -0.061 0.069 .378
C2 Age -0.076 0.032 .017 -0.024 0.026 .364 -0.032 0.020 .114 -0.010 0.004 .018
C3 Partner Status -0.106 0.140 .449 -0.007 0.115 .953 -0.210 0.088 .017 -0.029 0.018 .117
C4 Education 0.509 0.168 .003 0.189 0.139 .174 -0.016 0.106 .883 0.017 0.022 .434
C5 Income -0.014 0.206 .946 0.118 0.170 .488 -0.174 0.130 .182 -0.049 0.027 .072
C6 SRH -0.142 0.304 .642 0.312 0.250 .213 -0.046 0.192 .809 -0.069 0.040 .086
C7 Med Conds. 0.578 0.257 .025 -0.064 0.212 .765 -0.036 0.162 .825 -0.023 0.034 .503
C8 Optimism 0.246 0.063 <.001 -0.116 0.052 .027 0.138 0.040 .001 0.033 0.008 <.001
C9 Neuroticism -0.010 0.044 .811 0.110 0.036 .002 -0.087 0.027 .002 -0.006 0.006 .299
C10 Conscientious. 0.160 0.043 <.001 -0.056 0.036 .114 0.002 0.027 .957 0.031 0.006 <.001
Constant 8.665 4.488 .054 19.595 3.696 <.001 18.116 2.828 <.001 0.268 0.604 .658
R2 = 0.272
F(11,329) = 11.165, p = <.001
R2 = 0.201
F(11,329) = 7.514, p = . <.001
R2 = 0.223
F(11,329) = 8.566, p = <.001
R2 = 0.505
F(14,326) = 23.756, p = <.001 Note. PCSQ = consequences-positive; PCEC = primary control engagement coping; DC = disengagement coping; SSS = satisfaction with social support.
Page 446
422
M1 (PCEC)
M2 (DC)
M3 (SSS)
Y (Positive affect)
Antecedent
B
SE
p
B
SE
p
B
SE
p
B
SE
p
X (NCSQ) 0.217 0.373 .562 0.008 0.306 .978 -0.678 0.232 .004 -0.121 0.047 .011
M1 (PCEC) 0.028 0.007 .002
M2 (DC) 0.015 0.009 .080
M3 (SSS) 0.054 0.012 <.001
C1 Gender 0.990 0.525 .060 0.340 0.431 .431 0.435 0.326 .184 -0.110 0.066 .097
C2 Age -0.096 0.032 .003 -0.016 0.026 .544 -0.027 0.020 .172 -0.008 0.066 .097
C3 Partner Status -0.112 0.141 .424 -0.004 0.115 .974 -0.212 0.087 .016 -0.016 0.018 .368
C4 Education 0.534 0.170 .002 0.171 0.139 .219 0.030 0.105 .779 0.015 0.022 .486
C5 Income -0.024 0.208 .910 0.124 0.170 .468 -0.185 0.129 .152 -0.045 0.026 .084
C6 SRH -0.226 0.317 .476 0.329 0.260 .206 0.084 0.197 .670 -0.051 0.040 .549
C7 Med Conds. 0.660 0.257 .011 -0.102 0.211 .630 -0.017 0.160 .915 -0.020 0.033 .549
C8 Optimism 0.248 0.064 <.001 -0.114 0.053 .031 0.120 0.040 .003 0.016 0.008 .051
C9 Neuroticism -0.033 0.043 .444 0.120 0.035 .001 -0.089 0.027 .001 -0.007 0.006 .226
C10 Conscientious. 0.167 0.044 <.001 -0.058 0.036 .108 -0.008 0.027 .771 0.026 0.006 <.001
Constant 12.977 4.077 .002 17.147 3.343 <.001 21.996 2.531 <.001 1.865 0.582 .002
R2 = 0.261
F(11,329) = 10.567, p = <.001
R2 = 0.196
F(11,329) = 7.289, p = . <.001
R2 = 0.234
F(11,329) = 9.158, p = <.001
R2 = 0.477
F(14,326) = 21.233, p = <.001 Note. NCSQ = consequences-negative; PCEC = primary control engagement coping; DC = disengagement coping; SSS = satisfaction with social support
Page 447
423
M1 (PCEC)
M2 (DC)
M3 (SSS)
Y (Positive affect)
Antecedent
B
SE
p
B
SE
p
B
SE
p
B
SE
p
X (PCON) 1.765 0.499 .001 0.920 0.414 .027 0.585 0.318 .067 0.228 0.064 .001
M1 (PCEC) 0.023 0.007 .002
M2 (DC) 0.013 0.009 .134
M3 (SSS) 0.057 0.011 <.001
C1 Gender 0.811 0.516 .117 0.259 0.428 .545 0.463 0.329 .160 -0.111 0.065 .090
C2 Age -0.811 0.031 .007 -0.012 0.025 .651 -0.037 0.020 .059 -0.009 0.004 .018
C3 Partner Status -0.140 0.138 .311 -0.019 0.115 .871 -0.223 0.088 .012 -0.020 0.018 .259
C4 Education 0.448 0.168 .008 0.122 0.139 .382 -0.030 0.107 .780 0.001 0.021 .960
C5 Income -0.039 0.204 .849 0.117 0.169 .491 -0.184 0.130 .158 -0.045 0.026 .081
C6 SRH 0.048 0.307 .877 0.449 0.255 .079 0.010 0.196 .960 -0.048 0.039 .218
C7 Med Conds. 0.596 0.253 .019 -0.132 0.210 .529 -0.016 0.161 .920 -0.020 0.032 .533
C8 Optimism 0.208 0.063 .001 -0.133 0.053 .012 0.125 0.040 .002 0.016 0.008 .063
C9 Neuroticism -0.019 0.042 .652 0.126 0.035 <.001 -0.093 0.027 .001 -0.006 0.006 .262
C10 Conscientious. 0.150 0.043 .001 -0.065 0.035 .067 -0.001 0.027 .968 0.027 0.006 <.001
Constant 6.932 4.338 .111 13.773 3.595 <.001 18.405 2.763 <.001 0.820 0.595 .169
R2 = 0.287
F(11,329) = 12.061, p = <.001
R2 = 0.208
F(11,329) = 7.848, p = . <.001
R2 = 0.223
F(11,329) = 8.559, p = <.001
R2 = 0.486
F(14,326) = 22.039, p = <.001 Note. PCON = control-positive; PCEC = primary control engagement coping; DC = disengagement coping; SSS = satisfaction with social support.
Page 448
424
M1 (PCEC)
M2 (DC)
M3 (SSS)
Y (Positive affect)
Antecedent
B
SE
p
B
SE
p
B
SE
p
B
SE
p
X (NCON) 0.278 0.378 .463 -0.630 0.308 .042 0.549 0.236 .021 0.096 0.048 .046
M1 (PCEC) 0.026 0.007 <.001
M2 (DC) 0.018 0.009 .045
M3 (SSS) 0.056 0.012 <.001
C1 Gender 0.934 0.525 .076 0.409 0.428 .340 0.453 0.328 .168 -0.107 0.066 .109
C2 Age -0.088 0.032 .006 -0.025 0.026 .337 -0.032 0.020 .108 -0.009 0.004 .033
C3 Partner Status -0.107 0.141 .447 -0.015 0.115 .898 -0.204 0.088 .021 -0.014 0.018 .425
C4 Education 0.526 0.171 .002 0.210 0.139 .132 -0.032 0.106 .765 0.005 0.022 .823
C5 Income -0.023 0.208 .911 0.119 0.170 .482 -0.176 0.130 .176 -0.043 0.026 .098
C6 SRH -0.137 0.311 .660 0.236 0.253 .352 0.017 0.194 .930 -0.064 0.039 .104
C7 Med Conds. 0.650 0.257 .112 -0.095 0.210 .651 -0.003 0.160 .984 -0.016 0.033 .635
C8 Optimism 0.234 0.065 <.001 -0.095 0.053 .075 0.119 0.040 .004 0.017 0.008 .048
C9 Neuroticism -0.032 0.043 .457 0.123 0.035 .001 -0.100 0.027 <.001 -0.009 0.006 .122
C10 Conscientious. 0.161 0.044 <.001 -0.051 0.036 .149 -0.003 0.028 .926 0.028 0.006 <.001
Constant 12.538 4.181 .003 19.201 3.408 <.001 18.789 2.609 <.001 1.232 0.586 .036
R2 = 0.262
F(11,329) = 10.592, p = <.001
R2 = 0.206
F(11,329) = 7.762, p = . <.001
R2 = 0.227
F(11,329) = 8.794, p = <.001
R2 = 0.473
F(14,326) = 20.899, p = <.001 Note. NCON = control-negative; PCEC = primary control engagement coping; DC = disengagement coping; SSS = satisfaction with social support.
Page 449
425
M1 (PCEC)
M2 (DC)
M3 (SSS)
Y (Positive affect)
Antecedent
B
SE
p
B
SE
p
B
SE
p
B
SE
p
X (ER) -0.721 0.412 .081 0.255 0.339 .452 -0.550 0.258 .034 -0.137 0.052 .009
M1 (PCEC) 0.025 0.007 .001
M2 (DC) 0.017 0.009 .052
M3 (SSS) 0.056 0.011 <.001
C1 Gender 1.002 0.522 .056 0.326 0.429 .449 0.543 0.327 .098 -0.088 0.066 .186
C2 Age -0.093 0.031 .003 -0.015 0.026 .554 -0.041 0.019 .036 -0.010 0.004 .009
C3 Partner Status -0.086 0.141 .540 -0.013 0.116 .912 -0.194 0.088 .029 -0.011 0.018 .529
C4 Education 0.547 0.168 .001 0.170 0.139 .221 0.005 0.106 .960 0.012 0.022 .567
C5 Income 0.002 0.208 .992 0.114 0.171 .505 -0.159 0.130 .224 -0.039 0.026 .138
C6 SRH -0.081 0.310 .795 0.296 0.255 .246 0.009 0.194 .961 -0.060 0.039 .126
C7 Med Conds. 0.605 0.258 .019 -0.085 0.212 .689 -0.034 0.162 .832 -0.023 0.033 .480
C8 Optimism 0.221 0.065 .001 -0.107 0.053 .046 0.119 0.041 .004 0.016 0.008 .063
C9 Neuroticism 0.001 0.046 .988 0.109 0.038 .005 -0.073 0.029 .013 -0.002 0.006 .708
C10 Conscientious. 0.161 0.043 <.001 -0.057 0.036 .110 0.001 0.027 .968 0.028 0.006 <.001
Constant 14.707 4.094 <.001 16.714 3.331
<.001 21.532 2.539 <.001 1.812 0.577 .002
R2 = 0.267
F(11,329) = 10.901, p = <.001
R2 = 0.197
F(11,329) = 7.353, p = . <.001
R2 = 0.225
F(11,329) = 8.692, p = <.001
R2 = 0.478
F(14,326) = 21.278, p = <.001 Note. ER = emotional representations; PCEC = primary control engagement coping; DC = disengagement coping; SSS = satisfaction with social support.
Page 450
426
M1 (PCEC)
M2 (DC)
M3 (SSS)
Y (Quality of life)
Antecedent
B
SE
p
B
SE
p
B
SE
p
B
SE
p
X (NCSQ) 0.217 0.373 .581 0.008 0.306 .978 -0.678 0.232 .004 -1.373 0.379 <.001
M1 (PCEC) 0.059 0.059 .314
M2 (DC) 0.019 0.069 .782
M3 (SSS) 0.394 0.093 <.001
C1 Gender 0.990 0.525 .060 0.340 0.431 .431 0.435 0.326 .184 -1.262 0.528 .017
C2 Age -0.096 0.032 .003 -0.016 0.026 .544 -0.027 0.020 .172 -0.014 0.032 .672
C3 Partner Status -0.112 0.141 .424 -0.004 0.115 .974 -0.212 0.087 .016 -0.118 0.141 .406
C4 Education 0.534 0.170 .002 0.171 0.139 .219 0.030 0.105 .779 0.204 0.172 .237
C5 Income -0.024 0.208 .910 0.124 0.170 .468 -0.185 0.129 .152 -0.182 0.208 .384
C6 SRH -0.226 0.317 .476 0.329 0.260 .206 0.084 0.197 .670 -1.221 0.317 <.001
C7 Med Conds. 0.660 0.257 .011 -0.102 0.211 .630 -0.017 0.160 .915 0.018 0.260 .944
C8 Optimism 0.248 0.064 <.001 -0.114 0.053 .031 0.120 0.040 .003 0.380 0.067 <.001
C9 Neuroticism -0.033 0.043 .444 0.120 0.035 .001 -0.089 0.027 .001 -0.103 0.045 .022
C10 Conscientious. 0.167 0.044 <.001 -0.058 0.036 .108 -0.008 0.027 .770 0.133 0.045 .004
Constant 12.977 4.077 .002 17.147 3.343 <.001 21.996 2.531 <.001 28.226 4.648 <.001
R2 = 0.261
F(11,329) = 10.567, p = <.001
R2 = 0.196
F(11,329) = 7.289, p = <.001
R2 = 0.234
F(11,329) = 9.158, p = <.001
R2 = 0.595
F(14,326) = 34.159, p = <.001 Note. NCSQ = consequences-negative; PCEC = primary control engagement coping; DC = disengagement coping; SSS = satisfaction with social support.
Page 451
427
M1 (PCEC)
M2 (DC)
M3 (SSS)
Y (Quality of life)
Antecedent
B
SE
p
B
SE
p
B
SE
p
B
SE
p
X (NCON) 0.278 0.378 .463 -0.630 0.308 .041 0.549 0.236 .020 0.830 0.388 .033
M1 (PCEC) 0.038 0.060 .525
M2 (DC) 0.041 0.070 .562
M3 (SSS) 0.429 0.093 <.001
C1 Gender 0.934 0.525 .076 0.409 0.428 .340 0.453 0.328 .168 -1.199 0.534 .026
C2 Age -0.088 0.032 .006 -0.025 0.026 .337 -0.032 0.020 .108 -0.027 0.032 .398
C3 Partner Status -0.107 0.141 .447 -0.015 0.115 .898 -0.204 0.088 .021 -0.101 0.143 .482
C4 Education 0.526 0.171 .002 0.210 0.139 .132 -0.032 0.106 .765 0.104 0.175 .552
C5 Income -0.023 0.208 .911 0.119 0.169 .482 -0.176 0.130 .176 -0.161 0.211 .446
C6 SRH -0.137 0.311 .660 0.236 0.253 .352 0.017 0.194 .930 -1.407 0.315 <.001
C7 Med Conds. 0.650 0.257 .012 -0.095 0.210 .651 -0.003 0.160 .984 0.065 0.263 .804
C8 Optimism 0.234 0.065 <.001 -0.095 0.053 .075 0.119 0.040 .004 0.390 0.068 <.001
C9 Neuroticism -0.032 0.043 .457 0.123 0.035 .001 -0.100 0.027 <.001 -0.122 0.045 .008
C10 Conscientious. 0.161 0.044 <.001 -0.051 0.036 .149 -0.003 0.027 .926 0.151 0.045 .001
Constant 12.538 4.181 .003 19.201 3.408 <.001 18.789 2.609 <.001 21.820 4.719 <.001
R2 = 0.262
F(11,329) = 10.592, p = <.001
R2 = 0.206
F(11,329) = 7.762, p = <.001
R2 = 0.227
F(11,329) = 8.794, p = <.001
R2 = 0.584
F(14,326) = 32.705, p = <.001 Note. NCON = control-negative; PCEC = primary control engagement coping; DC = disengagement coping; SSS = satisfaction with social support.
Page 452
428
M1 (PCEC)
M2 (DC)
M3 (SSS)
Y (Quality of life)
Antecedent
B
SE
p
B
SE
p
B
SE
p
B
SE
p
X (ER) -0.721 0.412 .081 0.255 0.339 .452 -0.550 0.258 .034 -1.316 0.529 .054
M1 (PCEC) 0.027 0.059 .644
M2 (DC) 0.036 0.069 .604
M3 (SSS) 0.426 0.092 <.001
C1 Gender 1.002 0.522 .056 0.326 0.429 .449 0.543 0.327 .098 -1.024 0.529 .054
C2 Age -0.093 0.031 .003 -0.015 0.026 .554 -0.041 0.019 .036 -0.044 0.032 .170
C3 Partner Status -0.086 0.141 .540 -0.013 0.116 .912 -0.194 0.088 .029 -0.071 0.143 .621
C4 Education 0.547 0.168 .001 0.170 0.139 .221 0.005 0.106 .960 0.170 0.172 .324
C5 Income 0.002 0.208 .992 0.114 0.171 .505 -0.159 0.130 .224 -0.117 0.210 .578
C6 SRH -0.081 0.310 .795 0.296 0.255 .246 0.009 0.194 .961 -1.354 0.312 <.001
C7 Med Conds. 0.605 0.258 .019 -0.085 0.212 .689 -0.034 0.162 .832 -0.008 0.262 .976
C8 Optimism 0.221 0.065 .001 -0.107 0.053 .046 0.119 0.041 .004 0.378 0.067 <.001
C9 Neuroticism 0.001 0.046 .988 0.109 0.038 .005 -0.073 0.029 .013 -0.060 0.048 .206
C10 Conscientious. 0.161 0.043 <.001 -0.057 0.036 .110 0.001 0.027 .968 0.156 0.045 .001
Constant 14.707 4.049 <.001 16.714 3.331 <.001 21.532 2.540 <.001 27.116 4.630 <.001
R2 = 0.267
F(11,329) = 10.901, p = <.001
R2 = 0.197
F(11,329) = 7.353, p = <.001
R2 = 0.225
F(11,329) = 8.692, p = <.001
R2 = 0.591
F(14,326) = 33.598, p = <.001 Note. ER = emotional representations; PCEC = primary control engagement coping; DC = disengagement coping; SSS = satisfaction with social support.
Page 453
429
M1 (PCEC)
M2 (DC)
M3 (SSS)
Y (Psychological distress)
Antecedent
B
SE
p
B
SE
p
B
SE
p
B
SE
p
X (TCR) 0.363 0.353 .304 0.575 0.289 .047 -0.126 0.223 .572 -0.823 0.848 .332
M1 (PCEC) 0.448 0.140 .002
M2 (DC) 0.998 0.165 <.001
M3 (SSS) -0.852 0.217 <.001
C1 Gender 1.011 0.528 .056 0.449 0.432 .299 0.484 0.333 .147 -3.406 1.268 .008
C2 Age -0.094 0.031 .003 -0.022 0.026 .390 -0.038 0.020 .056 -0.132 0.076 .082
C3 Partner Status -0.142 0.142 .316 -0.036 0.116 .757 -0.209 0.089 .020 -0.124 0.340 .717
C4 Education 0.513 0.170 .003 0.142 0.139 .306 0.005 0.107 .961 -0.659 0.410 .109
C5 Income -0.083 0.210 .694 0.071 0.172 .681 -0.174 0.133 .190 -0.669 0.503 .184
C6 SRH -0.262 0.309 .399 0.274 0.253 .279 -0.065 0.195 .739 1.892 0.740 .011
C7 Med Conds. 0.635 0.257 .014 -0.125 0.210 .553 0.007 0.162 .967 0.071 0.619 .908
C8 Optimism 0.260 0.065 <.001 -0.094 0.053 .076 0.133 0.041 .001 -0.371 0.161 .022
C9 Neuroticism -0.038 0.043 .387 0.110 0.035 .002 -0.095 0.027 .001 0.792 0.107 <.001
C10 Conscientious. 0.162 0.044 <.001 -0.051 0.036 .160 0.000 0.028 .996 -0.039 0.108 .717
Constant 13.026 4.091 .002 15.952 3.346 <.001 20.920 2.581 <.001 55.187 10.969 <.001
R2 = 0.261
F(11,328) = 10.504, p = <.001
R2 = 0.204
F(11,328) = 7.627, p = <.001
R2 = 0.215
F(11,328) = 8.186, p = <.001
R2 = 0.567
F(14,325) = 30.449, p = <.001 Note. TCR = timeline-chronic; PCEC = primary control engagement coping; DC = disengagement coping; SSS = satisfaction with social support.
Page 454
430
M1 (PCEC)
M2 (DC)
M3 (SSS)
Y (Psychological distress)
Antecedent
B
SE
p
B
SE
p
B
SE
p
B
SE
p
X (PCSQ) 0.942 0.419 .025 -0.493 0.346 .155 0.489 0.265 .066 0.582 1.022 .569
M1 (PCEC) 0.432 0.141 .002
M2 (DC) 0.993 0.165 <.001
M3 (SSS) -0.851 0.218 <.001
C1 Gender 0.860 0.521 .100 0.370 0.430 .390 0.471 0.329 .154 -3.267 1.258 .010
C2 Age -0.075 0.032 .019 -0.023 0.026 .374 -0.031 0.020 .117 -0.134 0.077 .081
C3 Partner Status -0.118 0.140 .400 -0.011 0.115 .924 -0.212 0.088 .017 -0.162 0.338 .633
C4 Education 0.497 0.169 .003 0.185 0.139 .186 -0.017 0.106 .872 -0.706 0.411 .087
C5 Income -0.043 0.208 .837 0.108 0.171 .530 -0.177 0.131 .177 -0.724 0.500 .148
C6 SRH -0.198 0.307 .519 0.292 0.253 .250 -0.053 0.194 .784 1.859 0.740 .012
C7 Med Conds. 0.574 0.257 .026 -0.065 0.212 .760 -0.063 0.162 .823 0.005 0.623 .994
C8 Optimism 0.251 0.063 <.001 -0.114 0.052 .030 0.139 0.040 .001 -0.340 0.159 .034
C9 Neuroticism -0.011 0.044 .802 0.110 0.036 .002 -0.087 0.028 .002 0.790 0.107 <.001
C10 Conscientious. 0.153 0.043 .001 -0.059 0.036 .102 0.001 0.027 .982 -0.025 0.107 .814
Constant 9.163 4.502 .043 19.773 3.715 <.001 18.176 2.843 <.001 50.632 11.879 <.001
R2 = 0.269
F(11,328) = 10.993, p = <.001
R2 = 0.199
F(11,328) = 7.408, p = <.001
R2 = 0.223
F(11,328) = 8.543, p = <.001
R2 = 0.567
F(14,325) = 30.347, p = <.001 Note. PCSQ = consequences-positive; PCEC = primary control engagement coping; DC = disengagement coping; SSS = satisfaction with social support.
Page 455
431
M1 (PCEC)
M2 (DC)
M3 (SSS)
Y (Psychological distress)
Antecedent
B
SE
p
B
SE
p
B
SE
p
B
SE
p
X (NCSQ) 0.234 0.373 .531 0.014 0.307 .965 -0.677 0.232 .004 2.221 0.896 .014
M1 (PCEC) 0.413 0.140 .003
M2 (DC) 0.988 0.163 <.001
M3 (SSS) -0.747 0.219 .001
C1 Gender 0.963 0.525 .068 0.332 0.432 .443 0.432 0.327 .187 -2.998 1.248 .017
C2 Age -0.094 0.032 .003 -0.015 0.026 .556 -0.027 0.020 .175 -0.182 0.076 .018
C3 Partner Status -0.125 0.141 .374 -0.008 0.116 .947 -0.213 0.088 .016 -0.153 0.335 .648
C4 Education 0.519 0.170 .002 0.167 0.140 .233 0.028 0.106 .789 -0.769 0.407 .060
C5 Income -0.054 0.209 .796 0.114 0.172 .506 -0.188 0.130 .149 -0.699 0.495 .159
C6 SRH -0.290 0.320 .366 0.309 0.263 .240 0.078 0.199 .695 1.342 0.760 .078
C7 Med Conds. 0.655 0.257 .011 -0.103 0.211 .625 -0.018 0.160 .913 0.127 0.615 .836
C8 Optimism 0.254 0.064 <.001 -0.113 0.053 .034 0.121 0.040 .003 -0.297 0.159 .062
C9 Neuroticism -0.033 0.043 .439 0.120 0.035 .001 -0.089 0.027 .001 0.763 0.105 <.001
C10 Conscientious. 0.160 0.044 <.001 -0.060 0.036 .098 -0.009 0.028 .754 0.015 0.108 .890
Constant 13.393 4.085 .001 17.275 3.357 <.001 22.033 2.542 <.001 47.127 11.027 <.001
R2 = 0.259
F(11,328) = 10.423, p = <.001
R2 = 0.194
F(11,328) = 7.179, p = <.001
R2 = 0.234
F(11,328) = 9.132, p = <.001
R2 = 0.574
F(14,325) = 31.305, p = <.001 Note. NCSQ = consequences-negative; PCEC = primary control engagement coping; DC = disengagement coping; SSS = satisfaction with social support.
Page 456
432
M1 (PCEC)
M2 (DC)
M3 (SSS)
Y (Psychological distress)
Antecedent
B
SE
p
B
SE
p
B
SE
p
B
SE
p
X (PCON) 1.711 0.503 .001 0.909 0.417 .030 0.583 0.321 .070 -2.850 1.237 .022
M1 (PCEC) 0.488 0.141 .001
M2 (DC) 1.015 0.164 <.001
M3 (SSS) -0.814 0.216 <.001
C1 Gender 0.796 0.517 .124 0.256 0.429 .551 0.463 0.329 .161 -3.065 1.249 .015
C2 Age -0.083 0.031 .007 -0.011 0.025 .657 -0.037 0.020 .060 -0.149 0.075 .047
C3 Partner Status -0.148 0.139 .286 -0.020 0.115 .860 -0.223 0.088 .012 -0.111 0.336 .741
C4 Education 0.441 0.168 .009 0.121 0.140 .388 -0.030 0.107 .779 -0.572 0.410 .163
C5 Income -0.059 0.205 .773 0.112 0.171 .510 -0.185 0.131 .159 -0.718 0.496 .149
C6 SRH 0.000 0.312 1.000 0.439 0.259 .091 0.007 0.199 .971 1.449 0.753 .055
C7 Med Conds. 0.594 0.253 .020 -0.132 0.210. .529 -0.016 0.161 .920 0.107 0.615 .862
C8 Optimism 0.213 0.064 .001 -0.132 0.053 .013 0.125 0.041 .002 -0.299 0.159 .061
C9 Neuroticism -0.020 0.042 .644 0.126 0.035 <.001 -0.093 0.027 .001 0.761 0.105 <.001
C10 Conscientious. 0.146 0.043 .644 -0.066 0.036 .066 -0.001 0.028 .961 -0.013 0.107 .902
Constant 7.437 4.375 .090 13.882 3.630 <.001 18.431 2.791 <.001 62.376 11.426 <.001
R2 = 0.283
F(11,328) = 11.793, p = <.001
R2 = 0.206
F(11,328) = 7.714, p = <.001
R2 = 0.222
F(11,328) = 8.531, p = <.001
R2 = 0.573
F(14,325) = 31.169, p = <.001 Note. PCON = control-positive; PCEC = primary control engagement coping; DC = disengagement coping; SSS = satisfaction with social support.
Page 457
433
M1 (PCEC)
M2 (DC)
M3 (SSS)
Y (Psychological distress)
Antecedent
B
SE
p
B
SE
p
B
SE
p
B
SE
p
X (NCON) 0.274 0.378 .469 -0.632 0.309 .041 0.548 0.236 .021 0.941 0.913 .303
M1 (PCEC) 0.447 0.140 .002
M2 (DC) 0.962 0.165 <.001
M3 (SSS) -0.816 0.219 <.001
C1 Gender 0.906 0.525 .086 0.400 0.429 .352 0.449 0.328 .172 -3.137 1.258 .013
C2 Age -0.086 0.032 .007 -0.024 0.026 .348 -0.032 0.020 .111 -0.155 0.076 .043
C3 Partner Status -0.120 0.141 .397 -0.019 0.115 .870 -0.205 0.088 .020 -0.174 0.338 .608
C4 Education 0.513 0.171 .003 0.206 0.139 .141 -0.034 0.107 .754 -0.631 0.413 .127
C5 Income -0.053 0.209 .799 0.110 0.171 .521 -0.180 0.131 .170 -0.728 0.499 .145
C6 SRH -0.196 0.314 .533 0.217 0.257 .398 0.009 0.196 .962 1.708 0.749 .023
C7 Med Conds. 0.645 0.257 .013 -0.097 0.210 .645 -0.004 0.161 .980 0.049 0.619 .937
C8 Optimism 0.240 0.065 <.001 -0.093 0.053 .081 0.120 0.041 .003 -0.323 0.160 .044
C9 Neuroticism -0.032 0.043 .454 0.123 0.035 .001 -0.100 0.027 <.001 0.789 0.106 <.001
C10 Conscientious. 0.153 0.044 .001 -0.054 0.036 .135 -0.004 0.028 .898 -0.017 0.108 .871
Constant 12.994 4.192 .002 19.350 3.424 <.001 18.849 2.622 <.001 56.216 11.150 <.001
R2 = 0.259
F(11,328) = 10.439, p = <.001
R2 = 0.204
F(11,328) = 7.652, p = <.001
R2 = 0.227
F(11,328) = 8.772, p = <.001
R2 = 0.568
F(14,325) = 30.469, p = <.001 Note. NCON = control-negative; PCEC = primary control engagement coping; DC = disengagement coping; SSS = satisfaction with social support.
Page 458
434
M1 (PCEC)
M2 (DC)
M3 (SSS)
Y (Psychological distress)
Antecedent
B
SE
p
B
SE
p
B
SE
p
B
SE
p
X (ER) -0.724 0.412 .079 0.254 0.339 .454 -0.551 0.259 <.001 2.606 0.985 .009
M1 (PCEC) 0.471 0.139 .001
M2 (DC) 0.957 0.163 <.001
M3 (SSS) -0.790 0.216 <.001
C1 Gender 0.974 0.522 .063 0.317 0.430 .462 0.539 0.328 .101 -3.411 1.245 .007
C2 Age -0.974 0.522 .063 -0.015 0.026 .568 -0.041 0.020 .038 -0.132 0.075 .077
C3 Partner Status -0.092 0.031 .003 -0.017 0.116 .886 -0.196 0.089 .028 -0.240 0.336 .475
C4 Education 0.534 0.168 .002 0.166 0.139 .233 0.003 0.106 .975 -0.717 0.406 .078
C5 Income -0.028 0.209 .893 0.105 0.172 .543 -0.163 0.131 .215 -0.813 0.496 .102
C6 SRH -0.140 0.313 .655 0.278 0.258 .281 0.001 0.197 .997 1.508 0.742 .043
C7 Med Conds. 0.599 0.257 .021 -0.087 0.212 .684 -0.035 0.162 .828 0.198 0.616 .748
C8 Optimism 0.226 0.065 .001 -0.105 0.053 .050 0.120 0.041 .003 -0.283 0.159 .076
C9 Neuroticism 0.001 0.046 .988 0.109 0.038 .005 -0.073 0.029 .013 0.675 0.112 <.001
C10 Conscientious. 0.153 0.044 .001 -0.059 0.036 .099 -0.000 0.027 .998 -0.021 0.106 .846
Constant 15.162 4.060 <.001 16.854 3.348 <.001 21.599 2.552 <.001 47.770 10.928 <.001
R2 = 0.265
F(11,328) = 10.754, p = <.001
R2 = 0.195
F(11,328) = 7.242, p = <.001
R2 = 0.225
F(11,328) = 8.673, p = <.001
R2 = 0.575
F(14,325) = 31.446, p = <.001 Note. ER = emotional representations; PCEC = primary control engagement coping; DC = disengagement coping; SSS = satisfaction with social support.
Page 459
435
Appendix F: Model summary information for mediation models (Time 2)
Page 460
436
M1 (PCEC)
M2 (DC)
M3 (SSS)
Y (Life satisfaction)
Antecedent
B
SE
p
B
SE
p
B
SE
p
B
SE
p
X (PCSQ) 1.317 0.420 .002 0.432 0.324 .184 0.339 0.250 .177 -0.197 0.523 .706
M1 (PCEC) 0.245 0.087 .006
M2 (DC) -0.078 0.112 .490
M3 (SSS) 0.299 0.147 .042
C1 Gender 0.633 0.534 .237 0.241 0.412 .559 -0.055 0.318 .864 0.703 0.649 .280
C2 Age 0.081 0.031 .010 0.004 0.024 .853 -0.013 0.019 .472 0.054 0.038 .158
C3 Partner Status -0.469 0.031 .010 0.012 0.215 .956 -0.355 0.166 .033 0.612 0.341 .074
C4 Education 0.603 0.295 .042 0.379 0.227 .097 0.134 0.176 .446 0.117 0.362 .747
C5 Income 0.630 0.399 .116 -0.028 0.308 .927 0.213 0.238 .372 1.133 0.486 .021
C6 SRH -0.090 0.313 .775 -0.164 0.241 .498 0.273 0.186 .145 -0.270 0.381 .479
C7 Med Conds. 0.370 0.260 .156 0.280 0.201 .164 -0.034 0.155 .829 -0.226 0.317 .477
C8 Optimism 0.037 0.065 .574 -0.084 0.050 .099 0.016 0.039 .686 0.016 0.080 .837
C9 Neuroticism -0.017 0.043 .693 0.041 0.033 .216 -0.048 0.026 .063 -0.049 0.052 .349
C10 Conscientious. -0.031 0.045 .491 0.004 0.035 .918 0.034 0.027 .199 -0.085 0.055 .119
Constant -8.639 4.015 .033 -1.059 3.097 .733 -0.307 2.393 .898 -3.341 4.911 .497
R2 = 0.130
F(11,209) = 2.826, p = .002
R2 = 0.078
F(11,209) = 1.596, p = .102
R2 = 0.130
F(11,209) = 2.840, p = .002
R2 = 0.144
F(14,206) = 2.484, p = .003 Note. PCSQ = consequences-positive; PCEC = primary control engagement coping; DC = disengagement coping; SSS = satisfaction with social support.
Page 461
437
M1 (PCEC)
M2 (DC)
M3 (SSS)
Y (Life satisfaction)
Antecedent
B
SE
p
B
SE
p
B
SE
p
B
SE
p
X (ER) -1.207 0.429 .005 0.711 0.327 .031 -0.114 0.255 .656 -0.553 0.535 .302
M1 (PCEC) 0.218 0.088 .014
M2 (DC) -0.058 0.114 .613
M3 (SSS) -0.058 0.114 .613
C1 Gender 1.034 0.532 .053 0.244 0.406 .549 0.026 0.317 .936 0.303 0.146 .039
C2 Age 0.067 0.031 .032 0.007 0.024 .766 -0.016 0.019 .403 -0.746 0.645 .249
C3 Partner Status -0.499 0.279 .075 -0.000 0.213 .999 -0.364 0.166 .030 0.054 0.038 .162
C4 Education 0.706 0.297 .018 0.350 0.226 .123 0.149 0.177 .399 0.152 0.341 .076
C5 Income 0.481 0.407 .239 0.114 0.310 .715 0.208 0.242 .391 1.046 0.491 .034
C6 SRH -0.034 0.314 .915 -0.156 0.239 .516 0.285 0.187 .129 -0.271 0.380 .476
C7 Med Conds. 0.432 0.262 .100 0.262 0.199 .191 -0.024 0.187 .129 -0.205 0.317 .519
C8 Optimism 0.038 0.066 .568 -0.070 0.050 .162 0.018 0.039 .640 0.010 0.079 .896
C9 Neuroticism -0.005 0.043 .915 0.037 0.033 .269 -0.046 0.026 .075 -0.046 0.052 .377
C10 Conscientious. -0.019 0.045 .673 -0.001 0.034 .982 0.036 0.027 .182 -0.083 0.054 .131
Constant -9.283 4.024 .022 -1.466 3.069 .633 -0.508 2.397 .832 -3.339 4.897 .496
R2 = 0.122
F(11,209) = 2.638, p = .004
R2 = 0.090
F(11,209) = 1.883, p = .043
R2 = 0.123
F(11,209) = 2.670, p = .003
R2 = 0.148
F(14,206) = 2.561, p = .002 Note. ER = emotional representations; PCEC = primary control engagement coping; DC = disengagement coping; SSS = satisfaction with social support.
Page 462
438
M1 (PCEC)
M2 (DC)
M3 (SSS)
Y (Positive affect)
Antecedent
B
SE
p
B
SE
p
B
SE
p
B
SE
p
X (PCSQ) 1.316 0.420 .002 0.425 0.324 .191 0.343 0.249 .170 0.172 0.070 .015
M1 (PCEC) 0.047 0.012 <.001
M2 (DC) -0.014 0.015 .353
M3 (SSS) 0.034 0.020 .084
C1 Gender 0.625 0.532 .242 0.201 0.411 .626 -0.039 0.315 .902 -0.029 0.087 .738
C2 Age 0.082 0.031 .009 0.005 0.024 .838 -0.013 0.018 .494 -0.001 0.005 .813
C3 Partner Status -0.479 0.278 .087 0.007 0.215 .974 -0.365 0.165 .028 0.041 0.046 .369
C4 Education 0.617 0.296 .038 0.364 0.229 .113 0.163 0.175 .355 -0.070 0.049 .155
C5 Income 0.605 0.400 .132 -0.019 0.309 .950 0.175 0.237 .462 -0.063 0.066 .337
C6 SRH -0.101 0.312 .745 -0.190 0.240 .431 0.275 0.184 .137 -0.005 0.051 .922
C7 Med Conds. 0.373 0.260 .153 0.272 0.201 .177 -0.025 0.154 .874 -0.102 0.043 .017
C8 Optimism 0.037 0.065 .577 -0.082 0.050 .104 0.015 0.039 .705 0.004 0.011 .735
C9 Neuroticism -0.015 0.043 .726 0.042 0.033 .206 -0.046 0.025 .072 -0.013 0.007 .068
C10 Conscientious. -0.030 0.045 .502 -0.001 0.035 .989 0.038 0.027 .153 -0.005 0.007 .517
Constant -8.670 4.014 .032 -0.806 3.100 .795 -0.517 2.378 .828 1.016 0.660 .125
R2 = 0.130
F(11,209) = 2.831, p = .002
R2 = 0.076
F(11,209) = 1.553, p = .115
R2 = 0.131
F(11,209) = 2.858, p = .002
R2 = 0.124
F(14,206) = 4.006, p = <.001 Note. PCSQ = consequences-positive; PCEC = primary control engagement coping; DC = disengagement coping; SSS = satisfaction with social support.
Page 463
439
M1 (PCEC)
M2 (DC)
M3 (SSS)
Y (Positive affect)
Antecedent
B
SE
p
B
SE
p
B
SE
p
B
SE
p
X (PCON) 0.947 0.509 .064 0.926 0.384 .017 -0.108 0.299 .718 0.110 0.084 .190
M1 (PCEC) 0.050 0.012 <.001
M2 (DC) -0.014 0.015 .351
M3 (SSS) 0.038 0.020 .057
C1 Gender 0.852 0.534 .112 0.252 0.402 .532 0.033 0.313 .915 0.110 0.084 .190
C2 Age 0.081 0.032 .011 0.008 0.024 .726 -0.015 0.019 .424 -0.002 0.087 .982
C3 Partner Status -0.466 0.283 .101 0.041 0.213 .850 -0.378 0.166 .024 0.046 0.047 .328
C4 Education 0.620 0.301 .040 0.345 0.227 .130 0.175 0.176 .322 -0.072 0.049 .148
C5 Income 0.717 0.407 .080 0.050 0.307 .871 0.185 0.238 .439 -0.052 0.066 .431
C6 SRH 0.013 0.317 .968 -0.109 0.239 .650 0.279 0.186 .135 0.008 0.052 .877
C7 Med Conds. 0.379 0.264 .152 0.265 0.199 .184 -0.018 0.155 .908 -0.102 0.043 .018
C8 Optimism 0.038 0.066 .570 -0.091 0.050 .071 0.020 0.039 .606 0.004 0.011 .733
C9 Neuroticism -0.018 0.044 .679 0.037 0.033 .260 -0.045 0.026 .083 -0.013 0.007 .070
C10 Conscientious. -0.031 0.046 .491 -0.004 0.034 .917 0.039 0.027 .143 -0.005 0.007 .508
Constant -9.475 4.064 .021 -1.028 3.063 .738 -0.748 2.382 .754 0.946 0.666 .157
R2 = 0.104
F(11,209) = 2.197, p = .016
R2 = 0.093
F(11,209) = 1.953, p = .738
R2 = 0.123
F(11,209) = 2.675, p = .003
R2 = 0.198
F(14,206) = 3.629, p = <.001 Note. PCON = control-positive; PCEC = primary control engagement coping; DC = disengagement coping; SSS = satisfaction with social support.
Page 464
440
M1 (PCEC)
M2 (DC)
M3 (SSS)
Y (Positive affect)
Antecedent
B
SE
p
B
SE
p
B
SE
p
B
SE
p
X (ER) -1.192 0.428 .006 0.718 0.327 .029 -0.102 0.254 .688 -0.135 0.072 .064
M1 (PCEC) 0.047 0.012 <.001
M2 (DC) -0.006 0.015 .702
M3 (SSS) 0.039 0.020 .049
C1 Gender -1.192 0.530 .056 0.207 0.405 .610 0.041 0.314 .897 0.017 0.087 .842
C2 Age 0.068 0.031 .030 0.008 0.024 .751 -0.015 0.019 .423 -0.003 0.005 .852
C3 Partner Status -0.509 0.279 .070 -0.004 0.213 .984 -0.373 0.165 .025 0.039 0.046 .395
C4 Education 0.716 0.298 .017 0.336 0.228 .141 0.177 0.176 .317 -0.062 0.049 .211
C5 Income 0.462 0.409 .260 0.124 0.312 .692 0.173 0.242 .475 -0.079 0.067 .236
C6 SRH -0.049 0.312 .876 -0.178 0.230 .456 0.287 0.185 .121 0.002 0.051 .974
C7 Med Conds. 0.433 0.262 .100 0.254 0.200 .204 -0.016 0.155 .918 -0.097 0.043 0.025
C8 Optimism 0.038 0.066 .567 -0.069 0.050 .169 0.017 0.039 .655 0.005 0.011 .673
C9 Neuroticism -0.003 0.043 .948 0.037 0.033 .260 -0.044 0.026 .084 -0.012 0.007 .104
C10 Conscientious. -0.019 0.045 .671 -0.004 0.034 0.898 0.039 0.027 .141 -0.004 0.007 .620
Constant -9.273 4.025 .022 -1.242 3.071 .686 -0.719 2.382 .763 0.947 0.663 .155
R2 = 0.121
F(11,209) = 2.625, p = .004
R2 = 0.089
F(11,209) = 1.856, p = .047
R2 = 0.124
F(11,209) = 2.678, p = .003
R2 = 0.205
F(14,206) = 3.783, p = <.001 Note. ER = emotional representations; PCEC = primary control engagement coping; DC = disengagement coping; SSS = satisfaction with social support.
Page 465
441
Appendix G: Model summary information for moderation models
Page 466
442
Moderation analyses predicting life satisfaction from SPA and neuroticism
Ba SE t LLCI ULCI p
Constant 25.62 4.01 6.38 17.724 33.515 < .001
M Neuroticism -0.32 0.05 -6.75 -0.409 -0.225 < .001
X Control-positive (PCON) 2.06 0.64 3.20 0.796 3.332 .002
XM Neuroticism x PCON 0.20 0.06 3.34 0.082 0.317 .001
C1 Gender -0.83 0.58 -1.44 -1.969 0.308 .152
C2 Age 0.07 0.04 1.76 -0.009 0.152 .079
C3 Partner Status -0.52 0.18 -2.88 -0.870 -0.164 .004
C4 Education 0.09 0.21 0.43 -0.320 0.501 .664
C5 Income 0.21 0.27 0.79 -0.318 0.743 .430
C6 SRH -0.61 0.42 -1.43 -1.443 0.226 .152
C7 Medical Conditions -0.55 0.32 -1.74 -1.170 0.071 .083
F(10, 332) = 27.22, p <.001, R2 = .42
Constant 25.37 4.27 5.94 16.965 33.772 < .001
Neuroticism -0.33 0.05 -6.96 -0.430 -0.240 < .001
Control-negative (NCON) 0.72 0.52 1.38 -0.304 1.749 .167
Neuroticism x NCON 0.10 0.05 2.07 0.005 0.191 .039
C1 Gender -0.63 0.62 -1.02 -1.844 0.583 .308
C2 Age 0.07 0.04 1.67 -0.013 0.163 .096
C3 Partner Status -0.52 0.19 -2.68 -0.900 -0.138 .008
C4 Education 0.18 0.21 0.85 -0.234 0.589 .397
C5 Income 0.17 0.28 0.59 -0.386 0.716 .556
C6 SRH -0.89 0.42 -2.09 -1.719 -0.053 .037
C7 Medical Conditions -0.52 0.32 -1.64 -1.152 0.106 .103
F(10, 332) = 25.56, p <.001, R2 = .38
Page 467
443
Moderation analyses predicting psychological distress from SPA and generalised optimism
Ba SE t LLCI ULCI p
Constant 62.35 7.99 7.80 46.635 78.071 < .001
Optimism -0.94 0.14 -6.64 -1.222 -0.663 < .001
Control-positive (PCON) -2.04 1.19 -1.71 -4.382 0.308 .088
Optimism x PCON 0.46 0.18 2.55 0.104 0.809 .011
C1 Gender -0.75 1.33 -0.56 -3.373 1.878 .576
C2 Age -0.17 0.09 -1.95 -0.344 0.002 .053
C3 Partner Status 0.20 0.38 0.52 -0.548 0.939 .605
C4 Education -0.15 0.42 -0.37 -0.969 0.663 .713
C5 Income -0.80 0.57 -1.41 -1.915 0.315 .159
C6 SRH 3.24 0.82 3.97 1.637 4.848 < .001
C7 Medical Conditions 0.14 0.61 0.22 -1.065 1.337 .824
F(10, 330) = 14.08, p <.001, R2 = .38
Constant 62.53 7.69 8.13 47.408 77.660 < .001
Optimism -0.77 0.16 -4.66 -1.093 -0.444 < .001
Emotional representations (ER) 3.55 0.94 3.77 1.696 5.396 < .001
Optimism x ER -0.33 0.13 -2.59 -0.577 -0.079 .010
C1 Gender -1.41 1.30 -1.08 -3.969 1.158 .282
C2 Age -0.14 0.08 -1.63 -0.303 0.029 .105
C3 Partner Status -0.02 0.37 -0.06 -0.757 0.715 .955
C4 Education -0.19 0.42 -0.46 -1.014 0.631 .647
C5 Income -0.86 0.55 -1.55 -1.947 0.234 .123
C6 SRH 2.75 0.89 3.09 0.996 4.501 .002
C7 Medical Conditions 0.34 0.62 0.55 -0.870 1.552 .580
F(10, 330) = 18.07, p <.001, R2 = .41