Applying the disability-adjusted life year to trackhealth impact of social franchise programs inlow- and middle-income countriesDominic Montagu1*, Lek Ngamkitpaiboon2, Susan Duvall3, Amy Ratcliffe2
Abstract
Background: Developing effective methods for measuring the health impact of social franchising programs is vitalfor demonstrating the value of this innovative service delivery model, particularly given its rapid expansionworldwide. Currently, these programs define success through patient volume and number of outlets, widelyacknowledged as poor reflections of true program impact. An existing metric, the disability-adjusted life yearsaverted (DALYs averted), offers promise as a measure of projected impact. Country-specific and service-specific,DALYs averted enables impact comparisons between programs operating in different contexts. This study exploresthe use of DALYs averted as a social franchise performance metric.
Methods: Using data collected by the Social Franchising Compendia in 2010 and 2011, we compared franchiseperformance, analyzing by region and program area. Coefficients produced by Population Services Internationalconverted each franchise’s service delivery data into DALYs averted. For the 32 networks with two years of datacorresponding to these metrics, a paired t-test compared all metrics. Finally, to test data reporting quality, wecompared services provided to patient volume.
Results: Social franchising programs grew considerably from 2010 to 2011, measured by services provided (215%),patient volume (31%), and impact (couple-years of protection (CYPs): 86% and DALYs averted: 519%), but not bythe total number of outlets. Non-family planning services increased by 857%, with diversification centered in Asiaand Africa. However, paired t-test comparisons showed no significant increase within the networks, whethercategorized as family planning or non-family planning. The ratio of services provided to patient visits yieldedconsiderable range, with one network reporting a ratio of 16,000:1.
Conclusion: In theory, the DALYs averted metric is a more robust and comprehensive metric for social franchisingthan current program measures. As social franchising spreads beyond family planning, having a metric thatcaptures the impact of a range of diverse services and allows comparisons will be increasingly important. However,standardizing reporting will be essential to make such comparisons useful. While not widespread, errors in self-reported data appear to have included social marketing distribution data in social franchising reporting, requiringclearer data collection and reporting guidelines. Differences noted above must be interpreted cautiously as a result.
BackgroundPrivate providers outnumber public providers in nearlyall low- and middle-income countries (LMICs), deliver-ing more than 50% of all healthcare services in Africaand Asia and more than 70% of all healthcare in themost populous countries in these regions: Nigeria, India,
Pakistan, Bangladesh, and Indonesia [1]. Given privatehealth facilities’ large share of national health markets,LMIC national health systems are increasingly chal-lenged to ensure these private providers sufficientlyadvance public health goals and adhere to national stan-dards of care.Social franchising is an innovative way of leveraging
existing private sector infrastructure in LMICs to servethese national public health goals. To do so, social fran-chising promotes and improves clinical services among
* Correspondence: [email protected] Health Group, University of California San Francisco, CA, USAFull list of author information is available at the end of the article
Montagu et al. BMC Public Health 2013, 13(Suppl 2):S4http://www.biomedcentral.com/1471-2458/13/S2/S4
existing private providers through technical assistanceand the application of social marketing techniques, ahealth intervention that has proven successful in foster-ing widespread access to and use of public health com-modities in LMIC countries [2,3]. As the fastest growingmechanism for engaging private practitioners in nationalpublic health initiatives, this social franchising approachis supported by a highly collaborative community ofpractice and a growing body of evidence that demon-strates social franchising’s ability to improve servicequality, increase access to essential services, and servethe poor [4,5].Social franchises engage existing for-profit, private
clinics in a contractual exchange. The franchise program,nearly always run by a non-governmental organization(NGO), builds providers’ capacity in new clinical meth-ods, clinic management, business skills, and marketingand advertising techniques. Doing so builds demand forthe health services offered. The program also organizesongoing education and technical support as well asaccess to subsidized commodities and medicines whichare often unavailable. Service quality is further supportedthrough franchise-mediated linkages to private andnational referral systems. In exchange, providers whoenroll as franchisees commit to providing the health ser-vices that the implementing organization prioritizes,often low-margin services such as family planning orantenatal care, or socially unattractive services such astreatment for tuberculosis (TB) or HIV/AIDS. Franchiseproviders also are required to adhere to clearly definedclinical, reporting, and pricing practices. Increased clientload, the resulting increase in profits, training opportu-nities, and reputation enhancement are the most fre-quently cited motivations for providers to join a socialfranchise [6,7].Begun in the early 1990s in Pakistan and Nepal, social
franchising programs have steadily expanded throughoutthe developing world; as of June 2012, more than 50 pro-grams operate in 35 countries [8] (see map, Figure 1).Initially, participating clinics and providers offered onlyfamily planning services, but many franchise service port-folios have expanded in recent years to include pediatricand maternal care as well as infectious disease testingand treatment, among others. More than half of theworld’s social franchise programs now offer a range ofnon-family planning services, and the number of pro-gram areas addressed by each franchise is growing eachyear [8]. While social franchises are often linked to large-scale social marketing programs which promote and dis-tribute non-clinical health commodities (e.g., condoms ormosquito bednets) through retail outlets, the franchisesthemselves are, by definition, focused on clinical servicedelivery. Currently, two large international NGOs, Popu-lation Services International (PSI) and Marie Stopes
International (MSI), operate or support the majority ofglobal social franchise programs, 25 and 10 programsrespectively [9,10].The growth in the number of programs has led to the
development of a global community of practice amongsocial franchisors. Coordinated by the University of Cali-fornia, San Francisco (UCSF)’s Global Health Group, thisnetwork of social franchising implementors facilitatesinformation exchanges and supports almost all of theknown social franchising programs, compiling dataannually about its members in a Compendium of ClinicalSocial Franchising Programs [8,11]. The Social FranchisingCompendia are comprised of both large and small fran-chise programs. Large programs are defined as reportingan operating budget of more than $500,000 per year andincluding more than 50 member clinics. From 2010-2011,the Compendia gathered data on 58 social franchise net-works, spanning Asia, Africa, and Latin America.Increased confidence in this service delivery model on
the part of donor agencies and NGOs accounts, in part,for the rapid expansion of social franchising. These stake-holders believe that franchises increase access to impor-tant clinical services by extending the geographic reach ofthe government healthcare system. Related clinical servicemodels, such as NGO delivery or one-time training pro-grams, face challenges in providing widely distributed ser-vices. It can be difficult for these models to meet highquality standards at outlets while offering only a lowvolume of services to a small catchment area and patientbase. In contrast, by leveraging existing infrastructure andin situ skilled providers, social franchise networks are the-oretically able to assure quality at comparatively low cost,even in low volume settings [2].As with any health intervention, understanding the
health impact of social franchising programs is essential,to inform decision making and to demonstrate the viabi-lity and value of this innovative approach. Currently, pro-grams track a number of service delivery measures: thenumber of patient visits, not tracked by individualpatients, for any cause or service (called “patient volume”hereafter); the number of clinics operating (called “num-ber of outlets” hereafter); and (rarely) the number of pre-vention or treatment interventions received by patients(called “services provided” hereafter). Family planning-focused programs frequently track and report CYPs, ameasure of projected impact that can be applied to allfamily planning methods based on weights to approxi-mate the number of years a method safeguards againstpregnancy and the number of products or services pro-vided. For example, 120 condoms are considered to pro-tect the couple from pregnancy for one year, and arethus, equal to one CYP, as are 13 cycles of monthly con-traceptive pills, or .26 of a 5-year implant. (Note that theaverage implant is estimated to provide only 3.8 CYPs,
Montagu et al. BMC Public Health 2013, 13(Suppl 2):S4http://www.biomedcentral.com/1471-2458/13/S2/S4
Page 2 of 12
not five, because some 5-year implants are removed early;hence .26 implants leads to one CYP.) [12].These process measures are widely acknowledged as
crude and poorly correlated with the true health impactthat these programs likely achieve [13]. Patient volumeand number of outlets have inherent problems: the for-mer includes no information on severity of disease,while the latter does not reflect information on thepatients served or the types of illnesses and health con-ditions treated [14]. Although the CYP metric is a goodaggregate measure of family planning program projectedimpact, it is a metric of protection, not health impact,and it is limited to one program area only. As socialfranchises increasingly expand their portfolio of servicesbeyond family planning, CYPs will capture only a smallportion of all care offered.Program managers and donors currently seek more
robust measures of program impact, both to benchmarkprogram performance against appropriate comparators,and to track year-to-year improvement [15-18]. A stan-dardized metric for projected health impact would enablethese program comparisons and allow for more accurateassessments of social franchising program variations,after accounting for changes in population health and
service delivery. Such a method would also provide abasis for more accurate analysis of the cost-effectivenessof complex delivery systems and programs.An existing metric, DALYs averted, offers promise as an
impact measure of social franchising programs. Thismetric is based on the DALY, the standard unit represent-ing disease burden in a population, originally developedfor the World Bank in 1990 and adopted by the WorldHealth Organization (WHO) in 2000 as part of the GlobalBurden of Disease Study [19,20]. Disease burden can beexpressed as the number of DALYs lost due to a healthcondition, either from premature death (mortality) or dis-ability (morbidity), as compared to an ideal life expectancy[20]. The DALYs averted measure, then, denotes the dis-ability-adjusted life years that are not lost - or, are averted- as a result of a health intervention. The attraction ofusing a metric based on the DALY is that the DALYincorporates both mortality and morbidity, it is widelyused by global development agencies, it enables compari-son across countries on an standardized scale, and it canbe aggregated or disaggregated by disease [21,22].The DALYs averted metric is intended conceptually to
be the inverse of DALYs in burden and thus benefitsfrom a growing understanding of what a DALY, as a unit,
Figure 1 Global growth of social franchising programs, 2003 versus 2012.
Montagu et al. BMC Public Health 2013, 13(Suppl 2):S4http://www.biomedcentral.com/1471-2458/13/S2/S4
Page 3 of 12
is. Such attributes allow decision makers to use DALYsfor comparing the overall burden of disease due to TB,malaria, diabetes, or other illnesses. Conversely, decisionmakers can also compare projected DALYs averted forunderstanding the potential to reduce burden with speci-fic interventions, and to allocate resources based on thesedata.Despite its established importance in global burden of
disease assessment, the DALY has only recently beenadapted into a measure of the impact of healthcare inter-ventions by service providers. Beginning in 2007, PSIinitiated the use of an impact metric based on the DALY.In each of the 58 countries where PSI operated, research-ers calculated a country- and disease-specific DALY coeffi-cient for each prevention or treatment intervention [23].These models project the impact of specific products andservices across a wide range of program areas, such asmale circumcision, malaria rapid diagnostic test kits,intrauterine device (IUD) insertions, and pneumonia treat-ment [24]. Note that PSI bases the DALYs averted metricon models of health impact which are necessarily differentfrom the WHO and World Bank burden models ofDALYs. PSI has also never used age weighting in DALYcalculations.PSI DALYs averted models are tailored to different dis-
eases and interventions. As a generalized description,DALYs averted are calculated based on reduced risk in apopulation and the corresponding years of healthy lifepreserved. Using country-specific population and healthdata, the reduced risk of death is calculated by applyingthe demonstrated effectiveness of prevention or treat-ment to baseline disease burden. To calculate impact inDALYs averted, the reduction in mortality is multipliedby the number of years between average age at death forthe targeted disease and ideal life expectancy. The ratioof years lost from death to years lost from disability isused to calculate the additional years that would be lostto disability for the same disease. The result of this calcu-lation is a DALYs averted coefficient, the impact of a sin-gle product or service in years of healthy life preserved.Other publications describe the PSI methodology inmore detail [24].Each of PSI’s DALYs averted models projects health
impact from the use of one service or product delivered(e.g., a safe child delivery or the sale of a packet of oralrehydration salts (ORS) for pediatric diarrhea), producinga coefficient for this unit. Besides being product- or ser-vice-specific, this coefficient is also country-specific, asthe number of DALYs averted by any treatment or ser-vice varies according to the national burden of disease.For example, in a country with a low malaria burden, thesale of a long-lasting, insecticide-treated net (LLIN) willhave a small coefficient whereas this coefficient will bemuch larger in a country with higher incidence and
widespread malaria. Therefore, the DALYs averted coeffi-cient for an LLIN in Nicaragua will differ sharply fromthat used for an LLIN in Benin. To generate estimates ofthe number of DALYs averted by a specific service orproduct intervention, the coefficient is then applied tothe total number of services or products distributedwithin the country during the past year. For example, theLLIN coefficient for Benin is multiplied by the number ofLLINs distributed, resulting in the total number ofDALYs averted by the LLIN intervention in Benin.The final model outputs for each intervention, DALYs
averted, can serve as a program management tool as theseoutputs allow comparisons of impact between countriesand between different interventions offered within eachcountry program. Organizations can use the DALYsaverted metric to benchmark program impact and deter-mine program emphasis and design, as described else-where [25]. Thus far, both PSI and MSI have adoptedDALYs averted for internal program management use;other organizations are considering doing the same.For managing social franchising programs, the DALYs
averted metric would be useful for projecting programimpact, by applying the coefficients to reported servicedelivery data, on a monthly, quarterly, or annual basis.DALYs averted can be considered for specific interven-tions within a health program area (e.g., HIV or familyplanning) for a social franchise network, country, orregion. To understand the overall health impact of a socialfranchise program, the DALYs averted across all individualproducts or services can be summed. The resulting aggre-gate will show an estimate of the health impact of familyplanning services as well as the social franchising pro-gram’s impact on malaria, diarrhea, and other targetedhealth conditions. With this aggregate, comparisons ofoverall effect between social franchising programs mana-ged by different implementing organizations and operatingin different national contexts are possible because DALYsaverted adjusts for the burden of disease in each country.
Study goalsThis study seeks to demonstrate the application of a sin-gle, comprehensive health impact measure to social fran-chising programs. Our principal goal is to present the useof DALYs averted alongside currently used program out-put and impact measures - patient volume, number ofoutlets, number of services provided, and CYPs - to trackprogress across a global set of social franchising net-works. We describe changes in social franchising impactover two years, 2010 to 2011, and highlight differences byregion and program area. We also review the strengthsand limitations of each of the individual metrics currentlyused by social franchising programs. In doing so, we dis-cuss opportunities to incorporate DALYs averted as asocial franchising metric, reviewing the programmatic
Montagu et al. BMC Public Health 2013, 13(Suppl 2):S4http://www.biomedcentral.com/1471-2458/13/S2/S4
Page 4 of 12
decisions that could be informed by this metric. We hopethis study will provide insight into the benefits and chal-lenges of establishing a standardized impact measure-ment system for service delivery programs run bymultiple implementing organizations.
MethodsData for this analysis comes from the 2010 and 2011 self-reported programmatic and services data collected by theSocial Franchising Compendia for each year [8,11]. Allsocial franchising programs known to UCSF’s GlobalHealth Group at the end of each year are included in theSocial Franchising Compendia. To maximize the likeli-hood that all active social franchises are captured, thoseprograms tracked by the Social Franchising Compendiaare compared on a quarterly basis with other lists of socialfranchises (e.g., those compiled by the Center for HealthMarket Innovation and the International Centre for SocialFranchising), in addition to conducting a thorough searchof programs referenced on the internet, and canvassingdonors and implementers.Nearly all Social Franchising Compendia programs
voluntarily report service delivery data annually betweenFebruary and April, using either internet-based surveyforms or Adobe Portable Document Format (PDF) docu-ments filled in by hand. Data are checked for emptyresponse cells and for consistency with program descrip-tions. Programs report the total number of patient visits(patient volume) and the treatments, procedures, andproducts provided (services provided) for a wide range ofconditions and diseases. In addition, programs report arange of aggregate program data, including the numberof clinics included in the social franchising network, thenumber and type of providers per clinic, and the size ofannual operating budgets. Additional file 1 provides anoverview of the social franchising programs that areCompendia members.The key output measures emphasized in this study - ser-
vices provided, patient volume, and number of outlets -were directly reported by the social franchising networks tothe Social Franchising Compendium. These annual servicedelivery data formed the basis for calculating both DALYsaverted and CYPs. CYPs were calculated using the 2011USAID conversion factors specific to each family planningmethod, called CYP coefficients in this paper [12].To apply DALYs averted to franchised program ser-
vices, we adopted the most widely used tools for estimat-ing the number of DALYs averted from service deliverydata that we are aware of, the health impact estimationmodels used by PSI. PSI’s DALYs averted models areappealing for this analysis because of their breadth: thesemodels provide an estimate of per-unit impact of 44 dif-ferent service and product interventions, many of whichare offered by social franchisors and used in the LMICs
where most social franchising programs are currentlylocated. Therefore, the country- and service-specificDALYs averted coefficients produced by these modelscan be easily applied to multiple social franchises, regard-less of their program affiliation.To estimate DALYs averted, we multiplied the appro-
priate PSI DALYs averted country- and service-specificcoefficients to the service delivery data reported by thesocial franchising program of interest. For example, theBangladesh DALYs averted coefficients were used fordetermining the number of DALYs averted by each ofthe services offered by the Blue Star Bangladesh socialfranchise. Once DALYs averted were calculated for eachservice reported, we totalled all of them to produce anaggregated estimate of the number of DALYs avertedfor that social franchising program in either 2010 or2011.Among the full dataset reported to the Social Fran-
chising Compendium, certain services could not bepaired with coefficients for estimating DALYs avertedbecause of one of the following reasons: PSI did nothave a DALYs averted model for the intervention; thePSI model did not include country data for the countrywhere the intervention was reported; or the social fran-chise program reported insufficient information, prohi-biting the pairing of the service with a DALYs avertedcoefficient. Additional file 2 presents the full set ofinterventions reported by social franchising networks.Note that most, but not all, of these interventions couldbe matched to a country- and intervention-specific coef-ficient to estimate DALYs averted. All of the familyplanning methods offered by social franchisors could beconverted to CYPs.A total of 58 social franchising networks reported data
to the Social Franchising Compendium for the years 2010and 2011, with 50 programs reporting data in 2010 [11]and 51 programs doing so in 2011 [8]. Spanning threecontinents and 36 countries, these social franchising net-works vary in age and size, with Asian networks being theoldest and largest. The oldest network is Sangini Franchis-ing, launched in Nepal in 1994, while the youngest fivenetworks were launched in 2011 in Laos, Mozambique,Sudan, Nicaragua, and Somaliland. Sub-Saharan Africahas the largest number of social franchising programswhereas Latin America has the fewest.Fifty-one programs provided sufficient service delivery
data to enable the calculation of DALYs averted or CYPsprovided for 2010 or 2011. For the statistical analysis, weincluded only those programs from this sample which pro-vided data for both years (N = 32). Half of these (16 pro-grams) are controlled by or affiliated with PSI. Theremaining half are either affiliated with MSI (6 programs),the US-based NGO, DKT International (1 program), orare independent (9 programs), meaning they are
Montagu et al. BMC Public Health 2013, 13(Suppl 2):S4http://www.biomedcentral.com/1471-2458/13/S2/S4
Page 5 of 12
unaffiliated with an international NGO but may be linkedto a local NGO or private organization within the country.While most of the non-PSI programs deliver healthcare inthe same countries where PSI works, social franchisingprograms are also included from five countries where PSIis not present: Bangladesh, Indonesia, Peru, the Philip-pines, and Sierra Leone.
Data adjustmentsCertain non-PSI program data required some data extra-polation before we could derive the number of DALYsaverted based on PSI’s coefficients. For the five countrieswhere PSI does not currently work (and therefore, wherePSI has not yet determined country-specific coefficientsfor each health intervention), we needed to infer the valueof the DALYs averted coefficients for that country. To doso, we applied the average of the intervention coefficientfrom countries in the same WHO region with a per-capitagross domestic product (GDP) within 300% of the non-PSI country. For example, to determine the Philippinescoefficients, we used an average of those developed by PSIfor Vietnam, Laos, and Cambodia. Once we identified thecoefficients for each of these countries, we followed theprocess described above for calculating DALYs averted forthe social franchising programs in these five countries.We also needed to adjust non-PSI program data to fit
the parameters used in PSI’s DALYs averted models whenthe reported data relied on different treatment indicatorsor different services than those modelled. To make theseadjustments, we first compared the products and servicescurrently covered by PSI’s DALYs averted models to thosedispensed by non-PSI social franchises. Nine of the non-PSI programs reported the number of TB cases initiatedon treatment rather than the number of TB cases com-pleting treatment, a key distinction in the parameter usedby the PSI TB DALYs averted model. Published correla-tions between reported outcomes (e.g., initiation of TBtreatment) and outcomes needed for the DALYs avertedmodel (e.g., treatment completion) guided the extrapola-tion of estimates for the non-PSI programs. We estimatedcompletion rates using an average of 89.6% of TB treat-ment initiations, based on a WHO-led meta-analysis ofpublic-private TB initiatives [26].In one instance, we adjusted data by excluding data in
one year because the data did not match the criteriarequired by the models. The PSI HIV Counseling andTesting (HCT) DALYs averted model for HIV counselingand testing distinguishes between six categories of patientsreceiving HIV voluntary counseling and testing services:HIV-negative and single; HIV-positive and single; HIV-negative in a concordant couple; HIV-positive in a concor-dant couple; HIV-negative in a discordant couple; andHIV-positive in a discordant couple. As non-PSI programsdid not collect data on partner status in 2010, our analysis
excluded their reported HCT data. We included thesedata from 2011, as a more detailed survey instrumentrecorded partner status from HCT client interactions.A final set of adjustments concerned those non-PSI
social franchising programs which dispensed products orservices that are not currently supported by PSI’s DALYsaverted models. Examples of such services include laborand delivery, pediatric consultations, menstrual regulationservices, and vaccinations. These products and serviceswere not included in our analysis.
Comparisons across years and regionsSocial franchise networks were analyzed by size basedon the number of outlets that were reported for eachyear. We used ANOVA to compare the average size offranchises across the regions.We compared the sum of each of the metrics - ser-
vices provided, DALYs averted, CYPs, and patientvolume - for 2010 and 2011 for all of the social fran-chise programs reporting in each year and by region.We report the percent change from 2010 to 2011 foreach of these metrics, including the changes by region.For statistical analysis, we used a paired t-test to detectdifferences in the metrics as reported across the twoyears by each of the social franchising networks. Thistest was intended to identify a common shift towardeither increased or decreased output among those net-works reporting data in both 2010 and 2011 (N = 32)for each metric. To understand the overall percentchange for family planning and non-family planning ser-vices, we isolated services related to family planningfrom the programs reporting these data in both years (n= 30), summing up each of the metrics and consideringthe percent change over the two years. For statisticalanalysis, we again used a paired t-test to identify com-mon differences year to year. We followed the sameprocedure for analyzing non-family planning services.Nineteen franchises were compared in the paired t-test.In addition, we aggregated DALYs averted within pro-
gram areas by region. All services were categorized intoone of the following major program areas: family planning,sexual and reproductive health, maternal and child health,HIV/AIDS, malaria, diarrhea, acute respiratory disease,and tuberculosis.To check reporting quality, we compared services pro-
vided to patient volume using a Pearson’s correlationcoefficient. Certainly, a weak relationship between ser-vices provided and the number of patient visits may notalways indicate poor reporting. The relationship betweenthese two metrics could be weak if different franchisenetworks offer different numbers of integrated servicesper patient. Moreover, it is worth noting that the unit ofservice may vary across interventions. For example, ayear’s supply of oral contraceptives would be counted as
Montagu et al. BMC Public Health 2013, 13(Suppl 2):S4http://www.biomedcentral.com/1471-2458/13/S2/S4
Page 6 of 12
13 services whereas one IUD would be counted as a sin-gle service, even though it is expected to protect againstunintended pregnancy for longer than a year. Type ofservice, therefore, may affect the ratio between servicesprovided and patient volume.
ResultsDescription of sample for analysisThirty-two franchise networks were represented in theset of services for which DALYs averted or CYPs pro-vided could be calculated for the years 2010 and 2011.Networks included in the analysis represented 23 coun-tries. Over the two years, these franchises reported1,121,352,473 services provided through 22,941,811patient visits. Additional file 3 shows a summary ofreported data for all franchise networks in the analysis.
Size of social franchising networks by regionFranchise networks in Asia tended to be larger than theircounterparts in Latin America and Africa. On average, thenumber of outlets was different across the three regionsfor both years (ANOVA, p < .05). Asian social franchiseprograms had an average of 2,708 outlets across franchisenetworks in 2010. For the same year, Latin America hadan average of 606 outlets and Africa had an average of 114outlets. Number of outlets was not significantly differentin 2011 compared to 2010 for any of the regions.
Changes across the social franchising networks,2010 to 2011The years, 2010 to 2011, saw growth in social franchisingacross the set of networks, measured by output andimpact. During this time, the services provided increasedby 215% across the 32 franchise networks (Table 1). Asiaand Africa saw considerable growth, 245% and 189%respectively, although African networks reported fewerthan half the number of services provided overall com-pared to the Asian networks. For the 32 networks, thenumber of patient visits increased by 31% and CYPs roseby 86% over the two years. The number of DALYs avertedgrew by 519% across the full set of networks, with varia-tion by region. African franchise networks reported thegreatest change in DALYs averted, a 538% increase.Latin America experienced a decline in services provided
which also produced a decline in DALYs averted andCYPs. With just three countries (El Salvador, Guatemala,and Peru) offering small family planning programs, thisregion’s social franchise programs are limited in size andscope, making its aggregate health impact results sensitiveto shifts in individual programs, or program reporting. Inthis case, the exclusion of Guatemala’s non-franchise con-dom distribution efforts, inappropriately included in 2010,reduced the number of DALYs averted in Latin Americaby two-thirds in 2011.
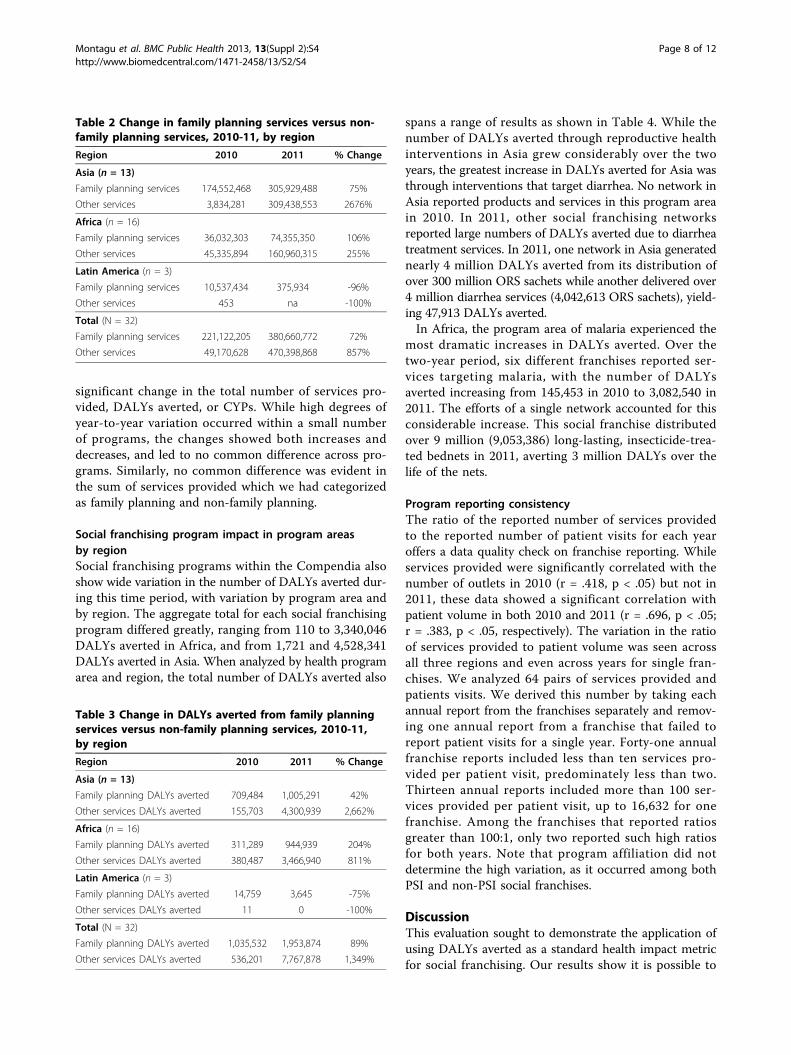
Over the two years, services in the franchise networksdiversified; non-family planning services increased by857% (Table 2). While these diverse types of interventionscomprised 18% of the reported services provided in 2010,this percentage more than doubled in 2011 to 55% of theservices provided by the franchises. Asian franchise net-works saw the greatest increase in non-family planningservices, from just 2% of the services reported for 2010 to50% in 2011. African social franchising programs initiallyoffered more diversity in its service portfolio than otherregions, reporting a higher percentage of non-family plan-ning services in 2010, 56%. Even so, these African net-works still continued to diversify in 2011, increasing to68%. Latin American social franchising programs werealmost exclusively focused on family planning in bothyears. The change in DALYs averted by these services cor-responded to the differences shown in the changes in ser-vices provided (Table 3). Note that the magnitude ofchange varies because each country’s burden of disease isfactored into the calculation of DALYs averted.
Significance of program output and impact changes,2010-2011In paired t-tests comparing the output and impactmetrics from the 32 social franchise programs thatreported sufficient data for both years, we did not detect
Table 1 Change in number of services provided, DALYsaverted, CYPs, and patient volume for products andservices eligible for analysis, 2010-11, by region
Region 2010 2011 % Change
Asia (n = 13)
Services provided 178,386,749 615,368,041 245%
DALYs averted 865,187 5,306,229 513%
CYPs 5,749,247 7,934,530 38%
Patient volume 7,605,797 10,149,492 33%
Africa (n = 16)
Services provided 81,368,197 235,315,665 189%
DALYs averted 691,776 4,411,879 538%
CYPs 892,064 4,693,329 426%
Patient volume 1,698,731 2,235,235 32%
Latin America (n = 3)
Services provided 10,537,887 375,934 -96%
DALYs averted 14,770 3,645 -75%
CYPs 183,640 90,854 -54%
Patient volume 626,376 626,278 0%
Total (N = 32)
Services provided 270,292,833 851,059,640 215%
DALYs averted 1,571,733 9,721,752 519%
CYPs 6,824,951 12,718,714 86%
Patient volume 9,930,806 13,011,005 31%
Montagu et al. BMC Public Health 2013, 13(Suppl 2):S4http://www.biomedcentral.com/1471-2458/13/S2/S4
Page 7 of 12
significant change in the total number of services pro-vided, DALYs averted, or CYPs. While high degrees ofyear-to-year variation occurred within a small numberof programs, the changes showed both increases anddecreases, and led to no common difference across pro-grams. Similarly, no common difference was evident inthe sum of services provided which we had categorizedas family planning and non-family planning.
Social franchising program impact in program areasby regionSocial franchising programs within the Compendia alsoshow wide variation in the number of DALYs averted dur-ing this time period, with variation by program area andby region. The aggregate total for each social franchisingprogram differed greatly, ranging from 110 to 3,340,046DALYs averted in Africa, and from 1,721 and 4,528,341DALYs averted in Asia. When analyzed by health programarea and region, the total number of DALYs averted also
spans a range of results as shown in Table 4. While thenumber of DALYs averted through reproductive healthinterventions in Asia grew considerably over the twoyears, the greatest increase in DALYs averted for Asia wasthrough interventions that target diarrhea. No network inAsia reported products and services in this program areain 2010. In 2011, other social franchising networksreported large numbers of DALYs averted due to diarrheatreatment services. In 2011, one network in Asia generatednearly 4 million DALYs averted from its distribution ofover 300 million ORS sachets while another delivered over4 million diarrhea services (4,042,613 ORS sachets), yield-ing 47,913 DALYs averted.In Africa, the program area of malaria experienced the
most dramatic increases in DALYs averted. Over thetwo-year period, six different franchises reported ser-vices targeting malaria, with the number of DALYsaverted increasing from 145,453 in 2010 to 3,082,540 in2011. The efforts of a single network accounted for thisconsiderable increase. This social franchise distributedover 9 million (9,053,386) long-lasting, insecticide-trea-ted bednets in 2011, averting 3 million DALYs over thelife of the nets.
Program reporting consistencyThe ratio of the reported number of services providedto the reported number of patient visits for each yearoffers a data quality check on franchise reporting. Whileservices provided were significantly correlated with thenumber of outlets in 2010 (r = .418, p < .05) but not in2011, these data showed a significant correlation withpatient volume in both 2010 and 2011 (r = .696, p < .05;r = .383, p < .05, respectively). The variation in the ratioof services provided to patient volume was seen acrossall three regions and even across years for single fran-chises. We analyzed 64 pairs of services provided andpatients visits. We derived this number by taking eachannual report from the franchises separately and remov-ing one annual report from a franchise that failed toreport patient visits for a single year. Forty-one annualfranchise reports included less than ten services pro-vided per patient visit, predominately less than two.Thirteen annual reports included more than 100 ser-vices provided per patient visit, up to 16,632 for onefranchise. Among the franchises that reported ratiosgreater than 100:1, only two reported such high ratiosfor both years. Note that program affiliation did notdetermine the high variation, as it occurred among bothPSI and non-PSI social franchises.
DiscussionThis evaluation sought to demonstrate the application ofusing DALYs averted as a standard health impact metricfor social franchising. Our results show it is possible to
Table 2 Change in family planning services versus non-family planning services, 2010-11, by region
Region 2010 2011 % Change
Asia (n = 13)
Family planning services 174,552,468 305,929,488 75%
Other services 3,834,281 309,438,553 2676%
Africa (n = 16)
Family planning services 36,032,303 74,355,350 106%
Other services 45,335,894 160,960,315 255%
Latin America (n = 3)
Family planning services 10,537,434 375,934 -96%
Other services 453 na -100%
Total (N = 32)
Family planning services 221,122,205 380,660,772 72%
Other services 49,170,628 470,398,868 857%
Table 3 Change in DALYs averted from family planningservices versus non-family planning services, 2010-11,by region
Region 2010 2011 % Change
Asia (n = 13)
Family planning DALYs averted 709,484 1,005,291 42%
Other services DALYs averted 155,703 4,300,939 2,662%
Africa (n = 16)
Family planning DALYs averted 311,289 944,939 204%
Other services DALYs averted 380,487 3,466,940 811%
Latin America (n = 3)
Family planning DALYs averted 14,759 3,645 -75%
Other services DALYs averted 11 0 -100%
Total (N = 32)
Family planning DALYs averted 1,035,532 1,953,874 89%
Other services DALYs averted 536,201 7,767,878 1,349%
Montagu et al. BMC Public Health 2013, 13(Suppl 2):S4http://www.biomedcentral.com/1471-2458/13/S2/S4
Page 8 of 12
apply a metric based on the DALY to service deliverydata from multiple social franchising programs, whetherDALYs averted is a new metric for these programs ornot. As calculation of the DALYs averted metric justrequires social franchise service delivery data as well assufficient data on disease burden for a country, the PSIDALYs averted models could be applied to non-PSIsocial franchise data. In some cases, we could not esti-mate DALYs averted because we did not have sufficientinformation reported on a franchise program’s interven-tions, such as the number of services provided or whatspecific disease was targeted. In other cases, we lackedcountry-specific data, such as disease prevalence, andalso could not estimate DALYs averted. However, mostsocial franchises in the Social Franchising Compendiaappear to report sufficient detail in service delivery data,and operate in countries in which disease burden dataare available. Therefore, as demonstrated, the conversionof this service delivery data into DALYs averted is feasi-ble for global social franchising programs.Our findings also support the theoretical basis for adopt-
ing DALYs averted as a summary measure of programhealth impact: this new metric can be applied to projecthealth impact across a range of products and services.While patient volume and number of outlets are impor-tant process metrics for tracking program progress, theydo not indicate health impact. The CYP metric, whilecommonly understood as a comprehensive measure ofprogram impact unlike these process measures, is actuallybased on intervention protection and is not context-speci-fic in terms of pregnancy risk in a population. Moreover,the CYP’s measurement is limited to family planning ser-vices. As demonstrated in this study’s analysis of DALYsaverted by service type and program area, many socialfranchising programs offer a diverse mix of services thatcannot be measured by CYPs. Certainly, large numbers ofDALYs averted from 2010-11 can be attributed to familyplanning (likely reflecting the reproductive health origins
of many social franchising programs). However, treatmentand services for health conditions not incorporated inCYPs - but with high importance to current burden of dis-ease [18] and offered by a growing number of social fran-chise programs - are important drivers of DALYs averted.DALYs averted, therefore, enables social franchisors tocapture a diverse array of health services when estimatinghealth impact.On account of this new metric’s wide applicability, the
importance of DALYs averted as a summary measure ofhealth impact may be most notable for social franchisingprograms in which non-family planning services contri-bute significantly to overall treatment numbers. For pro-grams where family planning is the focus of all or nearlyall of the services provided, a shift to DALYs averted islikely to offer only limited improvement in measurementof impact, resulting from the country context adjustmentsin the family planning DALYs averted model. However,given the current trend in LMICs to broaden clinic offer-ings beyond specialized, family planning-only services tomore integrated and comprehensive care, the benefit ofusing DALYs averted as the standard health impact metricfor social franchising is likely to grow in the future.In addition to capturing the impact of clinics offering
diversified services, the adoption of DALYs averted offersbenefits for social franchisors and their stakeholders inprogrammatic decision making. When tracking ongoingprogress and the overall impact of service delivery, socialfranchisors can calculate, and then compare, DALYsaverted at different levels of the network structure. Forexample, they can compare impact between individualhealth services, or sum up the DALYs averted from allservices to compare the performance of individual clinicswithin the network. The aggregate health impact estimatealso enables benchmarking of an entire franchise net-work’s performance between programs, countries, andregions, comparisons that are currently only possible insocial franchising for family planning impact. As the
Table 4 DALYs averted from social franchise program service delivery, 2010-11, by program area and region
Program Area DALYs Averted by AsianPrograms
DALYs Averted byAfrican Programs
DALYs Averted by LatinAmerican Programs
DALYs Averted by AllFranchises
2010(n = 13)
2011(n = 13)
2010(n = 16)
2011(n = 16)
2010(n = 3)
2011(n = 4)
2010(N = 32)
2011(N = 32)
Family Planning 709,484 1,005,291 311,289 944,939 14,759 3,645 1,035,532 1,953,874
Sexual and Reproductive Health 38,161 32,865 66,354 184,235 11 104,527 217,100
Total DALYs averted 865,187 5,306,229 691,776 4,411,878 14,770 3,645 1,571,733 9,721,752
Montagu et al. BMC Public Health 2013, 13(Suppl 2):S4http://www.biomedcentral.com/1471-2458/13/S2/S4
Page 9 of 12
DALYs averted metric incorporates disease burden - andthus, population need - into its impact estimates, socialfranchisors can use DALYs averted data to help deter-mine which services to emphasize in a particular catch-ment area, country, or region. While service delivery datacan show demand, the potential number of DALYsaverted is a better indicator of health needs, and ulti-mately, health impact.The DALYs averted metric can also be interpreted
alongside other data to reflect program aims and values.The cost per DALY averted is a common indicator ofcost-effectiveness. With cost data from a franchising net-work or for outlets within a franchise, franchise managerscan drive toward increased efficiency. A franchise-specificnet cost per DALY averted can help social franchisorsand stakeholders better consider the opportunities andtrade-offs of specific service delivery interventions, lead-ing to greater optimization of care.
LimitationsDeriving DALYs averted relies on complete and accurateservice delivery data, the key limitation of this study. Wefound evidence of inconsistent service outcome reportingin approximately 10% of programs. Certainly, errors inprogram reporting are likely present in all health impactmeasures, making cross-program comparisons inherentlychallenging. We believe these comparisons are neverthe-less still worth attempting. This analysis, and our pastexperience with many programs, gives us no reason tobelieve there is systematic and intentional misrepresenta-tion of service delivery information. Rather, as the SocialFranchising Compendia aims to include all clinic servicesprovided by its member networks, reporting variationsare likely due to poor specification of what data need tobe collected.One implication of the variability identified, however, is
that the changes identified through our analysis of 2010-2011 data in DALYs averted and patients seen should beinterpreted as indicative rather than absolute. The varia-bility seen here is indicative of changes in the applicationof franchising as a delivery platform worldwide, ratherthan changes within specific programs.Likewise, confusion about the distinction between those
health services provided through social franchising versussocial marketing distribution channels also persists. Theservices provided by social franchising programs areclinic-based and include clinical interventions, counseling,and commodity sales. Many clinical interventions, such asIUD insertions, involve one service provided during a sin-gle patient visit. Many commodity sales (condoms, cyclesof contraceptive pills, or others) could involve large num-bers of ‘services’ provided during a single patient visit.Social marketing is based on commodities only. Whilesocial marketing interventions will often involve the same
commodities as those in social franchising, these productsare usually delivered through non-clinic retail outlets anddo not involve patient visits. Despite differences in deliverymodality, the two intervention approaches use relatedmarket-based models, leading many implementing organi-zations to operate both, often with the two delivery sys-tems sharing the same overall brand of commodities (e.g.,PSI’s PUR water treatment product to prevent diarrhea).As a result, confusion in reporting is likely to occur, as
suggested by the data used in this study. One notableexample of these reporting errors can be seen in someoutlier data on commodity sales. In both 2010 and 2011,some social franchising programs stand out as havingexceptionally high rates of commodity sales - primarilyanti-malarial bednets (LLINs), ORS, and condoms - result-ing in some of the highest DALYs averted numbers fromindividual services in our study, as well as year-on-yearvolatility in the data. For example, one program in Africaserving approximately 700,000 patients reported the distri-bution of over 9 million LLINs in a single year. Anotherprogram, treating 1.27 million patients in Asia, noted thatit delivered over 300 million ORS sachets one year, over250 sachets per patient. Such high figures suggest that anumber of programs are erroneously including non-clinicretail outlet social marketing distribution figures in theirsocial franchising reporting, as we know was the case for aPSI Guatemala program in 2010 that erroneously includednon-clinic condom sales in its service delivery data. More-over, this high year-to-year variation in commodity salesoccurs while the number of patient visits remains stable.The high ratios of services to patient volume, particularlythose programs with 50:1 or even 16,000:1 ratios, are likelydue to an amalgamation of social marketing and socialfranchising outputs when reporting. Clearer guidelines onthe collection and reporting of service delivery data,including how to distinguish between commodities deliv-ered via social franchising versus social marketing chan-nels, are needed to minimize reporting errors in thefuture. Follow up with outlier programs will also bebeneficial.Another limitation of our analysis is that a number of
medical services remain uncounted in our DALYsaverted metric, notably antenatal care and safe deliveries.This omission under-credits social franchising programsdelivering these services in terms of health impact. IfDALYs averted is to become more widely used in socialfranchising, new DALYs averted models must be devel-oped for these services.This study is also limited by the models themselves as
well as the data fed into them. Determining the numberof DALYs averted by an intervention is difficult, requiringcomplex modeling of the specific burden of disease ineach country, and of the effectiveness and health out-comes of each intervention. To create these models,
Montagu et al. BMC Public Health 2013, 13(Suppl 2):S4http://www.biomedcentral.com/1471-2458/13/S2/S4
Page 10 of 12
accurate treatment data and population information areessential, yet sometimes challenging to obtain in theLMIC settings where this metric is applied. PSI needs touse proxies and best estimates for some model para-meters such as treatment use and wastage, as well asextrapolate population data from nearby countries whenlocal data are unavailable. In addition, development andmaintenance of the models has required a considerableinvestment by PSI. Moving to a broader set of interven-tions and pressure to develop new models has sometimescompromised the maintenance of models that need to beupdated continuously.
ConclusionDespite more than a decade of the global health com-munity using DALYs as a measurement of disease bur-den, the application of this metric for projecting healthprogram impact is still in its nascent stages. For therapidly emerging social franchise service delivery model,our analysis finds a strong theoretical basis for adoptingDALYs averted as its program impact metric. DALYsaverted is likely to be the most inclusive and compre-hensive measurement available, enabling inter- andintra-program comparisons for tracking program pro-gress and guiding strategic planning and programdesign. In theory as well as in practice, DALYs avertedcaptures the impact of a wide range of health care ser-vices, not limited to the delivery of family planningmethods, and thus best represents the breadth of careand treatment offered by a majority of social franchiseprograms. Our analysis supports this conclusion, evenwhile we found that the application of the DALYsaverted remains problematic given current challenges indata reporting and the burden of expanding modeldevelopment.The social franchising community of practice offers a
useful forum to pilot the DALYs averted metric as a stan-dardized measure for service delivery programs managedby multiple implementing organizations. First, the diver-sity of health services offered by social franchisorsenables opportunities for learning how to best measureprogram impact in different program areas. Second, theestablished platform for collaboration and transparentdata sharing provides a forum, such as that found in theSocial Franchising Compendia, for improving andstreamlining data management systems. Certainly, con-siderable work still needs to be done to assure that ser-vice delivery data collected by programs are based onshared parameters and are not subject to the vagaries ofinterpretation during data entry as appears to haveoccurred in 2010 and 2011. Motivated by shared interestsand the attraction of collaborative work, members of thesocial franchising community are currently collaboratingon developing standards to address these reporting
issues. Once this process is accomplished, we expectthe social franchising community of practice to be well-positioned to begin using, and eventually standardizing,DALYs averted as its metric for estimating programmatichealth impact in all service areas.
Additional material
Additional file 1: Description of all social franchising networks inSocial Franchising Compendia, 2011. This table provides a profile ofeach social franchising network that is a member of the SocialFranchising Compendia.
Additional file 2: Reported services corresponding to program areasfrom all social franchising networks. This table lists each of the healthservices reported by all of the social franchising networks, arranged byprogram area.
Additional file 3: Change in program output and impact data,2010-11. This file shows the change in program outputs and impactsfrom 2010 to 2011 among the 32 social franchising programs reportingdata for both years of interest.
List of abbreviationsDALYs: disability-adjusted life-years; CYPs: couple-years of protection; LMICs:low- and middle-income countries; NGO: non-governmental organization;TB: tuberculosis; HIV/AIDS: human immunodeficiency virus/acute immunedeficiency syndrome; PSI: Population Services International; MSI: Marie StopesInternational; UCSF: University of California - San Francisco; WHO: WorldHealth Organization; IUD: intrauterine device; ORS: oral rehydration salts;LLINs: long-lasting, insecticide-treated nets; PDF: Portable Document Format;USAID: United States Agency for International Development; LAM: LactationAmenorrheal Method; CAC: comprehensive abortion care; MVA: manualvacuum aspiration; CDK: clean delivery kit; PMTCT: prevention of mother-to-child transmission of HIV; ITN: insecticide-treated net; RDK: rapid diagnostickit; RDT: rapid diagnostic testing; ACT: artemisinin-based combinationtherapy; GDP: gross domestic product; HCT: HIV counseling and testing
Authors’ contributionsDM conceived of the analysis and wrote the first draft. LN led theadaptation of the DALYs averted models to the social franchising data andconducted the primary analysis. SD reviewed findings, advised oninterpretation, and led the rewriting of the second draft. AR conducted thesub-analysis. AR and LN wrote the findings. All authors contributed equallyto the background, interpretation, and discussion. All authors read andapproved the final manuscript.
Competing interestsThe authors declare that they have no competing interests.
AcknowledgementsThe application of the DALYs averted models to social franchising data andthe development of this paper have been made possible in part by fundingfrom Population Services International. The collection of data for the SocialFranchising Compendium was possible through funding from theRockefeller Foundation. We would like to thank all of those who providedinput while developing the analysis. We would also like to thank the manysocial franchises around the world that contributed their data and theirinsights to this work, and whose representatives are active members of theSocial Franchising Community of Practice. Finally, we are grateful to KimLongfield, May Sudhinaraset, and other colleagues at Population ServicesInternational and the University of California San Francisco for reviewingdrafts of this paper.
DeclarationsThis article is part of the supplement of BMC Public Health Volume 13,Supplement 2, 2013: Use of health impact metrics for programmatic
Montagu et al. BMC Public Health 2013, 13(Suppl 2):S4http://www.biomedcentral.com/1471-2458/13/S2/S4
decision making in global health. Population Services International, aregistered non-profit organization, provided the funding for the publicationof this supplement. The full contents of the supplement are available onlineat http://www.biomedcentral.com/bmcpublichealth/supplements/13/S2.
Author details1Global Health Group, University of California San Francisco, CA, USA.2Population Services International, Washington DC, USA. 3Independentglobal health consultant, Seattle, WA, USA.
Published: 17 June 2013
References1. Bustreo F, Harding A, Axelsson H: Can developing countries achieve
adequate improvements in child health outcomes without engaging theprivate sector? WHO Bulletin 2003, 81:886-895.
2. Montagu D: Franchising of health services in low-income countries.Health Policy Plann 2002, 17(2):121-30.
3. Beyeler N, De La Cruz AY, Montagu D: The impact of clinical socialfranchising on health services in low- and middle-income countries: asystematic review. PLoS One 2013, 8(4):e60669, doi:10.1371/journal.pone.0060669.
4. Koehlmoos TP, Gazi R, Hossain J, Rashidi T: Social franchising evaluation: ascoping review London: EPPI-Center, Social Science Research Unit, Instituteof Education, University of London; 2011.
5. Montagu D, Berman P, Goodman CA, Visconti A: Working with the privatesector to improve basic healthcare: a review of evidence andinterventions. Presentation at the 2012 Health Systems Research Symposium;Beijing.
6. Montagu D: Franchising of family planning and reproductive healthservices in developing countries. PhD thesis University of CaliforniaBerkeley, School of Public Health; 2002.
7. O’Connell K, Hom M, Aung T, Theuss M, Huntington D: Using and joininga franchised private sector provider network in Myanmar. PLoS One 2011,6:e28364.
8. Schlein K, Montagu D: Clinical social franchising compendium: an annualsurvey of programs San Francisco: University of California San Francisco;2012.
9. Population Services International Social Franchising: Ensuring QualityHealth Care Coverage in the Developing World. [http://www.psi.org/social-franchising-solution-inadequate-health-care-coverage-developing-world].
10. Marie Stopes International. Social Franchising. [http://www.mariestopes.org/what-we-do/social-franchising].
11. Schlein K, Drasser K, Montagu D: Clinical social franchising compendium: anannual survey of programs San Francisco: University of California SanFrancisco; 2011.
12. United States Agency for International Development Couple Years ofProtection. [http://transition.usaid.gov/our_work/global_health/pop/techareas/cyp.html].
13. Glasgow RE, Klesges LM, Dzewaltowski DA, Estabrooks PA, Vogt TM:Evaluating the impact of health promotion programs: using the RE-AIMframework to form summary measures for decision making involvingcomplex issues. Health Educ Res 2006, 21:688-694.
14. Davies SM, Geppert J, McClellan M, McDonald KM, Romano PS, Shojania KG:Refinement of the HCUP quality indicators Rockville (MD): Agency forHealthcare Research and Quality (US); 2001.
15. The Global Fund: Performance Based Funding. [http://www.theglobalfund.org/en/activities/pbf/].
16. Department for International Development: Research and Evidence.[http://www.dfid.gov.uk/What-we-do/Research-and-evidence].
17. US Agency for International Development: Performance-basedIncentives Primer for USAID Missions. [http://pdf.usaid.gov/pdf_docs/PNADX747.pdf].
18. The World Bank: Program-for-Results Financing. [http://web.worldbank.org/WBSITE/EXTERNAL/PROJECTS/0,,contentMDK:23215867~pagePK:41367~piPK:51533~theSitePK:40941,00.html].
19. Murray CJ: Quantifying the burden of disease: the technical basis fordisability-adjusted life years. Bull World Health Organ 1994, 72:429-445.
20. Murray CJ, Lopez AD: Quantifying disability: data, methods and results.Bull World Health Organ 1994, 72:481-494.
21. Lopez AD, Mathers CD, Ezzati M, Jamison DT, Murray CJL: Measuring theGlobal Burden of Disease and risk factors, 1990-2001. In Global Burden ofDisease and Risk Factors. Washington, DC: World Bank;Lopez AD, MathersCD, Ezzati M, Jamison DT, Murray CJL 2006:1-13.
22. Murray CJ, Lopez AD, Jamison DT: The global burden of disease in 1990:summary results, sensitivity analysis and future directions. Bull WorldHealth Organ 1994, 72(3):495-509.
23. Population Services International DALY FAQ 2012. [http://www.psi.org/resources/disability-adjusted-life-years-dalys/daly-faq].
24. Yang H, Duvall S, Ratcliffe A, Jeffries D, Stevens W: Modeling health impactof global health programs implemented by Population ServicesInternational. BMC Public Health 2013, 13(Suppl 2):S3.
25. Longfield K, Smith B, Gray R, Ngamkitpaiboon L, Vielot N: Putting healthmetrics into practice: using the disability-adjusted life year for strategicdecision making. BMC Public Health 2013, 13(Suppl 2):S2.
26. Lonnroth K, Uplekar M, Blanc L: Hard gains through soft contracts:productive engagement of private providers in tuberculosis control. BullWorld Health Organ 2006, 84:876-883.
doi:10.1186/1471-2458-13-S2-S4Cite this article as: Montagu et al.: Applying the disability-adjusted lifeyear to track health impact of social franchise programs in low- andmiddle-income countries. BMC Public Health 2013 13(Suppl 2):S4.
Submit your next manuscript to BioMed Centraland take full advantage of:
• Convenient online submission
• Thorough peer review
• No space constraints or color figure charges
• Immediate publication on acceptance
• Inclusion in PubMed, CAS, Scopus and Google Scholar
• Research which is freely available for redistribution
Submit your manuscript at www.biomedcentral.com/submit
Montagu et al. BMC Public Health 2013, 13(Suppl 2):S4http://www.biomedcentral.com/1471-2458/13/S2/S4