Page 1
APPLYING THE POSITIVE DEVIANCE MODEL IN
ETHIOPIA: THE MENTOR MOTHER PROJECT AND
ITS IMPACT ON CHILDHOOD MALNUTRITION IN
HOLETA
Tsedey A. Tamir
Master’s thesis
Public Health
School of Medicine
Faculty of Health Sciences
University of Eastern Finland
May 2017
Page 2
2
UNIVERSITY OF EASTERN FINLAND, Faculty of Health Sciences
Public Health
TAMIR, Tsedey A.: Applying the positive deviance model in Ethiopia: The Mentor Mother
project and its impact on childhood malnutrition in Holeta
Master’s thesis, 66 pages
Supervisors: Adjunct Professor, Arja Erkkilä, PhD, Sohaib Khan, MBBS, MPH, PHD
May 2017
Key words: childhood malnutrition, positive deviance, peer education
APPLYING THE POSITIVE DEVIANCE MODEL IN ETHIOPIA: THE MENTOR
MOTHER PROJECT AND ITS IMPACT ON CHILDHOOD MALNUTRITION IN
HOLETA
Malnutrition is responsible for more than 1/3 of deaths among young children in the world
and Ethiopia is one of the most severely affected countries. The main objective of this study
was to examine the determinants of weight-for-age Z score as well as the success of a
behavioural change program in decreasing the number of underweight children using
monthly records of weight measurements. The study was conducted using data from the
Mentor Mother Program in Holeta, Ethiopia, running since 2014. It aims to enhance access to
preventive and rehabilitative health and antenatal care among women and children under 5
through a wide scope of interventions in maternal and child health, family planning,
environmental sanitation and personal hygiene.
Altogether 262 participants were included in the study of which 107 were boys and 155 were
girls. The Mentor Mothers assigned to the family weighed the children and collected
information on socio-economic status, health history, environmental and home sanitation
using a questionnaire. The monthly weight-for-age Z scores were calculated using WHO
Growth Standards. Informed by the childhood malnutrition conceptual model proposed by
United Nations Children’s Fund, associations between possible causative factors and
malnutrition were first established and integrated into a linear mixed model. Linear mixed
method analysis was further used to examine variations in weight-for-age Z scores over a
period of 7 months after entry into the program. Sub-group analyses of children who were at
a normal weight and those who were underweight at the time of recruitment were carried out.
The study revealed that the weight-for-age Z score is associated with a number of underlying
and immediate causes such as adequate dietary intake in the form of breast-feeding and
complementary feeding, food security, sanitation and hygiene. Bivariate analyses
demonstrated relationships between higher weight-for-age Z score scores and delivery at a
health center, marital status, less illness frequency in the past month, better breast-feeding
and complementary feeding practices, less food shortages, better environmental sanitation,
better waste disposal and better personal hygiene. Multivariate analyses showed statistically
significant associations between weight-for-age Z score and the children’s personal hygiene,
complementary feeding and food shortages. The longitudinal multivariate analyses suggest
that, in the frame of 7 months, the more time children spent in the intervention, the higher
weight-for-age Z score was. However, the high proportion of children lost to follow-up
signifies that these results have to be interpreted with caution.
Page 3
3
ABBREVIATIONS
ANC Antenatal Care
CBN Community-Based Nutrition
CSA Central Statistical Agency
DHS Demographic Health Survey
EECMY–DASSC Ethiopian Evangelical Church Mekane Yesus - Development
and Social Services Commission
EGST Ethiopian Graduate School of Theology
EHDHS Ethiopian Mini Demographic Health Survey
ENN Emergency Nutrition Network
FAO Food and Agriculture Organization
HEP Health Extension Program
HEW Health Extension Worker
HIV/AIDS Human Immunodeficiency Virus/Acquired Immune Deficiency
Syndrome
IQ Intelligence Quotient
MMs Mentor Mothers
MUAC Mid Upper Arm Circumference
MUDH Ministry of Urban Development and Housing
NNS National Nutrition Strategy
OVC Orphans and Vulnerable Children
PANP Poverty Alleviation and Nutrition Program
Page 4
4
PD Positive Deviance
PISP Projet Intégrée de Santé et de Population
PNC Post-natal Care
SC Save the Children
SD Standard Deviation
STD Sexually Transmitted Disease
SUN Scaling Up Nutrition
TB Tuberculosis
UNICEF United Nations Children's Fund
WASH Water and Sanitation Hygiene
WAZ Weight-for-age Z scores
WHO World Health Organization
Page 5
5
ACKNOWLEDGEMENT
I am most grateful to my supervisors: Adjunct Professor Dr Arja Erkkilä and Dr. Sohaib
Khan, at the Institute of Public Health and Clinical Nutrition (University of Eastern Finland,
Kuopio, Finland) for their guidance and supervision through the process of this thesis.
I am also thankful to Dr Adamu Addissie at the Faculty of Medicine and School of Public
Health,University of Addis Ababa who helped me in identifying this research project and
provided me with a great number of invaluable resources, to Wosen who patiently answered
all my questions and took time out of her busy days to go through the data with me, to the
team at Holeta - both Siyoni and Chaltu - who regularly provided their help and input.
To my friends in the MPH program, Ana, Diana and Lucy, I owe many uplifted days during
the winter.
Last but not least, I want to thank my family (Mom, Gashe, Mickey, Ghion and Priya) whose
steady, firm and loving support gave me the strength needed to complete my thesis.
Page 6
6
CONTENTS
1 INTRODUCTION ............................................................................................................ 9
2 LITERATURE REVIEW .............................................................................................. 11
2.1 Nutritional status and anthropometry .................................................................... 11
2.2 Epidemiology of childhood malnutrition in Ethiopia .............................................. 13
2.3 Aetiology of childhood malnutrition ....................................................................... 15
2.3.1 The UNICEF conceptual model ...................................................................... 15
2.3.2 Immediate causes: the nutrition – infection cycle ......................................... 16
2.3.3 Underlying causes............................................................................................. 18
2.3.4 Macro factors .................................................................................................... 22
2.4 Consequences of childhood malnutrition ..................................................................... 23
2.4.1 Effects of child malnutrition on child development ........................................ 23
2.4.2 Effects of child malnutrition on adult health ................................................... 24
2.5 The Positive Deviance model ......................................................................................... 24
3 THE MENTOR MOTHER PROJECT ........................................................................ 28
4 OBJECTIVES OF THE STUDY .................................................................................. 30
4.1 General objective .................................................................................................... 30
4.2 Specific objectives ................................................................................................... 30
5 MATERIALS AND METHODS ................................................................................... 31
5.1 Study population .................................................................................................... 31
5.2 Data collection ........................................................................................................ 32
5.3 Statistical Analysis ........................................................................................... 33
5.4 Ethical considerations .................................................................................................... 33
6 RESULTS ........................................................................................................................ 35
6.1 Baseline characteristics .......................................................................................... 35
6.2 Malnutrition and immediate/underlying factors ..................................................... 39
6.3 Malnutrition status during the program ................................................................. 43
6.3.1 WAZ in whole study population and sub-groups during the program ....... 43
6.3.2 Determinants of WAZ changes in normal weight children .......................... 45
6.3.3 Determinants of WAZ trends in the whole sample during the program .... 46
6.3.4 Determinants of WAZ changes in underweight children ............................. 47
6.3.5 Characteristics of children with missing weight measurements .................. 48
Page 7
7
7 DISCUSSION .................................................................................................................. 52
7.1 Main Findings ........................................................................................................ 52
7.2 Discussion of findings in relation to other studies ................................................... 53
7.3 Strengths and weaknesses ....................................................................................... 54
7.4 Recommendations ........................................................................................................... 56
8 CONCLUSION ............................................................................................................... 58
9 REFERENCES ............................................................................................................... 59
Page 8
8
LIST OF TABLES
Table 1: General baseline characteristics of mothers .............................................................. 35
Table 2: General baseline characteristics of children at recruitment ....................................... 37
Table 3: Living environment characteristics............................................................................ 38
Table 4: Bivariate associations between immediate/underlying factors and baseline WAZ .. 39
Table 5: Effect size of predictor variables of baseline WAZ (cross-sectional model) ............ 42
Table 6: Descriptive statistics for WAZ during the first 7 months .......................................... 44
Table 7:Effect size of fixed factors in the longitudinal model................................................. 46
Table 8: Effect size of fixed factors in longitudinal model of normal weight children ........... 47
Table 9: Effect size of fixed factors in longitudinal model of underweight children ............. 48
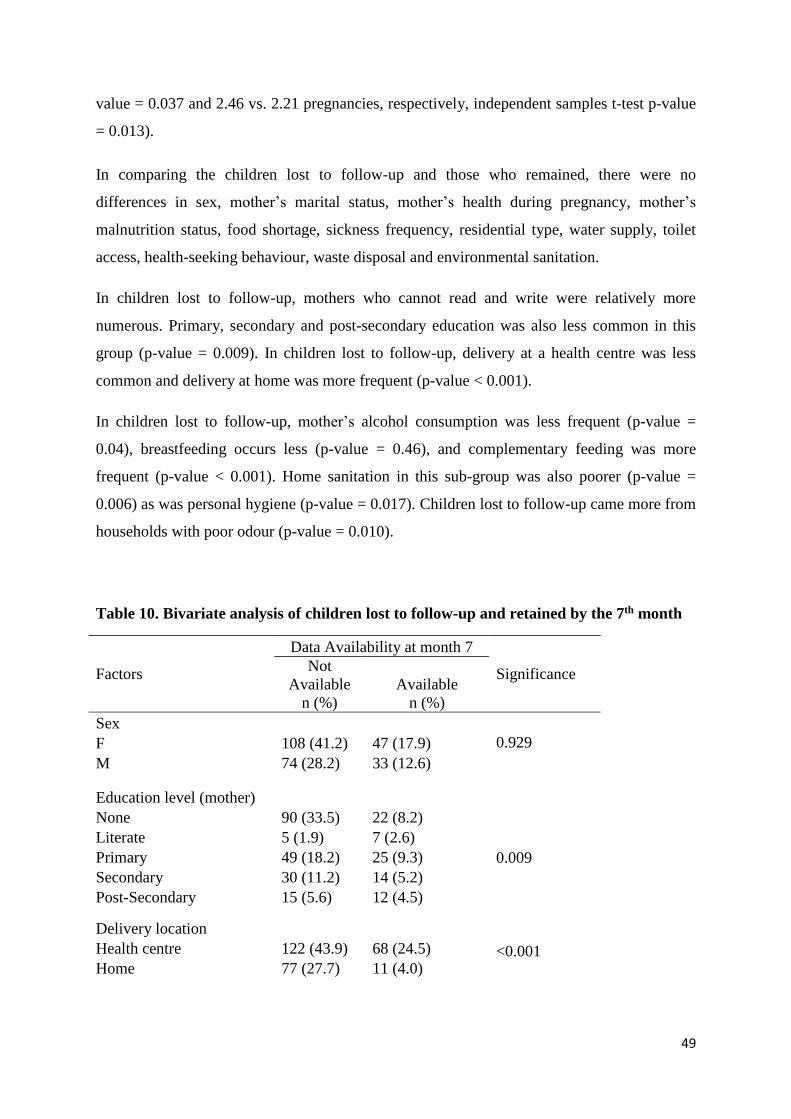
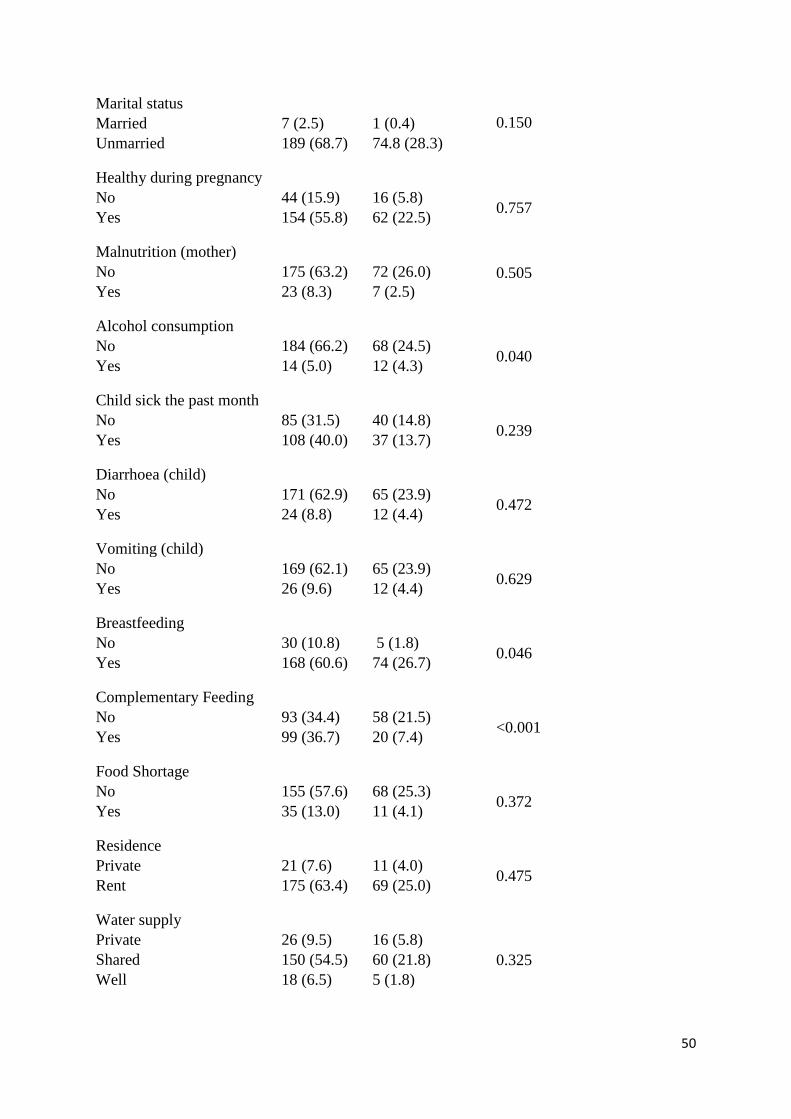
Table 10: Bivariate analysis of children lost to follow-up and retained by month 7 ............... 49
Page 9
9
1 INTRODUCTION
Malnutrition is responsible for more than 1/3 of deaths among young children in the world
(WHO 2015) and, according to the United Nations Children’s Fund (UNICEF), Ethiopia is
one of the most undernourished countries with 28% of all the child mortality in the country
associated with undernutrition (2015). Although the numbers have improved over recent
years as shown by the Demographic Health Study (Central Statistical Agency 2012), the
more recent 2014 Ethiopian Mini Demographic Health Survey (EHDHS) found that more
than 2 out of every 5 children under the age of 5 were stunted and 19 % were severely stunted
(Central Statistical Agency 2014). Additionally, the EHDHS survey reported that child
wasting or acute malnutrition was at a national average of 9% with the phenomenon being
highest (15%) in children less than 6 months of age. The survey also highlighted that 25% of
children under the age of 5 were underweight while 7% were severely underweight.
By definition, malnutrition refers to both undernutrition and overnutrition (Blössner & Onis
2005) but for the sake of simplicity, this study will use the term to refer to undernutrition. In
1990, UNICEF developed a nutrition conceptual framework that highlighted three causal
levels of malnutrition. First, it outlined the immediate determinants of malnutrition related to
dietary quality and disease. Then it identified more distal underlying causes at the household
or family level such as lack of access to basic services and infrastructure as well as
inadequate maternal and child feeding practices. Lastly, it underlined the possible broader
causes that occur at the societal level related to the political, economic and cultural context.
(Black et al. 2008)
In keeping with this framework, Megabiaw and Rahman (2013) found that poor maternal and
demographic situations such as rural residence, place of delivery, parental educations and
regional differences constituted the most important factors of stunting in Ethiopia.
Additionally, they reported that socioeconomic conditions, poor feeding practices, long-term
breastfeeding and poverty were all significantly associated with severe and moderate
stunting.
The consequences of malnutrition are far-reaching; some important outcomes include growth
retardation (Grantham-McGregor et al. 1991) and poor cognitive development that leads to
significant impact on education (UNICEF 2015) as well as on varying aspects of adult life
(Black et al. 2013). Moreover, there are other more immediate health impacts on a child’s
Page 10
10
well-being. For example, undernourished children under 5 are more at risk of anemia, acute
diarrheal syndrome, acute respiratory infection, and sometimes fever (UNICEF 2015).
In light of these challenges and the aforementioned underlying risk factors that contribute to
them, the Mentor Mother project was approved for implementation in Ethiopia in 2012. The
program is based on the Philani child health and nutrition program piloted in South Africa,
which integrates elements of a number of international behavioral change models that have
proven successful in improving healthy development of children in settings with limited
resources. This paraprofessional home visiting program was developed in townships near
Cape Town and seeks to address the needs of mothers of underweight and at-risk children
through the positive deviance (PD) model. (le Roux et al. 2010)
Although the impact of the program has been studied in the context of South Africa (Le et al.
2010; Rotheram-Borus et al. 2011; le Roux et al. 2011), only a few studies have examined its
application in Ethiopia (Sjöling 2015; Andréasson 2015). This thesis will endeavor to
specifically understand the impact of the Ethiopian program on the nutritional status of the
children enrolled in the program.
Page 11
11
2 LITERATURE REVIEW
2.1 Nutritional status and anthropometry
Among the many possible anthropometric measurements, the three most commonly used and
internationally recommended anthropometric indices of malnutrition are height-for-age,
weight-for-age (WAZ) and weight-for-height used to assess stunting, underweight and
wasting, respectively (De Onis et al. 2003; Fenn et al. 2008). Stunting is used as an indicator
of chronic malnutrition, wasting as an indicator of acute malnutrition and underweight as an
indicator of chronic and/or acute malnutrition (WHO 2016). The health and nutritional status
of a child is best defined by growth assessment since imbalances in health and nutrition
inevitably impact child growth irrespective of etiology. (Blössner and Onis 2005).
These indices can be expressed in terms of Z-scores, percentiles, or percentage of median, all
of which allow for comparisons between a chosen child or a group of children and a reference
population. In an effort to create uniformity in monitoring worldwide trends in child
malnutrition and make comparisons, the WHO, in 1986, initiated the WHO Global Database
on Child Growth and Malnutrition. The database compiles, standardizes and thus makes
possible the dissemination of results of nutritional surveys from many countries. (WHO
2016)
The WHO recommends the use of Z-score or standard deviations from the median of an
international reference population to characterize malnutrition (Seetharaman et al. 2007). The
child growth standards the organization uses were derived from children raised in optimal
environments that mitigated constraints to growth such as inadequate diets and infection
(Turck et al. 2013).
Measurements of standard deviations (SDs) from the mean (how far a child’s anthropometric
measure is from the mean) is used to indicate the severity of malnutrition: -1 SD to -2 SD is
said to be mild, -2 SD to -3 SD is said to be moderate and greater than -3 SD is said to be
severe. (WHO 2016)
Page 12
12
2.1.1 Stunting
The presence of stunting reveals a failure to reach linear growth potential reflecting poor
socioeconomic conditions and increased odds of frequent and early exposure to hostile
conditions such an inappropriate care and disease. It is the accumulated consequence of
retarded growth (WHO 1986; WHO 2016). It is most often an indicator of long-term dietary
inadequacy (de Onis et al. 2003). The prevalence of stunting ranges from 5% to 65% in
developing countries. Stunting is most prevalent between three months and three years of
age. After this period, mean heights run parallel to the reference indicating a state of having
“failed to grow” as opposed to a continual process of “failing to grow” reflected in the
previous period. (WHO 2005)
2.1.2 Wasting
Wasting is commonly associated with acute starvation or severe infection resulting in severe
weight loss. Wasting usually exists in population usually below 5% and prevalence peaks in
the second year of life (WHO 2016). Wasting refers to a deficit in tissue and fat mass
compared with the amount that is expected for a child of a specific weight and length (WHO
1986).
2.1.3 Underweight
The two ideal anthropometric indices for nutritional status are wasting and stunting since
these reflect distinct physiological and biological processes. Low WAZ or underweight is a
composite indicator that reflects body mass relative to age and influenced by both height and
weight (WHO 2016). As an index, WAZ does not differentiate between short children of
appropriate body weight and tall, thin children. WAZ reflects both the long-term nutritional
experience provided by stunting and the short-term nutritional changes demonstrated by
wasting (de Onis et al. 2003, WHO 1986). Thus, using WAZ as the sole indicator may
underestimate the true load of undernutrition (Seetharaman et al. 2007). WAZ seems to be
more purposeful in giving an overview of the distribution of nutritional problems in a country
or the general direction of change (WHO 1986).However, WAZ is primarily used due to the
Page 13
13
ease of collecting a sole measurement with the caveat of having accurate age information
available. WAZ is useful for tracking an anthropometric status but not comparison with a cut-
off value (Gorsetein et al. 1994). Furthermore, the appeal of growth assessment is in its
universality. It is generally culturally acceptable, equipment for its measuring is easily
transportable, little training is required, it is an inexpensive and non-invasive tool and it is
straightforward and robust as a measure. (WHO 1995).
2.2 Epidemiology of childhood malnutrition in Ethiopia
The majority of undernourished people currently live in the global developing regions where
780 million people were undernourished in the period between 2014 and 2016. The
prevalence of undernourishment has decreased from 18.6% in 1990-92 to 10.9% in 2014-16
largely due to changes in heavily populated countries like China and India. In Southern Asia
and Sub-Saharan Africa, progress is much slower. Approximately 23.2% of the population in
Sub-Saharan Africa, was estimated to be undernourished in the 2014–16 period which is the
highest prevalence of undernourishment for a region. (FAO 2015)
Although Ethiopia has achieved the Millennium Development Goal 1c target to halve the
proportion of people who suffer from hunger between 1990 and 2015 (UN 2016), the poor
nutritional status of children and women continues to be a serious problem in Ethiopia
(EHDHS 2014). The EHDHS found that 9% of children are wasted while 3% are severely
wasted. Wasting occurred most often in children under 6 months (15%) and children between
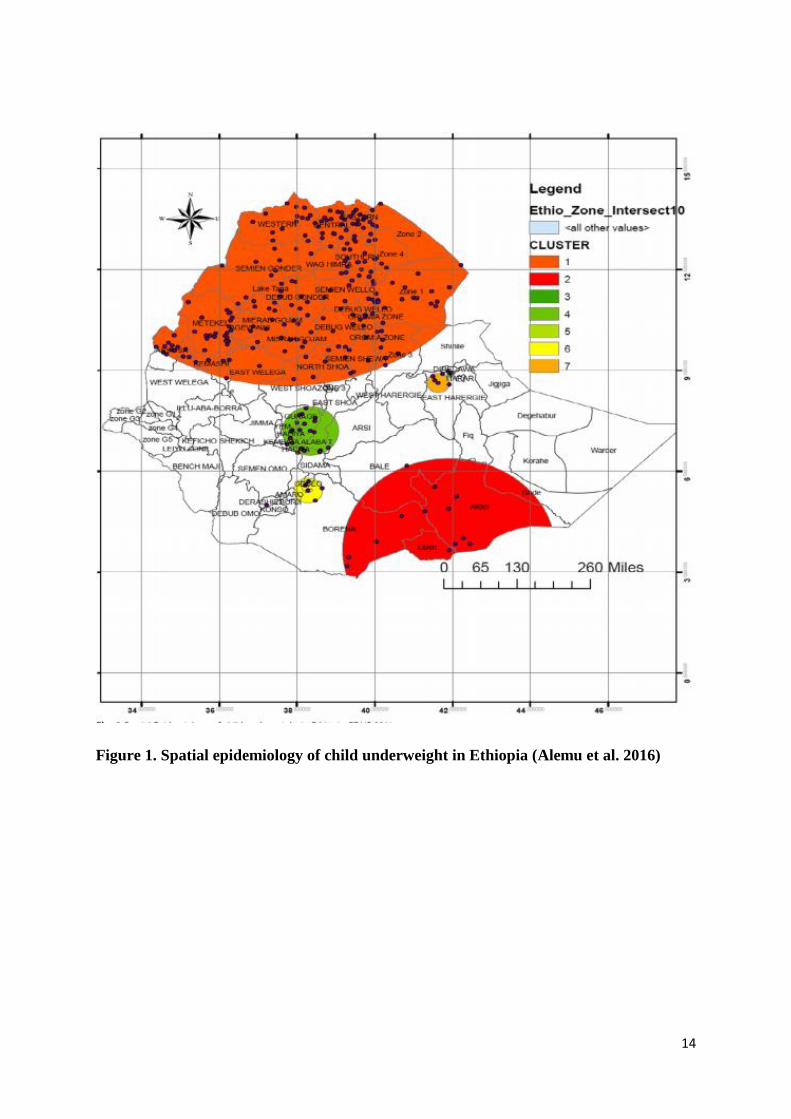
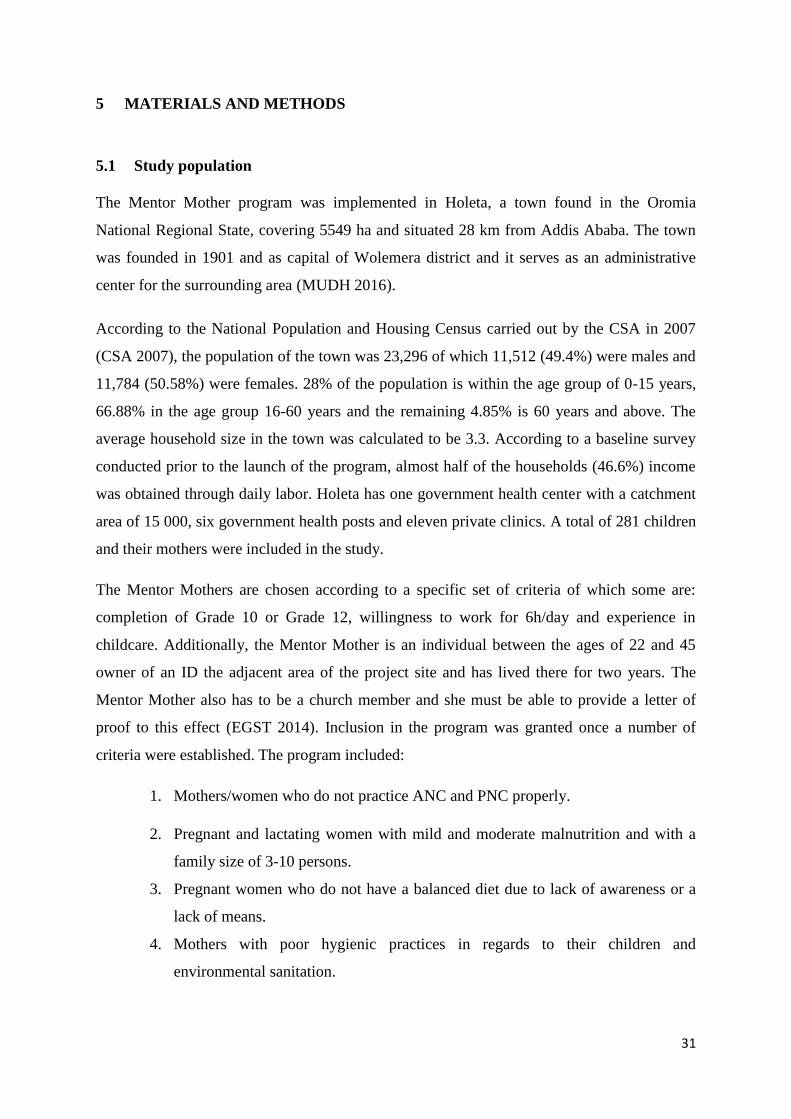
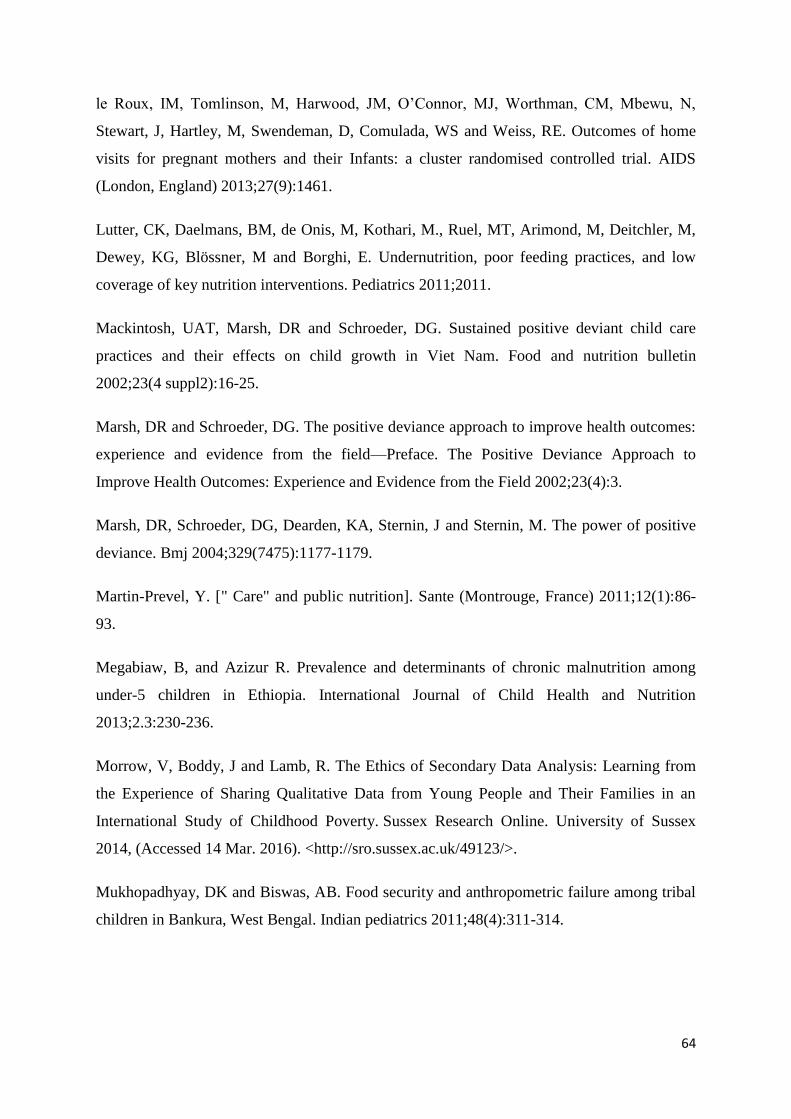
12 and 17 months (14%). The same study revealed that 25% of children under age 5 are
underweight, that the proportion of underweight children is highest in the age group 24-35
months at 31% and that there are regional variations in the proportion of underweight
children with rural children being more likely underweight than urban children and the
northern region being more affected than the southern region (Figure 1).
As far as trends are concerned, there has been a downward trend in the proportion of children
stunted and underweight over the last four DHS surveys. The prevalence of stunting was
reduced by 31% between 2000 and 2014, highlighting an improvement in chronic
malnutrition while the proportion of underweight children decreased by 39% during that
same period. Wasting seems to be one of the biggest nutritional challenges as only a small
decline was visible over the same period. (EHDHS 2014)
Page 14
14
Figure 1. Spatial epidemiology of child underweight in Ethiopia (Alemu et al. 2016)
Page 15
15
2.3 Aetiology of childhood malnutrition
2.3.1 The UNICEF conceptual model
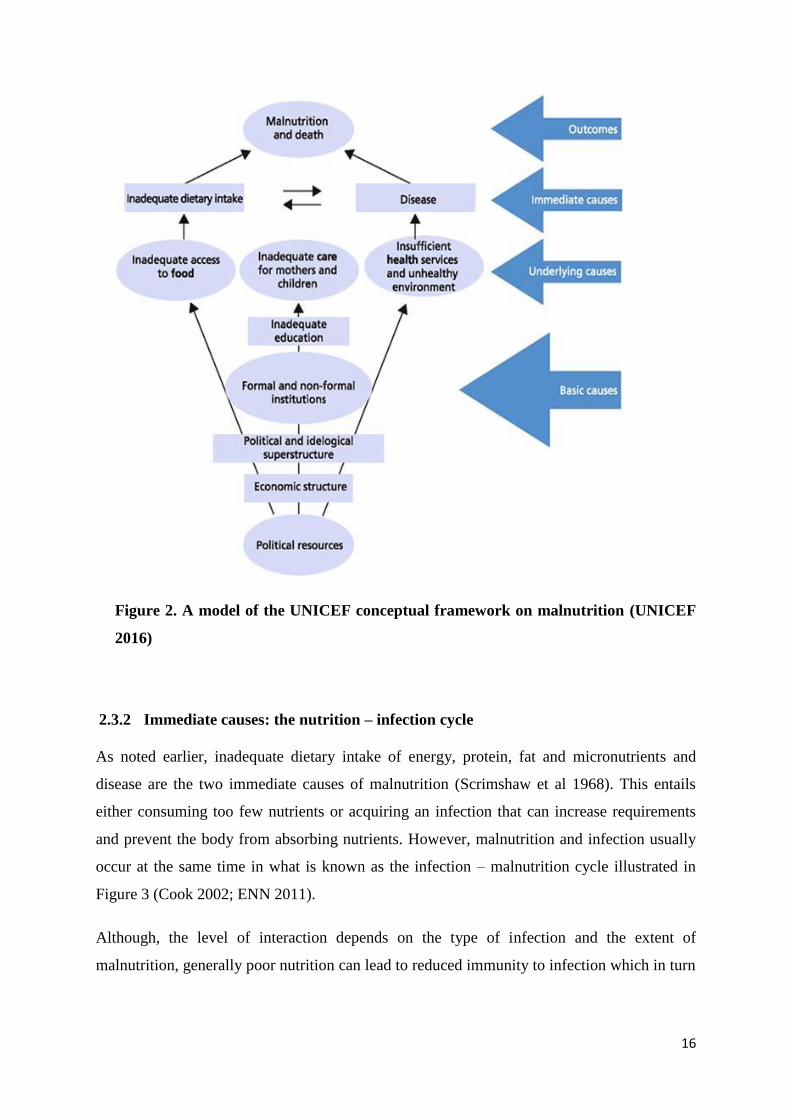
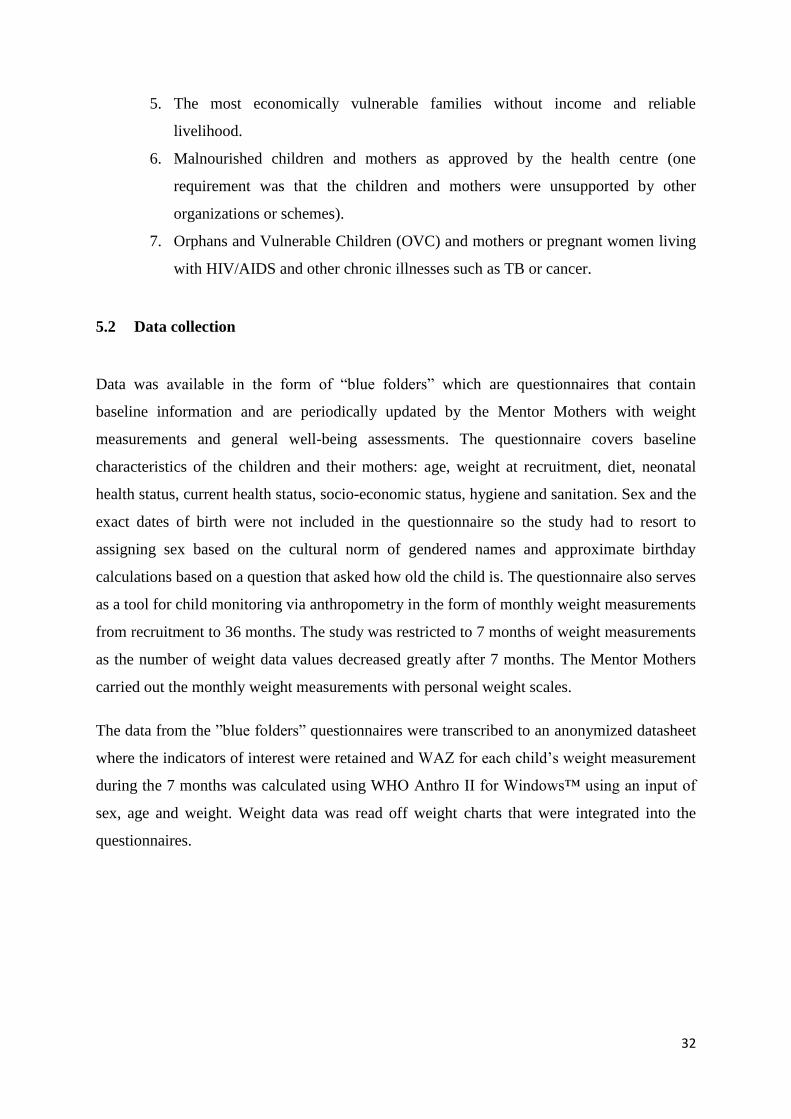
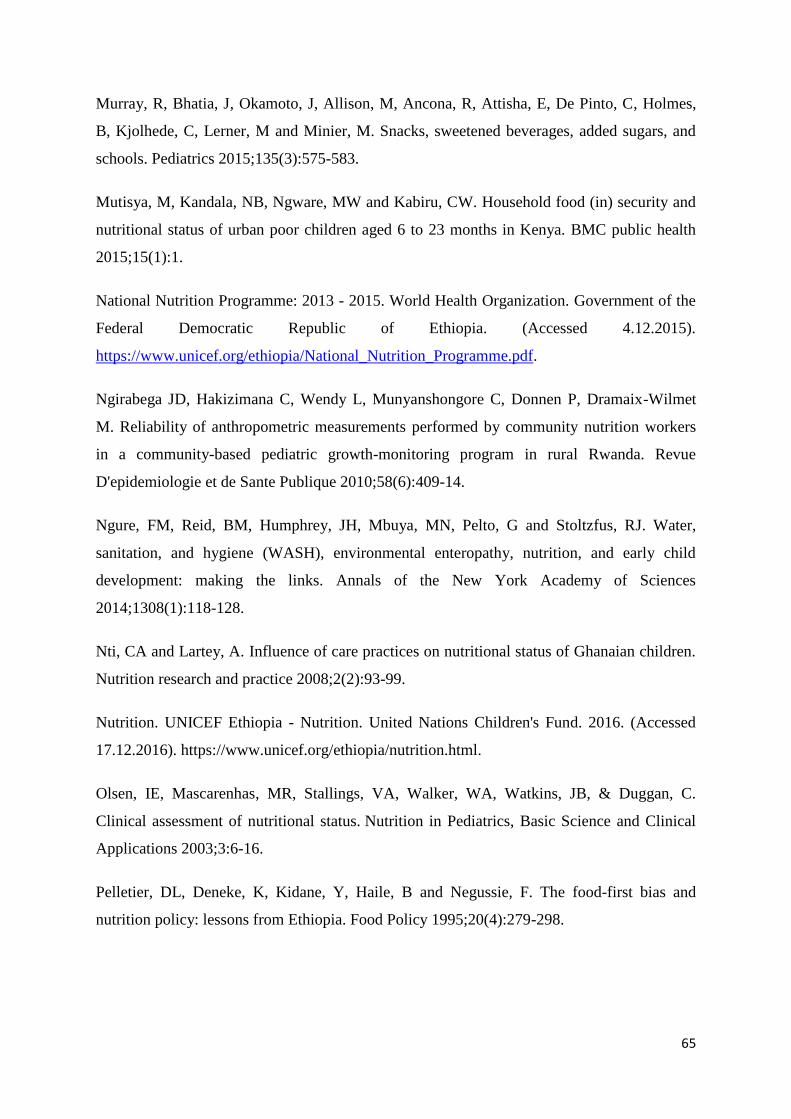
In 1990, UNICEF developed a nutrition conceptual framework (Figure 2) that highlighted
three causal levels of malnutrition in children; first, it outlined the immediate determinants of
malnutrition related to dietary quality and diseases that act on the individual (Scrimshaw et
al. 1968).
Although all causes act on the individual, other causes act indirectly through more complex
causal pathways (ENN 2011). More distally impacting nutrition status are the underlying
causes at the household/family and community level such as lack of access to basic services
and infrastructure or inadequate maternal and child feeding practices. Lastly, the model
underlined the possible broader causes at the societal level related to the political, economic,
and cultural context of the population (Black et al. 2008; ENN 2011). The framework is
notable for its effort in interweaving both biological and socioeconomic causes (Haddad &
Smith 2001).
Though seemingly comprehensive, the model does not take into account individual factors
that affect nutritional status such as genetic and phenotypic factors, disease susceptibility, and
heterogeneity in individual nutritional pathways (differences in metabolic rates for example).
Neither does the model acknowledge that seasonality may affect the different causal
pathways proposed. Seasonal cycles determine agricultural cycles that in turn affect food
availability and access (ENN 2011).
Page 16
16
Figure 2. A model of the UNICEF conceptual framework on malnutrition (UNICEF
2016)
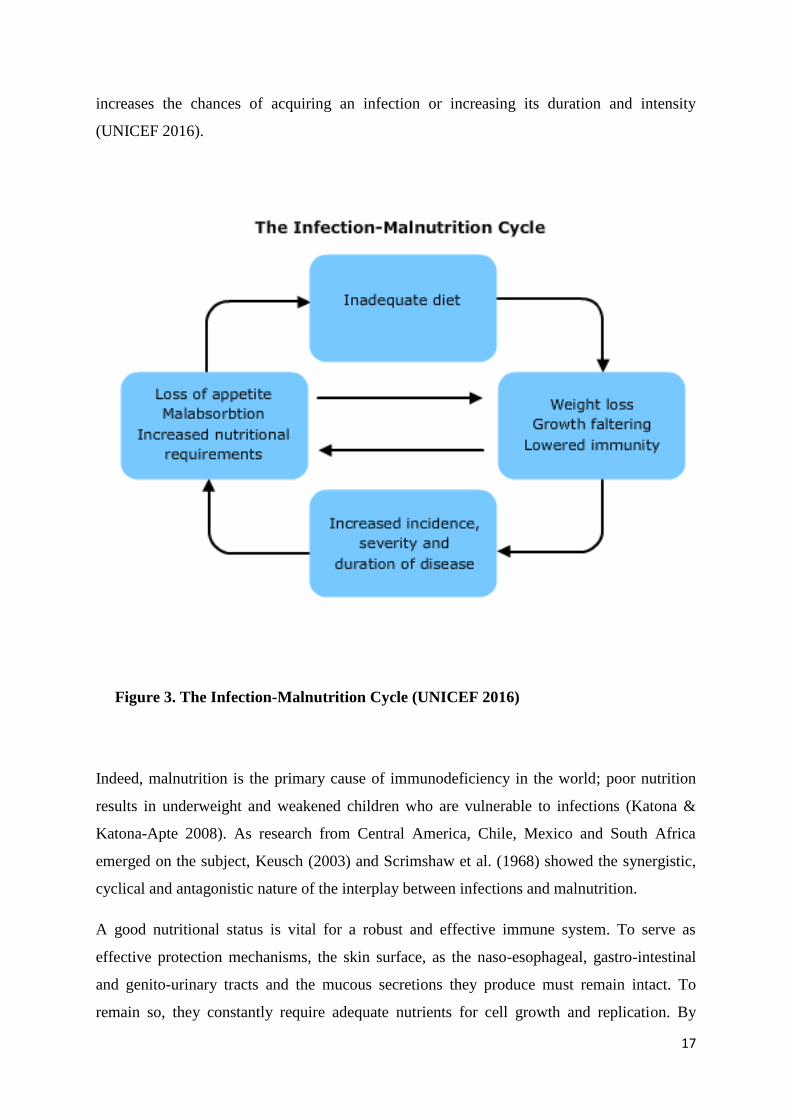
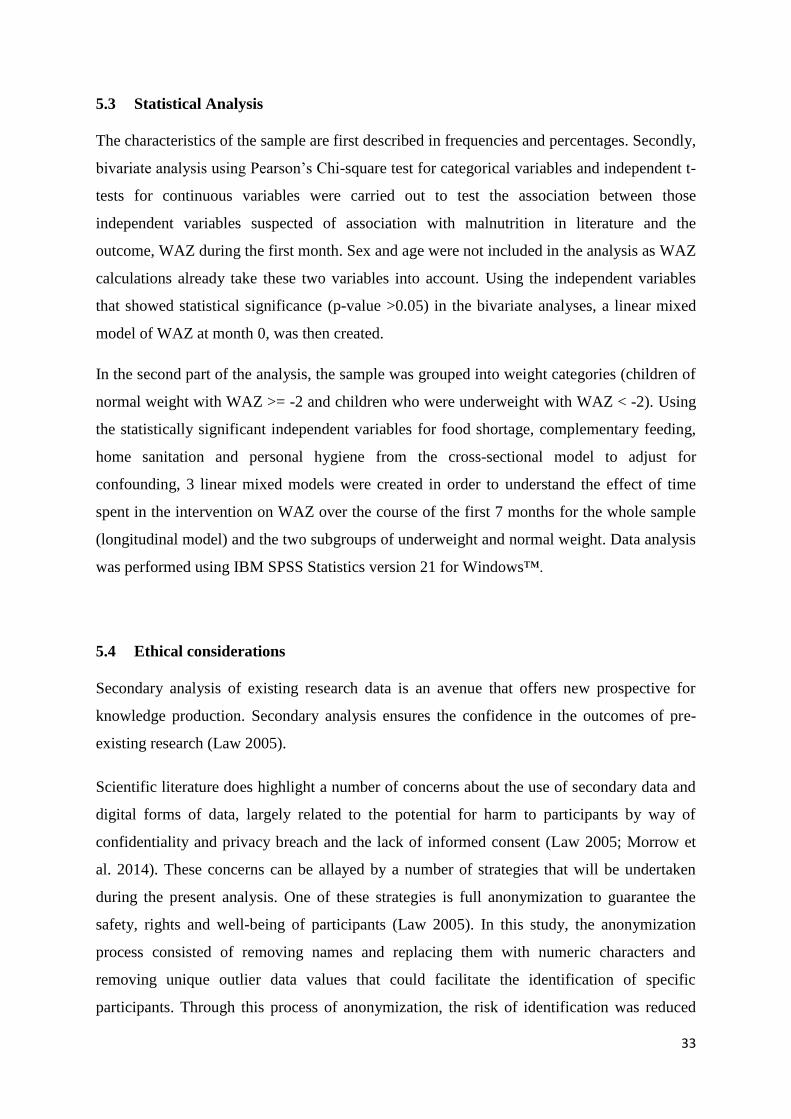
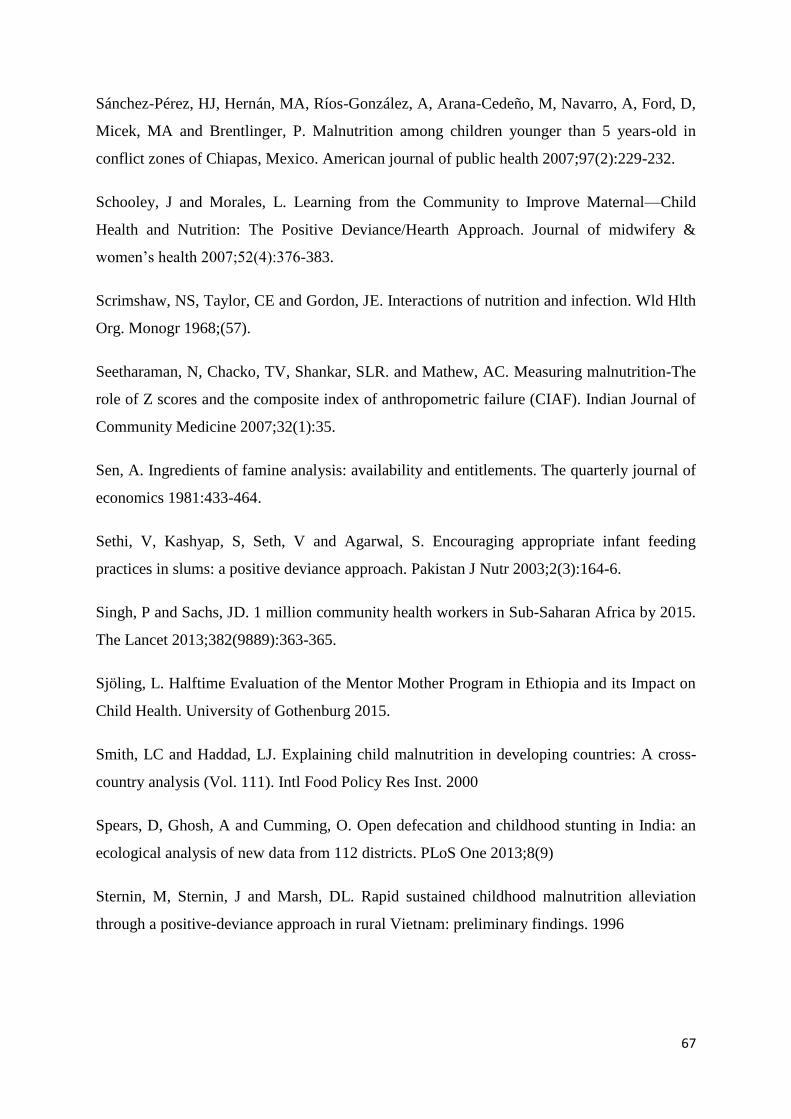
2.3.2 Immediate causes: the nutrition – infection cycle
As noted earlier, inadequate dietary intake of energy, protein, fat and micronutrients and
disease are the two immediate causes of malnutrition (Scrimshaw et al 1968). This entails
either consuming too few nutrients or acquiring an infection that can increase requirements
and prevent the body from absorbing nutrients. However, malnutrition and infection usually
occur at the same time in what is known as the infection – malnutrition cycle illustrated in
Figure 3 (Cook 2002; ENN 2011).
Although, the level of interaction depends on the type of infection and the extent of
malnutrition, generally poor nutrition can lead to reduced immunity to infection which in turn
Page 17
17
increases the chances of acquiring an infection or increasing its duration and intensity
(UNICEF 2016).
Figure 3. The Infection-Malnutrition Cycle (UNICEF 2016)
Indeed, malnutrition is the primary cause of immunodeficiency in the world; poor nutrition
results in underweight and weakened children who are vulnerable to infections (Katona &
Katona-Apte 2008). As research from Central America, Chile, Mexico and South Africa
emerged on the subject, Keusch (2003) and Scrimshaw et al. (1968) showed the synergistic,
cyclical and antagonistic nature of the interplay between infections and malnutrition.
A good nutritional status is vital for a robust and effective immune system. To serve as
effective protection mechanisms, the skin surface, as the naso-esophageal, gastro-intestinal
and genito-urinary tracts and the mucous secretions they produce must remain intact. To
remain so, they constantly require adequate nutrients for cell growth and replication. By
Page 18
18
allowing easier access to pathogens and mitigating the ability of the host to eliminate
pathogens once inside the body, undernutrition diminishes the barrier function and
predisposes to infections (Calder & Jackson 2000).
Recurrent infections such as acute respiratory infections, diarrhea, and helminthes and
chronic diseases such as HIV/AIDS, may heighten the risk of malnutrition through loss of
appetite, by hindering the uptake of nutrients, by diverting nutrients for immune response, or
increasing metabolic requirements and nutrient loss such as urinary nitrogen loss (Katona &
Katona Apte 2008). In turn, these changes could lead to further weight loss and further
damage of the defense mechanism (Katona & Katona Apte 2008; Lutter et al. 2011; UNICEF
2015).
In addition to adequate nutrient intake, dietary diversity has also been shown to be associated
with nutrient adequacy and nutritional status. Using data from 11 DHS to look at the
association between dietary diversity and stunting for children 6-23 months old, the authors
demonstrated that dietary diversity was also positively associated with stunting Z scores
(Arimond 2004).
2.3.3 Underlying causes
Nutrient inadequacy and the risk of infection are due to a number of factors at the household
and community level commonly known as underlying causes. They can be grouped into three
broad categories: household food insecurity (“food factor”), inadequate care (“care factor”)
and unhealthy household environments including lack of access to health services (“health
factors”). (Haddad & Smith 2000; UNICEF 2016)
2.3.3.1 Household food insecurity
Household food security is a concept that was developed during the 1980s in international
development circles (Cook 2002). It is defined as the sustainable access to safe food of
sufficient quality and quantity so as to ensure adequate intake and the health for all members
of the household. (UNICEF 2016)
Page 19
19
Three main components of household food security are key: availability, access and
utilization. Availability refers to a sufficient amount of appropriate food being physically
available. Access refers to income or other resources such as land which allow for the
acquisition of sufficient as well as appropriate food. Utilization is defined by the proper use
of food through appropriate food processing and means of storage (Swindale 2006; ENN
2011).
In turn, food insecurity is the constrained or uncertain availability or access to nutritionally
sufficient and safe foods (Cook 2002). In infants and toddlers, food insecurity is associated
with adverse health outcomes such as wasting, stunting and underweight (Saha 2009). In a
study carried out amongst children in rural Bangladesh, a gradient in the proportion of
underweight from 1 to 24 months of age was observed. Food-secure households in the study
had the lowest proportion while the extremely food-insecure households the highest
proportion. Similar patterns of stunting were found for the same group of children (Saha
2009). In a study in Kenya, similar results were observed; stunting among children aged
between 6 and 23 months was higher among children from food insecure households than
those from food secure (Mutisya 2015).
In an US study aiming to determine whether household food insecurity is associated with
adverse health outcomes in a population aged less than 36 months, the authors found that
children in food insecure household had significantly higher odds of having fair or poor
health, and of being hospitalized since birth (Cook 2004). In another study in Bengal,
multiple anthropometric failures were more likely in children living in low and very low food
secure households and that there was a dose response relationship between multiple
anthropometric failures and grades of food security (Mukhopadhyay & Biswas 2010).
2.3.3.2 Care-giving
Although a number of studies have found proof of a relationship between access to food and
nutritional status of children (Blaney 2009), others have noted the absence of such a link
(Shinsugi 2015). This absence can be explained by the relative importance of care in
nutritional well-being (Pelletier et al. 1995). The concept of care relates to ‘the provision in
the household and the community, of time, attention and support to meet the physical,
emotional, intellectual and social needs of the growing child and of other family members’
Page 20
20
(FAO & WHO 1992). According to Engel et al. (1997), care practices as relating to children
are comprised of breast-feeding and complementary feeding, food preparation and storage,
hygiene and health practices, and psychosocial care.
Differences in caring practices and resources between and, to a greater extent, within cultures
may exist (Engle et al. 1999). Differences appear in how each culture and more specifically
each family responds to children’s basic universal needs for food, protection, health care,
shelter, and affection (Martin-Prevel 2001). Multiple studies demonstrate the significant
positive association between care practices and children’s nutritional status (Ruel et al. 1999,
Nti & Lartey 2008; Amugsi 2014)
2.3.3.3 Household environment and basic health services
The last category of the underlying causes of undernutrition indicates those factors
influencing poor public health. This classification describes the health environment, exposure
to diseases and the ability to access to basic health infrastructure. Ease of access to clean, safe
water and sanitation, the presence or absence of malarial breeding areas, the quality of homes
and the related levels of overcrowding, temperature, and stress characterize the health
environment while the level of access to primary health services determines the extent to
which infection and disease can be prevented or treated. (UNICEF 2016)
Access to healthcare is defined as ‘the timely use of services according to need’ (Peters et al.
2008). Peters et al. (2008) described four main dimensions of access, each with a supply and
demand element. They highlighted geographic accessibility as defined by the physical
distance or travel time from the health care facility, availability which refers to having the
appropriate type of care and service providers available to those who require it, financial
accessibility and lastly, acceptability determined by the responsiveness of the health service
providers to the social and cultural expectations of user communities.
Of the four dimensions, distance is a recurring prime factor in access to health care (Buor
2003; Puett & Guerrero 2015). One study in the rural Ahafo-Ano South district of Ghana
found that distance was the main factor affecting utilization; the greater the distance from a
health facility, the lower the rate of health services utilization. Although other studies have
failed to find the same results, this might be due their failure to account for travel time when
considering geographical accessibility (Buor 2003).
Page 21
21
A study carried out in the eastern province of Rwanda revealed a significant and negative
association between stunting z-scores for under 5 children and travel time to the nearest
health center (Aoun et al. 2015). Distance was also a frequently noted barrier in a
comparative analysis of severe acute malnutrition treatment services in Pakistan and Ethiopia.
Households in both countries are faced with a variety of barriers to access such as distance,
high opportunity costs and lack of awareness of available services and of malnutrition itself
(Puett & Guerrero 2015). In another study in east rural Ethiopia, it was noted that mothers
who had no access to the health service facilities had children whose odds of exposure to the
risks of acute undernutrition were higher than those children whose mothers did have access
(Egata et al. 2014). Similarly, in a study in Nigeria, a 0.016-point decrease in child stunting z-
score was associated with 1% increase in women reporting significant health services
information problems (Agee 2010).
The lack of adequate safe water, effective sanitation systems and the presence of unhygienic
conditions all contribute to an unhealthy household environment and subsequent infectious
diseases (ENN 2011). The link between unhealthy environment and adverse nutritional
outcomes is said to be mediated by a number of disease pathways such as diarrhea, tropical
enteropathy and gastro-intestinal disorders (Spears et al. 2013).
Some have even posited that the primary causal pathway is not diarrhea but tropical
enteropathy (Humphrey 2009; Ngure et al. 2014), a subclinical disorder of the small intestine
caused by fecal bacteria ingested by young children living in poor environmental conditions
and resulting in malabsorption of nutrients, increased permeability and inflammation
(Humphrey 2009). As children start exploring the environmental world to which they are
confined by crawling, walking, mouthing objects, their risk of ingesting both animal and fecal
bacteria increases, especially in rural low-income settings. This results in intestinal infections
which lead to reduced appetite, malabsorption and increased nutrient loss and which in return
affect early childhood development (Rah et al. 2015). Indeed, a number of studies carried out
in Ethiopia and India have effectively demonstrated that poor environmental conditions (such
as the presence of open defecation) may increase the odds of child stunting (Spears et al.
2013; Ngure et al. 2014; Rah et al. 2015). In a study carried out in rural central Mexico,
WASH indicators were strongly associated with growth as described by height, weight, and
wasting in children aged 6 and 30 months (Calloway et al. 1988). It is important to note that
in reality, there is significant overlap and interaction between the three categories of
Page 22
22
underlying causes and it is not always easy to determine the relative effect of each underlying
cause (UNICEF 2015).
2.3.4 Macro factors
Macro factors or basic causes that influence the underlying determinants of child
malnutrition: the human, structural and financial resources that are available and how they are
utilized (this refers to the way these resources are politically, legally and culturally organized
and translated into food security, care, services and healthy environments). (UNICEF 2015;
Kavle et al. 2015).
In his now renowned paper, Sen (1981) posits that political factors are at the root of all
famines (1981). He demonstrated that it was government policy and not agricultural failure
via natural disasters that was the cause of the 1973 famine in Wollo, Ethiopia and the 1943
famine in West Bengal (Sen 1981). Kaluski et al. (2002) join him in his claim that famine in
Ethiopia is more a result of structural challenges rather than natural disasters.
Conflict in communities affect the nutritional status of its members, particularly children; in
Chiapas Mexico chronic violence and intracommunity conflict was strongly associated with
stunting in children. Conflict can decrease access to food and also increase vulnerability to
diseases. (Sánchez-Pérez 2007)
The economic well-being of a country plays no small role in childhood nutritional status.
Pongou and co-workers (2006) examined the impact of economic crises and the adjustment
programs of the 1990s in Cameroon on childhood malnutrition and found that the prevalence
of malnutrition among children younger than 3 years, as measured by WAZ, had significantly
increased from 16% to 23% from 1991 to 1998. One way to explain this change could be that
households reduce the dietary diversity and energy intake as a way of coping with increases
in food prices and reductions in income (Brinkman 2010).
Page 23
23
2.4 Consequences of childhood malnutrition
2.4.1 Effects of child malnutrition on child development
Nutrition has resonating effects on health throughout a life course as well as on cognitive and
social development, especially during early childhood. The consequences of malnutrition are
wide in scope, ranging from decreased learning capacity in children and elevated risk of
death from infections to increased risk of non-communicable diseases during adulthood.
(Black et al. 2013)
Starting from the time of conception to pregnancy, nutrition is vital for fetal growth. Babies
with poor fetal growth are at an increased risk of death throughout infancy (Wu & Chen
2009). Although poor fetal growth is rarely a direct cause of death, it can contribute indirectly
to neonatal death via birth asphyxia and infections such as pneumonia, sepsis and diarrhea
(Black et al. 2008).
Throughout childhood, stunted, underweight, and wasted children have an increased risk of
death from diarrhea, pneumonia, measles, and other infectious diseases (Wu & Chen 2009).
Additionally, malnutrition, by bringing about direct structural damage to the brain and
impairing infant motor development as well as exploratory behavior, can negatively affect
cognitive development. Although the effect of environmental factors weakens the association
progressively, birthweight is positively associated with childhood cognitive skills. (Victora et
al. 2008).
Specific types of micronutrient deficiencies have severe consequences for children both
through their direct effects (iron deficiency anaemia, xerophthalmia due to vitamin A
deficiency) and because they increase the risk of serious infections. Vitamin A deficiency has
been shown to have an association with a higher risk of mortality while zinc deficiency
increases the risk of diarrhea, malaria and pneumonia. Iron deficiency, which results from the
low consumption of meat, fish and poultry has effects on child cognition. A combined
analysis of 5 trials showed 1.73 lower IQ points per 10g/L decline in hemoglobin (Black et al.
2008). Iodine deficiency during pregnancy plays a role in the fetal motor and mental
development and raises the risk of miscarriage and fetal growth restriction (Black et al.
2008).
Page 24
24
2.4.2 Effects of child malnutrition on adult health
The effect of maternal and child undernutrition on adult health and body composition was
studied by carrying out meta-analyses of five birth cohorts from low and middle income
countries (India, the Philippines, South Africa, Guatemala, Brazil) (Lancet Series 2008). The
study concluded that small size at birth and at 2 years of age were associated with reduced
human capital; less schooling, shorter adult height, reduced economic productivity and lower
off spring birthweight for women. Although association with adult disease indicators were
less obvious (Victora et al. 2008), intrauterine growth retardation and low birth weight have
been shown to be associated with increased risks of cardiovascular diseases and related
disorders, including stroke, hypertension and type 2 diabetes mellitus (Wu & Chen 2009).
Furthermore, higher levels of depression, anxiety and lower self-esteem were visible in
adolescents who were stunted by age 2 compared to non-stunted group. Increased risk of
suicidal ideation and higher levels of hyperactivity in late adolescence and adult attention
deficit was shown to be associated with lower stunting z scores at 24 months of age. (Black et
al. 2013)
Famines can also effectively demonstrate the long-term effects of poor nutrition during early
childhood. The Dutch famine of 1944-1945 revealed the association between prenatal
exposure to famine and schizophrenia but not with human capital and cardiovascular risk
factors (Black et al 2013). On the other hand, the 1956-1961 Chinese famine demonstrated
the effects of famine exposure during pregnancy and during the first 2 years of life on weight,
height, income, mental health and intergenerational offspring birthweight (Black et al 2013).
2.5 The Positive Deviance model
The concept of PD was first articulated by Dr. Joe D. Wray, in his 1972 Tropical Pediatrics
editorial, when he asked, “Can we learn from successful mothers?” (Wray 1972). During the
same period, Sam Wishik and Susan Van der Vynckt branded families whose children were
in the upper quartile of stunting and underweight as “positive deviants” thus indirectly
answering Wray’s query (Wishik & Vynckt 1976; Schooley & Morales 2007).
According to Marsh et al. (2004), positive deviant behavior is defined as practicing
advantageous but uncommon behaviors by people who are of the same socioeconomic
background as peers who do not practice these behaviors (Schooley & Morales 2007). These
Page 25
25
behaviors are successful, adapted to the local culture and are usually affordable as well as
sustainable because at-risk people already practice them.
The PD approach is one alternative to needs-based approaches to development that depend on
scientific methods to identify methods for improved health. The danger in needs-based
methods is that local populations will be unable to obtain or sustain what has been identified
missing. PD offers an “assets-based” approach in that it takes advantage of “resilience” in
communities. (Lapping et al. 2002)
The caregiving behaviors that ensure the good nutritional status of children under 5 years
include but are not limited to the early initiation of breastfeeding, exclusive breastfeeding for
the first six months, appropriate introduction of complementary foods, the proper
management of childhood illnesses, immunizations, good hygiene, and birth spacing.
(Dearden et al. 2002)
The PD approach has been primarily used to address childhood malnutrition and it works
through multiple steps. Case definitions are first elaborated and four to six high risk people
who have attained good outcomes are identified. These individuals are then interviewed and
observed with the purpose of unmasking the uncommon behaviors that could be responsible
for the good outcome. The findings are analyzed to affirm that these behaviors are indeed
uncommon but accessible for those at risk individuals in need. Activities in behavior change
are developed in order to encourage the adoption of these new behaviors along with
monitoring and evaluation activities. (Marsh et al. 2004;Schooley & Morales 2007)
In nutrition programs, the assessor identifies PD mothers by weighing a general population’s
children and selects those weighing in the top 10% or 25% of the underweight distribution
whose resources are inadequate. The selected mothers are then interviewed to identify
behaviors distinct from those of mothers of malnourished children which is compiled into
what is known as the PD inquiry. (Berggren & Wray 2002)
The first implementation of the approach took place in Haiti in the 1970s with the “Projet
Intégrée de Santé et de Population (PISP)” under the helm of Haiti’s Division of Family
Hygiene. This model required daily contact with mothers over a 3-month period in which the
mothers were counselled on the use of local foods to rehabilitate malnourished children in
“Grand Foyers”, large outdoor kitchens (Bolles et al. 2002; Schooley & Morales 2007). The
activities were later modified in the 1990s to include itinerant workers in the “Ti Foyer” or
Page 26
26
Hearth model, a neighborhood model for nutritional rehabilitation in home-kitchens located
geographically closer to the targeted women (Bolles et al. 2002).
The results from different applications of the model were promising. Monitoring results from
the first cycle of the program showed that 100% and 66% of children in eight and five
targeted villages respectively gained weight as fast as or faster than the international standard
median six months after completing the PD program (Bolles et al. 2002). Similar results were
identified in other countries where the PD approach was applied during the 1990s (Marsh et
al. 2004). After implementation of the PANP program (Poverty Alleviation and Nutrition
Program) in Thanh Hoa Province, Vietnam by Save the Children Federation/US (SC), severe
malnutrition had been reduced from 23% to 4% (Sternin et al. 1996; Mackintosh et al. 2003).
When Mackintosh et al. (2003) carried out two follow-up surveys in the communes that had
been part of the program, they found out that children from the SC study group had better
nutritional statuses than those in the comparison group. The nutritional benefits even
extended to their younger siblings who had not been directly implicated in the intervention.
Another study by Schroeder et al. (2002) also examining a later integrated nutrition program
by SC in Vietnam found that although there was no overall effect on growth (in fact
anthropometric indicators worsened as the children aged), there were improvements in
dietary intakes and morbidity. Additionally, they found that the younger the child, the greater
the effect of the intervention. This, the authors surmised, was due to three factors: that the
highest growth rates occur during early infancy, that growth faltering occurs primarily
between 6 and 15 months of age and that it is easier to prevent growth faltering in the early
stages of growth than to prevent it during a later time period. Another study conducted in
Delhi, India found that after four weeks of induction into a PD study, adding 1 teaspoon of
ghee (milk fat) in the family pot food and providing an extra mid-day cereal snack for the
child were two PD behaviors that were taken up by the study targets. (Sethi et al. 2003)
What differentiates caregivers who have adopted these beneficial behaviors from those who
do not? In Dearden et al. (2002), authors interviewed caregivers of children 6 to 17.9 months
of age in five communes and looked at four behaviors centered on caregiving: feeding
children “PD food”, feeding during diarrheal episodes, hand-washing and health-seeking
behavior. By using elicitation procedures in their qualitative study, the authors discovered
that, for each of these behaviors, favorable social norms determined who practiced them
Page 27
27
while encouraging and reinforcing beliefs and attitudes were significant determinants of
every studied behavior with the exception of hand-washing.
The PD approach has a number of limitations as well. For example, uncommon practices
exist at a prevalence of 1-10% in communities and they are often costly to detect.
Additionally, even though training materials, workshops and technical assistance are more
and more readily available, scale-up may be limited as it requires individuals skilled in
community mobilization, PD theory, and participatory research. Furthermore, scale-up
presents its own set of challenges. An evaluation of a PD nutrition program scale-up in Viet
Nam demonstrated that the quality of interventions decreased as the program expanded
(Lapping et al. 2002). There could also be a limited generalizability of findings as inquiries
are local and a vital aspect of the approach is mobilization through self-discovery. Lastly, the
absence of culturally-appropriate methods to ensure not only fathers’ participation but to also
allow their wives to participate is not unimportant. (Lapping et al. 2002)
Page 28
28
3 THE MENTOR MOTHER PROJECT
The primary model used in the program is the PD/Hearth model targeting childhood
malnutrition implemented in Haiti in the early 1990s (Bolles et al. 2002). This model relies
on “positively deviant” mothers raising relatively healthy and well-nourished children while
living in resource-poor environments. These mothers are trained to lead gatherings of
malnourished children and their mothers (Wollinka et al. 1997).
The program also has elements of nurse home visits as these “model mothers” visit the
targeted mothers and their children in their homes. The findings from the Philani Program
have been promising and include improved health behaviors, increased nutritional
knowledge, and rehabilitation of undernourished children (le Roux et al. 2010).
In the Ethiopian context, the program commenced in June 2014 and will continue to
December 2017. Implementation of the program in Holeta is under the helm of the Ethiopian
Evangelical Church Mekane Yesus - Development and Social Services Commission
(EECMY - DASSC). The general objective of the program is to enhance access to preventive
and rehabilitative health and antenatal care among women and children under 5 with a wide
scope of intervention, targeting multiple groups (pregnant women, mothers and children) and
outlining action in many focus areas of which nutrition is just one aspect. It encompasses
basic maternal health, basic child health, family planning, environmental sanitation, personal
hygiene and other related focus areas. The Mentor Mothers work in collaboration with the
Health Extension Workers (HEW) assigned to the area (EGST 2014). The project design and
operation are closely aligned to the Ethiopian government’s health extension package and
incorporates its four pillars:
1. Hygiene and environmental sanitations (safe excreta disposal, waste removal, water
quality control, food hygiene, personal hygiene, proper housing)
2. Disease prevention and control (Tuberculosis (TB) prevention and control; First Aid,
malarial prevention and control, Sexually Transmitted Diseases (STDs) prevention and
control)
3. Family health service (maternal and child health, immunization, nutrition, adolescent
reproductive health, family planning)
4. Health education and communication which integrates the previous pillars
Page 29
29
In the realm of nutrition, the Mentor Mothers seek to provide proper counselling and support
for pregnant mothers and children through ante-natal care (ANC) follow up, post-natal care
(PNC), proper nutrition of pregnant women, education on breastfeeding (exclusive
breastfeeding, complementary feeding and continuing breastfeeding till 2 years), preparation
of nutritious food for children above 6 months, provide feeding support to households
deemed most in need and regular monitoring of child growth and development. (EGST 2014)
The Mentor Mothers are chosen according to a specific set of criteria of which completion of
Grade 10 or Grade 12, willingness to work for 6 hours a day and experience in childcare are
requirements. Additionally, the chosen Mentor Mother is an individual between the ages of
22 and 45, the owner of an ID from an area adjacent to the project site and has lived there for
two years. The Mentor Mother also has to be a church member and is able to provide a letter
of proof to this effect. (EGST 2014)
Based on these criteria, 28 Mentor Mothers were initially selected for the two sites of the
program: 15 Mentor Mothers for the Addis Ababa site and 13 Mentor Mothers for the Holeta
site. The 28 Mentor Mothers were trained for 20 days in four phases. First, they watched
experienced Mentor Mothers in action. They then attended training sessions covering info
about nutrition, basic child health, weighing babies and the completion of growth charts, how
to recognize danger signs and crisis situations and how to handle depressed mothers. They
also learnt how to build trust with mothers and, as a final step to their training, they carried
out the first round of home visits on their own. (EGST 2014)
After training, the Mentor Mothers visit 6 houses a day and a single household is visited
every 15 days but the frequency may increase based on the nature of individual cases. During
visits, the Mentor Mothers weighed the child and discussed the developmental progress with
the mother, as well as proper nutrition and hygiene, stress, breastfeeding, proper time to
introduce solid food, frequent feeding and mixed diet, immunizations progress/status and
deworming. (EGST 2014).
The Mentor Mothers receive a monthly salary of Birr 1500 as well as a stipend of 300
Ethiopian Birr for telephone charges and 2000 Birr for healthcare costs. (EGST 2014)
Page 30
30
4 OBJECTIVES OF THE STUDY
4.1 General objective
This study primarily aimed to determine whether the Mentor Mother program has had an
impact on 0 to 5 years old children’s WAZ scores in the 7-month period after enrolment into
the program. In addition, determinants of WAZ were analyzed.
4.2 Specific objectives
Three specific objectives were outlined:
1. Analyze the association between environmental and living conditions, feeding
practices, mother’s health status and education, access to health facilities, socio-
economic status and child’s weight status
2. Study the changes in proportions of underweight (WAZ < -2) for all children
under 5 during the 7-month period after the start of the intervention.
3. To compare the differences in proportions of underweight (WAZ < -2) among
children deemed underweight and those deemed at a normal weight at the
beginning of the intervention during the intervention.
Page 31
31
5 MATERIALS AND METHODS
5.1 Study population
The Mentor Mother program was implemented in Holeta, a town found in the Oromia
National Regional State, covering 5549 ha and situated 28 km from Addis Ababa. The town
was founded in 1901 and as capital of Wolemera district and it serves as an administrative
center for the surrounding area (MUDH 2016).
According to the National Population and Housing Census carried out by the CSA in 2007
(CSA 2007), the population of the town was 23,296 of which 11,512 (49.4%) were males and
11,784 (50.58%) were females. 28% of the population is within the age group of 0-15 years,
66.88% in the age group 16-60 years and the remaining 4.85% is 60 years and above. The
average household size in the town was calculated to be 3.3. According to a baseline survey
conducted prior to the launch of the program, almost half of the households (46.6%) income
was obtained through daily labor. Holeta has one government health center with a catchment
area of 15 000, six government health posts and eleven private clinics. A total of 281 children
and their mothers were included in the study.
The Mentor Mothers are chosen according to a specific set of criteria of which some are:
completion of Grade 10 or Grade 12, willingness to work for 6h/day and experience in
childcare. Additionally, the Mentor Mother is an individual between the ages of 22 and 45
owner of an ID the adjacent area of the project site and has lived there for two years. The
Mentor Mother also has to be a church member and she must be able to provide a letter of
proof to this effect (EGST 2014). Inclusion in the program was granted once a number of
criteria were established. The program included:
1. Mothers/women who do not practice ANC and PNC properly.
2. Pregnant and lactating women with mild and moderate malnutrition and with a
family size of 3-10 persons.
3. Pregnant women who do not have a balanced diet due to lack of awareness or a
lack of means.
4. Mothers with poor hygienic practices in regards to their children and
environmental sanitation.
Page 32
32
5. The most economically vulnerable families without income and reliable
livelihood.
6. Malnourished children and mothers as approved by the health centre (one
requirement was that the children and mothers were unsupported by other
organizations or schemes).
7. Orphans and Vulnerable Children (OVC) and mothers or pregnant women living
with HIV/AIDS and other chronic illnesses such as TB or cancer.
5.2 Data collection
Data was available in the form of “blue folders” which are questionnaires that contain
baseline information and are periodically updated by the Mentor Mothers with weight
measurements and general well-being assessments. The questionnaire covers baseline
characteristics of the children and their mothers: age, weight at recruitment, diet, neonatal
health status, current health status, socio-economic status, hygiene and sanitation. Sex and the
exact dates of birth were not included in the questionnaire so the study had to resort to
assigning sex based on the cultural norm of gendered names and approximate birthday
calculations based on a question that asked how old the child is. The questionnaire also serves
as a tool for child monitoring via anthropometry in the form of monthly weight measurements
from recruitment to 36 months. The study was restricted to 7 months of weight measurements
as the number of weight data values decreased greatly after 7 months. The Mentor Mothers
carried out the monthly weight measurements with personal weight scales.
The data from the ”blue folders” questionnaires were transcribed to an anonymized datasheet
where the indicators of interest were retained and WAZ for each child’s weight measurement
during the 7 months was calculated using WHO Anthro II for Windows™ using an input of
sex, age and weight. Weight data was read off weight charts that were integrated into the
questionnaires.
Page 33
33
5.3 Statistical Analysis
The characteristics of the sample are first described in frequencies and percentages. Secondly,
bivariate analysis using Pearson’s Chi-square test for categorical variables and independent t-
tests for continuous variables were carried out to test the association between those
independent variables suspected of association with malnutrition in literature and the
outcome, WAZ during the first month. Sex and age were not included in the analysis as WAZ
calculations already take these two variables into account. Using the independent variables
that showed statistical significance (p-value >0.05) in the bivariate analyses, a linear mixed
model of WAZ at month 0, was then created.
In the second part of the analysis, the sample was grouped into weight categories (children of
normal weight with WAZ >= -2 and children who were underweight with WAZ < -2). Using
the statistically significant independent variables for food shortage, complementary feeding,
home sanitation and personal hygiene from the cross-sectional model to adjust for
confounding, 3 linear mixed models were created in order to understand the effect of time
spent in the intervention on WAZ over the course of the first 7 months for the whole sample
(longitudinal model) and the two subgroups of underweight and normal weight. Data analysis
was performed using IBM SPSS Statistics version 21 for Windows™.
5.4 Ethical considerations
Secondary analysis of existing research data is an avenue that offers new prospective for
knowledge production. Secondary analysis ensures the confidence in the outcomes of pre-
existing research (Law 2005).
Scientific literature does highlight a number of concerns about the use of secondary data and
digital forms of data, largely related to the potential for harm to participants by way of
confidentiality and privacy breach and the lack of informed consent (Law 2005; Morrow et
al. 2014). These concerns can be allayed by a number of strategies that will be undertaken
during the present analysis. One of these strategies is full anonymization to guarantee the
safety, rights and well-being of participants (Law 2005). In this study, the anonymization
process consisted of removing names and replacing them with numeric characters and
removing unique outlier data values that could facilitate the identification of specific
participants. Through this process of anonymization, the risk of identification was reduced
Page 34
34
(Collins 1991), potential harm circumvented and benefits to the community optimized. Data
collection was performed once the consent was obtained from the mothers and the health
extension workers who are community health workers responsible for ensuring access to
primary health care in the community (EGST 2014).
Page 35
35
6 RESULTS
6.1 Baseline characteristics
Table 1, Table 2 and Table 3 present the general characteristics of the mothers sampled, their
children and the living environment, respectively. Of the mothers included in the program,
62.5% were between 16 and 27 and 30 % between 27 and 38 (Table 1). The mean age of the
women at the time of recruitment was 26.91 years (SD 6.94, range 16 – 60 years).
78.6% of the mothers had between 1 and 3 pregnancies at the time of questioning with a
mean of 2.39 (SD: 1.70, range: 1 – 10 pregnancies). In reference to education, the largest
group did not receive any form of educational instruction (40%) followed by the group
consisting of those who had completed primary education. Access to healthcare during time
of delivery was relatively good with 67.9% having given birth at a health centre. 78.9% of the
women had a spouse.
Of these women, 10.7% were diagnosed as malnourished by a nurse, 13.2% as anaemic and
16.4% as having experienced household food shortage. Alcohol usage and smoking rates
were quite low in the study population at 9.3% and 0.4%, respectively. Income data was only
available for 110 women and of these 48.2% had less than 500 Birr per month. Health-
seeking rates were quite high for the group at 96.1%. (Table 1)
Table 1. General baseline characteristics of the mothers
Variables Categories Frequency (%)
Mother's age, y (n=276) 16 - 26.99 175 (62.5)
27 - 37.99 84 (30)
38 - 48.99 11 (3.9)
49 – 60 6 (2.1)
Number of pregnancies (n=279) 1 – 3 220 (78.6)
4 – 7 54 (19.3)
8 – 12 5 (1.8)
Mother's education level (n=269) None 112 (40)
Literate 12 (4.3)
Primary 74 (26.4)
Secondary 44 (15.7)
Post-secondary 27 (9.6)
Place of delivery (n=278) Health center 190 (67.9)
Home 88 (31.4)
Page 36
36
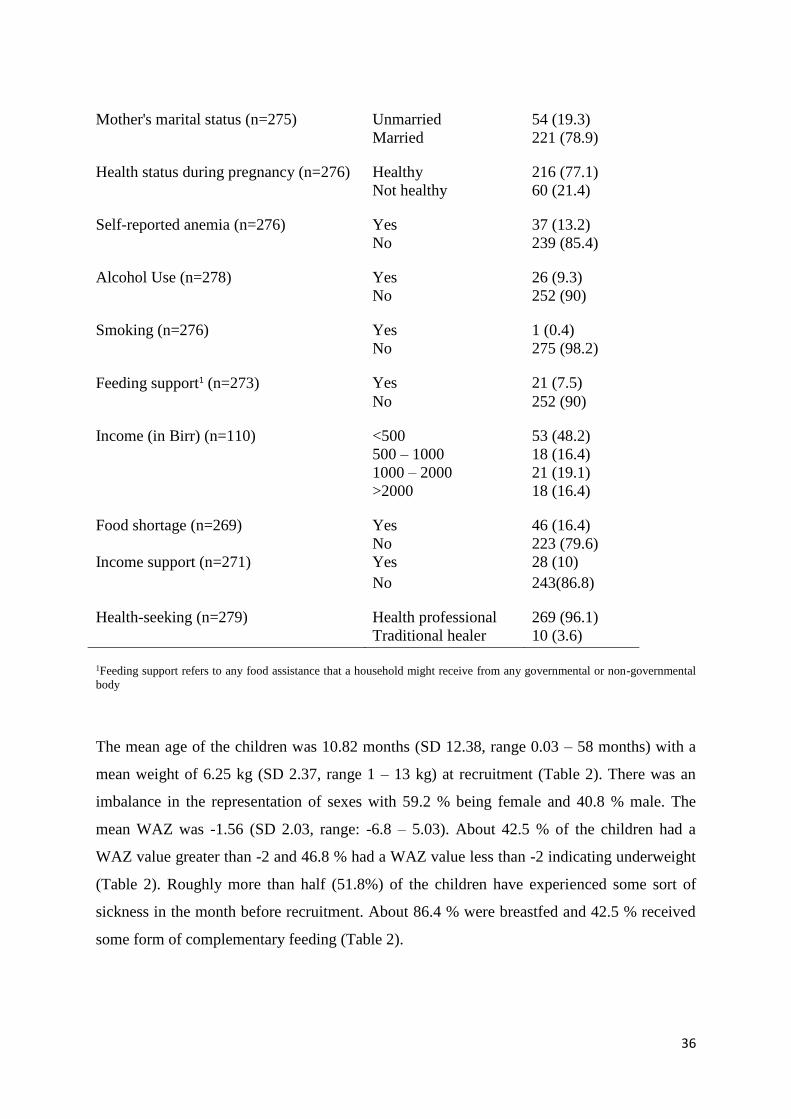
Mother's marital status (n=275) Unmarried 54 (19.3)
Married 221 (78.9)
Health status during pregnancy (n=276) Healthy 216 (77.1)
Not healthy 60 (21.4)
Self-reported anemia (n=276) Yes 37 (13.2)
No 239 (85.4)
Alcohol Use (n=278) Yes 26 (9.3)
No 252 (90)
Smoking (n=276) Yes 1 (0.4)
No 275 (98.2)
Feeding support1 (n=273) Yes 21 (7.5)
No 252 (90)
Income (in Birr) (n=110) <500 53 (48.2)
500 – 1000 18 (16.4)
1000 – 2000 21 (19.1)
>2000 18 (16.4)
Food shortage (n=269) Yes 46 (16.4)
No 223 (79.6)
Income support (n=271) Yes 28 (10)
No 243(86.8)
Health-seeking (n=279) Health professional 269 (96.1)
Traditional healer 10 (3.6)
1Feeding support refers to any food assistance that a household might receive from any governmental or non-governmental
body
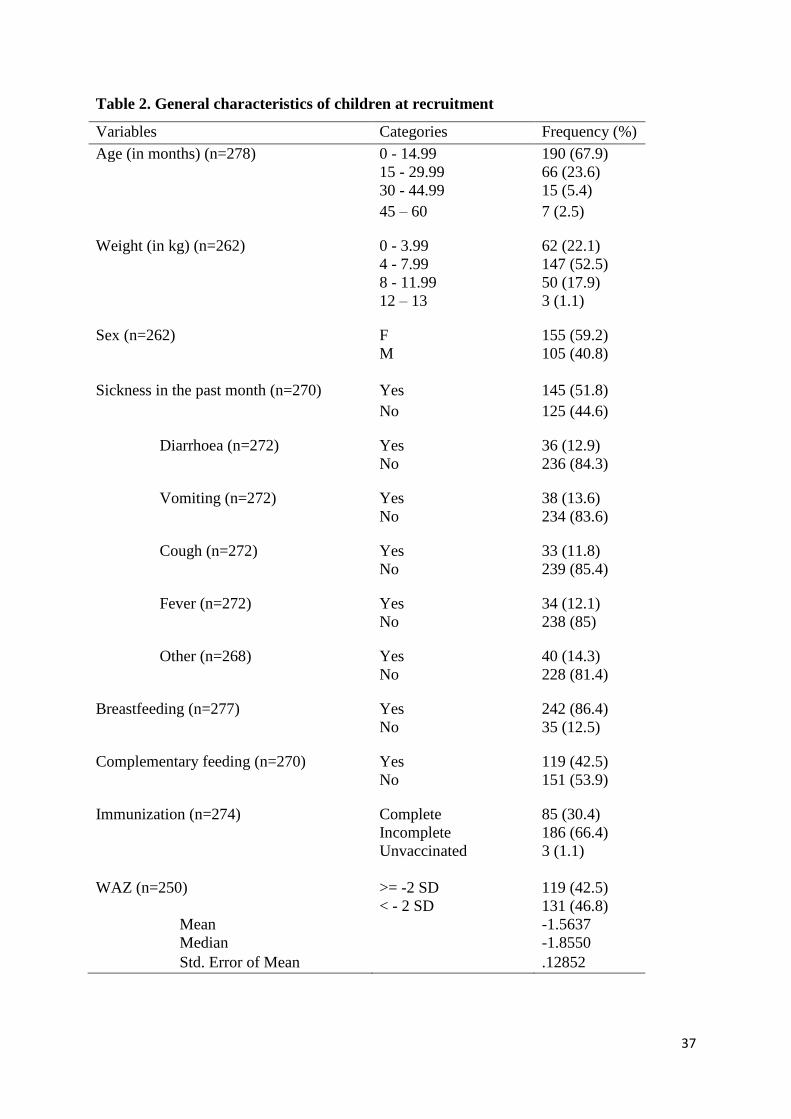
The mean age of the children was 10.82 months (SD 12.38, range 0.03 – 58 months) with a
mean weight of 6.25 kg (SD 2.37, range 1 – 13 kg) at recruitment (Table 2). There was an
imbalance in the representation of sexes with 59.2 % being female and 40.8 % male. The
mean WAZ was -1.56 (SD 2.03, range: -6.8 – 5.03). About 42.5 % of the children had a
WAZ value greater than -2 and 46.8 % had a WAZ value less than -2 indicating underweight
(Table 2). Roughly more than half (51.8%) of the children have experienced some sort of
sickness in the month before recruitment. About 86.4 % were breastfed and 42.5 % received
some form of complementary feeding (Table 2).
Page 37
37
Table 2. General characteristics of children at recruitment
Variables Categories Frequency (%)
Age (in months) (n=278) 0 - 14.99 190 (67.9)
15 - 29.99 66 (23.6)
30 - 44.99 15 (5.4)
45 – 60 7 (2.5)
Weight (in kg) (n=262) 0 - 3.99 62 (22.1)
4 - 7.99 147 (52.5)
8 - 11.99 50 (17.9)
12 – 13 3 (1.1)
Sex (n=262) F 155 (59.2)
M
105 (40.8)
Sickness in the past month (n=270) Yes 145 (51.8)
No 125 (44.6)
Diarrhoea (n=272) Yes 36 (12.9)
No 236 (84.3)
Vomiting (n=272) Yes 38 (13.6)
No 234 (83.6)
Cough (n=272) Yes 33 (11.8)
No 239 (85.4)
Fever (n=272) Yes 34 (12.1)
No 238 (85)
Other (n=268) Yes 40 (14.3)
No 228 (81.4)
Breastfeeding (n=277) Yes 242 (86.4)
No 35 (12.5)
Complementary feeding (n=270) Yes 119 (42.5)
No 151 (53.9)
Immunization (n=274) Complete 85 (30.4)
Incomplete 186 (66.4)
Unvaccinated 3 (1.1)
WAZ (n=250) >= -2 SD
< - 2 SD
119 (42.5)
131 (46.8)
Mean -1.5637
Median -1.8550
Std. Error of Mean .12852
Page 38
38
Table 3 presents the living environment characteristics of the households in which the
mothers and children find themselves in at the time of recruitment. 87.1 % were found to be
renting while water supply and toilet access are shared in majority of the households (75 %
and 66%, respectively). Poor waste disposal was registered for 37.1 % of the households,
poor environmental sanitation for 36.1 % of the households and poor personal hygiene for
29.3 % of the households. Mentor Mothers evaluated these characteristics.
Table 3. Living environment characteristics
Variables Categories Frequency (%)
Residence (n=276) Own 32 (11.4)
Rental 244 (87.1)
Water supply (n=275) Private 42 (15)
Shared 201 (75)
Well 23 (8.2)
Toilet (n=276) Private 11 (3.9)
Shared 185 (66.1)
Pit 80 (28.6)
Home sanitation (n=275) Good 85 (30.4)
Average 106 (37.9)
Poor 84 (30)
Environmental sanitation (n=275) Good 69(24.6)
Average 105(37.5)
Poor 101(36.1)
Waste disposal (n=266) Good 43(15.4)
Average 119(42.5)
Poor 104(37.1)
Personal hygiene (n=276) Good 86(30.7)
Average 108(38.6)
Poor 82(29.3)
Odor (n=276) Good 65(23.2)
Average 126(45)
Poor 85(30.4)
Page 39
39
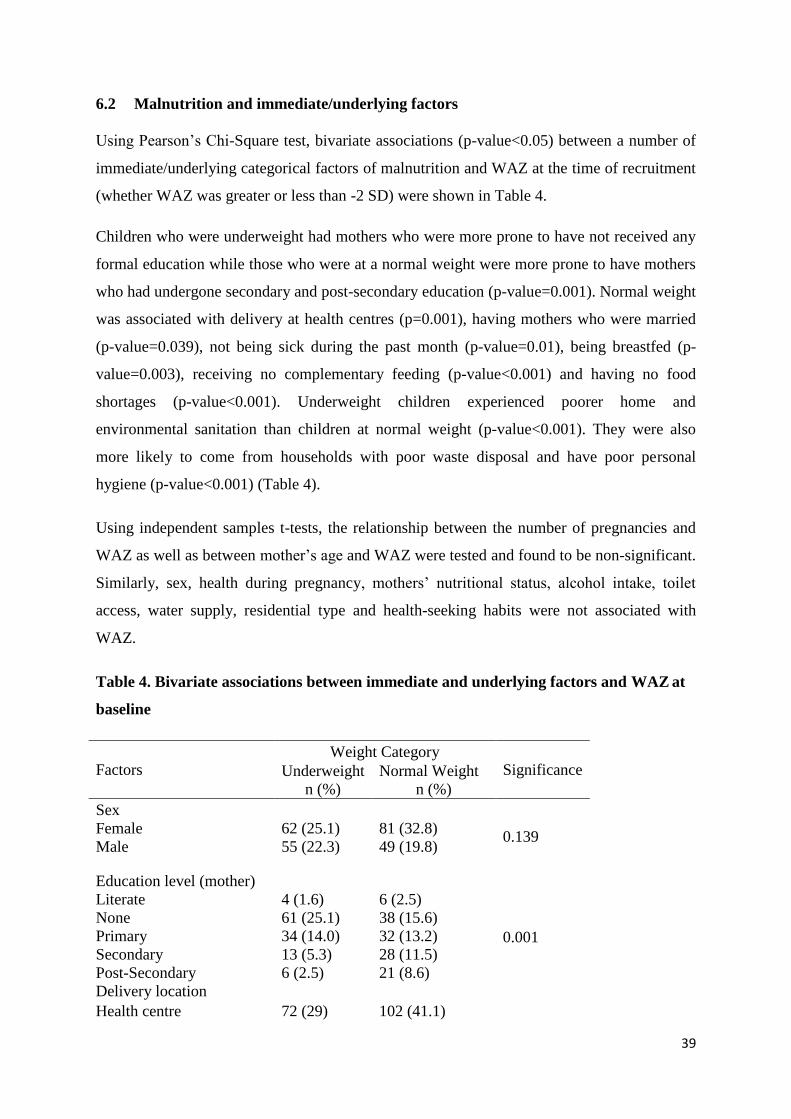
6.2 Malnutrition and immediate/underlying factors
Using Pearson’s Chi-Square test, bivariate associations (p-value<0.05) between a number of
immediate/underlying categorical factors of malnutrition and WAZ at the time of recruitment
(whether WAZ was greater or less than -2 SD) were shown in Table 4.
Children who were underweight had mothers who were more prone to have not received any
formal education while those who were at a normal weight were more prone to have mothers
who had undergone secondary and post-secondary education (p-value=0.001). Normal weight
was associated with delivery at health centres (p=0.001), having mothers who were married
(p-value=0.039), not being sick during the past month (p-value=0.01), being breastfed (p-
value=0.003), receiving no complementary feeding (p-value<0.001) and having no food
shortages (p-value<0.001). Underweight children experienced poorer home and
environmental sanitation than children at normal weight (p-value<0.001). They were also
more likely to come from households with poor waste disposal and have poor personal
hygiene (p-value<0.001) (Table 4).
Using independent samples t-tests, the relationship between the number of pregnancies and
WAZ as well as between mother’s age and WAZ were tested and found to be non-significant.
Similarly, sex, health during pregnancy, mothers’ nutritional status, alcohol intake, toilet
access, water supply, residential type and health-seeking habits were not associated with
WAZ.
Table 4. Bivariate associations between immediate and underlying factors and WAZ at
baseline
Factors Weight Category
Significance Underweight
n (%)
Normal Weight
n (%)
Sex
0.139 Female 62 (25.1) 81 (32.8)
Male 55 (22.3) 49 (19.8)
Education level (mother)
0.001
Literate 4 (1.6) 6 (2.5)
None 61 (25.1) 38 (15.6)
Primary 34 (14.0) 32 (13.2)
Secondary 13 (5.3) 28 (11.5)
Post-Secondary 6 (2.5) 21 (8.6)
Delivery location
Health centre 72 (29) 102 (41.1)
Page 40
40
Home 47 (19) 27 (10.9)
0.001
Marital status
Married 86 (35.0) 110 (44.7) 0.039
Unmarried 33 (13.3) 17 (6.8)
Healthy during pregnancy
0.949 No 25 (10.2) 28 (11.4)
Yes 92 (37.4) 101 (41.1)
Malnutrition (mother)
0.512 No 104 (42.1) 117 (47.4)
Yes 14 (5.7) 12 (4.9)
Alcohol consumption
0.857 No 107 (43.1) 117 (47.2)
Yes 11 (4.4) 13 (5.2)
Child sick past month
0.010
No 43 (17.8) 68 (28.2)
Yes 72 (29.9) 58 (24.1)
Diarrhoea (child)
0.012 No 95 (39.1) 116 (47.7)
Yes 22 (9.1) 10 (4.1)
Vomiting (child)
<0.001 No 89 (36.6) 118 (48.6)
Yes 28 (11.5) 8 (3.3)
Breastfeeding
0.003 No 23 (9.3) 9 (3.6)
Yes 94 (38.1) 121 (49.0)
Complementary Feeding
<0.001 No 41 (17.0) 92 (38.2)
Yes 75 (31.1) 33 (13.7)
Food Shortage
<0.001 No 83 (34.7) 113 (47.3)
Yes 32 (13.4) 11 (4.6)
Residence
0.245 Private 11 (4.4) 19 (7.6)
Rent 107 (43.0) 112 (45.0)
Page 41
41
Using those variables that showed significant association with WAZ in the bivariate
association analyses, a linear mixed model was constructed (Table 5). Of these, the variables
for complementary feeding (p-value = 0.024), food shortage (p-value = 0.001) and personal
hygiene (p-value < 0.001) had a significant association with WAZ at recruitment while
educational status (p-value = 0.477), marital status (p-value = 0.205), birth delivery location
(p-value = 0.573), breastfeeding (p-value = 0.139), home sanitation (p-value = 0.074) and
child sickness in the past month (p-value = 0.805) were not associated (Table 5).
Water supply
0.078
0.984
0.391
Private 13 (5.3) 28 (11.4)
Shared 93 (38.0) 90 (36.7)
Well 11 (4.5) 10 (4.1)
Toilet access
Pit 34 (13.8) 39 (15.9)
Private 5 (2.0) 6 (2.4)
Shared 77 (31.3) 85 (34.6)
Health-seeking
Medical 114 (45.6) 128 (51.2)
Traditional 5 (2.0) 3 (1.2)
Home sanitation
<0.001
Average 46 (18.8) 45 (18.4)
Good 21 (8.6) 60 (24.5)
Poor 50 (20.4) 23 (9.4)
Environmental sanitation
<0.001
Average 48 (19.6) 45 (18.4)
Good 15 (6.1) 49 (20.0)
Poor 55 (22.4) 33 (13.5)
Waste disposal
Average
Good
Poor
52 (21.9)
10 (4.2)
54 (22.8)
52 (21.9)
33 (13.9)
36 (15.2)
<0.001
Personal hygiene
Average 54 (22.0) 41 (16.7)
<0.001
<0.001
Good 17 (6.9) 64 (26.0)
Poor 47 (19.1) 23 (9.3)
Odour
Average 56 (22.8) 54 (22.0)
Good 15 (6.1) 47 (19.1)
Poor 47 (19.1) 27 (11.0)
Page 42
42
With 95% confidence, we can surmise that WAZ at baseline for children with good personal
hygiene was 2.819 (95% CI 1.478 - 4.160) points more than WAZ at baseline for children
with poor personal hygiene (p-value<0.001). Similarly, WAZ at baseline for children with
average personal hygiene was 1.319 (95% CI 0.284 - 2.353) points more than WAZ at
baseline for children with poor personal hygiene (p-value = 0.013). Additionally, those
children with good personal hygiene have a higher intercept than those with average personal
hygiene. This signifies that the better the personal hygiene, the higher WAZ at baseline was.
WAZ at baseline for children who did not receive complementary feeding was 0.750 (95% CI
1.401- 0.100) points higher than for those children who did (p-value = 0.024). WAZ at
baseline for children from households without food shortage was 1.302 (95% CI 2.042 -
0.563) points higher than for those children from households with food shortage (p-value =
0.001).
Table 5. Effect size of predictor variables of WAZ at baseline in a cross-sectional linear
mixed model
Variables Difference in
WAZ at baseline
Confidence
Interval
P-value
Education level (mother) 0.477
None +0.667 -0.436-1.769
Literate -0.638 -2.287-1.011
Primary +0.299 -0.743-1.340
Secondary +0.125 -0.959-1.208
Post-Secondary Ref. Ref
Illness in the past month
No
Yes
-0.745
Ref.
-0.669-0.520
Ref.
0.805
Delivery location
0.573
Health Centre -0.098 -0.762-0.565
Home Ref. Ref.
Marital status
0.205
Married -0.471 -1.201-0.259
Unmarried Ref. Ref.
Breastfeeding 0.139
Yes 0.586 -1.916-1.363
No Ref. Ref.
Complementary Feeding 0.024
Page 43
43
Yes -0.750 -1.401--0.100
No Ref. Ref.
Food Shortage
0.001
Yes -1.302 -2.042--0.563
No Ref. Ref.
Home sanitation
0.074
Good -1.518 -2.851--1.185
Average -0.964 -2.002-0.075
Poor Ref. Ref.
Personal hygiene
<0.001
Good +2.819 1.478-4.160
Average +1.319 0.284-2.353
Poor Ref. Ref.
6.3 Malnutrition status during the program
6.3.1 WAZ in whole study population and sub-groups during the program
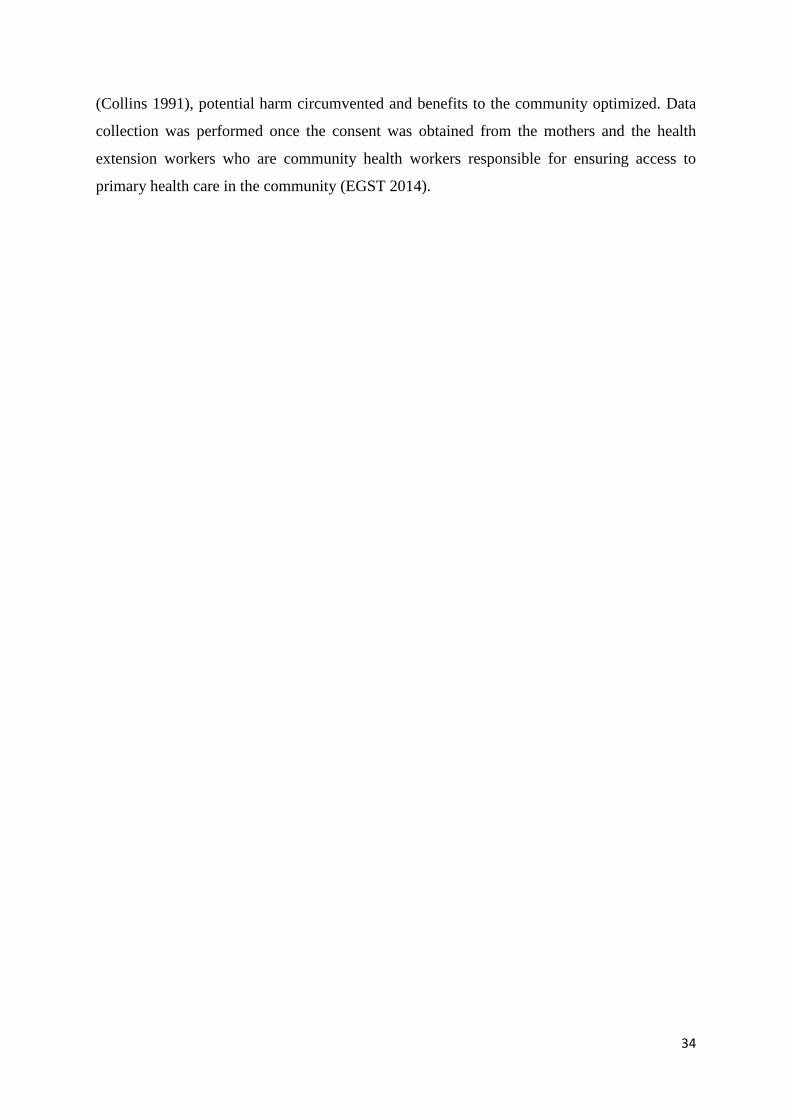
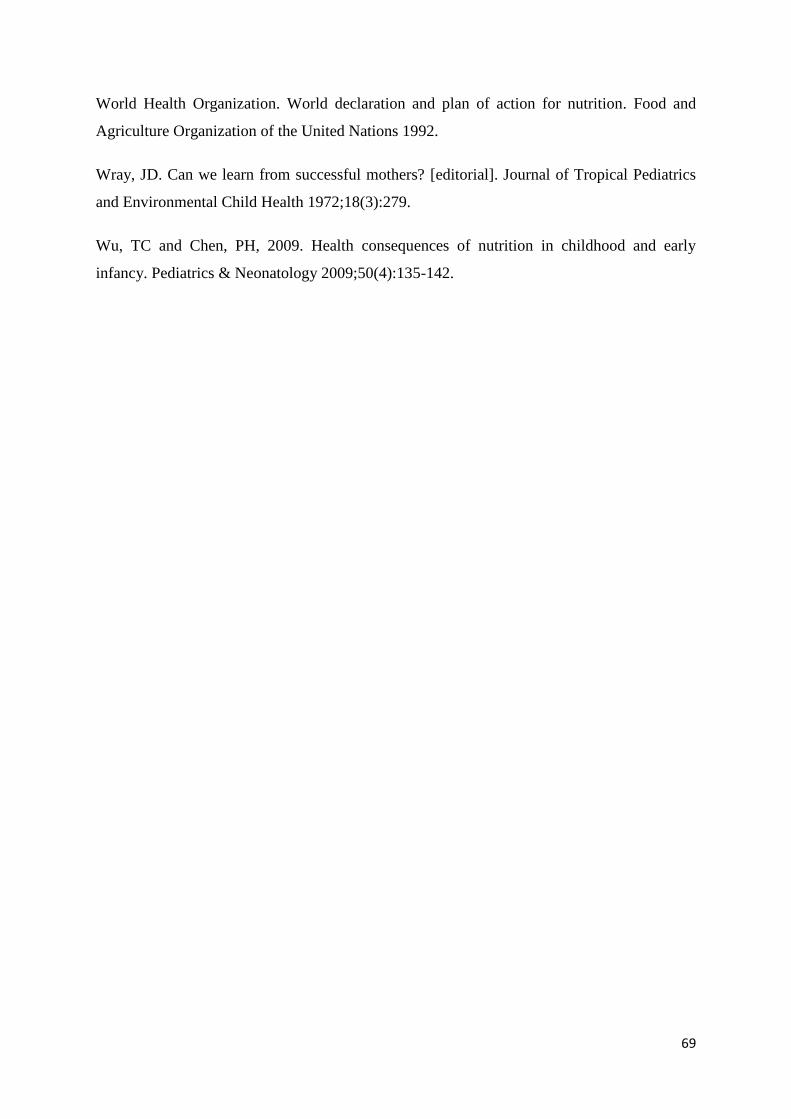
In general, over the 7 months, the mean WAZ showed a steady increase for the study
population (Figure 4, Table 6). In figure 4 and tables 7 and 8, the mean WAZ seems to have
increased more for children deemed underweight at the beginning of the intervention than for
those children at a normal weight. The mean WAZ for children at a normal weight presents
an overall downward slope. It is important to note that the number of missing WAZ values
was substantial and subsequently these graphs should be interpreted with caution.
Page 44
44
A. B
Figure 4. Mean WAZ in all children (A) and in underweight and normal weight (B)
Table 6. Descriptive statistics for WAZ during the first 7 months1
WAZ0 WAZ1 WAZ2 WAZ3 WAZ4 WAZ5 WAZ6 WAZ7
All children
N Valid 250 108 103 105 107 81 85 81
Mean -1.564 -1.160 -1.17 -.912 -.966 -.635 -.675 -.699
Minimum -6.80 -4.92 -5.70 -5.46 -4.37 -4.44 -4.22 -4.27
Maximum 5.03 4.25 3.82 3.69 3.60 3.26 2.67 2.50
Children underweight at recruitment
N Valid 119 46 47 41 49 32 35 35
Mean -3.261 -2.544 -2.413 -2.049 -2.005 -1.401 -1.338 -1.329
Minimum -6.80 -4.92 -5.70 -5.46 -4.37 -3.51 -4.22 -4.27
Maximum -2.01 -.53 -.27 1.63 1.69 2.19 2.38 2.50
Children with normal weight at recruitment
N Valid 131 58 54 61 54 47 46 44
Mean -.022 -.124 -.071 -.093 -.012 -.118 -.214 -.204
Page 45
45
Minimum -1.97 -2.18 -2.35 -2.63 -2.38 -4.44 -4.08 -3.00
Maximum 5.03 4.25 3.82 3.69 3.60 3.26 2.67 2.06
1WAZ0 – WAZ7 refer to weight-for-age Z scores of children in the program from month 1 to month 7
6.3.2 Determinants of WAZ changes in normal weight children
In the multivariate model of the sub-group of children of normal weight who participated in
the intervention (table 7), time spent in the intervention had a statistically significant effect on
WAZ. The table shows that WAZ seems to have faintly decreased over the course of the 7
months. The other explanatory variables in the model (food shortage, personal hygiene, home
sanitation and complementary feeding) do not show any statistical significance. The power of
the test was probably too weak due to the low number of subjects (n=131).
Table 7. Effect size of fixed factors in longitudinal model of normal weight children
(Linear mixed model)
Variables Difference in
WAZ
Confidence
Interval
P-value
Time
Month 7
Month 6
Month 5
Month 4
Month 3
Month 2
Month 1
Month 0
-0.403
-0.421
-0.322
-0.237
-0.298
-0.230
-0.138
Ref.
-0.679 - -0.126
-0.705 - -0.137
-0.608 - -0.035
-0.504 - -0.029
-0.555 - -0.042
-0.494-0.034
-0.397-0.122
Ref.
0.046
Complementary Feeding 0.385
No -0.244 -0.799-0.311
Yes Ref. Ref.
Food Shortage
0.105
No +0.740 -0.158-1.638
Yes Ref. Ref.
Home sanitation
0.301
Good -0.916 -2.56-0.727
Average -1.066 -2.45-0.315
Poor Ref. Ref.
Personal hygiene 0.305
Good +0.973 -0.635-2.580
Page 46
46
Average +1.071 -0.301-2.44
Poor Ref. Ref.
6.3.3 Determinants of WAZ trends in the whole sample during the program
Using the significant variables from the previous model, a longitudinal model was
constructed with time as a fixed factor (Table 8) to be able to discern the effect of 7 months
spent in the intervention on WAZ (p-value < 0.001). Complementary feeding, food shortage,
and personal hygiene all showed significance in this model with the exception of home
sanitation, which had a p-value of 0.742.
When observing the estimates of fixed effects and specifically the effect of time using the
first month as the baseline, we can surmise that the more time a child spent in the
intervention, the higher WAZ was (Table 8). The results in table 7 show that WAZ relatively
increased over the course of 7 months. The differences in WAZ for months 3, 2 and 1 were
respectively +0.257, +0.266 and +0.258 indicating smaller differences between these values
and the reference point, WAZ at month 0.
For the other explanatory factors, the trends over the first 7 months were similar to those of
the first month. The absence of complementary feeding and food shortages as well as better
personal hygiene were associated with a statistically significant relative increase in WAZ
(Table 8).
Page 47
47
Table 8. Effect size of fixed factors in the longitudinal linear mixed model
Variables Difference in WAZ Confidence Interval P-value
Time
Month 7
Month 6
Month 5
Month 4
Month 3
Month 2
Month 1
Month 0
+0.588
+0.560
+0.593
+0.432
+0.275
+0.266
+0.258
Ref.
0.333 – 0.843
0.299 – 0.820
0.327 – 0.860
0.197 – 0.669
0.037 – 0.514
0.029 – 0.502
0.020 – 0.495
Ref.
<0.001
Complementary Feeding 0.001
No +0.700 0.287-1.112
Yes Ref. Ref.
Food Shortage
0.019
No +0.632 0.105-1.159
Yes Ref. Ref.
Home sanitation
0.742
Good -0.371 -1.339-0.596
Average -0.245 -1.012-0.522
Poor Ref. Ref.
Personal hygiene
0.024
Good +1.330 0.376-2.286
Average +0.652 -0.103-1.
Poor Ref. Ref.
6.3.4 Determinants of WAZ changes in underweight children
The multivariate model of the sub-group of underweight children who participated in the
intervention demonstrates similar time trends to that of the longitudinal model for the whole
sample. The more time a child spent in the intervention, the higher WAZ for the child was
(Table 9). Using WAZ at Month 0 as a reference, we can observe that the gap between the
reference value and the previous months decreased progressively as time in the intervention
increased. The changes during months 0 to 4 were all statistically significant (p-value > 0.05)
with the exception of the fifth and sixth months. Similar to the normal weight subgroup, the
Page 48
48
explanatory variables describing personal hygiene, home sanitation, complementary feeding
and food shortages were not statistically significant.
Table 9. Effect size of fixed factors in longitudinal linear mixed model of underweight
children
Variables Difference in
WAZ
Confidence
Interval
P-value
Time
Month 7
Month 6
Month 5
Month 4
Month 3
Month 2
Month 1
Month 0
+1.832
+1.766
+1.764
+1.169
+1.040
+0.795
+0.634
Ref.
1.480-2.186
1.403-2.129
1.392-2.137
0.855-1.482
0.707-1.373
0.481-1.108
0.307-0.960
Ref.
<0.001
Complementary Feeding 0.239
No +0.232 -0.156-0.621
Yes Ref. Ref.
Food Shortage 0.841
No -0.040 -0.436-0.356
Yes Ref. Ref.
Home sanitation 0.912
Good +0.136 -0.577-0.849
Average +0.009 -0.521-0.539
Poor Ref. Ref.
Personal hygiene 0.278
Good +0.385 -0.366-1.136
Average +0.412 -0.101-0.925
Poor Ref. Ref.
6.3.5 Characteristics of children with missing weight measurements
Characteristics of children who continued to have all weight measurements were compared to
those children who had missing values during the program (Table 10). Children who were
lost to weight follow-up at the 7th month had mothers who were slightly older and had more
pregnancies than those children who were not lost (26.98 and 26.73 years respectively, p-
Page 49
49
value = 0.037 and 2.46 vs. 2.21 pregnancies, respectively, independent samples t-test p-value
= 0.013).
In comparing the children lost to follow-up and those who remained, there were no
differences in sex, mother’s marital status, mother’s health during pregnancy, mother’s
malnutrition status, food shortage, sickness frequency, residential type, water supply, toilet
access, health-seeking behaviour, waste disposal and environmental sanitation.
In children lost to follow-up, mothers who cannot read and write were relatively more
numerous. Primary, secondary and post-secondary education was also less common in this
group (p-value = 0.009). In children lost to follow-up, delivery at a health centre was less
common and delivery at home was more frequent (p-value < 0.001).
In children lost to follow-up, mother’s alcohol consumption was less frequent (p-value =
0.04), breastfeeding occurs less (p-value = 0.46), and complementary feeding was more
frequent (p-value < 0.001). Home sanitation in this sub-group was also poorer (p-value =
0.006) as was personal hygiene (p-value = 0.017). Children lost to follow-up came more from
households with poor odour (p-value = 0.010).
Table 10. Bivariate analysis of children lost to follow-up and retained by the 7th month
Factors
Data Availability at month 7
Significance Not
Available
n (%)
Available
n (%)
Sex
0.929 F 108 (41.2) 47 (17.9)
M 74 (28.2) 33 (12.6)
Education level (mother)
0.009
None 90 (33.5) 22 (8.2)
Literate 5 (1.9) 7 (2.6)
Primary 49 (18.2) 25 (9.3)
Secondary 30 (11.2) 14 (5.2)
Post-Secondary 15 (5.6) 12 (4.5)
Delivery location
<0.001 Health centre 122 (43.9) 68 (24.5)
Home 77 (27.7) 11 (4.0)
Page 50
50
Marital status
Married 7 (2.5) 1 (0.4) 0.150
Unmarried 189 (68.7) 74.8 (28.3)
Healthy during pregnancy
0.757 No 44 (15.9) 16 (5.8)
Yes 154 (55.8) 62 (22.5)
Malnutrition (mother)
0.505 No 175 (63.2) 72 (26.0)
Yes 23 (8.3) 7 (2.5)
Alcohol consumption
0.040 No 184 (66.2) 68 (24.5)
Yes 14 (5.0) 12 (4.3)
Child sick the past month
0.239 No 85 (31.5) 40 (14.8)
Yes 108 (40.0) 37 (13.7)
Diarrhoea (child)
0.472 No 171 (62.9) 65 (23.9)
Yes 24 (8.8) 12 (4.4)
Vomiting (child)
0.629 No 169 (62.1) 65 (23.9)
Yes 26 (9.6) 12 (4.4)
Breastfeeding
0.046 No 30 (10.8) 5 (1.8)
Yes 168 (60.6) 74 (26.7)
Complementary Feeding
<0.001 No 93 (34.4) 58 (21.5)
Yes 99 (36.7) 20 (7.4)
Food Shortage
0.372 No 155 (57.6) 68 (25.3)
Yes 35 (13.0) 11 (4.1)
Residence
0.475 Private 21 (7.6) 11 (4.0)
Rent 175 (63.4) 69 (25.0)
Water supply
0.325
Private 26 (9.5) 16 (5.8)
Shared 150 (54.5) 60 (21.8)
Well 18 (6.5) 5 (1.8)
Page 51
51
Toilet access
0.415
Pit 59 (21.4) 21 (7.6)
Private 6 (2.2) 5 (1.8)
Shared 130 (47.1) 55 (19.9)
Health-seeking
0.177 Medical 189 (67.7) 80 (28.7)
Traditional 9 (3.2) 1 (0.4)
Home sanitation
0.006
Average 77 (28.0) 29 (10.5)
Good 50 (18.2) 35 (12.7)
Poor 68 (24.7) 16 (5.8)
Environmental sanitation
0.051
Average 70 (25.5) 35 (12.7)
Good 44 (16.0) 25 (9.1)
Poor 80 (29.1) 21 (7.6)
Waste disposal
0.053
Average 87 (32.7) 32 (12.0)
Good 24 (9.0) 19 (7.1)
Poor 78 (29.3) 26 (9.8)
Personal hygiene
0.017
Average 77 (27.9) 31 (11.2)
Good 52 (18.8) 34 (12.3)
Poor 66 (23.9) 16 (5.8)
Odour
0.010
Average 89 (32.2) 37 (13.4)
Good 38 (13.8) 27 (9.8)
Poor 69 (25.0) 16 (5.8)
Page 52
52
7 DISCUSSION
7.1 Main Findings
The study revealed that WAZ is associated with a number of underlying and immediate
causes described by the UNICEF conceptual model of childhood malnutrition (UNICEF
2016) such as disease, care-giving practices, food security, sanitation and hygiene. Bivariate
analyses demonstrated relationships between higher WAZ scores and delivery at a health
centre, spousal presence, less illness frequency in the past month, more frequent
breastfeeding, less food shortages, better environmental sanitation, better waste disposal, and
better personal hygiene.
Multivariate analyses showed significant associations between WAZ and the children’s
personal hygiene, complementary feeding and food shortages. The absence of complementary
feeding, the absence of food shortages and better personal hygiene are associated with
relative increases in WAZ.
For the overall study population, WAZ improved over the initial 7 months with differences
most notable for those children who were deemed underweight at the beginning of the
intervention. Similar to the cross-sectional model describing WAZ during the first month of
intervention, the associations between WAZ and the explanatory factors of personal hygiene,
complementary feeding and food shortages remained statistically significant during the next
six months although these associations disappear in the sub-group analyses, presumably due
to the smaller sample sizes.
The intervention seemed to have had little effect on children who started out at a normal
weight. If anything, WAZ for that sub-group seemed to have slightly decreased over the 7
months but it is difficult to conclude definitively since only the results of the first month out
of the 7 months are statistically significant; there might have been differences occurring
during the other months that the small sample sizes might be masking. Alternatively, the
intervention might also be more suited to its objectives for those children who are
underweight and not those who were moderately underweight or at a normal weight at the
beginning of the intervention. A sizeable amount of children was lost to follow-up during the
7th month and they differed in many baseline characteristics from the children who had all the
measurements. In this lost to follow-up group, mothers who can’t read and write were
relatively more numerous; primary, secondary and post-secondary education were also less
Page 53
53
common in this group; delivery at a health centre was less frequent; alcohol consumption was
slightly lower; breastfeeding occurred less; and complementary feeding occurred more.
Home sanitation in this sub-group was also poorer as was personal hygiene.
7.2 Discussion of findings in relation to other studies
Our results on complementary feeding, food shortage, home sanitation, and personal hygiene
from the cross-sectional analysis reflect those of other studies (Saha 2009; Mukhopadhyay &
Biswas 2010; Spears et al. 2013; Ngure et al. 2014; Rah et al. 2015). Mukhopadhyay &
Biswas (2010) demonstrated that multiple anthropometric failures were more likely among
children aged 24-59 months receiving irregular complementary feeding and growing up in
severely food-insecure households. Saha et al. (2009) also found that household food security
was associated with greater weight and length gain in 1343 children from rural Bangladesh
followed from birth to 24 months of age. Ngure et al. (2014) noted an association of
improved water supply and sanitation with better growth outcomes in children in a number of
cross-sectional, case-control, and prospective cohort studies they reviewed. Rah et al. (2015)
similarly established that a lower prevalence of stunting in rural India is correlated with better
conditions of sanitation and hygiene practices. In the study, a 10% increase in rates of open
defecation was associated with a 0.7% increase in rates of both stunting and severe stunting.
Access to health care services, toilet access and disease showed no statistical significance in
this study contrary to the findings described in earlier literature (Katona & Katona Apte 2008;
Egata et al. 2014; Ngure et al. 2014). This could be due to two things: either their effects
were captured by other variables that showed significance or the restricted nature of the
questions asked to the mothers. For example, asking whether a child was ill solely in the past
month or whether or not they use a health center might not be specific enough to fully capture
the current health status and health services utilization, respectively.
Small scale-up studies from the early 1990s suggest that nutrition programs in Vietnam and
Haiti based on the PD model presented similar improvements. PD children had an adjusted
mean WAZ of –2.35 Z versus –2.59 Z for children in the non-PD group, although this
difference was not statistically significant (Marsh & Shroeder 2002). The benefits from this
program persisted well after program completion and even extended to younger siblings who
had never been exposed to the program (Mackintosh et al. 2002).
Page 54
54
When compared to the Philani Maternal Child Health and Nutrition Project in South Africa
on which this program is based, a number of common results emerge. In a randomized
control trial of the Philani project, a higher percentage of children in the intervention
condition were rehabilitated (WAZ score >= -2 SD) over the course of the study compared to
the control condition consisting of mothers and children under 5 from the same community
who were not invited to participate in the study (le Roux et al. 2010).
In a similar study, the authors found that the implementation of the Philani program in 37
neighborhoods in townships near Cape Town resulted in significantly greater weight gain
among the malnourished children who were a part of the intervention program than in the
children in the control group (le Roux et al. 2011). In this study (le Roux et al. 2011), two out
of each three mother-child unit (known as a dyad) were assigned to the Philani intervention
condition while the third dyad became a control case. Another study based on the program
found that children in the intervention group were 1.5 times less likely to be underweight and
2.4 times less likely to be severely underweight (Tomlinson et al. 2016).
Although this study did not allow for stunting measurements, another study of the Philani
program found that children enrolled in the program were more likely to have a stunting Z-
score greater than −2 SD (le Roux et al 2013). As observed in the normal weight group, a
lower than expected prevalence of malnutrition at baseline may lead to a lack of overall
impact on growth (Mackintosh et al. 2002).
These results bode well for the recent global shift to the use of community health workers in
generalist well-being interventions (Singh & Sachs, 2013): paraprofessionals can often be
good agents in the delivery of successful programs (Hadi 2003).
7.3 Strengths and weaknesses
The prospective aspect of the anthropometric measurements and the broad as well as
comprehensive nature of the questionnaire were some of the strengths of this study. The
Mentor Mothers were crucial to the process of collecting accurate information from members
of their own community in the widely-used language of the region (Afaan Oromo); this
contributed to making the targeted mothers comfortable in their responses. However, bias
could have resulted from the Mentor Mothers’ reports and follow-ups. Sub-grouping the
children according to the Mentor Mothers might have been one way to avoid this but the
Page 55
55
sample size was too small to carry out such an analysis and information of Mentor mother
was not recorded for all children. The lack of a control group is another limitation in the
design study. A control group would have contributed to more firmly establishing causality.
The diminishing availability of weight measurements during the first 7 months greatly
reduced the power of the study: by the 7th month, 71.1% of all weight measurements were
missing.
One strength of this study is its consideration of broader contextual factors including
mother’s education and socioeconomic status. However, missing values were one of the main
challenges of this study: 60.7% and 43.2% of the two variables that measured income were
missing (either a numerical income value or alternatively a question on the frequency of food
consumption in a day).
One limitation of this study was in understanding the link between complementary feeding
and WAZ. The transition from exclusive breastfeeding to foods usually extends from 6
months to 24 months of age (WHO 2015). For optimal growth and development, infants
should be exclusively breastfed below 6 months of age i.e. complementary feeding is not
recommended (WHO 2015). Although the results in this study show an inverse relationship
between complementary feeding and WAZ where a lack of complementary feeding is
associated with an increase in WAZ, it is difficult to surmise any meaningful conclusions
from these results since the age of children in the study ranges from 0 to 5 years of age. This
age range is too wide to fully understand the role of complementary feeding and to do so it
would be necessary to look at complementary feeding below and above 6 months of age.
Another limitation is that roughly half of the children were above the third percentile of WAZ
norms (>= -2 SD) at the beginning of the study and thus could not be characterized as a fully
underweight group that could adequately demonstrate improvements in WAZ. This was
unavoidable due to the broad spectrum of the intervention targets of the program beyond
malnutrition.
The lack of data on sex and exact date of birth posed a significant source of error for WAZ
calculations. Additionally, although Mentor Mothers received training before and during the
program, they are not health professionals thus there could have been more chances of error
in the weight measurements that could have affected the validity of the measurements.
However, a number of studies have shown that community members, with training, can
reliably collect anthropometric measurements (Ayele et al. 2012; Johnson et al. 2009;
Page 56
56
Ngirabega et al. 2010). In this study, errors were potentially minimized by a number of
aspects; each Mentor Mother had a weight scale so the same scale was used to measure the
same child and the electronic weight scales used were automatically calibrated.
Furthermore, the hygienic scales used in the questionnaire by the Mentor Mothers were
highly subjective, depending on the understanding and experiences of hygiene of each
Mentor Mother. It was difficult to ascertain what guiding criteria in assessing environmental
hygiene and sanitation was given from consulting the training manual used to train the
Mentor Mothers.
It is worth commenting on the consistency of results in table 6. The number of underweight
and normal weight children cannot be added to obtain the total number of children because
the underlying assumption for the sub-groups (underweight and normal weight) is that the
kids in these sub-groups have a value for weight at recruitment before being grouped.
Therefore all measures of WAZ from month 1 to 7 for these two children follow that
assumption. In the first grouping with the total number of children, there is no such
assumption, therefore a child in the total group may well not have a WAZ at recruitment but
may still appear in the successive months. This explains the slight differences when the
numbers of underweight and normal weight children are summed.
There is also an uncertainty in the use of WAZ as a way of understanding a child’s nutritional
status: using WAZ as the only indicator may underestimate the true load of undernutrition
(Seetharaman et al. 2007). WAZ does not distinguish between short children of appropriate
body weight and tall, thin children. WAZ reflects both the long-term nutritional experience
given by stunting and the short-term nutritional changes provided by wasting (de Onis et al.
2003, WHO 1986).
7.4 Recommendations
An implication of these findings is to include other nutritional indicators during the follow-
up, WAZ is an inexact tool and indicators such as stunting or wasting might provide a fuller
assessment of growth patterns amongst children. Another recommendation is to include more
follow-up indicators to monitor the wide range of objectives of the Mentor Mother program
(better hygiene and environmental practices, improved health status, better access to
Page 57
57
healthcare facilities and better caregiving practices) because having these tools to assess
outcomes will aid in better validating the program.
Page 58
58
8 CONCLUSION
The results of this study were fairly positive in confirming associations between malnutrition
and a number of contextual factors. From a nutritional perspective, the Mentor Mother
program is most beneficial for those children who are underweight at the time of recruitment
as this group showed the most significant decline in underweight in this study. In a country
such as Ethiopia which has shown positive results with a community-based approach to child
and maternal health, the Mentor Mother program is an additional tool in ensuring mothers’
and children’s wellbeing. However, the results obtained in this study need to be further
assessed in randomized controlled trials or in larger cohort studies along with the use of more
precise anthropometric indicators.
Page 59
59
9 REFERENCES
Agee, MD. Reducing child malnutrition in Nigeria: combined effects of income growth and
provision of information about mothers’ access to health care services. Social science &
medicine 2010;71(11):1973-1980.
Alemu ZA, Ahmed AA, Yalew AW, Birhanu BS. Non random distribution of child
undernutrition in Ethiopia: spatial analysis from the 2011 Ethiopia demographic and health
survey. International Journal for Equity in Health. 2016;15(1):198.
Amugsi, DA, Mittelmark, M.B., Lartey, A., Matanda, DJ and Urke, HB Influence of
childcare practices on nutritional status of Ghanaian children: a regression analysis of the
Ghana Demographic and Health Surveys. BMJ open 2014;4(11)
Andréasson, M. Halftime evaluation of the Mentor Mother Program in Ethiopia - focus on
women’s health. University of Gothenburg 2015.
Ayele, B, Aemere, A., Gebre, T, Tadesse, Z., Stoller, NE, See, CW, Sun, NY, Gaynor, BD,
McCulloch, CE, Porco, TC and Emerson, PM. Reliability of measurements performed by
community-drawn anthropometrists from rural Ethiopia. PloS one 2012;7(1).
Berggren WL, Wray JD. Positive deviant behavior and nutrition education. Food and
nutrition bulletin 2002;23(4 Suppl):7-8.
Black, RE, Allen, LH, Bhutta, ZA, Caulfield, LE, De Onis, M, Ezzati, M, Mathers, C, Rivera,
J and Maternal and Child Undernutrition Study Group. Maternal and child undernutrition:
global and regional exposures and health consequences. The Lancet 2008; 371(9608):243-
260.
Black, RE, Victora, CG, Walker, SP, Bhutta, ZA, Christian, P, De Onis, M, Ezzati, M,
Grantham-McGregor, S, Katz, J, Martorell, R and Uauy, R. Maternal and child undernutrition
and overweight in low-income and middle-income countries. The Lancet 2013;382(9890):
427-451.
Black, RE, Victora, CG, Walker, SP, Bhutta, ZA, Christian, P, De Onis, M, Ezzati, M,
Grantham-McGregor, S, Katz, J, Martorell, R and Uauy, R. Maternal and child undernutrition
Page 60
60
and overweight in low-income and middle-income countries. The Lancet 2013;382(9890):
427-451.
Blaney, S, Beaudry, M and Latham, M. Determinants of undernutrition in rural communities
of a protected area in Gabon. Public health nutrition 2009;12(10):1711-1725.
Blössner, M, de Onis, M. Malnutrition: quantifying the health impact at national and local
levels. Geneva, World Health Organization, 2005. WHO Environmental Burden of Disease
Series, No. 12. (Accessed 02.12.2015).
http://www.who.int/quantifying_ehimpacts/publications/MalnutritionEBD12.pdf?ua=1
Bolles, K, Speraw, C, Berggren, G and Lafontant, JG. Ti Foyer (hearth) community-based
nutrition activities informed by the positive deviance approach in Leogane, Haiti: A
programmatic description. Food and nutrition bulletin 2002;23(4 suppl2): 9-15.
Brinkman, HJ, de Pee, S, Sanogo, I, Subran, L and Bloem, MW. High food prices and the
global financial crisis have reduced access to nutritious food and worsened nutritional status
and health. The Journal of nutrition 2010;140(1):153S-161S.
Buor, D. Analysing the primacy of distance in the utilization of health services in the Ahafo‐
Ano South district, Ghana. The International journal of health planning and management
2003;18(4):293-311.
Calder, PC and Jackson, AA. Undernutrition, infection and immune function. Nutrition
research reviews 2000;13(01):3-29.
Calloway, DH, Murphy, SP, Beaton, GH, Allen, L, Horan, H, Merrill, KA, Balderston, J,
Jerome, N, Neumann, C and Bwibo, N. Food intake and human function: a cross-project
perspective of the Collaborative Research Support Program in Egypt Kenya and Mexico
1988.
Central Statistical Agency of Ethiopia and ICF International. Ethiopia Demographic and
Health Survey 2011. (Accessed 02.12.2015).
http://www.unicef.org/ethiopia/ET_2011_EDHS.pdf
Central Statistical Agency of Ethiopia. Ethiopia Mini Demographic and Health Survey 2014.
(Accessed 02.12.2015). http://www.unicef.org/ethiopia/Mini_DHS_2014__Final_Report.pdf
Page 61
61
Child growth indicators and their interpretation. Global Database on Child Growth and
Malnutrition. World Health Organization 2015. (Accessed. 02 Dec. 2015).
http://www.who.int/nutgrowthdb/about/introduction/en/index2.html.
Collins, M. The case for samples of anonymized records from the 1991 census. Journal of the
Royal Statistical Society 1992;155: 165-166.
Cook, JT. Clinical implications of household food security: definitions, monitoring, and
policy. Nutrition in Clinical Care 2002;5(4): 152-167.
Cook, JT, Frank, DA, Berkowitz, C, Black, MM, Casey, PH, Cutts, DB, Meyers, AF,
Zaldivar, N, Skalicky, A, Levenson, S and Heeren, T. Food insecurity is associated with
adverse health outcomes among human infants and toddlers. The Journal of nutrition
2004;134(6):1432-1438.
De Onis, M and Blössner, M. The World Health Organization global database on child
growth and malnutrition: methodology and applications. International journal of
epidemiology 2003;32(4):518-526.
Dearden, KA, Do, M, Marsh, DR, Schroeder, DG, Pachón, H and Lang, TT. What influences
health behavior? Learning from caregivers of young children in Viet Nam. Food and nutrition
bulletin 2002;23(4 suppl2):117-127.
Description. WHO Global Database on Child Growth and Malnutrition. World Health
Organization, 2016. (Accessed 17.12.2016).
http://www.who.int/nutgrowthdb/about/introduction/en/index2.html.
Egata, G, Berhane, Y and Worku, A. Predictors of acute undernutrition among children aged
6 to 36 months in east rural Ethiopia: a community based nested case-control study. BMC
pediatrics 2014;14(1):1.
EGST Community Outreach Practicum Project background and up-to-date progress
presentation 2014. Ethiopian Graduate School of Theology. Internal Report.
EHNRI: Profile and Role in the National Nutrition Programme. Field Exchange. ENN.
(Accessed 04.12.2015). http://www.ennonline.net/fex/40/ehnri.
Page 62
62
E-Library of Evidence for Nutrition Actions (eLENA): Appropriate Complementary Feeding.
World Health Organization, 2017. (Accessed 10.02.2017)
http://www.who.int/elena/titles/complementary_feeding/en/.
Engle, PL, Menon, P and Haddad, L. Care and nutrition: concepts and measurement. World
Development 1999;27(8):1309-1337.
ENN Online Technical Notes (Module 5). Emergency Nutrition Network. (Accessed
14.01.2015). http://files.ennonline.net/attachments/1963/htp-module-5-technical-notes.pdf
FAO, I. The state of food insecurity in the world 2015.
Fenn, B and Penny, ME. Using the new World Health Organisation growth standards:
differences from 3 countries. Journal of pediatric gastroenterology and nutrition 2008;
46(3):316-321.
Gorstein, J, Sullivan, K, Yip, R, De Onis, M, Trowbridge, F, Fajans, P and Clugston, G.
Issues in the assessment of nutritional status using anthropometry. Bulletin of the World
Health Organization 1994;72(2):273.
Grantham-McGregor, SM, Powell, CA, Walker, SP, & Himes, JH. Nutritional
supplementation, psychosocial stimulation, and mental development of stunted children: the
Jamaican Study. The Lancet 1991;338(8758): 1-5.
Hadi, A. Management of acute respiratory infections by community health volunteers:
experience of Bangladesh Rural Advancement Committee (BRAC). Bulletin of the World
Health Organization 2003;81(3):183-189.
Hoeree, T, Kolsteren, P and Roberfroid, D, 2001. [Management of malnutrition in preschool
children: the role of primary health care services]. Sante (Montrouge, France) 2001;12(1):94-
99.
Holeta City Administration. Ministry of Urban Development and Housing. (Accessed
17.12.2016). http://www.mwud.gov.et/web/holeta/home.
Humphrey, JH. Child undernutrition, tropical enteropathy, toilets, and handwashing. The
Lancet 2009;374(9694):1032-1035.
Page 63
63
Immediate Causes of Undernutrition. Causes and Most Vulnerable to Undernutrition -
Immediate Causes of Undernutrition. UNICEF. Accessed 17.12.2016.
http://www.unicef.org/nutrition/training/2.5/5.html.
Johnson W, Cameron N, Dickson P, Emsley S, Raynor P, Seymour C, Wright J. The
reliability of routine anthropometric data collected by health workers: a cross-sectional study.
International journal of nursing studies 2009;46(3):310-6.
Kaluski, DN, Ophir, E and Amede, T. Food security and nutrition–the Ethiopian case for
action. Public health nutrition 2002;5(03):373-381.
Kavle, JA, Mehanna, S, Saleh, G, Fouad, MA, Ramzy, M, Hamed, D, Hassan, M,
Keusch, G.T. Symposium: Nutrition and Infection, Prologue and Progress Since 1968. The
Journal of Nutrition 2003;133:328S-S.
Khan, G and Galloway, R. Exploring why junk foods are ‘essential’foods and how culturally
tailored recommendations improved feeding in Egyptian children. Maternal & child nutrition
2015;11(3):346-370.
Lapping, K, Marsh, DR, Rosenbaum, J, Swedberg, E, Sternin, J, Sternin, M and Schroeder,
DG. The positive deviance approach: Challenges and opportunities for the future. Food and
Nutrition Bulletin 2002;23(4 suppl2):128-135.
Law, M. Reduce, Reuse, Recycle: Issues in the Secondary Use of Research Data. IASSIST
Quarterly 2005;29.1: 5-10.
Le Roux, IM, le Roux, K, Comulada, WS, Greco, EM, Desmond, KA, Mbewu, N, &
Rotheram-Borus, MJ. Home visits by neighborhood Mentor Mothers provide timely recovery
from childhood malnutrition in South Africa: results from a randomized controlled trial. Nutr
J 2010;9(56): 1-10.
le Roux, IM, le Roux, K, Mbeutu, K, Comulada, WS, Desmond, KA and Rotheram-Borus,
MJ. A randomized controlled trial of home visits by neighborhood mentor mothers to
improve children's nutrition in South Africa. Vulnerable children and youth studies
2011;6(2):91-102.
Page 64
64
le Roux, IM, Tomlinson, M, Harwood, JM, O’Connor, MJ, Worthman, CM, Mbewu, N,
Stewart, J, Hartley, M, Swendeman, D, Comulada, WS and Weiss, RE. Outcomes of home
visits for pregnant mothers and their Infants: a cluster randomised controlled trial. AIDS
(London, England) 2013;27(9):1461.
Lutter, CK, Daelmans, BM, de Onis, M, Kothari, M., Ruel, MT, Arimond, M, Deitchler, M,
Dewey, KG, Blössner, M and Borghi, E. Undernutrition, poor feeding practices, and low
coverage of key nutrition interventions. Pediatrics 2011;2011.
Mackintosh, UAT, Marsh, DR and Schroeder, DG. Sustained positive deviant child care
practices and their effects on child growth in Viet Nam. Food and nutrition bulletin
2002;23(4 suppl2):16-25.
Marsh, DR and Schroeder, DG. The positive deviance approach to improve health outcomes:
experience and evidence from the field—Preface. The Positive Deviance Approach to
Improve Health Outcomes: Experience and Evidence from the Field 2002;23(4):3.
Marsh, DR, Schroeder, DG, Dearden, KA, Sternin, J and Sternin, M. The power of positive
deviance. Bmj 2004;329(7475):1177-1179.
Martin-Prevel, Y. [" Care" and public nutrition]. Sante (Montrouge, France) 2011;12(1):86-
93.
Megabiaw, B, and Azizur R. Prevalence and determinants of chronic malnutrition among
under-5 children in Ethiopia. International Journal of Child Health and Nutrition
2013;2.3:230-236.
Morrow, V, Boddy, J and Lamb, R. The Ethics of Secondary Data Analysis: Learning from
the Experience of Sharing Qualitative Data from Young People and Their Families in an
International Study of Childhood Poverty. Sussex Research Online. University of Sussex
2014, (Accessed 14 Mar. 2016). <http://sro.sussex.ac.uk/49123/>.
Mukhopadhyay, DK and Biswas, AB. Food security and anthropometric failure among tribal
children in Bankura, West Bengal. Indian pediatrics 2011;48(4):311-314.
Page 65
65
Murray, R, Bhatia, J, Okamoto, J, Allison, M, Ancona, R, Attisha, E, De Pinto, C, Holmes,
B, Kjolhede, C, Lerner, M and Minier, M. Snacks, sweetened beverages, added sugars, and
schools. Pediatrics 2015;135(3):575-583.
Mutisya, M, Kandala, NB, Ngware, MW and Kabiru, CW. Household food (in) security and
nutritional status of urban poor children aged 6 to 23 months in Kenya. BMC public health
2015;15(1):1.
National Nutrition Programme: 2013 - 2015. World Health Organization. Government of the
Federal Democratic Republic of Ethiopia. (Accessed 4.12.2015).
https://www.unicef.org/ethiopia/National_Nutrition_Programme.pdf.
Ngirabega JD, Hakizimana C, Wendy L, Munyanshongore C, Donnen P, Dramaix-Wilmet
M. Reliability of anthropometric measurements performed by community nutrition workers
in a community-based pediatric growth-monitoring program in rural Rwanda. Revue
D'epidemiologie et de Sante Publique 2010;58(6):409-14.
Ngure, FM, Reid, BM, Humphrey, JH, Mbuya, MN, Pelto, G and Stoltzfus, RJ. Water,
sanitation, and hygiene (WASH), environmental enteropathy, nutrition, and early child
development: making the links. Annals of the New York Academy of Sciences
2014;1308(1):118-128.
Nti, CA and Lartey, A. Influence of care practices on nutritional status of Ghanaian children.
Nutrition research and practice 2008;2(2):93-99.
Nutrition. UNICEF Ethiopia - Nutrition. United Nations Children's Fund. 2016. (Accessed
17.12.2016). https://www.unicef.org/ethiopia/nutrition.html.
Olsen, IE, Mascarenhas, MR, Stallings, VA, Walker, WA, Watkins, JB, & Duggan, C.
Clinical assessment of nutritional status. Nutrition in Pediatrics, Basic Science and Clinical
Applications 2003;3:6-16.
Pelletier, DL, Deneke, K, Kidane, Y, Haile, B and Negussie, F. The food-first bias and
nutrition policy: lessons from Ethiopia. Food Policy 1995;20(4):279-298.
Page 66
66
Peters, DH, Garg, A, Bloom, G, Walker, DG, Brieger, WR and Hafizur Rahman, M. Poverty
and access to health care in developing countries. Annals of the New York Academy of
Sciences 2008;1136(1):161-171.
Physical status: the use and interpretation of anthropometry. Report of a WHO Expert
Committee. Geneva, World Health Organization 1995; Technical Report Series No. 854.
Pongou, R, Salomon, JA and Ezzati, M. Health impacts of macroeconomic crises and
policies: determinants of variation in childhood malnutrition trends in Cameroon.
International journal of epidemiology 2006;35(3):648-656.
Puett, C and Guerrero, S. Barriers to access for severe acute malnutrition treatment services
in Pakistan and Ethiopia: A comparative qualitative analysis. Public health nutrition
2015;18(10):1873-1882.
Rah, JH, Cronin, AA, Badgaiyan, B, Aguayo, VM, Coates, S and Ahmed, S. Household
sanitation and personal hygiene practices are associated with child stunting in rural India: a
cross-sectional analysis of surveys. BMJ open 2015;5(2)
Rodriguez-Oliveros, MG, Bisogni, CA and Frongillo, EA. Knowledge about food
classification systems and value attributes provides insight for understanding complementary
food choices in Mexican working mothers. Appetite 2014;83:144-152.
Rotheram-Borus, MJ, Le Roux, IM, Tomlinson, M, Mbewu, N, Comulada, WS, Le Roux, K,
Stewart, J, O’Connor, MJ, Hartley, M, Desmond, K and Greco, E. Philani Plus (+): a Mentor
Mother community health worker home visiting program to improve maternal and infants’
outcomes. Prevention Science 2011;12(4):372-388.
Ruel, MT, Levin, CE, Armar-Klemesu, M, Maxwell, D and Morris, SS. Good care practices
can mitigate the negative effects of poverty and low maternal schooling on children’s
nutritional status: evidence from Accra. World Development 1999;27(11)1993-2009.
Saha, KK, Frongillo, EA, Alam, DS, Arifeen, SE, Persson, LÅ and Rasmussen, KM.
Household food security is associated with growth of infants and young children in rural
Bangladesh. Public health nutrition 2009;12(09):1556-1562.
Page 67
67
Sánchez-Pérez, HJ, Hernán, MA, Ríos-González, A, Arana-Cedeño, M, Navarro, A, Ford, D,
Micek, MA and Brentlinger, P. Malnutrition among children younger than 5 years-old in
conflict zones of Chiapas, Mexico. American journal of public health 2007;97(2):229-232.
Schooley, J and Morales, L. Learning from the Community to Improve Maternal—Child
Health and Nutrition: The Positive Deviance/Hearth Approach. Journal of midwifery &
women’s health 2007;52(4):376-383.
Scrimshaw, NS, Taylor, CE and Gordon, JE. Interactions of nutrition and infection. Wld Hlth
Org. Monogr 1968;(57).
Seetharaman, N, Chacko, TV, Shankar, SLR. and Mathew, AC. Measuring malnutrition-The
role of Z scores and the composite index of anthropometric failure (CIAF). Indian Journal of
Community Medicine 2007;32(1):35.
Sen, A. Ingredients of famine analysis: availability and entitlements. The quarterly journal of
economics 1981:433-464.
Sethi, V, Kashyap, S, Seth, V and Agarwal, S. Encouraging appropriate infant feeding
practices in slums: a positive deviance approach. Pakistan J Nutr 2003;2(3):164-6.
Singh, P and Sachs, JD. 1 million community health workers in Sub-Saharan Africa by 2015.
The Lancet 2013;382(9889):363-365.
Sjöling, L. Halftime Evaluation of the Mentor Mother Program in Ethiopia and its Impact on
Child Health. University of Gothenburg 2015.
Smith, LC and Haddad, LJ. Explaining child malnutrition in developing countries: A cross-
country analysis (Vol. 111). Intl Food Policy Res Inst. 2000
Spears, D, Ghosh, A and Cumming, O. Open defecation and childhood stunting in India: an
ecological analysis of new data from 112 districts. PLoS One 2013;8(9)
Sternin, M, Sternin, J and Marsh, DL. Rapid sustained childhood malnutrition alleviation
through a positive-deviance approach in rural Vietnam: preliminary findings. 1996
Page 68
68
Swindale, A and Bilinsky, P. Development of a universally applicable household food
insecurity measurement tool: process, current status, and outstanding issues. The Journal of
nutrition 2006;136(5):1449S-1452S.
The Cost of Hunger in Ethiopia: Implications for the Growth and Transformation of Ethiopia.
United Nations Children's Fund 2015. (Accessed 02.12.2015).
http://www.unicef.org/ethiopia/FINAL_Ethiopia_COHA_Summary_Report_June_20_24pg_
72dpi.pdf.
Tomlinson, M, Hartley, M, Le Roux, IM and Rotheram-Borus, MJ. The Philani Mentor
Mothers Intervention: neighbourhood wide impact on child growth in Cape Town’s peri-
urban settlements. Vulnerable Children and Youth Studies 2016;11(3):211-220.
United Nations Millennium Development Goals. United Nations. (Accessed 05.01.2017)
http://www.un.org/millenniumgoals/poverty.shtml.
Victora, CG, Adair, L, Fall, C, Hallal, PC, Martorell, R, Richter, L, Sachdev, HS and
Maternal and Child Undernutrition Study Group. Maternal and child undernutrition:
consequences for adult health and human capital. The lancet 2008;371(9609):340-357.
WHO | Malnutrition. WHO. World Health Organization, 2016. (Accessed 17.12.2016)
http://www.who.int/maternal_child_adolescent/topics/child/malnutrition/en/
WHO Working Group, 1986. Use and interpretation of anthropometric indicators of
nutritional status. Bulletin of the World Health Organization 1986;64(6):929.
Wishik, SM and Vynckt, S, 1976. The use of nutritional 'positive deviants' to identify
approaches for modification of dietary practices. American Journal of Public Health
1976;66(1):38-42.
Wollinka, O, Keeley, E, Burkhalter, BR and Naheed Bashir. Hearth Nutrition Model:
Applications in Haiti, Vietnam, and Bangladesh. Published for the U.S. Agency for
International Development and World Relief Corporation by the Basic Support for
Institutionalizing Child Survival (BASICS) Project 1997. (Accessed 02.12.2015).
http://www.basics.org/documents/pdf/1997%20Wollinka%20etal.%20Hearth%20nutrition%2
0model...%20WRC%26BASICS.pdf
Page 69
69
World Health Organization. World declaration and plan of action for nutrition. Food and
Agriculture Organization of the United Nations 1992.
Wray, JD. Can we learn from successful mothers? [editorial]. Journal of Tropical Pediatrics
and Environmental Child Health 1972;18(3):279.
Wu, TC and Chen, PH, 2009. Health consequences of nutrition in childhood and early
infancy. Pediatrics & Neonatology 2009;50(4):135-142.