21
Appraisal in Appraisal in Counseling Counseling Session 2 Session 2
| Date post: | 20-Dec-2015 |
| Category: |
Documents |
| View: | 218 times |
| Download: | 2 times |

Appraisal in CounselingAppraisal in Counseling
Session 2Session 2

ScheduleSchedule
Finish HistoryFinish History Statistical Concepts Statistical Concepts Scales of measurement Scales of measurement Norm-referenced versus Criterion-Norm-referenced versus Criterion-
referenced instruments referenced instruments Measures of Central TendencyMeasures of Central Tendency The Normal CurveThe Normal Curve Measures of VariabilityMeasures of Variability Types of ScoresTypes of Scores

Statistics in AppraisalStatistics in Appraisal1.1. A language, communication, from A language, communication, from
one professional to another.one professional to another.2.2. How much confidence can I put in How much confidence can I put in
this instrument’s scores?this instrument’s scores?3.3. Will I consistently get the same Will I consistently get the same
scores every time I administer the scores every time I administer the instrument?instrument?
4.4. Do the scores really measure the Do the scores really measure the concept or construct I want to concept or construct I want to measure?measure?
5.5. What can this instrument tell us? What can this instrument tell us? What can it not tell us?What can it not tell us?
6.6. What is the meaning of the score(s)? What is the meaning of the score(s)? Compared to…?Compared to…?
7.7. How can scores be explained?How can scores be explained?
AssessmentAssessment
Standards for Educational and Standards for Educational and Psychological Testing – any method Psychological Testing – any method used to measure characteristics of used to measure characteristics of people, programs or objects.people, programs or objects.
Anastasi & Urbina– objective, Anastasi & Urbina– objective, standardized measure of a sample of standardized measure of a sample of behaviorbehavior
Cronbach – systematic procedure for Cronbach – systematic procedure for observing behavior and describing it observing behavior and describing it with the aid of numerical scales or with the aid of numerical scales or fixed categories.fixed categories.

Samples of BehaviorSamples of Behavior
Usually measuring constructs such as Usually measuring constructs such as intelligence, interest, etc. which intelligence, interest, etc. which cannot be measured directly.cannot be measured directly.
Since only samples are gathered Since only samples are gathered must determine if sample is how must determine if sample is how person usually acts and are person usually acts and are inferences we are making correct.inferences we are making correct.
Use objective, standardized and Use objective, standardized and systematic measures to gather systematic measures to gather samples.samples.

Assessment Integral to Assessment Integral to CounselingCounseling
Assessing client problems.Assessing client problems. Conceptualizing and defining client Conceptualizing and defining client
problemsproblems Selecting and implementing effective Selecting and implementing effective
treatmenttreatment Evaluating counseling.Evaluating counseling.

Benefits of Using TestingBenefits of Using Testing
Aids focusing on developmental issuesAids focusing on developmental issues Aids problem solvingAids problem solving Helps decision makingHelps decision making Psychoeducational toolsPsychoeducational tools
Data indicate about 73% of Data indicate about 73% of counselors responded tests very counselors responded tests very important or important; only 9% important or important; only 9% said never used.said never used.

Minimum Competency for Minimum Competency for Proper Test UseProper Test Use
Proper testing Proper testing environmentenvironment
Examinee follows Examinee follows directions so test directions so test scores are accuratescores are accurate
Avoid coaching or Avoid coaching or trainingtraining
Scoring errorsScoring errors Avoid scoring & Avoid scoring &
recording errorsrecording errors Keep scoring keys & Keep scoring keys &
test materials securetest materials secure Know your instrument’s Know your instrument’s
psychometric psychometric propertiesproperties
Counseling and Counseling and interpretationinterpretation
Establish rapportEstablish rapport Know the instrument Know the instrument
and the construct and the construct completelycompletely
Willing to interpret & Willing to interpret & offer guidance offer guidance
Avoid labeling people Avoid labeling people on basis of test scoreson basis of test scores
Careful about assuming Careful about assuming norms for one group norms for one group apply to other groupsapply to other groups
Do your homeworkDo your homework
StatisticsStatistics
Scales of MeasurementScales of Measurement NominalNominal OrdinalOrdinal Interval Interval RationRation

NominalNominal categories, not rankedcategories, not ranked manipulating the numbers manipulating the numbers
arithmetically makes no arithmetically makes no sensesense
Example:Example: Continent of Birth Continent of Birth
1 Asia1 Asia
2 Africa2 Africa
3 Europe3 Europe
4 Latin America4 Latin America
5 North America …5 North America …
What is the arithmetic mean? What is the arithmetic mean?
Continent of BirthContinent of Birth
Continent Continent FrequencyFrequency %% Cumulative %Cumulative %
AsiaAsia 151151 64.864.8 64.864.8
AfricaAfrica 2222 9.49.4 74.274.2
EuropeEurope 3131 13.313.3 87.687.6
Middle EastMiddle East 88 3.43.4 91.091.0
Latin AmericaLatin America 77 3.03.0 94.094.0
North AmericaNorth America 11 .4.4 94.494.4
US AmericaUS America 77 3.03.0 97.497.4
CaribbeanCaribbean 55 2.12.1 99.699.6
New ZealandNew Zealand 11 .4.4 100.0100.0
TotalTotal 233233 100.0100.0 100.0100.0

Frequency DistributionFrequency Distribution
0
20
40
60
80
100
120
140
160
Asia
Africa
Europe
Middle East
Latin America
North America
US America
Caribbean
New Zealand
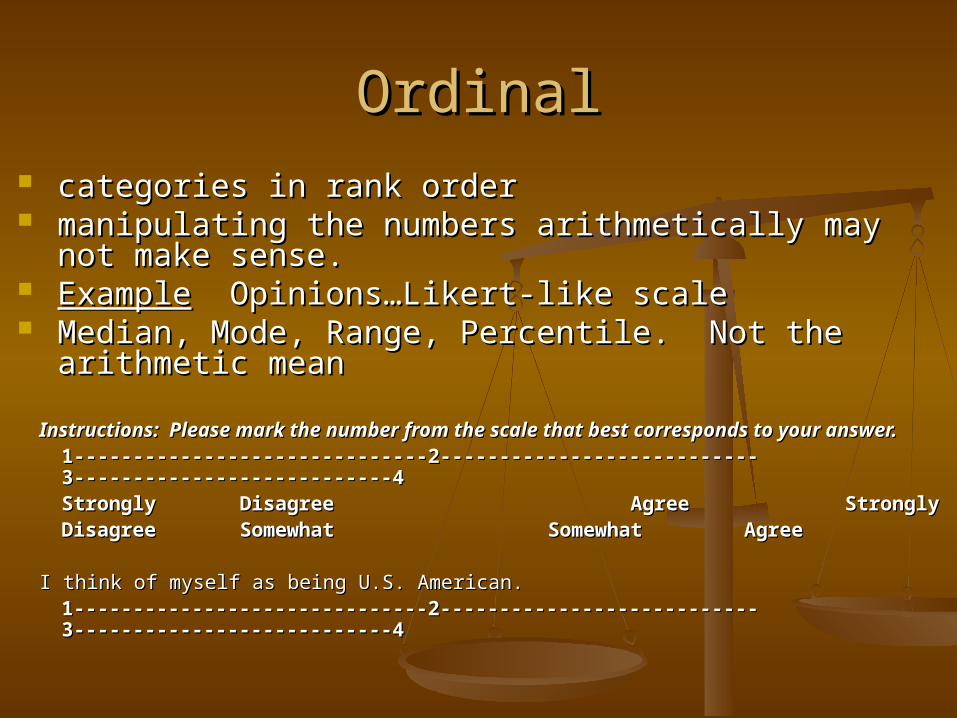
OrdinalOrdinal categories in rank ordercategories in rank order manipulating the numbers arithmetically may not manipulating the numbers arithmetically may not
make sense.make sense. ExampleExample Opinions…Likert-like scale Opinions…Likert-like scale Median, Mode, Range, Percentile. Not the arithmetic Median, Mode, Range, Percentile. Not the arithmetic
meanmean
Instructions: Please mark the number from the scale that best corresponds to Instructions: Please mark the number from the scale that best corresponds to your answer.your answer. 1------------------------------2---------------------------3---------------------------41------------------------------2---------------------------3---------------------------4StronglyStrongly DisagreeDisagree Agree Agree Strongly StronglyDisagreeDisagree SomewhatSomewhat Somewhat Somewhat Agree Agree
I think of myself as being U.S. American.I think of myself as being U.S. American.1------------------------------2---------------------------3---------------------------41------------------------------2---------------------------3---------------------------4

Ordinal DataOrdinal DataUS Ident 1 N=233US Ident 1 N=233
Code Code FreqFreq PercentPercent Cumulative PercentCumulative Percent1.001.00 130130 55.855.8 56.056.0
2.002.00 5656 24.024.0 80.280.2 2.502.50 11 .4 .4 80.680.6 3.003.00 3333 14.214.2 94.894.8 4.004.00 1212 5.2 5.2 100.0100.0 TotalTotal 232232 99.699.6
MissingMissing 11 .4 .4TotalTotal 233233 100.0100.0
MedianMedian 1.0000 1.0000 Strongly DisagreeStrongly DisagreeModeMode 1.001.00 Strongly DisagreeStrongly DisagreeMinimumMinimum 1.001.00 Strongly DisagreeStrongly DisagreeMaximumMaximum 4.004.00 Strongly AgreeStrongly AgreeRange 4.00 (Max-Min)+1Range 4.00 (Max-Min)+1

Interval/Ratio DataInterval/Ratio Data
Interval and ratio are similarInterval and ratio are similar continuous variable continuous variable can be represented numericallycan be represented numerically Mean, median, mode, frequency, range, Mean, median, mode, frequency, range,
percentage, percentilepercentage, percentile Interval Interval
may not make sense when we talk about ratiomay not make sense when we talk about ratio for instance…IQ…..is someone who has an IQ of for instance…IQ…..is someone who has an IQ of
50 half as intelligent as someone with an IQ of 50 half as intelligent as someone with an IQ of 100? Or does a zero IQ mean an absence of 100? Or does a zero IQ mean an absence of intelligence?intelligence?
Examples: IQ or scores on an achievement test or Examples: IQ or scores on an achievement test or the GRE, MAT, SATthe GRE, MAT, SAT
Ratio Ratio continuous data with true zeros.continuous data with true zeros. Height, weight, ageHeight, weight, age
Norm referenced vs. Criterion Norm referenced vs. Criterion referencedreferenced

Measures of Central TendencyMeasures of Central Tendency
ModeMode MedianMedian MeanMean

Measures of Central TendencyMeasures of Central Tendency
ModeMode is the most frequent scoreis the most frequent score can describe can describe multimodalmultimodal
curvescurves least stable of the measures least stable of the measures
because it is not readily because it is not readily repeatablerepeatable
it is affected by the number of it is affected by the number of people taking the testpeople taking the test
not affected by extreme scoresnot affected by extreme scores NOIRNOIR

Measures of Central TendencyMeasures of Central Tendency
MedianMedian middle score achievedmiddle score achieved 50% of the scores are higher than this 50% of the scores are higher than this
score and 50% are lower than this score.score and 50% are lower than this score. If there is no middle, we create it.If there is no middle, we create it. The median can tell us more about data The median can tell us more about data
which is which is skewed skewed versus data which is versus data which is “normal”“normal”
It is not effected by extreme scoresIt is not effected by extreme scores No indication of multimodalness.No indication of multimodalness. IRIR

Measures of Central TendencyMeasures of Central Tendency
MeanMean algebraic arithmetic averagealgebraic arithmetic average sum of the scores/number of sum of the scores/number of
observationsobservations it is affected by extreme scoresit is affected by extreme scores most frequently used Measure because most frequently used Measure because
it lends itself readily to more complex it lends itself readily to more complex manipulations.manipulations.
Used most extensively to describe Used most extensively to describe normal distributions.normal distributions.
NOIRNOIR

VariabilityVariability
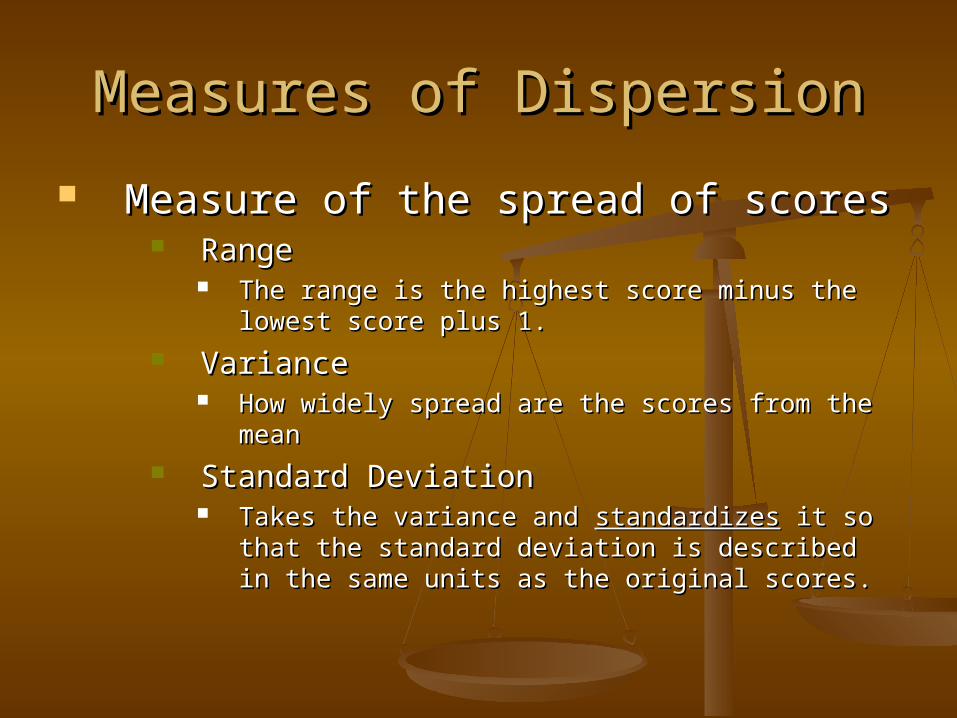
Measures of DispersionMeasures of Dispersion
Measure of the spread of scoresMeasure of the spread of scores RangeRange
The range is the highest score minus the lowest The range is the highest score minus the lowest score plus 1.score plus 1.
VarianceVariance How widely spread are the scores from the How widely spread are the scores from the
meanmean Standard DeviationStandard Deviation
Takes the variance and Takes the variance and standardizesstandardizes it so that it so that the standard deviation is described in the same the standard deviation is described in the same units as the original scores.units as the original scores.


