3379 PEACHTREE ROAD, NE SUITE 555 ATLANTA, GEORGIA 30326 September 14, 2016 ''''''' '''''''''' ''''''''''''' '''''''''''' ''''''''''''''''' ''''''''''' '''''''''' '''''''''''''''''''' ''''''''''''''' ''''''' ''''''''''' '''''''''''' '''''''''''' ''''''''''''''''''' '''''''''''' and ''''''' ''''''''''' ''''''''''''''''' '''''''''''''''''''''''''''' Re: Industrial Showroom Building ''''''''' ''''''''''''''''''' ''''''''' Westerville, Ohio 43081 Loan Name: '''''''''''''''''' '''''''''''''' DMS Number: ''''''''' TVAS File Number: 16074 Dear ''''''' '''''''''''': In accordance with your request, we have completed an appraisal of the above-referenced property. The purpose of the appraisal is to develop an opinion of the market value “as-is” of the fee simple interest in the subject property, subject to certain definitions, assumptions and limiting conditions as set forth in the accompanying report. The subject property was inspected on September 10, 2016, the effective date of this report. The client for this assignment is identified as '''''''''''' '''''''''''''''' '''''''''. The intended users of this report are '''''''''''' '''''''''''''''' ''''''''' and the '''''''' ''''''''''' '''''''''''''''' ''''''''''''''''''''''''''''', and the intended use is for loan underwriting and/or credit decisions. The appraisal is intended to conform with the Uniform Standards of Professional Appraisal Practice (USPAP), the Code of Professional Ethics and Standards of Professional Appraisal Practice of the Appraisal Institute, applicable state appraisal regulations, and the appraisal guidelines of our client. The appraisal is also prepared in accordance with the appraisal regulations issued in connection with the Financial Institutions Reform, Recovery and Enforcement Act (FIRREA). The following appraisal presents the most relevant data gathered in our investigation, details of
the processes utilized, and the interpretation and reconciliation of our analysis leading to the
opinion of value.
'''''''' '''''''''''' '''''''''''' '''''''''''''''' ''''''''' September 14, 2016 Page 2 The subject property consists of one legal parcel containing 87,120 square feet and is improved with a 13,125-square-foot structural steel-framed industrial showroom building constructed in 1995. The building is currently owner-occupied dba '''''''''''''''''''' ''''' '''''''''''''' ''''''''''''''. Based on the examination and analysis, it is our opinion that the market value “as is” of the fee simple interest in the subject property, subject to certain definitions, assumptions and limiting conditions as set forth in the accompanying report, as of September 10, 2016, was:
EIGHT HUNDRED FIFTY-FIVE THOUSAND DOLLARS
$855,000
If you have any questions or comments, please contact the undersigned. Thank you for the opportunity to be of service. Respectfully Submitted,
J. Carl Talbott, III Certified General Real Estate Appraiser Ohio Temporary License No. ACGT. 2016004619 Telephone: (404) 479-9887 Email: [email protected]
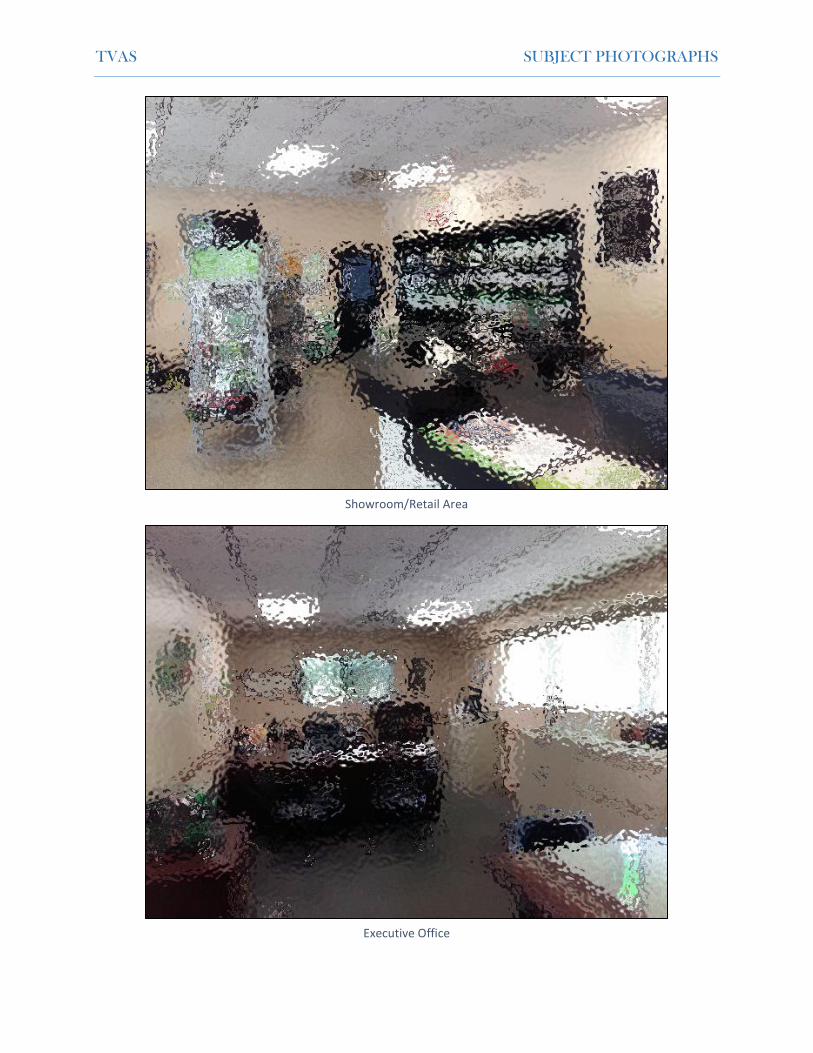
TVAS SUBJECT PHOTOGRAPHS
'''''''''''''''''''''' ''''''''' Facing Northeast
'''''''''''''''''''' ''''''''' Facing Southwest
TVAS SUBJECT PHOTOGRAPHS
Southeastern (Front) and Southwestern (Side) Elevations
Southeastern (Front) Elevation
TVAS SUBJECT PHOTOGRAPHS
Northeastern (Side) and Northwestern (Rear) Elevations
Southwestern (Side) and Northwestern (Rear) Elevations
Property History ........................................................................................................................................ 1
Site Characteristics .................................................................................................................................... 1
Highest and Best Use ................................................................................................................................ 2
Conditions of the Assignment ................................................................................................................... 3
Pro Forma Data ......................................................................................................................................... 3
Value Conclusions ..................................................................................................................................... 3
SCOPE OF WORK ........................................................................................................................................... 4
Property History ........................................................................................................................................ 5
Data Sources ............................................................................................................................................. 5
Definition of Values ................................................................................................................................... 6
Exposure/Marketing Time ........................................................................................................................ 6
AREA ANALYSIS ............................................................................................................................................. 9
Access and Linkages ................................................................................................................................ 13
Population ............................................................................................................................................... 13
Income .................................................................................................................................................... 15
Market Outlook ....................................................................................................................................... 23
SITE DESCRIPTION ....................................................................................................................................... 24
Legal Information .................................................................................................................................... 25
Flood Zone Map ...................................................................................................................................... 28
General Description ................................................................................................................................ 29
Construction Details ................................................................................................................................ 30
Interior Elements .................................................................................................................................... 30
Mechanical Systems ................................................................................................................................ 30
Special Improvements ............................................................................................................................ 31
Quality and Condition ............................................................................................................................. 31
Highest and Best Use as Vacant .............................................................................................................. 36
Highest and Best Use as Improved ......................................................................................................... 37
Most Likely Buyer .................................................................................................................................... 38
VALUATION PROCESS .................................................................................................................................. 39
Value Conclusion ..................................................................................................................................... 51
INCOME CAPITALIZATION APPROACH ........................................................................................................ 52
Summary of Comparable Rental Data .................................................................................................... 52
Potential Gross Income ........................................................................................................................... 59
Analysis of Expenses ............................................................................................................................... 59
Value Conclusion ..................................................................................................................................... 64
RECONCILIATION AND FINAL VALUE CONCLUSIONS .................................................................................. 65
Summary of Value Indications ................................................................................................................ 65
Market Value Conclusion ........................................................................................................................ 65
Assumptions and Limiting Conditions ..................................................................................................... 67
Qualifications of the Appraiser ............................................................................................................... 69
Engagement Letter .................................................................................................................................. 70
Insurable Value ....................................................................................................................................... 80
Terms and Definitions ............................................................................................................................. 81
TVAS EXECUTIVE SUMMARY
16074 Industrial Showroom Westerville 1
EXECUTIVE SUMMARY
Property Identification
TVAS File No. 16074 Property Type Industrial Showroom Building
Current Owner(s) '''''''''' '''''' ''''''''''' Previous Market Sale January 12, 1995 Previous Sale Price $125,000 Other Sales – Past Three Years None noted Property Status Owner-occupied
Site Characteristics
Total Land Area 2.0 Acres 87,120 SF Site Shape Mostly rectangular Topography Level Soils Appear adequate to support existing improvements Current Zoning L-M, Limited Manufacturing District
H-35, 35-Foot Height District Utilities All available Easements/Encroachments None noted Street(s) Access Exposure '''''''''''''''''''' ''''''''' Direct Good
TVAS EXECUTIVE SUMMARY
16074 Industrial Showroom Westerville 2
Improvements
Gross Building Area (SF) 13,125 Year Built 1995 Construction Class S, Structural Steel-Frame Effective Age 10 years Remaining Economic Life 30 years Rentable Area (SF) 13,125 Tenancy Single Occupancy Owner-occupied Grade-Level Loading 7 Dock-High Loading 2 Eave Height 14 Feet Finished Office Ratio 16.2% Coverage Ratio 15.1%
Highest and Best Use
Highest and Best Use as Vacant Commercial Use Highest and Best Use as Improved Continued Use of Existing Improvements
Valuation
Value Type Market Value “As-Is” Insurable Value
Property Rights Appraised Fee Simple Exposure/Marketing Time 6-9 months
TVAS EXECUTIVE SUMMARY
16074 Industrial Showroom Westerville 3
Conditions of the Assignment
Extraordinary Assumptions None Hypothetical Conditions None Assumptions and Limiting Conditions See Addenda
Pro Forma Data
Income Pro Forma
Revenue
Base Rent $78,750
Other Income $0
Reimbursements $0
Potential Gross Income $78,750
Vacancy and Collection Loss 3.0% ($2,363)
Effective Gross Income $76,388
Expenses
Property Management 3.0% $2,292
Reserves 3.0% $2,292
Total Expenses ($4,583)
Net Operating Income $71,804
Value Conclusions
Market Value “As-Is” Effective Date of Value Indicated Value
Sales Comparison Approach September 10, 2016 $855,000 Income Capitalization Approach September 10, 2016 $845,000
Market Value Conclusion September 10, 2016 $855,000
TVAS SCOPE OF WORK
16074 Industrial Showroom Westerville 4
SCOPE OF WORK
Report Criteria
Report Format Appraisal Report Purpose of the Appraisal Estimate Market Value as defined by the Board of
Governors of the Federal Reserve System, in accordance with Title XI of FIRREA (1989)
Intended Use To aid in loan underwriting in connection with
the acquisition, disposition and/or refinancing of the subject property
Client '''''''''''' ''''''''''''''' ''''''''' Intended User(s) The Intended Users are ''''''''''' '''''''''''''''''' '''''''''
and the '''''' '''''''''' '''''''''''''''''' ''''''''''''''''''''''''''''. '''''''''''' ''''''''''''''''' '''''''''' and its respective affiliates (collectively "'''''''''''''''") together with its successors, assigns and transferees with respect to its interests in the subject financing and/or any party to whom '''''''''''''''' has pledged its interest in the subject financing may use and rely upon this Report in connection with the making of a mortgage loan. Further, '''''''''''''''' may furnish this report to third parties involved in evaluating or auditing the subject financing, provided that no such parties may use or rely upon any such information unless the same have succeeded to ''''''''''''''''s interest in connection therewith. Finally, in compliance with banking regulations and internal policy, '''''''''''''''' may provide a copy of this Report to prospective borrowers on a non- reliance basis for informational purposes only.
Property Rights Appraised Fee Simple Date of Report September 14, 2016 Date of Inspection September 10, 2016 Date(s) of Value September 10, 2016
TVAS SCOPE OF WORK
16074 Industrial Showroom Westerville 5
Property Contact - Name ''''''''''' ''''''''''''' Property Contact – Phone '''''''''' ''''''''''''''''''' Inspection Details The appraiser was provided access to all interior
areas within the subject’s improvements.
Property History According to tax records, the subject property is currently owned by '''''''''''' '''''' '''''''''''. The subject property is presently owner-occupied dba ''''''''''''''''' ''''' '''''''''''''' '''''''''''''. We are not aware of any transactions regarding ownership during the three years preceding the preparation of this report. We are not aware of any agreement for sale or option currently in existence concerning the subject property.
Data Sources
Site To Do Business (STDB) Costar COMPS LoopNet U.S. Bureau of Labor Statistics Government Officials Ohio Department of Labor Moody’s Economy.com Institute of Real Estate Management Marshall Valuation Services Local brokers
Valuation Approaches
Approaches Utilized Approaches Omitted
Sales Comparison *Cost Approach
Income Capitalization Approach
*The cost approach was excluded from this appraisal because of the age of the improvements and the inherent difficulty in accurately quantifying depreciation for this type of asset.
TVAS SCOPE OF WORK
16074 Industrial Showroom Westerville 6
Definition of Values Market value is defined as: the most probable price that a property would bring in a competitive and open market under all conditions requisite to a fair sale, the buyer and seller each acting prudently and knowledgeably, and assuming the price is not affected by undue stimulus. Implicit in this definition is the consummation of a sale as of a specified date and the passing of title from seller to buyer under conditions whereby:
• Buyer and seller are typically motivated;
• Both parties are well informed or well advised, and acting in what they consider to be their own best interests;
• A reasonable time is allowed for exposure in the open market;
• Payment is made in terms of cash in U.S. dollars or in terms of financial arrangements comparable thereto; and
• The price represents the normal consideration for the property sold unaffected by special or creative financing or sales concessions granted by anyone associated with the sale.1
Insurable Value is defined as: the value used by insurance companies as the basis for insurance. Often
considered to be replacement or reproduction cost plus allowances for debris removal or demolition less
deterioration and non-insurable items. Sometimes cash value or market value, but often entirely a cost
concept.2
Exposure/Marketing Time Exposure time is the estimated time a property would have been offered to the market at a price equivalent to market value prior to sale on the effective date of valuation. Marketing time is the period of time necessary to sell the subject property interest at its estimated market value after the effective date of valuation. Marketing periods for transactions involving comparable properties can provide a reasonable proxy for determining an appropriate exposure time for the subject. We reviewed sales of similar properties to determine an appropriate exposure time for the subject property. We also reviewed other sales data reported by Costar within the subject’s market. The Westerville industrial submarket is relatively small comprising about 1.6% of the metro inventory. It is second-ranked in terms of both asking rents ($7.83) and vacancy rates (0.7%) versus the overall Columbus market. There have been only two sales in the past three years comprising approximately 40,000 square feet.
1 Federal Register, Vol. 55, 165, Friday, August 24, 1990, Rules and Regulations, 12 CFR Part 34.42(F) 2 Marshall & Swift/Boeckh, Marshall Valuation Service, (Los Angeles: Marshall & Swift/Boeckh, 2010), Sec. 3, Pg. 2.
TVAS SCOPE OF WORK
16074 Industrial Showroom Westerville 7
According to CoStar Group3, the Columbus MSA is projected to add jobs at a rate of 2.9% per year which is similar to recent historical growth as shown in the following chart.
As there is no evidence to suggest that forecasted market conditions will differ significantly from market conditions experienced within the last year, our estimate for exposure time is considered a reasonable proxy for the subject’s marketing time. Based on our analysis, we conclude the subject property to have a marketing time and exposure time between 6 and 9 months.
3 Columbus Economic Overview 3Q 2016
TVAS SCOPE OF WORK
16074 Industrial Showroom Westerville 8
Competency Statement
The Competency Provision of the Uniform Standards of Professional Appraisal Practice, promulgated by the Appraisal Foundation and required as part of the Financial Institutions Reform, Recovery, and Enforcement Act, states that: Prior to entering an agreement to perform any assignment, an appraiser must properly identify the property to be appraised and have the knowledge and experience that will be required to complete the assignment competently or alternatively: Disclose the lack of knowledge and/or experience to the client before accepting the assignment; Take all appropriate steps necessary to complete the assignment competently; and Describe the lack of knowledge and/or experience and the steps taken to complete the assignment competently in the report. The appraisers affirm that they have the knowledge and experience to competently complete the assignment in accordance with the competency provision in USPAP.
TVAS AREA ANALYSIS
16074 Industrial Showroom Westerville 9
AREA ANALYSIS The subject property is located within the city limits of Columbus in Franklin County, Ohio just south of the city of Westerville and approximately nine miles northeast of the central business district of Columbus. Franklin County is one of ten counties considered as part of the Columbus, OH Metropolitan Statistical Area. As of the 2015 census, the Columbus, OH MSA had a population of 2,021,632. Area Map
TVAS AREA ANALYSIS
16074 Industrial Showroom Westerville 10
The Federal bank of Cleveland provides the following synopsis on the economic conditons in the state of
Ohio.4
The unemployment rate in Ohio increased half a percentage point in the 6 months ending in April, from
4.7 percent to 5.2 percent, in turn raising the following question: Does an increase of this magnitude
signal the start of deterioration in the state's labor market conditions?
While Ohio's unemployment rate remains low—it fell slightly to 5.1 percent in May 2016—its increase
during this recent 6-month interval is among the largest for any state. Of interest is that several other
Midwestern states saw unemployment rate increases as large as or larger than Ohio's during this time
period, including Pennsylvania (up 0.5 percentage points) and Indiana and Illinois (both up 0.7
percentage points). Prior to the recent increase, in the third quarter of 2015 Ohio's unemployment rate
had reached its lowest point in nearly 15 years.
Using US unemployment rate data, some analysts have noted that an increase in the unemployment rate
above a certain threshold over a
predefined period has, in fact, been a
good guide to impending economic
weakness.
Edward Leamer, professor of
economics and statistics at UCLA,
reported in a 2008 paper titled
“What's a Recession, Anyway?” that
an increase in the national
unemployment rate that exceeds 0.8
percentage points in a 6-month
period has presaged every recession
in the post-World War II period, with only 1 false positive. Similarly, analysts at Goldman Sachs have
noted that an increase in the 3-month average of the US unemployment rate that exceeds 0.3
percentage points has also been a reliable indication that the US economy is either currently in recession
or headed for a recession in the subsequent 6 months. The single exception is in periods immediately
following a recession, during which time the unemployment rate may continue to trend up before
beginning to decline during an ensuing recovery.
In Ohio, when considering data back to the mid-1970s, a 6-month increase in the unemployment rate of
the magnitude we've witnessed recently has indeed tended to occur around US business cycle turning
points. The only exception was in the mid-1990s, when Ohio's unemployment rate rose for several
months after falling to 4.3 percent, a rate that was more than a percentage point below the US average
at the time. In the other cases, by the time the 6-month increase in Ohio's unemployment rate had
equaled or exceeded 0.5 percentage points, a national recession had already begun or had recently
ended.
4 State of the State: Ohio, June 2016
TVAS AREA ANALYSIS
16074 Industrial Showroom Westerville 11
The national unemployment rate continues to decline, and other indicators continue to point to ongoing
growth. In addition, it's important to be cautious in interpreting the recent increase in Ohio's
unemployment rate because of the annual revision process that often changes these data in significant
ways.
A good example of such change is the most recent annual revision to the 2015 data. Initially, the
unemployment rate for June was estimated to be 5.2 percent, but it was subsequently revised down to
4.8 percent, a 0.4 percentage point change. Similarly, the initial estimate for October was reported to be
4.4 percent, but was subsequently revised up to 4.7 percent, a 0.3 percentage point change. Clearly,
revisions—which can change several years' worth of data—could eliminate the recent increase in the
state's unemployment rate.
There is a far more benign interpretation of the recent increase in Ohio's unemployment rate: It could be
the result of more people entering the labor force because they believe their likelihood of securing jobs
has improved. Indeed, after remaining relatively flat for several years at about 5.7 million workers,
Ohio's labor force has increased—and sharply. Over the 6-month periods ending in April and May, the
state's labor force grew by 2.3 percent and 2.4 percent, respectively, the largest increases in any 6-month
period since the mid-1970s.
However, these recent increases seem surprisingly large, and they therefore may not survive later
revisions. If there are downward revisions to the recent labor force estimates without meaningful
revisions to the estimates of employment, these numbers could cause a downward revision to the
unemployment rate, thereby moderating or erasing recent increases.
While increases in the unemployment rate can be a good predictor of economic conditions to come, it's
too early to conclude that a downturn is imminent. Indeed, many other indicators, including anecdotal
reports from our District contacts, continue to point to ongoing moderate growth in the economy.
Summary Ohio's unemployment rate has increased more than that of many other states during a recent
6-month span, something that could signal a turn in the business cycle; however, most indicators
continue to point to ongoing growth.
TVAS NEIGHBORHOOD ANALYSIS
16074 Industrial Showroom Westerville 12
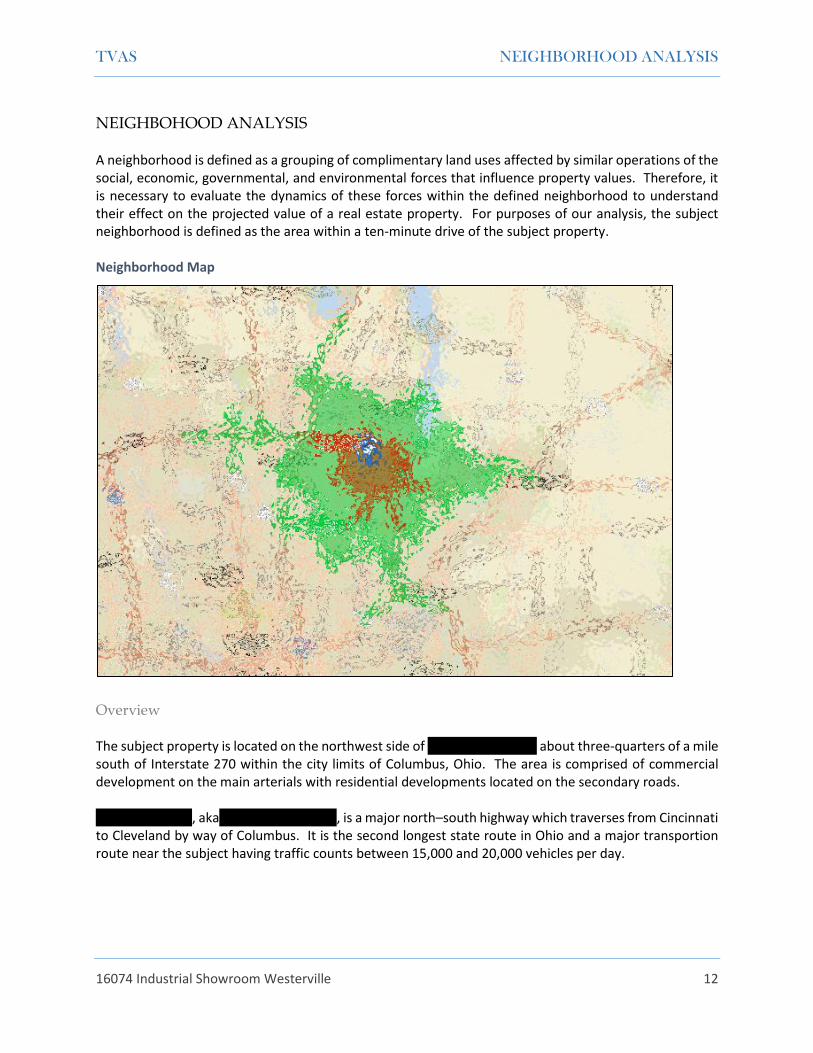
NEIGHBOHOOD ANALYSIS A neighborhood is defined as a grouping of complimentary land uses affected by similar operations of the social, economic, governmental, and environmental forces that influence property values. Therefore, it is necessary to evaluate the dynamics of these forces within the defined neighborhood to understand their effect on the projected value of a real estate property. For purposes of our analysis, the subject neighborhood is defined as the area within a ten-minute drive of the subject property. Neighborhood Map
Overview The subject property is located on the northwest side of ''''''''''''''''''''''' '''''''''' about three-quarters of a mile south of Interstate 270 within the city limits of Columbus, Ohio. The area is comprised of commercial development on the main arterials with residential developments located on the secondary roads. '''''''''''''''''''' ''''''''', aka '''''''''' '''''''''' '''''''''' ''', is a major north–south highway which traverses from Cincinnati to Cleveland by way of Columbus. It is the second longest state route in Ohio and a major transportion route near the subject having traffic counts between 15,000 and 20,000 vehicles per day.
TVAS NEIGHBORHOOD ANALYSIS
16074 Industrial Showroom Westerville 13
Due to the close proximity of Interstate 270, the subject property has good access to other parts of the
Columbus metropolitan area. Interstate 71 is located about four miles and and less than a ten-minute
Ohio State Route 161 Comments The subject’s proximity to transportation routes
is considered good
Population
5-Minute Drive 10-Minute Drive
2000 Population 22,675 121,500
2010 Population 24,208 130,644
2016 Population 25,883 138,979
2021 Population 27,439 146,580
2000-2010 Annual Rate 0.66% 0.73%
2010-2016 Annual Rate 1.08% 0.99%
2016-2021 Annual Rate 1.17% 1.07%
2016 Male Population 47.5% 47.9%
2016 Female Population 52.5% 52.1%
2016 Median Age 34.2 35.2
Source: STDB
TVAS NEIGHBORHOOD ANALYSIS
16074 Industrial Showroom Westerville 14
Households
5-Minute Drive 10-Minute Drive
2000 Households 9,457 50,179
2010 Households 9,809 53,705
2016 Total Households 10,408 56,953
2021 Total Households 11,008 60,069
2000-2010 Annual Rate 0.37% 0.68%
2010-2016 Annual Rate 0.95% 0.94%
2016-2021 Annual Rate 1.13% 1.07%
2016 Average Household Size 2.46 2.40
Source: STDB
Housing
5-Minute Drive 10-Minute Drive
2016 Total Housing Units 11,252 62,247
2016 Owner Occupied Housing Units 5,027 28,932
2016 Renter Occupied Housing Units 5,381 28,021
2016 Vacant Housing Units 844 5,294
2021 Total Housing Units 11,905 65,655
2021 Owner Occupied Housing Units 5,305 30,576
2021 Renter Occupied Housing Units 5,703 29,493
2021 Vacant Housing Units 897 5,586
Currently, 46.5% of the 62,247 housing units in the area are owner occupied; 45.0%, renter occupied; and 8.5% are vacant. Currently, in the U.S., 55.4% of the housing units in the area are owner occupied; 32.9% are renter occupied; and 11.7% are vacant. Median home value in the area is $157,071, compared to a median home value of $198,891 for the U.S. In five years, median value is projected to change by 2.36% annually to $176,511.
Source: STDB
TVAS NEIGHBORHOOD ANALYSIS
16074 Industrial Showroom Westerville 15
Income
5-Minute Drive 10-Minute Drive
2016 Median Household Income $52,115 $52,952
2021 Median Household Income $58,738 $60,638
2016-2021 Annual Rate 2.42% 2.75%
2016 Average Household Income $63,380 $70,399
2021 Average Household Income $70,329 $77,578
2016-2021 Annual Rate 2.10% 1.96%
2016 Per Capita Income $25,637 $28,987
2021 Per Capita Income $28,358 $31,898
2016-2021 Annual Rate 2.04% 1.93%
Source: STDB
Employment
Business Data 5-Minute Drive 10-Minute Drive
Total Businesses: 1,134 6,001
Total Employees: 16,095 95,763
Total Residential Population: 25,883 138,979
Employee/Residential Population Ratio: 0.62:1 0.69:1
Other Services (except Public Administration) 657 10.9% 4,572 4.8%
Automotive Repair & Maintenance 105 1.7% 755 0.8%
Public Administration 67 1.1% 1,872 2.0%
Unclassified Establishments 216 3.6% 352 0.4%
Totals 6,001 100.0% 95,763 100.0%
Source: STDB
TVAS NEIGHBORHOOD ANALYSIS
16074 Industrial Showroom Westerville 18
Retail/Entertainment
Major Shopping Centers Distance Opened GLA SF
Columbus Square 0.82 SW 1980 534,808
Highway 161 & Cleveland Avenue
80 Stores; Anchors: Columbus Square
Bowling, Ohio Thrift Store, Applicance Smart
Northland Plaza 0.96 SW 1988 210,036
Cleveland Avenue & E. Dublin-Granville Road
24 Stores; Anchors: None
Westerville Plaza 1.33 NE 1974 226,957
Huber Village Blvd & S. State Street
10 Stores; Anchors: Kohl’s, Macy’s, OfficeMax
Easton Square 2.32 SE 1994 613,706
Morse Rd & Stelzer Rd
24 Stores; Anchors: WalMart Supercenter,
Sam’s Club, Best Buy
Northtowne Centre 2.45 SW 1969 206,750
Morse Rd & Northtowne Blvd
12 Stores; Anchors: Old Time Pottery, Aldi
Morse Centre 2.56 SW 1979 235,589
Morse Rd & Northtowne Blvd
33 Stores; Anchors: Big Lots, Guitar Center
Easton Market 2.72 SE 1998 502,111
Easton Way & Morse Crossing
34 Stores; Anchors: Dick’s Sporting Goods,
Bed Bath & Beyond
Easton Town Center 2.88 SE 1999 1,500,000
Interstate 270 & Morse Rd
260 Stores; Anchors: Costco, Macy’s,
Nordstrom, Dick’s Sporting Goods
Source: STDB
TVAS NEIGHBORHOOD ANALYSIS
16074 Industrial Showroom Westerville 19
Conclusion The demographic data indicate that the subject neighborhood is in the growth stage of the economic life cycle with moderate forecasted population and job growth. Overall, there is a large residential and employment pool within five miles of the subject. The location of the neighborhood is benefited by good local and regional accessibility and is well-served by good transportation linkages and support services. In summary, economic and demographic factors point toward a stable environment for the neighborhood in the near future. Over the long term, the prospects for stable growth remain intact with moderate prospects for net appreciation in real estate values.
TVAS MARKET ANALYSIS
16074 Industrial Showroom Westerville 20
MARKET ANALYIS
Columbus Industrial Market Overview5
The industrial market is growing. A surprising thought considering all the headlines that promise to
reshape the economic landscape; notably Great Britain opting to leave the EU and the looming
presidential election, yet industrial tenants and landlords continue to show confidence in Central Ohio.
During the second quarter of 2016, the region saw 440,487 square feet of net absorption, constituting
the 13th consecutive quarter of growth. Absorption numbers are up 8.7 percent year-over year reducing
the overall vacancy rate to 6.1 percent– a 30 basis point reduction from the second quarter of 2015.
Advances in technology and e-commerce are shaping consumer shopping preferences, and warehousing
companies are taking notice. Now tenants look to improve their logistics capabilities by moving into
modern bulk space near transportation hubs. In Central Ohio, this kind of space is leasing rapidly. Major
deals this quarter include XPO Logistics who leased 151,200 square feet at 4000 Creekside Pkwy in
Lockbourne and Coty LCD who leased 144, 236 square
feet at 147-163 Heritage Dr. in Etna.
Rising occupier demand and ever tightening market
conditions have led to an influx of construction
activity in the region. Central Ohio now has over 3.5
million square feet in the pipeline, marking the fifth
consecutive quarter of construction levels over 3
million square feet. Amazon has positioned
themselves on the forefront of this wave of
investment. The e-commerce giant will deliver two fulfillment centers to Central Ohio in 2016: one in
Etna Township and the other at the Rickenbacker Global Logistics Park in Obetz.
Leasing Activity and Trends
At the close of the second quarter, the Central Ohio industrial market signed 1.3 million square feet of
new or expanded leases, a 36 percent decrease compared to the second quarter of 2015. The Southeast
submarket showed the most demand this quarter with 486,551 square feet of leasing activity followed
by the East submarket with 177,121 square feet.
Occupier demand for quality warehouse space continues to place pressure on rental rates and reduce
availabilities. Particulary this quarter, the amount of new deals between 50,000 and 150,000 square feet
have diminished the supply of quality mid-sized warehouse space available in the market. As a result,
5 Colliers International Columbus Industrial Report Q2 2016
TVAS MARKET ANALYSIS
16074 Industrial Showroom Westerville 21
landlords are charging higher rent prices and offering less concessions to existing tenants. Moving
forward, we can expect this trend to continue until new speculative developments add supply and ease
inventory tension.
Sales Activity On the sales side, approximately 14 industrial buildings over 20,000 square feet sold during the second quarter for a total of $30,653,000, an average price per square foot of $24.18. The largest sale came from the Trident Capital who acquired the 218,000-square-foot bulk warehouse at 6150 Huntley Road for $6.4 million or $29.35 per square foot.
Industry Data and Forecast There is much speculation among investors and market experts about how the U.S. economy will perform throughout the second half of 2016, especially in lieu of worldwide current events. So far economic fundamentals are showing mixed reviews. Over the past year 2.8 million jobs were added in the U.S., and yet the overall economy plateaued; GDP recorded a sluggish 1.1 growth rate over Q1 2016– a possible result of decreased exports due to volatile markets overseas. Nevertheless, the U.S. industrial market lingers in its growth phase. According to the most recent addition of the U.S. industrial Outlook report from Colliers International, all but 12 of the 70 markets covered in the report recorded positive net absorption reducing the national vacancy rate to 6.3 percent–the lowest rate in a decade. Back home, Central Ohio continues to expand and outpace markets in Ohio and the nation. Job growth is a great indicator of this. Over the past year Central Ohio has added 20,541 which helped reduce the overall unemployment rate to 3.8 percent– well below the U.S. rate now at 5.1 percent. Looking forward, we can expect the Central Ohio industrial market to attract both occupier and investor demand as more industrial tenants view the region as a stable, growth market.
TVAS MARKET ANALYSIS
16074 Industrial Showroom Westerville 22
Q2 2016 Columbus Industrial Statistics
TVAS MARKET ANALYSIS
16074 Industrial Showroom Westerville 23
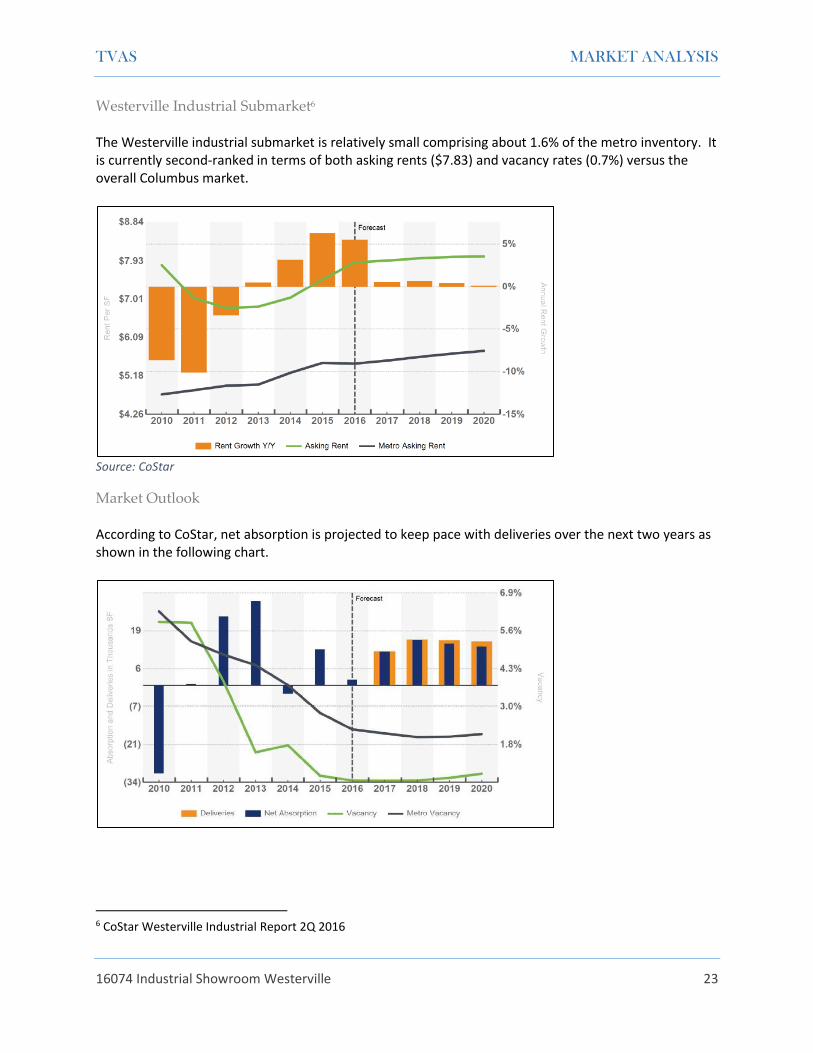
Westerville Industrial Submarket6
The Westerville industrial submarket is relatively small comprising about 1.6% of the metro inventory. It is currently second-ranked in terms of both asking rents ($7.83) and vacancy rates (0.7%) versus the overall Columbus market.
Source: CoStar
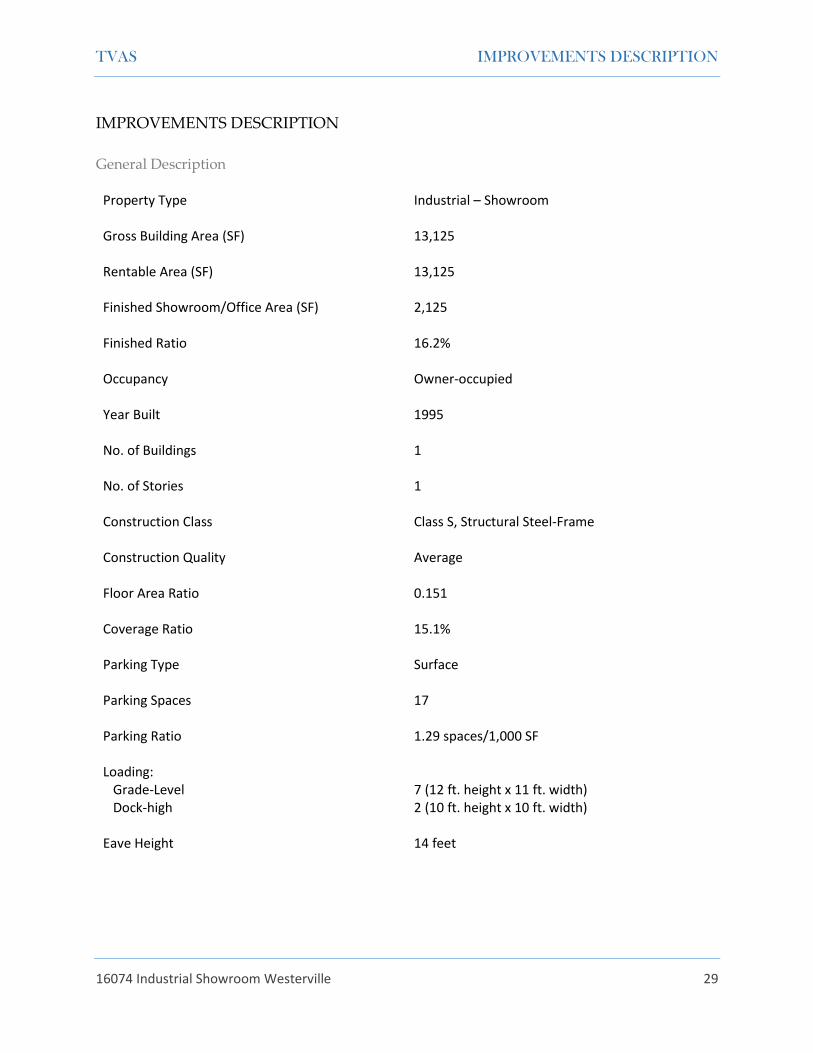
Market Outlook According to CoStar, net absorption is projected to keep pace with deliveries over the next two years as shown in the following chart.
6 CoStar Westerville Industrial Report 2Q 2016
TVAS SITE DESCRIPTION
16074 Industrial Showroom Westerville 24
SITE DESCRIPTION
Physical Characteristics
Location '''''''''' '''''''''''''''''''' ''''''''''' Westerville, Ohio 43081 The subject is located on the northwest side of ''''''''''''''''''' ''''''''''' ¾ of a mile south of Interstate 270. The subject is under the jurisdiction of the city of Columbus but has a Westerville address.
Total Land Area 2.0 Acres 87,120 SF Site Shape Mostly rectangular Topography Level Surplus/Excess Land None noted Soil Conditions We were not provided a soil report for review.
The soils that comprise the subject site appear to be of adequate support and permeability to support the existing and/or proposed structure(s). We did not observe any evidence to the contrary during our physical inspection of the property.
Environmental Considerations We are not aware of any known source of
pollution or environmental hazards noted in the area. As no gross evidence of contamination was observed, this report assumes that the site is free of contaminants. The opinion of value in this report is contingent upon no environmental hazards on or around the subject site. A Phase I environmental evaluation is suggested to verify these assumptions.
Utilities
Water Available Sewer Available Electricity Available Gas Available
TVAS SITE DESCRIPTION
16074 Industrial Showroom Westerville 25
Legal Information
Parcel Number(s) '''''''''''''''''''''''''' Current Owner ''''''''''' '''''' ''''''''''' Current Zoning L-M, Limited Manufacturing District
H-35, 35-Foot Height District City of Columbus*
*Zoning Comments According to the the city of Columbus GIS site,
the subject parcel is zoned L-M, Limited Manufacturing District. However, we could not find this particular designation in the city’s zoning ordinance. It appears the L-M designation has been retired. Our attempts to verify the subject property’s zoning were unsuccessful.
Flood Zone A Zone: Areas with a 1% annual chance of
flooding and a 26% chance of flooding over the life of a 30‐year mortgage. Because detailed analyses are not performed for such areas; no depths or base flood elevations are shown within these zones. In communities that participate in the NFIP, mandatory flood insurance purchase requirements apply to this zone.
Flood Map FEMA Flood Insurance Rate Map, Community
Panel 39049C0183K dated June 17, 2008 Wetlands/Watershed None noted Easements/Encroachments A 25-foot sanitary sewer easement traverses
through the northern quarter of the parcel and a 25-foot sewer and drainage easement traverses along the rear property line. We are not aware of any other easements or encroachments which would adversely affect the utilization of the site.
Preliminary Title Report An authoritative report of title was not provided
for review.
TVAS SITE DESCRIPTION
16074 Industrial Showroom Westerville 26
Surrounding Arterials
''''''''''''''''''''' ''''''''''
Access/Exposure Type of Street Primary No. of Lanes 2 with median turn lane Frontage 349.91 feet Access Direct No. of Curb Cuts 1 Improvements Curbs No Gutters No Sidewalks Yes Street Lighting Yes Median Yes Street Parking No
Parcel Map
TVAS SITE DESCRIPTION
16074 Industrial Showroom Westerville 27
Survey
TVAS SITE DESCRIPTION
16074 Industrial Showroom Westerville 28
Flood Zone Map
TVAS IMPROVEMENTS DESCRIPTION
16074 Industrial Showroom Westerville 29
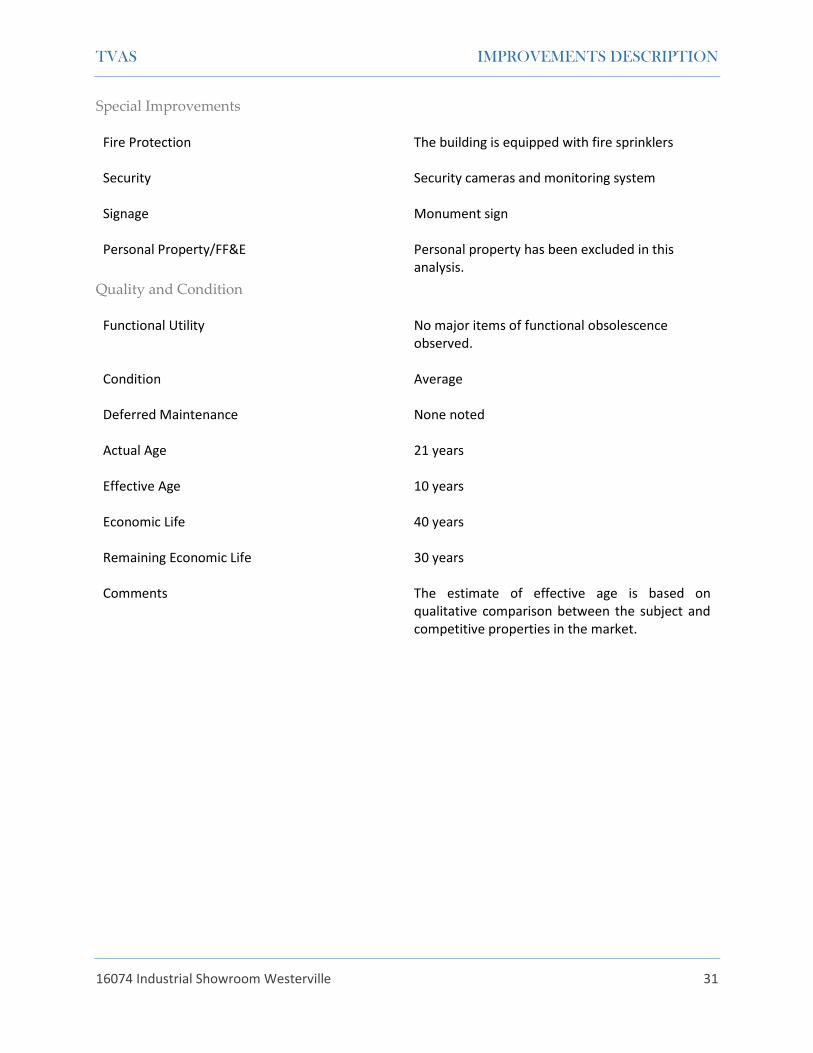
IMPROVEMENTS DESCRIPTION
General Description
Property Type Industrial – Showroom Gross Building Area (SF) 13,125 Rentable Area (SF) 13,125 Finished Showroom/Office Area (SF) 2,125 Finished Ratio 16.2% Occupancy Owner-occupied Year Built 1995 No. of Buildings 1 No. of Stories 1 Construction Class Class S, Structural Steel-Frame Construction Quality Average Floor Area Ratio 0.151 Coverage Ratio 15.1% Parking Type Surface Parking Spaces 17 Parking Ratio 1.29 spaces/1,000 SF Loading: Grade-Level 7 (12 ft. height x 11 ft. width) Dock-high 2 (10 ft. height x 10 ft. width) Eave Height 14 feet
TVAS IMPROVEMENTS DESCRIPTION
16074 Industrial Showroom Westerville 30
Construction Details
Foundation Poured concrete slab Construction Structural steel-framed Exterior Walls Modular metal panels Roof Gable with metal standing seam. The appraiser
was not provided access to the roof.
Windows Anodized aluminum frame Entry Doors Glass storefront and metal Ventilation Appears adequate Insulation Appears adequate
Interior Elements
Interior Layout Warehouse area, finished showroom/office space, and three service bays
Heating Gas FWA Cooling Package Units Electrical 3-Phase, 480/277 volts, 1200 amps Plumbing Standard piping and hot water systems assumed
TVAS IMPROVEMENTS DESCRIPTION
16074 Industrial Showroom Westerville 31
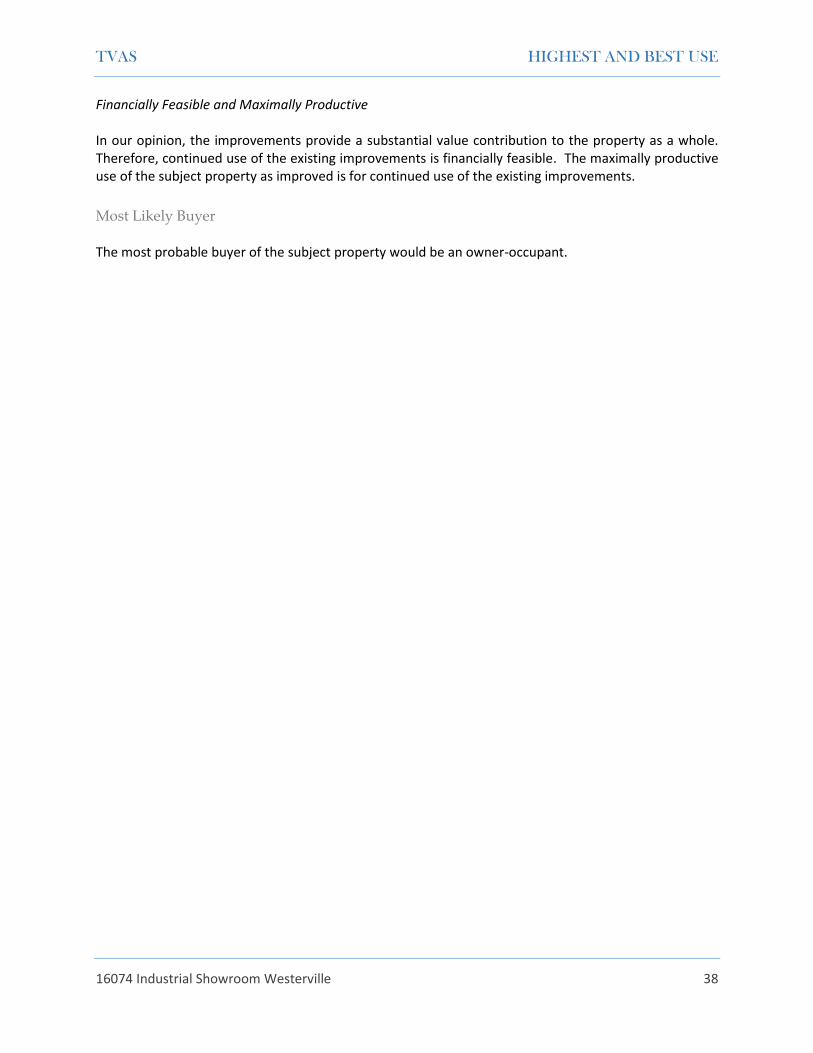
Special Improvements
Fire Protection The building is equipped with fire sprinklers Security Security cameras and monitoring system Signage Monument sign Personal Property/FF&E Personal property has been excluded in this
analysis.
Quality and Condition
Functional Utility No major items of functional obsolescence observed.
Condition Average Deferred Maintenance None noted Actual Age 21 years Effective Age 10 years Economic Life 40 years Remaining Economic Life 30 years Comments The estimate of effective age is based on
qualitative comparison between the subject and competitive properties in the market.
TVAS IMPROVEMENTS DESCRIPTION
16074 Industrial Showroom Westerville 32
Improvements Sketch
TVAS ZONING
16074 Industrial Showroom Westerville 33
ZONING
Zoning Summary
Zoning Jurisdiction City of Columbus Zoning Designation L-M, Limited Manufacturing District
H-35, 35-Foot Height District* *Comments According to the the city of Columbus GIS site,
the subject parcel is zoned L-M, Limited Manufacturing District. However, we could not find this particular designation in the city’s zoning ordinance. It appears the L-M designation has been retired. Our attempts to verify the subject property’s zoning were unsuccessful.
Legally Conforming? Assumed to be legally conforming Zoning Change Likely? No
TVAS ZONING
16074 Industrial Showroom Westerville 34
Zoning Map
TVAS REAL ESTATE TAXES AND ASSESSMENT
16074 Industrial Showroom Westerville 35
REAL ESTATE TAXES AND ASSESSMENT
Introduction In Ohio all real property types similar to the subject are required to be assessed at 35% of the fair market value unless otherwise specified by law. Property is assessed at the county level by the Auditor’s Office. Ohio law requires counties to revalue all real property every six years with an update at the three year midpoint as ordered by the Tax Commissioner of the State of Ohio. Franklin County is scheduled for a reappraisal in 2017.
Current Property Tax Liability The subject property is under the tax jurisdiction of Columbus, Ohio. The 2015 millage rate for properties
located in Columbus was $80.798968 per $1,000 of assessed value. The millage rate for 2016 has not
been determined. The following table summarizes the 2015 property tax liability for the subject property.
Parcel No. ''''''''''''''''''''''''''
Tax Year 2015
Tax-Appraised Value: Land Value $155,300
Improvement Value $419,700
Total Tax-Appraised Value $575,000
Times 35% Assessment 0.35
Assessed Value $201,260
Times Current Millage Rate 0.080798968
Total Property Taxes $16,261.60
According to the Franklin County Treasurer, the 2015 taxes for the subject property have been paid as of
the effective date of this report.
TVAS HIGHEST AND BEST USE
16074 Industrial Showroom Westerville 36
HIGHEST AND BEST USE
Introduction Highest and best use is defined as the reasonably probable and legal use of vacant land or an improved property.7 The four criteria the highest and best use must meet are:
◻ Legal Permissibility – a property use that is either currently allowed or most probably allowable under zoning codes, building codes, environmental regulations, and other applicable laws and regulations that govern land use;
◻ Physical Possibility – the land must be able to accommodate the size and shape of the ideal improvement;
◻ Financial Feasibility – the ability of a property to generate sufficient income to support the
use for which it was designed; and
◻ Maximum Productivity – the selected land use must yield the highest value of the possible uses.
Highest and Best Use as Vacant Legally Permissible The zoning regulations in effect at the time of the appraisal determine the legal permissibility of a potential use of the subject site. As described in the Zoning Section of this report, the subject parcel is zoned L-M, Limited Manufacturing District. However, we could not find this particular designation in the city’s zoning ordinance. It appears the L-M designation has been retired. Our attempts to verify the subject property’s zoning were unsuccessful. Based on the existing code, a number of commercial uses would be permitted in a “limited manufacturing” type of designation. Additionally, given the character of the area and the location of the subject within the district, a change in zoning is considered improbable. Physically Possible The physical possibility of a use is dictated by the size, shape, topography, availability of utilities, and any other physical aspects of the site. The subject property consists of a legal tax parcel containing 2.0 acres or 87,120 square feet. The site is mostly rectangular in shape and level with the street grade. The subject site has frontage along ''''''''''''''''''''' ''''''''''' with good exposure. All utilities are available to the site. A 25-foot sanitary sewer easement traverses through the northern quarter of the parcel and a 25-foot sewer
7 Appraisal Institute, The Dictionary of Real Estate Appraisal, Fifth Ed., (Chicago: Appraisal Institute, 2002)
TVAS HIGHEST AND BEST USE
16074 Industrial Showroom Westerville 37
and drainage easement traverses along the rear property line. The physical characteristics are considered adequate to accommodate most types of permitted development. Financially Feasible and Maximally Productive Financially feasible uses are those uses that can generate an income or return greater than or equal to the costs of development. Of the uses that are permitted, possible, and financially feasible, the one that will result in the maximum value for the property is considered the highest and best use. Conclusion We considered the legal issues related to zoning and legal restrictions. We also analyzed the physical characteristics of the site to determine what legal uses would be possible, and considered the financial feasibility of these uses to determine the use that is maximally productive. Considering the subject site’s physical characteristics and location, as well as the state of the local market, it is our opinion that the Highest and Best Use of the subject site as vacant is commercial use developed in accordance with the predominant supply and demand characteristics of the local market.
Highest and Best Use as Improved The Dictionary of Real Estate Appraisal defines highest and best use of the property as improved as: The use that should be made of a property as it exists. An existing improvement should be renovated or retained as is so long as it continues to contribute to the total market value of the property, or until the return from a new improvement would more than offset the cost of demolishing the existing building and constructing a new one. In analyzing the Highest and Best Use of a property as improved, it is recognized that the improvements should continue to be used until it is financially advantageous to alter physical elements of the structure or to demolish it and build a new one. Legally Permissible As described in the Zoning Section of this report, the subject parcel is zoned L-M, Limited Manufacturing District. However, we could not find this particular designation in the city’s zoning ordinance. It appears the L-M designation has been retired. Our attempts to verify the subject property’s zoning were unsuccessful. The site is improved with an industrial showroom building containing 13,125 square feet of gross building area which was constructed in 1995. It is assumed the improvements are legally conforming. Physically Possible The subject improvements are considered to be in average condition and appear be adequately maintained. There are no apparent major items of functional obsolescence or deferred maintenance. We know of no current or pending municipal actions or covenants that would require a change to the current improvements.
TVAS HIGHEST AND BEST USE
16074 Industrial Showroom Westerville 38
Financially Feasible and Maximally Productive In our opinion, the improvements provide a substantial value contribution to the property as a whole. Therefore, continued use of the existing improvements is financially feasible. The maximally productive use of the subject property as improved is for continued use of the existing improvements.
Most Likely Buyer The most probable buyer of the subject property would be an owner-occupant.
TVAS VALUATION PROCESS
16074 Industrial Showroom Westerville 39
VALUATION PROCESS
Methodology The thee generally accepted approaches to developing an opinion of value are the Cost Approach, the Sales Comparison Approach and Income Capitalization Approach. The applicability of each approach is considered based on the quality of market data and the motivation of market participants. The type and reliability of data and the applicability of each approach is then considered and reconciled into a final value estimate.
Cost Approach The Cost Approach is based on the principle of substitution, where an informed purchaser would pay no more for the subject than the cost to produce a substitute property with equivalent utility. This approach is particularly applicable when the property being appraised involves relatively new improvements which represent the highest and best use of the land or when relatively unique or specialized improvements are located on the site for which market data of comparable properties is difficult to obtain. The Cost Approach is also appropriate when existing improvements are reaching the end of their economic life and/or when the underlying land comprises the majority of the total property value. In these instances, the Cost Approach isolates the largest component of value by developing a full evaluation of the underlying land.
Sales Comparison Approach The Sales Comparison Approach is also based on the principle of substitution. This approach uses a market-based unit of comparison such as price per square foot, price per unit, etc. for analysis of the sales. The strength of this approach is its wide market acceptance among investors who often evaluate comparable properties on a price per unit means of comparison. In this approach, sales of comparable properties are identified and then adjustments are applied to the unit of comparison from an analysis of comparable sales. The adjusted unit of comparison is then used to derive an opinion of value for the subject property.
Income Capitalization Approach The Income Capitalization Approach reflects the subject property’s income-producing capabilities. This approach is based on the assumption that value is created by the expectation of benefits to be derived in the future. The two common valuation techniques associated with the Income Capitalization approach are direct capitalization and discounted cash flow (DCF) analysis.
TVAS VALUATION PROCESS
16074 Industrial Showroom Westerville 40
Summary The Cost Approach was considered but not deemed to be applicable in the valuation of the subject property. The age of the improvements renders an accurate estimate of depreciation difficult to obtain. The Sales Comparison Approach represents the primary method by which the fee simple interest in similar properties is evaluated. As such, this approach was given primary consideration in the reconciliation. In the Income Capitalization Approach, market rent was utilized for the subject’s forecasted operating statement. After estimating gross income, deductions were made for ownership and operational expenses. The resulting net operating income was then converted into an indication of value by means of direct capitalization. As the typical buyer profile for the subject property is an owner-occupant, this approach was given secondary consideration in the reconciliation.
TVAS SALES COMPARISON APPROACH
16074 Industrial Showroom Westerville 41
SALES COMPARISON APPROACH
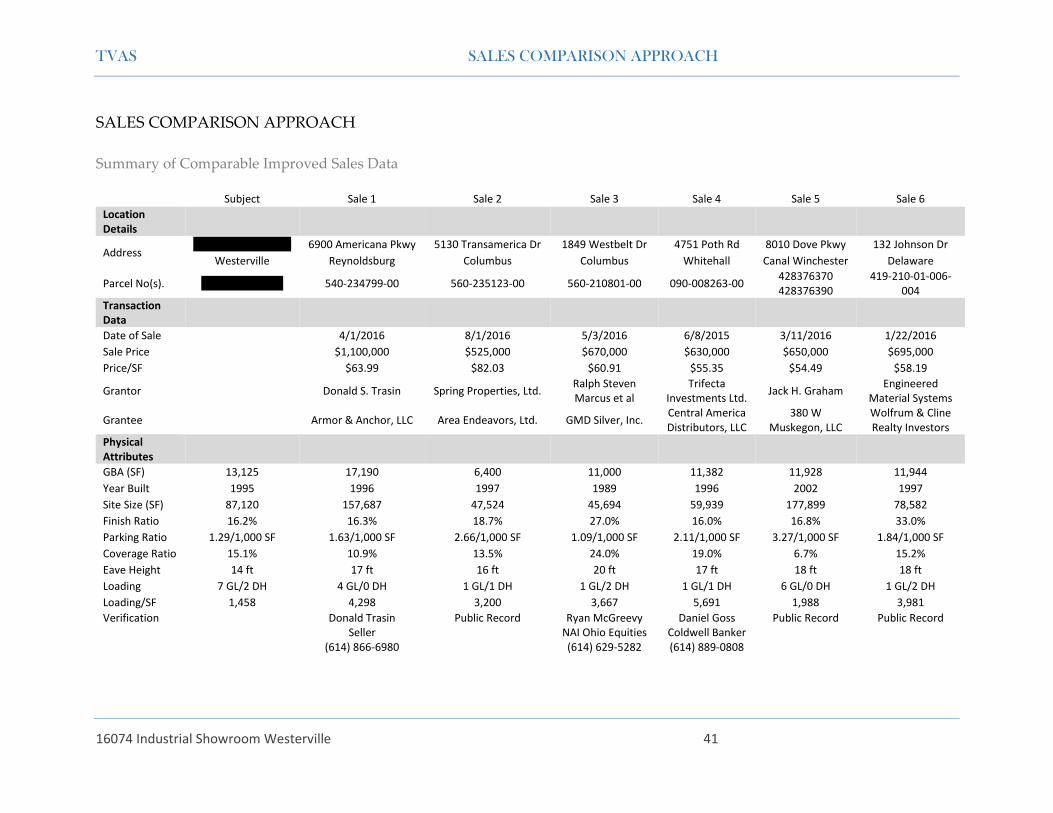
Summary of Comparable Improved Sales Data
Subject Sale 1 Sale 2 Sale 3 Sale 4 Sale 5 Sale 6
Location Details
Address ''''''''' '''''''''''''''''''' '''''' 6900 Americana Pkwy 5130 Transamerica Dr 1849 Westbelt Dr 4751 Poth Rd 8010 Dove Pkwy 132 Johnson Dr
Adjusted Sale Price/SF $63.99 $82.03 $60.91 $55.35 $54.49 $58.19
Property Adjustments
Location 0.0% 10.0% 20.0% 15.0% 20.0% 20.0%
GBA (SF) 13,125 6.0% -20.0% -3.0% -2.0% -1.0% -1.0%
Condition/Quality Average -10.0% 0.0% 0.0% 0.0% 0.0% 0.0%
Finish Ratio 16.2% 0.0% 0.0% -3.0% 0.0% 0.0% -6.0%
Parking Ratio 1.29/1,000 SF 0.0% -5.0% 0.0% 0.0% -5.0% 0.0%
Coverage Ratio 15.1% 0.0% 0.0% 0.0% 0.0% -5.0% 0.0%
Eave Height 14 ft -3.0% -1.0% -6.0% -3.0% -4.0% -4.0%
Loading 7 GL/2 DH 5.0% 2.0% 2.0% 3.0% 3.0% 2.0%
Net Adjustment -2.0% -14.0% 10.0% 13.0% 8.0% 11.0%
Adjusted Sale Price/SF $62.71 $70.55 $67.00 $62.55 $58.85 $64.59
TVAS SALES COMPARISON APPROACH
16074 Industrial Showroom Westerville 47
Comparable Improved Sales Analysis Property Rights Conveyed All the comparable sales analyzed included a transfer of the fee simple interest and no adjustments were deemed necessary after comparison of the adjusted sales. Financing/Cash Equivalency Data related to mortgage rates for the comparable sale transactions were unavailable, but most appear to have been financed with new conventional loans or purchased all-cash. It is assumed that the financing terms for the comparable sale transactions were market-oriented. No adjustments have been applied under this category. Conditions of Sale Market value of the subject property is based on the premise of an arms-length transaction for properties exposed to the market for a reasonable length of time. All of the comparable sales are believed to be arms-length transactions or sold at market value. Market Conditions According to CoStar Group8, no discernible trend in pricing is evident in the Columbus industrial market as shown in the chart below. According to Ryan McGreevy of NAI Ohio Equities, industrial sale prices have remained stable in the subject’s market area. No adjustments were indicated for changes in market conditions.
Source: CoStar
8 Columbus Economic Overview 3Q 2016
TVAS SALES COMPARISON APPROACH
16074 Industrial Showroom Westerville 48
Location Differences in location for industrial properties are related to such factors as proximity to transportation routes and availability of supporting uses. Additionally, industrial showroom properties are affected by neighborhood demographics and visibililty similar to retail properties. In this instance, we examined population, income and traffic count in an effort to differentiate a location factor between the subject and the comparable sales. The following tables present current population and income data for the subject property and the comparable sales within one mile of their respective locations as well as traffic count data.
Applied location adjustments are summarized in the following table.
Location Population/Income Traffic Counts Applied
Adjustment
Sale 1 6900 Americana Pkwy 0% 0%* 0%
Sale 2 5130 Transamerica Dr 0% 10% 10%
Sale 4 4751 Poth Rd 10% 5% 15%
Sale 3 1849 Westbelt Dr 10% 10% 20%
Sale 6 132 Johnson Dr 10% 10% 20%
Sale 5 8010 Dove Pkwy 10% 10% 20%
*Although Sale 1 is accessed from a road with a low traffic count, the parcel has good frontage and visibility from Interstate 70. No adjustment for traffic count was deemed necessary.
Building Size Differences in this category are attributable to the concept of economies of scale whereby larger properties would sell for a lower price per unit than smaller properties and vice versa. The following table summarizes the adjustments applied to the comparable sales.
Gross Building Area
(SF) Difference (SF) Applied Adjustment
Sale 1 17,190 4,065 6%
Subject 13,125
Sale 6 11,944 1,181 -1%
Sale 5 11,928 1,197 -1%
Sale 4 11,382 1,743 -2%
Sale 3 11,000 2,125 -3%
Sale 2 6,400 6,725 -20%
Condition/Quality Adjustments under this category account for differences in the estimated effective age of the subject property relative to the comparable data set. Differences in construction, quality and appeal are also considered in this category. The subject property is an industrial showroom building constructed in 1995. The estimated effective ages of all of the comparable sales were sufficiently similar to the effective age of the subject. Adjustments were based on inspection of interior photographs and broker comments when available. A downward adjustment was applied to Comparable 1 based superior construction quality.
TVAS SALES COMPARISON APPROACH
16074 Industrial Showroom Westerville 50
Showroom/Office Ratio The subject building is improved with 2,125 square feet of showroom/office area which equates to a finished ratio of 16.2%. Adjustments for differences in finished ratios are based on a contributory value estimate of $20 per square foot. The adjustments applied under this category are exhibited in the table below.
Contributory Value $20/SF -$340 $-3,200 -$23,760 $460 -$1,420 $-40,140
Sale Price^ $1,100,000 $525,000 $670,000 $630,000 $650,000 $695,000
Implied Adjustment 0% 0% -3% 0% 0% -6%
Applied Adjustment 0% 0% -3% 0% 0% -6% *Difference between the subject’s finished ratio applied to the comparable and the comparable finished space.
^Adjusted sale price prior to physical adjustments
Parking Ratio
Parking ratios were determined by the number of dedicated parking spaces on asphalt surfaces. Downward adjustments were applied to comparable sales 2 and 5 which have sufficiently higher parking ratios relative to the subject property. All of the other comparable sales were similar to the subject and were not adjusted. Coverage Ratio The subject’s 13,125-square-foot building is situated on a 87,120-square-foot site, resulting in a coverage ratio of 15.1%. A downward adjustment was applied to Comparable Sale 5 due to a superior coverage ratio. We considered location, frontage and orientation of the existing improvements in estimating the contributory value of the excess land. The adjustment applied under this category is exhibited in the table below.
Comparable Sale 5
Estimated Contributory Value of Excess Land $32,000 Sale Price^ $650,000
Implied Adjustment -5% ^Adjusted sale price prior to physical adjustments
TVAS SALES COMPARISON APPROACH
16074 Industrial Showroom Westerville 51
Eave Height The subject building’s minimum clear height was measured to 14 feet. All of the comparable sales have higher clear heights relative to the subject and were adjusted downward. Adjustments were based on our experience utilizing capitalized rent adjustments. In this instance, a rental difference of $0.05 per linear foot of clear height was capitalized at our estimated capitalization rate of 8.5% indicating a contributory value of $0.59 per linear foot. The adjustments applied under this category are exhibited in the table below.
Comparable Sale 1 2 3 4 5 6
Height Differential (Feet) -3 -2 -6 -3 -4 -4
Contributory Value @
$0.59/LF x Bldg. SF
$30,426 $7,552 $38,940 $20,146 $28,150 $28,188
Sale Price^ $1,100,000 $525,000 $670,000 $630,000 $650,000 $695,000
Implied Adjustment -3% -1% -6% -3% -4% -4%
^Adjusted sale price prior to physical adjustments
Loading
The subject warehouse building contains seven grade-level loading positions and two dock-high loading
positions which equates to one loading position per 1,458 square feet. All of the comparable sales are
considered inferior to the subject with regard to this category. Although Comparable Sale 5 is similar in
loading positions per square foot, a short truck court coupled with comingled parking and loading
warrants an upward adjustment. Additional upward adjustments were applied to comparable sales 1 and
Using a unit value of $65.00 per square foot, we estimate the market value “as-is” of the subject property by the Sales Comparison Approach as follows:
Market Value “As-Is” Sales Comparison Approach
GBA (SF) Unit Value Indicated Value
13,125 $65.00 $853,125
Rounded: $855,000
TVAS INCOME CAPITALIZATION APPROACH
16074 Industrial Showroom Westerville 52
INCOME CAPITALIZATION APPROACH
Summary of Comparable Rental Data Subject Rental 1 Rental 2 Rental 3 Rental 4
Location Details
Address '''''''''' ''''''''''''''''''''' '''' 7830 N. Central Dr 6766 Commerce Ct
625 Cross Pointe Rd Unit B
7465 Worthington-Galena Rd Unit A
Westerville, OH Lewis Center, OH Blacklick, OH Columbus, OH Columbus, SC
Transaction Data
Tenant Empire Cheer &
Dance N/A N/A N/A
Lease Type Direct Direct Direct Direct
Lease Date Mar-15 Available Available Available
Lease Term 60 months Negotiable Negotiable Negotiable
Lease Rate (S/SF/Yr) $5.25 $5.25 $6.25 $6.75
Expense Structure NNN NNN NNN NNN
Physical Attributes
Rentable Building Area (SF) 13,125 12,600 5,000 5,000 14,710
Year Built 1995 1990 1996 2002 1984
Coverage Ratio 15.1% 28.8% 28.2% 14.4% 34.5%
Showroom/Office Ratio 16.2% 16.7% 12.4% 50.0% 30.6%
Parking Ratio 1.29/1,000 SF 1.15/1,000 SF 2.29/1,000 SF 2.5/1,000 SF 1.02/1,000 SF
Address '''''''''' ''''''''''''''''''''''' ''''' 7830 N. Central Dr 6766 Commerce Ct 625 Cross Pointe Rd
Unit B 7465 Worthington-Galena Rd Unit A
Westerville, OH Lewis Center, OH Blacklick, OH Columbus, OH Columbus, SC
Rentable Building Area (SF) 13,125 12,600 5,000 5,000 14,710
Rent/SF/Yr $5.25 $5.25 $6.25 $6.75
Transactional Adjustments
Property Rights Conveyed Typical Typical Typical Typical
Adjustment $0.00 $0.00 $0.00 $0.00
Adjusted Rent/SF/Yr $5.25 $5.25 $6.25 $6.75
Lease Structure NNN NNN NNN NNN
Adjustment $0.00 $0.00 $0.00 $0.00
Adjusted Rent/SF/Yr $5.25 $5.25 $6.25 $6.75
Conditions of Lease None Asking Asking Asking
Adjustment $0.00 -$0.53 -$0.63 -$0.68
Adjusted Rent/SF/Yr $5.25 $4.72 $5.62 $6.07
Market Conditions Mar-15 Available Available Available
Adjustment $0.00 $0.00 $0.00 $0.00
Adjusted Rent/SF/Yr $5.25 $4.72 $5.62 $6.07
Property Adjustments
Location 20.0% 10.0% 20.0% 10.0%
Rentable Building Area (SF) 13,125 0.0% -8.0% -8.0% 1.0%
Condition/Quality Average 0.0% 0.0% 0.0% -10.0%
Coverage Ratio 15.1% 1.0% 1.0% 0.0% 2.0%
Showroom/Office Ratio 16.2% 0.0% 1.0% -8.0% -4.0%
Parking Ratio 1.29/1,000 SF 0.0% 0.0% 0.0% 0.0%
Eave Height 14 ft -5.0% -7.0% -2.0% -4.0%
Loading 7 GL/2 DH 5.0% 3.0% 5.0% 6.0%
Net Adjustment 21.0% 0.0% 7.0% 1.0%
Adjusted Rent/SF/Yr $6.35 $4.72 $6.01 $6.13
TVAS INCOME CAPITALIZATION APPROACH
16074 Industrial Showroom Westerville 57
Comparable Rentals Analysis Property Rights Conveyed All of the comparable lease transactions represent typical fixed-term leases, with no adjustments required. Expense Structure This forecasted income for the subject property was based on a triple-net lease structure. All of the comparable leases were structured as triple-net leases, with no adjustments required. Lease Conditions This category is included for consideration of rent concessions, atypical tenant improvements, and other extraordinary conditions between the parties to the transaction. Comparable rentals 2, 3 and 4 were listings and were adjusted downward for a typical lease negotiation factor. Market Conditions According to CoStar and other reviewed publications, no discernible trend in pricing is evident in the Westerville industrial market. No adjustments were indicated for changes in market conditions. Location Differences in location for industrial properties are related to such factors as proximity to transportation routes and availability of supporting uses. Additionally, industrial showroom properties are affected by neighborhood demographics and visibililty similar to retail properties. In this instance, we examined population, income and traffic count in an effort to differentiate a location factor between the subject and the comparable rentals.
Rental 1 7830 N Central Dr $89,885 936 $84,132,360
All of the comparable rentals are located on secondary roads with very low traffic counts and were
adjusted upward accordingly.
TVAS INCOME CAPITALIZATION APPROACH
16074 Industrial Showroom Westerville 58
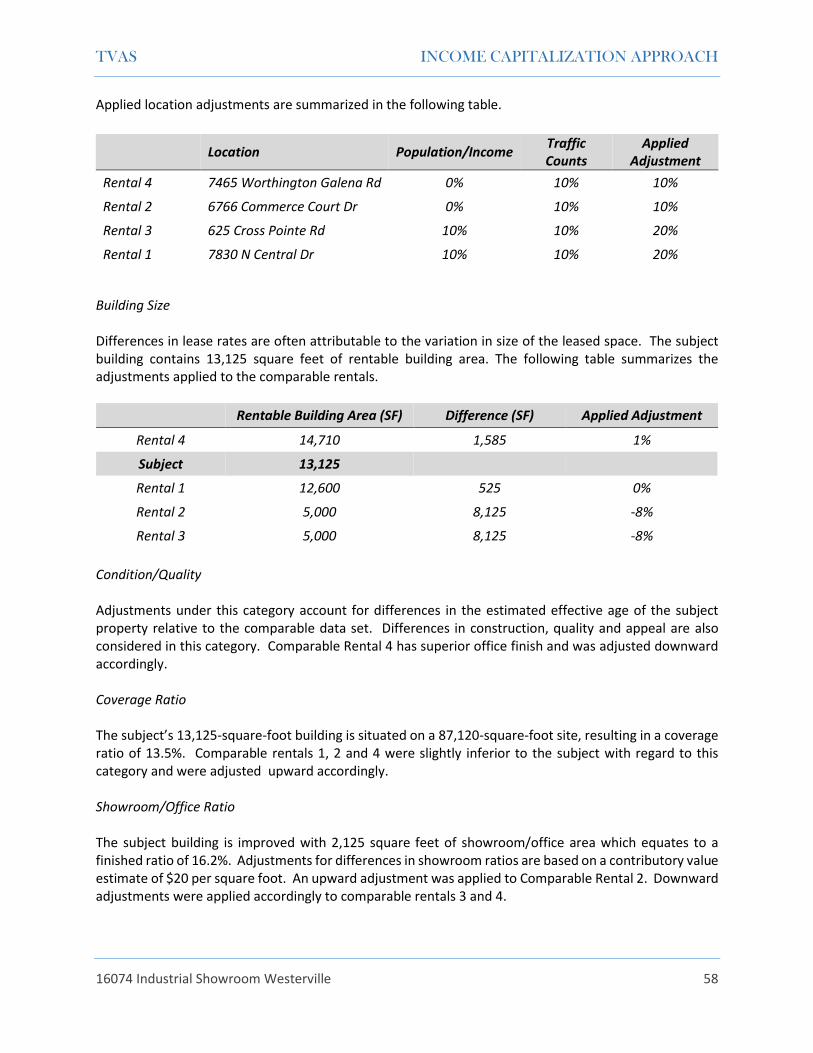
Applied location adjustments are summarized in the following table.
Location Population/Income Traffic Counts
Applied Adjustment
Rental 4 7465 Worthington Galena Rd 0% 10% 10%
Rental 2 6766 Commerce Court Dr 0% 10% 10%
Rental 3 625 Cross Pointe Rd 10% 10% 20%
Rental 1 7830 N Central Dr 10% 10% 20%
Building Size Differences in lease rates are often attributable to the variation in size of the leased space. The subject building contains 13,125 square feet of rentable building area. The following table summarizes the adjustments applied to the comparable rentals.
Rentable Building Area (SF) Difference (SF) Applied Adjustment
Rental 4 14,710 1,585 1%
Subject 13,125
Rental 1 12,600 525 0%
Rental 2 5,000 8,125 -8%
Rental 3 5,000 8,125 -8%
Condition/Quality Adjustments under this category account for differences in the estimated effective age of the subject property relative to the comparable data set. Differences in construction, quality and appeal are also considered in this category. Comparable Rental 4 has superior office finish and was adjusted downward accordingly. Coverage Ratio The subject’s 13,125-square-foot building is situated on a 87,120-square-foot site, resulting in a coverage ratio of 13.5%. Comparable rentals 1, 2 and 4 were slightly inferior to the subject with regard to this category and were adjusted upward accordingly. Showroom/Office Ratio The subject building is improved with 2,125 square feet of showroom/office area which equates to a finished ratio of 16.2%. Adjustments for differences in showroom ratios are based on a contributory value estimate of $20 per square foot. An upward adjustment was applied to Comparable Rental 2. Downward adjustments were applied accordingly to comparable rentals 3 and 4.
TVAS INCOME CAPITALIZATION APPROACH
16074 Industrial Showroom Westerville 59
Parking Ratio
Parking ratios were determined by the number of dedicated parking spaces on asphalt surfaces. All of the comparable rentals had sufficiently similar parking ratios and were not adjusted. Eave Height The subject building’s minimum clear height was measured to 14 feet. All of the comparable rentals had higher clear heights and were adjusted downward. Adjustments were applied accordingly based on a similar methodology detailed in the Sales Comparison Approach. Loading
The subject warehouse building contains seven grade-level loading positions and two dock-high loading
positions which equates to one loading position per 1,458 square feet. All of the comparable sales are
considered inferior to the subject with regard to this category. Additional upward adjustments were
applied to comparable rentals 1, 3 and 4 due to the lack of dock high or grade level loading positions.
Market Rent Conclusion
Minimum Maximum Mean Median Std Dev
Unadjusted Rent Per SF $5.25 $6.75 $5.88 $5.75 $0.65
Adjusted Rent Per SF $4.72 $6.35 $5.80 $6.07 $0.64 In this instance, we estimate market rent for the subject building to be $6.00 per square foot per year. For purposes of our analysis, we utilize $6.00 per square foot per year on a triple-net basis with the tenant responsible for property taxes, insurance, utilities, repairs and interior and exterior maintenance.
Potential Gross Income Based on the data, we calculate the potential gross income for the subject property as follows:
Building Area (SF) Market Rent Annual Rent
13,125 $6.00 $78,750
Analysis of Expenses Vacancy and Collection Loss Vacancy and collection loss is an allowance for reductions in potential gross income attributable to vacancies, tenant turnover and non-payment of rent. According to CoStar, vacancy for industrial properties in the Westerville submarket is currently 0.7%. There is no new construction reported in the subject neighborhood. Net absorption is projected to keep pace with new deliveries over the next several quarters. In this instance, we utilize a provision of 2% for vacancy and 1% for collection loss.
TVAS INCOME CAPITALIZATION APPROACH
16074 Industrial Showroom Westerville 60
Operating Expenses
Comparable rentals indicate a typical lease structure in the market. We assume the building would be leased on a triple-net basis with the tenants paying taxes, insurance, utilities, repairs and interior and exterior maintenance, and the landlord is responsible for management, leasing and a reserve for replacements. A discussion of these expenses follows. Property Management Property management expense for similar properties typically ranges from 3% to 5% of effective gross income. Given the property’s size and single-tenant configuration, we believe 3% is appropriate for the subject. Reserves for Replacement On a stabilized basis, a reserve fund is typically set for replacement of building components which have a shorter economic life than the building itself such as appliances, carpet, roof and air conditioning equipment. We have estimated the subject’s reserves expense to be 3% of effective gross income in our analysis.
Income Pro Forma
Revenue
Base Rent $78,750
Other Income $0
Reimbursements $0
Potential Gross Income $78,750
Vacancy and Collection Loss 3.0% ($2,363)
Effective Gross Income $76,388
Expenses
Property Management 3.0% $2,292
Reserves 3.0% $2,292
Total Expenses ($4,583)
Net Operating Income $71,804
TVAS INCOME CAPITALIZATION APPROACH
16074 Industrial Showroom Westerville 61
Mortgage-Equity Capitalization The mortgage-equity capitalization is a band of investment technique which combines weighted-average rates of the debt and equity portions of a capital investment to derive an overall capitalization rate (RO). This rate is the combination of the return to debt (RM) and the return to equity (RE). Given a mortgage ratio of M, the overall capitalization rate is calculated as:
Ro = M x RM + (1 – M) x RE
The cost of debt was calculated using mortgage rates, terms and loan-to-value assumptions from published surveys. In our opinion, a debt constant based on a 6.0% mortgage rate for 25 years with a 10-year call or balloon is considered appropriate for the subject property and is consistent with the present market. According to RealtyRates.com Investor Survey 2nd Quarter 2016, equity dividend rates for industrial Flex/R&D range from 7.60% to 16.61% with an average of 11.66%. In this instance, we believe an equity capitalization rate of 12.0% is appropriate reflecting the degree of risk associated with this type of investment. Surveyed interest rates for all classes of industrial properties range from 2.89% to 8.73% with an average of 4.85%. The current financing environment for Industrial Flex/R&D properties is cautious. Our assumptions are summarized in the following table.
Band of Investment Assumptions
Mortgage Interest Rate 5.25% Amortization Period 25 Years
Mortgage Ratio (Loan-to-Value) 75% Mortgage Constant 0.0719 Equity Dividend Rate 12.0% Holding Period 10 Years
Based on a 10-year holding period and the above-defined assumptions, we calculate the overall capitalization rate by the mortgage-equity technique as follows:
Mortgage-Equity Capitalization Rate
Mortgage Requirement 0.75 X 0.0719 = = 0.0539
Equity Requirement 0.25 X 0.1200 = = 0.0300
Indicated Capitalization Rate = 0.0839
The indicated capitalization rate by the mortgage-equity technique is 8.39%. In our opinion, the rate is reasonable and well-supported, as the data utilized for the assumptions are extracted from the market reflecting current mortgage interest rates and investor’s expected return on equity.
TVAS INCOME CAPITALIZATION APPROACH
16074 Industrial Showroom Westerville 62
Debt Service Coverage Ratio Technique This approach is similar to the band of investment technique in that the same risk and reward factors are inherent in both formulas: leverage, loan-to-value ratios, cost of debt, and debt service coverage ratios (DSCR). Lenders typically constrain the size of a mortgage based on the ability to service the debt. Generally, the DSCR is the ratio of net operating income to debt service. Lender requirements vary based on property type and the economic environment among other factors. Given a mortgage ratio of M, the overall capitalization rate is calculated as follows:
Ro = M x RM x DSCR
According to RealtyRates.com Investor Survey 2nd Quarter 2016, debt coverage ratios for industrial properties range from 1.15 to 2.15 with an average of 1.49.
Mortgage Ratio Mortgage Constant Debt Coverage Ratio Indicated Capitalization Rate
0.75 0.0719 1.49 0.0803 The indicated capitalization rate by the debt service coverage ratio technique is 8.03%.
Broker Interview Ryan McGreevy of NAI Ohio Equities stated that current capitalization rates for industrial properties in the Columbus market predominantly range from 7.5% to 8.5%.
TVAS INCOME CAPITALIZATION APPROACH
16074 Industrial Showroom Westerville 63
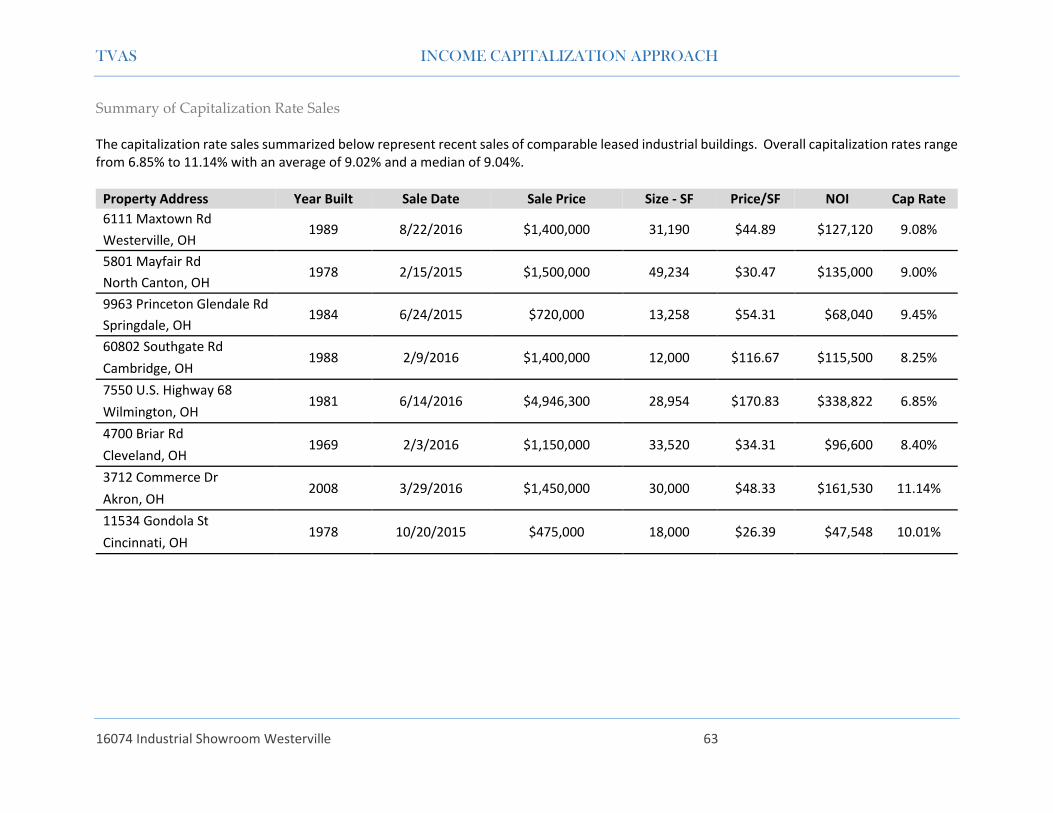
Summary of Capitalization Rate Sales The capitalization rate sales summarized below represent recent sales of comparable leased industrial buildings. Overall capitalization rates range from 6.85% to 11.14% with an average of 9.02% and a median of 9.04%.
Property Address Year Built Sale Date Sale Price Size - SF Price/SF NOI Cap Rate
3712 Commerce Dr 2008 3/29/2016 $1,450,000 30,000 $48.33 $161,530 11.14%
Akron, OH
11534 Gondola St 1978 10/20/2015 $475,000 18,000 $26.39 $47,548 10.01%
Cincinnati, OH
TVAS INCOME CAPITALIZATION APPROACH
16074 Industrial Showroom Westerville 64
Capitalization Rate Conclusion Our estimate of the overall capitalization rate for the subject property is presented below. The estimate is bracketed within the ranges exhibited by the comparable sales and survey data.
Capitalization Rate Conclusion
Range Average RealtyRates Investor Survey* 5.94% - 14.26% 9.46% Mortgage-Equity Technique - 8.39% Cap Rate Comparable Sales 6.85% - 11.14% 9.02% Debt Coverage Ratio Technique - 8.03% Broker Opinion 7.5% - 8.5% 8.00%
Conclusion 8.50% *2Q 2016 Industrial – Flex/R&D
Value Conclusion Based on our analysis, we estimate the market value of the subject property by the Income Capitalization Approach as follows:
Market Value “As-Is” Income Capitalization Approach
Net Operating Income Capitalization Rate Indicated Value $71,804 8.50% $844,753
Rounded: $845,000
TVAS CERTIFICATION
16074 Industrial Showroom Westerville 65
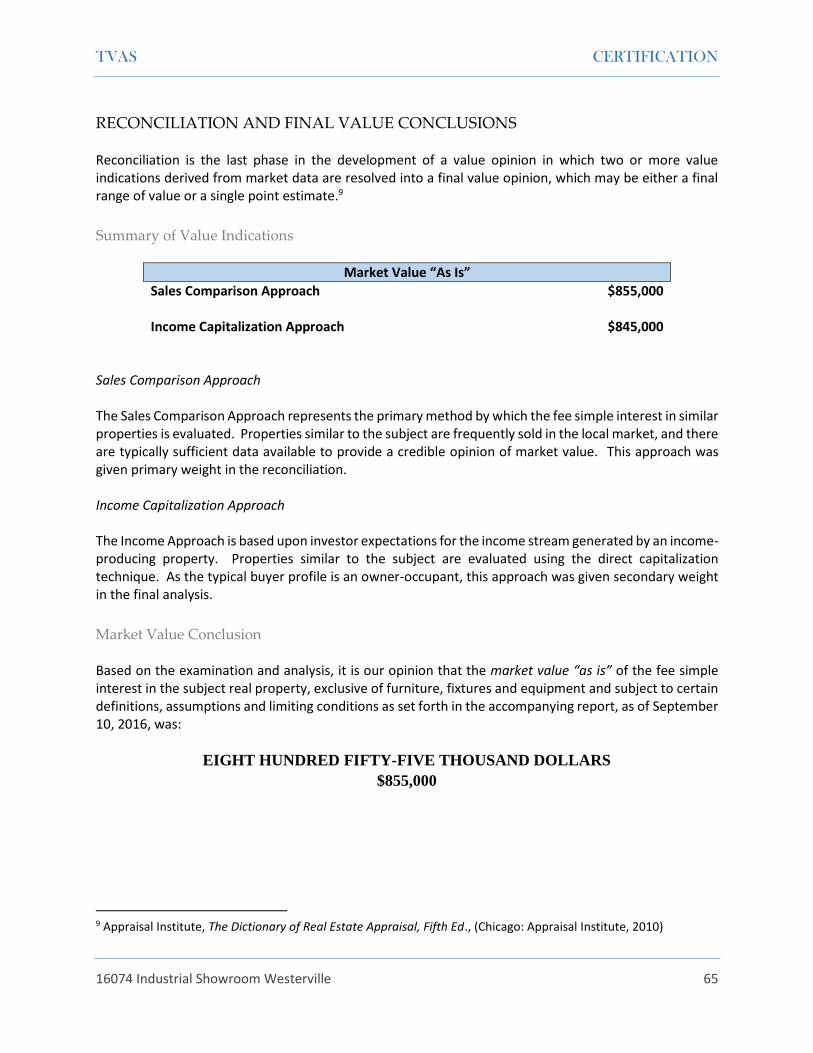
RECONCILIATION AND FINAL VALUE CONCLUSIONS Reconciliation is the last phase in the development of a value opinion in which two or more value indications derived from market data are resolved into a final value opinion, which may be either a final range of value or a single point estimate.9
Summary of Value Indications
Market Value “As Is”
Sales Comparison Approach $855,000 Income Capitalization Approach $845,000
Sales Comparison Approach The Sales Comparison Approach represents the primary method by which the fee simple interest in similar properties is evaluated. Properties similar to the subject are frequently sold in the local market, and there are typically sufficient data available to provide a credible opinion of market value. This approach was given primary weight in the reconciliation. Income Capitalization Approach The Income Approach is based upon investor expectations for the income stream generated by an income-producing property. Properties similar to the subject are evaluated using the direct capitalization technique. As the typical buyer profile is an owner-occupant, this approach was given secondary weight in the final analysis.
Market Value Conclusion Based on the examination and analysis, it is our opinion that the market value “as is” of the fee simple interest in the subject real property, exclusive of furniture, fixtures and equipment and subject to certain definitions, assumptions and limiting conditions as set forth in the accompanying report, as of September 10, 2016, was:
EIGHT HUNDRED FIFTY-FIVE THOUSAND DOLLARS
$855,000
9 Appraisal Institute, The Dictionary of Real Estate Appraisal, Fifth Ed., (Chicago: Appraisal Institute, 2010)
TVAS CERTIFICATION
16074 Industrial Showroom Westerville 66
CERTIFICATION I certify that, to the best of my knowledge and belief: • That the statements of fact contained in this report are true and correct. • The reported analyses, opinions, and conclusions are limited only by the reported assumptions and limiting conditions and are my personal, impartial, and unbiased professional analyses, opinions, and conclusions. • I have no present or prospective interest in the property that is the subject of this report and no personal interest with respect to the parties involved. • I have not performed services regarding the property that is the subject of this report within the three-year period immediately preceding acceptance of this assignment. • I have no bias with respect to the property that is the subject of this report or to the parties involved with this assignment. • My engagement in this assignment was not contingent upon developing or reporting predetermined results. • My compensation for completing this assignment is not contingent upon the development or reporting of a predetermined value or direction in value that favors the cause of the client, the amount of the value opinion, the attainment of a stipulated result, or the occurrence of a subsequent event directly related to the intended use of this appraisal. • My analyses, opinions, and conclusions were developed, and this report has been prepared, in conformity with the Uniform Standards of Professional Appraisal Practice. • J. Carl Talbott, III made a personal inspection of the property that is the subject of this report. No one provided significant professional assistance to the persons signing this report. • The reported analyses, opinions, and conclusions were developed, and this report has been prepared, in conformity with the requirements of the Code of Professional Ethics and the Standards of Professional Appraisal Practice of the Appraisal Institute. • The use of this report is subject to the requirements of the Appraisal Institute relating to review by its duly authorized representatives. • As of the date of this report, Carl Talbott has completed the Standards and Ethics Education Requirements for Candidates of the Appraisal Institute.
J. Carl Talbott, III Ohio Temporary License No. ACGT. 2016004619 State of Ohio
TVAS ADDENDA
16074 Industrial Showroom Westerville 67
ADDENDA
Assumptions and Limiting Conditions The estimate of value contained in this appraisal report is based upon the following basic assumptions and limiting conditions: 1. This report is based in part upon information carefully selected from a variety of sources, including public records and other sources deemed reliable. While a reasonable effort has been made to verify such information, no responsibility is assumed by the appraisers for its accuracy. 2. It is assumed that the legal description and plats of the subject property obtained from public records are correct. The plot plans and sketches included in this report are intended only to assist the reader in visualizing the property and should not be construed as engineering surveys or drawings. 3. The appraisers assume no responsibility for matters legal in nature nor do the appraisers render any opinion as to the property title, which is assumed to be marketable. All existing liens, encumbrances and assessments have been disregarded, and the property has been appraised as though free and clear and under responsible ownership and competent management. 4. It is assumed that all applicable zoning and use regulations and restrictions have been complied with, unless a non-conformity has been stated, defined and considered in this report. 5. It is assumed that all required licenses, consents or other legislative or administrative authority from any local, state or national governmental or private entity or organization have been or can be obtained or renewed for any use on which the value estimate contained in this report is based. 6. It is assumed that the utilization of the land and improvements of the subject is within the boundaries or property lines described and that there is no encroachment or trespass unless noted within the report. 7. It is assumed that there is full compliance with all applicable federal, state and local environmental regulations and laws unless non-compliance is stated, defined and considered in this report. 8. No soil borings or analyses have been made of the subject. It is assumed that soil conditions are adequate to support standard construction consistent with the highest and best use as stated in this report, and that there are no surface or sub-surface conditions or contaminants present that would materially impact value. 9. No responsibility is assumed for engineering matters, neither mechanical nor structural. Good mechanical and structural condition is assumed to exist. 10. Unless otherwise stated in this report, the existence of hazardous material, which may or may not be present on the property, was not observed by the appraiser. The appraiser has no knowledge of the existence of such materials on or in the property. The appraiser, however is not qualified to detect such substances. The presence of substances such as asbestos, urea-formaldehyde foam insulation, or other potentially hazardous materials may affect the value of the property. The value estimate is predicated on the assumption that there is no such material on or in the property that would cause a loss in value. No responsibility is assumed for any such conditions, or for any expertise or engineering knowledge required to discover them. The client is urged to retain an expert in this field, if desired. 11. No environmental impact studies were either requested or conducted in conjunction with this appraisal, and the appraiser hereby reserves the right to alter amend, revise or rescind any of the value opinions based upon any subsequent environmental impact studies, research or investigation.
TVAS ADDENDA
16074 Industrial Showroom Westerville 68
12. The Americans with Disabilities Act (ADA) became effective January 26, 1992. We have not made a specific compliance survey and analysis of this property to determine whether or not it is in conformity with the various detailed requirements of the ADA. It is possible that a compliance survey of the property together with a detailed analysis of the requirements of the ADA could reveal that the property is not in compliance with one or more of the requirements of the act. If so, this fact could have a negative effect upon the value of the property. We did not consider possible noncompliance with the requirements of ADA in estimating the value of the property. 13. Disclosure of the contents of this report is governed by the By-Laws and Regulations of the Appraisal Institute and is subject to the requirements of the Appraisal Institute relating to review by its duly authorized representatives. Neither all nor any part of the contents of this report (especially any conclusions as to value, the identity of the appraisers or the firm with which the appraisers is/are connected, or any reference to the Appraisal Institute or to the MAI or SRA designations) shall be disseminated to the public through advertising, public relations, news or sales media or any other public means of communication without the prior written consent and approval of the undersigned. 14. Unforeseeable events such as national disaster, war, depression or runaway inflation are not anticipated and would require changes in the value estimated in this report. 15. This appraisal was prepared for the confidential use of the client for the purpose specified and must not be used in any other manner without the written consent of the appraisers. The report and the data herein contained, except that provided by the client, remain the exclusive property of our firm. 16. Possession of this report, or a copy thereof, does not carry with it the right of publication. 17. The appraisers will not be required to provide further consultation or testimony or to appear in court by reason of this appraisal unless previous arrangements have been made. 18. I/we assume no responsibility for the business decisions of those who become aware of this report. 19. The individual values estimated for the various components of the subject property are valid only when taken in the context of this report and are invalid if considered individually, or as components in connection with any other appraisal. 20. This report is null and void if used in any connection with a real estate syndicate or syndication, defined as a general or limited partnership, joint venture, unincorporated association or similar organization formed for or engaged in investment or gain from an interest in real property, including but not limited to a sale, exchange, trade, development, or lease of property on behalf of others, or which is required to be registered with the United States Securities and Exchange Commission or any Federal or State Agency which regulates investments made as a public offering. 21. If this appraisal is used for mortgage loan purposes, the appraisers invite attention to the fact that: (1) the equity cash requirements of the sponsor have not been analyzed, (2) the loan ratio has not been suggested, (3) the amortization method and term have not been suggested, and (4) in the case of property to be constructed, compliance with plans and specifications is yet to be determined. 22. In the event the validity of any finding of this appraisal is questioned, the parties agree to binding arbitration. Each party shall select and pay for an independent MAI designated appraiser. The independent appraisers shall select a third MAI appraiser to be paid by both parties. The panel of appraisers shall expeditiously resolve any and all issues raised and their findings shall be binding on all parties.
TVAS ADDENDA
16074 Industrial Showroom Westerville 69
Qualifications of the Appraiser
J. CARL TALBOTT, III COMMERCIAL REAL ESTATE APPRAISER & CONSULTANT
Professional Affiliations: Appraisal Institute Candidate for Designation No. 532595 Certified General Real Estate Appraiser No. 342441 Georgia Real Estate Appraisal Board Education: University of Alabama, Master of Arts Concentration: Economics and Finance Mississippi State University, Bachelor of Business Administration Concentration: Banking and Finance Appraisal Institute General Appraiser Income Approach / Part I 2011
General Appraiser Market Analysis and Highest and Best Use 2012 Real Estate Finance, Statistics and Valuation Modeling 2012 General Appraiser Sales Comparison Approach 2012 General Appraiser Site Valuation and Cost Approach 2012 General Appraiser Income Approach / Part II 2013 Advanced Income Capitalization 2013 General Appraiser Report Writing and Case Studies 2013 7-Hour National USPAP Equivalent Course 2015 Business Practices and Ethics 2015 Quantitative Analysis 2016 Advanced Market Analysis and Highest and Best Use 2016 Advanced Concepts and Case Studies 2016 Experience: Valuation of Apartment Buildings, Automotive Dealerships, Carwash Facilities, Commercial Land, Condominium Developments, Convenience Stores, Dairy Farms, Flex Buildings, Funeral Homes, Golf Courses, Hotels/Motels, Industrial Buildings, Machinery and Equipment, Manufacturing Facilities, Mobile Home Parks, Nursing Facilities, Office Buildings, Poultry Operations, Refrigeration/Cold Storage Facilities, Religious Facilities, Residential Land, Restaurants, Retail Stores, Right-of-Way Acquisition and Property Condemnation, RV Parks, Shopping Centers, Subdivisions, Veterinary Clinics and Warehouse/Distribution Facilities. Offices: Talbott Valuation Advisory Services - CEO, Principal
TVAS ADDENDA
16074 Industrial Showroom Westerville 70
Engagement Letter
TVAS ADDENDA
16074 Industrial Showroom Westerville 71
Insurable Value We have estimated replacement costs by using the Marshall Valuation Service Commercial Estimator V2. The estimator automatically adjusts cost factors to reflect regional and local cost variations. This estimate is based on "Replacement Cost New" with no depreciation and reflects only "direct" or "hard" construction costs such as construction labor and materials: repair design/engineering; permit fees; and contractor's profit, contingency, and overhead. It does not include “indirect” costs such as surveys, site development, financing, or land acquisition costs. The cost estimate’s indirect cost items typically constitute about 10% of their estimate.
Replacement Cost Calculations
Building Type Industrials-Light Manufacturing
Quality/Class Average/S
Building Size (SF) 13,125
Cost PSF Units Total Cost
Base Cost $42.42 13,125 $556,763
Exterior Walls 4.47 13,125 58,669
Heating & Cooling 19.29 2,125 40,991
Sprinklers 2.98 13,125 39,112
Total $52.96 $695,535
Insurance Exclusions 0.10 ($69,554)
Indicated Replacement Cost $625,981
Rounded: $625,000
TVAS ADDENDA
16074 Industrial Showroom Westerville 72
Terms and Definitions Unless otherwise noted, the source of the following definitions is The Dictionary of Real Estate Appraisal, Fifth Edition, (Chicago: Appraisal Institute, 2010). As Is Market Value The estimate of the market value of real property in its current physical condition, use, and zoning as of the appraisal date. Band of Investment A technique in which the capitalization rates attributable to components of a capital investment are weighted and combined to derive a weighted-average rate attributable to the total investment. Deferred Maintenance Needed repairs or replacement of items that should have taken place during the course of normal maintenance. Depreciation A loss in property value from any cause; the difference between the cost of an improvement on the effective date of the appraisal and the market value of the improvement on the same date. Discounted Cash Flow (DCF) Analysis The procedure in which a discount rate is applied to a set of projected income streams and a reversion. The analyst specifies the quantity, variability, timing, and duration of the income streams and the quantity and timing of the reversion, and discounts each to its present value at a specified yield rate.
Effective Age The age of property that is based on the amount of observed deterioration and obsolescence it has sustained, which may be different from its chronological age. Effective Date of Appraisal The date on which the analyses, opinions, and advice in an appraisal, review, or consulting service apply. Entrepreneurial Profit 1) A market-derived figure that represents the amount an entrepreneur receives for his or her contribution to a project and risk; the difference between the total cost of a property (cost of development) and its market value (property value after completion), which represents the entrepreneur’s compensation for the risk and expertise associated with development. An entrepreneur is motivated by the prospect of future value enhancement (i.e., the entrepreneurial incentive). An entrepreneur who successfully creates value through new development, expansion, renovation, or an innovative change of use is rewarded by entrepreneurial profit. Entrepreneurs may also fail and suffer losses. 2) In economics, the actual return on successful management practices, often identified with coordination, the fourth factor of production following land, labor, and capital; also called entrepreneurial return or entrepreneurial reward. Exposure Time The estimated length of time the property interest being appraised would have been offered on the market prior to the hypothetical consummation of a sale at market value on the effective date of the appraiser; a retrospective estimate based on an analysis of past events assuming a competitive and open market.
TVAS ADDENDA
16074 Industrial Showroom Westerville 73
Extraordinary Assumption An assumption, directly related to a specific assignment, which, if found to be false, could alter the appraiser’s opinions or conclusions. Extraordinary assumptions presume as fact otherwise uncertain information about physical, legal, or economic characteristics of the subject property; or about conditions external to the property such as market conditions or trends; or about the integrity of data used in an analysis. Fee Simple Estate Absolute ownership unencumbered by any other interest or estate, subject only to the limitations imposed by the governmental powers of taxation, eminent domain, police power, and escheat. Floor Area Ratio (FAR) The relationship between the above-ground floor area of a building, as described by the building code, and the area of the plot on which it stands; in planning and zoning, often expressed as a decimal, e.g., a ratio of 2.0 indicates that the permissible floor area of a building is twice the total land area. Gross Building Area Total floor area of a building, excluding unenclosed areas, measured from the exterior of the walls of the above-grade area. This includes mezzanines and basements if and when typically included in the region. Highest and Best Use The reasonably probable and legal use of vacant land or an improved property that is physically possible, appropriately supported, financially feasible, and that results in the highest value. The four criteria the highest and best use must meet are legal permissibility, physical possibility, financial feasibility, and maximum productivity. Alternatively, the probable use of land or improved property – specific with respect to the user and timing of the use – that is adequately supported and results in the highest present value. Highest and Best Use of Land or a Site as Though Vacant Among all reasonable, alternative uses, the use that yields the highest present land value, after payments are made for labor, capital, and coordination. The use of a property based on the assumption that the parcel of land is vacant or can be made vacant by demolishing any improvements Highest and Best Use of Property as Improved The use that should be made of a property as it exists. An existing improvement should be renovated or retained as is so long as it continues to contribute to the total market value of the property, or until the return from a new improvement would more than offset the cost of demolishing the existing building and constructing a new one. Hypothetical Condition That which is contrary to what exists but is supposed for the purpose of analysis. Hypothetical conditions assume conditions contrary to known facts about physical, legal, or economic characteristics of the subject property; or about conditions external to the property, such as market conditions or trends; or about the integrity of data used in an analysis. Lease A contract in which rights to use and occupy land or structures are transferred by the owner to another for a specified period of time in return for a specified rent. Leased Fee Interest A freehold (ownership interest) where the possessory interest has been granted to another party by creation of a contractual landlord-tenant relationship (i.e., a lease).
TVAS ADDENDA
16074 Industrial Showroom Westerville 74
Leasehold Interest The tenant’s possessory interest created by a lease. Liquidation Value The most probable price that a specified interest in real property should bring under the following conditions:
• Consummation of a sale within a short time period. • The property is subjected to market conditions prevailing as of the date of valuation. • Both the buyer and seller are acting prudently and knowledgeably. • The seller is under extreme compulsion to sell. • The buyer is typically motivated. • Both parties are acting in what they consider to be their best interests. • A normal marketing effort is not possible due to the brief exposure time. • Payment will be made in cash in U.S. dollars, or in terms of financial arrangements comparable
thereto. • The price represents the normal consideration for the property sold, unaffected by special or
creative financing or sales concessions granted by anyone associated with the sale. This definition can also be modified to provide for valuation with specified financing terms. Market Area The area associated with a subject property that contains its direct competition. Marketing Time An opinion of the amount of time it might take to sell a real or personal property interest at the concluded market value level during the period immediately after the effective date of the appraisal. Marketing time differs from exposure time, which is always presumed to precede the effective date of an appraisal. Market Rent The most probably rent that a property should bring is a competitive and open market reflecting all conditions and restrictions of the lease agreement, including permitted uses, use restrictions, expense obligations, term, concessions, renewal and purchase options, and tenant improvements. Market Value The most probable price which a property should bring in a competitive and open market under all conditions requisite to a fair sale, the buyer and seller each acting prudently and knowledgeably, and assuming the price is not affected by undue stimulus. Implicit in this definition is the consummation of a sale as of a specified date and the passing of title from seller to buyer under conditions whereby:
• buyer and seller are typically motivated; • both parties are well informed or well advised, and acting in what they consider their own best
interests; • a reasonable time is allowed for exposure in the open market; • payment is made in terms of cash in U.S. dollars or in terms of financial arrangements comparable
thereto; and • the price represents the normal consideration for the property sold unaffected by special or
creative financing or sales concessions granted by anyone associated with the sale. (Source: Code of Federal Regulations, Title 12, Chapter I, Part 34.42[g]; also Interagency Appraisal and Evaluation Guidelines, Federal Register, 75 FR 77449, December 10, 2010, page 77472)
TVAS ADDENDA
16074 Industrial Showroom Westerville 75
Net Operating Income The actual or anticipated net income that remains after all operating expenses are deducted from effective gross income but before mortgage debt service and book depreciation are deducted. Obsolescence One cause of depreciation; an impairment of desirability and usefulness caused by new inventions, changes in design, improved processes for production, or external factors that make a property less desirable and valuable for a continued use; may be either functional or external. Parking Ratio A ratio of parking area or parking spaces to an economic or physical unit of comparison. Minimum required parking ratios of various land uses are often stated in zoning ordinances. Prospective Opinion of Value A value opinion effective as of a specified future date. The term does not define a type of value. Instead, it identifies a value opinion as being effective at some specific future date. An opinion of value as of a prospective date is frequently sought in connection with projects that are proposed, under construction, or under conversion to a new use, or those that have not yet achieved sellout or a stabilized level of long-term occupancy. Reconciliation The last phase in the development of a value opinion in which two or more value indications derived from market data are resolved into a final value opinion, which may be either a final range of value or a single point estimate. Replacement Cost The estimated cost to construct, at current prices as of the effective appraisal date, a substitute for the building being appraised, using modern materials and current standards, design, and layout. Reproduction Cost The estimated cost to construct, at current prices as of the effective date of the appraisal, an exact duplicate or replica of the building being appraised, using the same materials, construction standards, design, layout, and quality of workmanship and embodying all the deficiencies, superadequacies, and obsolescence of the subject building. Scope of Work The type and extent of research and analyses in an assignment. Stabilized Income Income at that point in time when abnormalities in supply and demand or any additional transitory conditions cease to exist and the existing conditions are those expected to continue over the economic life of the property; projected income that is subject to change, but has been adjusted to reflect an equivalent, stable annual income. Vacancy and Collection Loss A deduction from potential gross income made to reflect income reductions due to vacancies, tenant turnover, and non-payment of rent; also called vacancy and credit loss or vacancy and contingency loss. Often vacancy and collection loss is expressed as a percentage of potential gross income and should reflect the competitive market. Its treatment can differ according to the interest being appraised, property type, capitalization method, and whether the property is at stabilized occupancy.