David L. Darmofal Associate Professor of Aeronautics and Astronautics
Chair, Committee on Graduate Students
This Page Left Intentionally Blank
2
Approaches to Enhance Driver Situational Assessment Aids
by
Eric M. Jones
Submitted to the Department of Aeronautics and Astronautics on August 20, 2007 in partial fulfillment of the requirements for the degree of
Master of Science in Aeronautics and Astronautics
Abstract
Collision warning systems encounter a fundamental trade‐off between providing the driver more time in which to respond and alerting the driver unnecessarily. The probability that a driver successfully avoids a hazard increases as the driver is provided more time and distance in which to identify the hazard and execute the most effective response. However, alerting the driver at earlier, more conservative thresholds increases the probability that the alerts are unnecessary, either because sensor error has falsely identified a hazard or because the environment has changed such that a hazard is no longer a threat. Frequent unnecessary alerts degrade alert effectiveness by reducing trust in the system. The human‐factors issues pertaining to a forward collision warning system (FCWS) were analyzed using an Integrated Human‐Centered Systems approach, from which two design features were proposed: multi‐stage alerting, which alerts the driver at a conservative early threshold, in addition to a more serious late threshold; and directional alerting, which provides the driver information regarding the location of the hazard that prompted the alert activation. Alerting the driver earlier increases the probability of a successful response by conditioning the driver to respond more effectively if and when evasive action is necessary. Directional alerting decreases the amount of time required to identify the hazard, while promoting trust in the system by informing the driver of the cause of the alert activation. The proposed design features were incorporated into three FCWS configurations, and an experiment was conducted in which drivers were equipped with the systems and placed in situations in which a collision would occur if they did not respond. Drivers who were equipped with multi‐stage and directional alerting were more effective at avoiding hazardous situations than drivers who were not provided early alerting. Drivers with early alerting tended to respond earlier and more consistently, which promoted more successful responses. Subjective feedback indicates that drivers experienced high levels of acceptance, confidence, and trust in multi‐stage and directional alerting.
Thesis Supervisor: R. John Hansman Title: Professor of Aeronautics and Astronautics
3
This Page Left Intentionally Blank
4
Acknowledgements
This work was funded by a grant provided through the Ford‐MIT Alliance.
I would like to thank several people, without whom my graduate career would not have been possible:
My advisor, Prof. John Hansman, whose patience, understanding, and guidance were integral to my experience at MIT.
Louis and Dev, who have supported me tremendously throughout this project.
Cori, Max, Charlotte, CB, and everyone at AnthroTronix who truly introduced me to my love of human factors engineering.
Karen, whose mentorship and endless enthusiasm never ceases to inspire and encourage me.
I would also like to thank the Hinman CEO’s Program and the University of Maryland, College Park for providing the academic foundation that has opened my doors to countless opportunities.
There are several other individuals, without whom my graduate experiences would have been quite different:
Jonathan, whose kindness is only matched by his love of hockey. Your wisdom (and your wit) was crucial to my time in the lab.
Amy, who helped me get through my toughest academic times. Someday, those wings of yours are going to fly you off to whichever dream you choose (I expect a postcard).
Bruce, my erudite friend, who constantly forces me to sharpen my intellect (and my ability to successfully navigate a snow‐covered mountain).
Thaddeus, who has been a source of inspiration both academically and beyond.
Geri and Jay, who made Dearborn my home, and my summer so memorable.
Dan: without your unique sense of humor, MIT simply would not have been the same.
Kristin, my love: I am looking forward to all of our future adventures together.
And finally, my Mom and Dad. You encouraged my passion for science, my perpetual curiosity, and my personal ambition. Your influence, support, and love, are the sole reason I am who I am today: a jack of all trades, and now a master of one.
Remember, everyone: drive safely.
5
This Page Left Intentionally Blank
6
Table of Contents
Abstract ..........................................................................................................................................3 Acknowledgements .....................................................................................................................5 Table of Contents.........................................................................................................................7 List of Figures ...............................................................................................................................9 List of Tables...............................................................................................................................13
1. Introduction ............................................................................................................................15 2. Methodology...........................................................................................................................19 2.1. Integrated Human‐Centered Systems Approach....................................................... 19 2.2. System Model .................................................................................................................. 21 2.3. Information Requirements............................................................................................. 24 2.4. Kinematic Assessment.................................................................................................... 27
2.4.1. Example: Stopped Object on a Highway ..........................................................................................29 2.4.2. Time‐to‐Collision Alerting Thresholds ..............................................................................................33 2.4.3. The System Operating Characteristic Curve .....................................................................................35
Figure 2‐1: General FCWS closed loop feedback process. ............................................... 21 Figure 2‐2: Detailed FCWS closed loop feedback process. .............................................. 22 Figure 2‐3: Examples of intent states; all describe ways in which the system dynamics
can change........................................................................................................... 25 Figure 2‐4: An example state‐space representation of collision avoidance (braking to
stop)...................................................................................................................... 27 Figure 2‐5: An example state‐space representation of collision avoidance (steering to
avoid). .................................................................................................................. 28 Figure 2‐6: An example state‐space representation, including a notional alerting
threshold.............................................................................................................. 29 Figure 2‐7: A simplified representation of an example steering response. ................... 31 Figure 2‐8: Example: braking maneuvering limits for response times of 1.5, 3.0, and
6.0 seconds. ......................................................................................................... 32 Figure 2‐9: Example: steering maneuver limits for response times of 1.5, 3.0, and 6.0
seconds. ............................................................................................................... 32 Figure 2‐10: Example braking maneuver limits and corresponding notional alerting
thresholds. ........................................................................................................... 34 Figure 2‐11: Example steering maneuver limits and corresponding notional alerting
thresholds. ........................................................................................................... 34 Figure 2‐12: An example SOC curve. .................................................................................... 35 Figure 2‐13: Various degrees of system benefit as expressed by the SOC curve............ 36 Figure 2‐14: An SOC curve representation of the benefits of multi‐stage alerting. ....... 38 Figure 2‐15: An example implementation of a multi‐stage alerting configuration........ 39 Figure 2‐16: An example implementation of multi‐stage directional alerting (1 of 3);
locational stimulus highlights objects in the environment (diamond and octagon on windshield)..................................................................................... 41
Figure 2‐17: An example implementation of multi‐stage directional alerting (2 of 3). . 41 Figure 2‐18: An example implementation of multi‐stage directional alerting (3 of 3). . 42 Figure 3‐1: The experimental design: 1 fixed factor across 4 levels, representing 4
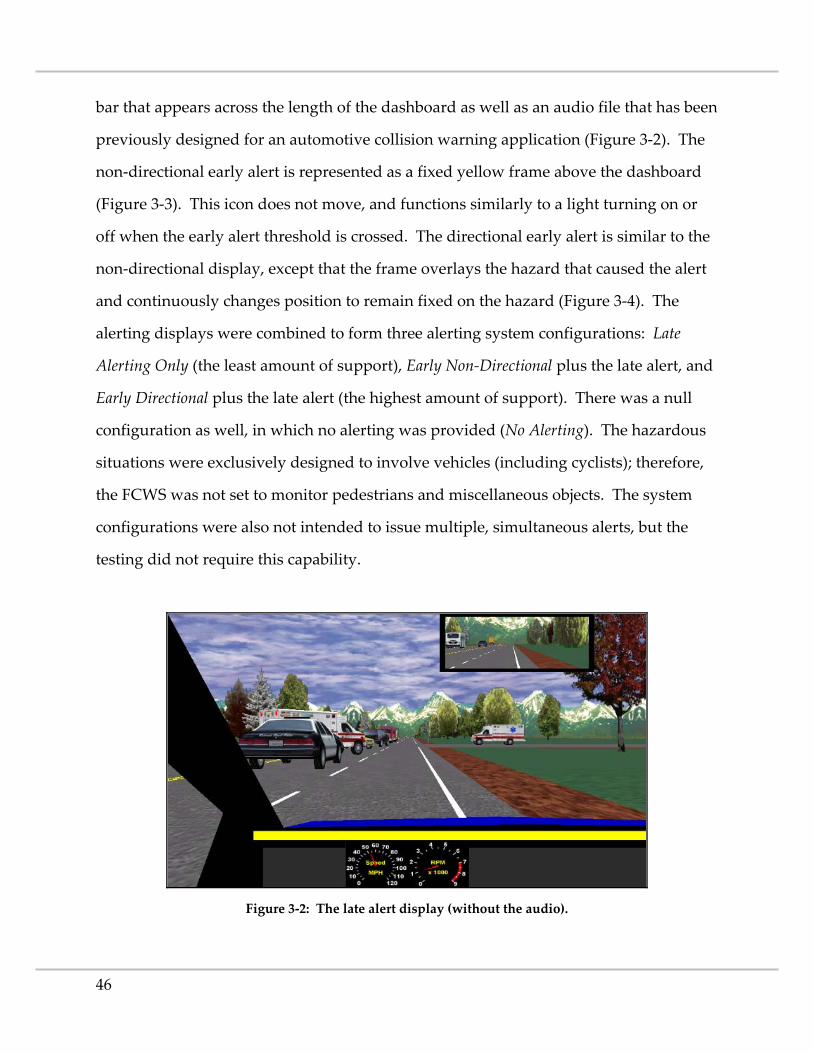
treatments............................................................................................................ 44 Figure 3‐2: The late alert display (without the audio). ..................................................... 46 Figure 3‐3: The Early Non‐Directional system configuration with (right) and without
the late alert......................................................................................................... 47
9
Figure 3‐4: The Early Directional system configuration with (right) and without the late alert. .............................................................................................................. 47
Figure 3‐5: TE2 example illustration: Oncoming vehicle turns left in front of the driver.................................................................................................................... 51
Figure 3‐6: TE6 example illustration: With an accident in the left‐hand lane, an ambulance crosses the road from the right. ................................................... 51
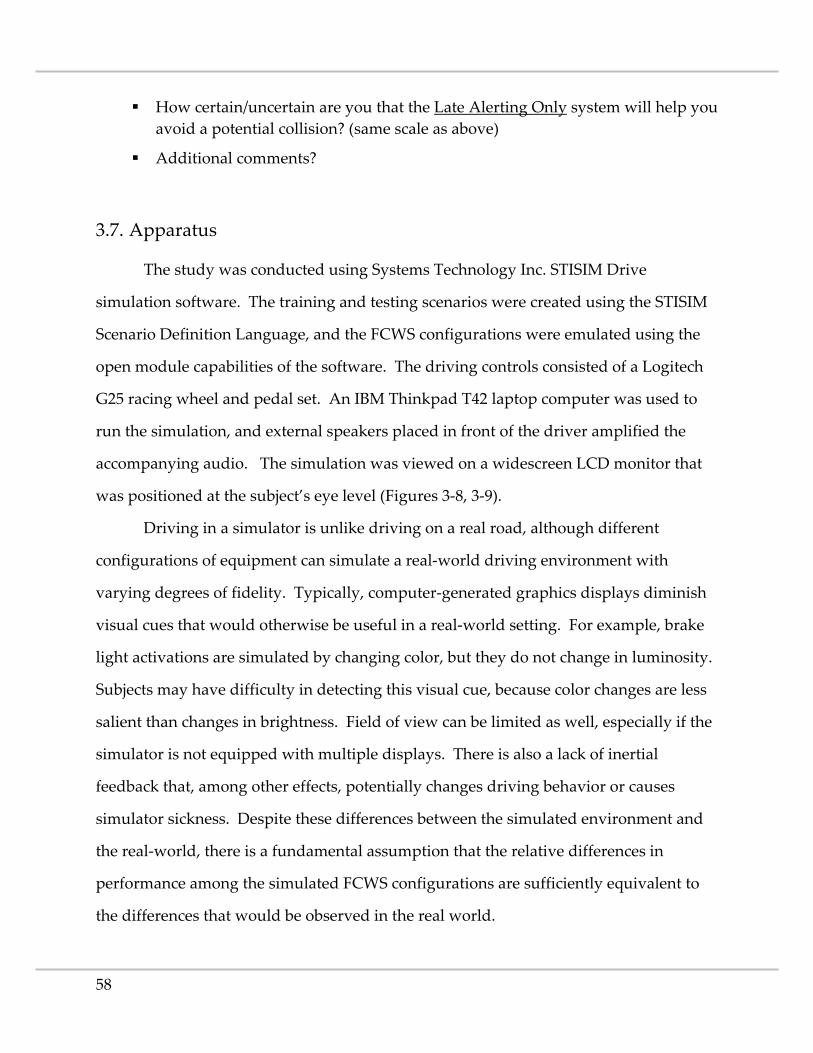
Figure 3‐7: An example of a map used for the map‐reading task [44]........................... 56 Figure 3‐8: The driving simulator........................................................................................ 59 Figure 3‐9: The positions of the subject and investigator. ............................................... 59 Figure 4‐1: Relative velocity at impact for collisions that occurred during TE2. ......... 64 Figure 4‐2: Relative velocity at impact for collisions that occurred during TE4. ......... 64 Figure 4‐3: Minimum range with respect to the target vehicle. ...................................... 70 Figure 4‐4: Response times with respect to the target vehicle. ....................................... 73 Figure 4‐5: Velocity profile for TE2 (key to the right)....................................................... 75 Figure 4‐6: Velocity profile for TE4. .................................................................................... 75 Figure 4‐7: Relative velocity vs. range plot for TE2. ......................................................... 77 Figure 4‐8: Relative velocity vs. range plot for TE4. ......................................................... 77 Figure 4‐9: Relative velocity vs. range plot for TE8. ......................................................... 78 Figure 4‐10: Relative velocity vs. range plot for the training scenario threat event (naïve
response). ............................................................................................................ 80 Figure 4‐11: Map‐reading task completion times................................................................ 81 Figure 4‐12: Example: accelerator input during unnecessary alert activations; first
exposure to the Early Directional FCWS (1 of 2)........................................... 84 Figure 4‐13: Example: accelerator input during unnecessary alert activations; first
exposure to the Early Directional FCWS (2 of 2)........................................... 84 Figure 4‐14: Example: accelerator input during unnecessary alert activations; first
exposure to the Early Non‐Directional FCWS (1 of 2).................................. 84 Figure 4‐15: Example: accelerator input during unnecessary alert activations; first
exposure to the Early Non‐Directional FCWS (2 of 2).................................. 85 Figure 4‐16: Subjective rating of the usefulness of early alerting. .................................... 86 Figure 4‐17: Percentages of subjects who thought early alerting was useful, not useful,
or were unsure.................................................................................................... 87 Figure 4‐18: Subjective confidence ratings for each of the alerting systems. .................. 88 Figure 4‐19: Percentage of subjects who were confident in the Early Directional system
configuration, not confident, or were unsure. ............................................... 88
10
Figure 4‐20: Percentage of subjects who were confident in the Early Non‐Directional system configuration, not confident, or were unsure................................... 89
Figure 4‐21: Percentage of subjects who were confident in the Late Alerting Only system configuration, not confident, or were unsure................................... 90
Figure 4‐22: Percentage of subjectsʹ system configuration preferences. .......................... 90 Figure 4‐23: Percentage of subjects who would prefer to own a FCWS, would not
prefer to own one, or were unsure. ................................................................. 91 Figure 4‐24: Percentage of subjectsʹ system configuration preferences of those who
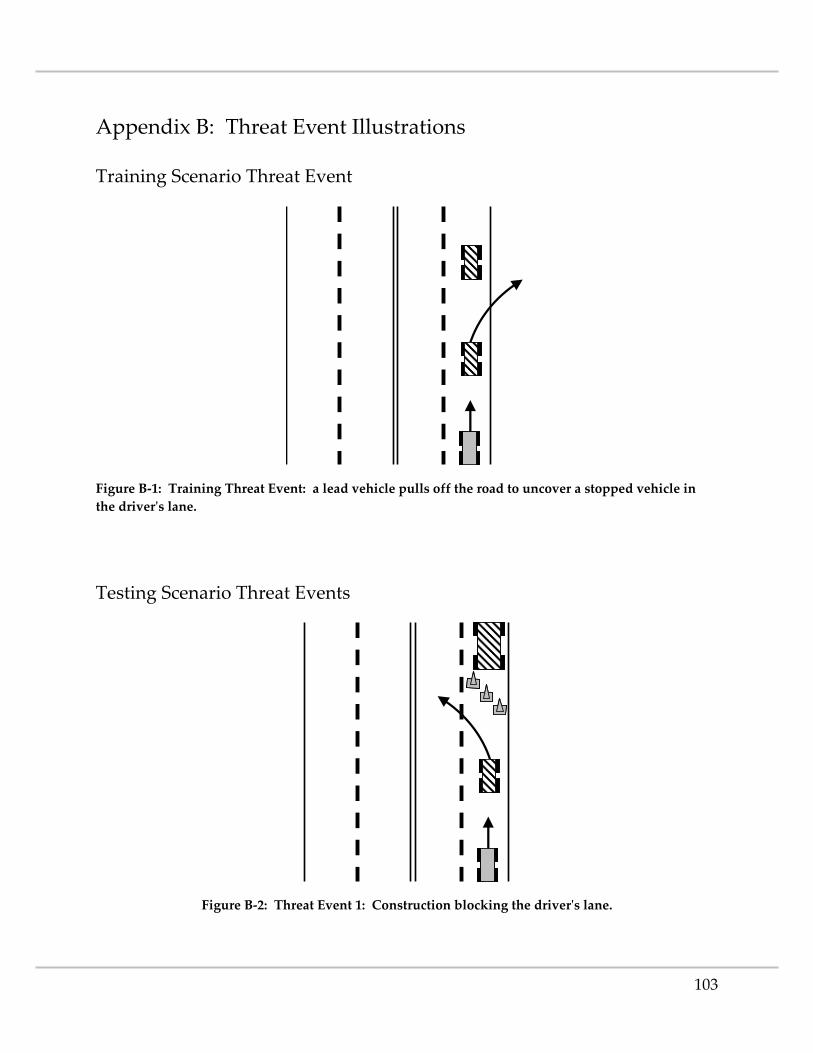
would prefer to own a FCWS........................................................................... 92 Figure B‐1: Training Threat Event: a lead vehicle pulls off the road to uncover a
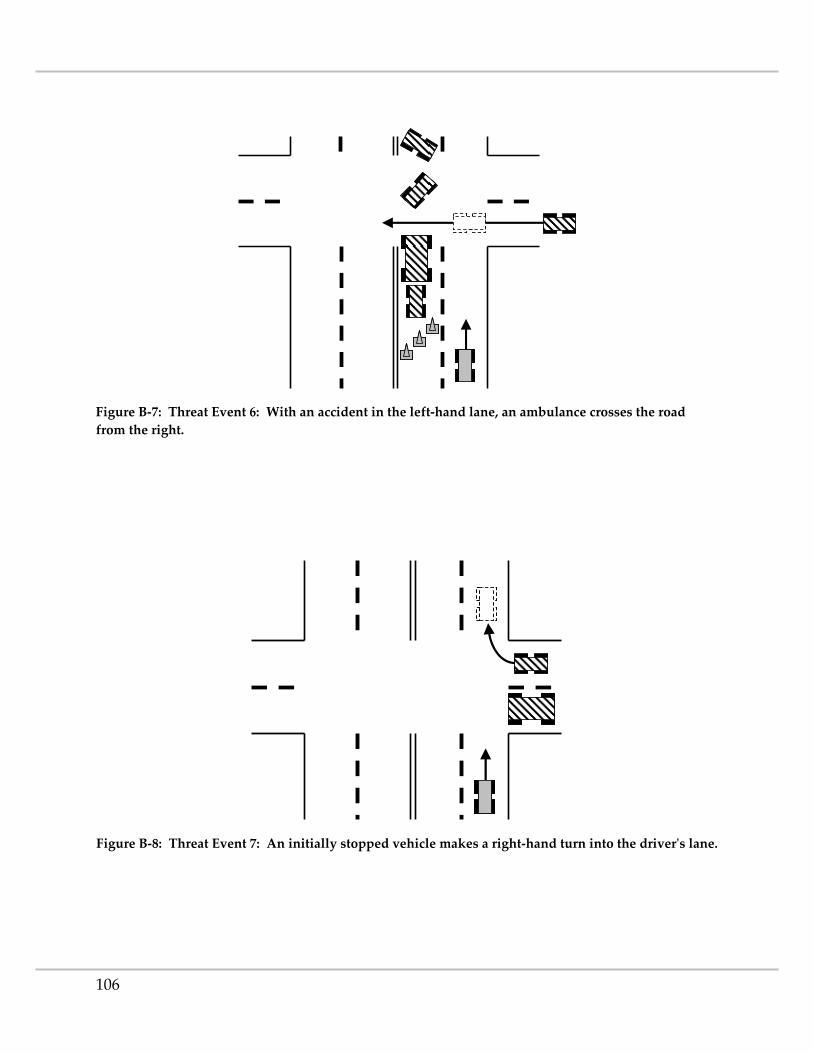
stopped vehicle in the driverʹs lane............................................................... 103 Figure B‐2: Threat Event 1: Construction blocking the driverʹs lane. .......................... 103 Figure B‐3: Threat Event 2: Oncoming vehicle turning left in front of the driver. .... 104 Figure B‐4: Threat Event 3: Initially stopped vehicle pulls into the driverʹs lane...... 104 Figure B‐5: Threat Event 4: A police officer chases another vehicle across the road. 105 Figure B‐6: Threat Event 5: A cyclist enters the driverʹs lane. ...................................... 105 Figure B‐7: Threat Event 6: With an accident in the left‐hand lane, an ambulance
crosses the road from the right. ..................................................................... 106 Figure B‐8: Threat Event 7: An initially stopped vehicle makes a right‐hand turn into
the driverʹs lane. ............................................................................................... 106 Figure B‐9: Threat Event 8: A lead vehicle decelerates because of slow‐moving traffic
Table 2‐1: Alerting threshold TTC values for 1.5, 3.0, and 6.0 second response times for evasive braking and steering maneuvers for an assumed maximum initial speed of 60 mph. ................................................................................................... 33
Table 4‐1: Threat event outcome summary (key below). .................................................. 62 Table 4‐2: Target vehicle collisions for each system configuration.................................. 63 Table 4‐3: Late alert threshold crossings, with respect to the target vehicle. ................. 65 Table 4‐4: Collision avoidance effectiveness, with respect to the target vehicle. .......... 66 Table 4‐5: Target and non‐target collisions, as a percentage of the total number of
hazards. .................................................................................................................. 67 Table 4‐6: Late alert threshold crossings for each system configuration, as a percentage
of the total number of target and non‐target hazards. .................................... 67 Table 4‐7: Collision avoidance effectiveness, with respect to target and non‐target
hazards. .................................................................................................................. 68 Table 4‐8: Late alert threshold crossings (given early alert threshold crossings),
necessary early alerts, and system effectiveness. ............................................. 69 Table 4‐9: Early responses, with respect to the target vehicle. ......................................... 71 Table 4‐10: Undefined response times. .................................................................................. 72 Table 4‐11: Type of first response during the threat events, expressed as percentage of
the total number of responses. ............................................................................ 74 Table 4‐12: Training scenario threat event outcomes (naïve response) (key to the right).
.................................................................................................................................. 79 Table 4‐13: Number of correct police officer identifications............................................... 82 Table 4‐14: Unnecessary early alert activations.................................................................... 85 Table A‐1: Testing scenario treatment order (key below). ............................................... 101 Table A‐2: Training scenario treatment order (key below).............................................. 102
13
This Page Left Intentionally Blank
14
1. Introduction
Each year, approximately 40 thousand people in the United States lose their lives
because of automobile accidents, an average that has remained steady for decades
despite technological advances in motor vehicle safety [1, 2]. Passive safety systems
such as seat belts and air bags effectively reduce the severity of injuries that result from
collisions, but they are limited to mitigating the aftermath of dangerous situations that
may have already injured the driver. To reduce the number of motor vehicle collisions,
injuries, and fatalities, research efforts have been developing active safety systems that
aim to prevent accidents from occurring altogether.
Current active safety systems focus predominantly on driver warnings and
vehicle control; for example, electronic stability systems and anti‐lock brakes that
prevent the driver from losing control of the vehicle during a turning or braking
maneuver. Warning lights mounted on mirrors can indicate the presence of a vehicle in
a blind spot, and lane departure warnings can alert the driver if an unintentional lane
change is detected. There are also systems that control the vehicle automatically, such
as adaptive cruise control which monitors and adjusts speed to match the traffic in the
driver’s lane and collision mitigation by braking which reduces vehicle speed when a
collision appears imminent. Unlike automated systems and simple warnings, collision
warning systems operate concurrently with the driver to provide alerts that support
awareness and assessment of potential hazards in order to avoid undesirable incidents
[3].
Over 1.8 million rear‐end collisions were reported in 2005, comprising the largest
segment of crashes (29.6%) as well as the most common crash that exclusively damages
property (30.4%) [1]. In addition to being the most frequent and most costly type of
accident, rear‐end collisions are also the most preventable, assuming that the driver
ultimately has control of the vehicle’s speed and trajectory. The frequency and
15
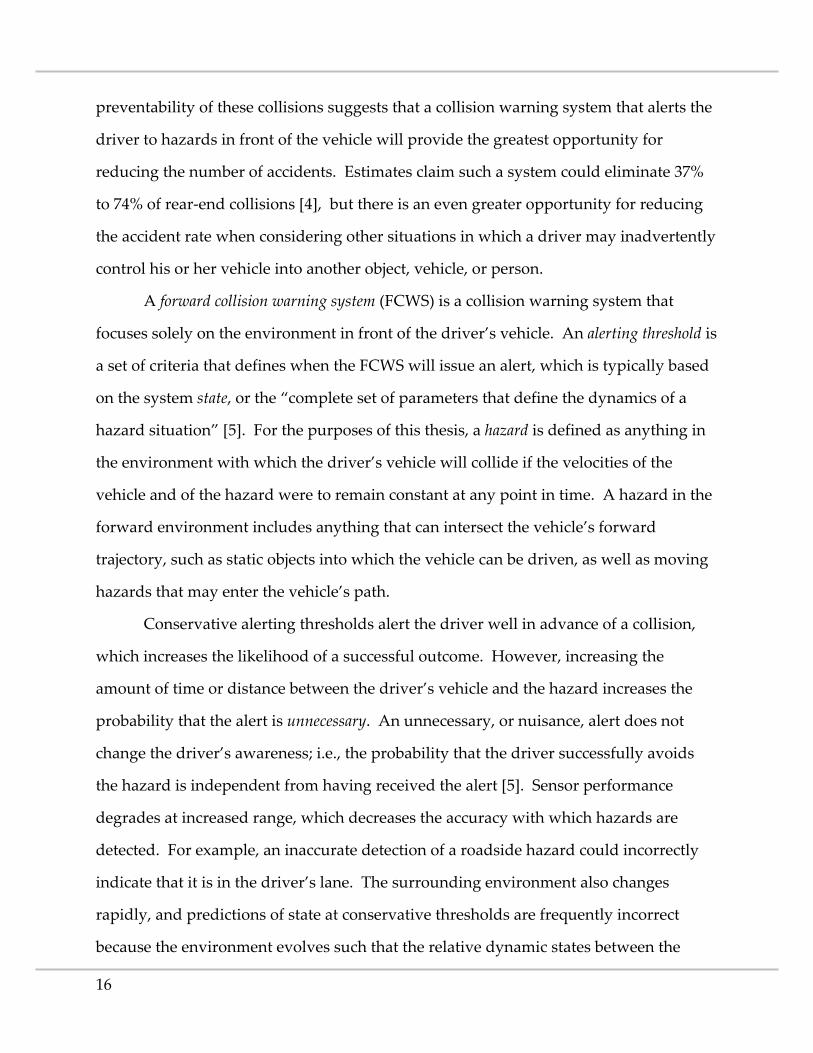
preventability of these collisions suggests that a collision warning system that alerts the
driver to hazards in front of the vehicle will provide the greatest opportunity for
reducing the number of accidents. Estimates claim such a system could eliminate 37%
to 74% of rear‐end collisions [4], but there is an even greater opportunity for reducing
the accident rate when considering other situations in which a driver may inadvertently
control his or her vehicle into another object, vehicle, or person.
A forward collision warning system (FCWS) is a collision warning system that
focuses solely on the environment in front of the driver’s vehicle. An alerting threshold is
a set of criteria that defines when the FCWS will issue an alert, which is typically based
on the system state, or the “complete set of parameters that define the dynamics of a
hazard situation” [5]. For the purposes of this thesis, a hazard is defined as anything in
the environment with which the driver’s vehicle will collide if the velocities of the
vehicle and of the hazard were to remain constant at any point in time. A hazard in the
forward environment includes anything that can intersect the vehicle’s forward
trajectory, such as static objects into which the vehicle can be driven, as well as moving
hazards that may enter the vehicle’s path.
Conservative alerting thresholds alert the driver well in advance of a collision,
which increases the likelihood of a successful outcome. However, increasing the
amount of time or distance between the driver’s vehicle and the hazard increases the
probability that the alert is unnecessary. An unnecessary, or nuisance, alert does not
change the driver’s awareness; i.e., the probability that the driver successfully avoids
the hazard is independent from having received the alert [5]. Sensor performance
degrades at increased range, which decreases the accuracy with which hazards are
detected. For example, an inaccurate detection of a roadside hazard could incorrectly
indicate that it is in the driver’s lane. The surrounding environment also changes
rapidly, and predictions of state at conservative thresholds are frequently incorrect
because the environment evolves such that the relative dynamic states between the
16
vehicle and the hazard do not warrant an alert activation. For example, the driver may
pass a stationary object along the side of the road while turning, which will not present
a hazard if the vehicle continues to turn; but during the fraction of a second in which
the vehicle is pointed towards the object, a simple collision warning algorithm would
determine the vehicle’s instantaneous forward trajectory, calculate a potential collision,
and activate unnecessarily. The object would have been avoided if the alert had not
been issued; however, a collision would have occurred if the vehicle had maintained
that trajectory. On the other hand, if the object was a moving vehicle in the opposite
lane, the system would have to infer what the other vehicle was going to do in the
future. Even if the states of the environment are measured perfectly, there will be
situations in which the FCWS will unnecessarily alert the driver because of the
uncertainty that permeates the external environment and the activity other vehicles.
Frequent unnecessary alerts will degrade the driver’s trust in the system (this is
sometimes referred to as the cry‐wolf effect), but setting the threshold too close to an
impending collision will reduce alert effectiveness by decreasing the available time and
distance in which to respond. The frequency of nuisance alerts may annoy the driver to
the point of distraction, particularly if the FCWS interface is invasive. Driving
incorporates many cognitively intensive tasks, and a mistimed alarm (especially an
unnecessary one) may exacerbate a dangerous situation by increasing the driver’s
cognitive workload. Similarly, alerting at an inopportune time may incite evasive
behavior that could cascade into a more serious situation. Consideration of these
human factors issues indicates a delicate, temporal balance of information that
contributes to the overall success of a collision warning system. The goal of this thesis
is to examine the system from a human‐centered perspective in order to design and
evaluate situational assessment aids that enhance the effectiveness of a FCWS.
The success of an alert is largely dependent on the driver’s response time, i.e., the
amount of time needed to assess the situation and, if necessary, perform an evasive
17
maneuver. Supporting the driver’s awareness of the environment and providing more
time to make an assessment will increase the probability that the driver will respond
quickly and effectively. However, there is a fundamental tradeoff between providing
the driver more time in which to react, and alerting the driver unnecessarily.
Conservative alerting thresholds provide the driver more time and distance in which to
make an assessment, but alerting farther in advance increases the probability that the
alert will not be necessary. Unnecessary alerts decrease the driver’s trust in the system,
which increases reaction time by provoking skeptical behavior that compels the driver
to verify that the cause of the alert is reason for concern. Response time increases if the
driver must identify a hazard that lacks salience, especially if the driver is initially
distracted and has not been monitoring changes in the environment.
Two situational assessment aids are proposed to enhance the effectiveness of a
collision warning system: multi‐stage alerting, which alerts the driver at an earlier,
conservative threshold in addition to a more serious late alert; and directional alerting,
which provides the driver information regarding the location of the hazard that
prompted the alert activation. The probability that a hazard is successfully avoided
increases as the driver’s response time decreases. Providing the driver more time in
which to respond increases this probability as well, because the driver has more time in
which to choose the most appropriate response. Multi‐stage alerting alerts the driver at
earlier, more conservative thresholds, thereby informing a potentially distracted or
unaware driver that there is hazard that may require further attention if the situation
becomes progressively more dangerous. This advanced notice conditions the driver to
respond more effectively if the hazard becomes more serious, because more time is
provided to formulate a response. Even if the conservative alert is unnecessary, the
driver will be more tolerant of the increased frequency of nuisance alerts if he or she
understands why they were provided. Directional alerting maintains trust in the
system by directing the driver’s attention to the hazard that caused the alert to activate.
18
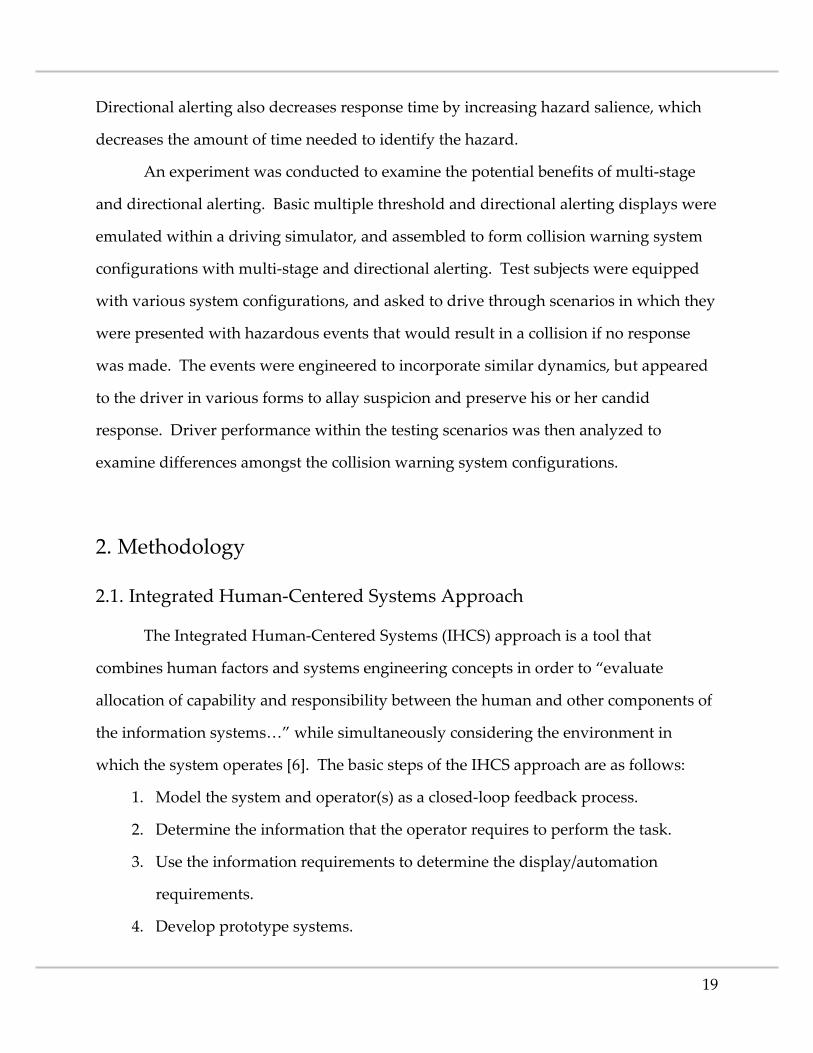
Directional alerting also decreases response time by increasing hazard salience, which
decreases the amount of time needed to identify the hazard.
An experiment was conducted to examine the potential benefits of multi‐stage
and directional alerting. Basic multiple threshold and directional alerting displays were
emulated within a driving simulator, and assembled to form collision warning system
configurations with multi‐stage and directional alerting. Test subjects were equipped
with various system configurations, and asked to drive through scenarios in which they
were presented with hazardous events that would result in a collision if no response
was made. The events were engineered to incorporate similar dynamics, but appeared
to the driver in various forms to allay suspicion and preserve his or her candid
response. Driver performance within the testing scenarios was then analyzed to
examine differences amongst the collision warning system configurations.
2. Methodology
2.1. Integrated Human‐Centered Systems Approach
The Integrated Human‐Centered Systems (IHCS) approach is a tool that
combines human factors and systems engineering concepts in order to “evaluate
allocation of capability and responsibility between the human and other components of
the information systems…” while simultaneously considering the environment in
which the system operates [6]. The basic steps of the IHCS approach are as follows:
1. Model the system and operator(s) as a closed‐loop feedback process.
2. Determine the information that the operator requires to perform the task.
3. Use the information requirements to determine the display/automation
requirements.
4. Develop prototype systems.
19
5. Perform simulation evaluations.
6. Integrated simulation testing.
7. System evaluation.
8. Field development phase.
The thesis will focus on steps 1 through 5 as applied to the design of a FCWS.
Simulated testing was performed, but the design concepts have not been introduced
into a field setting.
Previously, the IHCS approach has been used to evaluate aeronautical
applications that involve complex flows of information amidst human operators, such
as air traffic management and aircraft collision avoidance systems [6]. The automotive
domain is similar in that the driver must navigate the vehicle safely through a
hazardous, rapidly changing environment. There are differences, however, which put
the driving environment at a disadvantage. The density of motor vehicles on a
roadway is higher than that of aircraft within airspace. This proximity increases the
speed with which a seemingly harmless situation can propagate into a hazardous one.
The design of a FCWS must account for the dynamic constraints imposed by this
proximity. For example, a situation will degrade more rapidly when a hazard is closer
to the driver, which increases the risk of response time exceeding the amount of time
that is available before a collision occurs. This supports the need to decrease the
driver’s response time, or alert the driver earlier, in order to ensure a successful
avoidance.
20
2.2. System Model
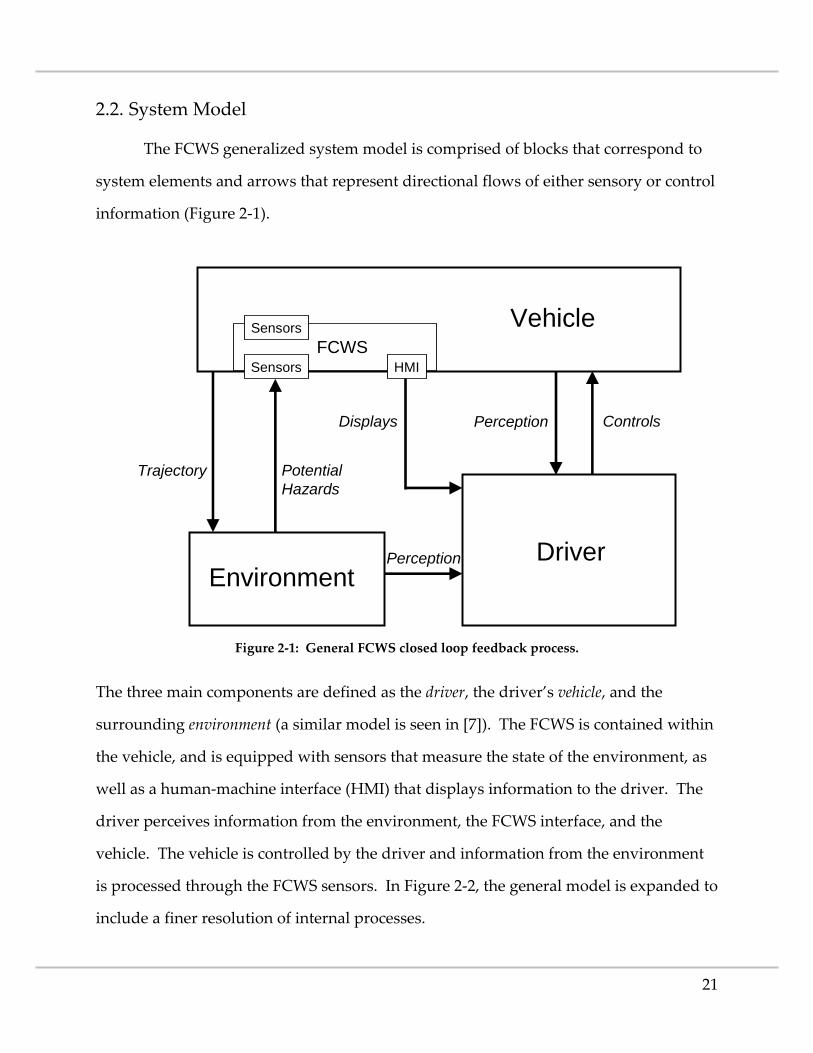
The FCWS generalized system model is comprised of blocks that correspond to
system elements and arrows that represent directional flows of either sensory or control
information (Figure 2‐1).
Vehicle
EnvironmentDriver
HMISensors
SensorsFCWS
ControlsPerceptionDisplays
Perception
PotentialHazards
Trajectory
Figure 2‐1: General FCWS closed loop feedback process.
The three main components are defined as the driver, the driver’s vehicle, and the
surrounding environment (a similar model is seen in [7]). The FCWS is contained within
the vehicle, and is equipped with sensors that measure the state of the environment, as
well as a human‐machine interface (HMI) that displays information to the driver. The
driver perceives information from the environment, the FCWS interface, and the
vehicle. The vehicle is controlled by the driver and information from the environment
is processed through the FCWS sensors. In Figure 2‐2, the general model is expanded to
Range rate Heading change rateBrake lights Azimuth change rateGPS route data Vehicle-to-Vehicle communication
In-vehicle displays (HMI)
Other Vehicles
Weather/Visibility factorsSurrounding trafficTraffic signals and signs
Vehicle-to-Vehicle communicationVehicle-to-Infrastructure communication
Driver
Vehicle
Environment
Figure 2‐3: Examples of intent states; all describe ways in which the system dynamics can change.
For a system to warn the driver of potential hazards, it must be able to accurately
detect those hazards within the environment. Sophisticated sensing technologies have
existed for decades, but it was not until recently that these sensors have been made
25
accessible to automobiles. Researchers have been exploring the potential applications of
radar ([11‐16]) and image‐based systems ([17‐19]) for object detection and identification.
There are also technologies that rely on thermal imaging, particularly for detecting
pedestrians or wild animals [20‐22]. Vehicle and pedestrian detection is also being
attempted through laserscanning [23‐25]. Some of the more robust systems, however,
are combined sensor suites [26, 27]. Selecting sensors and evaluating their effectiveness
within an operating environment is beyond the scope of this thesis; however, given
these observed technological trends, and for the purposes of this study, certain
information is assumed to be available.
In order to help the driver avoid objects that could potentially intersect his or her
path, these sensors must be able to detect the dynamic states of objects in the
environment. Current position relative to the driver’s vehicle is defined by range and
azimuthal angle, while speed and acceleration vectors are derived from these values as
they change over time. In a real‐world implementation, the accuracy of these values
decreases as the distance to the hazard increases. Attempting to detect hazards at
farther ranges will increase the number of false‐positive identifications. False‐positive
alerts are unnecessary because no hazard is present in the environment. Regardless of
what the driver chooses to do, no collision will occur with the cause of the alert
activation.
When the FCWS issues an alert, the driver needs to understand what the alert is
suggesting and the reason this suggestion was made. The alert stimulus must first be
perceived through the interface, as well as information regarding the corresponding
state. For example, the state of the alert could be binary (on or off), or it could consist of
multiple thresholds which correspond to a range of system states. In either case, the
driver needs to understand the circumstances that caused the alerting system to
activate. The driver is typically monitoring the environment for hazards, and must
therefore integrate this new information into the ongoing driving process. The driver
26
may have already been aware of the hazard, in which case the alert is redundant, or the
hazard was not detected by the driver, in which case the driver must decide whether or
not the source of the alert must be verified. If the driver trusts the system, then it may
not be necessary to understand why the alert was issued; otherwise, the driver must
then identify the location of the hazard by visually scanning the environment or by
using information provided through the FCWS display. If necessary, an evasive course
of action is chosen and executed, after which the driver recovers from the incident.
2.4. Kinematic Assessment
The display/automation requirements must account for the dynamic constraints
of the system elements. Time is a limiting factor when alerting the driver: if collisions
are to be avoided, alerts must be provided early enough for the driver to respond
appropriately. The state‐space representation proposed by [5] more clearly illustrates
this concept (Figures 2‐4, 2‐5).
Relative Velocity
Range
A
B
C
Ex. BrakingManeuvering Limit
Col
lisio
n
Figure 2‐4: An example state‐space representation of collision avoidance (braking to stop).
27
Relative Velocity
Range
A
B
C
Col
lisio
n
Ex. Steering Maneuvering Limit
Figure 2‐5: An example state‐space representation of collision avoidance (steering to avoid).
Each axis corresponds to a variable that describes a relative dynamic state of the system,
such as range (distance from the hazard) or relative velocity (range rate of change). The
vehicle state is represented as a location within the state‐space defined by these two
variables, and state trajectories describe the vehicle’s change in location over time. The
hazard space is a region in which, if entered, a collision will occur—in this case, when
range equals 0. The maneuvering limit is a region in which, if entered, the vehicle will
unavoidably cross into the hazard space (trajectories A and B). For example, a vehicle
that does not begin braking or turning at a sufficient range will ultimately collide with
the hazard depending on their respective inertial constraints. Relative velocity at
impact and the severity of the collision may be reduced, but an accident will still occur
(trajectory B). The inertial constraints and the chosen evasive maneuver will dictate the
shape of the boundary: in Figure 2‐4, stopping distance is proportional to the square of
the relative velocity, thus forming the parabolic curve; in Figure 2‐5, assuming that the
amount of time to make an evasive steering maneuver is constant, the distance over
which the maneuver is performed increases linearly with speed. A driver whose
28
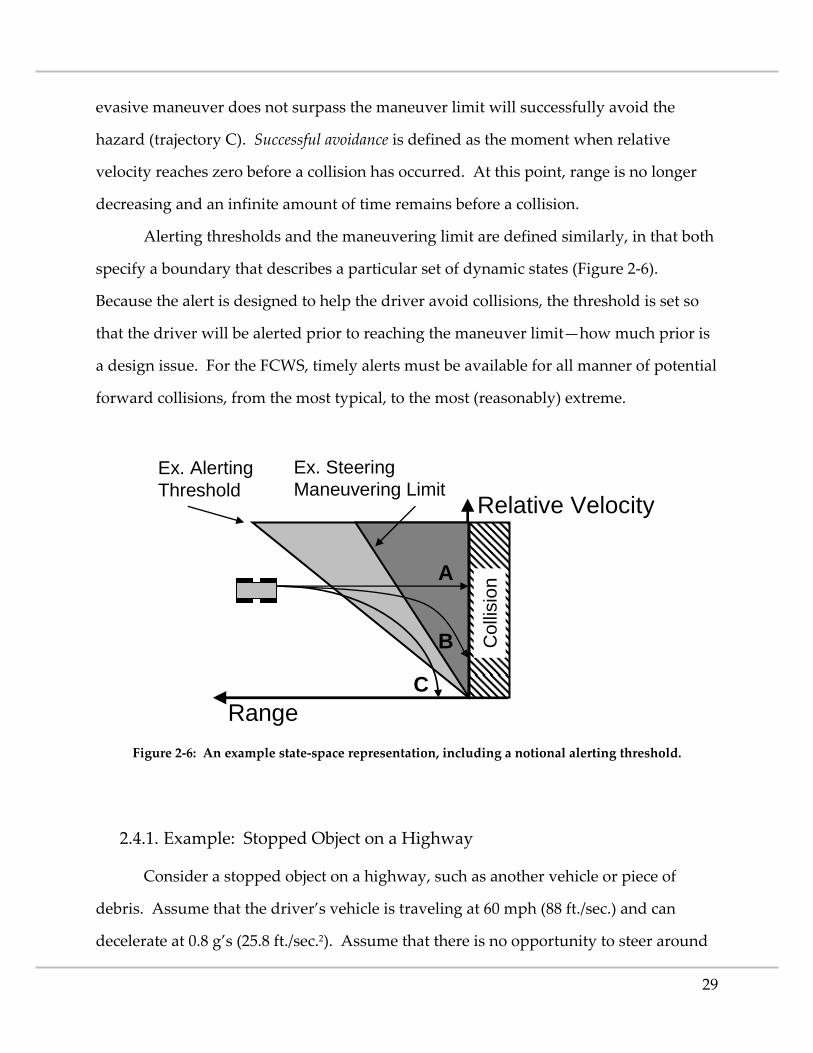
evasive maneuver does not surpass the maneuver limit will successfully avoid the
hazard (trajectory C). Successful avoidance is defined as the moment when relative
velocity reaches zero before a collision has occurred. At this point, range is no longer
decreasing and an infinite amount of time remains before a collision.
Alerting thresholds and the maneuvering limit are defined similarly, in that both
specify a boundary that describes a particular set of dynamic states (Figure 2‐6).
Because the alert is designed to help the driver avoid collisions, the threshold is set so
that the driver will be alerted prior to reaching the maneuver limit—how much prior is
a design issue. For the FCWS, timely alerts must be available for all manner of potential
forward collisions, from the most typical, to the most (reasonably) extreme.
Relative Velocity
Range
A
B
Ex. Alerting Threshold
C
Ex. Steering Maneuvering Limit
Col
lisio
n
Figure 2‐6: An example state‐space representation, including a notional alerting threshold.
2.4.1. Example: Stopped Object on a Highway
Consider a stopped object on a highway, such as another vehicle or piece of
debris. Assume that the driver’s vehicle is traveling at 60 mph (88 ft./sec.) and can
decelerate at 0.8 g’s (25.8 ft./sec.2). Assume that there is no opportunity to steer around
29
the hazard, and the driver is forced to come to a complete stop. Equations 1 through 3
are derived from simple kinematics:
avt initial
stop = (1)
a2vd
2initial
stop ⋅=
(2)
(3) stopreactioninitialmaneuver dtvd +⋅=
According to Equation 1, the driver will decelerate to a stop in 3.4 seconds (tstop). This is
the maneuvering limit—if the driver begins braking when a collision will occur in less
than 3.4 seconds, there will not be enough time to stop and avoid the accident. The
alerting threshold must also provide the driver enough time to assess and respond to
the alert prior to performing the stop. The time required to make an assessment is not
known, but as mentioned in Chapter 1, the reaction time is influenced by trust in the
FCWS, driver distractions, and the salience of the hazard. Assuming the driver makes a
rapid assessment, response time is assumed to be 1.5 seconds (treaction) [28]. If lack of
trust prompts the driver to verify the hazard, response time will increase with this
assessment. Likewise, if the hazard is not salient, the driver will require more time to
identify the hazard. The best‐case scenario already shows that the evasive maneuver
will take 4.9 seconds and a distance of 284 feet (with an additional 88 feet added for
every second needed to assess the alert, according to Equation 3).
Now, instead of decelerating to a stop, suppose the driver imparts a lateral
acceleration of 0.5 g’s (16.1 ft./sec.2) and steers around the hazard. If the hazard is
approximately the size of another vehicle, assume that the driver must move laterally 10
feet to avoid an accident. Figure 2‐7 shows a simplified representation of the steering
response.
30
2steerlateralta
21y =
10 ft.
( )reactionsteerinitial ttvx +⋅= Figure 2‐7: A simplified representation of an example steering response.
The y‐axis corresponds to the vehicle’s lateral position and the x‐axis corresponds to the
range, both with respect to the hazard. The lateral maneuver will require 1.1 seconds,
and in that time, the driver will have traveled 97 feet closer to the hazard (assuming
forward velocity is constant). Assuming a response time of 1.5 seconds, the lateral
maneuver will take 2.6 seconds and 229 feet, saving both time and distance when
compared to the stopping maneuver. Steering around the hazard is a better option
because it can be completed faster, but it is only effective if necessary space is available.
Alerting earlier provides more time in which to assess a situation, which supports the
awareness of the surrounding environment and assists the driver in choosing the best
evasive maneuver.
This example scenario is not comprehensive but illustrative of the limits to which
the FCWS must be designed. Drivers may, in fact, respond more mildly than the
assumed acceleration and deceleration values of these examples. Reaction time will
also vary, and instead of 1.5 seconds, a distracted, unaware, or skeptical driver could
take as long as 3 or 6 seconds to respond. Figures 2‐8 and 2‐9 illustrate the maneuver
limits for avoiding a stopped object by braking and by steering, assuming a deceleration
of 0.8 g’s and a lateral acceleration of 0.5 g’s.
31
Example: Braking Maneuver Limits
0
20
40
60
0200400600800
Range (ft.)
Rela
tive
Vel
ocity
(mph
)
1.5 sec3.0 sec6.0 sec
Response Time:
Figure 2‐8: Example: braking maneuvering limits for response times of 1.5, 3.0, and 6.0 seconds.
Example: Steering Maneuver Limits
0
20
40
60
0200400600800
Range (ft.)
Rela
tive
Vel
ocity
(mph
)
1.5 sec3.0 sec6.0 sec
Response Time:
Figure 2‐9: Example: steering maneuver limits for response times of 1.5, 3.0, and 6.0 seconds.
To avoid an accident, a driver who responds in 3 seconds, as opposed to 1.5 seconds,
would need to be alerted 420 feet from the hazard to avoid a collision (an increase of 130
feet). The steering response limit increases similarly with a 3 second reaction (365 feet
as opposed to 230 feet). A reaction time of 6 seconds or more further increases the
required alert distance, which will increase the number of unnecessary alerts.
32
Decreasing the driver’s response time allows the thresholds to be set closer to the
hazard.
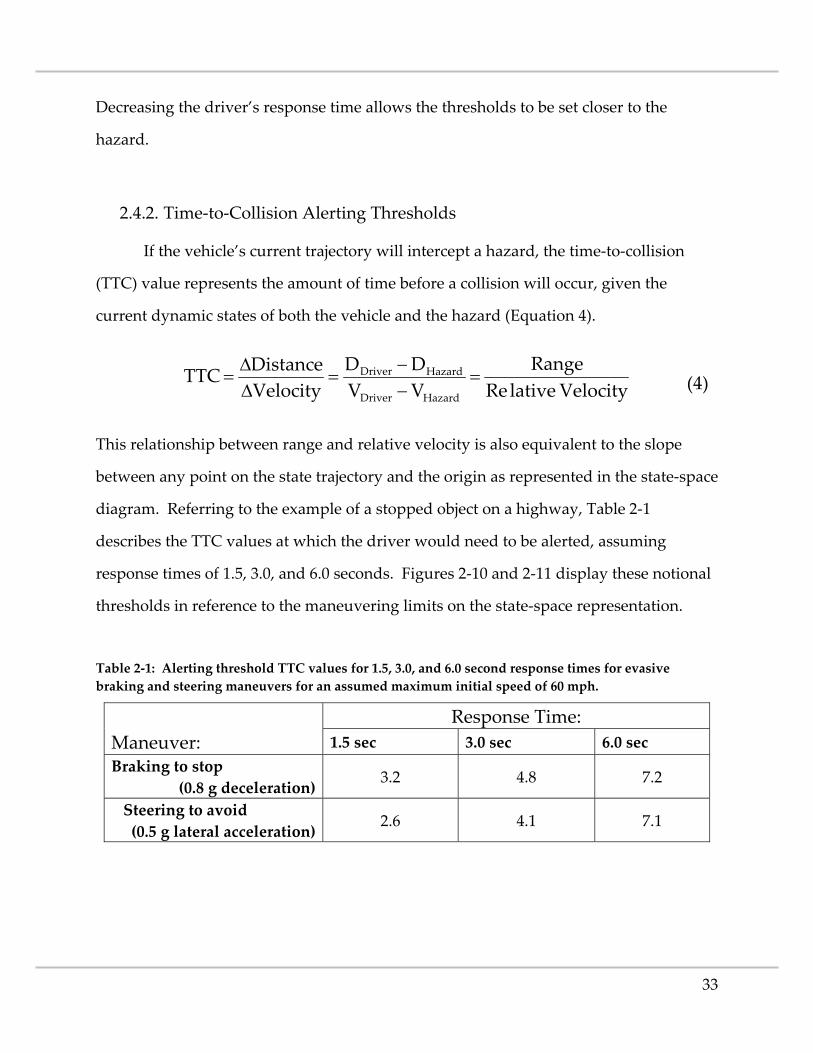
2.4.2. Time‐to‐Collision Alerting Thresholds
If the vehicle’s current trajectory will intercept a hazard, the time‐to‐collision
(TTC) value represents the amount of time before a collision will occur, given the
current dynamic states of both the vehicle and the hazard (Equation 4).
Velocity lativeReRange
VVDD
VelocityDistanceTTC
HazardDriver
HazardDriver =−−
=ΔΔ
= (4)
This relationship between range and relative velocity is also equivalent to the slope
between any point on the state trajectory and the origin as represented in the state‐space
diagram. Referring to the example of a stopped object on a highway, Table 2‐1
describes the TTC values at which the driver would need to be alerted, assuming
response times of 1.5, 3.0, and 6.0 seconds. Figures 2‐10 and 2‐11 display these notional
thresholds in reference to the maneuvering limits on the state‐space representation.
Table 2‐1: Alerting threshold TTC values for 1.5, 3.0, and 6.0 second response times for evasive braking and steering maneuvers for an assumed maximum initial speed of 60 mph.
Steering to avoid (0.5 g lateral acceleration) 2.6 4.1 7.1
33
Response Time:
Example: Braking Maneuver Limits and Alerting Thresholds
0
20
40
60
0200400600800
Range (ft.)
Rel
ativ
e Ve
loci
ty (m
ph)
1.5 sec3.0 sec6.0 sec
7.2 sec TTC
4.8 sec TTC
3.2 sec TTC
(Assumed 0.8 g deceleration)
Figure 2‐10: Example braking maneuver limits and corresponding notional alerting thresholds.
Response Time:
Example: Steering Maneuver Limits and Alerting Thresholds
0
20
40
60
0200400600800
Range (ft.)
Rel
ativ
e Ve
loci
ty (m
ph)
1.5 sec3.0 sec6.0 sec
(Assumed 0.5 g lateral acceleration)
7.2 sec TTC
4.8 sec TTC
3.2 sec TTC
Figure 2‐11: Example steering maneuver limits and corresponding notional alerting thresholds.
The uncertainty in the future system state causes false hazard identifications at
impractically distant TTC values. Considering the proximity of motor vehicles on a
roadway, as well as the speed with which speed and trajectory can change, alerting at
high TTC thresholds will cause frequent unnecessary alert activations. If the driver’s
34
response time is decreased, a successful maneuver will not depend on an alerting
threshold that causes an unacceptable frequency of unnecessary alerts.
2.4.3. The System Operating Characteristic Curve
This fundamental tradeoff between providing the driver more time in which to
respond and alerting the driver unnecessarily is formalized in an analytical model
called the System Operating Characteristic (SOC) curve [5, 29]. The SOC curve is
constructed much like a Receiver Operator Characteristic (ROC) curve in signal
detection theory in that for any time at which an alert is issued, the curve
simultaneously represents the probabilities that the alert is both successful (signal) and
unnecessary (noise). The curve is constructed by plotting the probabilities of multiple
alert thresholds at various times or distances from the hazard (Figure 2‐12). SOC curves
are more comprehensive than ROC curves, however, because they encapsulate all
components of the system that influence performance, such as the sensors, prediction
algorithms, and operator reaction. For a FCWS, the system would also include the
driver’s perception of the alert, the assessment of the potential hazard, and the
subsequent evasive maneuver.
P(Unnecessary Alert)
P(S
ucce
ssfu
l Ale
rt) 1.0
0.2
0.4
0.6
0.8
0.0 0.2 0.4 0.6 0.8 1.0
Far range
Close range
Collision
System Curve
Figure 2‐12: An example SOC curve.
35
As the alerting threshold is set farther away from the driver, the probability that
an alert is unnecessary increases because the hazard will likely be avoided had the alert
not been provided. On the other hand, an unnecessary alert is also considered
successful because, by definition, no collision occurs. However, as the threshold is
placed closer to the driver, the probability of a successful outcome decreases because
the driver has less time and distance in which to assess the alert and avoid the hazard.
At close thresholds, the alerting system is confident that the driver is about to
unwittingly collide with another vehicle or object, but the driver has not been given
adequate time to respond appropriately.
P(Unnecessary Alert)
P(Su
cces
sful
Ale
rt) 1.0
0.2
0.4
0.6
0.8
0.0 0.2 0.4 0.6 0.8 1.0
P(Unnecessary Alert)
P(S
ucce
ssfu
l Ale
rt) 1.0
0.2
0.4
0.6
0.8
0.0 0.2 0.4 0.6 0.8 1.0
P(Unnecessary Alert)
P(S
ucce
ssfu
l Ale
rt) 1.0
0.2
0.4
0.6
0.8
0.0 0.2 0.4 0.6 0.8 1.0
(A) (B) (C)
P(Unnecessary Alert)
P(Su
cces
sful
Ale
rt) 1.0
0.2
0.4
0.6
0.8
0.0 0.2 0.4 0.6 0.8 1.0
P(Unnecessary Alert)
P(S
ucce
ssfu
l Ale
rt) 1.0
0.2
0.4
0.6
0.8
0.0 0.2 0.4 0.6 0.8 1.0
P(Unnecessary Alert)
P(S
ucce
ssfu
l Ale
rt) 1.0
0.2
0.4
0.6
0.8
0.0 0.2 0.4 0.6 0.8 1.0
(A) (B) (C) Figure 2‐13: Various degrees of system benefit as expressed by the SOC curve.
An ideal system will operate in the upper left‐hand corner, where all alerts are
100% necessary and successful. Curves that are closer to this point represent systems
that are more effective than those with curves that are farther away. For example,
consider Figure 2‐13: (A) shows a positive system benefit (the probability of influencing
a successful response is greater than probability that the alert is not useful); (B) shows a
neutral performance (an alert is just as likely to be successful as it is unnecessary); and
(C) shows a negative system benefit (the driver is more likely to avoid an accident
without the system). The SOC curves are not static, and can change based on
environmental conditions, the driver’s acceptance of the system, and other factors that
36
influence the effectiveness of the FCWS. A system that quickly annoys the driver with
an excess number of false alerts will lose the driver’s trust, and may shift to reflect a
more neutral curve as the driver chooses to ignore the warnings. Likewise, a system
may represent a negative system benefit if it distracts the driver during a critical
maneuver and, in fact, causes an accident.
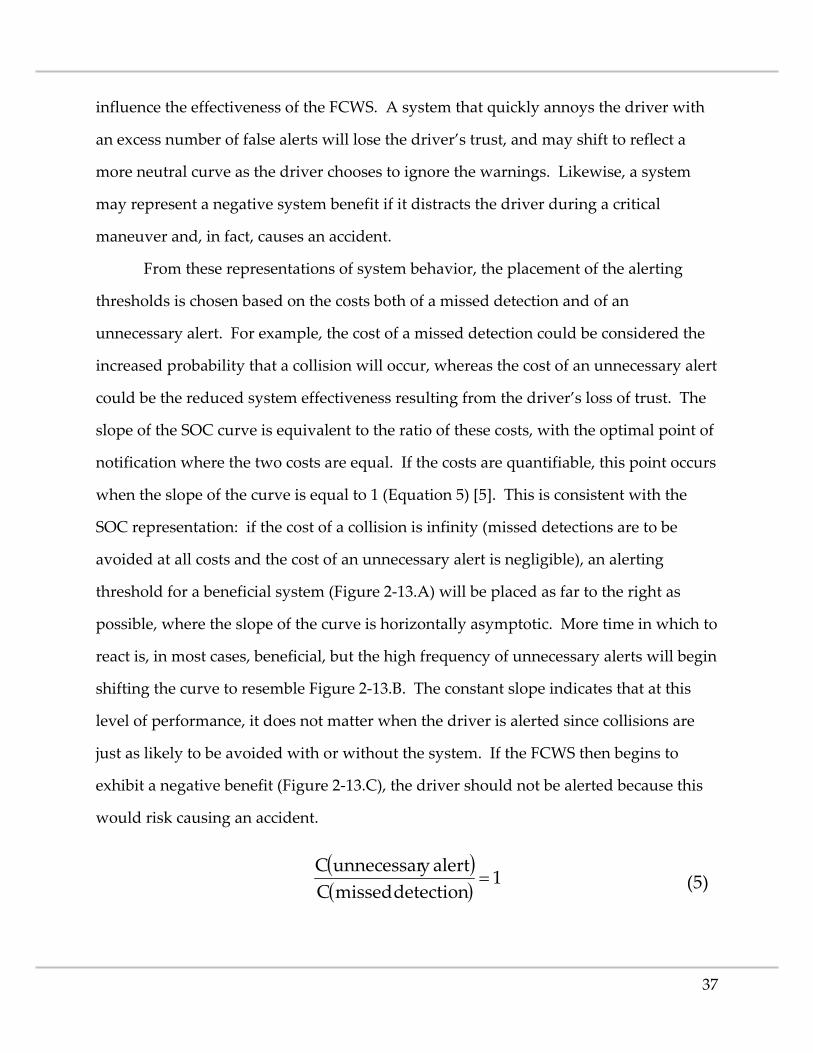
From these representations of system behavior, the placement of the alerting
thresholds is chosen based on the costs both of a missed detection and of an
unnecessary alert. For example, the cost of a missed detection could be considered the
increased probability that a collision will occur, whereas the cost of an unnecessary alert
could be the reduced system effectiveness resulting from the driver’s loss of trust. The
slope of the SOC curve is equivalent to the ratio of these costs, with the optimal point of
notification where the two costs are equal. If the costs are quantifiable, this point occurs
when the slope of the curve is equal to 1 (Equation 5) [5]. This is consistent with the
SOC representation: if the cost of a collision is infinity (missed detections are to be
avoided at all costs and the cost of an unnecessary alert is negligible), an alerting
threshold for a beneficial system (Figure 2‐13.A) will be placed as far to the right as
possible, where the slope of the curve is horizontally asymptotic. More time in which to
react is, in most cases, beneficial, but the high frequency of unnecessary alerts will begin
shifting the curve to resemble Figure 2‐13.B. The constant slope indicates that at this
level of performance, it does not matter when the driver is alerted since collisions are
just as likely to be avoided with or without the system. If the FCWS then begins to
exhibit a negative benefit (Figure 2‐13.C), the driver should not be alerted because this
would risk causing an accident.
( )( )
1detection missedC
alertyunnecessarC= (5)
37
2.5. Proposed Design Features
2.5.1. Multi‐Stage Alerting
A multi‐stage alerting configuration that alerts the driver at earlier, more
conservative thresholds will provide more time in which to respond and increase the
probability of a successful maneuver. Given the SOC curve in Figure 2‐14.A, it is not
probable that a system will successfully alert the driver when sufficient evidence
indicates that a collision is about to occur. If the system were to, instead, issue an
earlier, minimally obtrusive alert when the likelihood of a collision is still low, but
possible, the driver will be conditioned to respond more quickly (for example, within
1.5 seconds) and appropriately if and when evasive action is necessary. An earlier
threshold does not alert the driver when the situation requires a last‐second response;
instead, knowing that a crash is possible, the driver may reduce speed, turn slightly, or
perform a similar low‐level maneuver. Evasive maneuvers of greater magnitude
decrease the probability of a successful response because the driver is more likely to
lose control of the vehicle or lose awareness of obstacles in the surrounding
environment. The conditioning of the driver at an earlier threshold ensures an, earlier,
controlled, appropriate response that increases the probability that the alert is
successful, and shifts the SOC curve closer to the ideal operating point (Figure 2‐14.B).
P(Unnecessary Alert)
P(Su
cces
sful
Ale
rt) 1.0
0.2
0.4
0.6
0.8
0.0 0.2 0.4 0.6 0.8 1.0
Crash Possible –Issue Early Alert
P(Unnecessary Alert)
P(S
ucce
ssfu
l Ale
rt) 1.0
0.2
0.4
0.6
0.8
0.0 0.2 0.4 0.6 0.8 1.0
P(Unnecessary Alert)
P(S
ucce
ssfu
l Ale
rt) 1.0
0.2
0.4
0.6
0.8
0.0 0.2 0.4 0.6 0.8 1.0
Crash Probable –Issue Late Alert
(A) (B) (C)
P(Unnecessary Alert)
P(Su
cces
sful
Ale
rt) 1.0
0.2
0.4
0.6
0.8
0.0 0.2 0.4 0.6 0.8 1.0
Crash Possible –Issue Early Alert
P(Unnecessary Alert)
P(S
ucce
ssfu
l Ale
rt) 1.0
0.2
0.4
0.6
0.8
0.0 0.2 0.4 0.6 0.8 1.0
P(Unnecessary Alert)
P(S
ucce
ssfu
l Ale
rt) 1.0
0.2
0.4
0.6
0.8
0.0 0.2 0.4 0.6 0.8 1.0
Crash Probable –Issue Late Alert
(A) (B) (C) Figure 2‐14: An SOC curve representation of the benefits of multi‐stage alerting.
38
If the situation continues to pose an imminent threat, the system can issue a more
serious alert in a region that maintains a desired probability of success as well as the
desired confidence that the alert is necessary (indicated by the box in Figure 2‐14.C).
Had no conditioning occurred, and the system remained on the original curve, the
probability that the driver would have successfully avoided the hazard would be
significantly decreased. If only the late alert is issued, it is not certain the driver will be
able to respond quickly enough to avoid a collision, especially if he or she is distracted
or momentarily skeptical that a response is necessary.
(A) (B) (C) Figure 2‐15: An example implementation of a multi‐stage alerting configuration.
A multi‐stage FCWS configuration will not be consistently beneficial if the driver
cannot tolerate the increased frequency of unnecessary alerts. The early alert is not
intended to prompt an immediate evasive maneuver, therefore the alerting interface
should not imply as such. An obnoxious stimulus will annoy and distract the driver if
frequent alerts are not necessary. A less obtrusive, advisory alert will mitigate this
problem. Figure 2‐15 demonstrates an example implementation of a multi‐stage
alerting system with an in‐dash display. In (A), the TTC value with respect to the lead
vehicle has not crossed the early threshold, and no alert is currently displayed. As the
lead vehicle slows down, an advisory alert activates, informing the driver that a crash is
possible (B). As the lead vehicle stops, and the TTC value decreases, the late alert
39
activates, indicating that an immediate response is necessary to avoid a collision (C).
The late alert is designed to be much more visually conspicuous, and for example, could
be accompanied by an audio alert.
2.5.2. Directional Alerting
A system that alerts earlier and more often is also more likely to be accepted if
the driver understands why the alert is issued, even if it is unnecessary. Directional
alerting directs the driver’s attention to the location of the hazard that caused the alert
activation, which promotes trust in the FCWS by showing the driver the motivation for
the system’s judgments (Figures 2‐16 – 2‐18). Explicitly pointing to the hazard’s
locations also decreases the amount of time that is required to scan and verify the cause
of the alert. For example, with earlier alerting thresholds, there may be situations in
which the hazard is not obvious to the driver, either because it is too far away or the
changes in the environment are too subtle to notice. This ambiguity can be exaggerated
by lack of awareness [30], which would result in longer assessment times. By indicating
the location of the hazard via the alerting display, ambiguity is more quickly resolved.
40
Figure 2‐16: An example implementation of multi‐stage directional alerting (1 of 3); locational stimulus highlights objects in the environment (diamond and octagon on windshield).
Figure 2‐17: An example implementation of multi‐stage directional alerting (2 of 3).
41
Figure 2‐18: An example implementation of multi‐stage directional alerting (3 of 3).
Earlier alerting also provides an ancillary benefit: it confirms the system is
working. The probability that any particular driver will have an accident is fairly low
for any given trip. Although it is fortunate that collisions and the events leading up to
collisions are infrequent from an individual driver’s point of view, this does not provide
many opportunities to truly benefit from the FCWS or develop an understanding of
how it works. Anti‐lock brakes encounter similar problems: they lie dormant until
absolutely needed, denying drivers the frequent exposure that would otherwise build
this understanding. Directional alerting mitigates the undesired driver reactions that
would otherwise make frequent exposure detrimental and transforms an ambiguous
notification into an advantageous situation assessment aid. For instance, assume an
oncoming vehicle steers into the driver’s lane while passing another vehicle. The FCWS
identifies the oncoming vehicle as a hazard for the few seconds it remains in front of the
driver. The subsequent alert is technically unnecessary, because no collision occurs
after the vehicle completes the pass; however, the alert is useful in maintaining the
driver’s awareness of the environment, and if the situation had become more
dangerous, an aware driver would be conditioned to respond more effectively.
42
3. Experimentation
Several collision alerting displays were emulated within a driving simulator and
combined to form FCWS configurations that incorporated directional and multi‐stage
alerting. Subjects were then equipped with the various systems, and asked to complete
test scenarios which placed them in multiple hazardous situations that would result in a
collision if no response was made. All hazardous events were designed to present the
driver with similar event dynamics to allow comparison across different events during
which different system configurations were in effect. Subjects were asked to follow
several objectives in priority order that the emphasized the primary goal of collision
avoidance. Controlled driver distractions were introduced through secondary tasks, as
well as with the design of visual elements within the driving environment. Subjective
data was collected after the testing was completed.
A pilot study was conducted prior to this experiment, through which the alerting
displays, alerting thresholds, driving environment, hazardous situations, and
experimental protocol were improved and refined. The pilot study results indicated
several promising trends in support of multi‐stage and directional alerting. These
results motivated the main experiment, and were ultimately reproduced with more
statistical power. Although integral to the design of the main experiment, the pilot
study will not be discussed in this thesis.
3.1. Hypotheses
Three hypotheses were tested:
H1: When drivers are alerted to potential collisions, they will respond more
effectively than when they are not alerted.
H2: When drivers are provided earlier alerts, in addition to late alerts, they will
respond more effectively than when they receive only late alerts.
43
H3: When drivers are provided directional early alerts, they will respond more
effectively than when they receive non‐directional early alerts.
The first hypothesis pertains to the absolute benefit of alerting vs. no‐alerting, and the
second two hypotheses address the proposed designed features of multi‐stage and
directional alerting.
3.2. Experimental Design
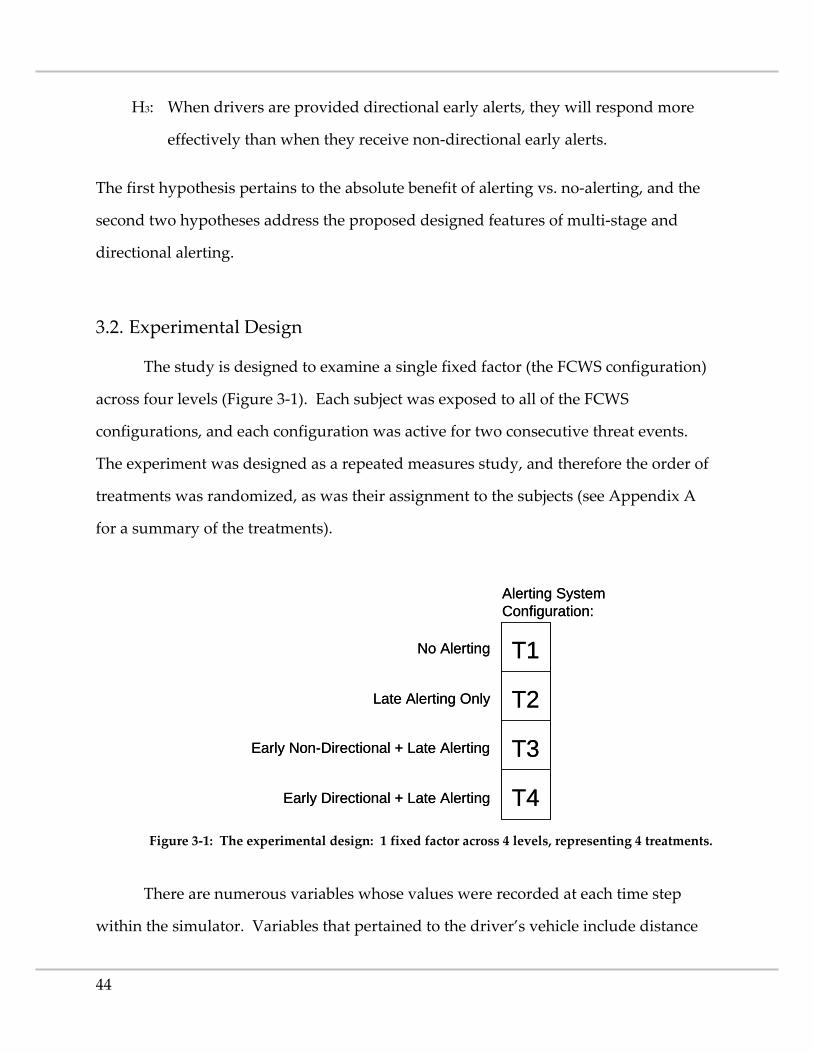
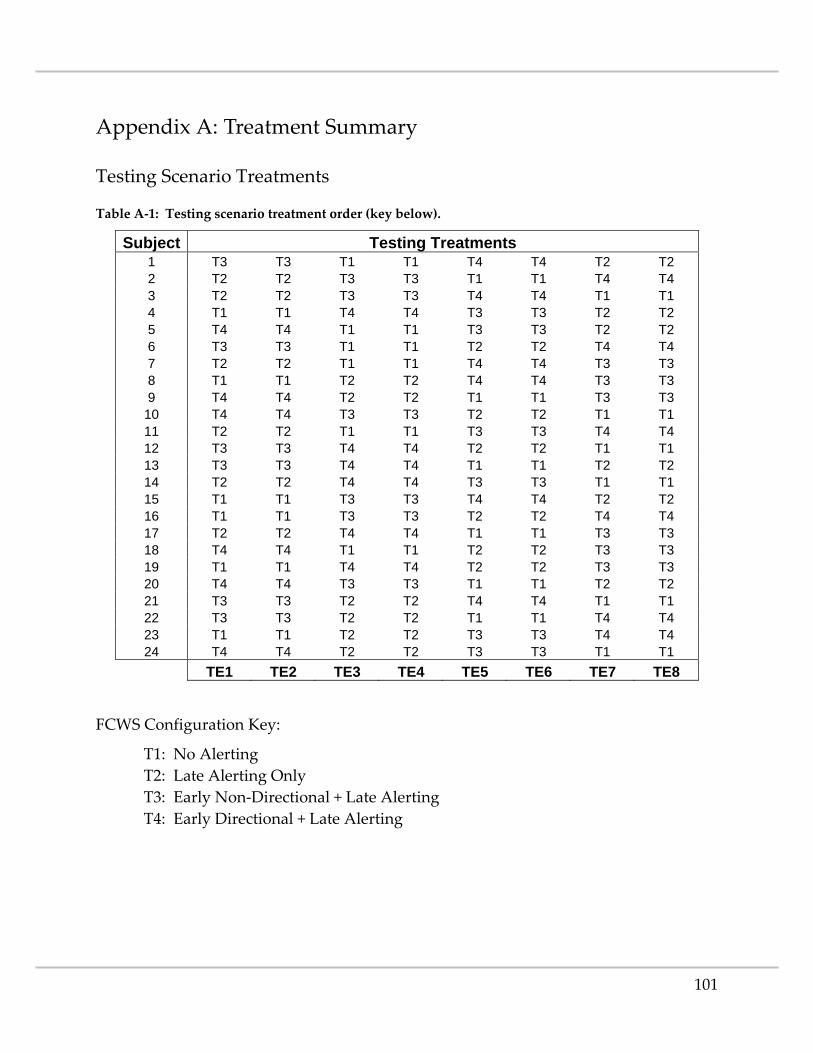
The study is designed to examine a single fixed factor (the FCWS configuration)
across four levels (Figure 3‐1). Each subject was exposed to all of the FCWS
configurations, and each configuration was active for two consecutive threat events.
The experiment was designed as a repeated measures study, and therefore the order of
treatments was randomized, as was their assignment to the subjects (see Appendix A
for a summary of the treatments).
T1
Alerting System Configuration:
T2
T3
T4
No Alerting
Late Alerting Only
Early Non-Directional + Late Alerting
Early Directional + Late Alerting
T1
Alerting System Configuration:
T2
T3
T4
No Alerting
Late Alerting Only
Early Non-Directional + Late Alerting
Early Directional + Late Alerting
Figure 3‐1: The experimental design: 1 fixed factor across 4 levels, representing 4 treatments.
There are numerous variables whose values were recorded at each time step
within the simulator. Variables that pertained to the driver’s vehicle include distance
Differences in the number of police officers that subjects were able to correctly
identify may suggest differences in the awareness subjects may have had of other
vehicles in the environment. The number of correct police officer identifications was
similar across the systems, although subjects using the Early Directional system
identified the highest number, more than half (highlighted in Table 4‐13). There were
two subjects who did not identify any police officers; both were using the Late Alerting
Only system. Subjects were able to identify at least one officer with all the other system
configurations.
The amount of time the driver took to identify the officer is not analyzed because
it was not possible to guarantee that every police officer was visible at the same time for
every subject, and it is not possible to determine if, at that point, the officers were
visible. The instantiations of the police officers were controlled, but they could have
been visually occluded by surrounding traffic.
Table 4‐13: Number of correct police officer identifications.
FCWS Configuration Correct Identifications Total # of P.O.’s %
No Alerting 71 144 49%
Late Alerting Only 68 144 47%
Early Non‐Directional 71 144 49%
Early Directional 82 144 57%
4.4.3. Maintaining Speed
Subjects were told they would be penalized if the vehicle’s speed was below 55
mph or above 60 mph, but the subjects’ average speed during the testing was between
50 mph and 55 mph. The needle of the simulated speedometer displayed speeds that
82
were 1 mph to 3 mph higher than the speed recorded in the simulator, which could
account for this shift below the requested speed. Maximum speeds ranged between 60
mph to the vehicle’s maximum speed of 65 mph.
4.5. Response to Unnecessary Alert Activations
Driver responses to the unnecessary alert activations were not significantly
varied. These observations only include subjects who were provided an early alerting
system, since the Late Alerting Only and No Alerting configurations did not
unnecessarily activate at the early alert threshold. The alerts were set to turn on and
turn off at specified distances, and therefore the duration of the activation was
dependent upon the vehicle’s speed. This duration was between 3.01 seconds and 4.01
seconds for all subjects.
Most subjects released the accelerator when they were presented an unnecessary
alert, while some braked and some performed no response. Figures 4‐12 through 4‐15
display examples of accelerator input profiles for the durations of both unnecessary
activations. It was initially assumed that the first response would indicate the most
confusion, while the second would show a response of less magnitude (indicating less
confusion). Here, it appears that within these examples, the Early Directional system
incites a more cautious response, regardless of whether or not directional alerting was
provided during the first or second activation. This could be because the driver trusted
that the alert was going to direct attention to a hazard, and slowed down in anticipation
of a dangerous situation. Drivers who were not provided directional alerting did not
respond as strongly to the unnecessary activation, possibly because the false‐positive
alerts were expected, or because they quickly scanned the environment and determined
that there was no hazard. Directional alerting could be detrimental if false‐positive
activations are frequent. The driver’s attention could be directed unnecessarily from a
83
more important task, or the driver may lose trust in the system if the directional alert
cannot identify any particular hazard.
Figure 4‐12: Example: accelerator input during unnecessary alert activations; first exposure to the Early Directional FCWS (1 of 2).
Figure 4‐13: Example: accelerator input during unnecessary alert activations; first exposure to the Early Directional FCWS (2 of 2).
Figure 4‐14: Example: accelerator input during unnecessary alert activations; first exposure to the Early Non‐Directional FCWS (1 of 2).
84
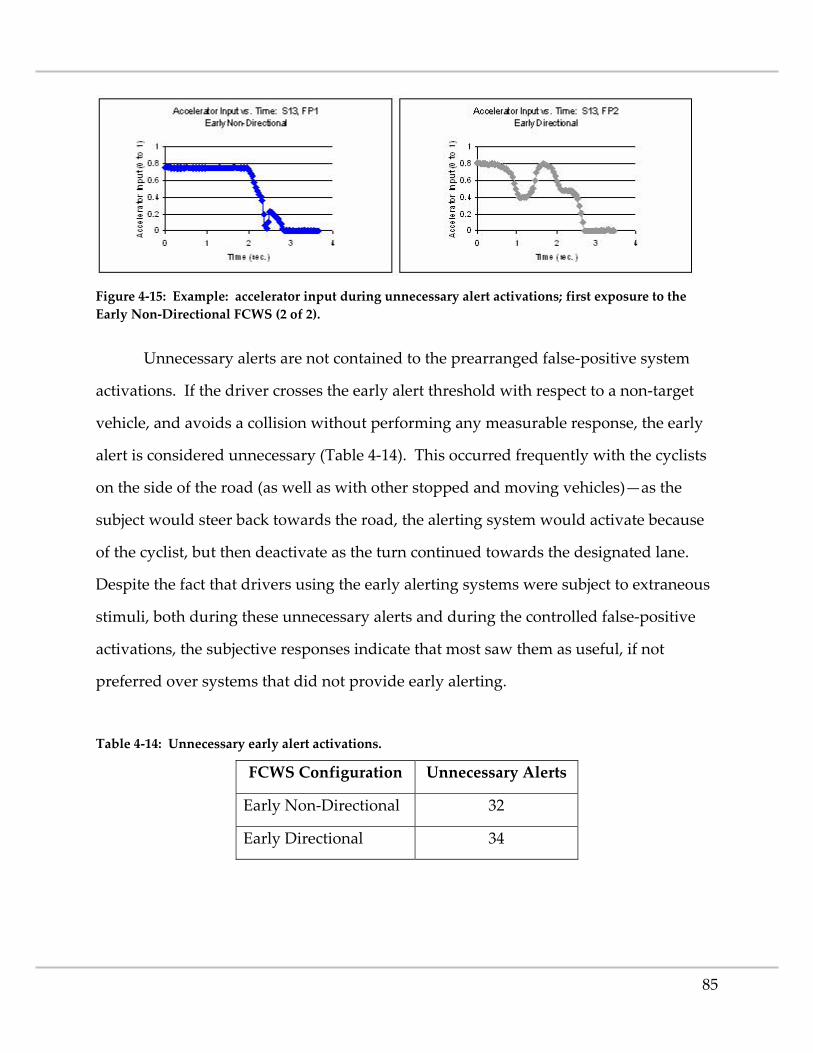
Figure 4‐15: Example: accelerator input during unnecessary alert activations; first exposure to the Early Non‐Directional FCWS (2 of 2).
Unnecessary alerts are not contained to the prearranged false‐positive system
activations. If the driver crosses the early alert threshold with respect to a non‐target
vehicle, and avoids a collision without performing any measurable response, the early
alert is considered unnecessary (Table 4‐14). This occurred frequently with the cyclists
on the side of the road (as well as with other stopped and moving vehicles)—as the
subject would steer back towards the road, the alerting system would activate because
of the cyclist, but then deactivate as the turn continued towards the designated lane.
Despite the fact that drivers using the early alerting systems were subject to extraneous
stimuli, both during these unnecessary alerts and during the controlled false‐positive
activations, the subjective responses indicate that most saw them as useful, if not
preferred over systems that did not provide early alerting.
Table 4‐14: Unnecessary early alert activations.
FCWS Configuration Unnecessary Alerts
Early Non‐Directional 32
Early Directional 34
85
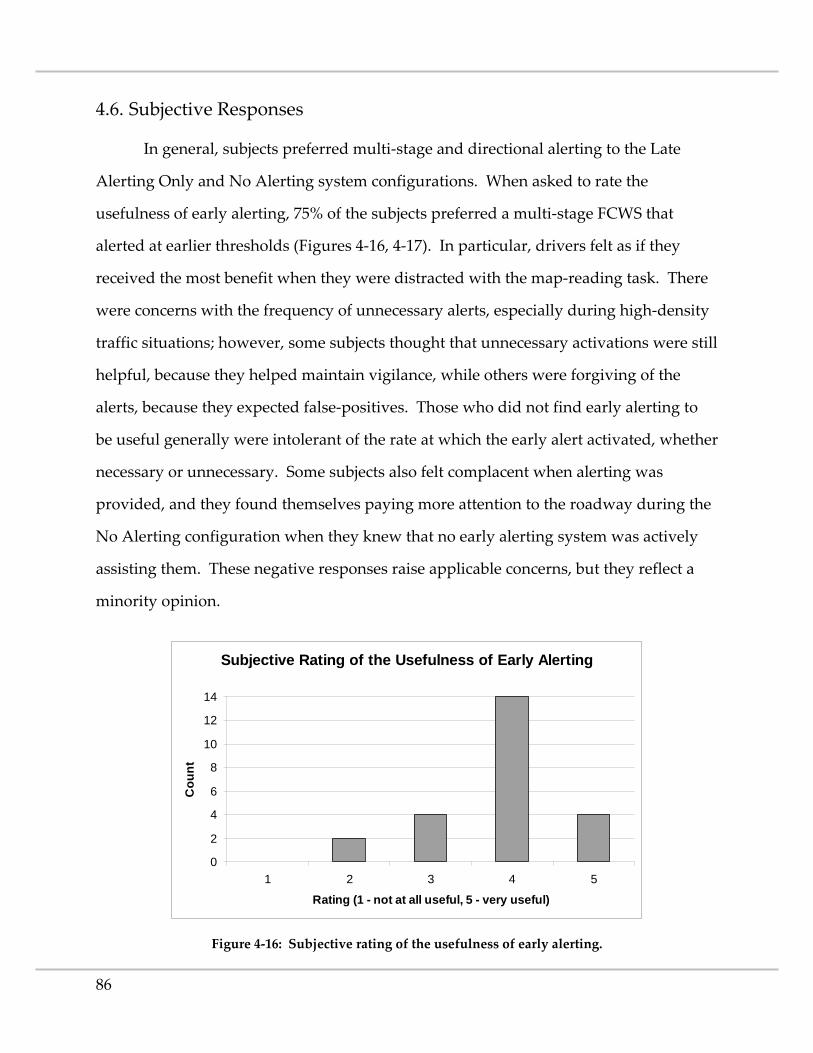
4.6. Subjective Responses
In general, subjects preferred multi‐stage and directional alerting to the Late
Alerting Only and No Alerting system configurations. When asked to rate the
usefulness of early alerting, 75% of the subjects preferred a multi‐stage FCWS that
alerted at earlier thresholds (Figures 4‐16, 4‐17). In particular, drivers felt as if they
received the most benefit when they were distracted with the map‐reading task. There
were concerns with the frequency of unnecessary alerts, especially during high‐density
traffic situations; however, some subjects thought that unnecessary activations were still
helpful, because they helped maintain vigilance, while others were forgiving of the
alerts, because they expected false‐positives. Those who did not find early alerting to
be useful generally were intolerant of the rate at which the early alert activated, whether
necessary or unnecessary. Some subjects also felt complacent when alerting was
provided, and they found themselves paying more attention to the roadway during the
No Alerting configuration when they knew that no early alerting system was actively
assisting them. These negative responses raise applicable concerns, but they reflect a
minority opinion.
Subjective Rating of the Usefulness of Early Alerting
0
2
4
6
8
10
12
14
1 2 3 4 5
Rating (1 - not at all useful, 5 - very useful)
Cou
nt
Figure 4‐16: Subjective rating of the usefulness of early alerting.
86
Subjective Rating of the Usefulness of Early Alerting
17%
75%
8%
Not UsefulNeutralUseful
Figure 4‐17: Percentages of subjects who thought early alerting was useful, not useful, or were unsure.
Subjects were asked how certain or uncertain they would be that the different
alerting systems would help them avoid a collision if they were to enter a hazardous
situation. Most expressed confidence in the two early alerting system configurations,
while many were not confident that the Late Alerting Only system would be beneficial
(Figure 4‐18). Of the early alerting systems, subjects were most confident in the Early
Directional system configuration (Figure 4‐19). They appreciated being shown “exactly
where the problem is,” and having the advanced notice to avoid the hazard without
having to perform a last‐second emergency maneuver. Most found the directional
alerting easy to understand and use, and thought that it was particularly beneficial
during those threat events in which the hazard was approaching the main roadway
from the side.
87
Subjective Confidence Ratings
0
2
4
6
8
10
12
1 2 3 4 5
Rating (1 - lowest, 5 - highest)
Cou
nt Late Alerting OnlyEarly Non-DirectionalEarly Directional
Figure 4‐18: Subjective confidence ratings for each of the alerting systems.
Confidence in the Early Directional System
8%
29%
63%
Not ConfidentNeutralConfident
Figure 4‐19: Percentage of subjects who were confident in the Early Directional system configuration, not confident, or were unsure.
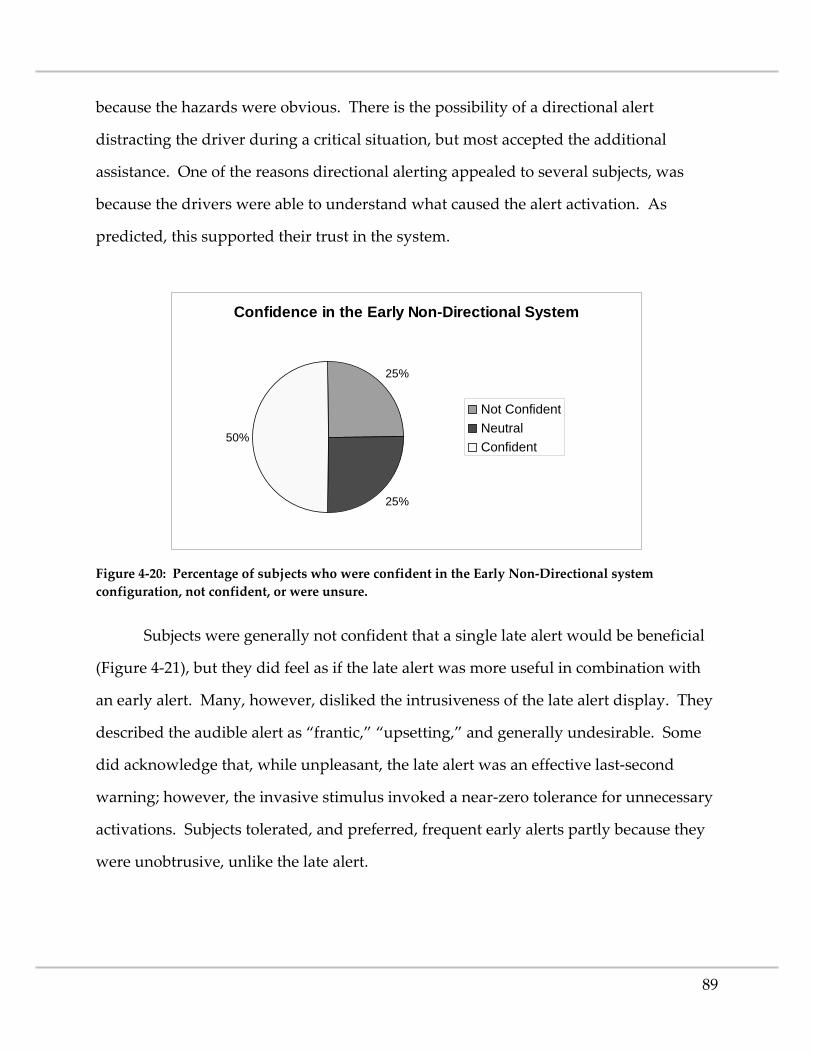
The Early Non‐Directional alerting system provided advanced notice as well, but
subjects acknowledged that it took time to discover the hazard (Figure 4‐20). However,
some felt as if the non‐directional alert was sufficient in identifying hazards, and that
the directional alert was confusing. These subjects either preferred to search for the
hazard without assistance, or they thought that directional alerting was unnecessary
88
because the hazards were obvious. There is the possibility of a directional alert
distracting the driver during a critical situation, but most accepted the additional
assistance. One of the reasons directional alerting appealed to several subjects, was
because the drivers were able to understand what caused the alert activation. As
predicted, this supported their trust in the system.
Confidence in the Early Non-Directional System
25%
25%
50%
Not ConfidentNeutralConfident
Figure 4‐20: Percentage of subjects who were confident in the Early Non‐Directional system configuration, not confident, or were unsure.
Subjects were generally not confident that a single late alert would be beneficial
(Figure 4‐21), but they did feel as if the late alert was more useful in combination with
an early alert. Many, however, disliked the intrusiveness of the late alert display. They
described the audible alert as “frantic,” “upsetting,” and generally undesirable. Some
did acknowledge that, while unpleasant, the late alert was an effective last‐second
warning; however, the invasive stimulus invoked a near‐zero tolerance for unnecessary
activations. Subjects tolerated, and preferred, frequent early alerts partly because they
were unobtrusive, unlike the late alert.
89
Confidence in the Late Alerting Only System
54%
25%
21%
Not ConfidentNeutralConfident
Figure 4‐21: Percentage of subjects who were confident in the Late Alerting Only system configuration, not confident, or were unsure.
System Preference
41%
17%
8%21%
13%
Late Alerting Only
Early Non-Directional
Early Directional
No Preference (among systems)
No System
Figure 4‐22: Percentage of subjectsʹ system configuration preferences.
When asked which system they preferred, most indicated the Early Directional
alerting system (Figure 4‐22). More subjects preferred the Early Non‐Directional system
to the Late Alerting Only system, but 13% preferred each of the three systems equally.
Approximately one fifth of the subject did not prefer any alerting system. When asked
if they would prefer to own a vehicle with a FCWS, the most common concern was cost.
Many expressed interest in the system, but were not sure if they could commit to the
technology (Figure 4‐23). Some said that the system would need to be more “accurate”
90
or “reliable,” and not activate unnecessarily too often. Alert tolerance can vary among
different people (and at different times), therefore incorporating the ability to customize
the alert thresholds may increase acceptance. However, providing the ability to make
personal adjustments could possibly undermine the effectiveness of the system. The
subjects acknowledged that it would take time to learn to use the system effectively,
and that the nature of the implementation would influence the decision. Several
subjects also said that if the FCWS had been proven to be effective, they would be more
inclined to purchase a vehicle that was equipped with an alerting system.
Of the 62% of subjects who would prefer to own a FCWS‐equipped vehicle, 40%
had no preference among the systems (Figure 4‐24). Of the remaining subjects, most
would prefer the Early Directional system, followed by Early Non‐Directional, and
lastly Late Alerting Only.
Alerting System Ownership Preference
21%
17%
62%
Prefer to Own
Do Not Prefer to Own
Not Sure
Figure 4‐23: Percentage of subjects who would prefer to own a FCWS, would not prefer to own one, or were unsure.
91
System Preference of Those Who Prefer to Own
13%
20%
27%
40%Late Alerting Only
Early Non-Directional
Early Directional
No Preference (among systems)
Figure 4‐24: Percentage of subjectsʹ system configuration preferences of those who would prefer to own a FCWS.
Despite an overall acceptance of multi‐stage and directional alerting, the subjects
had several suggestions for improvements. For example, providing additional
information with the alerts may assist the driver in performing the most appropriate
response. Assuming that the extra information does not saturate the driver’s cognitive
workload, drivers may benefit if they knew more specifically which threat the
algorithms were predicting (e.g., “lead vehicle deceleration” or “possible lane
incursion”). Similarly, incorporating predictive elements with the early alert displays
may support the driver’s projection of the future dynamic state of the hazard. Some
suggested adding an audio tone to the early alert to direct attention back to the road if
the driver was distracted and looking elsewhere. There were concerns with the
displays as well, and their potential to visually distract the driver. One subject
suggested using “current points of focus,” such as the speedometer, instead of
implementing an additional display.
92
5. Conclusions
A FCWS that alerts the driver to hazards in front of the vehicle provides the
greatest opportunity for preventing collisions that would otherwise result in injury or
death. This potential benefit, however, can only be achieved if the FCWS can ensure
that the driver effectively interprets an alert with enough time to avoid a potential
collision. There is a fundamental trade‐off between providing the driver more time in
which to respond, and alerting the driver unnecessarily. The probability of a successful
response increases when the driver has more time and distance in which to identify the
hazard and execute the most appropriate maneuver. However, alerting the driver at
earlier, more conservative thresholds increases the probability that the alerts are
unnecessary, either because sensor error has falsely identified a hazard or because the
environment has changed such that the hazard is no longer a threat. Frequent
unnecessary alerts degrade alert effectiveness by reducing trust in the system, but
setting alert thresholds too close to the hazard risks an unsuccessful response.
The human‐factors issues pertaining to a FCWS were analyzed using an
Integrated Human‐Centered Systems (IHCS) approach, from which two design features
were proposed: multi‐stage alerting, which alerts the driver at an earlier, conservative
threshold, in addition to a more serious, late threshold; and directional alerting, which
provides the driver information regarding the location of the hazard that prompted the
alert activation. Alerting the driver earlier increases the probability of a successful
response by conditioning the driver to respond more effectively if and when evasive
action is necessary. Directional alerting decreases the amount of time required to
identify the hazard, while promoting trust in the system by informing the driver of the
cause of the alert activation. The proposed design features were incorporated into four
FCWS configurations: one that provided no alerting, one that provided only a single
late alert, and two that provided early alerts in addition to the late alerts. The two early
93
alerting systems were divided into two categories, one of which provided non‐
directional early alerting and the other which provided directional early alerting. An
experiment was conducted in which subjects were equipped with the various
configurations and placed in unique situations that were designed to result in a
collision if they did not respond effectively. Driver response behavior was analyzed for
each of the alerting system configurations.
Drivers who were equipped with multi‐stage and directional alerting avoided
hazardous situations more effectively than drivers who were not provided early
alerting. When equipped with directional alerting, subjects were consistently able to
avoid more collisions and more late alert threshold crossings. Subjects with directional
alerting tended to maintain farther distances from hazards, which increased the
probability that the responses were successful. When a collision did occur with a
hazard that was not initially on the road in front of the driver, the relative velocity at
impact was highest when subjects were not alerted and lowest when subjects were
alerted early. During this event, no collision occurred with directional alerting, which
indicates that specifically directing the driver’s attention to hazards beyond the
immediate forward environment promotes the most effective response.
The TTC values at which the subjects first responded tended to be farther from
the hazard for subjects using the early directional alerting system. Also, there was less
variability among the response times for the early alerting systems, which may suggest
system effectiveness across a wider range of driving abilities. When subjects
responded, most chose to release the accelerator as opposed to a more committing
maneuver such as steering or braking. Milder responses (such as releasing the
accelerator) require more time to perform, but they decrease the probability that a
driver will lose control or inadvertently cause another accident while performing an
evasive maneuver. Multi‐stage alerting enables milder responses, because the alerts
provide more time in which to perform the maneuver.
94
As seen in the velocity profiles, subjects who experienced collisions attempted to
slow down at maximum deceleration, but the onset of the response was later than other
more effective maneuvers. Without steering to avoid the hazard, a collision was
unavoidable. The driver may have been unaware of what was required to avoid a
collision, but had the response been made earlier the maneuver may have been
successful. This behavior is reflected in the plots of relative velocity vs. range. These
plots also indicate a clear distinction between drivers who were and were not provided
early alerting during the event in which a lead vehicle decelerates because of traffic up
ahead. Drivers who were alerted earlier began braking farther from the hazard, more
effectively avoiding both collisions and late alert threshold crossings.
When subjects were exposed to the FCWS, without prior knowledge that their
vehicle would be equipped with an alerting system, the early alerting systems were
least effective. When subjects were unfamiliar with the alerting stimulus, the braking
response was delayed, possibly indicating lack of awareness or confusion. This
supports the case for a system that alerts earlier and more frequently: by consistently
exposing the driver to the alerting stimulus, drivers will develop an understanding of
the system and how it works. Familiarity promotes trust, which enhances alert
effectiveness.
During the pre‐determined unnecessary system activations, drivers who were
using the Early Directional system displayed more cautious responses, regardless of
whether or not the directional alerting false‐positive was shown first or second during
the testing scenario. The system was designed to direct the driver’s attention to the
location of a hazard, and therefore subjects were responding appropriately, expecting to
see a cause for concern. Frequent activations in the absence of a threat could degrade
the driver’s trust in the system, but the majority of subjective responses do not indicate
dissatisfaction or annoyance.
95
There were numerous occasions when the early alerting systems activated
unnecessarily, but drivers indicated a high level of acceptance, confidence, and trust in
multi‐stage and directional alerting. Three‐quarters of the subjects thought that the
early alerts were useful, and although some were concerned with the frequency of
unnecessary activations, the majority of subjects preferred the additional support.
Drivers were most confident in the system that would provide directional and multi‐
stage alerting, followed by non‐directional multi‐stage alerting and late alerting only.
Given the generous amounts of positive feedback, and the observations of driver
response behavior, a FCWS that incorporates directional and multi‐stage alerting will
effectively assist drivers in identifying, assessing, and avoiding hazardous situations,
thereby reducing the number of collisions, and actively supporting driver safety.
96
6. References
[1] NCSA, ʺTraffic Safety Facts 2005: A Compilation of Motor Vehicle Crash Data from the Fatality Analysis Reporting System and the General Estimates System.,ʺ NHTSA, NCSA, DOT, Washington, DC DOT HS 810 631, 2005.
[2] NCSA, ʺEstimates of Motor Vehicle Traffic Crash Fatalities and People Injured: 2006,ʺ NHTSA, Washington, DC, online presentation DOT HS 810 755, May 25 2007.
[3] J. K. Kuchar, ʺCollision alerting system evaluation methodology for ground vehicles,ʺ presented at Transportation Sensors and Controls: Collision Avoidance, Traffic Management, and ITS, 1997.
[4] P. L. Zador, S. A. Krawchuk, and R. B. Voas, ʺFinal Report ‐‐ Automotive Collision Avoidance System (ACAS) Program,ʺ NHTSA, Washington, DC DOT HS 809 080, August 2000.
[5] J. K. Kuchar, ʺA Unified Methodology for the Evaluation of Hazard Alerting Systems,ʺ in MIT International Center for Air Transportation, Department of Aeronautics & Astronautics, vol. Ph.D. Cambridge, MA: Massachusetts Institute of Technology, 1995, pp. 167.
[6] R. J. Hansman, J. K. Kuchar, J. P. Clarke, S. Vakil, R. Barhydt, and A. Pritchett, ʺIntegrated human centered systems approach to the development of advanced cockpit and air traffic management systems,ʺ 1997.
[7] R. M. Clarke, M. J. Goodman, M. Perel, and R. R. Knipling, ʺDriver Performance and IVHS Collision Avoidance Systems: A Search for Design‐Relevant Measurement Protocols,ʺ presented at ITS America Annual Meeting, Washington, DC, 1994.
[8] M. R. Endsley, Automation and Situation Awareness. Mahwah, New Jersey: Lawrence Erlbaum, 1996.
[9] M. R. Endsley, ʺTheoretical Underpinnings of Situation Awareness: A Critical Review,ʺ in Situation Awareness Analysis and Measurement, M. R. Endsley and D. J. Garland, Eds. Mahwah, NJ: Lawrence Erlbaum Associates, 2000, pp. 24.
[10] M. R. Endsley, ʺDesign and evaluation for situation awareness enhancement,ʺ presented at Human Factors Society 32nd Annual Meeting, Santa Monica, CA, 1988.
[11] A. C. Stein, R. A. Solomon, and D. A. Zeidman, ʺField evaluation of the Rader Control Systems (RCS) Radar Anti‐Collision Warning System,ʺ D. o. T. NHTSA, Ed.: Systems Technology, Inc., 1992, pp. 81.
[12] R. Ervin, S. Bogard, and P. Fancher, ʺConsidering Radar Detection of Vehicles in a String for Gaining Situation Awareness of a Propagating Conflict,ʺ presented at Transportation Research Board 80th Annual Meeting, Washington, DC, 2001.
97
[13] F. Kruse, F. Folster, M. Ahrholdt, H. Rohling, M.‐M. Meinecke, and T.‐B. To, ʺTarget Classification Based on Near‐Distance Radar Sensors,ʺ presented at Intelligent Vehicles Symposium, University of Parma, Italy, 2004.
[14] U. Meis and R. Schneider, ʺRadar Image Acquisition and Interpretation for Automotive Applications,ʺ presented at Intelligent Vehicles Symposium, Columbus, Ohio, 2003.
[15] W. Nagy and J. Wilhelm, ʺSystem and Parametric Tradeoffs of Forward Looking Automotive Radar Systems,ʺ presented at National Radar Conference, Ann Arbor, Michigan, 1996.
[16] M. Skutek, M. Mekhaiel, and G. Wanielik, ʺA PreCrash System based on Radar for Automotive Applications,ʺ presented at Intelligent Vehicles Symposium, Columbus, Ohio, 2003.
[17] B. Ulmer, ʺVITA ‐ An Autonomous Road Vehicle (ARV) for Collision Avoidance in Traffic,ʺ presented at IEEE Intelligent Vehicles Symposium, 1992.
[18] E. Dagan, O. Mano, G. P. Stein, and A. Shashua, ʺForward Collision Warning with a Single Camera,ʺ presented at Intelligent Vehicles Symposium, University of Parma, Italy, 2004.
[19] B. Ulmer, ʺVITA II ‐ Active Collision Avoidance in Real Traffic,ʺ presented at Intelligent Vehicles ʹ94 Symposium, Paris, France, 1994.
[20] A. Broggi, A. Fascioli, M. Carletti, T. Graf, and M. Meinecke, ʺA Multi‐resolution Approach for Infrared Vision‐based Pedestrian Detection,ʺ presented at Intelligent Vehicles Symposium, University of Parma, Italy, 2004.
[21] D. T. Linzmeier, M. Mekhaiel, D. Vogt, R. Prasanna, and K. C. J. Dietmayer, ʺProbabilistic Signal Interpretation Methods for a Thermopile Pedestrian Detection System,ʺ presented at Intelligent Vehicles Symposium, Las Vegas, Nevada, 2005.
[22] Raytheon, ʺNightDriver Thermal Imaging Camera and HUD Development Program for Collision Avoidance Applications ‐ Final Report,ʺ Raytheon Commercial Infrared, Dallas, TX DOT‐HS‐809‐163, June 2000.
[23] K. C. Fuerstenberg, D. T. Linzmeier, and K. C. J. Dietmayer, ʺPedestrian Recognition and Tracking of Vehicles using a vehicles based Multilayer Laserscanner,ʺ presented at World Congress and Exhibition on Intelligent Transport Systems and Services, Madrid, Spain, 2003.
[24] K. C. Fuerstenberg and J. Scholz, ʺReliable Pedestrian Detection using Laserscanners,ʺ presented at Intelligent Vehicles Symposium, Las Vegas, Nevada, 2005.
[25] R. Labayrade, C. Royere, and D. Aubert, ʺA Collision Mitigation System using Laser Scanner and Stereovision Fusion and its Assessment,ʺ presented at Intelligent Vehicles Symposium, Las Vegas, Nevada, 2005.
98
[26] B. Alefs, D. Schreiber, and M. Clabian, ʺHypothesis based vehicle detection for increased simplicity in multi‐sensor ACC,ʺ presented at Intelligent Vehicles Symposium, Las Vegas, Nevada, 2005.
[27] A. Amditis, A. Polychronopoulos, N. Floudas, and L. Andreone, ʺFusion of infrared vision and radar for estimating the lateral dynamics of obstacles,ʺ Information Fusion, vol. 6, pp. 129–141, 2004.
[28] S. Y. Sohn and R. Stepleman, ʺMeta‐analysis on total braking time,ʺ Ergonomics, vol. 41, pp. 1129‐1140, 1998.
[29] J. K. Kuchar, ʺManaging Uncertainty in Decision‐Aiding and Alerting System Design,ʺ presented at 6th CNS/ATM Conference, Taipei, Taiwan, 2001.
[30] R. A. Rensink, J. K. OʹRegan, and J. J. Clark, ʺTo See or Not to See: The Need for Attention to Perceive Changes in Scenes,ʺ Psychological Science, vol. 8, pp. 368‐373, 1997.
[31] R. v. d. Horst and J. Hogema, ʺTime‐to‐Collision and Collision Avoidance Systems,ʺ presented at 6th ICTCT Workshop, Salzburg, 1993.
[32] L. Yang, J. H. Yang, E. Feron, and V. Kulkarni, ʺDevelopment of a Performance‐Based Approach for a Rear‐End Collision Warning and Avoidance System for Automobiles,ʺ presented at IEEE Intelligent Vehicles Symposium, Columbus, OH, 2003.
[33] J. Hillenbrand, K. Kroschel, and V. Schmid, ʺSituation Assessment Algorithm for a Collision Prevention Assistant,ʺ presented at Intelligent Vehicles Symposium, Las Vegas, Nevada, 2005.
[34] A. Burgett and R. J. M. Jr., ʺA New Paradigm for Rear‐end Crash Prevention Driving Performance,ʺ NHTSA, Washington, DC SAE 2001‐01‐0463, March 2001.
[35] A. L. Burgett, A. Carter, R. J. Miller, W. G. Najim, and D. L. Smith, ʺA Collision Warning Algorithm for Rear‐End Collisions,ʺ presented at 16th International Techical Conference on Enhanced Safety of Vehicles, Washington, DC, 1998.
[36] T. L. Brown, J. D. Lee, and D. V. McGehee, ʺHuman performance models and rear‐end collision avoidance algorithms,ʺ Human Factors, vol. 43, pp. 462‐482, 2001.
[37] T. A. Dingus, D. V. McGehee, N. Manakkal, S. K. Jahns, C. Carney, and J. M. Hankey, ʺHuman Factors Field Evaluation of Automotive Headway Maintenance/Collision Warning Devices,ʺ Human Factors, vol. 39, pp. 216‐229, 1997.
[38] J. L. Campbell, C. M. Richard, J. L. Brown, and M. McCallum, ʺCrash Warning System Interfaces: Human Factors Insights and Lessons Learned,ʺ NHTSA, Washington, DC DOT HS 810 697, January 2007.
[39] ʺ44 Crashes,ʺ General Motors Corporation; NAO Engineering, Safety and Restraints Center, Crash Avoidance Department, Detroit, Michigan, v 3.0 January 1997.
99
[40] W. G. Najm and J. D. Smith, ʺDevelopment of Crash Imminent Test Scenarios for Integrated Vehicle‐Based Safety Systems (IVBSS),ʺ NHTSA, Washington, DC DOT VNTSC‐NHTSA‐07‐01, DOT HS 810 757., April 2007.
[41] R. C. Curry, J. A. Greenberg, and R. J. Kiefer, ʺNADS versus CAMP Closed‐Course Comparison Examining “Last‐Second” Braking and Steering Maneuvers Under Various Kinematic Conditions,ʺ Crash Avoidance Metrics Partnership, Farmington Hills, MI DOT HS 809 925, August 2005.
[42] E. Stern, V. Barth, W. Durfee, M. Rosen, T. Rosenthal, E. Schold‐Davis, C. Schaffer, J. Wachtel, M. Watson, and J. Zola, ʺA Protocol for Avoiding Driving Simulator Sickness,ʺ presented at 2006 STISIM Users Conference, MIT AgeLab, Cambridge, MA, 2006.
[43] L. Angell, J. Auflick, P. A. Austria, D. Kochhar, L. Tijerina, W. Biever, T. Diptiman, J. Hogsett, and S. Kiger, ʺDriver Workload Metrics Project: Final Report,ʺ NHTSA, Washington, DC DOT HS 810 635, November 2006.
[44] L. Angell, J. Auflick, P. A. Austria, D. Kochhar, L. Tijerina, W. Biever, T. Diptiman, J. Hogsett, and S. Kiger, ʺDriver Workload Metrics Project: Final Report ‐ Appendices,ʺ NHTSA, Washington, DC DOT HS 810 635, November 2006.
100
Appendix A: Treatment Summary
Testing Scenario Treatments
Table A‐1: Testing scenario treatment order (key below).
Subject Testing Treatments 1 T3 T3 T1 T1 T4 T4 T2 T2 2 T2 T2 T3 T3 T1 T1 T4 T4 3 T2 T2 T3 T3 T4 T4 T1 T1 4 T1 T1 T4 T4 T3 T3 T2 T2 5 T4 T4 T1 T1 T3 T3 T2 T2 6 T3 T3 T1 T1 T2 T2 T4 T4 7 T2 T2 T1 T1 T4 T4 T3 T3 8 T1 T1 T2 T2 T4 T4 T3 T3 9 T4 T4 T2 T2 T1 T1 T3 T3
10 T4 T4 T3 T3 T2 T2 T1 T1 11 T2 T2 T1 T1 T3 T3 T4 T4 12 T3 T3 T4 T4 T2 T2 T1 T1 13 T3 T3 T4 T4 T1 T1 T2 T2 14 T2 T2 T4 T4 T3 T3 T1 T1 15 T1 T1 T3 T3 T4 T4 T2 T2 16 T1 T1 T3 T3 T2 T2 T4 T4 17 T2 T2 T4 T4 T1 T1 T3 T3 18 T4 T4 T1 T1 T2 T2 T3 T3 19 T1 T1 T4 T4 T2 T2 T3 T3 20 T4 T4 T3 T3 T1 T1 T2 T2 21 T3 T3 T2 T2 T4 T4 T1 T1 22 T3 T3 T2 T2 T1 T1 T4 T4 23 T1 T1 T2 T2 T3 T3 T4 T4 24 T4 T4 T2 T2 T3 T3 T1 T1
TE1 TE2 TE3 TE4 TE5 TE6 TE7 TE8
FCWS Configuration Key:
T1: No Alerting T2: Late Alerting Only T3: Early Non‐Directional + Late Alerting T4: Early Directional + Late Alerting
101
Training Scenario Treatments
Table A‐2: Training scenario treatment order (key below).
Subject Training Treatments 1 T4 T4 T2 T1 T3 2 T2 T2 T1 T4 T3 3 T2 T2 T3 T1 T4 4 T2 T2 T3 T4 T1 5 T3 T3 T4 T1 T2 6 T4 T4 T3 T2 T1 7 T4 T4 T2 T3 T1 8 T3 T3 T4 T1 T2 9 T2 T2 T4 T1 T3 10 T2 T2 T4 T3 T1 11 T4 T4 T1 T2 T3 12 T3 T3 T1 T2 T4 13 T3 T3 T2 T4 T1 14 T3 T3 T2 T1 T4 15 T4 T4 T3 T2 T1 16 T2 T2 T1 T3 T4 17 T3 T3 T2 T1 T4 18 T4 T4 T2 T3 T1 19 T2 T2 T1 T3 T4 20 T3 T3 T1 T4 T2 21 T4 T4 T1 T3 T2 22 T2 T2 T1 T4 T3 23 T3 T3 T4 T2 T1 24 T4 T4 T3 T1 T2
Naïve TE TE TE TE
FCWS Configuration Key:
T1: No Alerting T2: Late Alerting Only T3: Early Non‐Directional + Late Alerting T4: Early Directional + Late Alerting
102
Appendix B: Threat Event Illustrations
Training Scenario Threat Event
Figure B‐1: Training Threat Event: a lead vehicle pulls off the road to uncover a stopped vehicle in the driverʹs lane.
Testing Scenario Threat Events
Figure B‐2: Threat Event 1: Construction blocking the driverʹs lane.
103
Figure B‐3: Threat Event 2: Oncoming vehicle turning left in front of the driver.
Figure B‐4: Threat Event 3: Initially stopped vehicle pulls into the driverʹs lane.
104
Figure B‐5: Threat Event 4: A police officer chases another vehicle across the road.
Figure B‐6: Threat Event 5: A cyclist enters the driverʹs lane.
105
Figure B‐7: Threat Event 6: With an accident in the left‐hand lane, an ambulance crosses the road from the right.
Figure B‐8: Threat Event 7: An initially stopped vehicle makes a right‐hand turn into the driverʹs lane.
106
Figure B‐9: Threat Event 8: A lead vehicle decelerates because of slow‐moving traffic up ahead.