Aerosol Science 33 (2002) 1309 – 1325 www.elsevier.com/locate/jaerosci Approaches to increasing yield in evaporation= condensation nanoparticle generation Yogendra Singh a , Julie R.N. Javier a , Sheryl H. Ehrman a ; ∗ , Martin H. Magnusson b , Knut Deppert b a Department of Chemical Engineering, University of Maryland, College Park, MD 20742 2111 USA b Solid State Physics, Lund University, Box 118, S221 00 Lund, Sweden Received 1 June 2001; received in revised form 19 April 2002; accepted 22 April 2002 Abstract With the recent interest in the chemical, electronic and optical properties of nanometer scale metal particles, there is now interest in manufacturing these materials in larger quantities. Since both small particle size and high particle number concentrations are sought, there is a need for improved particle generation reactors that can realize both goals. Here, results are presented for the synthesis of indium metal nanoparticles in an evaporation= condensation aerosol generator. Size distributions were measured for metal nanoparticles formed using a standard ow conguration, as well as using several variations on the standard conguration. The aim of the modications is to increase the cooling rate and thus, to increase the nucleation rate of the nanoparticles. An increase in the number concentration of particles and, in some cases, a signicant decrease in average particle size was observed when the modied reactor congurations were used. These results can be explained by the changes in the time–temperature history of the nanoparticles resulting from the modications to the aerosol generator. A monodisperse model of nanoparticle formation and growth, accounting for nucleation, condensation and coagulation, was used to describe particle formation in the standard ow conguration, to guide the modications, and to describe particle formation in one of the modied congurations, with qualitative agreement seen between measured and predicted particle sizes. ? 2002 Elsevier Science Ltd. All rights reserved. 1. Introduction Metal nanoparticles are of interest for a variety of uses including catalysis, as masks for nanofab- rication techniques, and as precursors in the formation of compound semiconductor nanoparticles. ∗ Corresponding author. Tel.: +1-301-405-1917; fax: +1-301-314-9126. E-mail address: [email protected] (S.H. Ehrman). 0021-8502/02/$ - see front matter ? 2002 Elsevier Science Ltd. All rights reserved. PII: S0021-8502(02)00072-1
Approaches to increasing yield in evaporation=condensationnanoparticle generation
Yogendra Singha, Julie R.N. Javiera, Sheryl H. Ehrmana ; ∗, Martin H. Magnussonb,Knut Deppertb
aDepartment of Chemical Engineering, University of Maryland, College Park, MD 20742 2111 USAbSolid State Physics, Lund University, Box 118, S221 00 Lund, Sweden
Received 1 June 2001; received in revised form 19 April 2002; accepted 22 April 2002
Abstract
With the recent interest in the chemical, electronic and optical properties of nanometer scale metal particles,there is now interest in manufacturing these materials in larger quantities. Since both small particle size andhigh particle number concentrations are sought, there is a need for improved particle generation reactorsthat can realize both goals. Here, results are presented for the synthesis of indium metal nanoparticles in anevaporation=condensation aerosol generator. Size distributions were measured for metal nanoparticles formedusing a standard 2ow con3guration, as well as using several variations on the standard con3guration. The aimof the modi3cations is to increase the cooling rate and thus, to increase the nucleation rate of the nanoparticles.An increase in the number concentration of particles and, in some cases, a signi3cant decrease in averageparticle size was observed when the modi3ed reactor con3gurations were used. These results can be explainedby the changes in the time–temperature history of the nanoparticles resulting from the modi3cations to theaerosol generator. A monodisperse model of nanoparticle formation and growth, accounting for nucleation,condensation and coagulation, was used to describe particle formation in the standard 2ow con3guration,to guide the modi3cations, and to describe particle formation in one of the modi3ed con3gurations, withqualitative agreement seen between measured and predicted particle sizes. ? 2002 Elsevier Science Ltd. Allrights reserved.
1. Introduction
Metal nanoparticles are of interest for a variety of uses including catalysis, as masks for nanofab-rication techniques, and as precursors in the formation of compound semiconductor nanoparticles.
0021-8502/02/$ - see front matter ? 2002 Elsevier Science Ltd. All rights reserved.PII: S 0021-8502(02)00072-1
1310 Y. Singh et al. / Aerosol Science 33 (2002) 1309–1325
Since many of the material properties of interest are size dependent, most applications require unag-glomerated particles with a controlled size distribution, and these requirements limit the scalabilityof many production processes.
Various processes for synthesizing metal nanoparticles from the gas phase have been developedat the laboratory scale. In one of the earliest systematic studies of metal nanoparticle formation byevaporation and condensation in a low pressure (0.5–4 Torr) inert gas atmosphere, Granqvist andBuhrman (1976) found that the size distributions of various metal nanoparticles were log-normal inshape, if the metal particles were spherical (¡ 20 nm in diameter). The size distribution of particlepopulations containing larger particles with well de3ned crystal habits were found to deviate from alog-normal shape. Scheibel and PorstendGorfer (1983) described a device based upon evaporation andcondensation in a horizontal tube furnace at atmospheric pressure for the generation of monodispersesilver and NaCl aerosols in the size range of 2–300 nm. With this generator, they studied particleformation by measuring particle size distributions of the condensation aerosols as a function offurnace temperature, carrier gas 2ow rate, and position of the boat containing the metal.
Some more recent eHorts have been focused on increasing the production rate of metal nano-particles and on developing continuous processes for synthesis and collection. Mahoney andAndres (1995) developed a versatile arc evaporation reactor for producing nanoscale unagglom-erated, equiaxed metal clusters, and metal-based ceramics. In this process, production rates of gramsper hour are possible because of the enhanced evaporation rate of the metal. In another approachto metal nanoparticle synthesis, termed the aerosol 2ow condenser, Haas, Birringer, Gleiter, andPratisinis (1997) used radio frequency (RF) heating to enhance metal evaporation, combined withjets of carrier gas 2owing over the metal source to produce palladium particles in a continuousprocess. Compared to particles formed by traditional inert gas condensation methods (Gleiter, 1992),the palladium particles formed were considerably smaller, and a reduction in the geometric standarddeviation of the particle size distribution was observed.
The reactor system used here, an evaporation=condensation aerosol generator, was selected becauseit is widely used at the laboratory scale, and can be easily modi3ed, allowing a comparison ofthe eHect of our modi3cations on the 3nal particle size distribution and number concentration toresults obtained using the original, unmodi3ed 2ow con3guration. The goal of our modi3cations isto simultaneously increase the number concentration of nanoparticles produced and to decrease theaverage particle size. We have chosen to study the formation of indium metal nanoparticles, but theresults obtained here are generally applicable to any material formed by the evaporation=condensationroute.
To obtain insight into the physical phenomena occurring during nanoparticle growth from the gasphase, and to guide our modi3cations to the aerosol generator, theoretical predictions of particleformation rates and growth dynamics are helpful. For these purposes, various models have beendeveloped for the case of instantaneous coalescence, an assumption that, as described later, webelieve is reasonable for our system. Friedlander (1983) reported a solution for the growth ofparticles by nucleation and condensation for isothermal conditions, with no assumptions regardingthe particle size distribution, using the 3rst three moments of the particle size distribution. Pratsinis(1988) developed a moment-based model accounting for the eHects of nucleation, condensation, andcoagulation on particle growth dynamics, assuming a unimodal log-normal particle size distribution.This moment-based approach was later extended to incorporate thermophoresis and diHusion as wellas two-dimensional variations in concentration, temperature, and velocity (Phanse & Pratsinis, 1989).
Y. Singh et al. / Aerosol Science 33 (2002) 1309–1325 1311
Other more computationally intensive approaches, including those developed by Girshick and Chiu(1989) and Xiong and Pratsinis (1991), use discrete-sectional techniques to describe the evolutionof the particle size distribution.
In the simple case of particles uniform in size that coalesce instantaneously, Panda and Pratsinis(1995) have shown that particle formation and growth can be described by balances on the metalvapor atoms, the particle number concentration and the particle volume concentration. The model wehave used in this study is based upon their approach, developed originally to describe the growth ofaluminum particles by an evaporation=condensation process. We selected this methodology becauseit has been shown to give results for metal nanoparticle formation and growth that are comparableto those obtained using much more computationally intensive models (Panda & Pratsinis, 1995).The estimates for the 3nal primary particle size and number concentration of indium nanoparticlesobtained using the model were 3rst compared with the experimental results for diHerent furnacetemperatures, obtained using a standard con3guration. The model was then used to estimate theeHect of increasing the cooling rate on particle number and average size for several hypotheticaltemperature pro3les. Guided by our numerical results, we made two simple modi3cations to thereactor to increase the rate of cooling, and the particle number concentration and size distributionswere compared to those obtained using the original standard con3guration.
2. Experimental methods
In the standard con3guration, shown in Fig. 1, puri3ed nitrogen carrier gas (¿ 99:9999%), passesthrough the reactor, an alumina tube, 60 cm in length and 1:8 cm in inner diameter, heated externallyby a 22 cm long horizontal tube furnace. For these experiments, the set point of the furnace wasbetween 1173 and 1373 K. A boron nitride boat containing indium metal was placed inside the tubeat the point of maximum temperature to obtain the highest possible metal evaporation rate. At thesetemperatures, the metal is in the liquid phase, and as it evaporates, it provides a source of metalvapor. The carrier gas 2ow rate was kept constant at 1.68 standard liters per minute (slpm). Thetemperature inside the furnace was measured along the centerline as a function of axial distanceusing a type N thermocouple, and the temperature pro3les are reported in Fig. 2. The Reynoldsnumbers for this system calculated at the various furnace set point temperatures do not exceed 20,indicating laminar 2ow.
Fig. 1. Schematic of the standard evaporation=condensation setup.
1312 Y. Singh et al. / Aerosol Science 33 (2002) 1309–1325
Fig. 2. Measured temperature pro3le inside the reactor tube for various maximum furnace set point temperatures and forthe QTAO setup at 1373 K. The zero position, with respect to axial distance, corresponds to the inlet of the alumina tube.For reference, the location of the furnace is shown with dashed lines.
The particle size distribution was measured downstream of the alumina tube using the followinghome built instrumentation: an ultraviolet particle charger, a Vienna-type diHerential mobility analyzer(DMA), and an electrometer. The ultraviolet charger uses the photoelectric eHect to produce a streamof positively charged particles and free electrons by irradiating the particle-laden stream with 222 nmwavelength light. The free electrons can then charge the neutral particles, with the 3nal result beinga stream of positively and negatively charged particles (Burtscher, Scherrer, Siegmann, Schmidt-Ott,& Federer, 1982). In the DMA, diHerences in mobility of charged particles in an electric 3eld as afunction of particle size are used to select a desired nanoparticle size range (Winkelmayer, Reischl,Lindner, & Berner, 1991). The electrometer measures the current carried by the stream of particles,thus giving the number concentration of a particular size range assuming singly charged particles.The reported size distribution was corrected for the charging eOciency of the ultraviolet charger, anexperimentally determined function of particle diameter (Deppert & Magnusson, 1999). The chargingprobability using the ultraviolet charger is greater for smaller particles as compared to the chargingprobability (Boltzmann distribution) obtained using the more common Kr-85 charger. The mass ofmetal evaporated was determined by weighing the boat before and after each experiment using ananalytical balance.
The modi3cations to the furnace are shown in Figs. 3 and 4. In the 3rst modi3ed setup, shownin Fig. 3, a quartz tube of inner diameter 4 mm, and 25:4 cm in length, was placed inside thealumina tube downstream of the boat containing the metal. We refer to this con3guration as thequartz-tube-as-outlet (QTAO) setup. The 2ow over the boat was equal to 1:51 slpm. To reducelosses of the vapor from diHusion to the reactor tube walls, a carrier gas stream with a 2ow rateof 0:17 slpm was introduced from the opposite side, giving a total 2ow rate of 1:68 slpm. Theentire 2ow through the furnace exits through the quartz tube, and the vapor condenses to formnanoparticles within the quartz tube. The temperature pro3le inside the quartz tube for a furnace setpoint temperature of 1373 K was measured using a type N thermocouple, and is shown in Fig. 2. TheReynolds number for the 2ow of nitrogen through the small quartz tube was higher, approximately65, but still well below the transition to turbulent 2ow.
Y. Singh et al. / Aerosol Science 33 (2002) 1309–1325 1313
Fig. 3. Schematic, not to scale, of the QTAO modi3ed setup.
Fig. 4. Schematic, not to scale, of the QTAB modi3ed setup.
In the other modi3cation reported here, shown in Fig. 4, a quartz tube 4 mm in inner diameterand 35:4 cm in length was placed inside the alumina tube at the inlet side. The outlet of thequartz tube was located downstream of the boat, just before the end of the tube furnace. Basedupon observations of the location of metal deposition in the alumina tube in experiments using thestandard con3guration, it is believed that nucleation occurs a few centimeters downstream of wherethe alumina tube exits the furnace, with the exact location depending upon the furnace temperaturepro3le. Hence, it is believed that with the quartz tube in this position, the time–temperature historyin the region of nucleation will be aHected. We refer to this arrangement as the quartz-tube-after-boat(QTAB) setup. In this case, the carrier gas 2ows through both the quartz tube and the annular spacebetween the quartz and alumina tubes. The total 2ow rate was kept constant at 1:68 slpm, but the2ow rates of the two streams were varied so that the ratio of the average velocity in the quartz tubeto the average velocity in the annular space ranged from 1:1 to 20:1. The details of the 2ow ratesare given in Table 1. At the higher velocity ratios, a con3ned co2owing annular jet is formed, witha jet Reynolds number of 33 for the 20:1 velocity ratio, indicating that the jet is laminar.
3. Theory
In the evaporation–condensation reactor, the carrier gas passes over the boat, carrying away metalvapor. As the mixture of vapor and carrier gas 2ows downstream and cools, particles form andgrow by the processes of nucleation, condensation and coagulation. Here, the term nucleation is usedto describe the formation of stable, chemically homogeneous metal clusters from a supersaturated
1314 Y. Singh et al. / Aerosol Science 33 (2002) 1309–1325
Table 1Details of 2ow rates for the QTAB experiments
Quartz tube 0.08 0.16 0.85Annular region 1.60 1.52 0.83
Jet Reynolds number at exit of quartz tube 3 6 33
vapor. Condensation is the process of cluster growth via collisions with vapor phase metal atoms(monomers). Coagulation is the process of cluster growth via collisions between metal clusters,followed by coalescence of the clusters (Friedlander, 1977).
An important consideration is whether the particles are spheroids or dendritic aggregates. We canlook to estimates of characteristic times for interparticle collision and particle coalescence to give in-sight into the 3nal particle morphology (Flagan & Lunden, 1995; Lehtinen, Windeler, & Friedlander,1996). The characteristic time for collisions is de3ned as the time required for the cluster numberconcentration to decrease by a factor of two, and the characteristic time for coalescence is de3ned asthe time required for two coalescing spheres to form a single sphere. From a modeling point of view,it is important to determine which of these two mechanisms, collision or coalescence, limits the rateof particle growth. If particles coalesce faster than they collide, the particles will be spherical, but ifthe time required for coalescence is greater than the time between interparticle collisions, then theparticles will form aggregates (Flagan & Lunden, 1995; Lehtinen et al., 1996). Transmission electronmicroscope images of indium particles obtained for a furnace maximum temperature of 1373 K, anexample of which is shown in Fig. 5, suggest that the particles are spherical. The faint core-shellpattern visible in the image is believed to result from shell melting of the nanoparticles under theelectron beam. The following simple calculation serves to support the assertion that the particles arecoalescing completely between collisions.
The characteristic coalescence time, de3ned as the time for two equal size spheres to coalesce viaa viscous 2ow mechanism, is given by (Frenkel, 1945)
�coal = �pdp; (1)
where �coal is the coalescence time, �p is the particle viscosity, dp is the particle diameter and is the surface tension of the metal. The collision time, de3ned as the time required for the initialnumber concentration of the particles to be reduced by half by collisions between particles, is givenby (Friedlander, 1977)
�coll =2
N�g; (2)
Y. Singh et al. / Aerosol Science 33 (2002) 1309–1325 1315
Fig. 5. Transmission electron microscope image of indium nanoparticles.
where �coll is the collision time, is the collision frequency function, N is the number of particlesper unit mass of carrier gas, and �g is the density of the carrier gas.The collision frequency function for particles of uniform diameter, valid from the free molecular
to the continuum regime, is given by (Seinfeld, 1986)
= 8 Ddp
[dp
dp +√2g
+4√2D
cdp
]−1
; (3)
where the particle diHusion coeOcient D, particle velocity c, and the transmission parameter g aregiven by the following equations:
D =kBT
3 �gdp
[5 + 4Kn+ 6Kn2 + 18Kn3
5− Kn+ (8 + )Kn2
]; (4)
where T is temperature, Kn is the Knudsen number (Kn = 2�=dp) and � is the mean free path ofthe gas.
c =
√8kBT �p�p
; (5)
g=1
3dp�p[(dp + �p)3 − (d2p + �2p)
3=2]− dp; (6)
where vp is particle volume, and the mean free path for the particles given by
�p =8D c
: (7)
1316 Y. Singh et al. / Aerosol Science 33 (2002) 1309–1325
From experimental results for the average particle size as a function of furnace temperature, char-acteristic times for collisions and coalescence were estimated, using Eqs. (1) and (2), at conditionscorresponding to an axial location 13 cm downstream of where the reactor tube exits the furnace.The temperature was taken to be 459 K, the measured temperature at that point for a furnace setpoint temperature of 1373 K. The particles were assumed to be monodisperse, with a diameter equalto the measured volume average diameter, 54 nm, and a number concentration estimated from themeasured metal sublimation rate assuming all of the material condensed to form nanoparticles. Theviscosity, �p and surface tension, , of indium at 459 K are 1:6× 10⁻³ kg m−1 s−1 and 0:55 N m−2,respectively (Smithells, 1992; CRC, 1996). The characteristic collision time was relatively long, inthe order of a second. However, the characteristic time for coalescence was very short, in the orderof 10−10 s, suggesting that coalescence is eHectively instantaneous under these conditions. Theseresults suggest that the assumption that the particles are spherical (at least in the furnace) is reason-able, a result which is not surprising, considering the low melting point of indium, 428 K, and theprocess temperatures. Here, the use of a model in which coalescence is assumed instantaneous is jus-ti3ed, but this has to be veri3ed for other temperature histories or for materials with higher meltingpoints.
Particle formation and growth can be described, for the simple case of particles that are uniformin size, and that coalesce instantaneously, by balances on the metal vapor atoms, the particle num-ber concentration and the particle volume concentration (Panda & Pratsinis, 1995). Following theirapproach, the equation for the rate of change of the number of monomers of the condensing metalper unit mass of gas, nm, can be written as
dnmdt
=− Ig∗
�g− d2pnms(S − 1)
√kBT2 m1
Nf(Kn); (8)
where I is the nucleation rate and f(Kn), a function of Knudsen number (Warren & Seinfeld,1984). The 3rst term on the right hand side (RHS) of Eq. (8) represents the loss of monomers bynucleation, while the second RHS term describes the loss of monomers by condensation. The carriergas density �g, is calculated assuming ideal gas behavior. The saturation ratio is given by
S =nm�gnms
; (9)
where the monomer concentration per unit volume of gas, nms, at saturation is
nms =ps
kBT(10)
with ps equal to the equilibrium vapor pressure of the condensing metal.To describe nucleation, a variety of improvements to the classical theory of Becker and DGoring
(1935) have been proposed (see for example Girshick & Chiu, 1989; McClurg & Flagan, 1998;Martinez, Ferguson, Heist, & Nuth, 2001 and references therein). There is still considerable discus-sion as to the most accurate approach. Here, because we cannot measure nucleation rates directly,and thus cannot evaluate which model gives the most exact results, we simply use the nucleationrate derived from classical nucleation theory (Friedlander, 1977):
I = 2[
p1
(2 m1kBT )1=2
](nm�
2=31 )
[�2=31
kBT
]1=2
exp[− 16 3�213(kBT )3(ln S)2
]; (11)
Y. Singh et al. / Aerosol Science 33 (2002) 1309–1325 1317
where p1 is the partial pressure of the nucleating species and m1, and �1 are the mass and volumeof the monomer, respectively. The number of monomers (g∗) in the particle of critical size is
g∗ =[
2�3(ln S)
]3; (12)
where the dimensionless surface tension group � is
�=s1kBT
; (13)
where s1 is the monomer surface area.Similarly, the equation describing the change in the number concentration of particles with time
can be written asdNdt
=I�g
− 12N 2�g (14)
with the 3rst RHS term representing the formation of particles by nucleation and the second RHSterm accounting for the loss of particles by coagulation.
The particle volume concentration per unit mass of gas is given by
dVdt
=Ig∗
�g�1 + d2pnms�1(S − 1)
√kBT2 m1
Nf(Kn); (15)
where the 3rst term on the RHS describes the volume contribution by nucleation and the secondterm stands for the gain in particle volume via condensation of monomers. Assuming particles ofspherical shape, the average particle diameter, dp is
dp =[6VN
]1=3: (16)
A continuous expression for temperature as a function of axial distance is obtained by 3tting apolynomial function to the experimentally measured temperature pro3les. The residence time, t, canbe related to the axial position, x, and the reactor diameter, d, assuming a uniform plug 2ow velocitypro3le:
dtdx
= d2
4Q(17)
with the gas 2ow rate given by
Q =QrtT (x)Trt
; (18)
where the subscript rt refers to reference conditions.
4. Results and discussion
4.1. Experimental and model results—standard con4guration
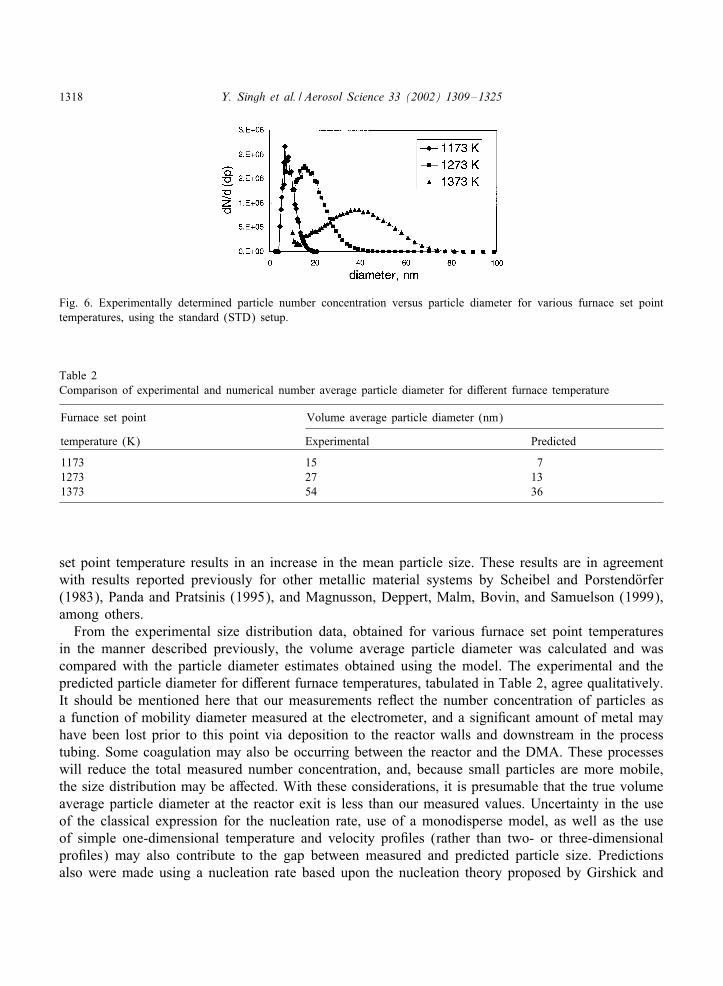
The measured particle size distributions, adjusted for charger eOciency, are shown for diHerentfurnace maximum set point temperatures in Fig. 6. It can be seen that an increase in the furnace
1318 Y. Singh et al. / Aerosol Science 33 (2002) 1309–1325
Fig. 6. Experimentally determined particle number concentration versus particle diameter for various furnace set pointtemperatures, using the standard (STD) setup.
Table 2Comparison of experimental and numerical number average particle diameter for diHerent furnace temperature
Furnace set point Volume average particle diameter (nm)
temperature (K) Experimental Predicted
1173 15 71273 27 131373 54 36
set point temperature results in an increase in the mean particle size. These results are in agreementwith results reported previously for other metallic material systems by Scheibel and PorstendGorfer(1983), Panda and Pratsinis (1995), and Magnusson, Deppert, Malm, Bovin, and Samuelson (1999),among others.
From the experimental size distribution data, obtained for various furnace set point temperaturesin the manner described previously, the volume average particle diameter was calculated and wascompared with the particle diameter estimates obtained using the model. The experimental and thepredicted particle diameter for diHerent furnace temperatures, tabulated in Table 2, agree qualitatively.It should be mentioned here that our measurements re2ect the number concentration of particles asa function of mobility diameter measured at the electrometer, and a signi3cant amount of metal mayhave been lost prior to this point via deposition to the reactor walls and downstream in the processtubing. Some coagulation may also be occurring between the reactor and the DMA. These processeswill reduce the total measured number concentration, and, because small particles are more mobile,the size distribution may be aHected. With these considerations, it is presumable that the true volumeaverage particle diameter at the reactor exit is less than our measured values. Uncertainty in the useof the classical expression for the nucleation rate, use of a monodisperse model, as well as the useof simple one-dimensional temperature and velocity pro3les (rather than two- or three-dimensionalpro3les) may also contribute to the gap between measured and predicted particle size. Predictionsalso were made using a nucleation rate based upon the nucleation theory proposed by Girshick and
Y. Singh et al. / Aerosol Science 33 (2002) 1309–1325 1319
Fig. 7. Average particle number concentration pro3les, N , for various cooling rates as a function of axial distance, estimatedusing the monodisperse model.
Chiu (1990), and the agreement between observed and predicted values did not improve. Regardless,the model is still useful for estimating the sensitivity of particle size and number concentration tovarious experimental parameters.
As shown by Girshick and Chiu (1989) and Panda and Pratsinis (1995) among others, a decreasein particle size will be observed for high cooling rates, low evaporation temperatures, low systempressures, and low metal vapor concentration. If the concentration of metal vapor is decreased bylowering the evaporation temperature, or by some other modi3cation to reduce the metal vaporconcentration, the production rate of particles will decrease. Because our objectives are to increasethe rate of production of particles as well as to decrease their size, we focus on the cooling rate asour adjustable experimental parameter.
4.2. Modeling results for hypothetical time–temperature histories
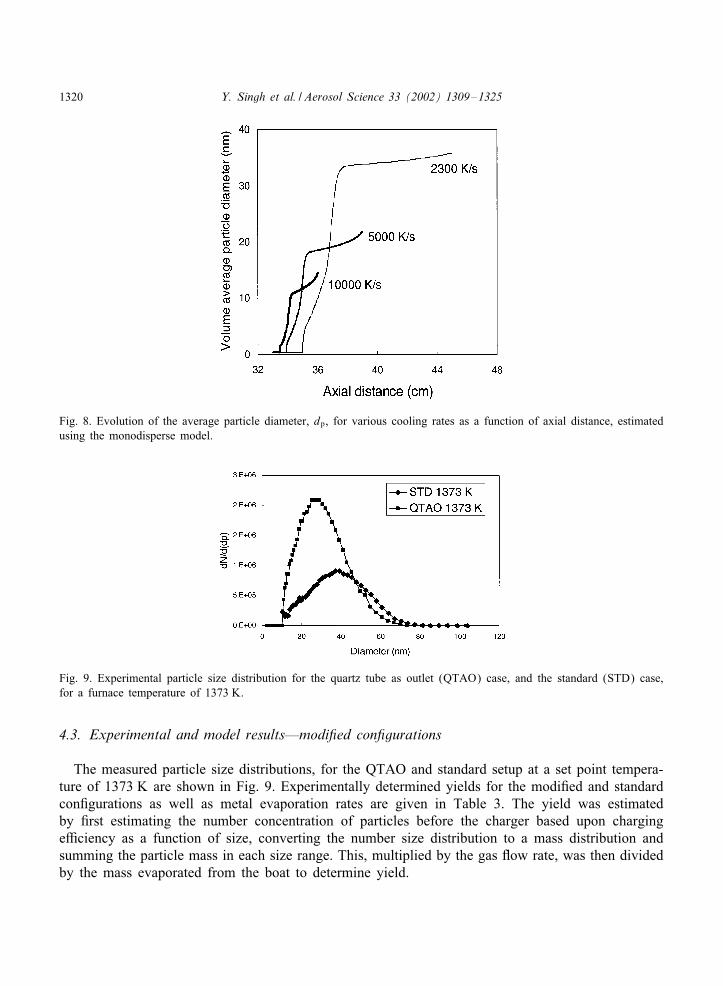
A hypothetical base case is considered in which indium vapor is generated at a rate of 8:3 ×10⁻³ mg s−1, corresponding to the experimentally measured evaporation rate for a furnace set pointtemperature of 1373 K. Three diHerent cooling rates, 2300, 5000, and 10 000 K s−1 were considered,with 2300 Ks−1 corresponding to the maximum measured cooling rate for the standard 1373 K case.Fig. 7 shows the evolution of particle number concentration, reported as number of particles perkilogram of carrier gas, for the various cooling rates. As the cooling rate increases, the particlenumber concentration increases, since an increase in the cooling rate will result in a higher rateof nucleation and a greater total number of particles formed. Correspondingly, the 3nal particlediameter, as shown in Fig. 8, decreases with increasing cooling rate. The location of the onset ofparticle formation is also aHected by the cooling rate as shown in both Figs. 7 and 8, with slowercooling resulting in particle formation occurring further downstream.
1320 Y. Singh et al. / Aerosol Science 33 (2002) 1309–1325
Fig. 8. Evolution of the average particle diameter, dp, for various cooling rates as a function of axial distance, estimatedusing the monodisperse model.
Fig. 9. Experimental particle size distribution for the quartz tube as outlet (QTAO) case, and the standard (STD) case,for a furnace temperature of 1373 K.
4.3. Experimental and model results—modi4ed con4gurations
The measured particle size distributions, for the QTAO and standard setup at a set point tempera-ture of 1373 K are shown in Fig. 9. Experimentally determined yields for the modi3ed and standardcon3gurations as well as metal evaporation rates are given in Table 3. The yield was estimatedby 3rst estimating the number concentration of particles before the charger based upon chargingeOciency as a function of size, converting the number size distribution to a mass distribution andsumming the particle mass in each size range. This, multiplied by the gas 2ow rate, was then dividedby the mass evaporated from the boat to determine yield.
Y. Singh et al. / Aerosol Science 33 (2002) 1309–1325 1321
Table 3Metal evaporation rates and estimated yields, for all runs at 1373 K
Flow con3guration Temperature (K) Rate of metal evaporated Yield (%)from boat (mgmin−1)
Fig. 10. Temperature in the cooling zone as a function of residence time, calculated based upon temperature measurementsas a function of distance, for both the standard (STD) con3guration and the QTAO con3gurations at a furnace set pointtemperature of 1373 K.
Comparing the two setups, the total particle number concentration obtained for the QTAO setupwas approximately twice the number concentration obtained for the standard setup. This result is allthe more signi3cant, considering that the evaporation rate is approximately the same. The volumeaverage particle size was also smaller, 35 nm, versus 54 nm for the standard case, as would be ex-pected since the overall yield is unchanged. The geometric standard deviation (GSD) was unchanged,1.5 for each case. It should be mentioned that, though the size distributions were not measured asa function of residence time as that was outside the limitations of our apparatus, the GSD is sim-ilar to that obtained for self-preserving log-normal distributions (Lai, Friedlander, Pich, & Hidy,1972). Fig. 10 shows temperature versus residence time, calculated from experimentally measuredtemperature pro3les downstream of the maximum temperature assuming a 2at velocity pro3le, forthe standard 1373 K and the QTAO case. As apparent in Fig. 10, the cooling rate for the QTAOcase is much greater than the cooling rate for the standard 1373 K case. Using the quartz tube as thereactor outlet increases the average velocity in the cooling region by a factor of 20. Hence, while themagnitude of the rate of change of temperature with position is slightly less than the standard case,the rate of change of temperature with time is much greater and this results in a higher nucleationrate.
1322 Y. Singh et al. / Aerosol Science 33 (2002) 1309–1325
Fig. 11. Experimental particle size distributions for the QTAB and the standard (STD) cases, for a furnace temperatureof 1373 K.
The rate of nucleation as a function of axial distance was calculated as a function of axialdistance for the QTAO case and for the standard 1373 K setup. The maximum nucleation rate forthe modi3ed setup was 2 × 10²⁰ kg−1 s−1 whereas for the standard 1373 K case, it was found tobe 2 × 10¹⁷ kg−1 s−1. Estimated nucleation rates are reported in units of per mass of carrier gasper time to allow for comparison of rates obtained for diHerent temperature histories. If the sameconcentration of vapor is condensing, a greater nucleation rate will result in a smaller average particlesize. The experimental rates of metal evaporation were approximately the same for the two setups,29:8 mg h−1 for the standard 1373 K case and 29:4 mg h−1 for the QTAO modi3cation, suggestingthe same concentration of vapor is condensing in each case, and the observed diHerences are onlydue to the diHerences in cooling rate.
Because the velocity pro3les were similar to the standard case, we used the model to predictparticle size for these experimental conditions. As done previously, a uniform velocity pro3le wasassumed, and a polynomial 3t to the measured temperature pro3le reported for the QTAO case inFig. 2 was used. From the model calculations, an average 3nal particle size of 11 nm was predicted,a much greater shift to smaller size than was observed experimentally (35 nm). Again, uncertaintyin the nucleation rate, neglecting the eHect of wall deposition, and use of only one-dimensionaltemperature and velocity pro3les may be responsible for the disagreement between the observedresults and estimates based upon theory.
Experimental results for the second modi3cation, the QTAB setup, are shown in Fig. 11. Fromthe results in Table 3, this modi3cation leads to a decrease in the metal evaporation rate, under-standable as convection over the boat decreases. At the lowest velocity ratio, 1:1, the total numberconcentration is lower than the standard case, possibly re2ecting the decrease in the amount ofavailable metal vapor because of the slower evaporation rate. This phenomena is even more obviousfor the 2:1 velocity ratio. The GSD of the size distributions also vary somewhat, larger for the 1:1velocity ratio (1.7), versus 1.5 for the 2:1 and 20:1 velocity ratios. Most notably, at the highestvelocity ratio, 20:1, there is a signi3cant increase in the total number concentration of nanoparticles,
Y. Singh et al. / Aerosol Science 33 (2002) 1309–1325 1323
approximately 2.5 times the total number concentration obtained for the standard case. Again, thisis a notable result because of the slower evaporation rate, and thus, less available metal vapor.Correspondingly, the yield is the highest for this case. It may be possible that wall losses imme-diately after particle formation are signi3cantly reduced because of the jet-like 2ow in the regionwhere nucleation is believed to occur. Considering particle size, a decrease in the volume averageparticle diameter was observed for the 20:1 velocity ratio, 40 nm versus 54 nm for the standardsetup.
The velocity, temperature, and concentration pro3les that result from this modi3cation are muchmore complex than for the previously mentioned con3gurations. It is beyond the capability of theone-dimensional model used here to describe them, but the eHects of this con3guration on the time–temperature history can be qualitatively described. As measured with a type N thermocouple, thecenter jet gas temperature at the jet outlet is, within the experimental uncertainty of the temperaturemeasurement, the same as the annular gas stream temperature for each of the velocity ratios. Thisindicates that the gas that forms the center jet has suOcient residence time in the furnace to reachthe temperature of the surrounding gas prior to exiting the quartz tube, and the jet does not actto cool the metal vapor=carrier gas mixture. The center jet initially contains no metal vapor, butas the center jet and the coaxial stream come into contact, the velocity of the gas in the outerstream adjacent to the jet will increase as momentum is transferred to it from the jet. There mayalso be some diHusion of metal vapor into the faster 2owing center jet. The result is that someof the metal vapor will experience an increased rate of cooling, and this eHect increases as thevelocity ratio increases. A drawback to this modi3cation is that it results in a broader range ofpossible time–temperature histories than either the standard con3guration or the QTAO setup, andthus, as observed here, this would not be the best approach for reducing the spread of the sizedistribution.
5. Conclusions
Variations on the evaporation=condensation method were used to alter the time–temperature historyduring the synthesis of indium nanoparticles. Particle size distributions were measured for indiumnanoparticles using both the standard and modi3ed setups. The results obtained were compared withrespect to the particle concentration and particle diameter. An increase in the number concentrationof particles and, in some cases, a signi3cant decrease in average particle size was observed whenthe modi3ed reactor con3gurations were used. The smallest average size was achieved using theQTAO reactor con3guration, but the QTAB con3guration, with the 20:1 velocity ratio, resulted inthe greatest increase in number concentration. A one-dimensional monodisperse model was used todescribe the dynamics of particle synthesis and growth and to give insight into the mechanismsleading to an increase in the number concentration and decrease in average particle size. Our modelresults suggest that the experimental observations can be attributed to the increase in the nucleationrate that arises from the steeper temperature gradient in the modi3ed con3gurations. Our experimentalobservations demonstrate that simple changes to evaporation=condensation aerosol generators willresult in a decrease in the average particle size, without sacri3cing particle yield, measured in termsof total number concentration.
1324 Y. Singh et al. / Aerosol Science 33 (2002) 1309–1325
Acknowledgements
The authors gratefully acknowledge the support of the United States National Science Foundation(grant CTS-9973845), and the Nanometer Consortium, Lund University, Sweden. J.R.N. Javier alsoacknowledges the partial support of the ASPIRE program at the University of Maryland, CollegePark. We thank Jan-Olle Malm for supplying the TEM image.
References
Becker, R., & DGoring, W. (1935). Kinetische Behandlung der Keimbildung in GubersGattigen DGampfen. Ann allen desPhysik, 24, 719–752.
Burtscher, H., Scherrer, L., Siegmann, H. C., Schmidt-Ott, A., & Federer, B. (1982). Probing aerosols by photoelectriccharging. Journal of Applied Physics, 53, 3787–3791.
CRC Handbook of Chemistry and Physics (77th ed.) (1996). Cleveland, Ohio: Chemical Rubber Publishing Co.Deppert, K., & Magnusson, M. H. (1999). Unpublished results.Flagan, R. C., & Lunden, M. M. (1995). Particle structure control in nanoparticles synthesis from the vapor phase.
Materials Science and Engineering, A204, 113–124.Frenkel, J. (1945). Viscous 2ow of crystalline bodies under the action of surface tension. Journal of Physics, 9, 385–391.Friedlander, S. K. (1977). Smoke, dust and haze, fundamentals of aerosol behavior. New York: Wiley.Friedlander, S. K. (1983). Dynamics of aerosol formation by chemical reaction. Annals of the New York Academy of
Sciences, 404, 354–364.Girshick, S. L., & Chiu, C.-P. (1989). Homogeneous nucleation of particles from the vapor phase in thermal plasma
synthesis. Plasma Chemistry and Plasma Processing, 9, 355–369.Girshick, S. L., & Chiu, C. P. (1990). Kinetic nucleation theory—a new expression for the rate of homogeneous nucleation
from an ideal supersaturated vapor. Journal of Chemical Physics, 93, 1273–1277.Gleiter, H. (1992). Nanostructured materials. Advances in Materials, 4, 474–481.Granqvist, C. G., & Buhrman, R. A. (1976). Ultra3ne metal particles. Journal of Applied Physics, 47, 2200–2219.Haas, V., Birringer, R., Gleiter, H., & Pratisinis, S. E. (1997). Synthesis of nanostructured powders in an aerosol 2ow
condenser. Journal of Aerosol Science, 28, 1443–1453.Lai, F. S., Friedlander, S. K., Pich, J., & Hidy, G. M. (1972). Self preserving particle size distribution for Brownian
coagulation in free molecule regime. Journal of Colloid and Interface Science, 39, 395–405.Lehtinen, K. E. J., Windeler, R. S., & Friedlander, S. K. (1996). Prediction of nanoparticle size and the onset of dendrite
formation using the method of characteristic times. Journal of Aerosol Science, 27, 883–896.Magnusson, M. H., Deppert, K., Malm, J.-O., Bovin, J.-O., & Samuelson, L. (1999). Gold nanoparticles: Production,
reshaping, and thermal charging Journal of Nanoparticle Research, 1, 243–251.Mahoney, W., & Andres, R. P. (1995). Aerosol synthesis of nanoscale clusters using atmospheric arc evaporation.
Materials Science and Engineering, A204, 160–164.Martinez, D. M., Ferguson, F. T., Heist, R. H., & Nuth, J. A. III (2001). Application of scaled nucleation theory to
metallic vapor condensation. Journal of Chemical Physics, 115, 310–316.McClurg, R. B., & Flagan, R. C. (1998). Critical comparison of droplet models in homogeneous nucleation theory. Journal
of Colloid and Interface Science, 201, 194–199.Panda, S., & Pratsinis, S. E. (1995). Modeling the synthesis of aluminum particles by evaporation–condensation in an
aerosol 2ow reactor. Nanostructured Materials, 5, 755–767.Phanse, G. M., & Pratsinis, S. E. (1989). Theory for aerosol generation in laminar 2ow condensers. Aerosol Science and
Technology, 11, 100–119.Pratsinis, S. E. (1988). Simultaneous nucleation, condensation, and coagulation in aerosol reactors. Journal of Colloid
and Interface Science, 124, 416–427.Scheibel, H. G., & PorstendGorfer, J. (1983). Generation of monodisperse Ag- and NaCl-aerosols with particle diameters
between 2 and 300 nm. Journal of Aerosol Science, 14, 113–126.Seinfeld, J. H. (1986). Atmospheric chemistry and physics of air pollution. New York: Wiley.
Y. Singh et al. / Aerosol Science 33 (2002) 1309–1325 1325
Smithells, C. J. (1992). Smithells metals reference book. Oxford: Butterworth-Heinman.Warren, D. R., & Seinfeld, J. H. (1984). Nucleation and growth of aerosol from a continuously reinforced vapor. Aerosol
Science and Technology, 3, 135–154.Winkelmayer, W., Reischl, G. P., Lindner, A. O., & Berner, A. (1991). A new electromobility spectrometer for the
measurement of aerosol size distribution in the range from 1 to 100 nm. Journal of Aerosol Science, 22, 289–296.Xiong, Y., & Pratsinis, S. E. (1991). Gas phase production of particles in reactive turbulent 2ows. Journal of Aerosol