Approaching Sustainability Holistically: How Investors and Brands Can Make Progress on Key Issues Together Paul Herman , HIP Investor Ratings + Portfolios @hipinvestor Evan Harvey , Nasdaq @NASDAQ Jackson Robinson , Trillium Asset Management @TrilliumAM Be sure to engage in the app: sb16app.com 1) Check into the session by selecting session from the program and selecting 'check in' 2) Pose and 'up-vote' questions to be posed during Q&A: In session description, select 'submit a question'
What Does ESG Mean?Limiting the data spectrum to realistic deliverables
SOURCE:BrownFlynn,2015
ESG Disclosure Guidance
How does Nasdaq define ESG data?Better labels = clearer expectations
3
It is important to note that while this document primarily uses the term “ESG” because it is commonly used among investors, the term “sustainability” is used interchangeably as it is more common among companies. While subtle nuances exist, for the purpose of this guidance, both terms are seen as encompassing the broad set of environmental, social and governance considerations that can impact a company’s ability to execute its business strategy and create value.While ESG factors are at times called non-financial, how a company manages them undoubtedly has financial consequences. ESG factors create real impacts upon:
ESG Disclosure Guidance
Access to capitalCost savings and productivityRisk managementRevenue growth and market accessBrand value and reputation
License to operateHuman capital managementEmployee retention and recruitmentMergers and acquisitionsNew product and service innovation
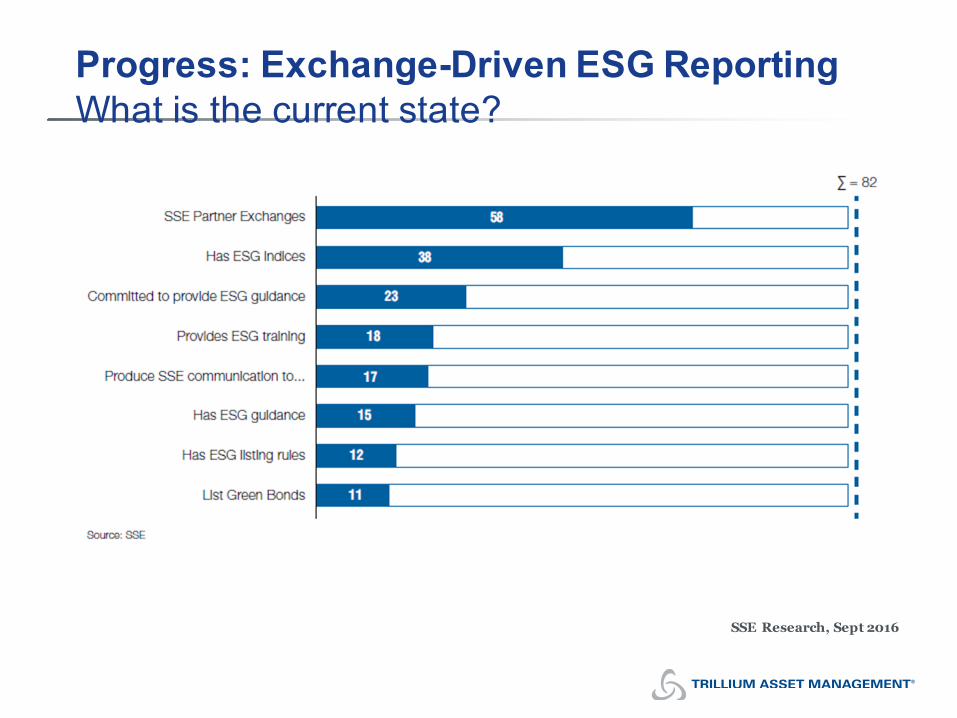
Progress: Exchange-Driven ESG ReportingWhat is the current state?
4 ESG Disclosure Guidance
SSE Research, Sept 2016
A Mix of Rules, Guidance, and Commitments40 (of 82) exchanges are leading the way
5 ESG Disclosure Guidance
SSE Research, Sept 2016
Defining the LandscapeNasdaq recommends disclosure of these ESG metrics
6
This list includes 33 indicators across three broad categories. E, S, and G concerns are given equal weight. This list purposely includes all 7 of the “first generation” sustainability metrics valued by Corporate Knights and other ratings entities.ENVIRONMENTAL (E) SOCIAL(S) CORPORATEGOVERNANCE (G)
Stock exchanges have been asked (by the UN and PRI) to create corporate reporting guidance and other tools that specifically address these five SDGs. Doing so would significantly increase global chances of achieving 2030 targets.
Sidebar 2: Global Regulatory Actions
8 ESG Disclosure Guidance
Virtually every market regulator is active in the sustainability debate. This has been driven by demand from investors, governments, NGOs, and citizens. Some regulators have already created ESG disclosure requirements; others are investigating the right way forward.
Note: SEC Reg S-K. Of the 227 original comment letters, 66% discussed sustainability disclosures. This is pretty remarkable, considering that only 3.2% of the Concept Release (11 of 341 pages) discussed sustainability disclosure. SASB
Cumulative Total Shareholder Return (TSR) over 10 Years
* Total Shareholder Return includes reinvested dividends and price appreciation. From Dec 31st 2005 to Dec 31st 2015.Source: Great Place To Work ®; Thomson Reuters; HIP Investor analysis and portfolio modeling
No.Empl. FirmsGPTW Medium 100-999 22GPTW Large 1000+ 93
• Drinking water safety, including nitrate and fluoride
• Level of EPA violations
14 of 40 EARTH points:
• Treatment technique• Leakage• Per-person
water use• Use of recycled water
2 of 10 EQUALITY points:
• Gender diversity of the Board and executive management
60%
WATER UTILITIES:CITY OF SAN DIEGO WATER = 60%
30
K-12 Muni Bond Issuers: Advance High Rated K-12’s with Low Income to Continue their High Impacts
31
K-12 Muni Bond Issuers: Fund High Rated K-12’s with Low Income to Seek Better Impacts
32
CITIES: Household Income and Impact Ratings Correlate, but Impact Depends on Management
33
HOSPITAL SYSTEMS: Household Income and Impact Ratings Correlate, but Impact Depends on Mgmt.
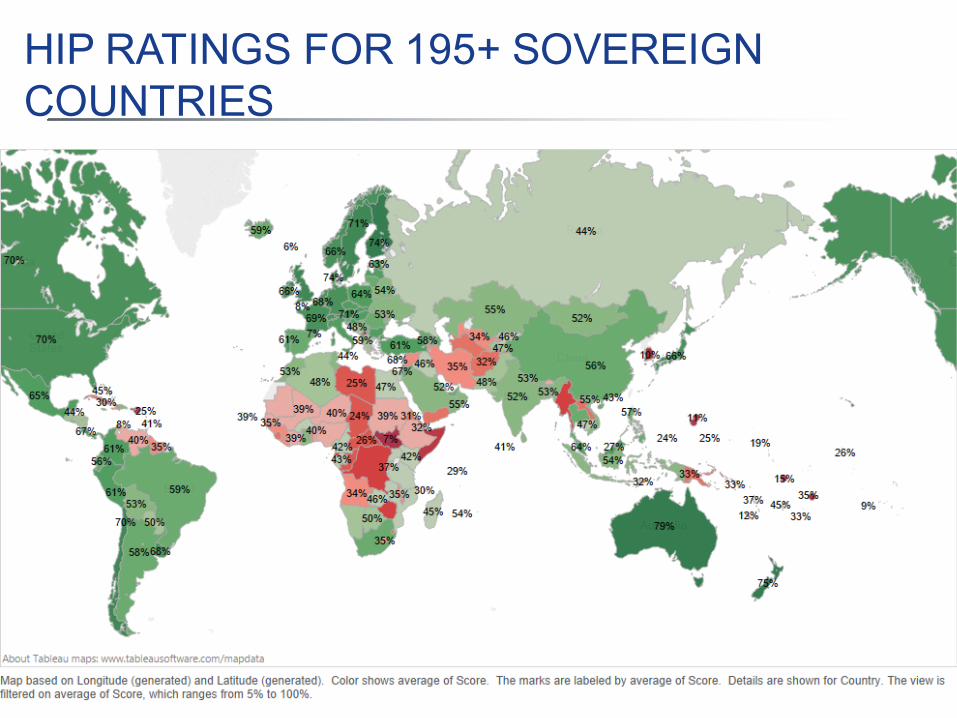
HIP RATINGS FOR 195+ SOVEREIGN COUNTRIES
34
COUNTIES IN CALIFORNIA
35
CITY IMPACT CATEGORIESCity of Seattle = 70%
15 of 25 WEALTH points
•Median Income•Affordability of
Housing•Vacant Houses•Unemployment
•Poverty
21 of 25 HEALTH points:
• Obesity/Diabetes• Crime Rate
• Graduation Rate• Health Insurance
Coverage
75%15 of 25 EQUALITY
points:• Gender Diversity
& Ethnicity Reflected in
Business Ownership
WEALTH25%
EQUALITY25%EARTH
25%
HEALTH25%
70%
19 of 25 EARTH points:• Commuting
Method &Time Duration
HIP HEALTH PILLAR HIP WEALTH HIP EQUALITY
St County MetroAreaOverall
HIP Rating
Diabetes Rate
Adult Obesity
Rate
V iolent Crime Rate
Murder Rate
Grad Rate High
School
Grad Rate
College
% Living in Poverty
Occupied (not vacant)
Housing
Women Ow ned
Businesses
African American Population
African American Ow ned
BusinessesMD County of Anne Arundel Baltimore 58.3% 8% 28% 561 3.5 91% 37% 6% 93% 31% 15% 9%MD County of Baltimore Baltimore 54.1% 9% 27% 538 2.5 90% 35% 10% 92% 31% 26% 17%MD County of Carroll Baltimore 57.4% 8% 28% 207 2.4 91% 32% 6% 96% 27% 3% 2%MD County of How ard Baltimore 61.7% 8% 25% 577 - 95% 60% 4% 96% 30% 17% 15%MD County of Montgomery Baltimore 57.9% 8% 25% 193 2.1 92% 57% 7% 95% 26% 17% 3%MD County of Prince George Baltimore 53.5% 11% 34% 708 10.5 85% 30% 9% 92% 38% 63% 55%MD County of Frederick Baltimore 62.2% 8% 27% 312 1.3 92% 38% 6% 95% 31% 8% 6%MD County of Harford Baltimore 58.6% 9% 30% 347 2.5 92% 33% 7% 94% 34% 13% 9%MD City of Baltimore Baltimore 44.7% 12% 32% 1,405 34.9 80% 27% 24% 82% 37% 63% 35%US USA Average National * 8% 27% 405 4.8 86% 29% 16% 87% 29% 13% 7%
* The median of HIP Ratings calculated for Cities is 52.8%, for Counties is 53.5%, and for States is 49.5%; HIP Ratings cover more than 350 cities, counties and states.HIP Ratings are comprised of the Pillars of Health, Wealth, Earth, Equality and Trust. Selected pillars and metrics are show n above.Each column is color-coded: GREEN for leaders in ratios, YELLOW for average ratios, RED for laggards in ratios
The Wire: Impacts of City of Baltimorevs. surrounding Maryland Counties
37
SRI, ESG AND IMPACT APPLY ACROSS ALL ASSET CLASSES
qGenerate after-tax INCOME of $__MM annually, through conservative to moderate investment choices (the majority from fixed income, corporate bonds, sovereign treasuries, real estate investment trusts [REITs], and dividends from preferred and common stocks).
qLower the RISK of principal loss through diversification across multiple asset types and seek protection against potential inflation (e.g. TIPS: Treasury Inflation Protected Securities; baskets of commodities, including gold and silver; real estate and REITs; investments that generate income within 18 months of committed capital; and consideration of hedging, including options).
qSeek higher positive-IMPACT investments across all asset types (e.g. cash, fixed income, public equity, private equity, real estate, etc.). Using the HIP (Human Impact + Profit) Scorecard evaluation tools, target a 100% invested for impact by 2020. Today, the portfolio’s weighted average HIP Score is __%.q All of our investments need to minimize the negative impact on all people and the planet.
qTarget competitive investment PERFORMANCE versus appropriate benchmarks, calculated on a pre-tax basis, relative to similar risk investments: q According to the Strategic Plan’s goals, the portfolio seeks a five-year average annual appreciation of 8%
nominal returns. Expected tax rate of 35%, we seek 5% after-tax annual returns.
qRationale for Impact Investor:q Liquidity, Doing well and doing good, Wealth preservation, Diversification, and Moderate capital