Energy Value (blue) is the LMP times the DG output
Market Price Response (yellow) is the total load times the change in LMP • Quantified for each
hour of the year.
• Limit to a few years (capacity market will adapt).
5
(LMP)
Capacity Value
May be computed for either (1) individual resource or (2) for the “distributed solar fleet” which reflects diversity of location and design
Different technologies will have different production profiles, and consequently different measures of “effective” capacity, e.g.: • Solar follows the sun • Storage would be dispatched to maximize bill savings
Determine effective capacity • Can use PJM’s rules for intermittent resources (average summer power
output between 2 pm and 6 pm) • Or, use other metric (e.g., average output in top 100 hours)
Apply cost of capacity (e.g. peaking resource)
6
Roadmap (Example from Maine PUC study: Components may be different in Maryland)
7
25 Year Levelized ValueGross
Value
Load
Match
Factor
Loss
Savings
Factor
Distributed
PV Value
A × B × (1+C) = D
($/kWh) (%) (%) ($/kWh)
Avoided Energy Cost C1 LSF-Energy V1
Avoided Gen. Capacity Cost C2 ELCC LSF-ELCC V2
Avoided Res. Gen. Capacity Cost C3 ELCC LSF-ELCC V3
Avoided NG Pipeline Cost C4 LSF-Energy V4
(Solar Integration Cost) (C5) LSF-Energy (V5)
Transmission
Delivery
Service
Avoided Trans. Capacity Cost C6 ELCC LSF-ELCC V6
Avoided Dist. Capacity Cost C7 PLR LSF-Dist V7
Voltage Regulation C8 V8
Net Social Cost of Carbon C9 LSF-Energy V9
Net Social Cost of SO2 C10 LSF-Energy V10
Net Social Cost of NOx C11 LSF-Energy V11
Market Price Response C12 LSF-Energy V12
Avoided Fuel Price Uncertainty C13 LSF-Energy V13
Total
Other
Energy
Supply
Distribution
Delivery
Service
Environmental
Additional Resources
Minnesota Value of Solar Tariff Methodology
• Developed by CPR for Minnesota Dept. of Commerce, approved by Minnesota PUC
storage adds $0.08/kWh to paired distributed solar PV• Assumes 50% RPS + locational marginal avoided cost
value multiplier
18
Initial Principles on DER Valuation• Enable stacked values for DERs
• Simultaneous provision of wholesale market and distribution system benefits
• Specifying value of grid needs is better than specifying value of technologies• Enable open access—create technology-neutral performance requirements for DER
offers to compete on merit
• Evaluate offers using best-fit, least-cost methods that incorporate stacked value
• DER capacity value increasingly depends on storage, which has:• Temporal characteristics—when DER is most needed
Affordable, renewable, resilient, reliable grid that gives consumers choices
Requires a new approach to the grid
Appreciate that PSC may initiate such a proceeding in Maryland
Overview regarding net metering
There is no utility death spiral. Net metering does not add significant cost at low levels of penetration and has many benefits.
Proposals to change net metering in the near term are hasty, ill-considered, unfair, and unnecessary. Higher connection charges, being imposed in some places, are an egregious example.
Net metering should continue and be extended to community solar In Maryland so that low-income households and others can benefit from it.
Change in net metering should be in the context of a transition to a more resilient, distributed, emissions-free grid with open access for consumers to become producers and transparency of the grid to all parties. Grid neutrality principles, recently articulated by former FERC chairman and co-authors should form part of the starting point.
There is no utility “death spiral”
Despite alarms regarding grid defection, there is no “death spiral” –former FERC chairman Jon Wellinghoff and co-authors called it a “red herring” in a recent article. (Note 1)
Lawrence Berkeley Lab estimated rate impact at 2.5% net metered solar penetration in a northeastern utility (Massachusetts example) where generation is deregulated: 0.2 percent. (Note 2)
Maryland currently has much less than 1% net metered solar PV. It has only an overall 2% solar RPS carve out by 2022.
By this measure, the typical residential bill impact of net metered solar in Maryland at present should be remain small for some years though the specific percentage bill impact may be different than the example in the study.
Net metering change is premature
The direct cost of net metering is low and will remain so for some time. There is no utility “death spiral” in Maryland.
One premise of increased connection charges is that solar rooftop homes still have capacity needs, an opinion held Exelon’s CEO Chris Crane. (Crane 2014, Note 3)
But McMansions also have high capacity needs. They are not charged more for 200-amp service (Mr. Crane’s example). As you know, a flat fee applies generally. For instance, in Pepco territory it is for service up to 400 amps. (Note 4) There is usually no charge for service upgrades.
Hostility to net metering is generally based on private, not public, interest.
A low estimate for value of solar is the wholesale price of electricity (Mr. Crane’s example). It is oriented exclusively to private corporate interest. This is contrary to a central principle of grid neutrality. It even ignores the significant reduction in distribution losses that accompanies rooftop solar, especially at low penetrations.
The high estimates are in a study by the Maine PSC: 18 cents in the first year and 33 cents per kWh in the long-term. (Note 5) Both are comfortably more than Maryland residential rates. Note that in this estimate, the value of solar is variable: it increases from the first year as various benefits such as elimination of fuel price uncertainty increase.
Maine PSC Value of Solar – Year 1
Maine PSC Value of solar: Long-term
Net metering recommendations for the next several
years
Maintain net metering limit at least to its present 1,500 MW limit
Initiate grid of the future proceedings as a complement to this distributed energy PC 40 effort.
Initiate action to ensure net metering is inclusive of low-income households beyond the pilot community solar program. Low-income people have been almost totally shut out of roof top solar. The vast majority cannot benefit from it directly. Community solar legislation is far off.
Give solar access to low-income households. IEER’s Energy Justice report shows that a community choice aggregation solar program for all recipients of electricity bill assistance can provide universal solar access and reduce costs of assistance at the same time. (Note 5)
Long-term context
Consider value of solar and changes in present net metering policy only within the context of:
Adopting of grid neutrality principles
Making the grid transparent to small scale solar producers and consumers
Establishing a path to a distributed, resilient, emissions-free (or nearly so) grid
Considering system benefits and costs in the presence and absence of distributed storage and ownership of that storage
Including health and other social and economic benefits accompanying distributed solar, including the reduced pollution and the potential for more well-paying local jobs along with the costs that distributed solar creates for the grid (for serving as its storage)
Net metering: short and long-term
Net metering OK in the present stage of the grid
Change as we become closer to this stage of the grid
Grid Neutrality Principles
Hu, Kann, Tong, and Wellinghoff have proposed the following:
Empower the consumer while maintaining universal access to safe, reliable electricity at reasonable cost
Demarcate the boundary between public and private interests; protect the “commons”
Align risks and rewards across the industry
Create a transparent, level playing field
Foster open access to the grid to parties who meet system-wide standards.
I would elaborate somewhat on the last point:
Foster open access that is not discriminatory to small-scale producers and consumers, including low-income households and small businesses who do not have suitable rooftops for solar installations.
And add:
Establish resilience at reasonable cost, with a stress on renewable microgrids
Ensure compatibility with an emissions-free (or nearly so) electricity system in the long term (2040-2050)
Implications for net metering
Net metering is approximately aligned with some grid neutrality principles: it empowers consumers to become producers, creates open access, though it is still very limited in the absence of community solar.
Neither utility nor distributed solar producer has actionable information for optimizing costs and benefits when it concerns behind-the-meter systems. In other words, despite “smart meters” there is a marked lack if transparency,
Transparency of the commons to all parties is essential if its demarcation is to be equitable and subject to democratic processes.
Maryland has some advantages
Having come late to solar relative to other leading states, Maryland has the time to develop and adopt grid neutrality principles over the next few years along with other changes needed for a grid of the future.
Promotion of smart appliances, real-time information for consumers while protecting privacy and security is an important priority. This is a large part of the technical basis on which grid neutrality can be created.
Complete grid transformation can be done by 2050. Electricity needs will grow even
with efficiency increases. Transport and HVAC will need to be efficiently electrified to
achieve a low-emissions energy sector
Conclusions
Maintain net metering for distributed solar at least to its 1,500 MW limit
Expand solar access for low income households
Include grid neutrality principles in PC 40.
Change in net metering should be in the context of long-term needs for a resilient, affordable, emissions-free grid with far more distributed resources and adoption of grid-neutrality principles.
Individuals must have much more transparency - and the technical means to take advantage of it.
There is plenty of room in the transition to the future grid for individuals, workers, and businesses, including utilities, to benefit. Specifically, even with efficiency, electricity requirements will grow considerably since a low-emissions energy future will require efficient electrification of most HVAC and transportation.
IEER will be submitting materials for the PC 40 record in the coming weeks.
David J. Collins, Executive Secretary Public Service Commission of Maryland William Donald Schaefer Tower 6 St. Paul Street Baltimore, MD 21202 October 20, 2105 RE: PC 40 IN THE MATTER OF THE INVESTIGATION INTO THE TECHNICAL AND FINANCIAL BARRIERS TO THE DEPLOYMENT OF SMALL DISTRIBUTED ENERGY RESOURCES TOPIC: “Appropriate Valuation Factors for Small Distributed Energy Resources”
Who is MD SUN
My name is Corey Ramsden and I am the Program Director for MD SUN. MD SUN is a non-profit effort of the Community Power Network dedicated to increasing equitable and universal access to renewables throughout the state of Maryland. We do this in part by organizing residents into solar co-ops, or bulk purchase programs, to use their collective buying power to get a discount when they go solar.
In addition to our direct solar co-op efforts, we maintain a lively network of solar homeowners, installers, and other stakeholders through a newsletter mailing list of nearly 1300 and an email listserv of 425 members discussing solar topics like technology questions, utility net metering billing problems, and future legislative and regulatory priorities.
Participants in our solar co-ops typically see up to a 20% discount and gain the support of the group as they navigate the process. So far in 2015 we have launched nine solar co-ops throughout the state and engaged over 1000 homeowners through our group and public education work. As a result of those efforts, more than 600 homeowners joined our groups with 140 of them going solar so far. We’ve seen a contracted capacity of approximately 870kW in 2015 and we expect to reach 1MW by the end of the year.
Through the solar co-op model, group members have helped to bring revenue and jobs to Maryland’s economy while working with seven different solar installation companies to date. By their collective action, these homeowners delivered an estimated $2.5M in sales to these local businesses.
Net Metering works
As part of our work, MD SUN conducts public information sessions all over the State. These sessions last 1.5 to 2 hours and cover solar technology, net metering, our solar co-op process, and solar economics. When we discuss the economics for a residential homeowner we start with the incentives such as the federal tax credit, the Maryland Clean Energy Grant, and the value of Solar Renewable Energy Credits. We purposefully leave the benefit of the solar array’s generated electricity impact on their utility bill for last. By the time we get there we stress the long-term value it represents. People get it. They understand that the cost of what they used to
consume from the utility is now being credited back to them at the same value or they avoid that cost altogether when solar production and load coincide within the home. In short, net metering is working as a means to encourage and to compensate system owners and people understand it.
Low-income access
Unfortunately, the direct benefits of solar ownership are only available to homeowners in Maryland with a good property for solar, sufficient cash or good credit. This leaves the majority of Maryland residents unable to participate.
Because of this reality, MD SUN and others organizations like GRID Alternatives are working to enable broader access to solar for Maryland’s low-income residents. The need is great. According to the Home Energy Affordability Gap Study1, the average Maryland resident pays 8% or less for energy as a percentage of their total income. For low-income residents, their energy burden can be as high as 40% of their total income with many seeking publicly funded energy assistance dollars to help pay energy bills.
Through the work of GRID Alternatives, a non-profit that works exclusively to install solar and create jobs in low-income communities, we see that low-income focused solar programs demonstrate the potential to help low-income energy consumers reduce their energy-related costs on an ongoing basis. Distributed photovoltaic solar has an immediate economic impact for these homeowners, providing financial savings that can be used on other essential needs.
As the community solar pilot comes online in 2016 we look forward to expanding access to these benefits to all Maryland residents and in particular, low-income residents. To make projects economically viable for these participants we encourage no less than the full retail rate (including generation, transmission, and distribution) for shared energy credited to a subscriber of a community solar array. Anything less provides yet another technical and financial barrier that reduces the value low-income participants receive from small, distributed energy resources.
What comes after Net Metering?
From studies in other parts of the country from Maine2 to Minnesota3 to Nevada4, it’s becoming clear that a value of solar approach will show an even greater value for solar to the electricity network than what is currently delivered through net metering. We support giving careful consideration to a proper valuation of solar and other distributed energy resources in future rate designs.
1 Home Energy Affordability Gap, Fisher, Sheehan, & Colton. http://www.homeenergyaffordabilitygap.com/03a_affordabilityData.html; 2 Clean Power Research, LLC, Maine Distributed Solar Valuation Study, page 6. http://www.nrcm.org/wp-
These are important questions and we encourage the Commission to consider them in a deliberate manner so as not to create undue market disruption. For the time being, net metering is working and appropriate to keep the market growing and to keep us on the path toward meeting 2020 RPS goals.
In closing
Thank you for providing me with the opportunity to present comments here today and to have them entered into the record. We look forward to continued participation in the efforts of this Commission to properly value the contributions of distributed energy resources to Maryland’s electricity network, its economy, and most importantly to all Maryland residents.
• Minnesota, one of the first states to conduct this type of analysis, adopted legislation defining the value of solar as “the value to the utility, its customers, and society for operating distributed solar photovoltaic resources interconnected to the utility system.”
Staff Briefing Papers. Minnesota Public Utilities Commission. August 2014.
• Components:
– Avoided energy costs (general agreement on these): Avoided supply costs, avoided generation capacity, avoided system losses, and avoided transmission and distribution capacity
– Ancillary services (more debate on these): grid support services, avoided financial risk, reliability and resiliency, and societal impacts (environmental and economic development)
– Local factors (highly variable): level of solar penetration, fuel mix, weather patterns, generation fuel mix of geographic area, interconnection location of distributed solar system on the grid, utility market structure
Connecticut Academy of Science and Engineering, for Connecticut General Assembly.
Click to edit Master title style
• Click to edit Master text styles
– Second level
• Third level
– Fourth level
» Fifth level
3
Key Benefits of Distributed PV
3
• Avoided costs
– Generation
– Lower losses throughout transmission and distribution system
– Avoided future capital costs in transmission and distribution – especially if locations are chosen with this in mind.
“If a more distributed grid architecture becomes favored, as appears to be the case in New York, some expensive transmission projects have the potential to become stranded cost to ratepayers, who bear the ultimate risks. Beginning to integrate increased levels of distributed energy resources may inform and, by potentially deferring traditional transmission and distribution investments, even reduce the cost of grid modernization if Connecticut were to follow a similar path.” (Connecticut Academy of Science and Engineering)
• Grid resiliency – Decentralization can help isolate regional issues – NY REV micro-grids as outgrowth of CDG
• Reduction in financial risk – Reduces demand on volatile fuels sources; hedge against volatility
• Haven’t even talked about benefits relating to climate change, air pollution, local jobs…
Click to edit Master title style
• Click to edit Master text styles
– Second level
• Third level
– Fourth level
» Fifth level
4
Texas – Austin Energy (CPR)
4
Source: Clean Power Research
• This is the actual value of solar tariff for Austin program
• Value computed is almost the same as retail price (11 cents)
• Decline in natural gas pricing
• Lower loss savings
• Higher transmission savings
• No “societal” environmental benefits (though successful Green Choice Program indicates willingness to pay)
Click to edit Master title style
• Click to edit Master text styles
– Second level
• Third level
– Fourth level
» Fifth level
5
Massachusetts (Acadia)
5
Source: Acadia Center
• Looking ONLY at sum of avoided costs, VOS roughly same as average retail rates
• VOS much higher than retail once demand response induced price effects and environmental benefits taken into account
Click to edit Master title style
• Click to edit Master text styles
– Second level
• Third level
– Fourth level
» Fifth level
6
Nevada (NPUC)
6
• Net cost to participants of net metering
• Net benefit to NON-participating rate-payers
• Shift due to reduction in state cash incentive and significant avoidance in RPS costs to utility
• 2016 and onward, NPUC expects net-neutral cost shift between participants and non-participants
Source: Nevada Public Utilities Commission
Click to edit Master title style
• Click to edit Master text styles
– Second level
• Third level
– Fourth level
» Fifth level
7
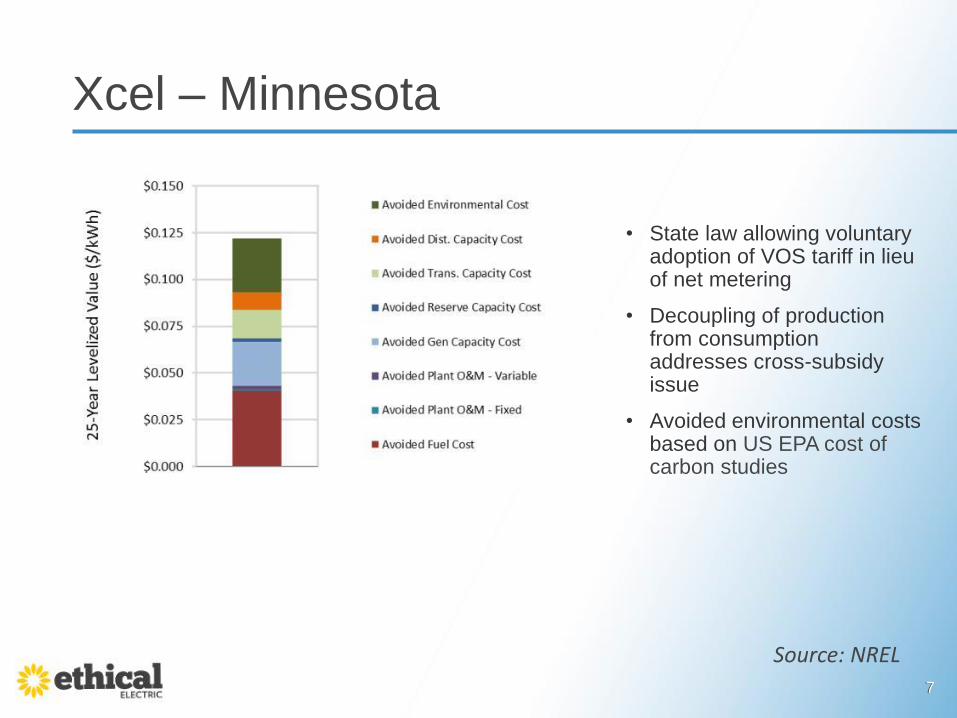
Xcel – Minnesota
7
• State law allowing voluntary adoption of VOS tariff in lieu of net metering
• Decoupling of production from consumption addresses cross-subsidy issue
• Avoided environmental costs based on US EPA cost of carbon studies
Source: NREL
Click to edit Master title style
• Click to edit Master text styles
– Second level
• Third level
– Fourth level
» Fifth level
8
Maine PUC (CPR)
8
• Direct avoided costs very close to retail price (14.5 cents), even with no distribution benefits
• Value of solar much greater when including DRIPE benefits, avoided environmental costs, and fuel price volatility reduction
Source: Clean Power Research
Click to edit Master title style
• Click to edit Master text styles
– Second level
• Third level
– Fourth level
» Fifth level
9
RMI “Meta-Study”
9
• Meta-study looked at a dozen studies performed around country
• Once high/low outliers removed, all VOS studies came in between 12-20 cents/kW-hr
• Similar range as retail rates
Source: NREL
Click to edit Master title style
• Click to edit Master text styles
– Second level
• Third level
– Fourth level
» Fifth level
10
2015 Compilation of VOS Studies
10
Source: Frontier Group
• Compilation completed last summer
• Retail rates
– Range: 10-16 cents
– Average: 12 cents
• Value of Solar
– Range: 4-34 cents
– Average: 18 cents
• Averages not “relevant”, but indicative
Click to edit Master title style
• Click to edit Master text styles
– Second level
• Third level
– Fourth level
» Fifth level
11
What to do with all this?
• Obviously there is great variance in the studies
– Super sunny states (NV) vs. not-so-much (ME)
– Rooftop vs. Community
– Different fuel mixes vary by region
– Load congestion
– Many other regional effects
• But generally they are at or above the retail rate…
11
Click to edit Master title style
• Click to edit Master text styles
– Second level
• Third level
– Fourth level
» Fifth level
12
What’s Right for Maryland?
• To do what’s right for Maryland, do a Maryland study
• While we are studying it, adopt retail net metering credits for pilot
• After all, net metering has been a good proxy
– Simple market approach – this is what MD residents already get for rooftop
– Energy goes in and energy goes out. Residential consumers are all paying retail rate. Electricity generated by community solar can be sold at full retail rate.
– Yes, community solar does use part of distribution grid. On other hand, can take advantage of this and incentivize areas of congestion. NY is doing this thru opportunity zones.
– Fairness – if we use lower rate then we are discriminating against people that can’t go solar, which is most of the population – low income, renters, shaded neighborhoods, etc…
• When study is done, adopt conclusions for reasonable period of time,
and re-assess VOS periodically – CT has embarked on this approach
12
Click to edit Master title style
• Click to edit Master text styles
– Second level
• Third level
– Fourth level
» Fifth level
Thank You!
PC 40: Small Distributed Energy Resources
Appropriate Valuation Factors for
Small Distributed Energy Resources
Presented by: William M. Gausman
October 20, 2015
2
Appropriate Valuation of Customer-Sited DERs
Energy Supply Cost Reductions
Transmission and Distribution System Costs and
Benefits
Societal Benefits
Key Issue to Equitable and Sustainable Valuation:
Rate Designs that Recognize Both Cost and Benefits and
are Based On Economic and Technical Facts
3
Energy Supply Cost Reductions
Supply-Related Benefits
• Reductions in Energy Supply Requirements
– LMP including Energy, Congestion and Losses
• Possible Reductions in Capacity Requirements
– Capacity credit limited due to intermittent nature of DERs. Any benefits
should be credited on the supply side
• Ancillary Services Impacts
– For the most part intermittent resources do not currently provide Ancillary
Services and actually increase Ancillary Services requirement
Benefits that accrue to the DER Customer
– Lower energy requirements otherwise provided by Energy Supplier
– Price Risk Management (Fixed Price)
4
Transmission and Distribution Potential for Avoided Transmission and Distribution Costs
– Utility planning must be based on peak system and equipment loading
– In most cases peak loading is not coincident with peak solar generation
– The utility must be able to handle full customer loads anytime a momentary takes PV off line
– System must handle full load pick up since DER restoration is delayed after grid is restored – full load available without benefit of DER
Distribution System Upgrade Costs – Customers currently pay for cost of interconnection
– With increased DER concentrations, distribution upgrades and redesigns will be required
– In many instances, it will not be feasible to determine which DER customer driving the need for an upgrade – it is the impact of many DER installations
– New rate design mechanisms will have to be considered to allocate costs
– In any event, these costs reduce the value of any benefits that specific DER installations may otherwise provide to the T&D system
Additionally, DR, EE, and economic conditions also are reducing demand
growth – absent very complicated customer by customer rate design, new policies, cost allocation and rate design principles are needed for the 21st Century grid
5
Aggregate View for Peak Load – All Pepco NEM Customers’ Combined DER Reduces Load, but Solar Peak and System Peak Are Not Coincidental
(10,000.0)
(5,000.0)
-
5,000.0
10,000.0
15,000.0
20,000.0
25,000.01:0
0
2:0
0
3:0
0
4:0
0
5:0
0
6:0
0
7:0
0
8:0
0
9:0
0
10
:00
11
:00
12
:00
13
:00
14
:00
15
:00
16
:00
17
:00
18
:00
19
:00
20
:00
21
:00
22
:00
23
:00
0:0
0
kW
Pepco Combined NEM July 2, 2014
Load
Generation
System Summer Peak @ 17:00
(10,000.0)
(5,000.0)
-
5,000.0
10,000.0
15,000.0
20,000.0
25,000.0
1:0
0
2:0
0
3:0
0
4:0
0
5:0
0
6:0
0
7:0
0
8:0
0
9:0
0
10
:00
11
:00
12
:00
13
:00
14
:00
15
:00
16
:00
17
:00
18
:00
19
:00
20
:00
21
:00
22
:00
23
:00
0:0
0
Pepco Combined NEM February 20, 2015
Load
Generation
System Winter Peak @ 08:00
kW
6
Valuing and Accounting for Cost and Benefits to the
Distribution Grid from Customer Provided DERs
Determining the value of the DER resource is locational dependent and allows for: • Investments to be optimized through a better understanding of hosting capacity
and locational DER benefits – Utilities can assess whether they can avoid or defer investments through DERs
– Utilities can assess the need for system upgrades to accommodate aggregate DER
Compensate/credit for the value that DERs bring to the distribution grid needs to be based on specific characteristics • Location – can DER defer or relieve overload or increase capacity
• Dispatch/Control – need for advance inverter functionalities operated by the Utility
• Voltage support – will local grid operate within COMAR limits
State Policy will need to determine when it makes sense to undertake integrated DER process, identify method to determine cost and benefits and how to socialize T&D costs and benefits arising from DER
Location of the DER and Fact-Based Evaluation of Costs
and Benefits to the Grid are Key to Grid Value
7
Societal Benefits of Customer-Sited DERs Societal benefits of customer provided DERs might include:
• Lower Air Emissions
• Lowered Global Warming Impact
• Health Benefits
• Job Creation
• Land and Water Use Benefits
• Energy Security
Societal benefits are difficult to quantify and have not been traditionally incorporated into electric rates (supply, transmission, distribution)
Societal benefits are one justification for assigning value to at least some of the methods that already exist: • Renewable Energy Credits
• Grants
• Investment Tax Credits (ITC)
Societal Benefits Should be Compensated Transparently
Through Stand Alone Incentives and Not Through T&D
Rates
8
DER Customers Connected to the Grid
Should Pay their Fair Share of Grid Costs Benefits to DER customers by staying connected to the grid
• Supply/Demand Balancing (Off-grid DER customers must pay for storage and start up capacity)
• Resell energy during periods of excess generation and deliver energy during periods of deficient generation
• Back-up service when on-site generation is unavailable
• Provide voltage and frequency control services and maintain high power quality
Grid-connected DER customers benefit throughout the year even it they are net zero energy use for the year!
Could DER customers self-supply these services and sever ties with the grid? • Yes, but will incur significant capital costs and bear the risk of battery leakage and
other maintenance issues and costs
The Distribution Grid Provides Significant
Value to Customers with DERs
9
Appendix
10
What is Hosting Capability
The hosting capacity analysis is designed to give an indication of how much PV can be added to a feeder before problems are likely to be encountered causing undesirable effects on voltage or power flow
The hosting capacity study represent a wide variety of PV interconnection scenarios to identify at what level violations start to occur
All of these violations are checked at the minimum daytime load point with the PV output at clear sky output values
Some of the factors tested for during the analysis:
• voltage violation
• voltage flicker
• voltage regulator and capacitor that would cause considerable additional controller movement
• reverse flow violation
• feeder current imbalance
• all system components were checked for overload conditions
11
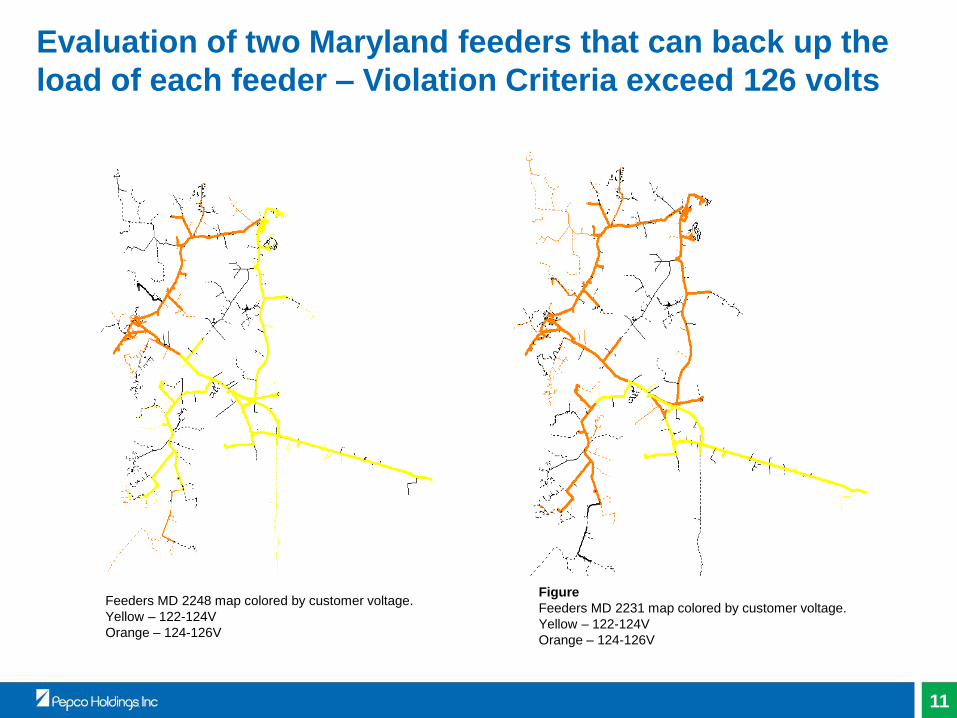
Evaluation of two Maryland feeders that can back up the
load of each feeder – Violation Criteria exceed 126 volts
Figure
Feeders MD 2231 map colored by customer voltage.
Yellow – 122-124V
Orange – 124-126V
Feeders MD 2248 map colored by customer voltage.
Yellow – 122-124V
Orange – 124-126V
12
NEM Bill Characteristics
NJ DE MD DC
Max size 100% 110% 200% 100%
Excess
generation
treatment on
bill
Monthly kWh
credit with an
annual payout
Monthly kWh
credit with an
annual payout
Monthly kWh
credit with an
annual payout
Monthly credit
What the
monthly kWh
credit covers
Only kwh based
charges
Only kwh based
charges
Only kwh based
charges
Anything on the
customer bill
Annual payout
price base
Average LMP Average SOS or
TPS retail rate
for energy
Average SOS or
TPS retail rate
for energy1
Monthly –
Distribution kWh
rate (< 100 kW
capacity), SOS
or TPS retail rate
for energy
Note: For MD and DE Customers on TOU rates, the credits are based on the TOU rate. 1We request the actual rate from the TPS, who is not obligated to tell us that information,
frequently we are paying the average SOS rate even if it’s higher.