APPROVAL SHEET Title of Thesis: Group recognition in social networks Name of Candidate: Nagapradeep Chinnam Master of Science, 2011 Thesis and Abstract Approved: ( ) Dr. Tim Finin Professor (CSEE Department, UMBC) Date Approved: ________________ NOTE: *The Approval Sheet with the original signature must accompany the thesis or dissertation. No terminal punctuation is to be used.
Transcript
APPROVAL SHEET
Title of Thesis: Group recognition in social networks Name of Candidate: Nagapradeep Chinnam Master of Science, 2011 Thesis and Abstract Approved: ( ) Dr. Tim Finin Professor (CSEE Department, UMBC) Date Approved: ________________ NOTE: *The Approval Sheet with the original signature must accompany the
thesis or dissertation. No terminal punctuation is to be used.
Report Documentation Page Form ApprovedOMB No. 0704-0188
Public reporting burden for the collection of information is estimated to average 1 hour per response, including the time for reviewing instructions, searching existing data sources, gathering andmaintaining the data needed, and completing and reviewing the collection of information. Send comments regarding this burden estimate or any other aspect of this collection of information,including suggestions for reducing this burden, to Washington Headquarters Services, Directorate for Information Operations and Reports, 1215 Jefferson Davis Highway, Suite 1204, ArlingtonVA 22202-4302. Respondents should be aware that notwithstanding any other provision of law, no person shall be subject to a penalty for failing to comply with a collection of information if itdoes not display a currently valid OMB control number.
1. REPORT DATE 2011 2. REPORT TYPE
3. DATES COVERED 00-00-2011 to 00-00-2011
4. TITLE AND SUBTITLE Group recognition in social networks
5a. CONTRACT NUMBER
5b. GRANT NUMBER
5c. PROGRAM ELEMENT NUMBER
6. AUTHOR(S) 5d. PROJECT NUMBER
5e. TASK NUMBER
5f. WORK UNIT NUMBER
7. PERFORMING ORGANIZATION NAME(S) AND ADDRESS(ES) University of Maryland, Baltimore County,Department of ComputerScience and Electrical Engineering,Baltimore,MD,21250
8. PERFORMING ORGANIZATIONREPORT NUMBER
9. SPONSORING/MONITORING AGENCY NAME(S) AND ADDRESS(ES) 10. SPONSOR/MONITOR’S ACRONYM(S)
11. SPONSOR/MONITOR’S REPORT NUMBER(S)
12. DISTRIBUTION/AVAILABILITY STATEMENT Approved for public release; distribution unlimited
13. SUPPLEMENTARY NOTES
14. ABSTRACT Recent years have seen an exponential growth in the use of social networking systems, enabling their usersto easily share information with their connections. A typical Facebook user, as an example, might have300-400 connections that include relatives, friends, business associates and casual acquaintances. Sharinginformation with such a large and diverse set of people without violating social norms or privacy can bechallenging. Allowing users to define groups and restrict information sharing by group reduces theproblem but introduces new ones: managing groups and their members, relations and information sharingpolicies. This thesis addresses the problem of maintaining group membership. We describe a system thatlearns to classify a user’s new connections into one or more existing groups based on the connection’sattributes and relations. We demonstrate the approach using data collected from real Facebook users. Thetwo major tasks are identifying the relevant features for the classification and selecting the learningmechanism that best suits the task. Hierarchical and overlapping groups pose another significantchallenge. We show that our system classifies new connections into these groups with high accuracy evenwith only 10-20% of labeled data.
15. SUBJECT TERMS
16. SECURITY CLASSIFICATION OF: 17. LIMITATION OF ABSTRACT Same as
Report (SAR)
18. NUMBEROF PAGES
53
19a. NAME OFRESPONSIBLE PERSON
a. REPORT unclassified
b. ABSTRACT unclassified
c. THIS PAGE unclassified
Standard Form 298 (Rev. 8-98) Prescribed by ANSI Std Z39-18
ABSTRACT Title of Document: GROUP RECOGNITION IN SOCIAL
NETWORKS
Nagapradeep Chinnam, Master of Computer Science, 2011
Directed By: Professor Dr Tim Finin,
Department of Computer Science and Electrical Engineering
Recent years have seen an exponential growth in the use of social networking
systems, enabling their users to easily share information with their connections. A
typical Facebook user, as an example, might have 300-400 connections that include
relatives, friends, business associates and casual acquaintances. Sharing information
with such a large and diverse set of people without violating social norms or privacy
can be challenging. Allowing users to define groups and restrict information sharing
by group reduces the problem but introduces new ones: managing groups and their
members, relations and information sharing policies. This thesis addresses the
problem of maintaining group membership.
We describe a system that learns to classify a user's new connections into one
or more existing groups based on the connection's attributes and relations. We
demonstrate the approach using data collected from real Facebook users. The two
major tasks are identifying the relevant features for the classification and selecting the
learning mechanism that best suits the task. Hierarchical and overlapping groups pose
another significant challenge. We show that our system classifies new connections
into these groups with high accuracy even with only 10-20% of labeled data.
GROUP RECOMMENDATION IN SOCIAL NETWORKS
By
Nagapradeep Chinnam
Thesis submitted to the Faculty of the Graduate School of the University of Maryland, Baltimore County, in partial fulfillment
of the requirements for the degree of Masters in Computer
Figure 5.2 Mean Average Precision across data sets …………………………….. 39
Figure 5.3 Split on training data vs MAP ………………………………………... 40
Figure 5.4 Size of the groups vs MAP …………………………………………… 41
Figure 5.5 MAP vs Consolidated data sets ……………………………………….. 41
1
Chapter 1
INTRODUCTION
In this chapter we present an introduction to the notion of social networks and
the groups. We will discuss the need and motivation for classifying friends into
groups and then present a formal thesis definition.
1.1 Social Networks and Groups
A social network is a structure made up of nodes, which may represent
individuals, organizations and other real world entities, which are connected by
relationships like friendship, kinship, interests etc.
Social networks have evolved into a virtual world where people are using
them to connect to each other and to share updates in real time. There are hundreds of
social web portals out there each tending different purposes and users varying from
researchers to movie fans. Having a profile on one or the other social network has
become a necessity for an average internet user. Social networks are even used for
business promotions like organizing events and taking surveys etc. Consider for
example, if you would like to conduct a survey it takes a lot of effort in terms of the
promotion to reach out to the intended audience. Using social networks targeting the
audience and reaching out has become very easy as the survey can spread virally from
friend to friend getting it the maximum attention.
2
Table 1.1 List of social networking sites Source: Wikipedia
NAME DESCRIPTION/FOCUS NUMBER OF
REGISTERED USERS
ACADEMIA.EDU Social networking site for Academics/ Researchers
211,000
BADOO General, Meet new people, Popular in Europe and Latin America
86,000,000
BLOGSTER Blogging community 85,579
CLASSMATES.COM School, college, work and the military 50,000,000
DELICIOUS Social bookmarking allows users to locate and save websites that match their own interests
8,822,921
DOUBAN Largest Chinese community providing user review and recommendation services for movies, books, and music. It also doubles up as the Chinese language book, movie and music database.
46,850,000
FACEBOOK General 750,000,000+
FLIXSTER Movies 32,000,000
FOURSQUARE Location based mobile social network 2,000,000
IBIBO Talent based social networking site that allows promoting one’s self and also discovering new talent. Most popular in India
3,500,000
MEETUP.COM General. Used to plan offline meetings for people interested in various activities
ORKUT General. Owned by Google Inc. Popular in India and Brazil
100,000,000
3
1.2 Motivation
One of the primary concerns in social networks is to maintain privacy in this
virtual world while still staying connected with others. Striking balance between
getting connected and maintaining privacy is becoming a crucial requirement to the
end user. Consider the scenario, where you are planning to attend a base ball game
featuring your favorite team on a weekday. You want to share it with your friends that
you are watching a marquee game but at the same time don’t want your colleagues at
work don’t know about your whereabouts. There are several privacy models that help
the user in achieving this. One of these is a group based semantic model that clusters
your friends into groups and the privacy settings can be fine tuned for each group
depending on the user preferences.
Some statistics from Facebook, a famous social networking site:
• More than 500 million active users
• 50% of active users log on to Facebook in any given day
• People spend over 700 billion minutes per month on Facebook
• There are over 900 million objects that people interact with (pages, groups,
events and community pages)
• More than 30 billion pieces of content (web links, news stories, blog posts,
notes, photo albums, etc.) shared each month.
With so much information being generated and shared, groups are an essential
entity of a social network, which makes sure that the information is shared only with
the intended audience. Hence it is important to classify friends into different groups
so that better privacy controls can be applied for each group while sharing
4
information. Groups provide private channels for communication in the social
network.
Classifying friends into groups can be a tedious task. We believe that using
machine learning, a model can be trained to accurately classify the friends into
different groups. In this work, we would thus like to define a process that will classify
a friend connection to a pre-defined group.
1.3 Thesis Contribution
The thesis contribution can be briefly stated as follows:
1. Understand how people group their friends in a social network and how they
use them by taking a survey.
2. We determine the relevant features that are useful for classifying users into
groups and then train a machine learning models for the classification.
3. We evaluate different approaches in machine learning to identify the best
5
Chapter 2
BACKGROUND AND RELATED WORK
In this chapter, we provide some background knowledge about SVMs and
different versions of them and the external APIs we used to achieve our goal. We also
describe some related work that has been pursued in the direction of grouping the
friends in social networks like Facebook and LinkedIn.
2.1 SVMs
Support vector machines (SVMs) are a set of related supervised learning
methods that analyze data and recognize patterns, used for classification and
regression analysis. The standard SVM takes a set of input data and predicts, for each
given input, which of two possible classes the input is a member of, which makes the
SVM a non-probabilistic binary linear classifier.
A SVM constructs a hyperplane or set of hyperplanes in a high or infinite
dimensional space, which can be used for classification, regression, or other tasks.
Intuitively, a good separation is achieved by the hyperplane that has the largest
distance to the nearest training data points of any class (so-called functional margin),
since in general the larger the margin the lower the generalization error of the
classifier.
Given some training data , a set of n points of the form
6
where the yi is either 1 or −1, indicating the class to which the point belongs. Each
is a p-dimensional real vector. SVM finds the maximum-margin hyperplane that
divides the points having yi = 1 from those having yi = − 1[3].
Fig 2.1 Maximum-margin hyperplane and margins for an SVM trained with samples
from two classes. Source: Wikipedia
Any hyperplane can be written as the set of points satisfying
where denotes the dot product. The vector is a normal vector: it is perpendicular to
the hyperplane. The parameter determines the offset of the hyperplane from the
origin along the normal vector .
2.2 WEKA
Weka is a collection of machine learning algorithms for data mining tasks.
The algorithms can either be applied directly to a dataset or can be called from the
7
Java code. Another advantage is portability, since it is fully implemented in the Java
programming language and thus runs on almost any modern computing platform [1].
Weka is a comprehensive toolbench for machine learning and data mining. Its
main strengths lie in the classification area, where all current ML approaches and
quite a few older ones have been implemented within a clean, object-oriented Java
class hierarchy. Regression, Association Rules and clustering algorithms have also
been implemented. All of Weka's techniques are predicated on the assumption that
the data is available as a single flat file or relation, where each data point is described
by a fixed number of attributes.
2.3 Logistic Regression
Logistic regression or logit model is used for prediction of the probability of
occurrence of an event by fitting data to a logit function logistic curve. It is a
generalized linear model used for binomial regression. Like many forms of regression
analysis, it makes use of several predictor variables that may be either numerical or
categorical. Logistic regression is used extensively in the medical and social sciences
fields, as well as marketing applications such as prediction of a customer's propensity
to purchase a product or cease a subscription.
Logistic regression is a useful way of describing the relationship between one
or more independent variables (e.g., age, sex, etc.) and a binary response variable,
expressed as a probability, that has only two values, such as having cancer ("has
cancer" or "doesn't have cancer").
8
A logistic function ƒ(z) for a given input z is given by
Fig 2.2 The logistic function with z on the horizontal axis and ƒ(z) on the vertical axis
Source: Wikipedia
The logistic function is useful because it can take as an input any value from negative
infinity to positive infinity, whereas the output is confined to values between 0 and 1.
The variable z represents the exposure to some set of independent variables, while
ƒ(z) represents the probability of a particular outcome, given that set of explanatory
variables. The variable z is a measure of the total contribution of all the independent
variables used in the model and is known as the logit.
The variable z is usually defined as
9
where β0 is called the "intercept" and β1, β2, β3, and so on, are called the "regression
coefficients" of x1, x2, x3 respectively. Each of the regression coefficients describes
the size of the contribution of that risk factor. A positive regression coefficient means
that the explanatory variable increases the probability of the outcome, while a
negative regression coefficient means that the variable decreases the probability of
that outcome.
2.4 Facebook List Suggestions
Facebook has its own set of recommendation features. But from the examples we
understood that it uses only the connections (mutual friends in a group) for
suggestions. It ignores the other attributes. Also it seems to ignore the fact that groups
might overlap.
2.5 InMaps
InMaps is a LinkedIn Labs experimental product that is an interactive visual
representation of the LinkedIn user’s professional universe and tries to identify the
elusive hubs in the user’s professional world. It is a great way to understand the
relationships between you and your entire set of LinkedIn connections.
InMaps sifts through all of your connections, detects the relationships between
them, and groups them into different network clusters. It color-codes and clumps
these networks together so you can see the depth of your connections in one interface.
By creating a network of interconnecting nodes representing each of your contacts,
InMaps help you visualize clusters of your contacts based on how well they're
10
interconnected. User can then add labels to the groups of contacts, and zoom in and
out of the map to discover trends or other details.
InMaps offers an insight into who the major connections, bridges and
influencers are in the user’s network. People with bigger dots and their names in
larger fonts have more connections (and typically more sway) in specific clusters. For
instance, by studying the interconnectedness of certain nodes, user can see who the
'bridge' in his relationships with groups of contacts. User can also see who knows the
most people in a particular working sphere by how big their node is, which could be
useful if you ever need to find a contact or someone with influence.
2.6 Facebook Applications on managing groups
There are several third party Facebook applications that try to automatically
group people using various inputs.
2.6.1 Fellows
‘Fellows’ is a Facebook application which comes up with a way to
automatically generate groups for your friends, using only the information "who
knows who". By analyzing your Facebook connections, it presents the Facebook user
with several groups. It tries to hide the burden of completely creating the groups from
the user.
2.6.2 Social Flows
SocialFlows is a Facebook application to you by the Stanford Mobile & Social
Computing Laboratory at Stanford University. It help you rediscover groups of
11
people that matter to you in your flows of life, without too much hassle on your part.
It reveals user’s important and closest social groups by analyzing tagged photos of the
user and his friends. The discovered social groups can then be edited & refined using
SocialFlows, and we can make the rediscovered social groups available to the user to
share on Facebook as Facebook Friends Lists. Its goal is to help users protect their
privacy by making it easy to create relevant personal social groups that users can
safely share social information with. It also help users make sense of their ever
growing social graph of friends by arranging them into groups that makes sense.
12
Chapter 3
UNDERSTANDING GROUPS
In a social network, grouping the connections into different lists helps the user
to communicate effectively within the social graph targeting the intending audience.
We have conducted a survey for Facebook users to understand how people use groups
in the real life. This chapter apart from defining different types of groups also
showcases the insights that we got from conducting the survey.
3.1 Why to group contacts?
Social network lets us connect and communicate with people that we are
connected to in all kinds of ways like friends from school, family members,
colleagues and people whom we know. In general, we don’t have the same level of
comfort with all of our friends in sharing updates or we might want to keep some
updates private to a particular group or in some cases we might want to target specific
set of our friends. This all leads to the creation of groups within our social network.
‘Friend Lists’ is a feature in Facebook that enables its users to group their friends.
It allows to create named lists of friends that the user can use to organize their
relationships whichever way works best for them. These private lists can be used to
message people, send group or event invitations, and to filter updates from certain
groups of friends. There are other uses that give the user more control over the
information they share on Facebook and who they share it with.
13
Facebook provides a more real-time model of keeping up with your friends’
activities around the site and powerful way to filter your news feed. You can even use
this as a marketing technique by grouping your friends related to their interests. When
you have, you can send each group of friends emails related to what you think they’ll
enjoy. This is a very easy way to get the word out.
3.2 Types of groups
After observing the lists created by several users, we came up with these different
types of groups.
3.2.1 Social Lists
Figure 3.1 Social lists
The members of these lists are strongly interconnected to one another. For a new
member, the group membership is easily predictable by looking at the count of
14
friends he has in that group. Examples are groups like High school, Colleagues,
Family etc.
3.2.2 Role based Lists
Figure 3.2 Role based lists
These lists are created based on their role in an organization or in one’s
personal life. The members of these lists may not be connected to each other, but
from the user’s (who created the lists) perspective these people share a common
feature(s). Groups like Managers, Faculty are examples for this type of lists.
15
3.2.3 Interest based lists
Figure 3.3 Social lists
These lists are created to group the members who share common interest(s)
with the user. Interest based lists differ from role based lists as the members of the
later share a common property among themselves but in the former the members
share a common interest/property with the user. The members in these lists may not
be connected to each other.
3.2.4 Personal lists
These lists are created by the user based on the factors that are not captured by
the social network. Factors may vary from personal reasons like how much they like
them to the professional reasons. The model for these lists is tough to capture.
Examples are groups like ‘best friends’ etc.
16
Table 3.1: Types of Lists
LISTS
TYPES
IS
STRONGLY
CONNECTED
SHARES COMMON
FEATURES AMONG
GROUP MEMBERS
SHARES COMMON
FEATURES WITH
THE USER
GROUP
MEMBERSHIP
RECOMMENDATIONS
Social lists Yes Yes Yes Easy: based on connections
Role based lists Need not be Yes Need not be
Easy: if information is
available
Interest based lists Need not be Yes Yes
Moderate: if information is
available Idiosyncra
tic lists Need not be Need not be Need not be Difficult
3.3 Survey
A survey has been conducted among Facebook users with a set of 12 objective
questions. This survey is intended to understand how people use friend lists in
Facebook. We got 128 responses from different age groups and varying professions.
The results provided a great insight into the group dynamics in social networks.
3.3.1 Questionnaire:
1 What is your age?
A) <20 B) 20-30 C) 30-50 D) >50
2 How many hours do you spend every day on facebook?
A) <30 mins B) 1-2 hrs C) 2-4hrs D) i'm a facebook addict
17
3 What best describes your profession?
A) Student B) Working (IT related) C) Working (Non-IT) D) Retired
4 How many friends do you have in facebook?
A) <50 B)50-100 C)100-200 D) 200-500 E) 500-1000 F) >1000
5 I value my Facebook privacy?
A) Strongly disagree B) Disagree C) Neither agree nor disagree D) Agree
E) Strongly Agree
6 What is your primary purpose for friend lists in Facebook?
A) Friend lists!! what are they? B) To organize my friends C) To share
information in a controlled fashion D) Both B & C
7 How many friend lists have you created in Facebook?
A) None B)0-5 C) 6-10 D) >10
8 If possible what kind of privacy settings you would like to constrain using
friend lists?
A) My status updates B) Likes & comments C) Photos and videos D) All
9 What kind of friend lists do you have or like to have?
A) Social lists (Almost everyone in these lists know each other Ex:
Highschool, Colleagues, Family)
B) Role based lists (Ex: Managers, Faculty)
18
C) Interest based lists (Friends in these lists need not be connected Ex:
Running)
10 Do you have any lists with overlapping friends?
A) No B) Just a few C) A lot
11 Do you like to have hierarchical lists (Ex: High school friends and High
school best buddies)?
A) Yes B) No C) Don't care
12 What kind of analysis you would like to be done by a Facebook App on your
friend lists?
A) Automatically create lists for me by looking at my friends information
B) Suggest friends to add to the lists that I have created
C) Data analysis over my friends profile information
3.3.2 Results:
From the questionnaire, we analyzed the relationships between privacy, groups
and other attributes on 21 different data points. In the following section we present
some of the findings that we find interesting.
19
3.3.2.1 Profession vs Privacy
Figure 3.4 Profession vs Privacy
There is a general consensus among all the users irrespective of their
profession about their privacy. Every one values it. To the statement ‘They value their
Facebook privacy’ the percentage of users who agree and to the percentage of users
who strongly agree to it is almost same. Users want privacy but they are not harsh
about it. It shows that users don’t want strong privacy policies that block them from
the rest of the social network. They want policies that enable them to connect and
share information in a secure way.
3.3.2.2 Number of friends vs Purpose for creating groups
We tried to find out why users want to create groups. Is it to share information
with their friends in a controlled fashion or to organize their friends? The results
showed that both organizing friends and sharing information are equally important
irrespective of the number of friends the user has.
20
Figure 3.5 Number of friends vs Purpose to create groups
3.3.2.3 Time spent on Facebook vs Types of groups
Figure 3.6 Time spent on Facebook vs Types of groups
Social lists are popular among users irrespective of the time they spent on
Facebook. Users who spend less time don’t care much about the other kind of lists,
21
but as they spend more time there is an increase in the need of both Role based lists
and Interest based lists.
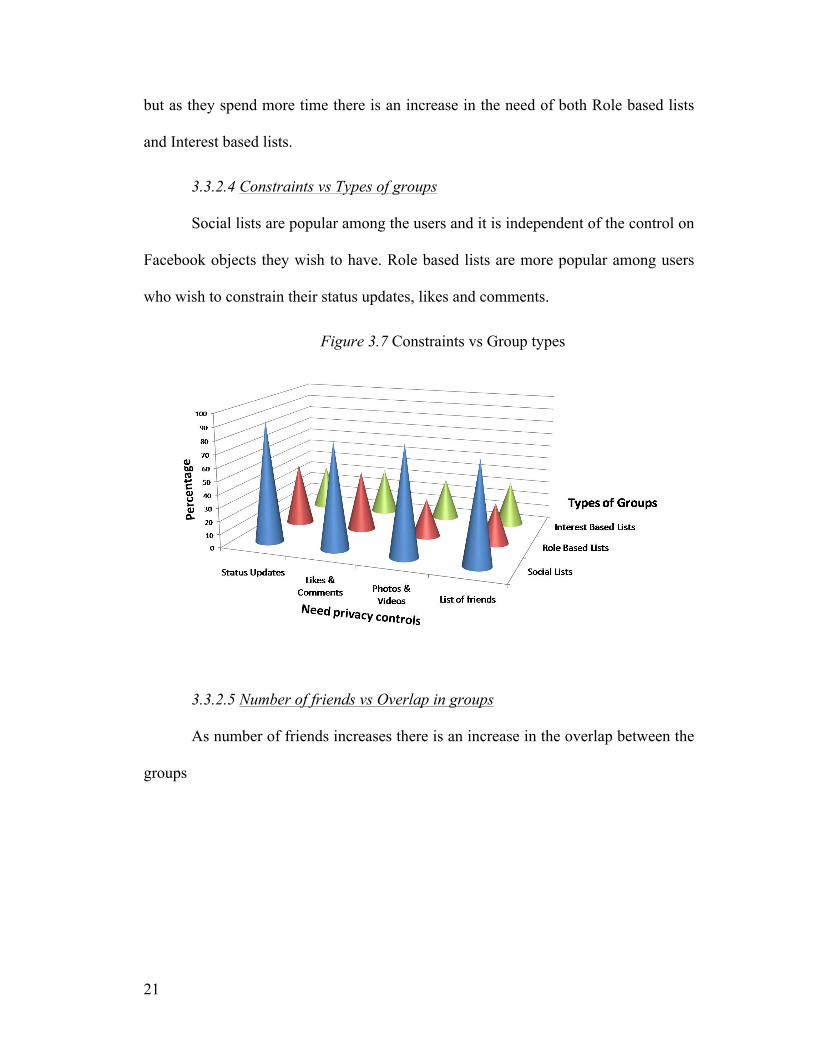
3.3.2.4 Constraints vs Types of groups
Social lists are popular among the users and it is independent of the control on
Facebook objects they wish to have. Role based lists are more popular among users
who wish to constrain their status updates, likes and comments.
Figure 3.7 Constraints vs Group types
3.3.2.5 Number of friends vs Overlap in groups
As number of friends increases there is an increase in the overlap between the
groups
22
Figure 3.8 Number of Friends vs Overlap between groups
3.3.2.6 Number of lists vs Need for hierarchy in groups
As the size of the groups increases users felt the requirement of a hierarchical
groups to organize them. Also the percentage of ‘don’t care’ responses reduced to
zero as the size of groups increases
Figure 3.9 Number of groups vs Hierarchy in groups
23
Chapter 4
SYSTEM DESIGN AND IMPLEMENTATION
In this chapter we will explain a high level design and implementation of our
system. In the first section we explain the general architecture and the system
components that have most direct influence on the system. We then describe the
feature vector that we extracted from the datasets and the libraries and packages that
we used to build this system.
4.1 System Architecture
Figure 4.1 provides an architectural overview of our system.
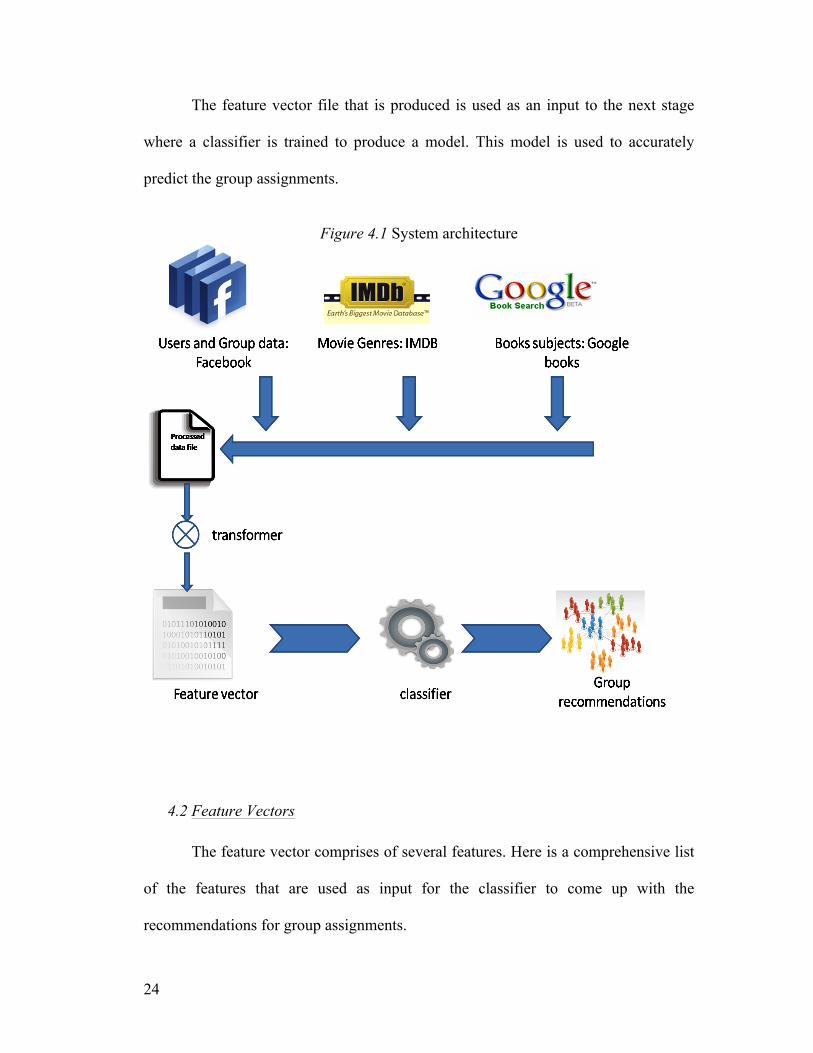
The system architecture consists of 3 stages. In the first stage data is collected
from Facebook using Graph API. It includes the data collected from each user about
his friends and the lists (groups) that he has already created. This data is co-related
with the inputs from IMDB (to identify the genres of the movies that the user has
liked) and Google Books (to identify the subjects of the books that are liked by the
user) to produce an intermediate file.
In the second stage, a transformer is used to produce a feature vector that is
consistent with the classifier that is used in the next stage. Different classifiers use
different input formats. Transformer takes the intermediate file and converts into the
required format of the classifier.
24
The feature vector file that is produced is used as an input to the next stage
where a classifier is trained to produce a model. This model is used to accurately
predict the group assignments.
Figure 4.1 System architecture
4.2 Feature Vectors
The feature vector comprises of several features. Here is a comprehensive list
of the features that are used as input for the classifier to come up with the
recommendations for group assignments.
25
Table 4.2 shows all the relevant features extracted from the user’s profile to
create a feature vector file that trains the classifier.
4.2.1 General Information
Features like age, sex and languages are extracted from the basic information
of the user profile. There are lots of groups that have same attribute values except that
the groups are different in terms of the age of the members. Example: ‘Family’ and
‘Kids’ are two groups that might have same attribute values but differ in the age
groups of its members. Another example can be ‘UMBC CS Graduate Students’ and
‘UMBC CS Faculty’. These groups are usually part of a bigger group but are
separated to achieve privacy. In cases like these, the ‘age’ attribute acts as a beacon to
distinguish them from one another.
The languages section is processed using the bag-of-words model. The user’s
location is also captured in the feature vector. Most of the cities in Facebook are
tagged along with their state and sometimes their country. The city and state
information is mined from the user’s location related features like ‘current city’ and
‘home town’.
4.2.2 Education History
The user’s education history provides a great insight into the social groups
like ‘high school’, ‘Graduate Friends’ etc. Facebook provides an interface to collect
good amount of information on the user’s education background. We can extract
fields like the name of the school, its type (college or graduate school or high school),
degree the user has achieved and the concentration he majored in from the education
26
history of the user. This provides a comprehensive detail about the user, which
includes all the schools/colleges that he has attended. From these fields bag of words
are generated by removing the listed stop words.
4.2.3 Work History
Similar to the features extracted from the education history, attributes are
captured from work history of the user. We are interested in the fields like name of
the organization(s) the user worked for, position(s) he held, work city and work state
along with other information like details of the project(s) for all places where the user
has worked. From these fields bag of words are generated by removing the listed stop
words.
Table 4.1. List of stop words used while processing text bag-of-words model
LIST OF STOP WORDS
AND, AT, FOR, IN, MV, OF, THE, &, !, -, ;
4.2.4 Is-A-Friend Relationship
Most of the members in social lists (almost everyone in these social lists
knows each other Ex: High school, Colleagues, Family) are strongly connected. For a
given person and a group, we can check how many ‘friends’ he has in that group.
Based on the relationship ‘is-a-friend’ (is-connected), a mutual friend count is
generated for the user’s friend against each group. This count signifies how strongly a
friend is connected to the rest of the friends in a group. A high number for a group
27
indicates a strong likelihood of that connection belonging to the group provided the
group is a social list
This turned out to be a strong indicator in most of the groups to determine
whether the membership of the user in that group. The count has to be normalized in
order to consider the variance between memberships cardinality of different groups.
4.2.5 Movies, Television & Books
A person’s favourite movies, television shows and the books he reads gives us
good insight into the kind of person he is. These can be captured from the Facebook
user’s data.
Using the Netflix API[8], the genres of the movies and TV shows for which the
user liked are identified. The summation of the count for each genre from all the
movies and television shows is generated and is normalized to account the factor that
some users might list more movies where as some might just list few. This count
captures the user’s interest in that genre.
Similarly for the books, Google book Data API is used to calculate the
normalized count for each category the user is interested in.
4.2.6 Games, Sports, Activities & Interests
Facebook provides multiple fields like games, sports, activities, and interests
to capture the user’s extracurricular activities. These fields provide more information
on the user interests and help our classifier to predict the interest-based groups more
accurately.
28
A bag of words is generated using the fields like games, sports, favorite teams,
favorite athletes, activities and interests of the user. These features try to capture the
user’s social life apart from education and work.
Table 4.2. Features extracted from different data collected from the Facebook user.
DATA COLLECTED FEATURES EXTRACTED
BASIC PROFILE INFORMATION Age, Sex, Home town, Home State, Current
City, Current State, Languages
EDUCATION & WORK HISTORY Bag of words from relevant features
MOVIES & TELEVISION Normalized count of genres of the movies
from the user interests using Netflix API
BOOKS Normalized count of subjects of the books
from the user interests using Google Data
API
GAMES, SPORTS, ACTIVITIES &
INTERESTS
Bag of words from relevant features
WHO KNOWS WHO
(IS-CONNECTED)
Mutual friend count in each group
29
4.3 Libraries
4.3.1 Facebook Graph API
At Facebook's core is the social graph; people and the connections they have
to everything they care about. The Graph API[6] presents a simple, consistent view of
the Facebook social graph, uniformly representing objects in the graph (e.g., people,
photos and pages) and the connections between them (e.g., friend relationships,
shared content, and photo tags).
Every object in the social graph has a unique ID. You can access the
properties of an object by requesting https://graph.facebook.com/ID
All of the objects in the Facebook social graph are connected to each other via
relationships. Bret Taylor is a fan of the Coca-Cola page, and Bret Taylor and Arjun
Banker are friends. We call those relationships connections in our API. You can
examine the connections between objects using the URL structure
https://graph.facebook.com/ID/CONNECTION_TYPE
Authorization:
The Graph API as such allows you to easily access all public information
about an object. To get additional information about a user, you must first get their
permission. At a high level, you need to get an access token for the Facebook user.
After you obtain the access token for the user, you can perform authorized requests
30
on behalf of that user by including the access token in your Graph API requests. The
user_activities friends_activities Provides access to the user's list of activities as the activities connection
user_birthday friends_birthday Provides access to the birthday with year as the birthday_date property
user_education_history
friends_education_history
Provides access to education history as the education property
user_hometown friends_hometown Provides access to the user's hometown in the hometown property
user_interests friends_interests Provides access to the user's list of interests as the interests connection
user_location friends_location Provides access to the user's current location as the location property
user_work_history friends_work_history Provides access to work history as the work property
read_friendlists manage_friendlists
Provides access to any friend lists the user created. All user's friends are provided as part of basic data, this extended permission grants access to the lists of friends a user has created, and should only be requested if your application utilizes lists of friends.
Access Token:
• Create a link to request necessary permissions from the user. The permissions