39th Annual Simulation Symposium Modeling, Simulation and Performance Evaluation for a CIOQ Switch Architecture Sponsored by FAPEMIG Antonio M. Alberti INATEL – National Institute of Telecommunications, MG, Brazil. Sebastiao R. de Aguiar Filho FEMC – Fundação Educacional Montes Claros, MG, Brazil. Anilton Salles Garcia UFES – Federal University of Espirito Santo, ES, Brazil.
Transcript
39th Annual Simulation Symposium
Modeling, Simulation and Performance
Evaluation for a CIOQ Switch
Architecture
Sponsored by FAPEMIG
Antonio M. AlbertiINATEL – National Institute of
Telecommunications, MG, Brazil.
Sebastiao R. de Aguiar FilhoFEMC – Fundação Educacional Montes Claros,
MG, Brazil.
Anilton Salles GarciaUFES – Federal University of Espirito Santo,
ES, Brazil.
39th Annual Simulation Symposium
Presentation Outline
� Introduction
� Single Input Buffer CIOQ Architecture
� Class Based Input Buffer CIOQ Architecture
� Developed Models
� Performance Evaluation
� Final Remarks
39th Annual Simulation Symposium
Introduction
� In the past decade, data traffic has experimented a huge
growth, mainly due to Internet popularization.
� Telephony operators built new networks to transport end
users multimedia traffic.
� Technologies as ADSL and ATM (Asynchronous Transfer
Mode) emerged in access and core networks, respectively.
� Also, powerful routers have been developed to drain Internet
traffic.
39th Annual Simulation Symposium
Introduction
� Packet switching nodes and their architectures have
experienced a big development, not only in terms of capacity
and scalability, but also in terms of efficiency and QoS
support.
� An important portion of this deployment occurred in the
context of the ATM networks.
� Most of the ATM switch architectures are built arranging
multistage switching elements to form an interconnection
network.
39th Annual Simulation Symposium
Introduction
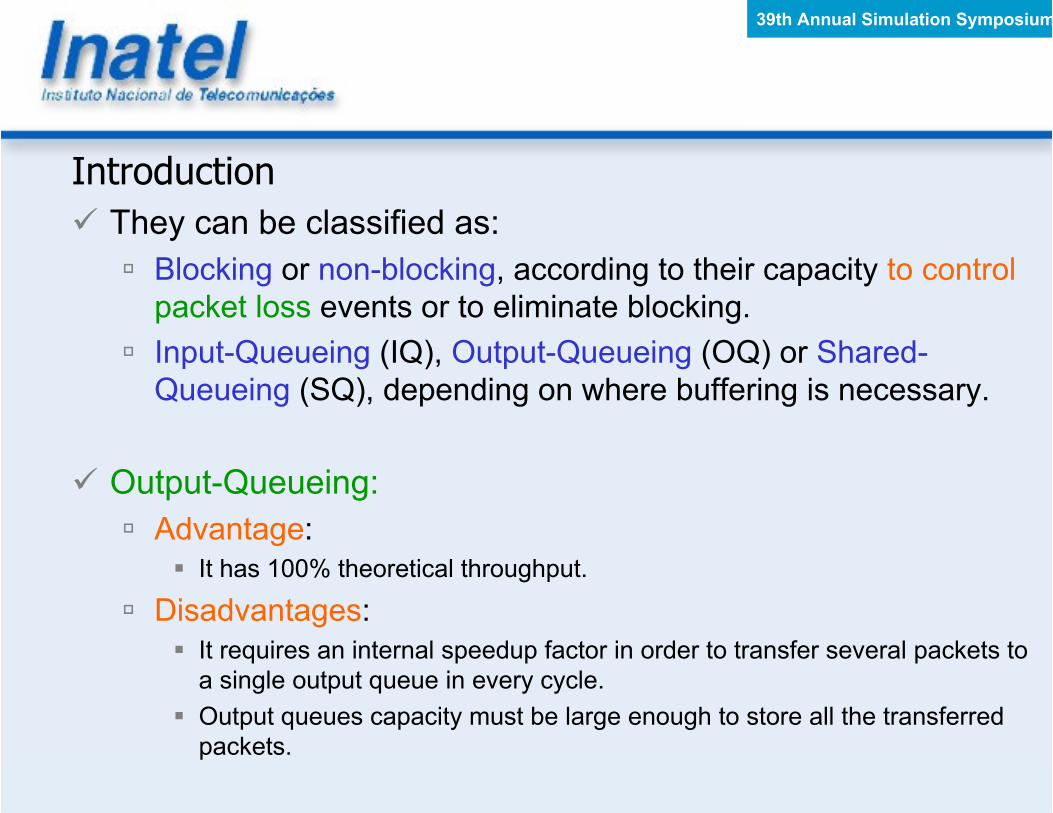
� They can be classified as:
� Blocking or non-blocking, according to their capacity to control
packet loss events or to eliminate blocking.
� Input-Queueing (IQ), Output-Queueing (OQ) or Shared-
Queueing (SQ), depending on where buffering is necessary.
� Output-Queueing:
� Advantage:
� It has 100% theoretical throughput.
� Disadvantages:
� It requires an internal speedup factor in order to transfer several packets to
a single output queue in every cycle.
� Output queues capacity must be large enough to store all the transferred
packets.
39th Annual Simulation Symposium
Introduction
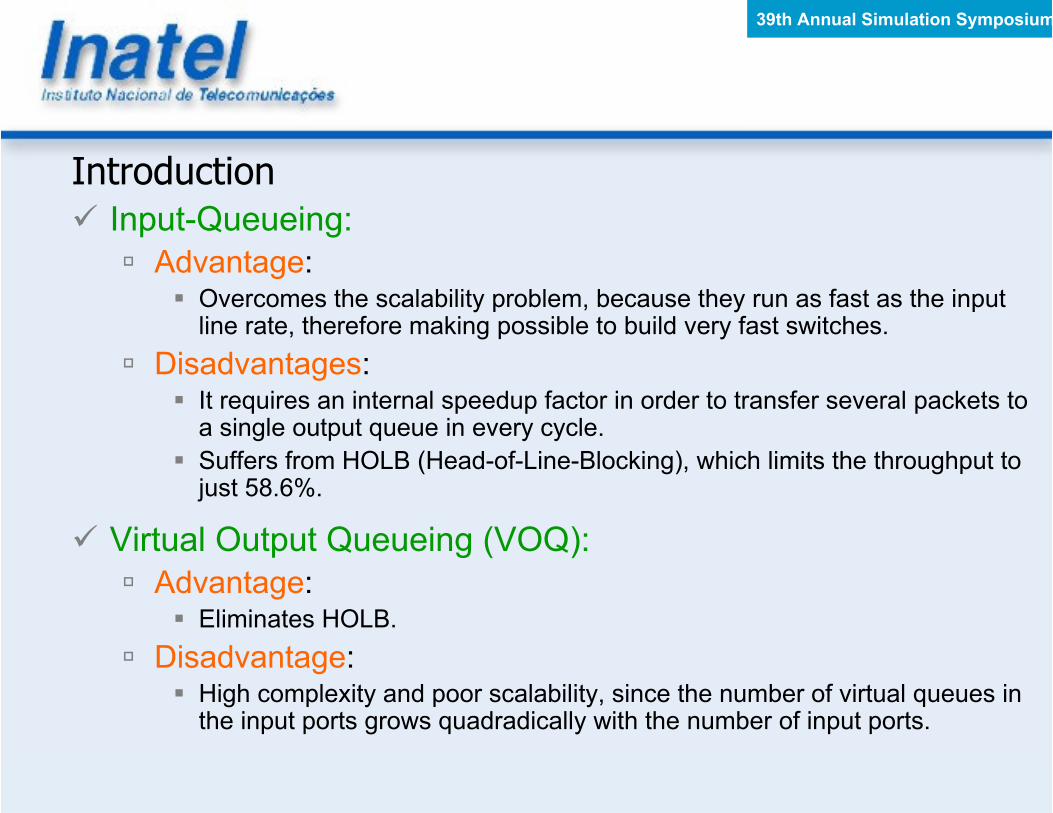
� Input-Queueing:
� Advantage: � Overcomes the scalability problem, because they run as fast as the input line rate, therefore making possible to build very fast switches.
� Disadvantages: � It requires an internal speedup factor in order to transfer several packets to a single output queue in every cycle.
� Suffers from HOLB (Head-of-Line-Blocking), which limits the throughput to just 58.6%.
� Virtual Output Queueing (VOQ):
� Advantage: � Eliminates HOLB.
� Disadvantage: � High complexity and poor scalability, since the number of virtual queues in the input ports grows quadradically with the number of input ports.
39th Annual Simulation Symposium
Introduction
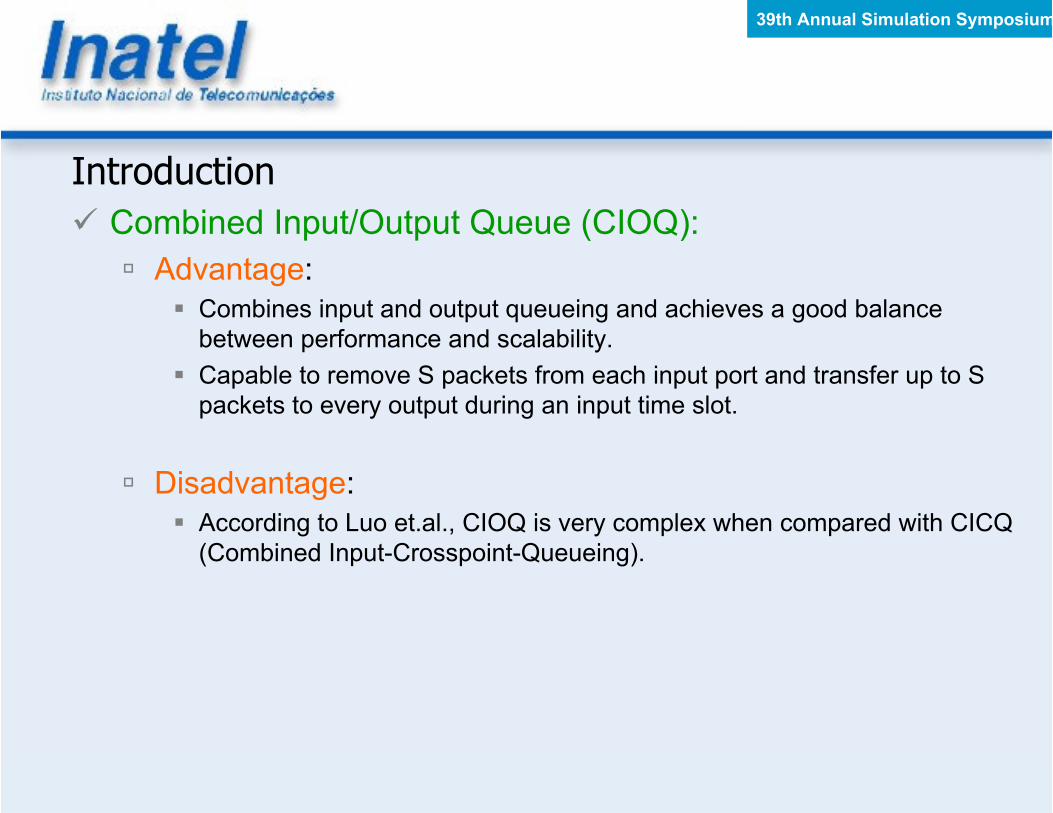
� Combined Input/Output Queue (CIOQ):
� Advantage:
� Combines input and output queueing and achieves a good balance
between performance and scalability.
� Capable to remove S packets from each input port and transfer up to S
packets to every output during an input time slot.
� Disadvantage:
� According to Luo et.al., CIOQ is very complex when compared with CICQ
(Combined Input-Crosspoint-Queueing).
39th Annual Simulation Symposium
Introduction
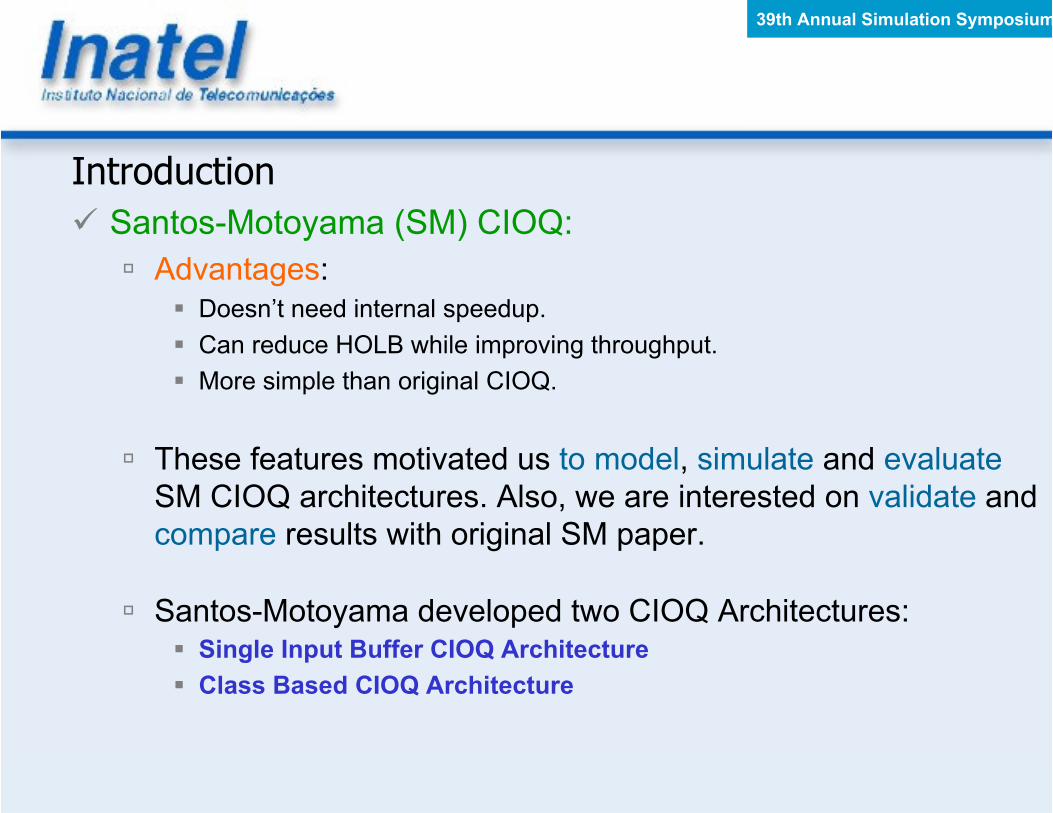
� Santos-Motoyama (SM) CIOQ:
� Advantages:
� Doesn’t need internal speedup.
� Can reduce HOLB while improving throughput.
� More simple than original CIOQ.
� These features motivated us to model, simulate and evaluate
SM CIOQ architectures. Also, we are interested on validate and
compare results with original SM paper.
� Santos-Motoyama developed two CIOQ Architectures:� Single Input Buffer CIOQ Architecture
� Class Based CIOQ Architecture
39th Annual Simulation Symposium
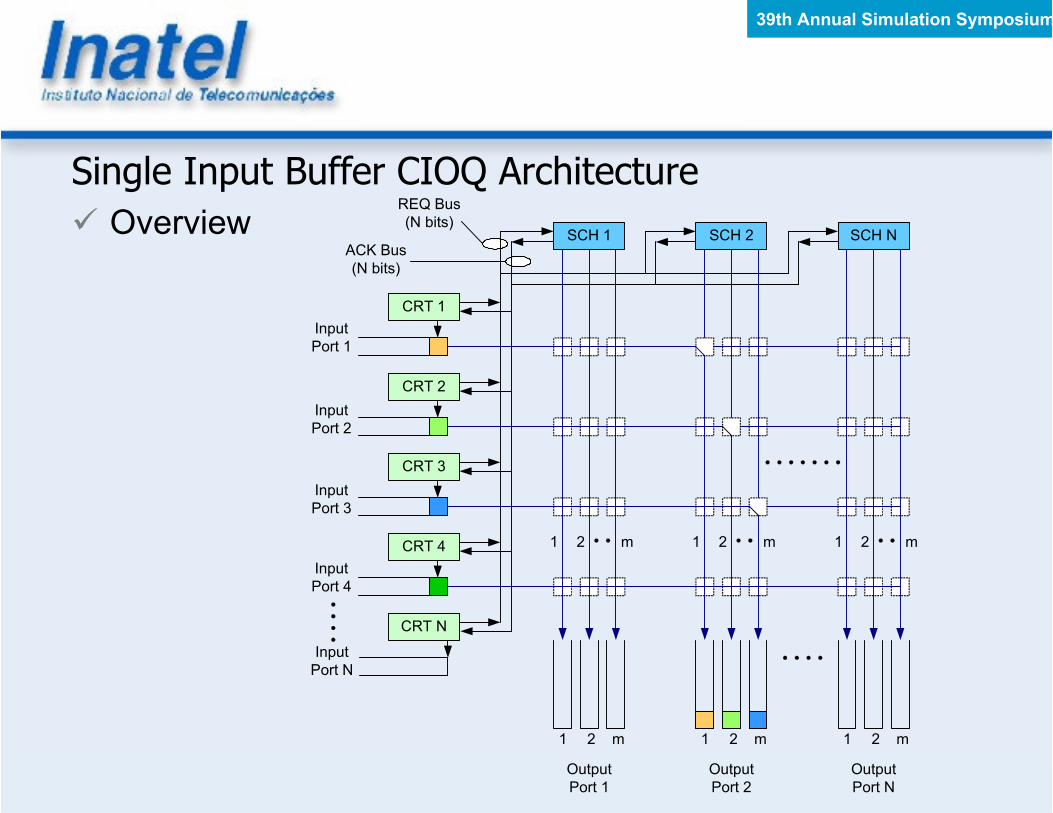
Single Input Buffer CIOQ Architecture
� It has one simple FIFO queue for each input port, a crossbar
with m internal links (or channels) from each input to each
output port and m output queues in every output port.
� Each input queue has a control unit (CRT), which monitors
queue’s head in order to determine if there exists a packet to
be transferred.
� If it is the case, it sends a request (REQ) to a desired output
port scheduler module (SCH) in order to request a crossbar
link to this output port.
� Any CRT can ask just one request per time slot.
39th Annual Simulation Symposium
Single Input Buffer CIOQ Architecture
� Overview
Input
Port 1
CRT 1
Input
Port 2
CRT 2
Input
Port 3
CRT 3
Input
Port 4
CRT 4
Input
Port N
CRT N
SCH 1 SCH 2 SCH N
REQ Bus
(N bits)
ACK Bus
(N bits)
1 2 m 1 2 m 1 2 m
Output
Port 1
Output
Port 2
Output
Port N
1 2 m 1 2 m 1 2 m
39th Annual Simulation Symposium
Single Input Buffer CIOQ Architecture
� The SCH grants on a round-robin basis up to m links to the
asking CRTs.
� This is done through acknowledgement signals (ACKs).
� To be fair, in the next cycle SCH will begin to grant from the
input that wasn’t granted in the previous cycle.
� The output queues are also served in a round-robin basis.
39th Annual Simulation Symposium
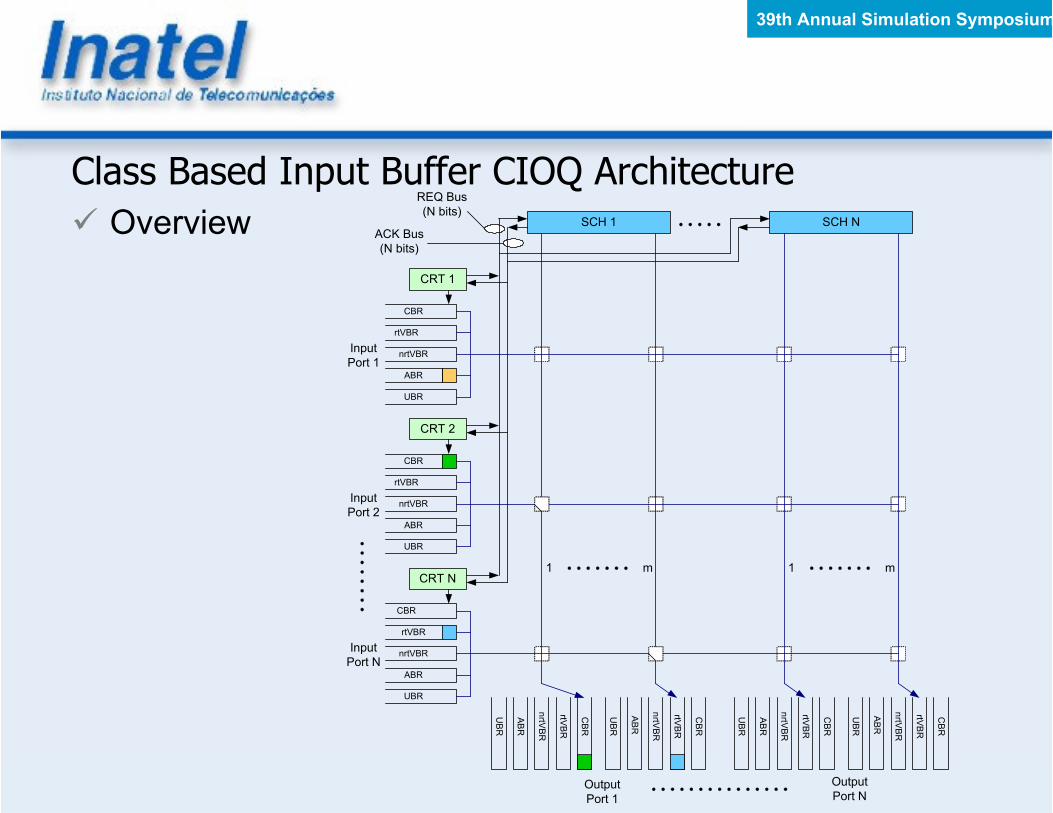
Class Based Input Buffer CIOQ Architecture
� Extended version of the previous architecture to support
traffic classes priorization.
� It has five logical FIFO queues in each input port, one for
every priority class.
� The priority classes are named according to ATM service
categories: CBR, rtVBR, nrtVBR, ABR and UBR.
� The incoming packets are classified and stored in the
appropriate class queues.
39th Annual Simulation Symposium
Class Based Input Buffer CIOQ Architecture
� The architecture also uses two buses: REQ and ACK.
� At each output port, 5xm physical queues are needed, where
m is the number of internal links.
� Also, it has one scheduler for each output port.
� Both input and output schedulers use round-robin service
discipline to determine service order.
39th Annual Simulation Symposium
Class Based Input Buffer CIOQ Architecture
� Overview
Input
Port 1
CRT 1
SCH 1
REQ Bus
(N bits)
ACK Bus
(N bits)
CBR
rtVBR
nrtVBR
ABR
UBR
Input
Port N
CRT N
CBR
rtVBR
nrtVBR
ABR
UBR
Output
Port 1
Output
Port N
Input
Port 2
CRT 2
CBR
rtVBR
nrtVBR
ABR
UBR
SCH N
1 m1 m
CBR
rtVBR
nrtV
BR
ABR
UBR
CBR
rtVBR
nrtV
BR
ABR
UBR
CBR
rtVBR
nrtV
BR
ABR
UBR
CBR
rtVBR
nrtV
BR
ABR
UBR
39th Annual Simulation Symposium
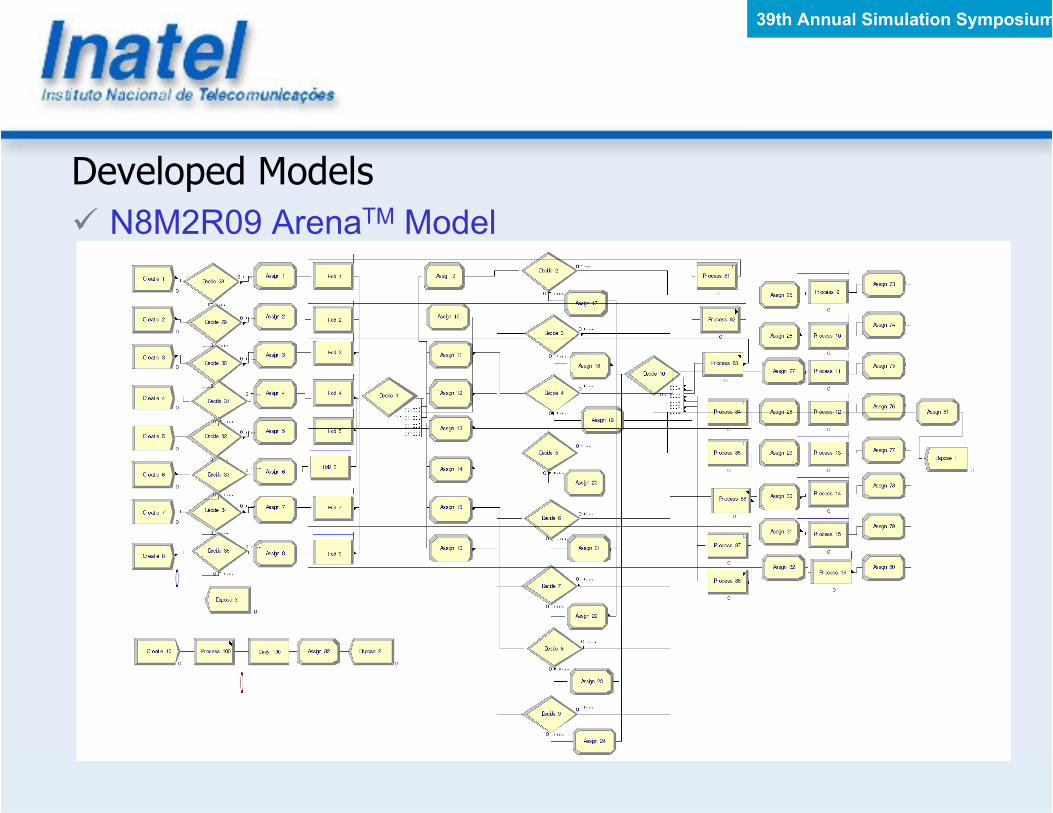
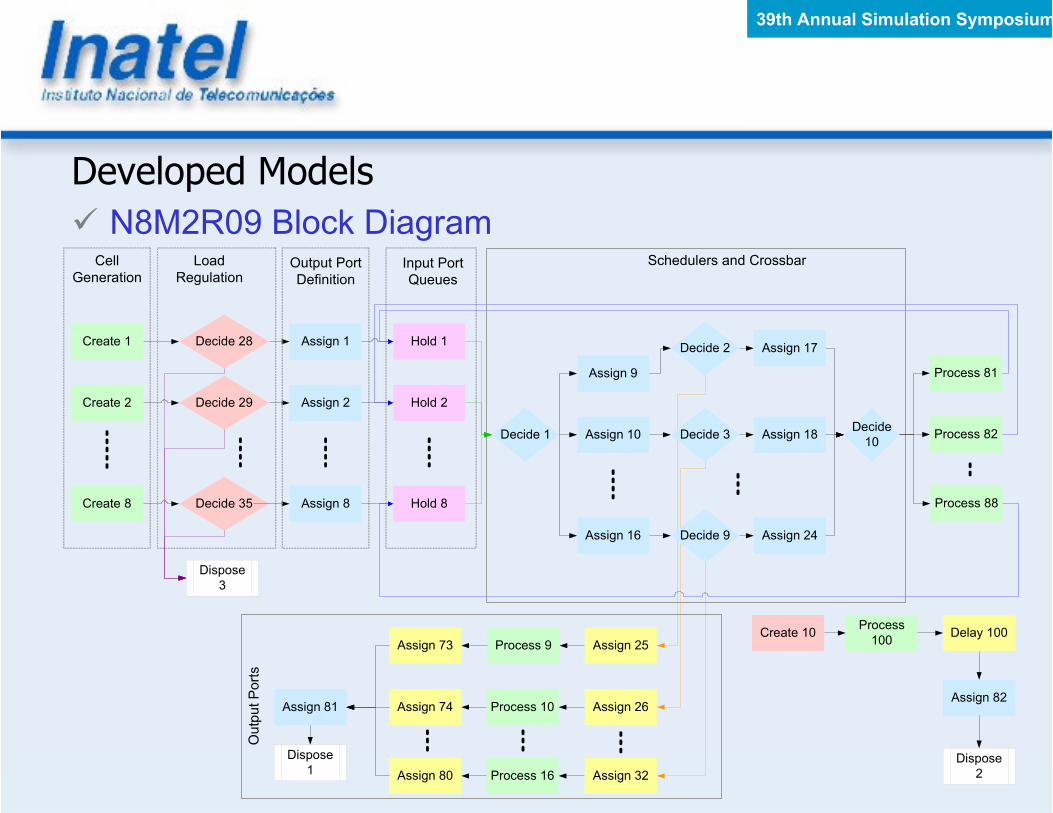
Developed Models
� We used Arena 5.0TM to develop and implement simulation
models for the SM CIOQ architectures.
� To each architecture we developed a basic model and
implemented several derived models varying the number of
input-output ports (N), the number of internal links (m) and the
offered load (r).
� At the end, we developed 181 simulation models.
� Model Example: N8M2R09 (N=8, m=2 and r=0.9) single
buffer CIOQ model.
39th Annual Simulation Symposium
Developed Models
� N8M2R09 ArenaTM Model
39th Annual Simulation Symposium
Developed Models
� N8M2R09 Block DiagramCell
Generation
Decide 28Create 1
Create 2 Decide 29
Create 8 Decide 35
Load
Regulation
Assign 1
Assign 2
Assign 8
Output Port
Definition
Hold 1
Hold 2
Hold 8
Input Port
Queues
Decide 1
Assign 9
Assign 10
Assign 16
Assign 18
Assign 24
Process 81
Process 82
Process 88
Decide 2 Assign 17
Assign 25
Assign 26
Assign 32
Schedulers and Crossbar
Decide
10
Process 9
Process 10
Process 16
Assign 73
Assign 74
Assign 80
Assign 81
Dispose
1
Dispose
3
Output Ports
Create 10Process
100Delay 100
Assign 82
Dispose
2
Decide 3
Decide 9
39th Annual Simulation Symposium
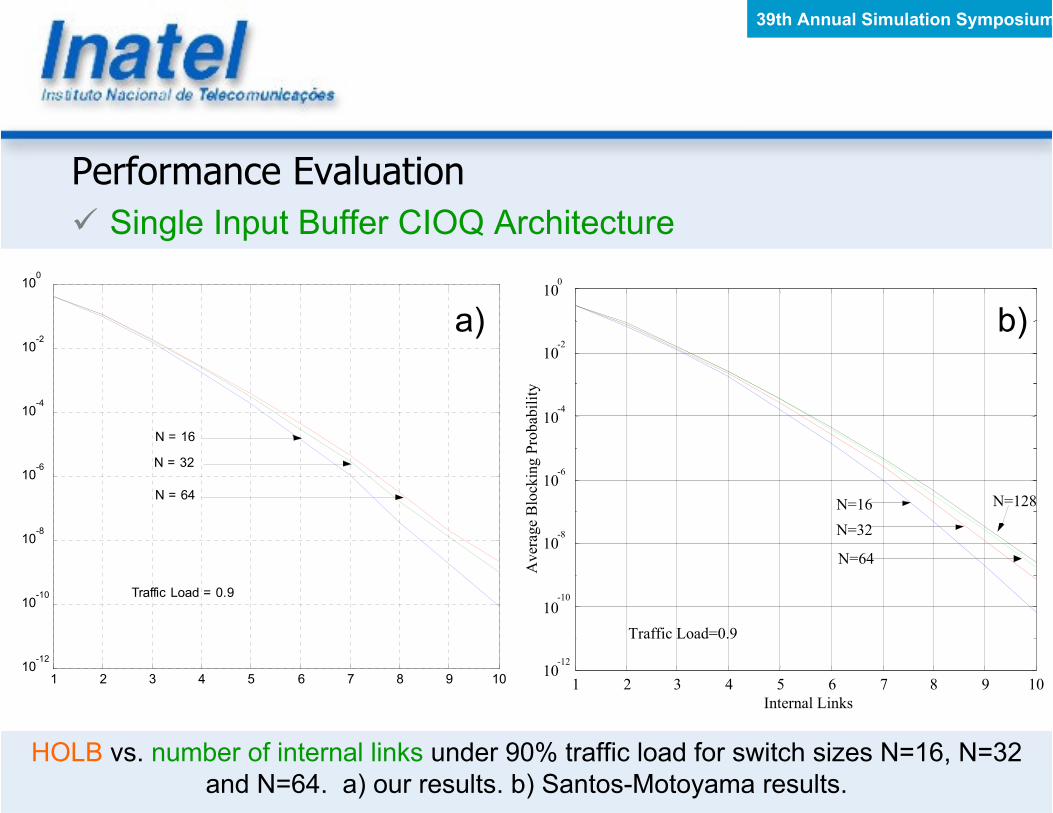
Performance Evaluation
� Single Input Buffer CIOQ Architecture
1 2 3 4 5 6 7 8 9 1010
-12
10-10
10-8
10-6
10-4
10-2
100
N = 16
N = 32
N = 64
Traffic Load = 0.9
1 2 3 4 5 6 7 8 9 1010
-12
10-10
10-8
10-6
10-4
10-2
100
Internal Links
Average Blocking Probability
Traffic Load=0.9
N=16
N=32
N=64
N=128
a) b)
HOLB vs. number of internal links under 90% traffic load for switch sizes N=16, N=32
and N=64. a) our results. b) Santos-Motoyama results.
39th Annual Simulation Symposium
Performance Evaluation
� Single Input Buffer CIOQ Architecture
1 2 3 4 5 6 7 8 9 1010
-10
10-8
10-6
10-4
10-2
100
Switch Size: 64 X 64
Traffic Load = 0.9
Traffic Load = 0.8
Traffic Load = 1.0
Traffic Load = 0.7
a)
1 2 3 4 5 6 7 8 9 1010
-10
10-8
10-6
10-4
10-2
100
Switch Size: 64 x 64
ρ = 0.7
ρ = 0.8
ρ = 0.9
ρ =1
b)
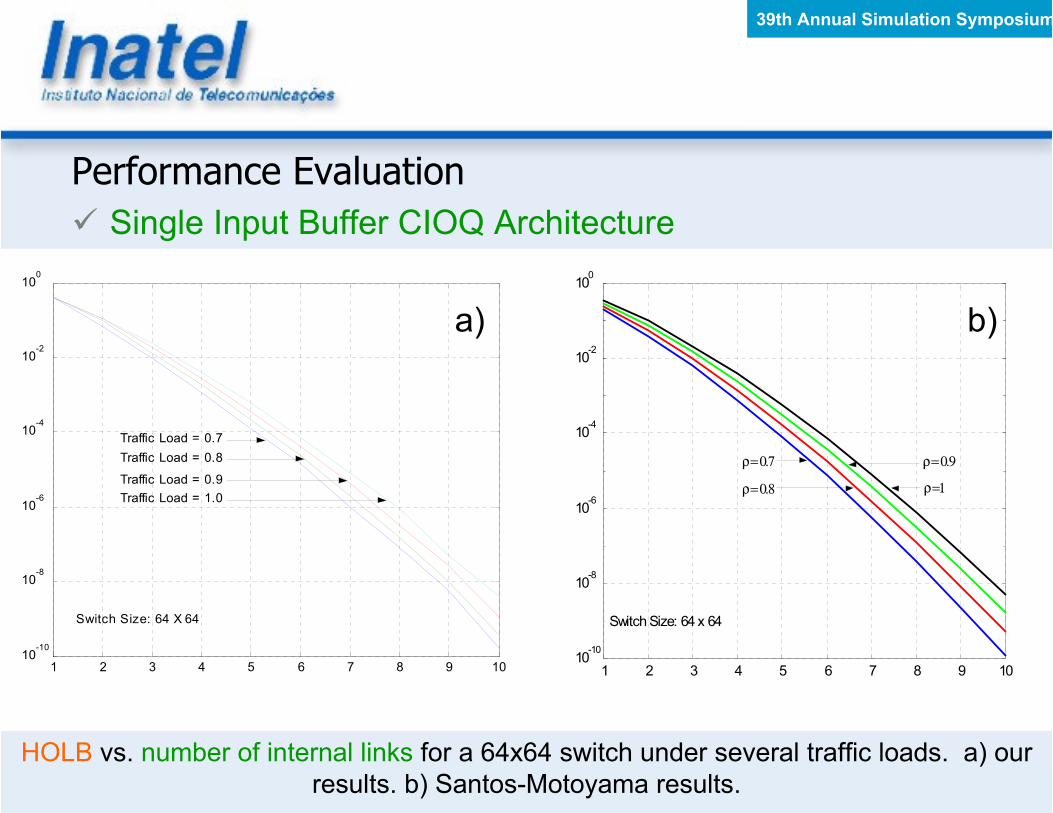
HOLB vs. number of internal links for a 64x64 switch under several traffic loads. a) our
results. b) Santos-Motoyama results.
39th Annual Simulation Symposium
Performance Evaluation
� Single Input Buffer CIOQ Architecture
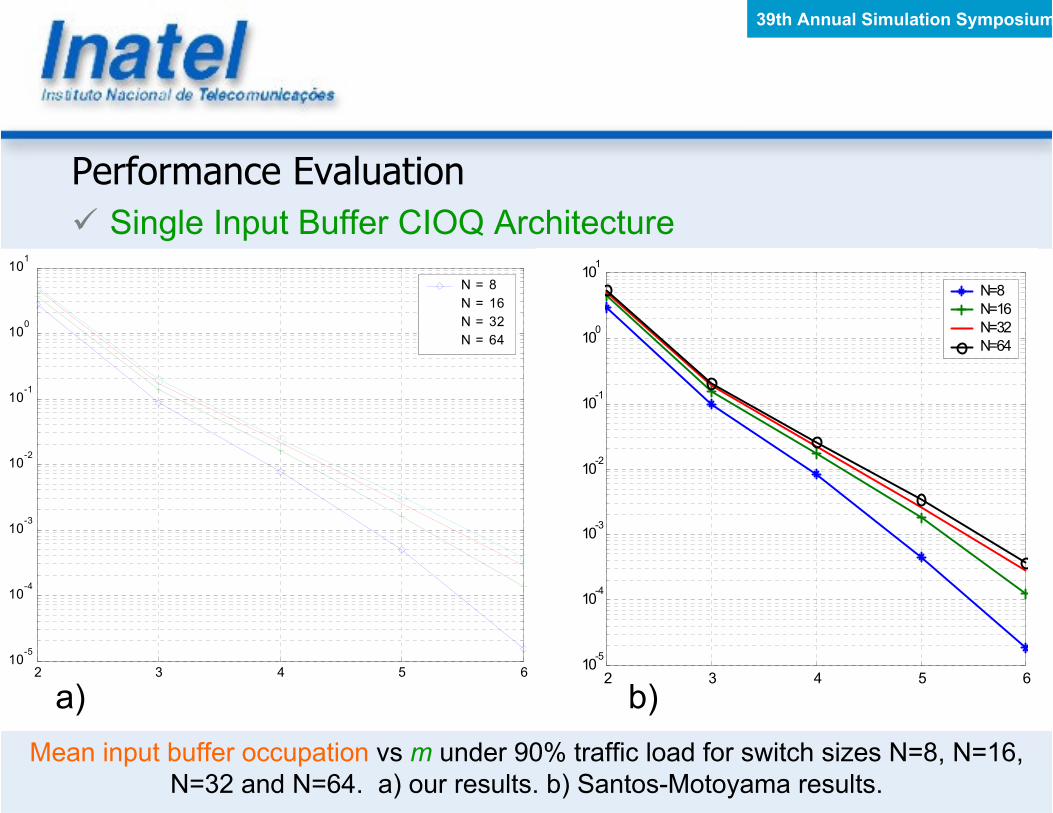
Mean input buffer occupation vs m under 90% traffic load for switch sizes N=8, N=16,
N=32 and N=64. a) our results. b) Santos-Motoyama results.
2 3 4 5 610
-5
10-4
10-3
10-2
10-1
100
101
N=8
N=16
N=32
N=64
2 3 4 5 610
-5
10-4
10-3
10-2
10-1
100
101
N = 8
N = 16
N = 32
N = 64
a) b)
39th Annual Simulation Symposium
Performance Evaluation
� Single Input Buffer CIOQ Architecture
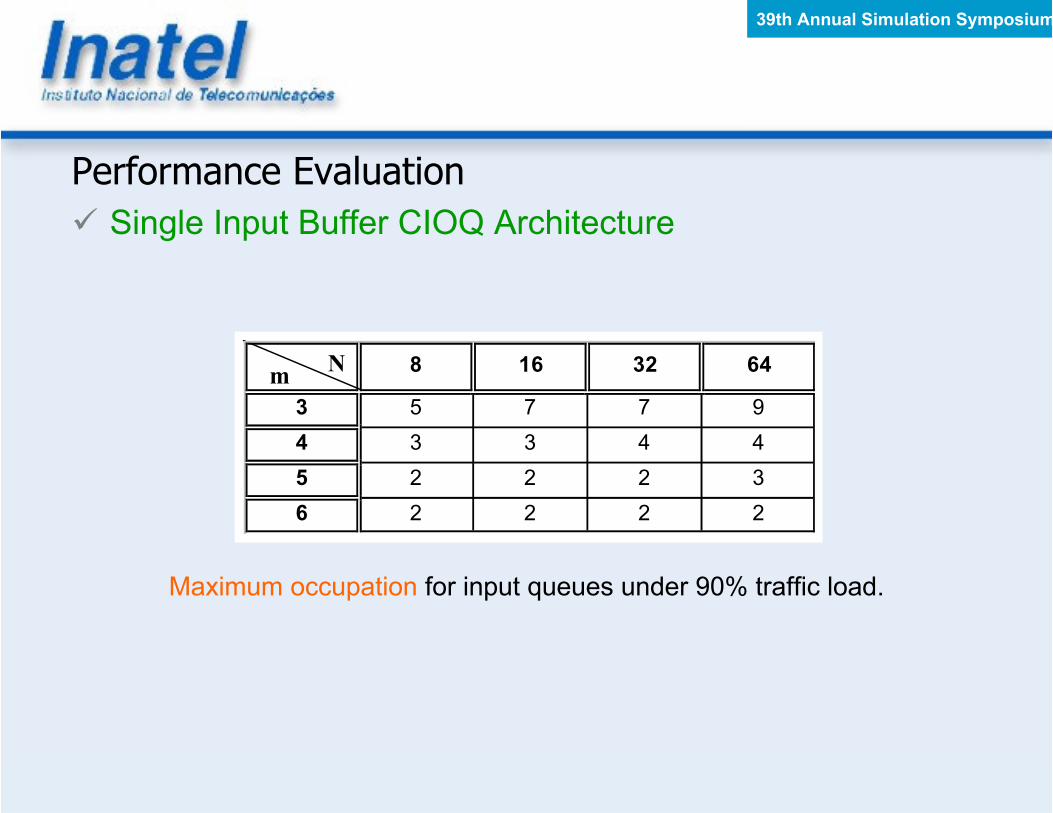
Maximum occupation for input queues under 90% traffic load.
�m
8 16 32 64
3 5 7 7 9
4 3 3 4 4
5 2 2 2 3
6 2 2 2 2
39th Annual Simulation Symposium
Performance Evaluation
� Class Based Input Buffer CIOQ Architecture
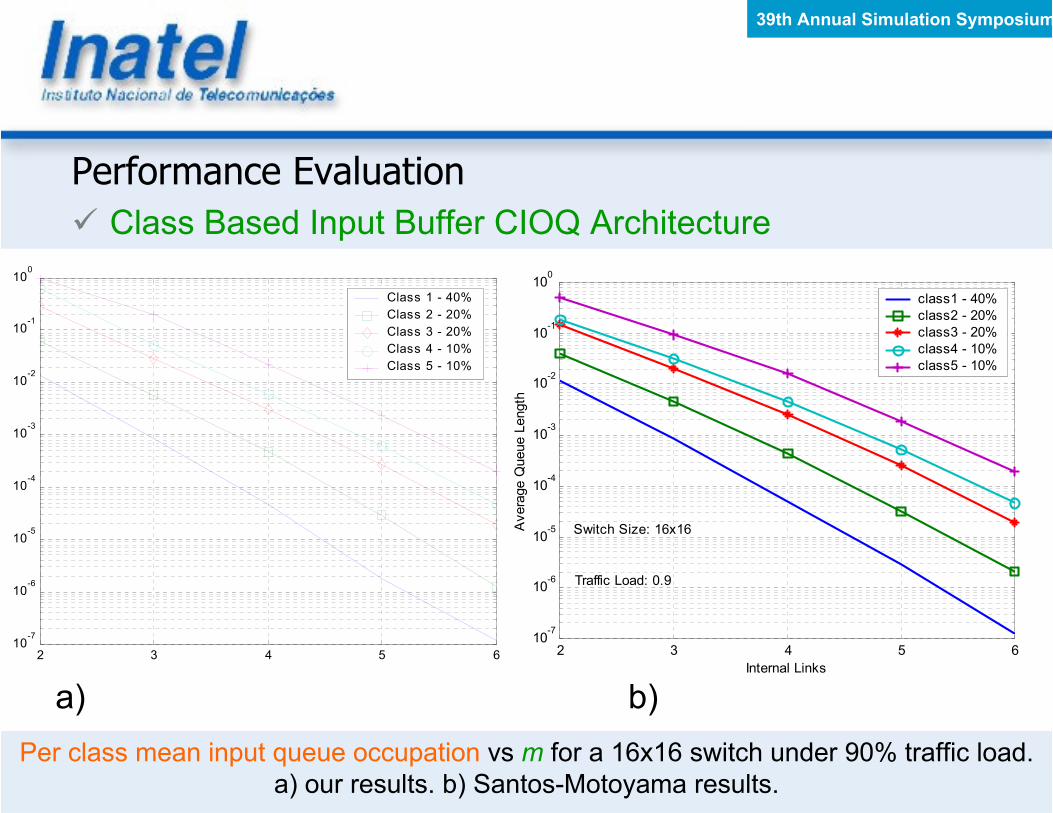
Per class mean input queue occupation vs m for a 16x16 switch under 90% traffic load.
a) our results. b) Santos-Motoyama results.
a)
2 3 4 5 610
-7
10-6
10-5
10-4
10-3
10-2
10-1
100
Internal Links
Average Queue Length
class1 - 40%
class2 - 20%
class3 - 20%
class4 - 10%
class5 - 10%
Switch Size: 16x16
Traffic Load: 0.9
2 3 4 5 610
-7
10-6
10-5
10-4
10-3
10-2
10-1
100
Class 1 - 40%
Class 2 - 20%
Class 3 - 20%
Class 4 - 10%
Class 5 - 10%
b)
39th Annual Simulation Symposium
Performance Evaluation
� Class Based Input Buffer CIOQ Architecture
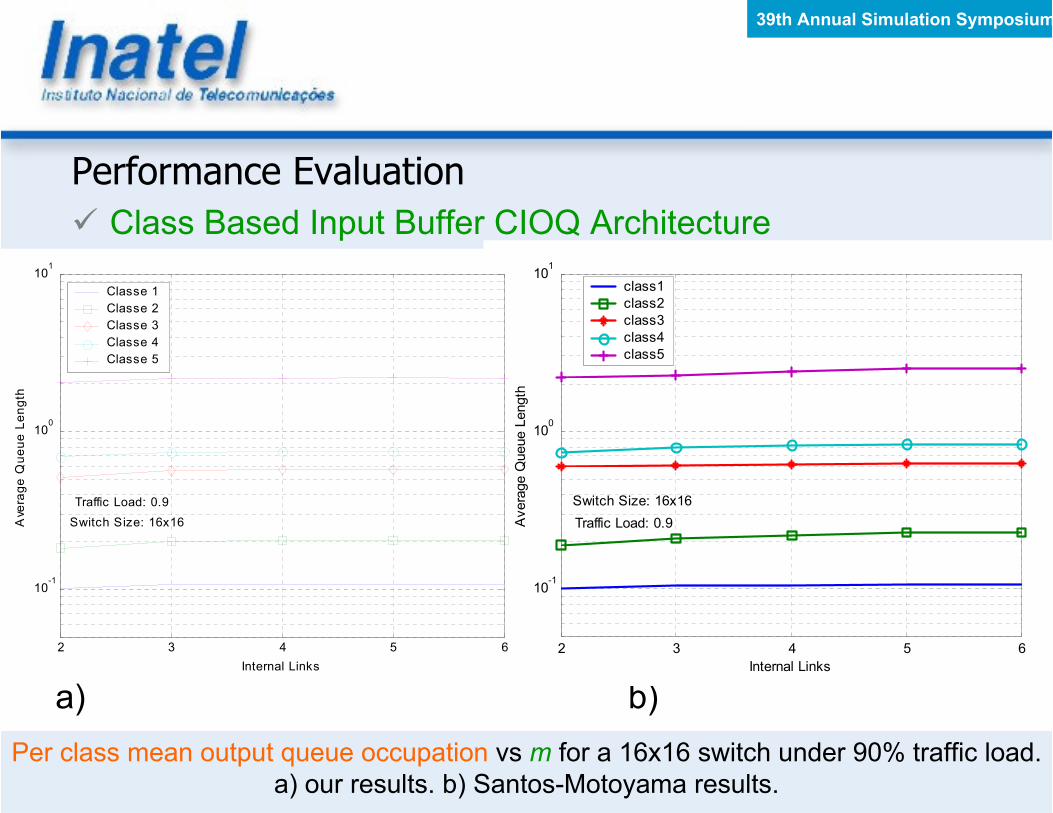
Per class mean output queue occupation vs m for a 16x16 switch under 90% traffic load.
a) our results. b) Santos-Motoyama results.
a) b)
2 3 4 5 6
10-1
100
101
Internal Links
Average Queue Length
class1
class2
class3
class4
class5
Switch Size: 16x16
Traffic Load: 0.9
2 3 4 5 6
10-1
100
101
Internal Links
Average Q
ueue Length
Classe 1
Classe 2
Classe 3
Classe 4
Classe 5
Switch Size: 16x16
Traffic Load: 0.9
39th Annual Simulation Symposium
Final Remarks
� We presented modeling, simulation and performance
evaluation of two Santos-Motoyama CIOQ architectures.
� We validated and compared results with SM previous work.
� We proved that the studied CIOQs can reduce HOLB using a
simple solution and without high speed rates inside the
switch, producing a good improvement with regard to Input
Queueing, not only in terms of occupation reduction, but also
in terms of HOLB decrease.
� Future works include performance evaluation under other