20
April 15, 2010
| Date post: | 02-Jan-2016 |
| Category: |
Documents |
| Upload: | heather-noble |
| View: | 28 times |
| Download: | 0 times |
April 15, 2010

Revised Fiscal Year 2011 Proposed Budget
• October 2009 – General Fund shortfall for Fiscal Year 2011 identified as $179 million
• December 2009 – City Council adopts 18-month budget to close $179 million shortfall with one-time and on-going solutions
• April 2010 – Proposed budget solves additional $28 million deficit caused by
o Slow economic recovery
o Revenue losses
o Adjustment to ARC payment
2

Fiscal Year 2011 Budget Solutions
• $96.8 million in one-time solutions adopted by City Council in December 2009:
• $82.3 million in on-going solutions adopted by City Council in December 2009
• $28 million proposed solutions
3

On-going SolutionsAdopted in December 2009
• On-going Revenue
Parking Utilization Study $2.6 M
$1.1 M
$1.4 M
Other $2.3 M
ADA/Deferred Maintenance Crew Transfer
Tenant Improvements/Deferred Maintenance Crew Transfer
4
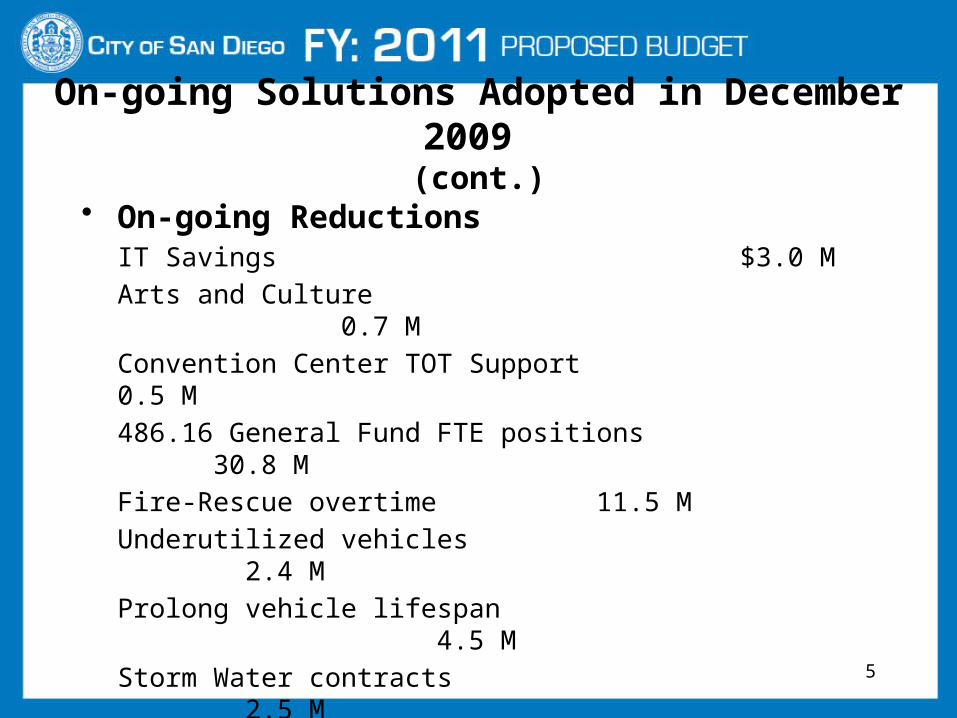
On-going Solutions Adopted in December 2009 (cont.)
• On-going ReductionsIT Savings $3.0 M
Arts and Culture 0.7 M
Convention Center TOT Support 0.5 M
486.16 General Fund FTE positions 30.8 M
Fire-Rescue overtime 11.5 M
Underutilized vehicles 2.4 M
Prolong vehicle lifespan 4.5 M
Storm Water contracts 2.5 M
Other department supplies and services 19.0 M _________________________________________________________________________________________________
Total on-going solutions $82.3 M
5

Closing the Projected Deficit in the FY 2011 Proposed General Fund Budget
Departmental Savings in Fleet Costs $ 11.0 million
Savings in Departmental Reductions in Services, Supplies and Equipment
$ 7.5 million
Savings in Retiree Health Care Annual Costs $ 3.0 million
Restructuring of Settlement Agreementfor Alleged Underfunding of Pension System (1996-2006)
$ 6.7 million
Total $28.2 million
6
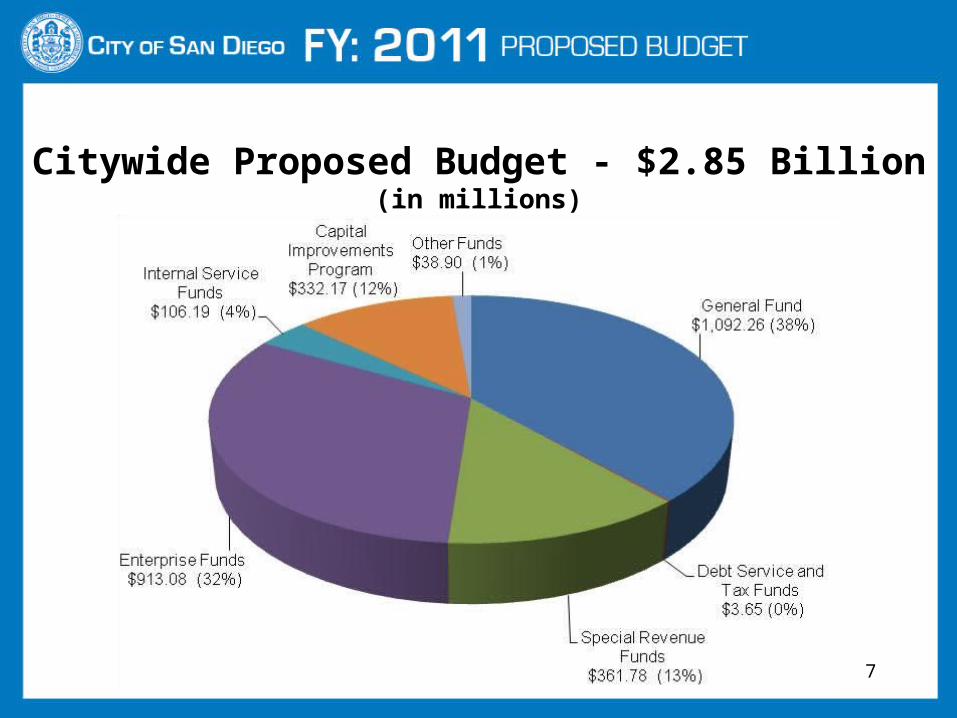
Citywide Proposed Budget - $2.85 Billion(in millions)
7
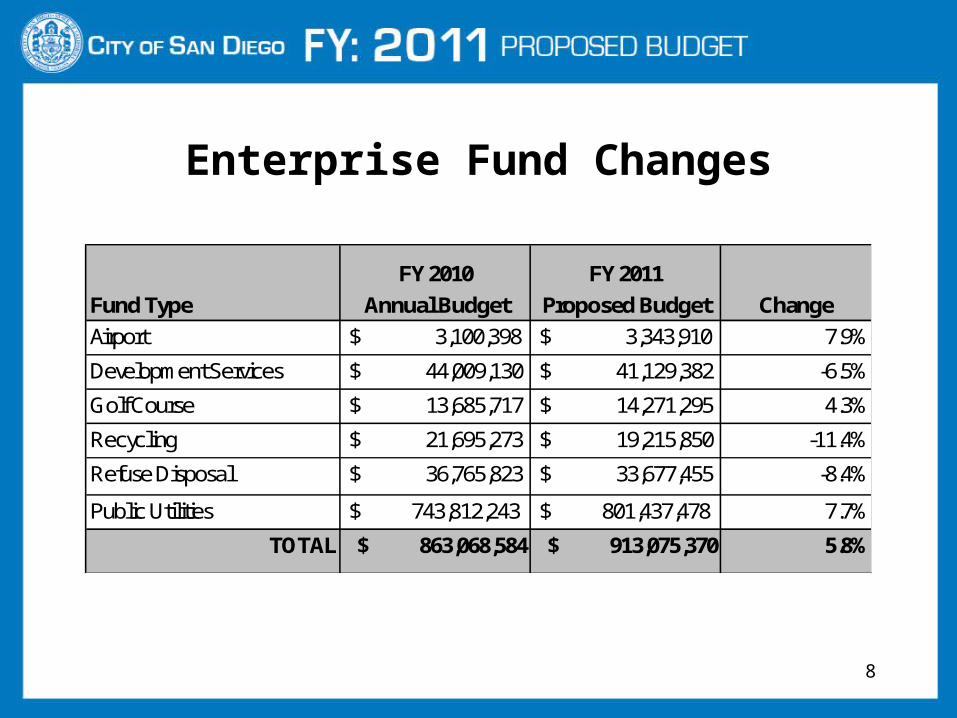
Enterprise Fund Changes
Fund Type
FY 2010
Annual Budget
FY 2011
Proposed Budget Change
Airport $ 3,100,398 $ 3,343,910 7.9%
Development Services $ 44,009,130 $ 41,129,382 -6.5%
Golf Course $ 13,685,717 $ 14,271,295 4.3%
Recycling $ 21,695,273 $ 19,215,850 -11.4%
Refuse Disposal $ 36,765,823 $ 33,677,455 -8.4%
Public Utilities $ 743,812,243 $ 801,437,478 7.7%
TOTAL $ 863,068,584 $ 913,075,370 5.8%
8

Reductions to City Staff(rounded to nearest FTE)
Positions FY 2010Annual Budget
FY 2011Proposed Budget
Change
Citywide 10,572 10,231 -3.2 %
General Fund 7,397 7,061 -4.5 %
9
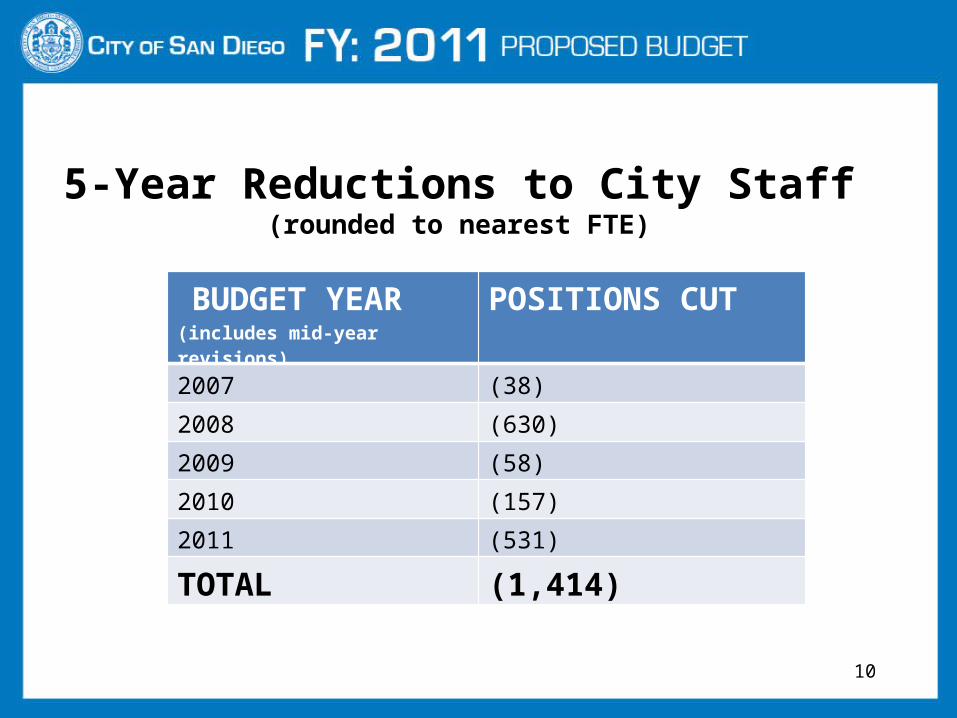
5-Year Reductions to City Staff(rounded to nearest FTE)
BUDGET YEAR(includes mid-year revisions)
POSITIONS CUT
2007 (38)
2008 (630)
2009 (58)
2010 (157)
2011 (531)
TOTAL (1,414)
10

General Fund Expenditures - $1.09 Billion(in millions)
11

General Fund Budgeted Positions Fiscal Year 2011
12
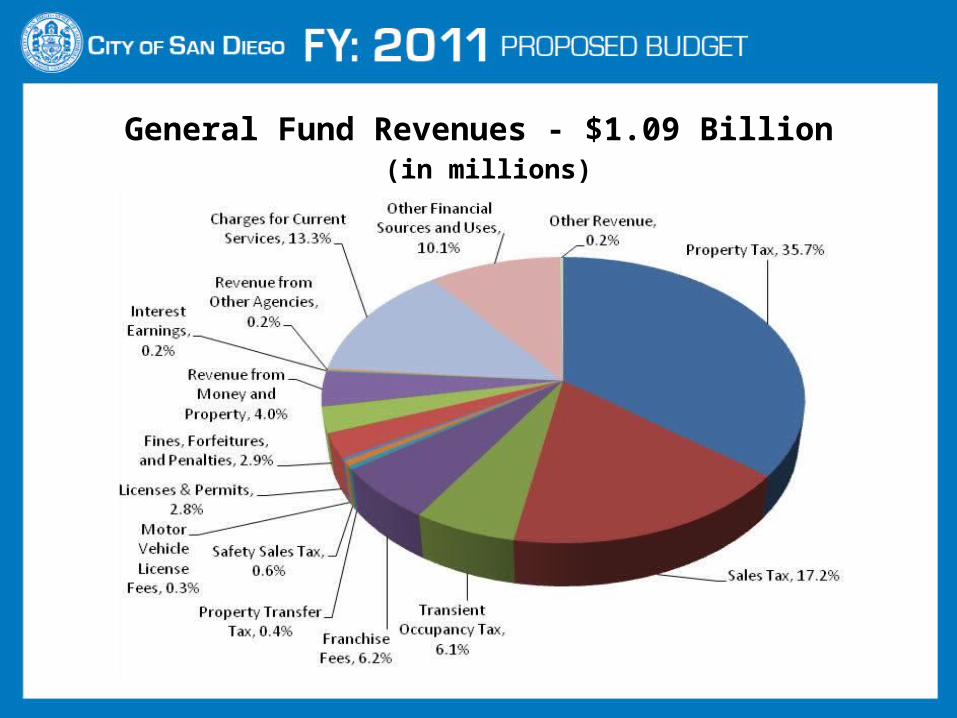
General Fund Revenues - $1.09 Billion (in millions)
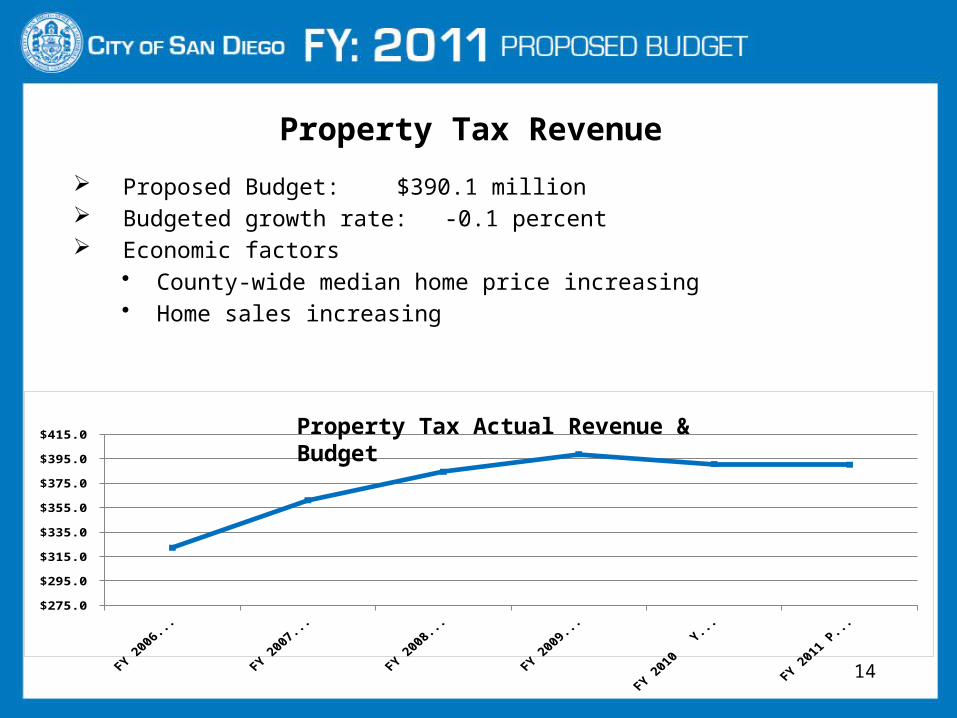
Property Tax Revenue
Proposed Budget: $390.1 million Budgeted growth rate: -0.1 percent Economic factors
• County-wide median home price increasing• Home sales increasing
FY 2006 Actuals FY 2007 Actuals FY 2008 Actuals FY 2009 Actuals FY 2010 Year-End Projection
FY 2011 Proposed Budget
$275.0
$295.0
$315.0
$335.0
$355.0
$375.0
$395.0
$415.0 Property Tax Actual Revenue & Budget
14
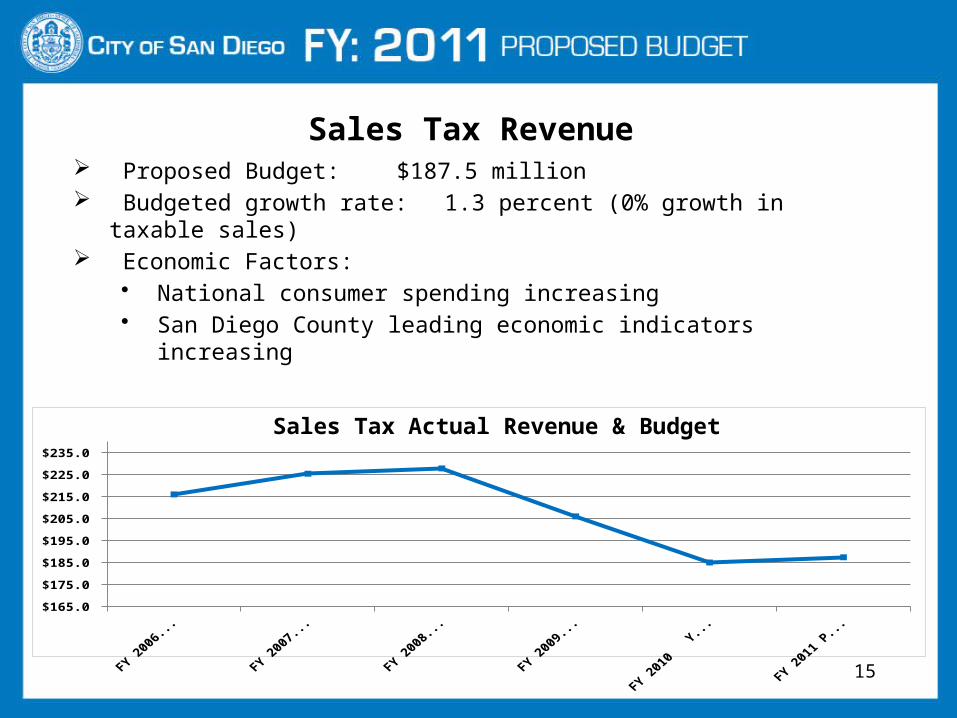
Sales Tax Revenue Proposed Budget: $187.5 million Budgeted growth rate: 1.3 percent (0% growth in taxable sales) Economic Factors:
• National consumer spending increasing• San Diego County leading economic indicators increasing
FY 2006 Actuals FY 2007 Actuals FY 2008 Actuals FY 2009 Actuals FY 2010 Year-End Projection
FY 2011 Proposed Budget
$165.0
$175.0
$185.0
$195.0
$205.0
$215.0
$225.0
$235.0
Sales Tax Actual Revenue & Budget
15
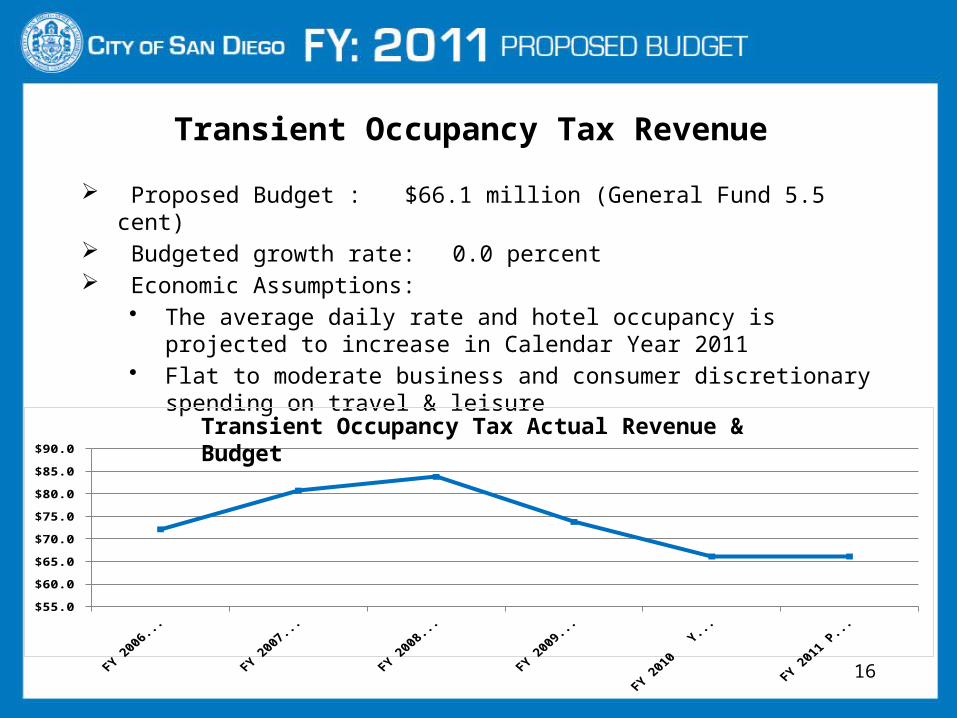
Transient Occupancy Tax Revenue
Proposed Budget : $66.1 million (General Fund 5.5 cent) Budgeted growth rate: 0.0 percent Economic Assumptions:
• The average daily rate and hotel occupancy is projected to increase in Calendar Year 2011
• Flat to moderate business and consumer discretionary spending on travel & leisure
FY 2006 Actuals FY 2007 Actuals FY 2008 Actuals FY 2009 Actuals FY 2010 Year-End Projection
FY 2011 Proposed Budget
$55.0
$60.0
$65.0
$70.0
$75.0
$80.0
$85.0
$90.0
Transient Occupancy Tax Actual Revenue & Budget
16

Franchise Fee Revenue
Proposed Budget : $67.2 million (General Fund) Budgeted growth rate: -4.3 percent Economic Assumptions:
• Declining revenue for SDG&E• Modest increase in tonnage of refuse hauled
FY 2006 Actuals FY 2007 Actuals FY 2008 Actuals FY 2009 Actuals FY 2010 Year-End Projection
FY 2011 Proposed Budget
$50.0
$55.0
$60.0
$65.0
$70.0
$75.0
Franchise Fee Actual Revenue & Budget
17
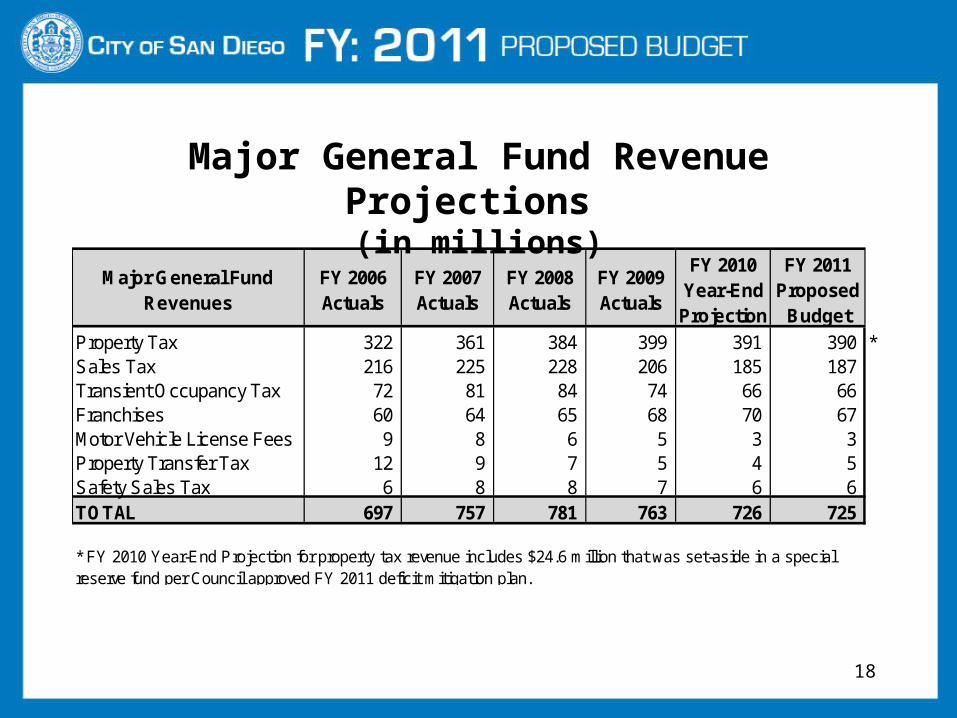
Major General Fund Revenues
FY 2006 Actuals
FY 2007 Actuals
FY 2008 Actuals
FY 2009 Actuals
FY 2010 Year-End Projection
FY 2011 Proposed
Budget
Property Tax 322 361 384 399 391 390 *Sales Tax 216 225 228 206 185 187Transient Occupancy Tax 72 81 84 74 66 66Franchises 60 64 65 68 70 67Motor Vehicle License Fees 9 8 6 5 3 3Property Transfer Tax 12 9 7 5 4 5Safety Sales Tax 6 8 8 7 6 6TOTAL 697 757 781 763 726 725
* FY 2010 Year-End Projection for property tax revenue includes $24.6 million that was set-aside in a special reserve fund per Council approved FY 2011 deficit mitigation plan.
Major General Fund Revenue Projections (in millions)
18
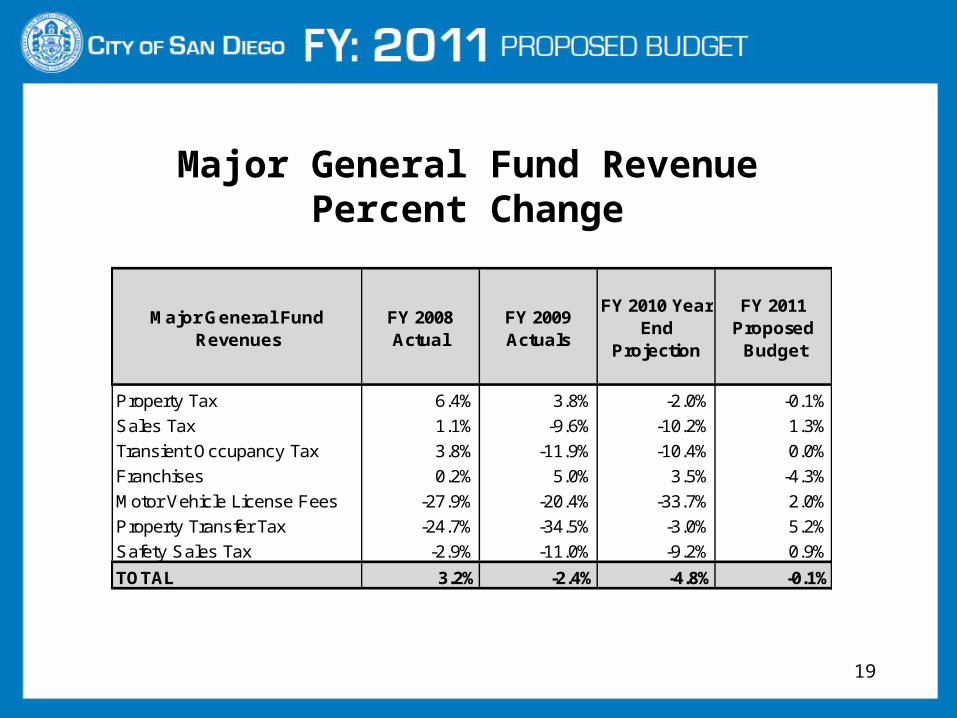
Major General Fund Revenues
FY 2008 Actual
FY 2009 Actuals
FY 2010 Year End
Projection
FY 2011 Proposed
Budget
Property Tax 6.4% 3.8% -2.0% -0.1%
Sales Tax 1.1% -9.6% -10.2% 1.3%
Transient Occupancy Tax 3.8% -11.9% -10.4% 0.0%
Franchises 0.2% 5.0% 3.5% -4.3%
Motor Vehicle License Fees -27.9% -20.4% -33.7% 2.0%
Property Transfer Tax -24.7% -34.5% -3.0% 5.2%
Safety Sales Tax -2.9% -11.0% -9.2% 0.9%
TOTAL 3.2% -2.4% -4.8% -0.1%
Major General Fund Revenue Percent Change
19
Questions
20


![[Kaio]Ujang.15.April.2010 Fuiyo.net](https://static.documents.pub/doc/80x56/55cf97ac550346d03392efb7/kaioujang15april2010-fuiyonet.jpg)


