19
Residential Solar Consumer Insights Energy Resilience, Advertising, Policy Incentives, and Financing April 2021

Residential Solar Consumer Insights Energy Resilience, Advertising, Policy Incentives, and Financing
April 2021

Table of Contents
Executive Summary ………………………………………………………………………………………..….……………. 3
Survey ………………………………………………………………………………………………..……………………………..….... 4
Methodology ……………………………………………………………………………………………….………….. 4
Results ………………………………………………………………………………………………………..……….….….. 5
Case Studies ……………………………………………………………………………………….…………………………….... 8
Timeline from lead to installation…………………………….………………………………... 8
Late-stage lead conversion barriers..………………………………………………….….. 10
Financial incentives awareness gap….………………………………..…………..…………. 12
Installation driver relationships ….…..………………………………………………….………. 14
Energy resilience & natural disasters…..……..…………………………………………….. 16
2
BEACN SOLARREVIEWS
Executive Summary
SolarReviews.com and UC Berkeley's BEACN consulting group surveyed over
400,000 homeowners who requested a solar quote on a SolarReviews website
between 2016 and 2020. This is one of the largest surveys of homeowners
considering solar to date, covering questions about financing choice, storage, and
key drivers or barriers that influenced homeowners’ decisions. The results of this
survey are examined in five case studies that highlight interesting developments in
residential solar. Each case study has greater potential to be explored and provide
novel insights. These case studies include findings in storage and energy
resilience, the effects of homeowner awareness of financial incentives on solar
adoption, and other areas. Further analysis into the case study findings and survey
results could support innovation in state and federal solar policy, marketing
techniques, and improved installer-to-consumer communication.
3
BEACN SOLARREVIEWS
Survey Methodology
Survey introduction
To better understand what factors motivate people togo solar and what factors turn people away, 400,000homeowners who had submitted a request for aquote from a SolarReviews service between 2016and 2020 were surveyed. This survey identifiedwhich interested individuals installed solar with theintent to uncover useful trends in residential solaradoption.
Given the target population of these 400,000homeowners, 384 completed surveys were neededfor a 95% confidence interval. The total number ofresponses received for this survey was over 5,300 —which well exceeded the 384 needed responses forrobust results.
The goal of this survey was to identify factors thataffect the adoption of residential solar. This includesbottlenecks in the installation process, customer perceptions of the process, and customer knowledge offinancial and non-financial benefits, as well as other factors.
Survey representativeness and bias
Because the survey was only sent to homeowners who interacted with SolarReviews, it is implied thatrespondents were interested in installing solar panels at one point. Thus, this survey is representative ofnationwide homeowners who have had some degree of interest in solar installation. In addition, those whowere previously interested in solar but did not install were less likely to respond to the survey due to theirlack of engagement with the solar industry.
4

BEACN SOLARREVIEWS
Survey Results
By the numbers
How important were thefollowing factors in yourdecision to install orconsider solar?
According to the survey, the primarymotivation for installing solar waspotential savings on electricity bills.
Interestingly, the second and third mostimportant drivers were disasterresilience and reduced emissions.
This implies that solar has the potentialto tap into markets that experiencepower outages due to natural disasters,heat waves, or unreliable utility service.
Increased home value was rated as “Important” or higher by 59.8% of respondents, showing thatconsumers are considering the additional equity that an owned solar system can add to the home.
Another unique find was that support for local jobs was important for 52.4% of respondents.
5

BEACN SOLARREVIEWS
How important were the following financial incentives in yourdecision to install solar?
The federal tax credit was the single-most important financial incentive to respondents.
Net metering was the second-mostimportant overall with 84.6% ofrespondents rating it with a score of“Important” or higher. Rebates andstate/local tax credits were the secondand third most salient options in termsof “Very Important” ratings.
The least popular, though stillimportant incentive was SolarRenewable Energy Credits (SRECs).Only available in a few states, SRECsare certificates sold by homeowners toutilities based on the extra energytheir solar panels produce.
Please rate how each of these factors played into your overalldecision to not install solar
The data clearly shows that the upfront cost of solar is the most significant barrier to installing solar, with72.5% of respondents rating it with ascore of “Important” or higher.
Lack of financing came in second place,and although less striking than upfrontcost, it was considered a significantbarrier by 36.1% of respondents.
Interestingly, respondents ratedconfusion with the process of installingsolar as more of an issue thanpermitting and location, ranking it as thethird-most significant factor influencingtheir decision not to go solar.
Permitting and location concerns can besignificant, but are mainly issues inareas where the permitting process
hasn’t been streamlined, and for homeowners with shaded homes or other location-specific issues. Thisrelatively high rating for process confusion implies that giving potential customers a clearer understandingof the process early on, along with information and resources that streamline the process, can increasethe odds of them following through with their intent of installing solar.
6

BEACN SOLARREVIEWS
What is the size of your solarsystem in kW?
The median solar system size of those surveyed wasaround 11 kW of capacity.
There were, however, a significant number of systemswith over 20 kW of capacity; from our findings, itappears that residential system size follows aright-skew distribution.
Have you installed a battery storagesystem?
Of the respondents that have solar, 11.5% alsohave a battery storage system installed. Of thatpercentage, 88.7% installed their storage systemless than 6 months before or after installing solar.
This shows that if a homeowner is consideringinstalling solar with storage, they’ll most likelypurchase each within a short period of oneanother to reap the immediate benefits thatfinancial savings and energy independence offer.
Since 2016, there has been clearyear-over-year growth in batterystorage installations for homeownerswho install solar.
In fact, around 71% of installations overthe last five years took place in 2020.This trend is likely to continue, due tointerest in solar for disaster resiliencewhich can be enhanced by the use of abattery.
7

BEACN SOLARREVIEWS
Case Study: Timeline from Lead to Installation
Three months is the most common lead to installation timeline
This chart displays the distribution of the timebetween requesting a solar quote andinstalling a photovoltaic system within thefirst year. There is a clear peak at threemonths, followed by a gradual decrease ininstallations throughout the rest of the year.From the data, we determined that 37% offirst-year installations occurred within threemonths of the original quote.
But that does not mean homeowners shouldbe forgotten if they have not installed within3 months because 33% of first-yearinstallations occurred more than six monthsafter receiving an original quote.
FIGURE 1: A histogram of the time between lead creation and installation for consumers who installed a system within oneyear of requesting a quote (excluding leads generated within a year of the survey)
Pre-2018 leads show that solar searchers remain interested ininstallation long term
Within Figure 2 below, the distribution over several years between requesting a solar quote and installinga photovoltaic system is displayed. Because of the long installation window, this chart is limited torespondents who first requested a quote prior to 2018.
Contrary to the pattern of gradually declining installations in the one year case, these respondentsinstalled more systems during the 2+ years after receiving their initial quote versus within the originalyear. This may be partly driven by the reduction in the cost of solar installations during that time or by therapid growth in the overall solar market.
It is clear that the interest in going solar among those who have sought out quotes does remain strong foryears after the original quote was received. For instance, 68% of all survey respondents who have notyet installed solar and were not in the process of doing so, indicated that they were still interested ininstalling a solar system in the future.
8

FIGURE 2: A histogram of the time between lead and installation for consumers who installed a system within four years ofrequesting a quote. (excluding leads generated after 2017)
One of the most interesting findings was the fact that leads from the earliest surveyed time period (Jan.2016) were still getting solar installed at the end of 2020. These results offer exciting possibilities forinstallers to enhance their marketing and communications efforts to close sales for years after a lead isreceived.
Recommendations
Although closing a lead quickly is the best-case scenario, the survey data supports the theory that with anexpensive elective purchase like solar, some homeowners need a long period of time to make a decision,and that long-term marketing and measurement of lead success may provide significant value to installers.
9
BEACN SOLARREVIEWS
Case Study: Late-Stage Lead Conversion Barriers
Analysis of respondents who nearly installed residential solar
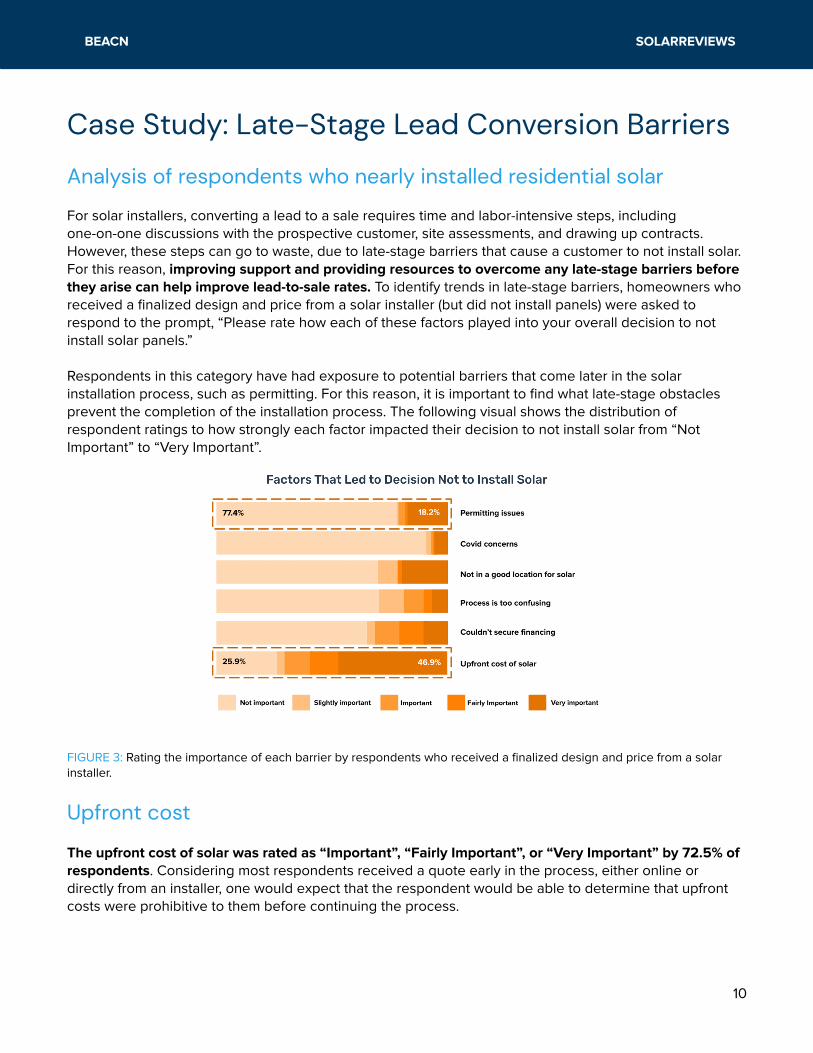
For solar installers, converting a lead to a sale requires time and labor-intensive steps, includingone-on-one discussions with the prospective customer, site assessments, and drawing up contracts.However, these steps can go to waste, due to late-stage barriers that cause a customer to not install solar.For this reason, improving support and providing resources to overcome any late-stage barriers beforethey arise can help improve lead-to-sale rates. To identify trends in late-stage barriers, homeowners whoreceived a finalized design and price from a solar installer (but did not install panels) were asked torespond to the prompt, “Please rate how each of these factors played into your overall decision to notinstall solar panels.”
Respondents in this category have had exposure to potential barriers that come later in the solarinstallation process, such as permitting. For this reason, it is important to find what late-stage obstaclesprevent the completion of the installation process. The following visual shows the distribution ofrespondent ratings to how strongly each factor impacted their decision to not install solar from “NotImportant” to “Very Important”.
FIGURE 3: Rating the importance of each barrier by respondents who received a finalized design and price from a solarinstaller.
Upfront cost
The upfront cost of solar was rated as “Important”, “Fairly Important”, or “Very Important” by 72.5% ofrespondents. Considering most respondents received a quote early in the process, either online ordirectly from an installer, one would expect that the respondent would be able to determine that upfrontcosts were prohibitive to them before continuing the process.
10

BEACN SOLARREVIEWS
Based on these results, however, we can see this is not the case. These respondents received anestimate, communicated with installers, had an on-site evaluation, and received a finalized price beforedeciding that the price exceeded their willingness to pay.
Further research is needed to determine why some respondents continued the process after receiving theinitial price estimate. Some possible hypotheses are inability to qualify for acceptable financing terms,potential aversion to financial commitment from the homeowner, or lack of understanding regarding thetrue ROI of a home solar installation.
Higher availability of zero-down or deferred financing options which are personalized to the homeowners’financial situation could help with their willingness to commit financially.
Permitting
The impact of permitting issues was nearly binary because every respondent who almost installed solarclassified permitting issues as one of the ends of the spectrum, either “Not Important” or “Very Important”,with very few in between.
For the majority of respondents who did not install solar, permitting was entirely insignificant and mostlyranked as “Not Important” (77.4%). This indicates that for the typical homeowner who reaches an advancedstage in the process of installing solar, permitting is likely not a factor in the decision not to install.
18.2% of respondents did rate permitting as “Very Important”.
Permitting requirements can be costly, both in terms of time and money, and vary by locality. Perhaps theimpact of permitting issues for this 18.2% is at least partially a reflection of local laws and restrictions, withthose finding it prohibitive where the process is less streamlined.
11

BEACN SOLARREVIEWS
Case Study: Financial Incentives Awareness Gap
Higher awareness of incentives and financing options could lead tomore installations
FIGURE 4: This bar chart compares the proportion of respondents who inquired about installing solar and the steps in thelead conversion process they completed, but ultimately did not install solar. The respondents were either aware (dark blue)or unaware (light blue) of financial incentives.
Of the survey respondents, 52% were aware of at least one financial incentive for installing solar. As seenin Figure 4 above, a similar percentage (~79%), of both financial incentive aware and unaware-respondentsresearched solar online. This is surprising because online research should yield results about financialincentives.
Awareness of financial incentives was strongly correlated with completing each of the other solarinstallation steps in the survey, as in, more likely to communicate with a solar installer, have an on-siteassessment, and so on. This suggests that the incentives are working as intended and that raisingawareness of them might increase solar adoption.
12
BEACN SOLARREVIEWS
Thus, increasing consumer awareness of financial incentives would help address the pain point ofupfront costs noted in the first case study. One popular incentive that has greatly increased the adoptionof solar is the Solar Massachusetts Renewable Target program, aptly nicknamed the SMART program,which pays solar homeowners a fixed rate per kilowatt-hour of solar energy produced for 10 years. Thestructure of the SMART program encourages homeowners to go solar sooner, promotes the adoption ofbattery storage, and provides enough savings to cut the payback period of a solar panel system installedin Massachusetts in half.
Because each state that offers solar incentives has their own specific program, creating a generaleducation campaign would be difficult. The exception to this is the federal tax credit, which represents anopportunity for homeowners in every state to receive a tax credit on the cost to install solar, but this willexpire in 2024 without congressional action.
Another noteworthy result is the low number of respondents who explored different financing options,such as loans specific to solar. The topic of personalized financing is not discussed until later in theinstallation process, after the finalized design and price is set. Therefore, people may not realize thatpersonalized financing plans can reduce the upfront cost and allow them to pay off their solar installationin more manageable amounts over time.
A possible explanation for this trend would be that upfront costs deter potential customers from goingmuch further in the process. As noted in the survey results, financial incentives like the federal tax creditare one of the biggest factors leading to the decision to install solar, but consumers might not be aware ofthese financial incentives. To help convert homeowners who are hesitant about the upfront costs,incentives and personal financing options need to be made available early in the process.
13
BEACN SOLARREVIEWS
Case Study: Installation Driver Relationships
Ranking of drivers
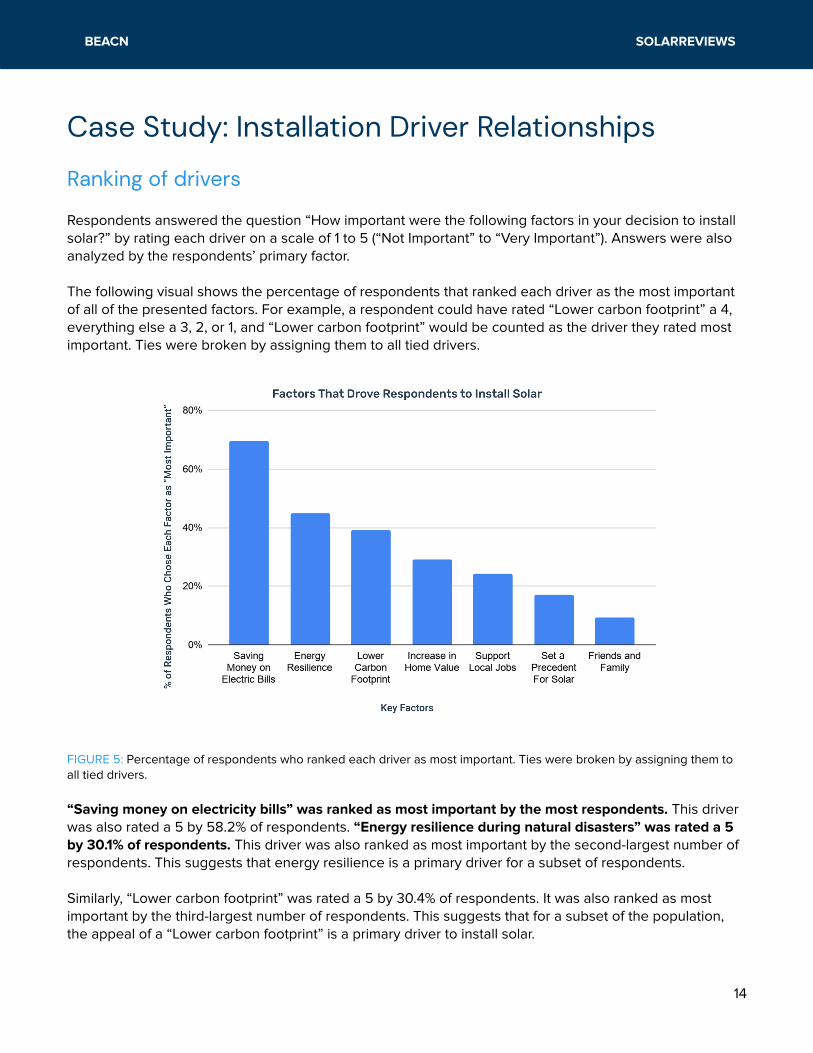
Respondents answered the question “How important were the following factors in your decision to installsolar?” by rating each driver on a scale of 1 to 5 (“Not Important” to “Very Important”). Answers were alsoanalyzed by the respondents’ primary factor.
The following visual shows the percentage of respondents that ranked each driver as the most importantof all of the presented factors. For example, a respondent could have rated “Lower carbon footprint” a 4,everything else a 3, 2, or 1, and “Lower carbon footprint” would be counted as the driver they rated mostimportant. Ties were broken by assigning them to all tied drivers.
FIGURE 5: Percentage of respondents who ranked each driver as most important. Ties were broken by assigning them toall tied drivers.
“Saving money on electricity bills” was ranked as most important by the most respondents. This driverwas also rated a 5 by 58.2% of respondents. “Energy resilience during natural disasters” was rated a 5by 30.1% of respondents. This driver was also ranked as most important by the second-largest number ofrespondents. This suggests that energy resilience is a primary driver for a subset of respondents.
Similarly, “Lower carbon footprint” was rated a 5 by 30.4% of respondents. It was also ranked as mostimportant by the third-largest number of respondents. This suggests that for a subset of the population,the appeal of a “Lower carbon footprint” is a primary driver to install solar.
14

BEACN SOLARREVIEWS
Further analysis should be conducted to determine characteristics of these subsets of the population forwhom different factors are the primary driver.
“Friends and family recommended installing solar” was ranked as most important by the smallest numberof respondents. Furthermore, the mean rating of this factor for respondents who rated it as most importantwas only a 2.7, between “Slightly Important” and “Important” on the given scale.
This low value, while still being the highest rating for these respondents, suggests perhaps theserespondents did not see their primary driver in installing solar represented in possible answer choices,were conservative in rating strongly, or some other unknown factor. Further research should be conductedto determine what is causing these respondents to rate all driver options relatively low.
Correlation matrix of rating of drivers
Figure 6 represents data gathered fromresponses to the question "Howimportant were the following factors inyour decision to install solar?"
To read the matrix, the installation driversare listed on the bottom and left side ofthe matrix. The matrix shows therelationship between these drivers usingcorrelation coefficients between everypossible pair of drivers. 1 = Very strongrelationship and -1 = No relationship.
Since each correlation coefficient waspositive, the data shows thatrespondents who rated any driver highlywere more likely to rate other drivershighly, as well. Especially thoserespondents who rated lower carbonfootprint, supporting local jobs, orsetting a precedent highly, also ratedthe other drivers in this trio highly.
FIGURE 6: Correlation coefficients between each driver based on respondent ratings of each driver responding to thequestion, “How important were the following factors in your decision to install solar?”
This shows that in many cases, there is not one single driver that leads to respondents' decision to installsolar. Additionally, some related drivers, like setting a precedent and supporting local jobs, showcase amindset that is drawn towards solar as a collective good. While other related drivers like saving money onelectric bills, energy resilience, and increase in home value are highly correlated and showcase an“individualistic” mindset.
15

BEACN SOLARREVIEWS
Case Study: Energy Resilience & Natural Disasters
Energy resilience benefits of solar + storage in natural disasters
The United States faced 20 tropical storms in 2020, and each one caused hundreds of power outages1.Anything from lightning to flying debris can damage power lines and cause an interruption to thehousehold power supply. Having a solar power system, with the ability to be independent from the gridusing a storage battery, allows for greater resilience and thus fewer worries about power outagesduring natural disasters.
Solar panels are built to be resistant against a variety of natural disasters, like hail. But, in the case that thesolar system does get damaged and cannot operate properly, warranties or most homeowners insurancepolicies cover the cost of replacing the solar system or panels2.
Many people who expect frequent harsh weather conditions may consider installing solar panels + storagenot only for financial benefits, but also for grid independence and energy security during power outages.
Energy resilience and battery storage
The plot below depicts the distribution of responses, from one to five, to the question, “How important isenergy resilience during natural disasters as a part of your decision to install solar?”
As can be seen in Figure 7, the two groupsdepicted, (those with battery storagesystems and those without), belong tovisibly distinct underlying distributions.
While the distribution of this ranking forthose without storage systems is nearlyuniform, those with energy storagesystems ranked energy resilience as amuch more important factor, with themode being a five. Those without storagesystems found energy resilience to be farless significant, with a mode value of three.
FIGURE 7: The distribution of the importance of energy resilience, from one to five, for those with and without batterystorage systems._1: Natural Disasters in 20202: Nationwide Homeowners Insurance Coverage for Solar Panels
16

BEACN SOLARREVIEWS
Interestingly, however, the importance of energy resilience as a reason to install solar panels did not varysignificantly, according to the most common disaster in the location of the homeowner. The mean valuesfor each disaster type are within a range of 0.12, indicating there is likely little difference in the underlyingdistribution of this parameter when segregated by disaster type.
Future analysis may uncover trends between energy resilience preferences and natural disasterfrequency, or blackout frequency and duration.
FIGURE 8: Mean importance ranking by most frequently-occurring natural disaster in location of the home.
17
BEACN SOLARREVIEWS
Key points derived from the report
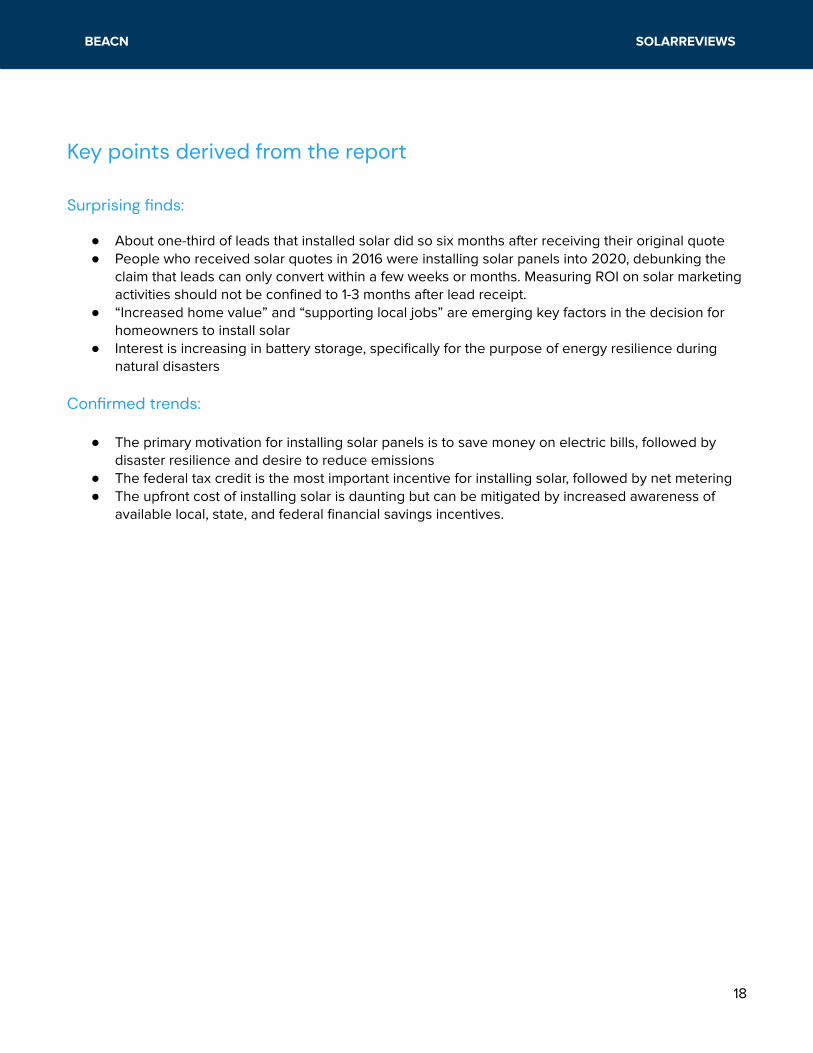
Surprising finds:
● About one-third of leads that installed solar did so six months after receiving their original quote● People who received solar quotes in 2016 were installing solar panels into 2020, debunking the
claim that leads can only convert within a few weeks or months. Measuring ROI on solar marketingactivities should not be confined to 1-3 months after lead receipt.
● “Increased home value” and “supporting local jobs” are emerging key factors in the decision forhomeowners to install solar
● Interest is increasing in battery storage, specifically for the purpose of energy resilience duringnatural disasters
Confirmed trends:
● The primary motivation for installing solar panels is to save money on electric bills, followed bydisaster resilience and desire to reduce emissions
● The federal tax credit is the most important incentive for installing solar, followed by net metering● The upfront cost of installing solar is daunting but can be mitigated by increased awareness of
available local, state, and federal financial savings incentives.
18


