32
Beginning Performance Tuning Session 887 Arup Nanda Longtime Oracle DBA April 22-26, 2012 Mandalay Bay Convention Center Las Vegas, Nevada, USA

Beginning/Performance/TuningSession 887
5rup/Nanda
Longtime/Oracle/DB5
April 22-26, 2012Mandalay Bay Convention CenterLas Vegas, Nevada, USA

About Me
• Oracle DBA for 16 years and counting• Speak at conferences, write articles, 4
books, provide trainings, security audits• Brought up the Global Database Group
at Starwood Hotels, in White Plains, NY• Blog: arup.blogspot.com
2Beginning/Performance/Tuning

Agenda• What this is about?
– You noticed some degradation of performance
– What should you do next?• Where to start• What tool to use
– How to understand the root issue
– For BEGINNERS only
3Beginning/Performance/Tuning
Tools• Nothing to buy• SQL*Plus and internal Oracle
supplied utilities• May be extra-cost

Why Most Troubleshooting Fails• Not systematic or methodical• Not looking at the right places• Confusing Symptoms with Causes• 60% of all issues fall into a pattern
4Beginning/Performance/Tuning
Principle #1
Measure your challenge
5Beginning/Performance/Tuning
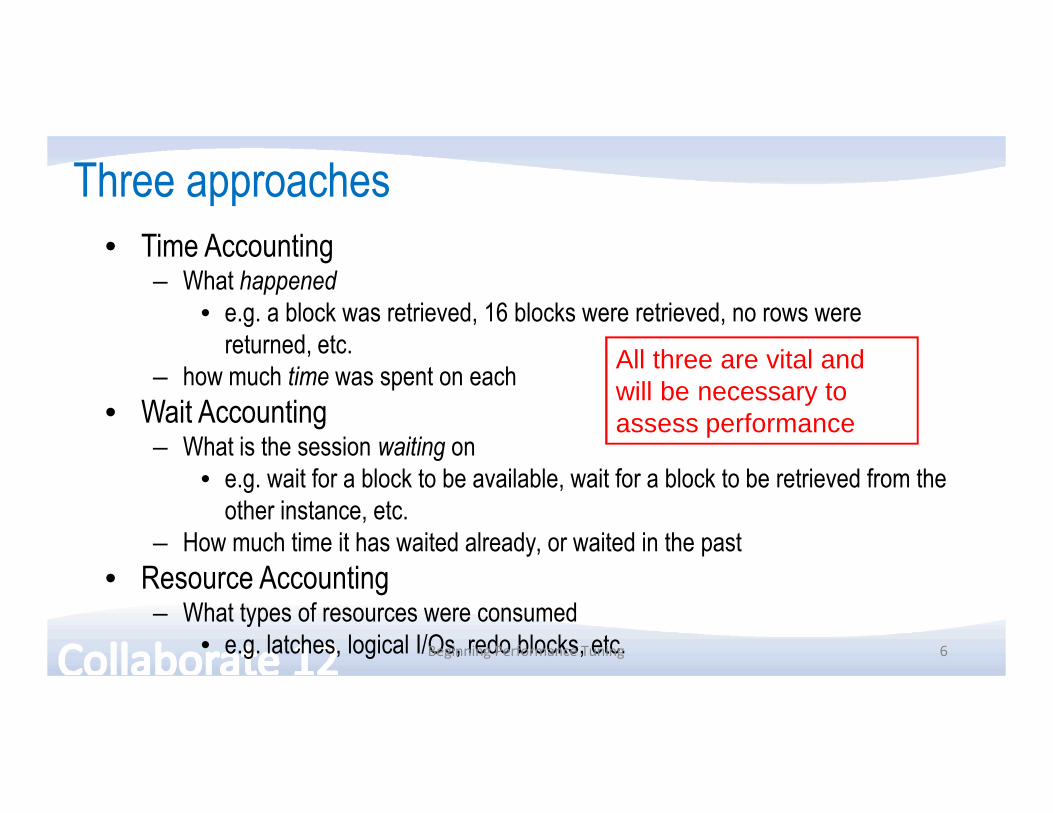
Three approaches• Time Accounting
– What happened• e.g. a block was retrieved, 16 blocks were retrieved, no rows were
returned, etc.– how much time was spent on each
• Wait Accounting– What is the session waiting on
• e.g. wait for a block to be available, wait for a block to be retrieved from the other instance, etc.
– How much time it has waited already, or waited in the past• Resource Accounting
– What types of resources were consumed• e.g. latches, logical I/Os, redo blocks, etc. 6Beginning/Performance/Tuning
All three are vital and will be necessary to assess performance

What�s a Wait?• A process in Oracle can only be in three states
– Doing something Useful (consuming CPU) �.. U– Idle, waiting for some work to be assigned �.. I– Waiting for something, e.g. �.. W
• a block from disk• a lock• a latch (could be waiting on CPU)
• Response time = U + I + W• We must accurately measure each component time before we
decide what and how to tune
7Beginning/Performance/Tuning

Wait Interface• Oracle provides an interface to check what these values
are � useful work, idle time and waits.• The information is available in V$SESSION
– Was in V$SESSION_WAIT in pre-10g– select sid, event, state, wait_time, seconds_in_wait from v$session
• event shows what the session is/was stuck on
8Beginning/Performance/Tuning
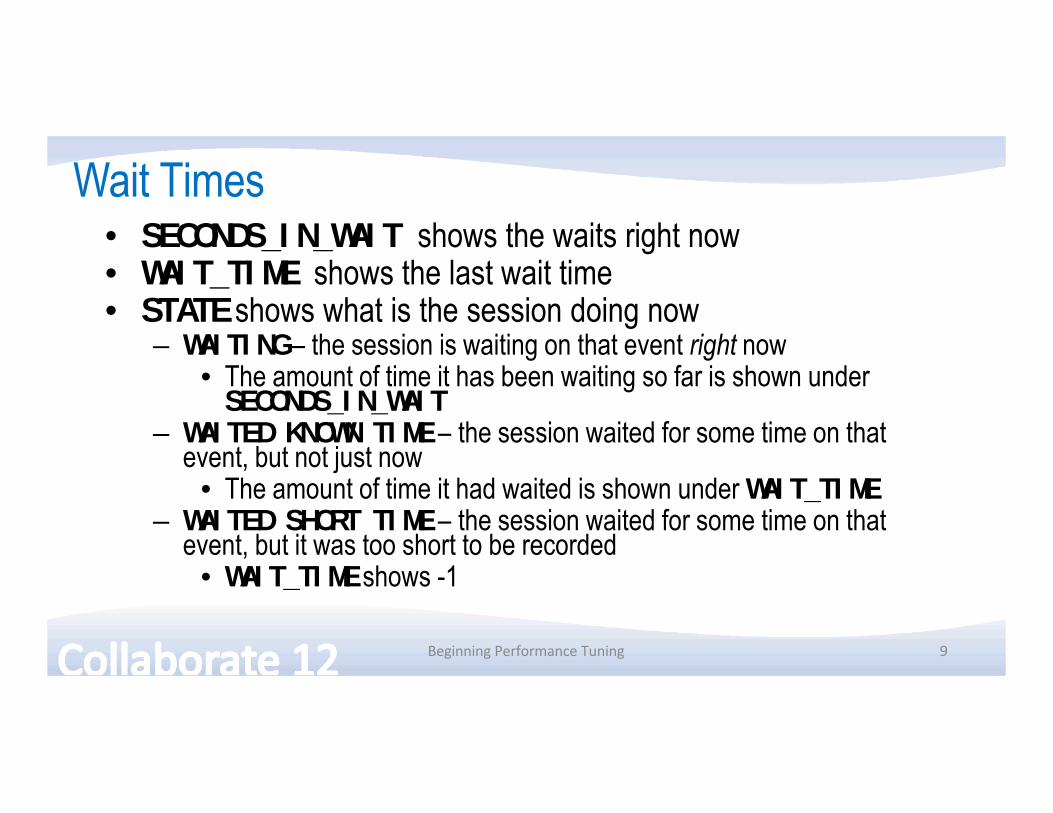
Wait Times• SECONDS_IN_WAIT shows the waits right now• WAIT_TIME shows the last wait time• STATE shows what is the session doing now
– WAITING � the session is waiting on that event right now • The amount of time it has been waiting so far is shown under SECONDS_IN_WAIT
– WAITED KNOWN TIME � the session waited for some time on that event, but not just now
• The amount of time it had waited is shown under WAIT_TIME– WAITED SHORT TIME � the session waited for some time on that
event, but it was too short to be recorded• WAIT_TIME shows -1
9Beginning/Performance/Tuning
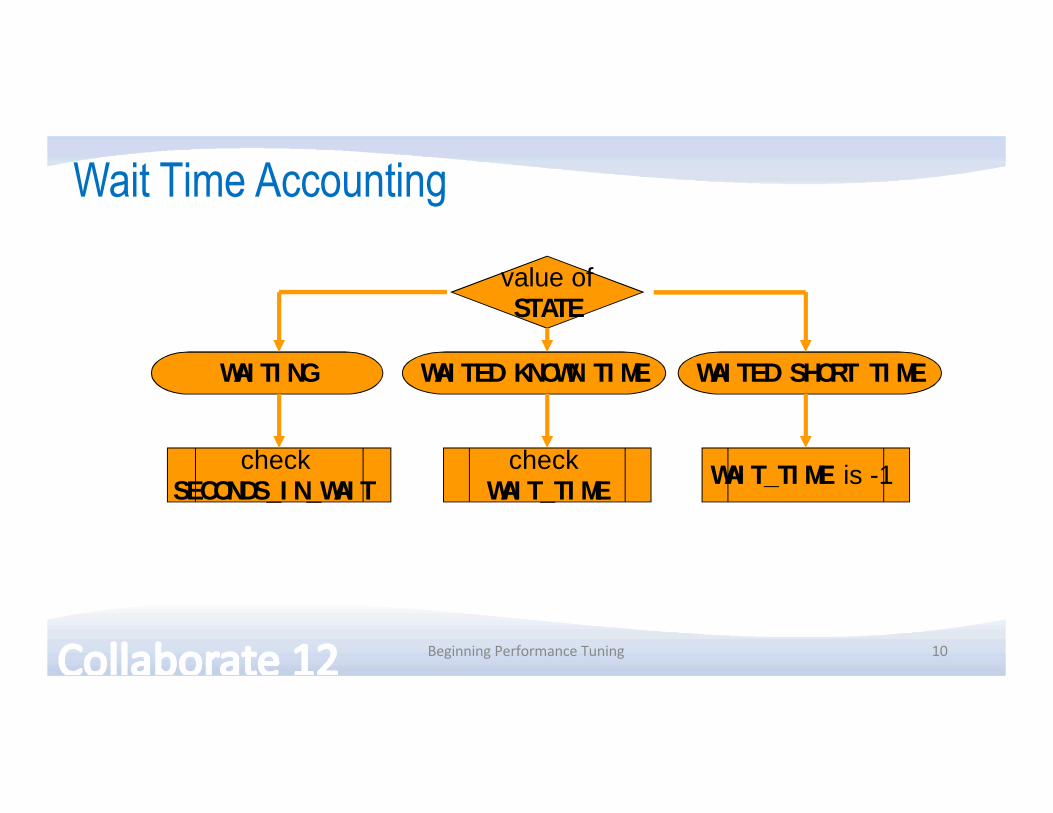
Wait Time Accounting
value ofSTATE
WAITING WAITED KNOWN TIME WAITED SHORT TIME
check SECONDS_IN_WAIT
check WAIT_TIME
WAIT_TIME is -1
10Beginning/Performance/Tuning

Principle #2
Understand the cause of the delay
11Beginning/Performance/Tuning
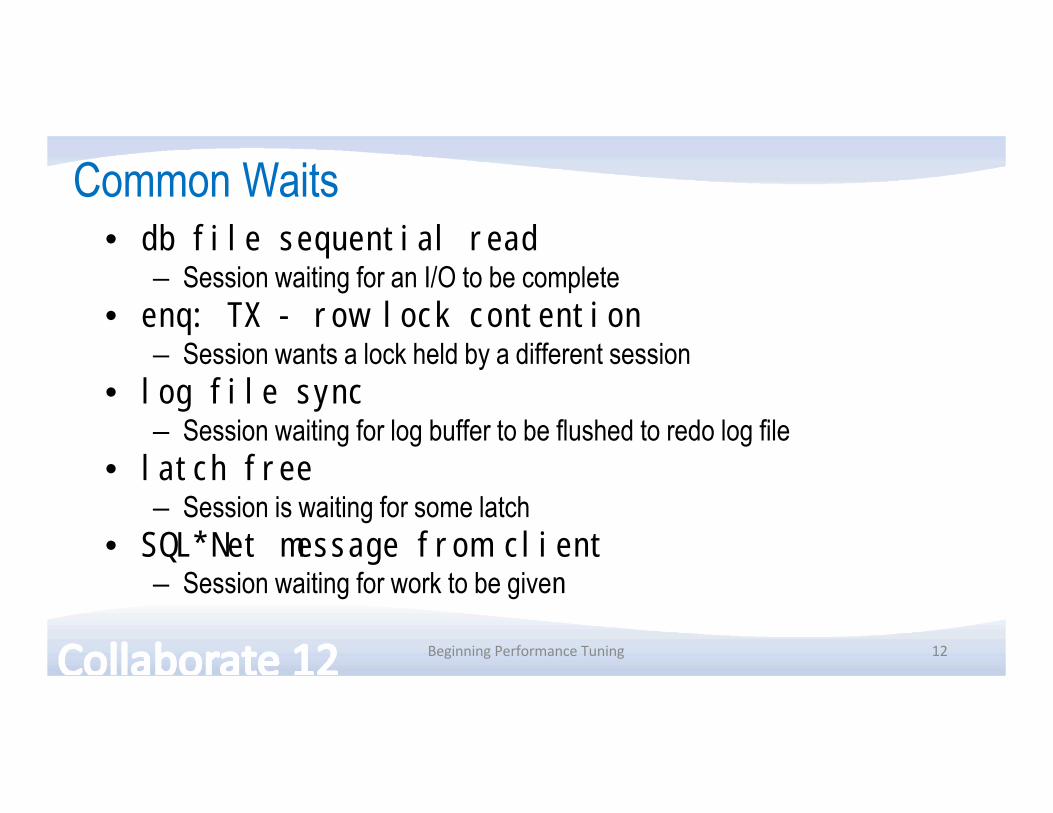
Common Waits• db file sequential read
– Session waiting for an I/O to be complete• enq: TX - row lock contention
– Session wants a lock held by a different session• log file sync
– Session waiting for log buffer to be flushed to redo log file• latch free
– Session is waiting for some latch• SQL*Net message from client
– Session waiting for work to be given
12Beginning/Performance/Tuning

select sid, state, event, state, wait_time, seconds_in_wait
from v$sessionwhere event not in('SQL*Net message from client','SQL*Net message to client','rdbms ipc message'
)where state = 'WAITING'
13Beginning/Performance/Tuning

14Beginning/Performance/Tuning
Locking

Locking Waits• Find out which session is locking this record
select
blocking_session, blocking_instance,
seconds_in_wait
from v$session
where sid = <sid>
• Find out who is holding the lock
15Beginning/Performance/Tuning

V$SESSION Columns• SID � the SID• SERIAL# - Serial# of the session• MACHINE � the client that created the session• TERMINAL � terminal of the client• PROGRAM � the client program, e.g. TOAD.EXE• STATUS � Active/Inactive• SQL_ID � the SQL_ID• PREV_SQL_ID � the previous SQL
16Beginning/Performance/Tuning
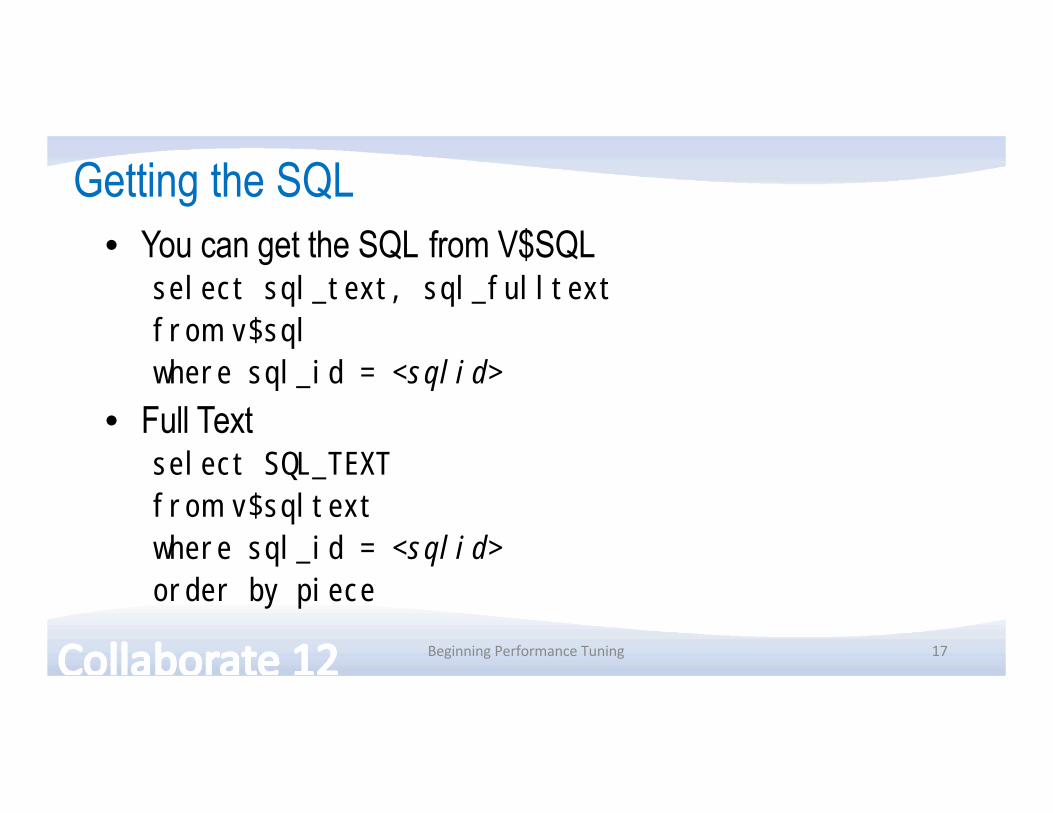
Getting the SQL• You can get the SQL from V$SQL
select sql_text, sql_fulltextfrom v$sqlwhere sql_id = <sqlid>
• Full Textselect SQL_TEXTfrom v$sqltextwhere sql_id = <sqlid>order by piece
17Beginning/Performance/Tuning
Last 10 Waits• What events the session has already waited on so far?• View V$SESSION_WAIT_HISTORY• Shows last 10 waits for active sessions
18Beginning/Performance/Tuning
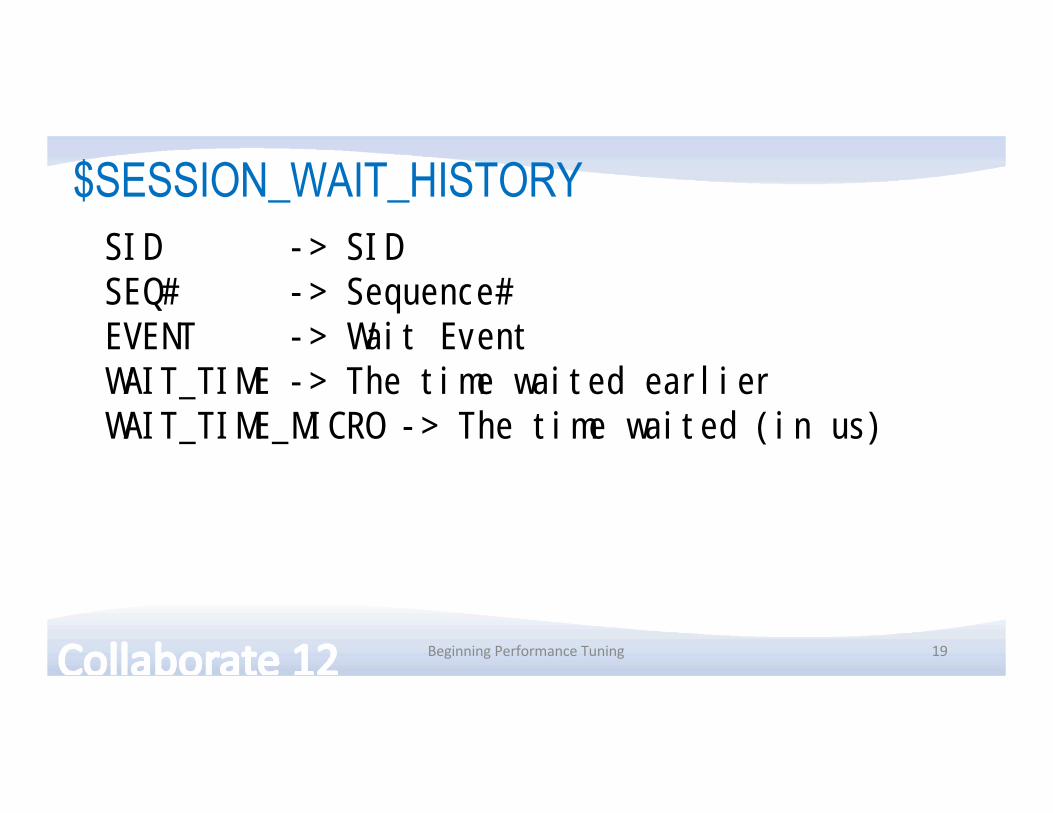
$SESSION_WAIT_HISTORYSID -> SIDSEQ# -> Sequence#EVENT -> Wait EventWAIT_TIME -> The time waited earlier WAIT_TIME_MICRO -> The time waited (in us)
19Beginning/Performance/Tuning

V$SESSION_EVENT• All waits the session encountered so farSID ? Session ID
EVENT ? The wait event, e.g. “library cache lock”
TOTAL_WAITS ? total number of times this session has waited
TOTAL_TIMEOUTS ? total no. of times timeouts occurred for this
TIME_WAITED ? the total time (in 100th of sec) waited
AVERAGE_WAIT ? the average wait per wait
MAX_WAIT ? the maximum for that event
TIME_WAITED_MICRO ? same as time_waited; but in micro seconds
EVENT_ID ? the event ID of the event
WAIT_CLASS_ID ? the class of the waits
WAIT_CLASS#
WAIT_CLASS V$EVENT_N5ME/has/the/event/details/joined/on/EVENT#/column
20Beginning/Performance/Tuning
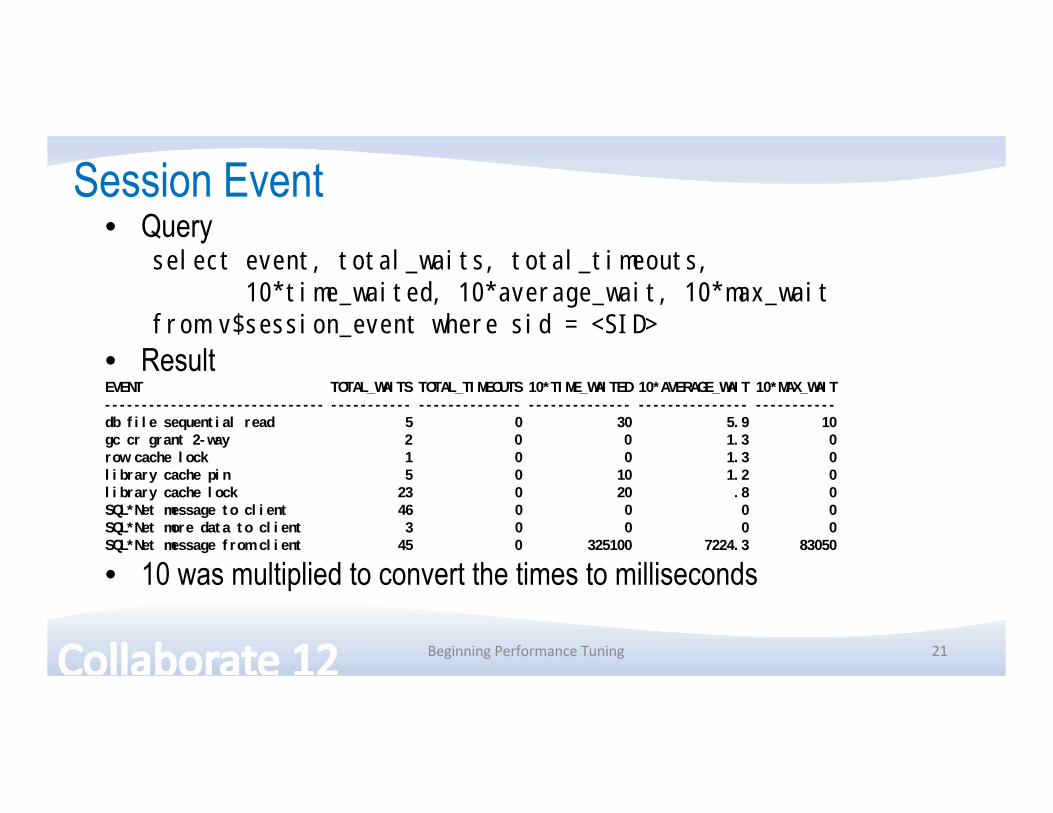
Session Event• Query
select event, total_waits, total_timeouts, 10*time_waited, 10*average_wait, 10*max_wait
from v$session_event where sid = <SID>
• ResultEVENT TOTAL_WAITS TOTAL_TIMEOUTS 10*TIME_WAITED 10*AVERAGE_WAIT 10*MAX_WAIT------------------------------ ----------- -------------- -------------- --------------- -----------db file sequential read 5 0 30 5.9 10gc cr grant 2-way 2 0 0 1.3 0row cache lock 1 0 0 1.3 0library cache pin 5 0 10 1.2 0library cache lock 23 0 20 .8 0SQL*Net message to client 46 0 0 0 0SQL*Net more data to client 3 0 0 0 0SQL*Net message from client 45 0 325100 7224.3 83050
• 10 was multiplied to convert the times to milliseconds
21Beginning/Performance/Tuning

System Event• The V$SYSTEM_EVENT view shows the same waits for the
entire instanceselect event, total_waits, total_timeouts, 10*time_waited, 10*average_waitfrom v$system_eventwhere event like 'gc%‘
EVENT TOTAL_WAITS TOTAL_TIMEOUTS 10*TIME_WAITED 10*AVERAGE_WAIT---------------------------------------- ----------- -------------- -------------- ---------------gcs remote message 3744149220 3391378512 1.2595E+10 3.4gc buffer busy 2832149 14048 23739030 8.4gc cr multi block request 62607541 120749 32769490 .5gc current multi block request 2434606 57 775560 .3gc cr block 2-way 128246261 19168 77706850 .6gc cr block 3-way 126605477 22339 124231140 1….
22Beginning/Performance/Tuning
Active Session History• Captures the state of all active sessions in memory• Visible through V$ACTIVE_SESSION_HISTORY
– Part of diagnostic and tuning pack. Extra cost• Held for 30 minutes• Then stored in AWR � DBA_HIST_ACTIVE_SESS_HIST
23Beginning/Performance/Tuning

Tracing• DBMS_MONITOR
begindbms_monitor.session_trace_enable (
session_id => &sid,serial_num => &serial,waits => TRUE,binds => TRUE
);end;
24Beginning/Performance/Tuning

Analyze Tracefile• TKPROF is the tool$ tkprof u/p <inputfile> <outputfile>
<Outputfile> is a text file
25Beginning/Performance/Tuning

High CPU• From OS top or similar commands find out the process ID • Find out the session for that processselect sid, s.username, status, machine, state,
seconds_in_wait, sql_id
from v$session s, v$process p
where p.spid = &spid
and s.paddr = p.addr;
26Beginning/Performance/Tuning

Stats of a Session• How much CPU the session has consumed • How much of the came from the session• View: V$SESSTAT
27Beginning/Performance/Tuning

Understanding Statistics• V$SESSTAT shows the information except the name, which
is shown in V$STATNAME• V$MYSTAT shows the stats for the current session only
18:31:01 SQL> desc v$sesstatName Null? Type----------------- -------- ----------SID NUMBERSTATISTIC# NUMBERVALUE NUMBER
18:31:01 SQL> desc v$sesstatName Null? Type----------------- -------- ----------SID NUMBERSTATISTIC# NUMBERVALUE NUMBER
SQL> desc v$statnameName Null? Type----------------- -------- ----------STATISTIC# NUMBERNAME VARCHAR2(64)CLASS NUMBERSTAT_ID NUMBER 28Beginning/Performance/Tuning
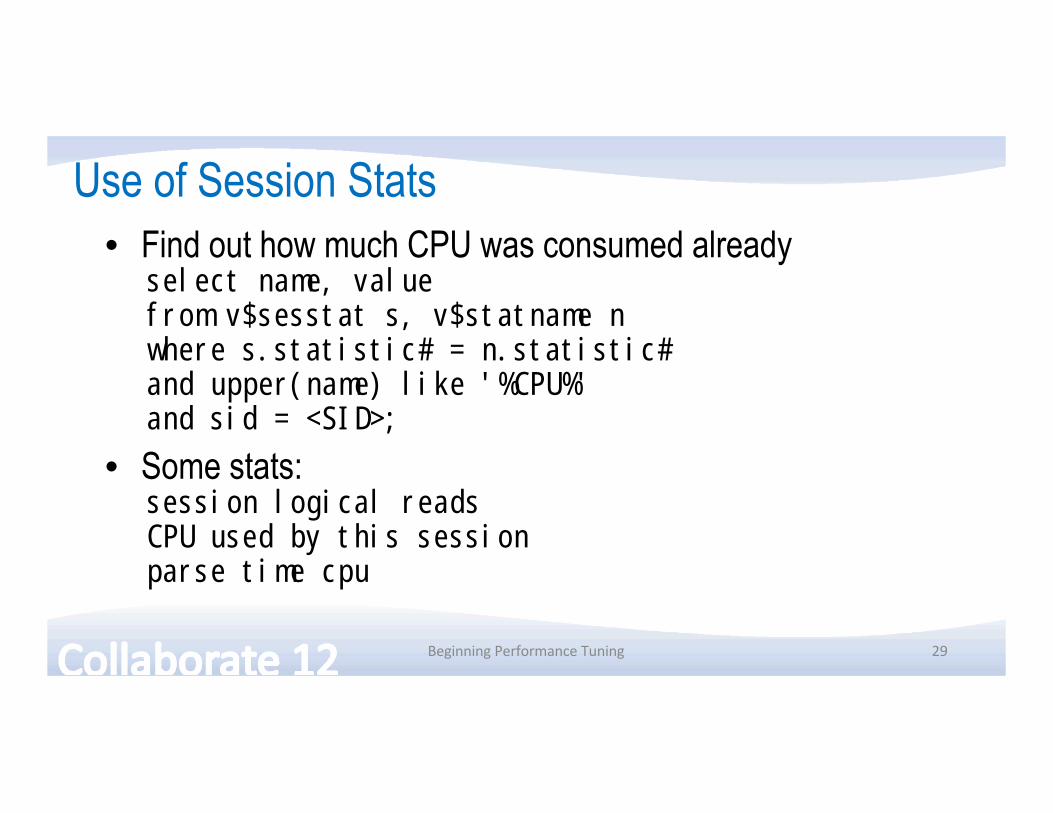
Use of Session Stats• Find out how much CPU was consumed already
select name, valuefrom v$sesstat s, v$statname nwhere s.statistic# = n.statistic#and upper(name) like '%CPU%'and sid = <SID>;
• Some stats:session logical readsCPU used by this sessionparse time cpu
29Beginning/Performance/Tuning

System Statistics• Similar to events, there is also another view for system level
stats - V$SYSSTATSQL> desc v$sysstatName Null? Type----------------- -------- ------------STATISTIC# NUMBERNAME VARCHAR2(64)CLASS NUMBERVALUE NUMBERSTAT_ID NUMBER
• Note there is a NAME column• This is a cumulative value Time/?
Stat
stic
Valu
e/? Rate/of/
Change/is/different
30Beginning/Performance/Tuning

Summary• Find out what is the immediate symptom � CPU, I/O
running high or a specific session is slow• Find out who is consuming the most of the resource• If a specific session is slow, find out what it is waiting on• Get more information on the session
– what all the session has been waiting on, what resources it has consumed so far, etc
• Trace to get a timeline of events.31Beginning/Performance/Tuning
Thank You!Session 887
Beginning Performance TuningBlog: arup.blogspot.comTwitter: arupnanda
32Beginning/Performance/Tuning


