April 29, 2011 Bruce Wolfe, Executive Officer California Regional Water Quality Control Board San Francisco Bay Region 1515 Clay Street, Suite 1400 Oakland, CA 94612 Subject: Feasibility/Infeasibility Criteria Report - MRP Provisions C.3.c.i.(2)(b)(iv) and C.3.c.iii.(1) Dear Mr. Wolfe: This letter and attachment are submitted on behalf of all 76 municipalities subject to the requirements of the Municipal Regional Stormwater NPDES Permit (MRP). MRP Provision C.3.c.i.(2)(b) requires Regulated Projects to treat 100% of the amount of runoff identified in Provision C.3.d. for the Regulated Project’s drainage area with LID treatment measures onsite or at a joint stormwater treatment facility. LID treatment measures are harvesting and re-use, infiltration, evapotranspiration, or biotreatment. A properly engineered and maintained biotreatment system may be considered only if it is infeasible to implement harvesting and re-use, infiltration, or evapotranspiration at the project site. MRP Provision C.3.c.i.(2)(b)(iv) requires the Permittees to submit a report on the criteria and procedures that will be used to determine when harvesting and re-use, infiltration, or evapotranspiration is feasible and infeasible at a Regulated Project site. MRP Provision C.3.c.iii.(1) states that the report shall contain the following information: • Literature review and discussion of documented cases/sites, particularly in the Bay Area and California, where infiltration, harvesting and re-use, or evapotranspiration have been demonstrated to be feasible and/or infeasible; and • Discussion of proposed feasibility and infeasibility criteria and procedures the Permittees shall employ to make a determination of when biotreatment will be allowed at a Regulated Project site. Through the Bay Area Stormwater Management Agencies Association (BASMAA), the Permittees have worked together to prepare the attached “Harvest and Use, Infiltration, and Evapotranspiration Feasibility/Infeasibility Criteria Report” (Report). This Report fulfills the MRP requirements to develop criteria and procedures for Permittees to follow to determine whether harvesting and use, infiltration, or evapotranspiration are feasible or infeasible at a Regulated Project site and when biotreatment may be used. The Report also provides a literature
Transcript
April 29, 2011 Bruce Wolfe, Executive Officer California Regional Water Quality Control Board San Francisco Bay Region 1515 Clay Street, Suite 1400 Oakland, CA 94612 Subject: Feasibility/Infeasibility Criteria Report - MRP Provisions
C.3.c.i.(2)(b)(iv) and C.3.c.iii.(1) Dear Mr. Wolfe: This letter and attachment are submitted on behalf of all 76 municipalities subject to the requirements of the Municipal Regional Stormwater NPDES Permit (MRP).
MRP Provision C.3.c.i.(2)(b) requires Regulated Projects to treat 100% of the amount of runoff identified in Provision C.3.d. for the Regulated Project’s drainage area with LID treatment measures onsite or at a joint stormwater treatment facility. LID treatment measures are harvesting and re-use, infiltration, evapotranspiration, or biotreatment. A properly engineered and maintained biotreatment system may be considered only if it is infeasible to implement harvesting and re-use, infiltration, or evapotranspiration at the project site.
MRP Provision C.3.c.i.(2)(b)(iv) requires the Permittees to submit a report on the criteria and procedures that will be used to determine when harvesting and re-use, infiltration, or evapotranspiration is feasible and infeasible at a Regulated Project site. MRP Provision C.3.c.iii.(1) states that the report shall contain the following information:
• Literature review and discussion of documented cases/sites, particularly in the Bay Area and California, where infiltration, harvesting and re-use, or evapotranspiration have been demonstrated to be feasible and/or infeasible; and
• Discussion of proposed feasibility and infeasibility criteria and procedures the Permittees shall employ to make a determination of when biotreatment will be allowed at a Regulated Project site.
Through the Bay Area Stormwater Management Agencies Association (BASMAA), the Permittees have worked together to prepare the attached “Harvest and Use, Infiltration, and Evapotranspiration Feasibility/Infeasibility Criteria Report” (Report). This Report fulfills the MRP requirements to develop criteria and procedures for Permittees to follow to determine whether harvesting and use, infiltration, or evapotranspiration are feasible or infeasible at a Regulated Project site and when biotreatment may be used. The Report also provides a literature
Transmittal – Feasibility/Infeasibility Criteria Report MRP Provisions C.3.c.i.(2)(b)(iv) and C.3.c.iii.(1)
April 29, 2011 2
review (Appendix B) and a description of documented cases/sites in the Bay Area and California where harvesting and use, infiltration, and evapotranspiration have been demonstrated to be feasible or infeasible (Appendix C). The criteria and procedures recommended in this Report will be incorporated into the Permittees’ local and/or countywide guidance documents for compliance with Provision C.3. requirements for new development and redevelopment projects. When the LID site design, source control and treatment requirements in Provision C.3.c take effect, and throughout the remaining term of the MRP, Permittees will require applicants to apply the feasibility/infeasibility criteria and procedures to Regulated Projects as part of the development of stormwater quality control plans for those projects.
The Permittees intend to develop a status report on their experience implementing the feasibility/infeasibility criteria and procedures and submit it to the Regional Water Quality Control Board by December 1, 2013, as required by MRP Provisions C.3.c.i.(2)(b)(v) and C.3.c.iii.(2). The status report will include discussion of: 1) the most common criteria employed, with site specific examples; 2) barriers, including institutional and technical site specific constraints, to implementation of harvesting and use, infiltration and evapotranspiration, and proposed strategies for removing the barriers; 3) any proposed changes to the feasibility/infeasibility criteria and procedures and rationale for those changes; and 4) guidance to Permittees for future implementation efforts.
Please contact Jill Bicknell, BASMAA Development Committee Chair, at 408-720-8811 if you have any questions about the Report or need additional information.
Transmittal – Feasibility/Infeasibility Criteria Report MRP Provisions C.3.c.i.(2)(b)(iv) and C.3.c.iii.(1)
April 29, 2011 3
We certify under penalty of law that this document was prepared under our direction or supervision in accordance with a system designed to assure that qualified personnel properly gather and evaluate the information submitted. Based on our inquiry of the person or persons who manage the system, or those persons directly responsible for gathering the information, the information submitted is, to the best of our knowledge and belief, true, accurate, and complete. We are aware that there are significant penalties for submitting false information, including the possibility of fine and imprisonment for knowing violations.
James Scanlin, Alameda Countywide Clean Water Program
Tom Dalziel, Contra Costa Clean Water Program
Kevin Cullen, Fairfield-Suisun Urban Runoff Management Program
Matt Fabry, San Mateo Countywide Water Pollution Prevention Program
Adam Olivieri, Santa Clara Valley Urban Runoff Pollution Prevention Program
Lance Barnett, Vallejo Sanitation and Flood Control District
Transmittal – Feasibility/Infeasibility Criteria Report MRP Provisions C.3.c.i.(2)(b)(iv) and C.3.c.iii.(1)
April 29, 2011 4
Attachment: Harvest and Use, Infiltration, and Evapotranspiration Feasibility/Infeasibility Criteria Report and Appendices
cc: Tom Mumley, Regional Water Board Shin-Roei Lee, Regional Water Board Dale Bowyer, Regional Water Board Sue Ma, Regional Water Board BASMAA Board of Directors
Prepared for
Bay Area Stormwater Management Agencies Association (BASMAA)P.O. Box 2385
Menlo Park, CA 94026
Harvest and Use, Infiltration and Evapotranspiration Feasibility/Infeasibility
Criteria Report
Municipal Regional Permit Provisions C.3.c.i (2) and C.3.c.iii(1)
Prepared by
1111 Broadway, 6th Floor Oakland, California 94607
2.2 Factors Affecting Feasibility of Infiltration Treatment Systems ................. 5 2.2.1 Site Condition and Location............................................................ 5 2.2.2 Soil Types and Infiltration Rates..................................................... 6
2.3 Factors Affecting Feasibility of Rainwater Harvesting ............................... 8 2.3.1 Supply and Demand ........................................................................ 8 2.3.2 Other Factors ................................................................................... 9 2.3.3 Other Drivers to Implement Rainwater Harvesting Systems ........ 10
2.4 Factors Affecting Feasibility of Evapotranspiration ................................. 11
3. LID FEASIBILITY EVALUATION PROCESS ............................................... 12 3.1 Step 1a. Site Design Measures/Self-Treating and Self-Retaining Areas ... 12
Table 1: Distribution of Hydrologic Soil Groups by MRP Area Counties from NRCS Soil Survey ........................................................................................................................ 8
Table 2: Required Ponding Depth and Saturated Hydraulic Conductivity (Ksat) to Achieve 80 Percent Capture with an Impervious to Pervious Area Ratio of 2:1 ........... 16
Table 3: Design Criteria for Interceptor Trees ............................................................... 17
Table 4: Self-Treating Areas .......................................................................................... 18
Table 5: Toilet and Urinal Water Usage per Resident or Employee .............................. 24
Table 7: Modified ETWU Daily Average Irrigation Demand by Location and Landscape Coefficient .................................................................................................... 28
Table 8: Required Cistern Volume and Demand per Acre of Impervious Area to Achieve 80% Capture with a 48-hour Drawdown Time ................................................ 30
Table 9: Required Cistern Volume and Demand per Acre of Impervious Area to Achieve 80% Capture with the Longer Drawdown Time Allowable (Minimum Demand) for Cistern of 50,000 Gallons or Less ............................................................. 30
Table 10: TUTIA Ratios for Typical Land Uses for Rain Gauges Analyzed ................ 32
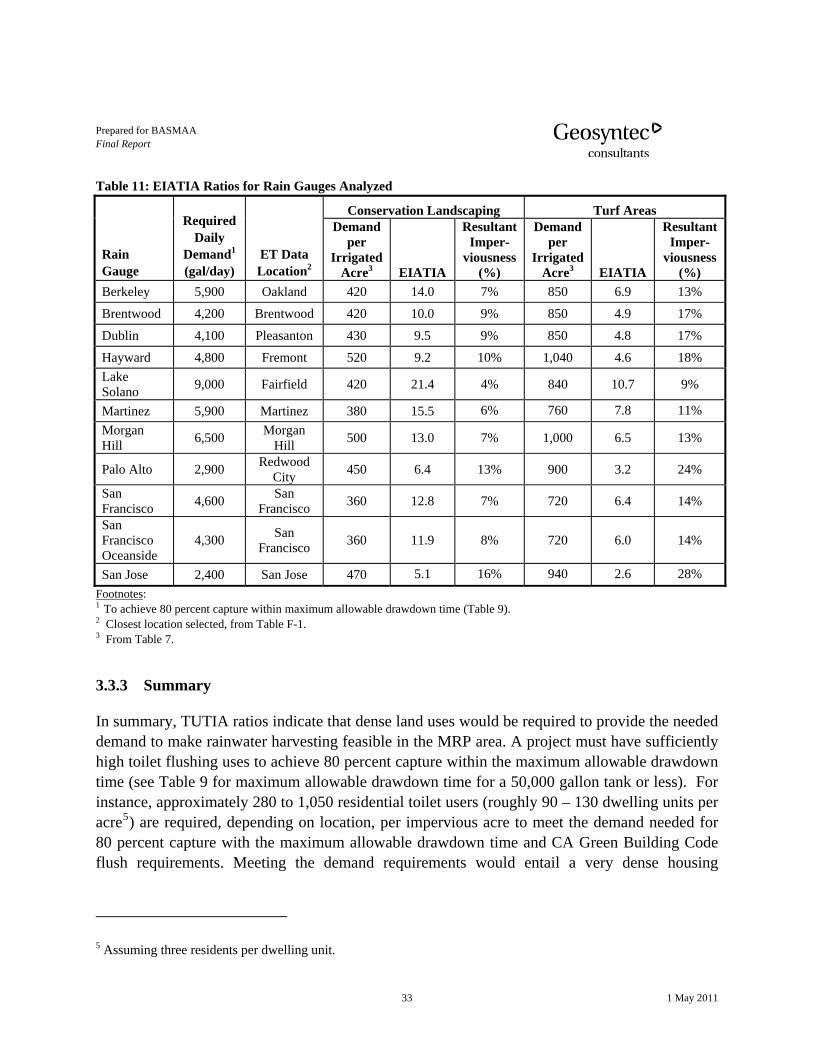
Table 11: EIATIA Ratios for Rain Gauges Analyzed .................................................... 33
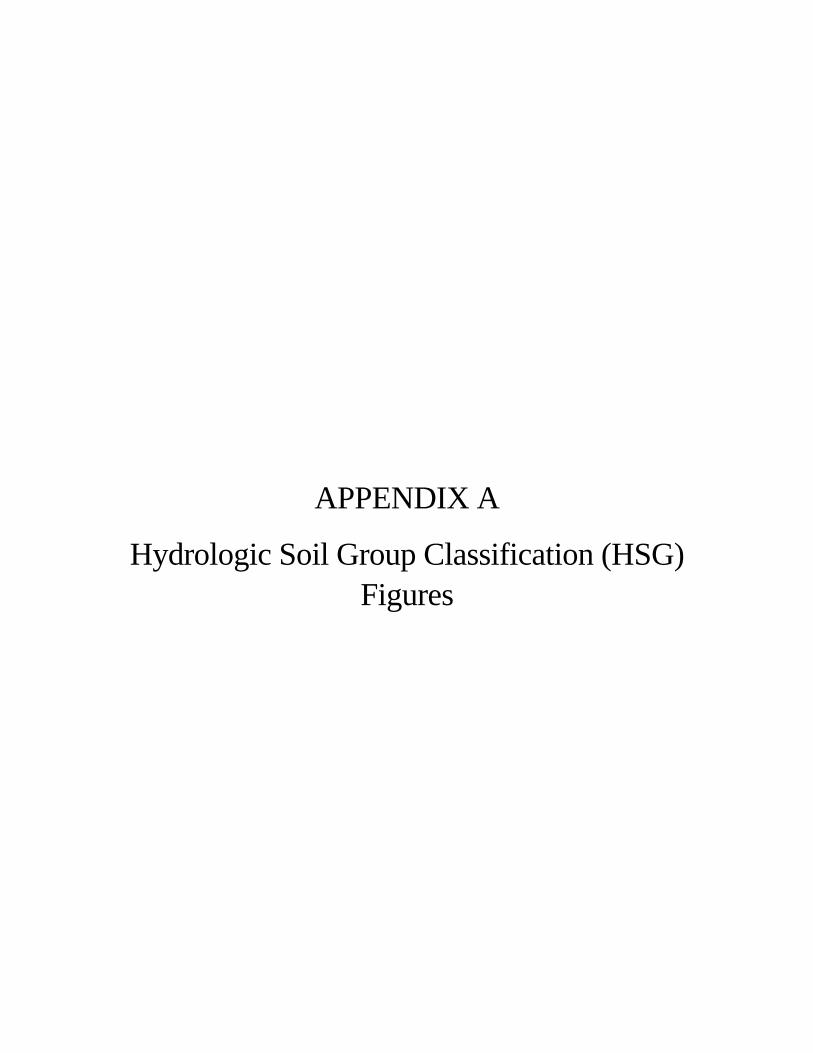
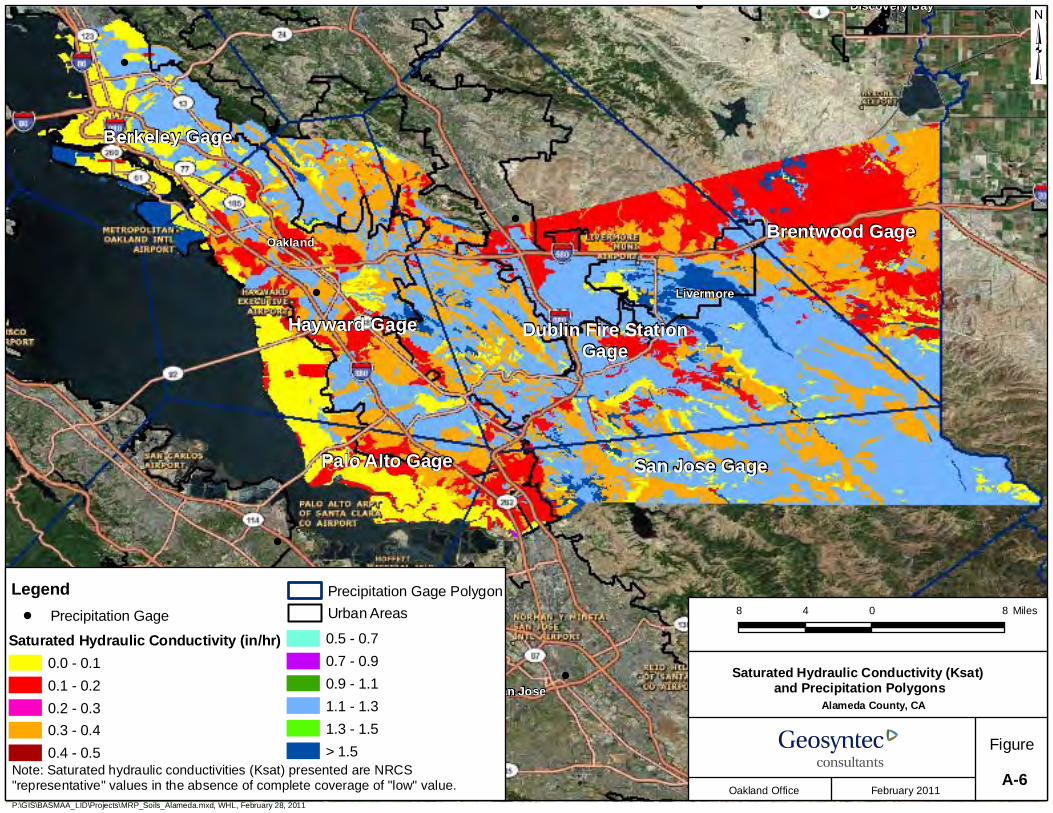
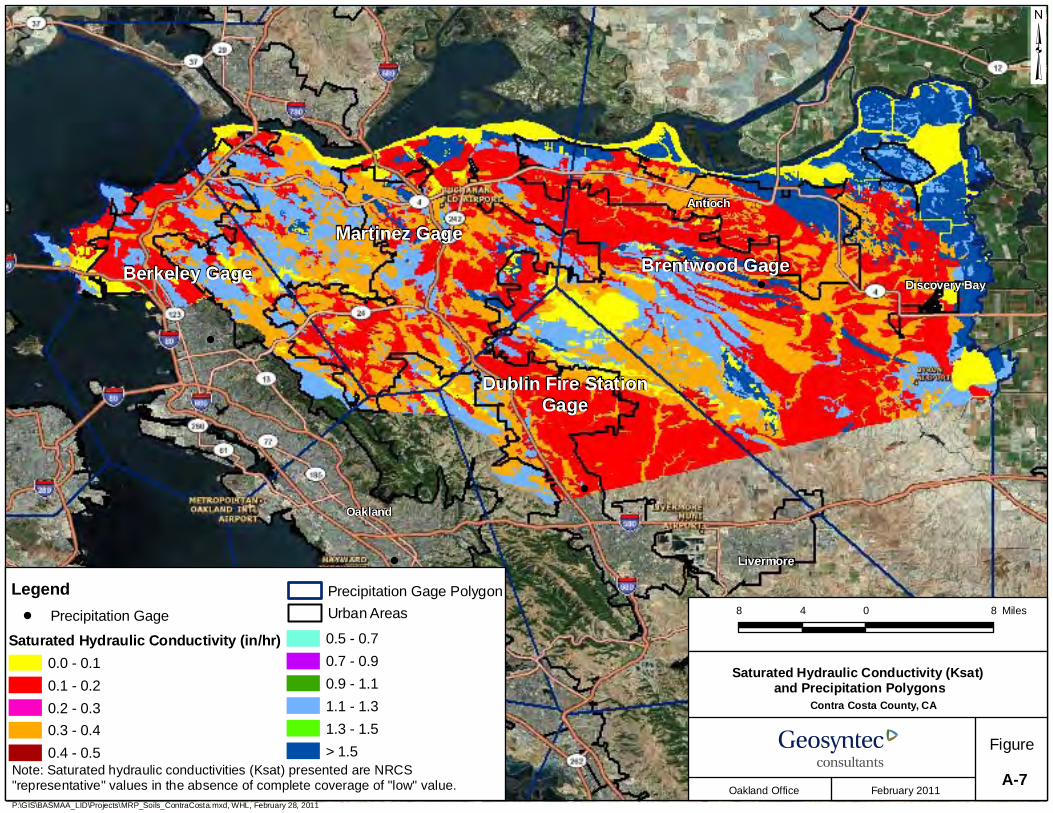
Appendix A: Hydrologic Soil Group Classification (HSG) Figures
Appendix B: Literature Review
Appendix C: Case Studies
Appendix D: Interceptor Trees
Appendix E: Bioinfiltration Modeling Data and Results
Appendix F: Rainwater Harvesting Data and Figures
Prepared for BASMAA Final Report
1 1 May 2011
1. INTRODUCTION
The Municipal Regional Permit (MRP) requires that each Regulated Project treat 100 percent of the amount of runoff1 identified in Provision C.3.d from a Regulated Project’s drainage area with low impact development (LID) treatment measures onsite or at a joint stormwater treatment facility. LID treatment measures are defined as rainwater harvesting and use, infiltration, evapotranspiration, or biotreatment. A biotreatment system may only be used if it is infeasible to implement harvesting and use, infiltration, or evapotranspiration at a project site.
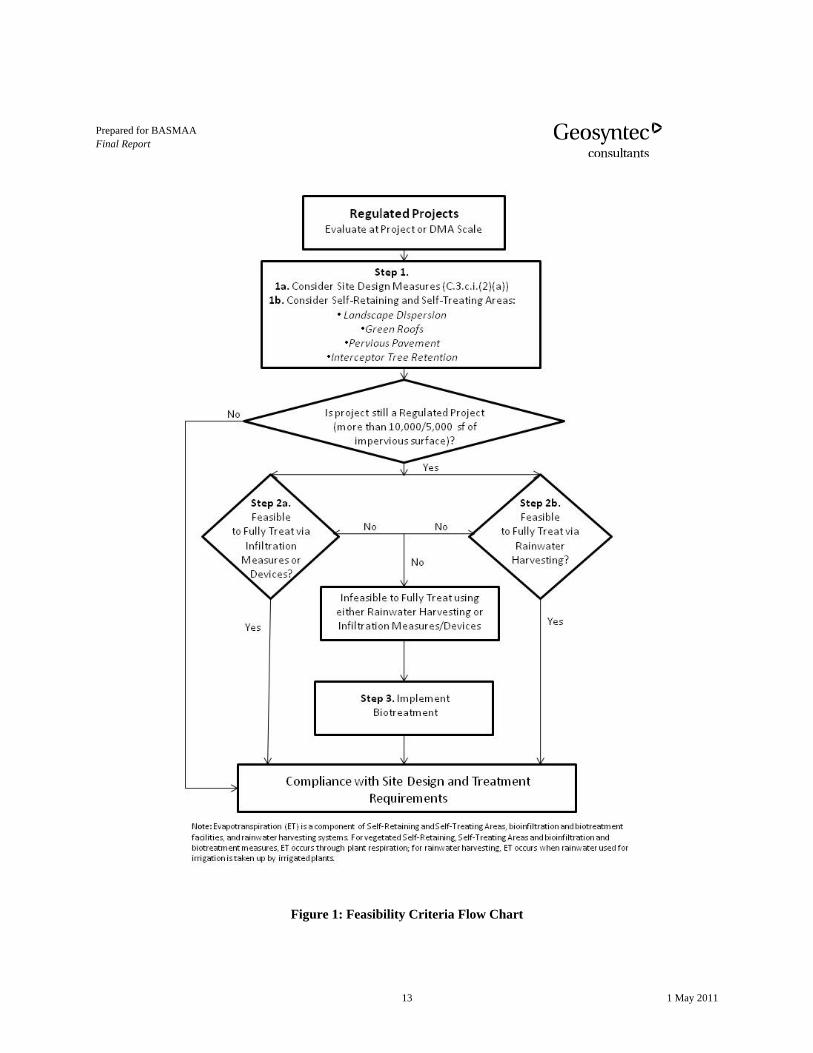
MRP Provisions C.3.c.i.(2)(b) and C.3.c.iii.(1) require permittees to develop a Feasibility/ Infeasibility Criteria Report (Report) for submittal to the Regional Water Board by May 1, 2011. This Report fulfills the MRP requirements to develop criteria and procedures for Permittees to follow to determine whether harvesting and use, infiltration, or evapotranspiration are feasible or infeasible at a Regulated Project site and when biotreatment may be used. The Report provides background on the key factors influencing feasibility, a flow chart (Figure 1) describing the sequential steps in the feasibility evaluation, and technical analyses that provide criteria and recommendations for each step.
This Report also provides a literature review (Appendix B) and a description of documented cases/sites in the Bay Area and California where harvesting and use, infiltration, and evapotranspiration have been demonstrated to be feasible or infeasible (Appendix C), per the MRP requirements.
The criteria and procedures recommended in this Report will be incorporated into the Permittees’ local and/or countywide guidance documents for compliance with Provision C.3. requirements for new development and redevelopment projects. Beginning December 1, 2011, when the LID site design, source control and treatment requirements in Provision C.3.c take effect, and throughout the remaining term of the MRP, Permittees will require applicants to apply the feasibility/infeasibility criteria and procedures to Regulated Projects as part of the development of stormwater quality control plans for those projects.
The Permittees’ intend to develop a status report on their experience with implementing the feasibility/infeasibility criteria and procedures and submit it to the Regional Water Quality Control Board by December 1, 2013, as required by MRP Provisions C.3.c.i.(2)(b)(v) and C.3.c.iii.(2). The status report will include discussion of: 1) the most common criteria employed, with site specific examples; 2) barriers, including institutional and technical site specific
1 MRP Provision C.3.d specifies numeric sizing criteria for stormwater treatment systems. Hydraulic sizing design criteria are specified for volume-based, flow-based, and combined volume and flow-based treatment systems.
Prepared for BASMAA Final Report
2 1 May 2011
constraints, to implementation of harvesting and use, infiltration and evapotranspiration, and proposed strategies for removing the barriers; 3) any proposed changes to the feasibility/infeasibility criteria and procedures and rationale for those changes; and 4) guidance to Permittees for future implementation efforts.
Several important terms used throughout this Report are defined below:
• Bioinfiltration is an infiltration measure designed to detain stormwater runoff, filter stormwater runoff through soil media and plant roots, and infiltrate stormwater runoff to the extent feasible given the properties of underlying soils and other factors identified in MRP Provision C.3.c.i.(2)(b)(iii).
• Biotreatment is a facility designed to detain stormwater runoff, filter stormwater runoff through soil media and plant roots, and release the treated stormwater runoff to the storm drain system.
• Dispersion refers to the practice of routing stormwater runoff from impervious areas, such as rooftops, walkways, and patios, onto the surface of adjacent pervious (Self-Retaining) areas. Stormwater runoff is dispersed via splash block, dispersion trench, or sheet flow and soaks into the ground as it moves slowly across the surface of the pervious area.
• Evapotranspiration (ET) is the loss of water to the atmosphere by the combined processes of evaporation (from soil and plant surfaces) and transpiration (from plant tissues). ET occurs in bioinfiltration and biotreatment facilities, rainwater harvesting facilities (if stored rainwater is used for irrigation), Self-Retaining Areas, and Self-Treating Areas.
• Infiltration refers to the use of the filtration, adsorption, and biological decomposition properties of soils to remove pollutants prior to the intentional routing of stormwater runoff to the subsurface for groundwater recharge.
• Infiltration Devices are infiltration facilities that are deeper than they are wide and designed to infiltrate stormwater runoff into the subsurface and, as designed, bypass the natural groundwater protection afforded by surface soil. These devices include dry wells, injection wells, and infiltration trenches (includes French drains).
• Infiltration Measures are infiltration facilities that are wider than they are deep (e.g., bioinfiltration, infiltration basins, and shallow wide infiltration trenches and dry wells).
Prepared for BASMAA Final Report
3 1 May 2011
• Interceptor Trees are new or existing trees on a project site that obtain “credits” for a certain square footage of Self-Treating Area, due to their ability to capture and evapotranspire rainfall, based on the type and size of the tree.
• Pervious Pavement is pavement that is designed and constructed to store and infiltrate rainfall at a rate equal to immediately surrounding unpaved, landscaped areas, or that is designed and constructed to store and infiltrate the stormwater runoff volume described in C.3.d.
• Rainwater Harvesting refers to the capturing and storing of stormwater runoff for later use.
• Self-Retaining (S-R) Areas, also called “zero discharge” areas, are designed to retain the first one inch of rainfall (by ponding and infiltration and/or evapotranspiration) without producing stormwater runoff. S-R Areas may include graded depressions with landscaping or pervious pavement. Areas Draining to Self-Retaining Areas are impervious or partially pervious areas that drain to Self-Retaining Areas (see also Dispersion).
• Self-Treating (S-T) Areas are a portion of a development site in which infiltration, evapotranspiration and other natural processes remove pollutants from stormwater. S-T Areas may include conserved natural open areas, areas of landscaping, green roofs, pervious pavement, and interceptor trees. A S-T Area only treats the rain falling on itself and does not receive stormwater runoff from other areas.
Prepared for BASMAA Final Report
4 1 May 2011
2. KEY FACTORS INFLUENCING FEASIBILITY
2.1 Amount of Stormwater Runoff
Provision C.3.c.i.(2)(b) requires Regulated Projects to treat 100 percent of the amount of stormwater runoff identified in Provision C.3.d. for a Regulated Project’s drainage area, with harvest and use, infiltration, and evapotranspiration treatment measures. Provision C.3.d. states stormwater treatment systems must meet at least one of three hydraulic sizing design criteria explained in the following subsections.
2.1.1 Volume Hydraulic Design Basis
Provision C.3.d.i.(1) provides that treatment systems whose primary mode of action depends on volume capacity shall be designed to treat a stormwater volume calculated according to methods in the book “Urban Runoff Quality Management”2 (for example, approximately the 85th percentile 24-hour storm runoff event), or the volume of annual stormwater runoff required to achieve 80 percent or more capture, determined according to the methodology in the California Stormwater Management Practice Handbook, New Development and Redevelopment (2003), using local rainfall data.
Both of these criteria require definitions of both a volume and a corresponding drawdown time to be technically valid and to achieve the intended result. If, for example, a facility were to be constructed with a specified volume determined according to either of the methods, but the corresponding drawdown time could not be assured, then the facility would not be designed to treat the amount of stormwater runoff identified in Provision C.3.d and therefore the project could not use this facility for compliance with Provision C.3.c.
2.1.2 Flow Hydraulic Design Basis
Provision C.3.d.i.(2) states that treatment systems whose primary mode of action depends on flow capacity shall be sized to treat (a) 10 percent of the 50-year peak flowrate; (b) the flow of runoff produced by a rain event equal to at least two times the 85th percentile hourly rainfall intensity for the applicable area, based on historical records of hourly rainfall depths; or (c) the flow of runoff resulting from a rain event equal to at least 0.2 inches per hour intensity. Calculation by method (b) allows ascertainment of the percentage of stormwater runoff treated over a long (30+ year) period of record; the specification of two times the 85th percentile hourly
2 WEF Manual of Practice No. 23/ASCE Manual of Practice No. 87, (1998), pages 175–178.
Prepared for BASMAA Final Report
5 1 May 2011
rainfall intensity achieves treatment of approximately 80 percent of the average annual stormwater runoff in the Bay Area.
2.1.3 Combination Flow and Volume Design Basis
Provision C.3.d.i.(3) allows the use of more flexible methods, such as continuous simulation of rainfall and stormwater runoff inflows and outflows, to characterize the performance of a facility over a long (30+ year) period of record and show that 80 percent capture would be expected. The inclusion of this new option in the MRP underscores the intent of Provision C.3.d. that facilities be designed to manage 80 percent of stormwater runoff, and the corresponding intent of Provision C.3.c. that LID treatment measures achieve this criterion.
2.2 Factors Affecting Feasibility of Infiltration Treatment Systems
Technical infeasibility of infiltration may result from site conditions that restrict the operability of infiltration measures and devices. Various factors affecting the feasibility of infiltration treatment may create an environmental risk, structural stability risk, or physically restrict infiltration. The presence of any of these limiting factors may render infiltration technically infeasible for a proposed project, meaning that infiltration of 80 percent of stormwater runoff is not achievable for that project.
2.2.1 Site Condition and Location
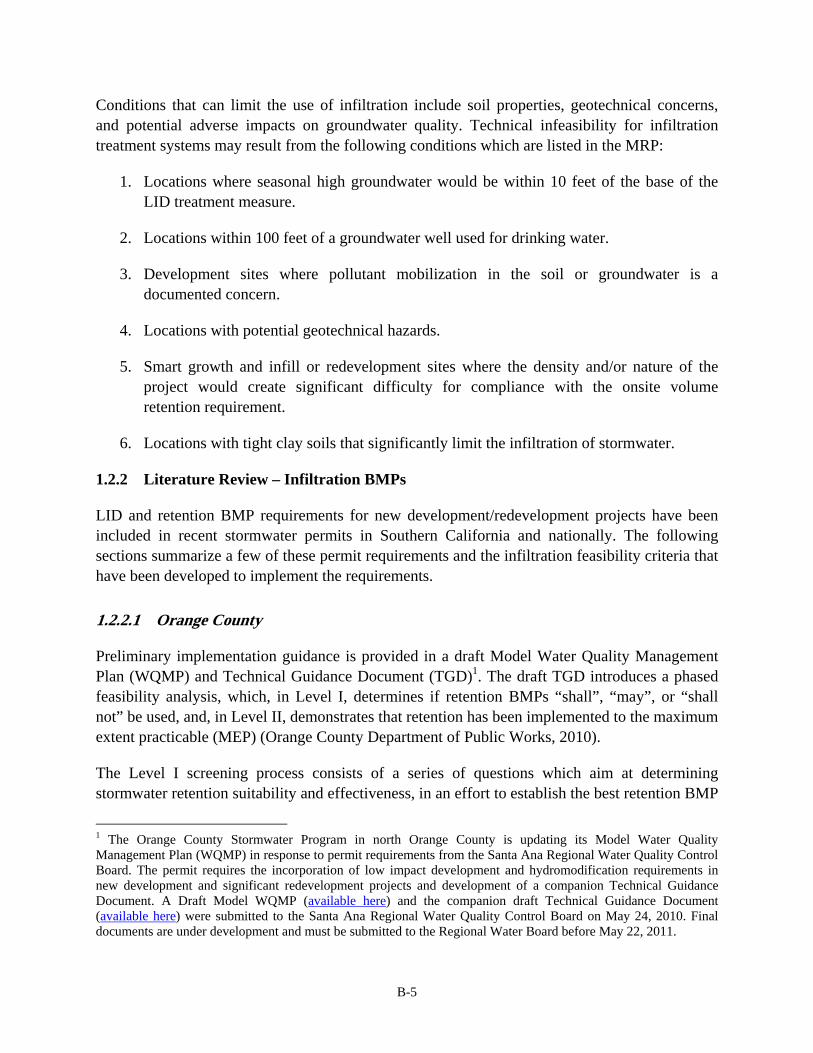
The factors listed in the MRP Provision C.3.c.i.(2)(b)(iii) are included below:
• Seasonal High Groundwater Table – Locations where a seasonal high groundwater table or mounded groundwater beneath the infiltration measure is within 10 feet of the base of the infiltration measure.
• Groundwater Production Wells – Infiltration should not be designed within 100 feet of groundwater production wells.
• Pollutants in Soil or Groundwater – Locations where pollutant mobilization is a documented concern should not utilize infiltration. Infiltration into these areas could cause migration and spreading of contaminant plumes.
• Geotechnical Hazards – Infiltration at locations with potential geotechnical hazards such as steep slopes, areas with landslide potential, soils subject to liquefaction, and locations less than a specified setback from building foundations.
Prepared for BASMAA Final Report
6 1 May 2011
• Clay Soils – Locations with tight clay soils that significantly limit the infiltration of stormwater.
Other limitations to the use of infiltration measures or devices may include:
• High Infiltration Rates – Highly infiltrating native soils, such as sand and gravel, may not be protective of groundwater at a project site where infiltration devices are implemented.
• Industrial Areas and Areas with High Traffic – Infiltration devices are not approved as a stand-alone measure for treating stormwater runoff from land uses that pose a high threat to water quality, including but not limited to industrial and light industrial activities, high vehicular traffic (i.e., 25,000 or greater average daily traffic on a main roadway or 15,000 or more average daily traffic on any intersecting roadway), automotive repair shops, car washes, fleet storage areas, or nurseries (per Provision C.3.d.iv.(2)(d)).
• Septic Systems and Underground Tanks – Infiltration devices should be located at least 100 feet away from septic tanks and underground storage tanks with hazardous materials, as well as any other potential underground sources of pollution.
• Protection of Beneficial Uses – Locations where reduction of stormwater runoff may potentially impair beneficial uses of the receiving water, such as change of seasonality of ephemeral washes, as documented in a site-specific study (e.g., California Environmental Quality Act (CEQA) analysis) or watershed plan;
• Underground Utilities – Infiltration measures, devices, or facilities may conflict with the location of existing or proposed underground utilities or easements. Infiltration measures, devices, or facilities should not be placed on top of or very near to underground utilities such that they discharge to the utility trench, restrict access, or cause stability concerns.
• Existing Policies – Local Water District policies or guidelines may limit locations where infiltration may occur, require greater separation from seasonal high groundwater, or require greater setbacks from potential sources of pollution.
2.2.2 Soil Types and Infiltration Rates
The Soil Survey is a nationally available dataset completed by the Soil Conservation Service (SCS) (now identified as the Natural Resource Conservation Service [NRCS]) of the US Department of Agriculture in April 1970. The Soil Survey assigned a NRCS Hydrologic Soil Group classification to soil types mapped in the US, including the MRP area. Hydrologic Soil Group (HSG) classifications range from more infiltrative (Group A) to less infiltrative (Group D) (for further information, see http://soils.usda.gov/). An overview of these classifications is presented in the following:
• Group A soils are typically sands, loamy sands, or sandy loams. Group A soils have low stormwater runoff potential and high infiltration rates even when thoroughly wetted. They consist chiefly of deep and well to excessively drained sands or gravels and have a high rate of water transmission.
• Group B soils are typically silt loams or loams. They have a moderate infiltration rate when thoroughly wetted and consist chiefly of moderately deep to deep and moderately well to well drained soils with moderately fine to moderately coarse texture.
• Group C soils are typically sandy clay loams. They have low infiltration rates when thoroughly wetted, consist chiefly of soils with a layer that impedes downward movement of water, and/or have moderately fine to fine soil structure.
• Group D soils are typically clay loams, silty clay loams, sandy clays, silty clays, or clays. They have very low infiltration rates when thoroughly wetted and consist chiefly of clay soils with high swelling potential, permanent high water table, claypan or clay layer at or near the surface, and/or shallow soils over nearly impervious material.
It is likely feasible to infiltrate a higher proportion of stormwater runoff on sites with NRCS Hydrologic Soil Groups A and B. On sites with NRCS Hydrologic Soil Groups C and D, a much smaller proportion of stormwater runoff can typically be infiltrated. NRCS soil classifications are generally available at a resolution of 30 square meter grid cells, which do not account for small scale heterogeneity.
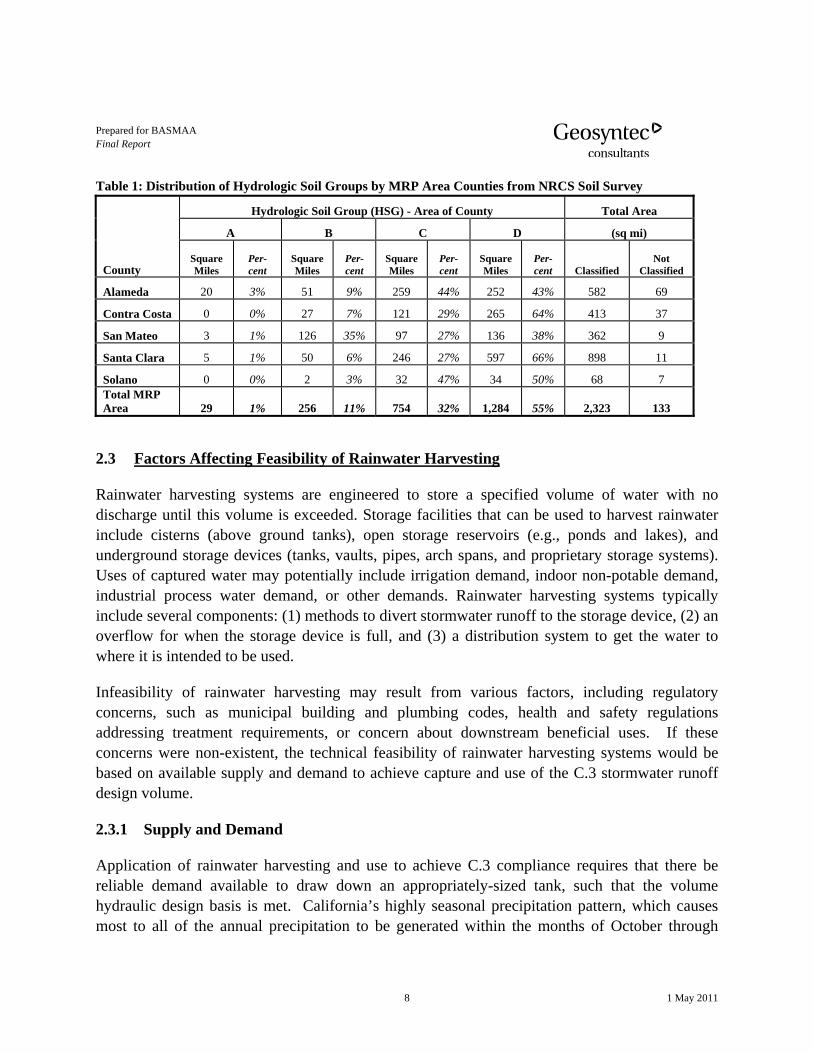
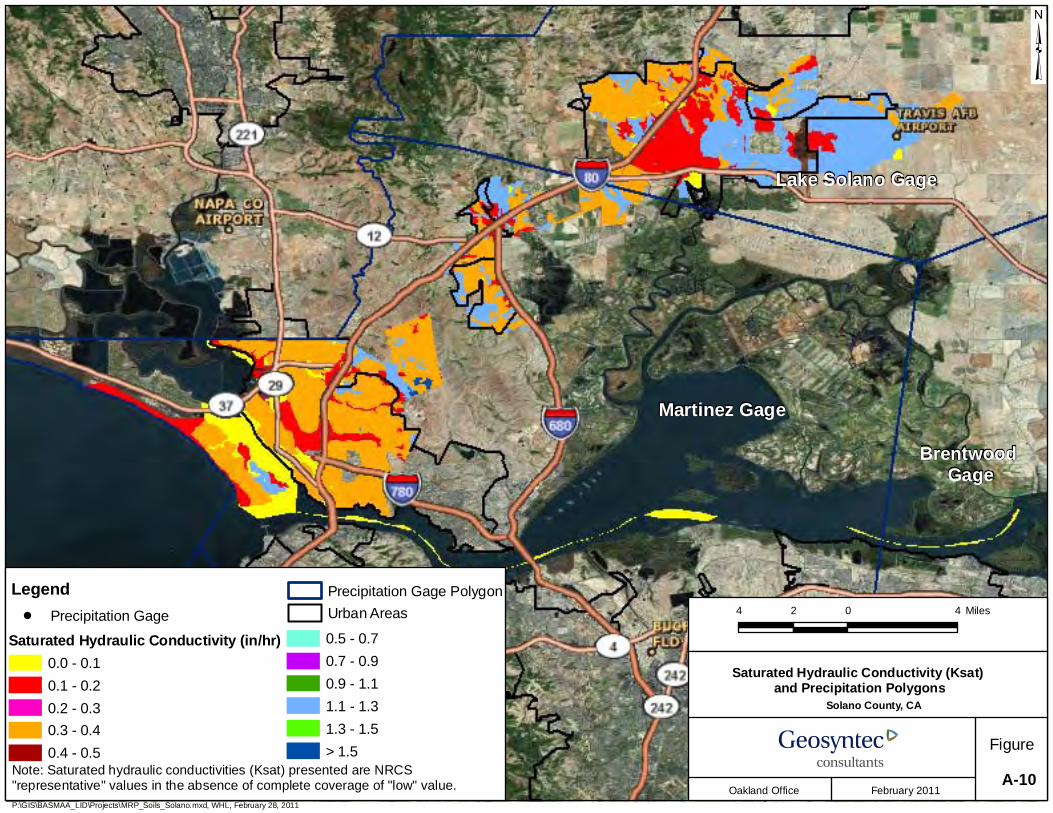
To analyze the distribution of soils within the MRP area, Hydrologic Soil Group classifications were obtained from the NRCS database in geographic information system (GIS) format and clipped to the extent of the MRP area. The database contains over 900 different map units for the Bay Area. Most map units (880 of 930) are assigned a HSG. The spatial distribution of HSGs within the MRP area is presented for Alameda, Contra Costa, San Mateo, Santa Clara, and Solano counties in Appendix A, Figures 1 through 5, respectively, and is also included in Table 1 below.
The NRCS soil survey dataset contain HSG classifications for approximately 94 percent of the MRP area, with the majority of unclassified areas located in low lying regions within Alameda and Contra Costa counties that may have been already developed at the time of the survey. Approximately 88 percent of areas classified within the MRP area were assigned HSGs of C (33 percent and 754 square miles) or D (55 percent and 1284 square miles). HSG C and D soils account for 87 percent of classified soils in Alameda County, 93 percent of classified soils in Contra Costa and Santa Clara counties, and 97 percent of classified soils in Solano County.
Prepared for BASMAA Final Report
8 1 May 2011
Table 1: Distribution of Hydrologic Soil Groups by MRP Area Counties from NRCS Soil Survey
County
Hydrologic Soil Group (HSG) - Area of County Total Area
2.3 Factors Affecting Feasibility of Rainwater Harvesting
Rainwater harvesting systems are engineered to store a specified volume of water with no discharge until this volume is exceeded. Storage facilities that can be used to harvest rainwater include cisterns (above ground tanks), open storage reservoirs (e.g., ponds and lakes), and underground storage devices (tanks, vaults, pipes, arch spans, and proprietary storage systems). Uses of captured water may potentially include irrigation demand, indoor non-potable demand, industrial process water demand, or other demands. Rainwater harvesting systems typically include several components: (1) methods to divert stormwater runoff to the storage device, (2) an overflow for when the storage device is full, and (3) a distribution system to get the water to where it is intended to be used.
Infeasibility of rainwater harvesting may result from various factors, including regulatory concerns, such as municipal building and plumbing codes, health and safety regulations addressing treatment requirements, or concern about downstream beneficial uses. If these concerns were non-existent, the technical feasibility of rainwater harvesting systems would be based on available supply and demand to achieve capture and use of the C.3 stormwater runoff design volume.
2.3.1 Supply and Demand
Application of rainwater harvesting and use to achieve C.3 compliance requires that there be reliable demand available to draw down an appropriately-sized tank, such that the volume hydraulic design basis is met. California’s highly seasonal precipitation pattern, which causes most to all of the annual precipitation to be generated within the months of October through
Prepared for BASMAA Final Report
9 1 May 2011
April, strongly affects the practicality of rainwater harvesting systems to meet MRP treatment requirements.
In California and other arid or semi-arid regions, supply and demand often do not occur simultaneously. Specifically, irrigation is a demand that is present during months where supply is largely unavailable. Rainwater supply is largely unavailable during the summer months, so the total percentage of annual supply provided by rainwater harvesting is typically low. A study by Jensen (2010) displays this trend for Salt Lake City and Phoenix, which have seasonal rainfall patterns similar to the Bay Area. The percent of annual supply provided by cisterns for indoor and outdoor uses was calculated to meet only 25% of demand, even as cistern sizes increase. An analysis of supply and demand conditions for the Bay Area is provided in Section 3.3 of this report.
2.3.2 Other Factors
Other factors that may affect the feasibility of rainwater harvesting and use to achieve C.3 compliance include the following:
• Recycled Water Use Conflicts – Use of municipal recycled water may limit available demand for harvested rainwater. In municipalities that have invested in recycled water distribution facilities in order to achieve water conservation goals or wastewater discharge compliance mandates, buildings along distribution pipelines may be required to use recycled water for non-potable demands, thereby reducing or eliminating demand for harvested rainwater.
• Municipal Building and/or Plumbing Codes – The 2009 Uniform Plumbing Code (UPC), the 2009 International Plumbing Code (IPC), and the draft 2010 California Plumbing Code do not address rainwater harvesting systems. The UPC does, however, contain requirements for the installation, construction, alteration, and repair of municipal recycled water systems that supply toilets, urinals, and trap primers for floor drains and floor sinks for non-residential building. The California-Nevada Section of the American Water Works Association also has issued guidelines for the planning, design, construction, and operation of municipal recycled water systems, but not for rainwater harvesting systems. Thus, most municipalities currently do not have a building permit process in place to review building permit applications for the installation of rainwater harvesting systems.
• Reliability of Water Quality and/or Water Chemistry with Rainwater Harvesting Systems – Reliable water quality and consistent water chemistry is important, if not imperative, for interior uses, in particular for industrial and evaporative cooling processes and other
Prepared for BASMAA Final Report
10 1 May 2011
uses with a high probability of human contact such as toilet and urinal flushing. The California Department of Health Services (DHS) has established specific water quality standards and treatment reliability criteria for municipal recycled water under Title 22, Division 4, Chapter 3, of the California Code of Regulations. Title 22 sets bacteriological water quality standards on the basis of the expected degree of public contact with recycled water. For water reuse applications with a high potential for the public to come into contact with recycled water, Title 22 requires disinfected tertiary treatment. For applications with a lower potential for public contact, Title 22 requires three levels of secondary treatment, basically differing by the amount of disinfection required. Samples of effluent discharge at treatment plants that provide recycled water programs (for both interior and exterior uses) are collected and analyzed daily. The results are evaluated, rechecked if necessary, and used by treatment plant operators to regulate the treatment process to ensure water quality. No evaluation standards or process currently exists to ensure the water quality and consistency of rainwater harvesting systems.
• Operational Challenges of Rainwater Harvesting Systems – Given rainfall patterns in the Bay Area, there are potential operational challenges with rainwater harvesting systems that propose to use captured water for interior uses, where said captured water must be treated with Title 22 treatment systems (e.g., ultra-violet or chlorination disinfection systems), and how those treatment systems are physically shut off once the stored and captured rainwater is depleted.
• Site Constraints – Site topography and available space may restrict potential placement of rainwater harvesting tanks. Topography may result in elevation and head drop, as well as tank stability (i.e. on slopes) issues. Enough hydraulic head is needed from the runoff source to the storage tank and then to the point of water use to provide flow. If there is inadequate head to empty the storage tank to the desired depth, pumps would be needed.
• Geotechnical/Structural Stability – Roofs and ground surfaces must be able to support a large cistern, rooftop collection system or underground tank full of water. The bearing capacity of soils underneath surface-mounted storage tanks must be adequate to support the weight of a tank full of water.
• Proximity of Underground Utilities – Tanks should not be placed on top of underground utilities or septic systems such that they restrict access or cause stability concerns.
2.3.3 Other Drivers to Implement Rainwater Harvesting Systems
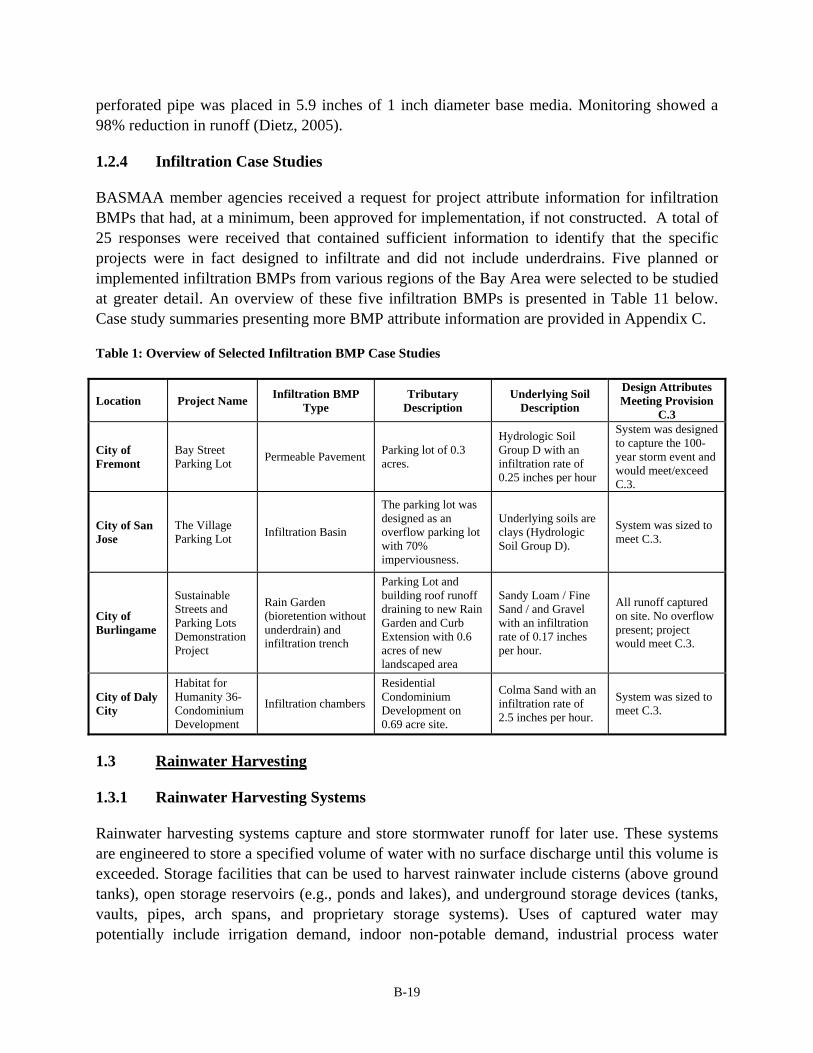
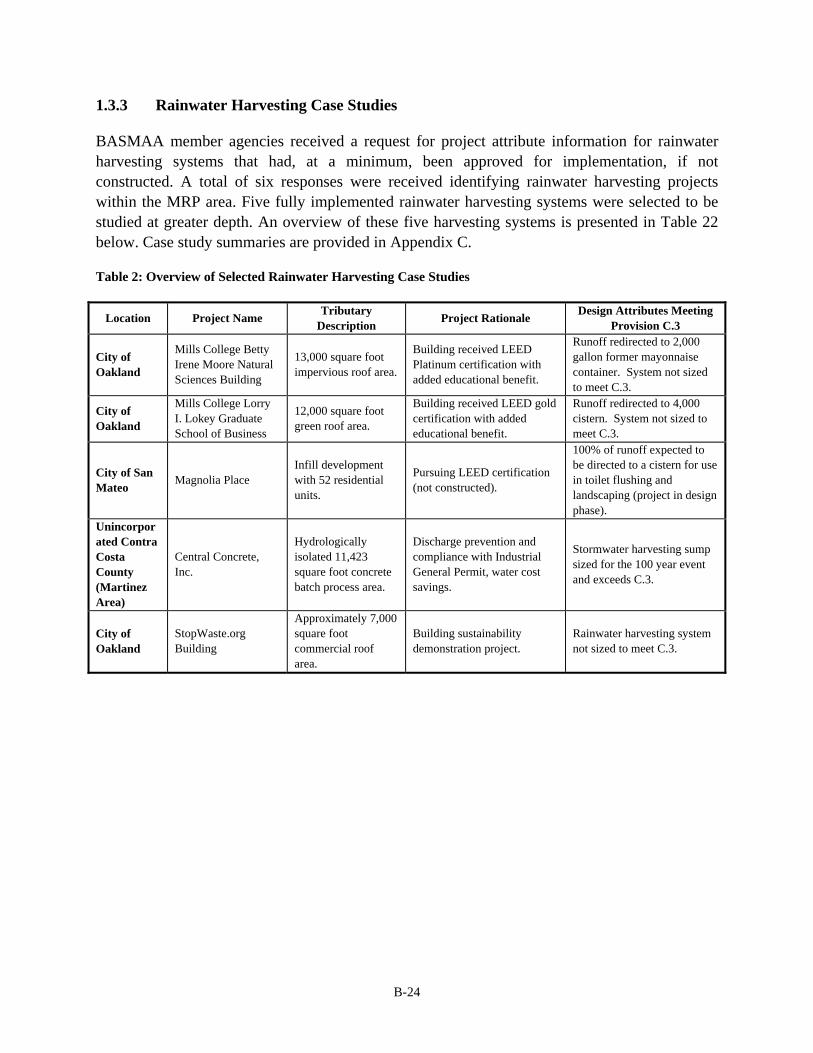
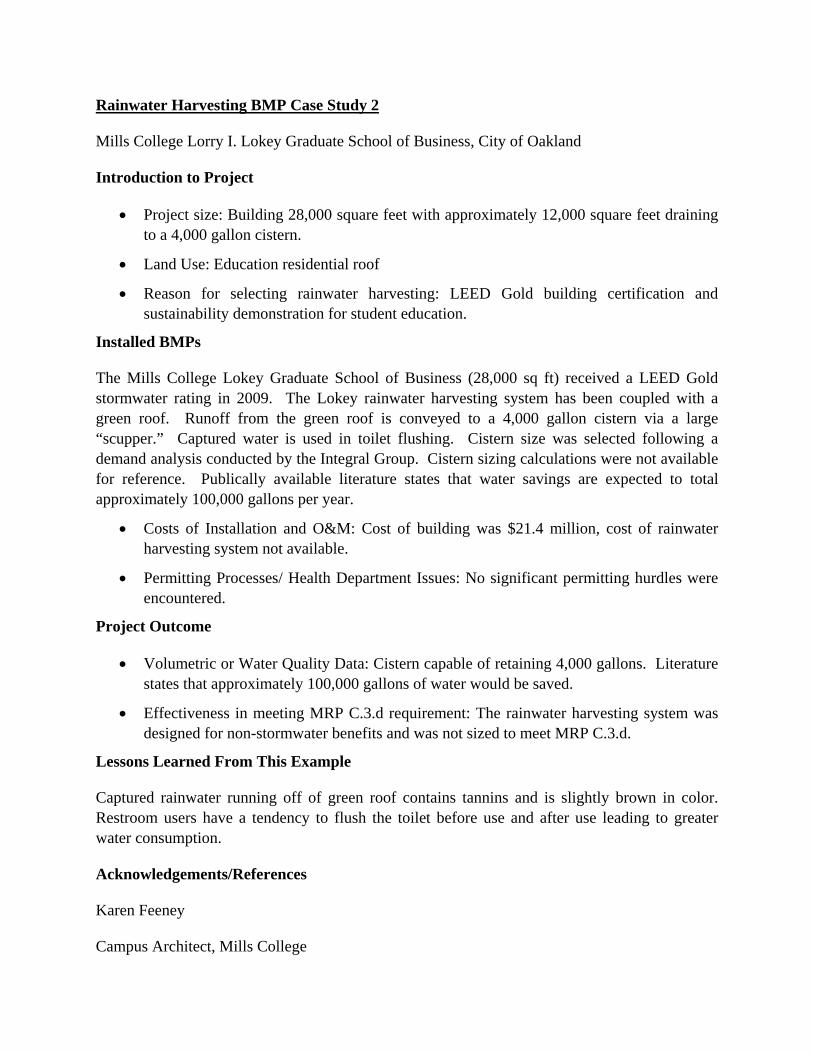
A review of five rainwater harvesting projects that have, at a minimum, received planning approval within the MRP area showed that systems were constructed in response to a number of
Prepared for BASMAA Final Report
11 1 May 2011
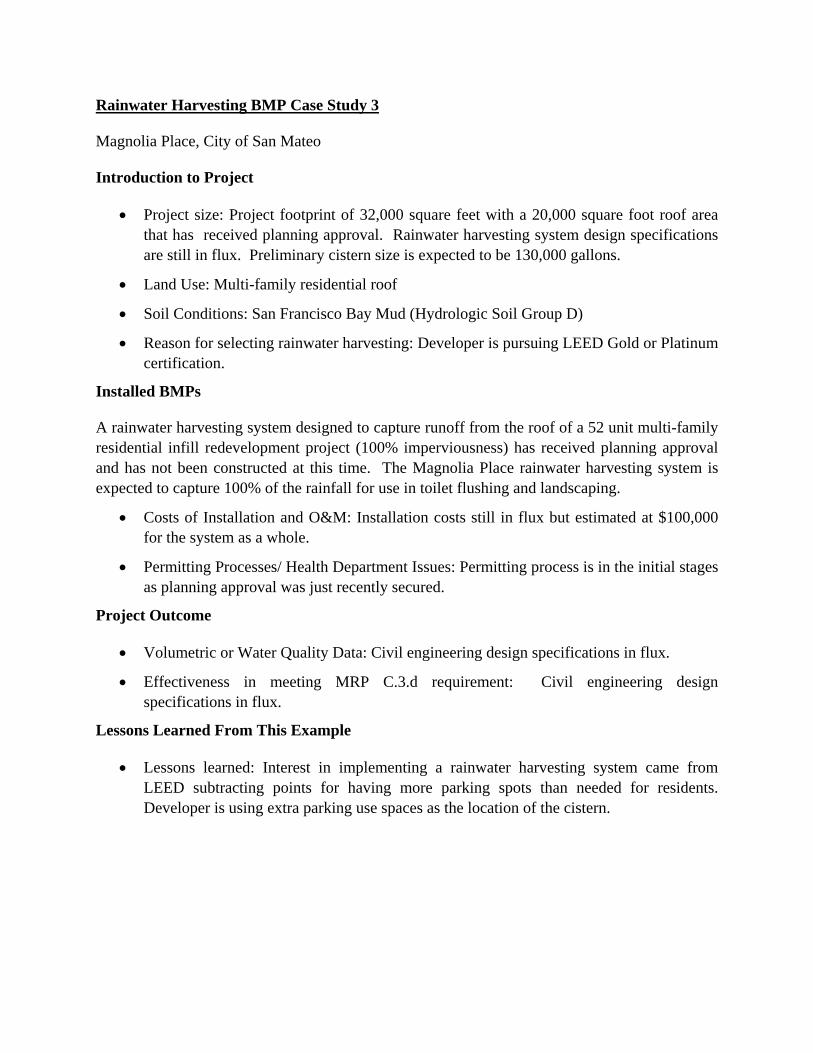
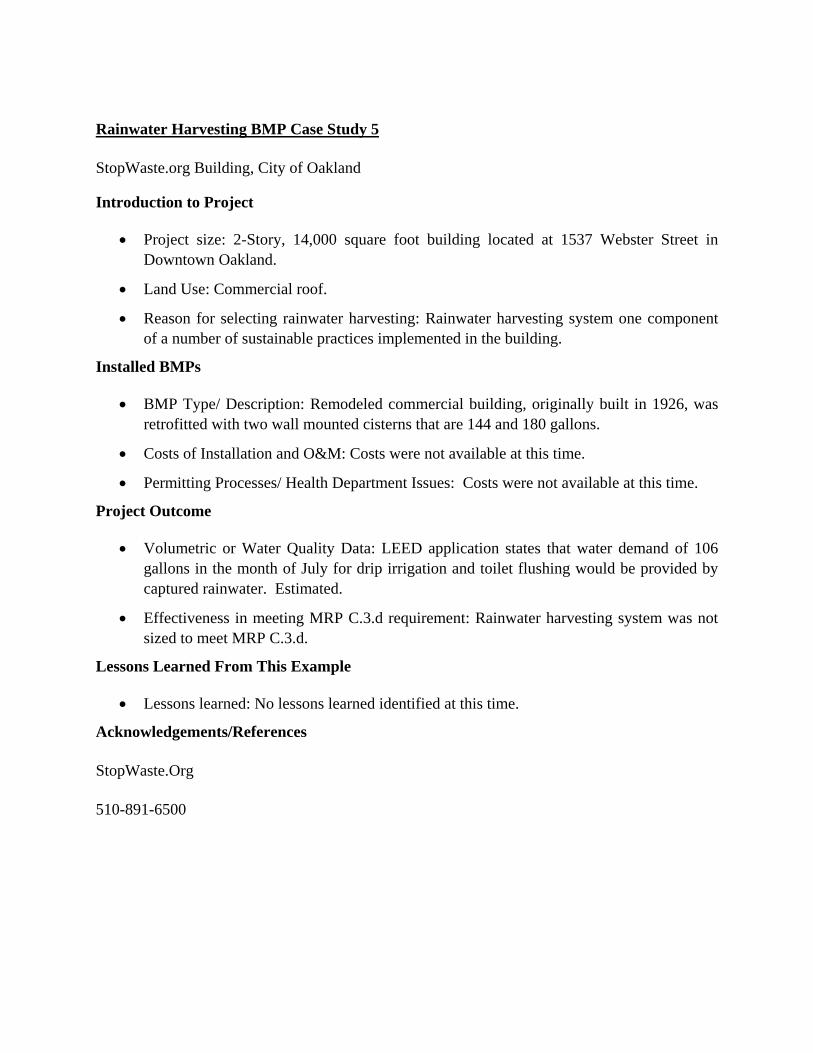
drivers other than stormwater retention and low impact development requirements. Four of the five case studies presented in Appendix C (Mills College’s two systems, the Stopwaste.Org building, and the planned Magnolia Place project) identify Leadership in Energy & Environmental Design (LEED) certification as the primary incentive for investing in rainwater harvesting systems.
Public education and the demonstration of sustainable technology were identified as a secondary driver for both Mills College buildings as well as the Stopwaste.Org building. Rainwater harvesting is expected to be incorporated into the planned Magnolia Place multi-family residential development with the prospect of securing additional LEED points for a higher Green Building certification level.
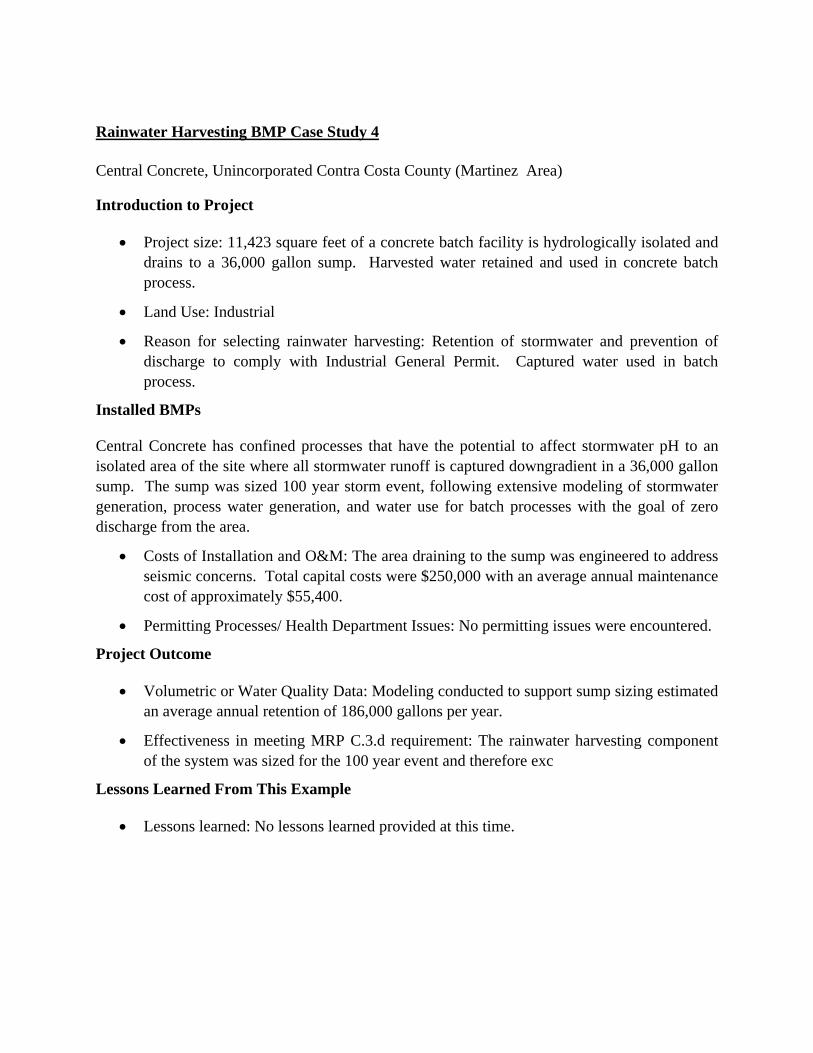
The rainwater harvesting or capture system operated at the Central Concrete batch plant in unincorporated Contra Costa County was implemented to prevent the discharge of stormwater with an elevated pH, given the site’s concrete batching processes, and reduce or eliminate the potential for non-compliance with the California Industrial Storm Water General Permit (Order 97-03-DWQ). Central Concrete is able to utilize captured stormwater in their industrial processes and avoid the costs of purchasing water. However, the primary driver for the investment in harvesting system design, performance modeling, and ultimately implementation was meeting discharge requirements under the Industrial General Permit (Appendix C).
2.4 Factors Affecting Feasibility of Evapotranspiration
Evapotranspiration (ET) is the loss of water to the atmosphere by the combined processes of evaporation (from mulch, soil, and plant surfaces) and transpiration (from plant tissues). ET rates are an indicator of how much water crops, lawns, gardens, and trees need for growth and productivity based on local climate conditions.
ET is considered in this report to be a component of Self-Retaining and Self-Treating Areas, bioinfiltration and biotreatment facilities, and rainwater harvesting systems. For vegetated Self-Retaining, Self-Treating Areas, and bioinfiltration and biotreatment measures, ET occurs through plant respiration; for rainwater harvesting, ET occurs when rainwater used for irrigation is taken up by irrigated plants. Thus, the feasibility of ET is not specifically evaluated but is included in the process for evaluating infiltration and rainwater harvesting feasibility.
A flow chart representing the sequential process for use in determining whether infiltration, rainwater harvesting, and evapotranspiration are feasible or infeasible to implement at a project site is presented in Figure 1. Before using the flow chart, a project proponent will have determined that the project is a Regulated Project. A preliminary site plan may be prepared that divides the project into drainage management areas (DMAs). The feasibility/infeasibility analysis process may be conducted for each DMA or the entire project site.
The sequential process presented in Figure 1 begins with assessing site design measures (Step 1a) and determining the amount of Self-Treating Areas and Self-Retaining Areas on the project site (Step 1b). If a project consists entirely of Self-Retaining Areas, Areas Draining to Self-Retaining Areas, and/or Self-Treating Areas, then it complies with site design and treatment requirements of the MRP. If there are remaining impervious areas with stormwater runoff to be treated, then the project proponent assesses the feasibility to treat the C.3.d. amount of stormwater runoff via infiltration measures or devices (Step 2a) and/or rainwater harvesting measures (Step 2b) using the steps detailed in the sections below. If it is infeasible to fully treat the C.3.d stormwater runoff amount using either of the two measures, then a project proponent implements biotreatment (Step 3).
3.1 Step 1a. Site Design Measures/Self-Treating and Self-Retaining Areas
The first step in the process is to implement site design strategies as part of MRP requirements in C.3.c.i.(2)(a). On development projects where they are feasible, these methods are considered the primary and preferred method of implementing LID and achieving compliance with Provision C.3.c. These methods have the greatest potential for controlling stormwater runoff via infiltration and evapotranspiration while also mimicking pre-project site hydrology.
Because MRP Provision C.3.c.i.(2)(a) does not include technical criteria to ensure the effectiveness of these methods, the Permittees have developed, as part of their own implementation procedures, specific methods that applicants must follow to demonstrate their site design measures achieve the objectives of Provision C.3.c.
Prepared for BASMAA Final Report
13 1 May 2011
Figure 1: Feasibility Criteria Flow Chart
Prepared for BASMAA Final Report
14 1 May 2011
The first set of site design strategies include:
• Limiting disturbance of natural water bodies and drainage systems;
• Conserving natural areas; and
• Minimizing impervious surfaces.
The designation of Self-Treating Areas is the method used to document and credit areas that are left undisturbed or are being restored to pervious condition. These areas may or may not produce stormwater runoff under the rainfall intensity specified in Provision C.3.d.; however, any runoff produced is filtered through vegetation and surface soils before flowing to storm drains.
Provision C.3.c.i.(2)(a) also requires Regulated Projects to implement one or more of the following site design measures:
1. Direct roof runoff into cisterns or rain barrels for reuse3.
2. Direct roof runoff onto vegetated areas.
3. Direct stormwater runoff from sidewalks, walkways, and/or patios onto vegetated areas.
4. Construct sidewalks, walkways, and/or patios with permeable surfaces.
5. Construct driveways, bike lanes and/or uncovered parking lots with permeable surfaces.
The designation of Self-Retaining Areas and Areas Draining to Self-Retaining Areas is the method applicants and permittees use to implement and account for items 2 through 5 above, while assuring the rainfall intensity specified in Provision C.3.d. will produce no stormwater runoff from these areas.
3.1.1 Landscape Dispersion
Landscape dispersion refers to the practice of routing stormwater runoff from impervious areas, such as rooftops, walkways, and patios, onto the surface of adjacent pervious (Self-Retaining) areas. Stormwater runoff is dispersed via splash block, dispersion trench, or sheet flow and soaks into the ground as it moves slowly across the surface of the pervious area. In general, the pervious area should store and infiltrate the runoff from the first inch of rainfall within 48 hours.
3 When implemented as a site design measure, rainwater harvesting is one of a number of potential measures to reduce runoff, and rain barrels or cisterns do not need to be sized to meet C.3.d. requirements for 80 percent capture of average annual runoff.
Prepared for BASMAA Final Report
15 1 May 2011
Some C.3 technical design guidance documents require that the impervious to pervious area ratio for Areas Draining to Self-Retaining Areas and Self-Retaining Areas not exceed 2:1.
The following design criteria and considerations for Self-Retaining Areas are referenced from several Bay Area C.3 design manuals, including the 2010 Alameda County Manual, the 2010 Contra Costa County Manual, and the 2010 San Mateo County Manual.
• The S-R Area should retain the first one inch of rainfall without runoff;
• The maximum allowable ratio4 of impervious (Area Draining to S-R Area) to pervious area (S-R Area) is 2:1;
• Any area drain inlets in the S-R area should be at least 3 inches above grade;
• Side slopes of the S-R Area should not exceed 4 percent;
• The S-R area should be bermed all the way around or graded concave;
• The entire S-R Area is lawn, landscaping, or pervious pavement; and
• The S-R Area has amended soils, vegetation, and irrigation as required to maintain soil stability and permeability.
The required storage volume within a Self-Retaining Area to capture 80 percent of the average annual runoff volume draining from a one-acre impervious area, with a 48-hour drawdown time, was estimated using continuous simulation modeling for rainfall gauges located throughout the MRP area (see Appendix F for drawdown nomographs). Table 2 includes the required ponding depth and saturated hydraulic conductivity (Ksat) to achieve 80 percent capture within a 48 hour drawdown, with an impervious to pervious area ratio of 2:1.
The results of the modeling show that the design criterion to retain an inch of rainfall, which translates to a 3-inch ponding depth for a Self-Retaining Area if the maximum 2:1 ratio is used, achieves the capture and subsequent infiltration and evapotranspiration of the targeted 80 percent of average annual stormwater runoff, given reasonable assumptions for a minimum rate of infiltration to site soils.
4 The maximum allowable ratio of impervious to pervious area should not exceed 1:1, if hydromodification requirements also apply per MRP provision C.3.g.
Prepared for BASMAA Final Report
16 1 May 2011
Table 2: Required Ponding Depth and Saturated Hydraulic Conductivity (Ksat) to Achieve 80 Percent Capture with an Impervious to Pervious Area Ratio of 2:1
Dublin 3,100 2:1 2.6 0.05 Hayward 3,900 2:1 3.2 0.07 Lake Solano 3,100 2:1 2.5 0.05 Martinez 3,400 2:1 2.8 0.06 Palo Alto 2,700 2:1 2.2 0.05 San Francisco 2,000 2:1 1.7 0.03 San Francisco Oceanside 2,800 2:1 2.3 0.05 San Jose 2,500 2:1 2.1 0.04 Berkeley 3,100 2:1 2.5 0.05
Footnotes: 1 Determined from continuous simulation modeling, see Appendix F for nomographs. Storage needed for a 1 acre impervious
area with a 48 hour drawdown time.
3.1.2 Green Roofs
For the purpose of the feasibility evaluation process, green roofs can be considered Self-Treating Areas or Self-Retaining Areas. For criteria used to account for green roofs in C.3 compliance, please refer to BASMAA’s Green Roof Minimum Specifications Report (May 2011).
3.1.3 Pervious Pavement
Pervious pavement can be considered a Self-Treating Area, if the area stores and infiltrates rainfall at a rate equal to immediately surrounding unpaved, landscaped areas, or a Self-Retaining Area, if it receives stormwater runoff from other areas and is designed to store and infiltrate the C.3.d stormwater runoff volume. In general, the depth of base course required to achieve pavement stability and durability for a given soil usually provides sufficient volume within the pavement and base course to store and infiltrate rainfall at a rate equivalent to surrounding unpaved landscaped areas, or to store and infiltrate the stormwater runoff volume described in Provision C.3.d. If an underdrain is used, it must be placed above the volume of base course necessary to store and infiltrate the C.3.d volume.
Prepared for BASMAA Final Report
17 1 May 2011
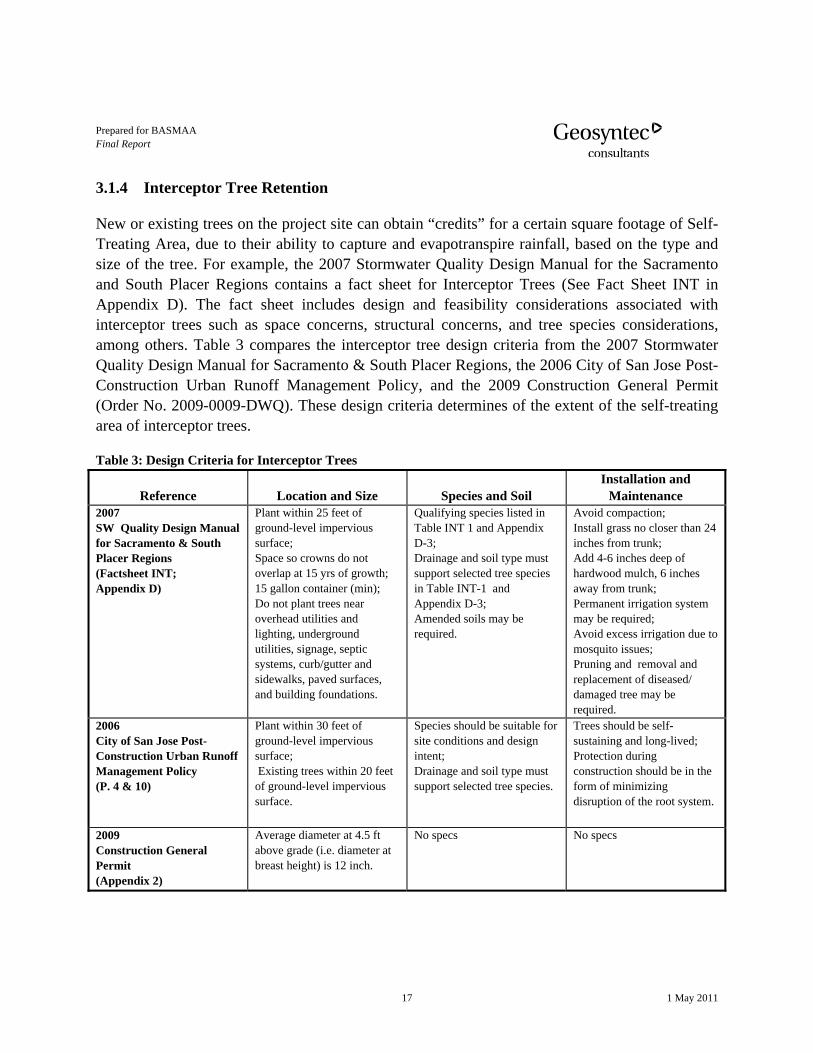
3.1.4 Interceptor Tree Retention
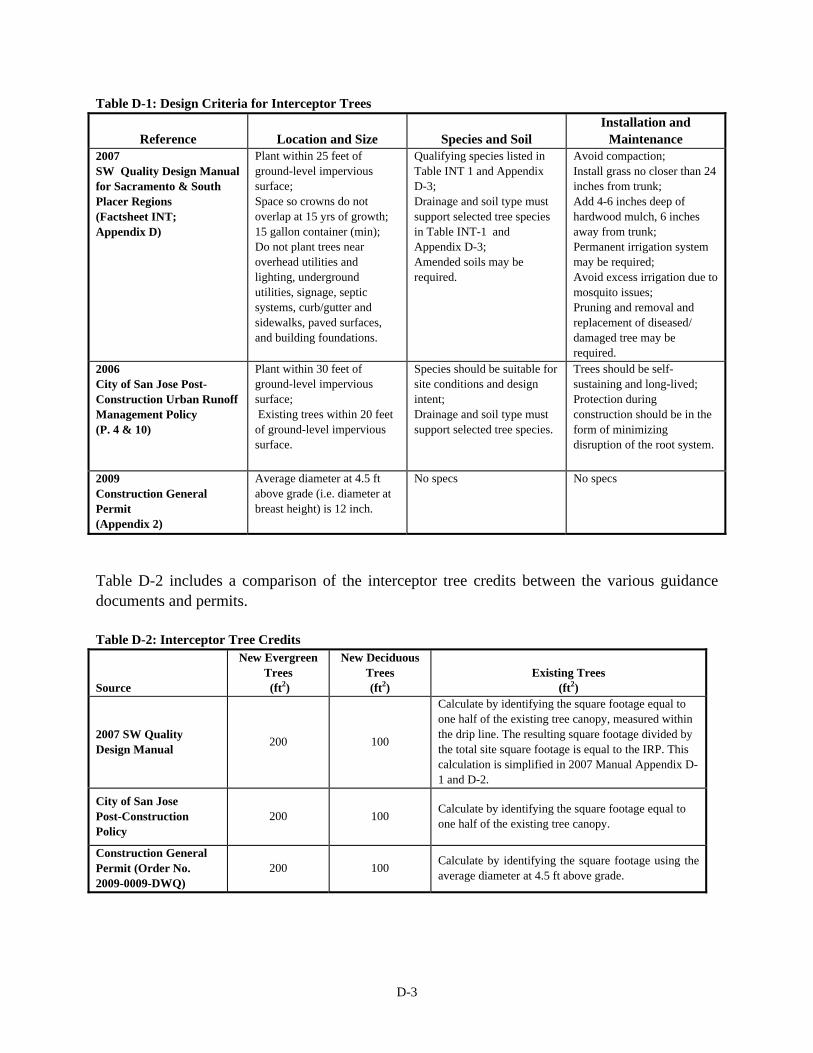
New or existing trees on the project site can obtain “credits” for a certain square footage of Self-Treating Area, due to their ability to capture and evapotranspire rainfall, based on the type and size of the tree. For example, the 2007 Stormwater Quality Design Manual for the Sacramento and South Placer Regions contains a fact sheet for Interceptor Trees (See Fact Sheet INT in Appendix D). The fact sheet includes design and feasibility considerations associated with interceptor trees such as space concerns, structural concerns, and tree species considerations, among others. Table 3 compares the interceptor tree design criteria from the 2007 Stormwater Quality Design Manual for Sacramento & South Placer Regions, the 2006 City of San Jose Post-Construction Urban Runoff Management Policy, and the 2009 Construction General Permit (Order No. 2009-0009-DWQ). These design criteria determines of the extent of the self-treating area of interceptor trees.
Table 3: Design Criteria for Interceptor Trees
Reference Location and Size Species and Soil Installation and
Maintenance 2007 SW Quality Design Manual for Sacramento & South Placer Regions (Factsheet INT; Appendix D)
Plant within 25 feet of ground-level impervious surface; Space so crowns do not overlap at 15 yrs of growth; 15 gallon container (min); Do not plant trees near overhead utilities and lighting, underground utilities, signage, septic systems, curb/gutter and sidewalks, paved surfaces, and building foundations.
Qualifying species listed in Table INT 1 and Appendix D-3; Drainage and soil type must support selected tree species in Table INT-1 and Appendix D-3; Amended soils may be required.
Avoid compaction; Install grass no closer than 24 inches from trunk; Add 4-6 inches deep of hardwood mulch, 6 inches away from trunk; Permanent irrigation system may be required; Avoid excess irrigation due to mosquito issues; Pruning and removal and replacement of diseased/ damaged tree may be required.
2006 City of San Jose Post-Construction Urban Runoff Management Policy (P. 4 & 10)
Plant within 30 feet of ground-level impervious surface; Existing trees within 20 feet of ground-level impervious surface.
Species should be suitable for site conditions and design intent; Drainage and soil type must support selected tree species.
Trees should be self-sustaining and long-lived; Protection during construction should be in the form of minimizing disruption of the root system.
2009 Construction General Permit (Appendix 2)
Average diameter at 4.5 ft above grade (i.e. diameter at breast height) is 12 inch.
No specs No specs
Prepared for BASMAA Final Report
18 1 May 2011
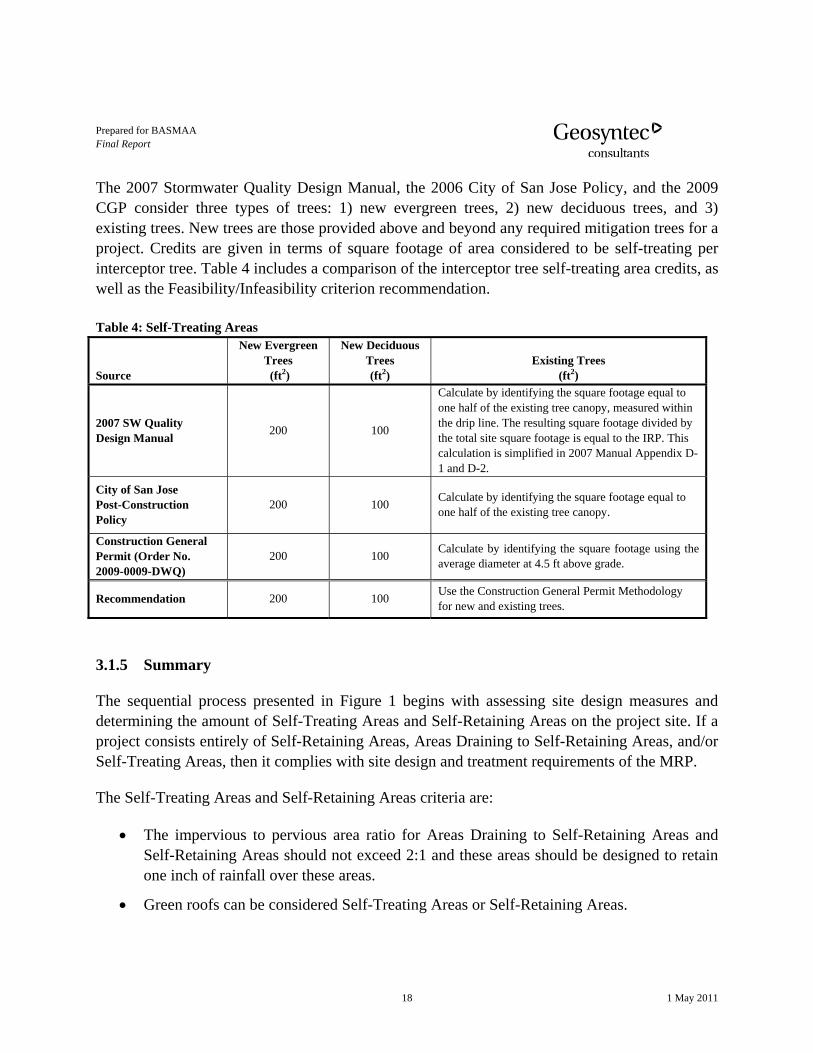
The 2007 Stormwater Quality Design Manual, the 2006 City of San Jose Policy, and the 2009 CGP consider three types of trees: 1) new evergreen trees, 2) new deciduous trees, and 3) existing trees. New trees are those provided above and beyond any required mitigation trees for a project. Credits are given in terms of square footage of area considered to be self-treating per interceptor tree. Table 4 includes a comparison of the interceptor tree self-treating area credits, as well as the Feasibility/Infeasibility criterion recommendation. Table 4: Self-Treating Areas
Source
New Evergreen Trees (ft2)
New Deciduous Trees (ft2)
Existing Trees (ft2)
2007 SW Quality Design Manual 200 100
Calculate by identifying the square footage equal to one half of the existing tree canopy, measured within the drip line. The resulting square footage divided by the total site square footage is equal to the IRP. This calculation is simplified in 2007 Manual Appendix D-1 and D-2.
City of San Jose Post-Construction Policy
200 100 Calculate by identifying the square footage equal to one half of the existing tree canopy.
Construction General Permit (Order No. 2009-0009-DWQ)
200 100 Calculate by identifying the square footage using the average diameter at 4.5 ft above grade.
Recommendation 200 100 Use the Construction General Permit Methodology for new and existing trees.
3.1.5 Summary
The sequential process presented in Figure 1 begins with assessing site design measures and determining the amount of Self-Treating Areas and Self-Retaining Areas on the project site. If a project consists entirely of Self-Retaining Areas, Areas Draining to Self-Retaining Areas, and/or Self-Treating Areas, then it complies with site design and treatment requirements of the MRP.
The Self-Treating Areas and Self-Retaining Areas criteria are:
• The impervious to pervious area ratio for Areas Draining to Self-Retaining Areas and Self-Retaining Areas should not exceed 2:1 and these areas should be designed to retain one inch of rainfall over these areas.
• Green roofs can be considered Self-Treating Areas or Self-Retaining Areas.
Prepared for BASMAA Final Report
19 1 May 2011
• Pervious pavement can be considered a Self-Treating Area, if the area stores and infiltrates rainfall at a rate equal to immediately surrounding unpaved, landscaped areas, or a Self-Retaining Area, if it receives stormwater runoff from other areas and is designed to store and infiltrate the C.3.d stormwater runoff volume.
• Interceptor Tree credits will be given in terms of square footage of area considered to be self-treating per the method specified in the Construction General permit (200 sf for new evergreen trees, 100 sf for new deciduous trees, and the average diameter at 4.5 ft above grade for existing trees).
3.2 Step 2a. Infiltration Measures and Devices
The assessment of feasibility of infiltration or rainwater harvest for a particular development project can start with assessing either infiltration (Step 2a) or rainwater harvesting (Step 2b). If either option is found to be feasible and is implemented, the other option does not need to be assessed. If the first option considered is found to be infeasible, then the other option must be assessed before moving to biotreatment.
Infiltration can be implemented on a project site using infiltration measures or devices. The most common infiltration measure that will be used by projects is bioinfiltration. To assess the feasibility of infiltration using bioinfiltration on a project site, one must evaluate whether infiltration of the required 80 percent of average annual stormwater runoff can be achieved with the following standard design parameters:
• Sizing factor (bioinfiltration surface area /tributary equivalent impervious area) of 4 percent;
• 6-inch deep surface reservoir;
• 18-inch deep planting media;
• 12-inch deep gravel layer;
• Open interface of the gravel layer to the underlying soils (no liner).
Factors affecting whether the required amount of stormwater runoff may be infiltrated in a facility of this design include: 1) the permeability of underlying soils; and 2) the presence or absence of factors which would preclude allowing the open interface of the gravel layer to underlying soils. An evaluation of the feasibility of bioinfiltration due to the permeability of
Prepared for BASMAA Final Report
20 1 May 2011
underlying soils was conducted using a continuous simulation model. The modeling assumptions, results and conclusions are presented in Section 3.2.1.
If site conditions preclude allowing an open interface of the gravel layer to underlying soils, then infiltration (using bioinfiltration, other infiltration measures, or infiltration devices) is infeasible and the feasibility of rainwater harvesting systems must be assessed. The following conditions may preclude the use of infiltration measures or devices on a project site:
• Locations within 100 feet of a groundwater well used for drinking water;
• Development sites where pollutant mobilization in the soil or groundwater is a documented concern;
• Locations with potential geotechnical hazards;
• Locations where policies of local water districts or other applicable agencies preclude infiltration.
In addition, MRP Provision C.3.d.iv. provides feasibility criteria specifically for infiltration devices, which include the following:
• Appropriate pollution prevention and source control measures, including a minimum of two feet of suitable soil to achieve a maximum of 5 inches/hour infiltration rate;
• Adequate maintenance is provided to maximize pollutant removal capabilities;
• Vertical distance from the base of any infiltration device to the seasonal high groundwater mark is at least 10 feet (or greater if the site has highly porous soils or there are other concerns for groundwater protection);
• Unless stormwater is first treated by a method other than infiltration, infiltration devices are not approved as a treatment measure for stormwater runoff from areas of industrial areas, areas of high vehicular traffic or land uses that pose a high threat to water quality;
• Infiltration devices are not placed in the vicinity of known contaminated sites; and
• Infiltration devices are located a minimum of 100 feet horizontally away from any known water supply wells, septic systems, and underground storage tanks (or greater if the site has highly porous soils or there are other concerns for groundwater protection).
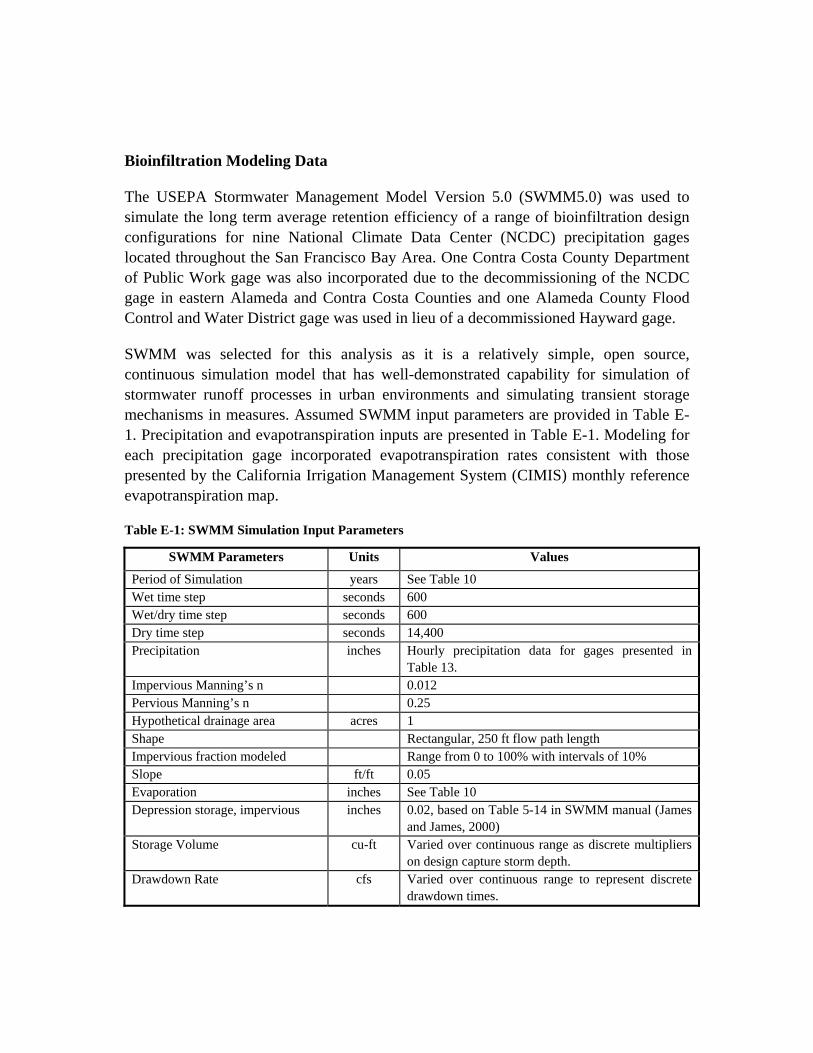
3.2.1 Bioinfiltration Modeling
Bioinfiltration measures were modeled with a defined retention storage volume and underlying soil infiltration rate, represented by the soil’s saturated hydraulic conductivity or “Ksat” value.
Prepared for BASMAA Final Report
21 1 May 2011
These parameters were varied to evaluate, within the accuracy of the model and model inputs, the long term performance of the bioinfiltration measure using a range of gravel sump depths, underlying soil Ksat, and rainfall records from MRP areas. A bioinfiltration measure sited in a location with a higher Ksat, which allows for more rapid drawdown (i.e., makes storage available more quickly), would be expected to capture a greater fraction of overall stormwater runoff than an identically sized measure that draws down more slowly.
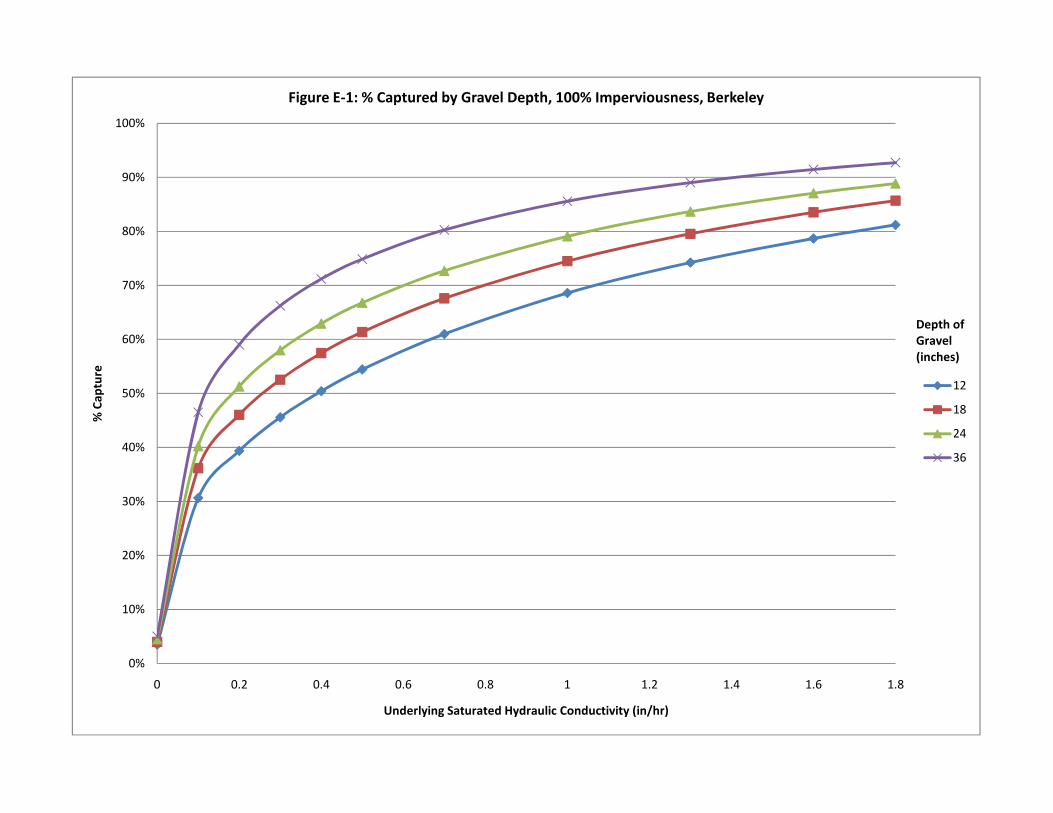
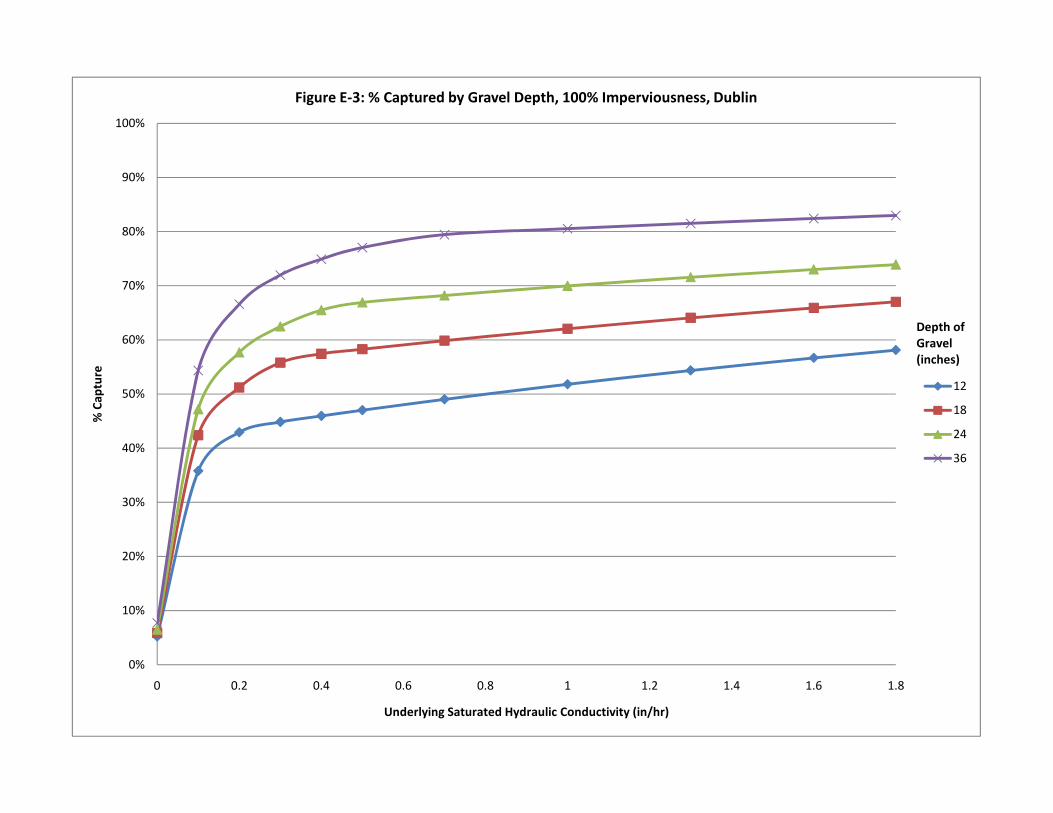
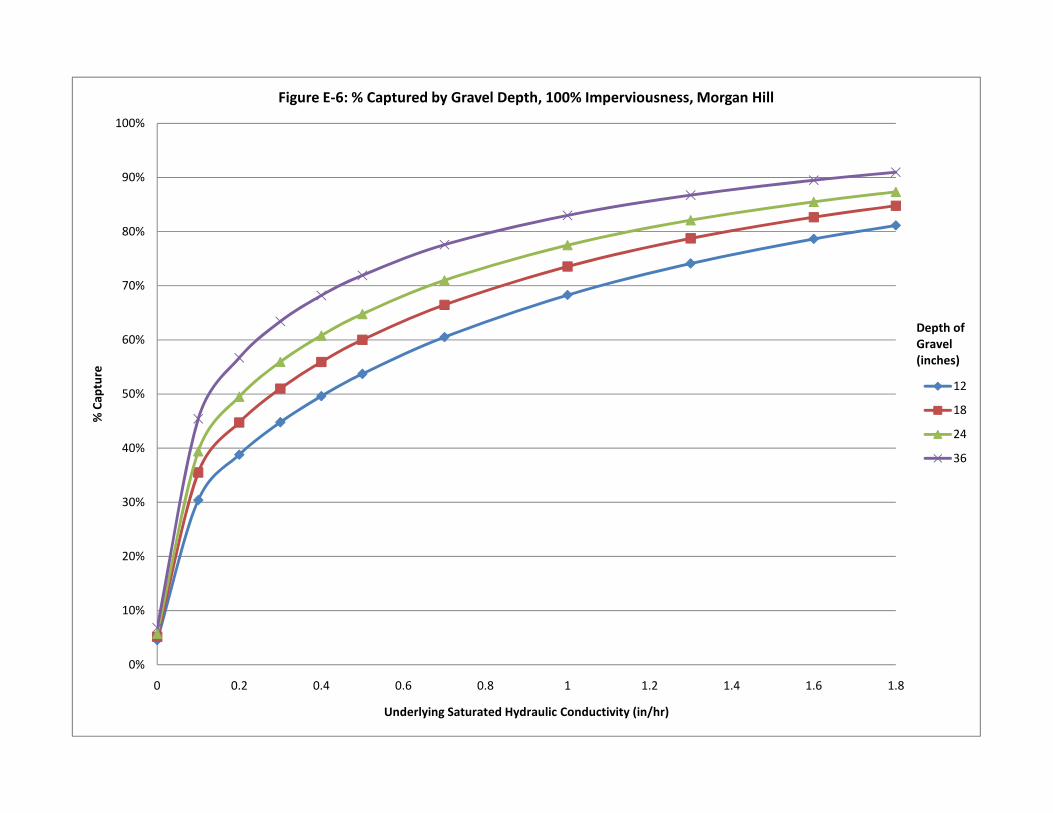
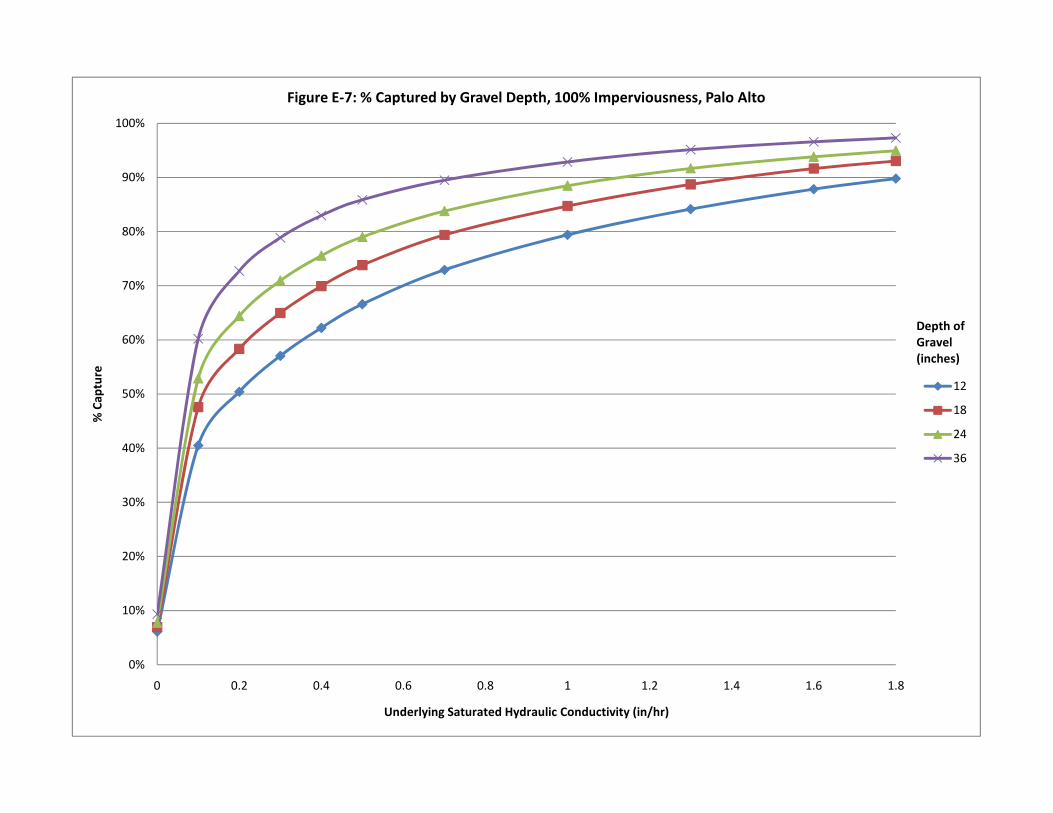
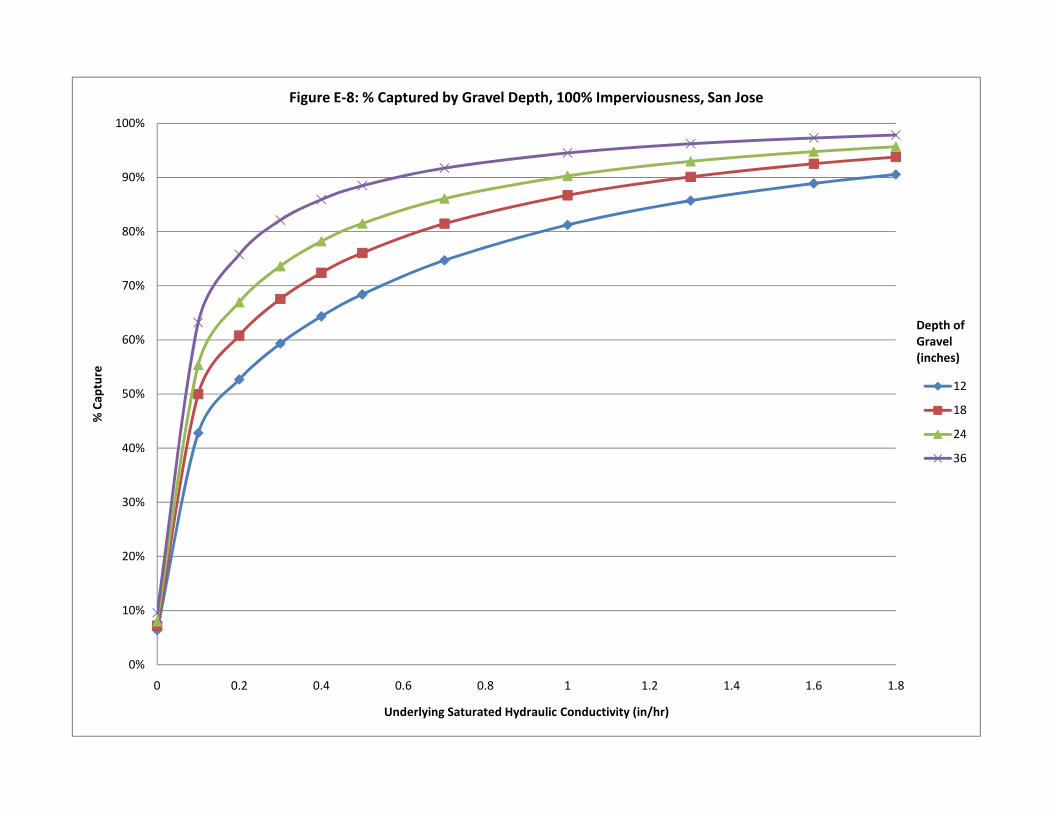
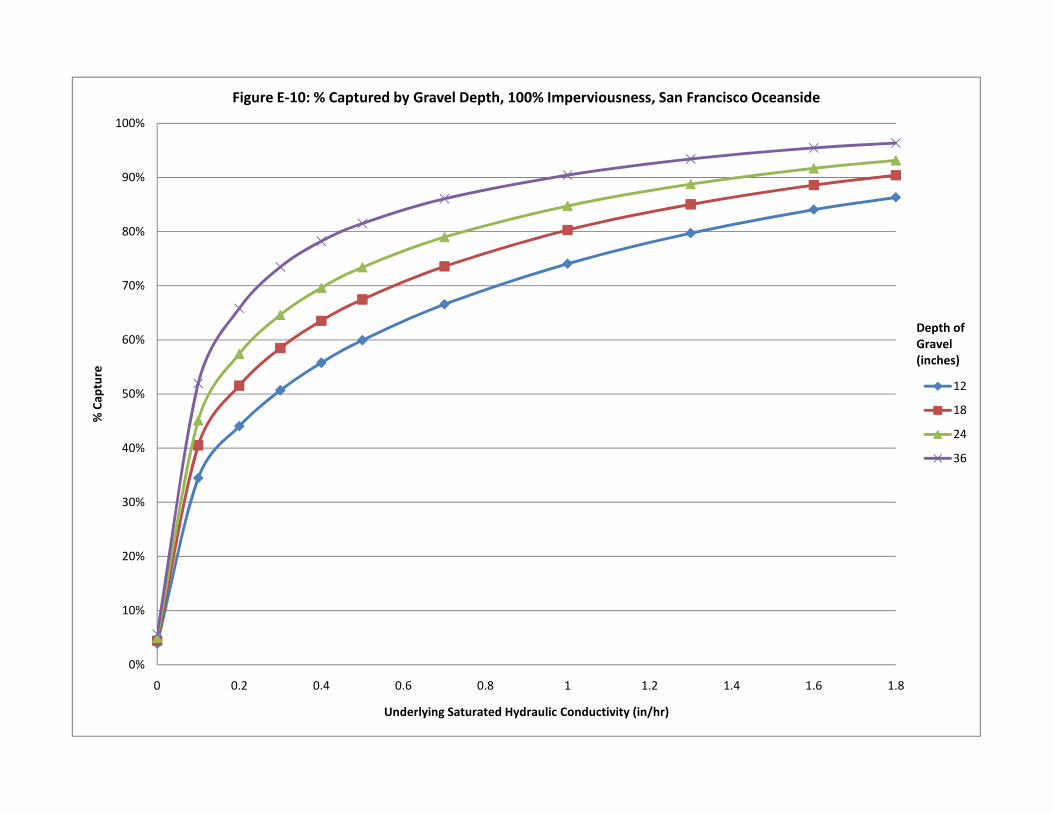
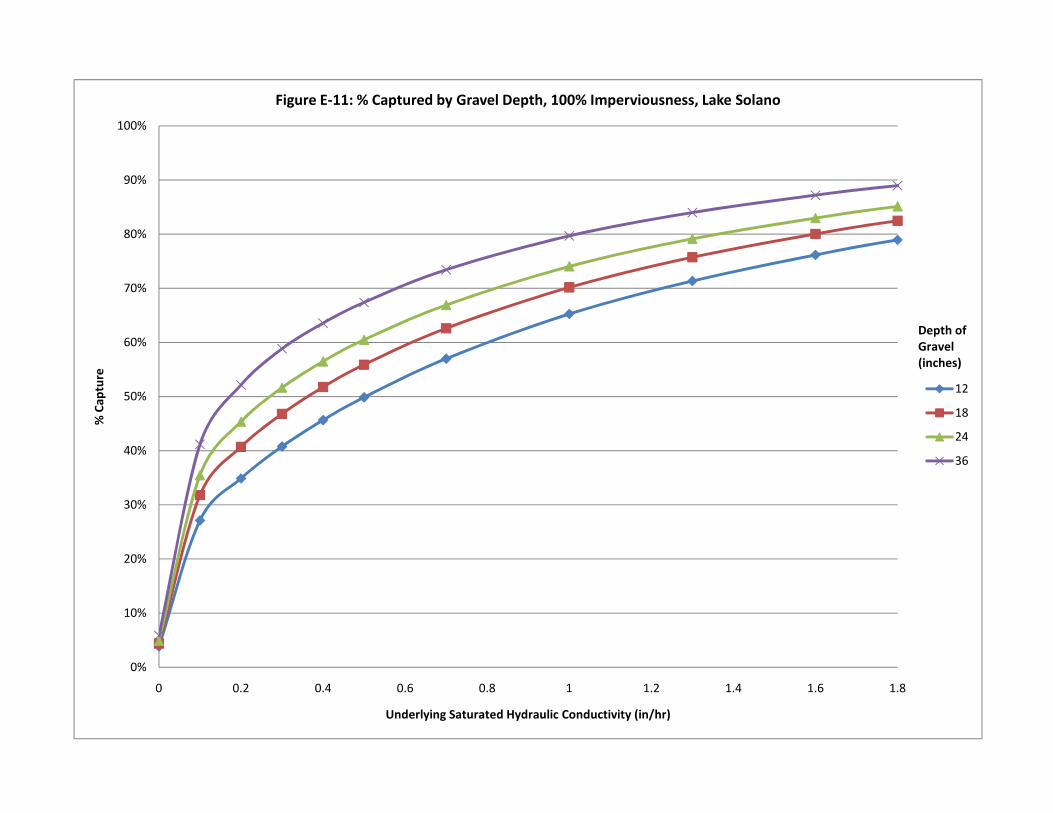
An evaluation of the relationships between bioinfiltration design parameters and expected long term infiltration efficiency was conducted to determine required bioinfiltration gravel sump depth and design Ksat to achieve 80 percent capture of the average annual stormwater runoff volume. These relationships were developed through a continuous simulation model that relates bioinfiltration design volume and storage recovery rate (i.e., drawdown time) to an estimated long term infiltration efficiency. A series of charts presenting the relationships between tributary imperviousness, underlying soil saturated hydraulic conductivity, and the depth of the gravel layer within the bioinfiltration measure were developed for rain gages throughout the San Francisco Bay Area (See Appendix E).
The resulting average annual infiltration efficiency (i.e., the portion of average annual stormwater runoff that is infiltrated and not immediately bypassed by the measure or released through the raised underdrain) was extracted from the modeling results for each run and presented as the dependent variable in the previously mentioned nomographs.
The infiltration efficiency of four bioinfiltration measure cross-sections (differentiated by the depth of the gravel layer) across Bay Area precipitation patterns varied extensively. Modeling results indicate that 80 percent capture cannot be achieved in areas where underlying soil infiltration rates are low, typically below 0.4 inches/hour (consistent with Hydrologic Soil Groups C and D). However, modeling results indicate that 80 percent capture can be achieved throughout the MRP area where saturated hydraulic conductivities are greater than 1.6 inches/hour, consistent with Hydrologic Soil Group A, except for except in the vicinity of the Dublin and Hayward gages. The relationship between the independent variables of precipitation gage, tributary imperviousness, and underlying soil saturated hydraulic conductivity and the dependent variable of percent capture are shown in the nomographs provided in Appendix E.
On sites with soils having hydraulic conductivities between 0.4 and 1.6 inches per hour, the likelihood of achieving the 80 percent capture objective may be marginally increased by adding more storage (for example, a gravel layer deeper than 12 inches) (See Appendix F). However, achievement of the 80 percent objective still could not be assured at any given site with these soils, regardless of the amount of storage added, as the variability between measured conductivity and actual performance greatly exceeds this narrow range. Due to the bimodal
Prepared for BASMAA Final Report
22 1 May 2011
nature of soils distribution within the MRP area, a 12 inch gravel layer design standard is reasonable.
3.2.2 Summary
Infiltration measures and devices that are sized with a reasonable design standard (4 percent sizing factor, 6 inch surface reservoir, 18 inch planting media, and 12 inch gravel layer) will feasibly achieve the 80 percent capture objective for sites with soils having hydraulic conductivities above 1.6 inches per hour in all MRP areas except in the vicinity of the Dublin and Hayward gages. Reasonably sized infiltration measures and devices cannot achieve the 80 percent capture objective for all other locations within the MRP area.
3.3 Step 2b. Rainwater Harvesting
To determine if rainwater harvesting is feasible for the project or DMA, an assessment of use demand for harvested stormwater that will achieve 80 percent capture of the average annual runoff volume is required. Demand estimation should include consideration of requirements for using low water use plumbing fixtures, recycled water for indoor and outdoor uses, and low water use landscaping.
Tables 14 and 15 at the end of this section provide a simplified method for evaluating the feasibility of rainwater harvesting for meeting C.3 criteria by capturing and using 80 percent of average annual runoff. These tables or similar tables would be used in the permittees’ guidance to applicants for development approvals.
3.3.1 Harvested Water Demand Calculations
The following sections provide background information, technical references, and guidance for estimating the harvested water demand of a project. These references are intended to be used primarily at the planning phase of a project and for feasibility screening purposes.
Key Differences in Demand Calculations for Harvest and Use feasibility versus Water Supply Planning
It is important to note that harvested water demand calculations differ in purpose and methods from water demand calculations done for water supply planning. When designing harvest and use systems for stormwater management, a reliable method of regenerating system storage capacity (i.e., using water from the system via nonpotable demand) must exist to provide storage capacity for subsequent storms. Therefore, demand calculations for harvest and use measures
Prepared for BASMAA Final Report
23 1 May 2011
should attempt to estimate the actual demand that is reliably present to drain rainwater harvesting cisterns during the wet season. This objective is fundamentally different from the objectives of water demand forecasting calculations done for water supply planning, which may err toward higher estimates of demand. Harvested water demand calculations used to determine the feasibility of harvest and use measures must be based on estimates of actual demand that are reliably present to drain the cistern during the wet season.
Types of Harvested Water Demand
Types of non-potable water demand anticipated to be applicable to rainwater harvesting and use systems in the foreseeable future include:
• Toilet and urinal flushing
• Irrigation
• Vehicle washing
• Evaporative cooling
• Industrial processes
• Other non-potable uses
The following sections include analyses of toilet flushing, outdoor irrigation demand, and other non-potable demands. The primary distinction between toilet/urinal flushing and irrigation demand is the level of treatment and disinfection that is required to use the water and the seasonal pattern of the demand. Other non-potable demands are anticipated to be highly project specific and should be calculated using project-specific information.
Toilet and Urinal Flushing Demand Calculations
The following guidelines should be followed for computing harvested water demand from toilet and urinal flushing:
• Demand calculations for toilet and urinal flushing demand should be based on the average rate for the lowest two weeks of demand for a typical year.
• Demand calculations should consider changes in occupancy over weekends, around holidays, and changes in attendance/enrollment over school vacation periods when determining the critical two week period.
Prepared for BASMAA Final Report
24 1 May 2011
• For facilities with generally high demand but periodic shut downs (e.g., for vacations, seasonal variations in processes for industrial uses, equipment maintenance, or other reasons), a project specific analysis should be conducted to determine whether performance can be maintained during shut downs. Such an analysis should consider the statistical distributions of precipitation and demand.
Table 5 provides estimated toilet and urinal flushing demand per resident or employee for a variety of land uses. The per capita use per day is based on daily employee or resident usage. For non-residential types of development, the “visitor factor” and “student factor” (for schools) should be multiplied by the employee use to account for toilet and urinal usage for non-employees using facilities.
Table 5: Toilet and Urinal Water Usage per Resident or Employee
Footnotes: 1 Based on American Waterworks Association Research Foundation, 1999. Residential End Uses of Water. Denver, CO:
AWWARF. 2 Based on a use of 3.45 gallons per flush and the average number of per employee flushes per subsector, Table D-1 for MWD
(Pacific Institute, 2003) . 3 Based on a use of 1.6 gallons per flush, Table D-4 and average number of per employee flushes per subsector, Appendix D
(Pacific Institute, 2003). 4 This factor is multiplied by the per capita demand for toilet and urinal flushing to obtain a total daily use that accounts for
visitors. This multiplier is based on the proportion of annual use allocated to visitors and others per employee for each land use type (the schools visitor factor assumes about 5 students per employee) (Table D-1 and D-4, Pacific Institute, 2003).
5 Water Efficient Total Use is extrapolated from Pacific Institute results based on 2010 California Green Building Code requirements for new development of 1.6 gallons per toilet flush and 1.0 gallons per urinal flush.
Prepared for BASMAA Final Report
25 1 May 2011
General Requirements for Irrigation Demand Calculations
The following guidelines should be followed for computing harvested water demand from landscape:
• Irrigation rates should be based on the irrigation demand exerted by the types of landscaping that are proposed for the project, with consideration for water conservation requirements.
• Irrigation rates should be estimated to reflect the average rates over a typical wet-season week, including one significant storm event. As such, it should be reflected in these calculations that ET demand would be entirely off-set by precipitation during and for some time after the end of rainfall.
• Unless land application of stormwater is approved for the project, irrigation rates must not exceed agronomic demand. Agronomic demand refers to the rate at which plants use water.
The following sections describe methods that may be used to calculate harvested water irrigation demand. While these methods are simplified, they provide a reasonable estimate of potential harvested water demand that is appropriate for feasibility analysis and project planning. These methods may be replaced by a more rigorous project-specific analysis that meets the intent of the criteria above.
Model Water Efficient Landscape Ordinance Method
This irrigation demand method is based on the Model Water Efficient Landscape Ordinance, AB 1881 (the Ordinance), which was approved in September 2009. The Department of Water Resources published the Ordinance with guidance on how to calculate appropriate landscape irrigation demand. The method recommended in the Ordinance includes a formula for calculating the Estimated Total Water Use (ETWU), based on the reference evaporation, landscape coefficient, and irrigation efficiency.
For the purpose of calculating harvested water irrigation demand applicable to the sizing of harvest and use systems, the ETWU has been modified to reflect typical wet season irrigation demand. This method assumes that the wet season is defined for this purpose as November through April. This method further assumes that no irrigation water will be applied during days with precipitation totals greater than 0.1 inches or within the 2 days following such an event.
Prepared for BASMAA Final Report
26 1 May 2011
Based on available rainfall data, the percent of non-irrigable days during the wet season recorded at Bay Area rain gauges ranges from 32 percent to 39 percent. For the purposes of demand calculations, 40 percent of days are assumed to have no irrigation demand.
The following equation is used to calculate the Modified ETWU:
Modified ETWU = estimated daily total water usage during wet season
EToWet = Average Reference Evapotranspiration from November through April (inches per month)
PF = Plant Factor from WUCOLs
HA = Hydrozone Area [high, medium, and low water use areas] (sq-ft)
IE = Irrigation Efficiency (assume 90 percent for demand calculations)
SLA = Special Landscape Area (sq-ft) (defined as an area of the landscape dedicated solely to edible plants, areas irrigated with recycled water, water features using recycled water and areas dedicated to active play such as parks, sports fields, golf courses, and where turf provides a playing surface
CDemand = Unit conversion and irrigable days coefficient, 0.0125
In this equation, the coefficient (CDemand) accounts for unit conversions and shut down of irrigation during and for the two days following a significant precipitation event:
CDemand = (1 mo/30 days)×(1 ft/12 in)×(7.48 gal/cu-ft)×(approximately 6 out of 10 days with irrigation demand from November through April)
When using this method, the example tables contained within the Ordinance may be useful to determine the irrigation use for a project site, with the appropriate modifications to reflect the Modified ETWU calculations. These worksheets allow the user to area-weight the inputs for irrigation.
Prepared for BASMAA Final Report
27 1 May 2011
Reference ET Data
Evapotranspiration data contained in the Model Water Efficient Landscape Ordinance, derived from CIMIS, for the MRP area is provided in Appendix F.
Plant Factor
The Water Use Classifications of Landscape Species (WUCOLS, University of California and Department of Water Resources, 2000) should be used to determine the plant factor that is applicable to each landscape irrigation zone. The plant factor estimates the amount of water needed by plants. The Ordinance classifies plant factors as following:
• Low water use plants: 0 to 0.3
• Moderate water use plants: 0.4 to 0.6
• High water use plants: 0.7 to 1.0
Recommended plant factors are listed in Table 6.
The plant factor is derived from the “species factors” listed in WUCOLS, which correlate to plant water needs derived from available data. At the time of the 2000 WUCOLs, 1,800 plant species had been evaluated for relative water needs. Specific species factors for these plant species are available in WUCOLs.
Table 6: Planning Level Recommendations for Plant Factor (PF)
Using the method and inputs described above, daily average wet season demands were developed for one acre of irrigated area based on location and landscape coefficient (See Table 7). These demand estimates are appropriate to be used to calculate the drawdown of harvest and use systems for the purpose of LID measure sizing calculations.
Prepared for BASMAA Final Report
28 1 May 2011
Table 7: Modified ETWU Daily Average Irrigation Demand by Location and Landscape Coefficient
Location ETWU (gal/acre/day) Conservation Turf
Alameda County
Fremont 520 1,040 Livermore 440 880 Oakland 420 850 Oakland Foothills 400 800 Pleasanton 430 850 Union City 470 930 Contra Costa County
Brentwood 420 850 Concord 380 770 Martinez 380 760 Moraga 460 910 Pittsburg 400 800 Walnut Creek 430 850 San Mateo County
Half Moon Bay 380 770 Redwood City 450 900 Woodside 580 1,160 Santa Clara County
Gilroy 460 920 Los Gatos 450 900 Morgan Hill 500 1,000 Palo Alto 440 890 San Jose 470 940 Solano County
Benicia 390 780 Fairfield 420 840 Suisun Valley 420 840 San Francisco County San Francisco 360 720
Prepared for BASMAA Final Report
29 1 May 2011
Calculating Other Harvested Demands
Calculations of other harvested water demands should be conducted based on the knowledge of land uses, industrial processes, and other factors that are project-specific. Demand should be calculated based on the following guidelines:
• Demand calculations should represent actual demand that is anticipated from November through April.
• Sources of demand should only be included if they are reliably and consistently present during the wet season.
• Where demands are substantial but irregular, a more detailed analysis should be conducted based on a statistical analysis of anticipated demand and precipitation patterns.
3.3.2 Planning Level Harvest and Use Feasibility Thresholds
This section describes the technical analysis and assumptions that were used to develop planning level feasibility thresholds for harvest and use systems. The intent of these thresholds is to identify projects with low potential for harvest and use and provide a means for applicants to demonstrate infeasibility of harvest and use, where clearly infeasible, without a conducting a detailed project specific analysis. These thresholds are intended to take the place of a rigorous feasibility analysis for the projects to which they apply.
Demand Thresholds for Rainwater Harvesting
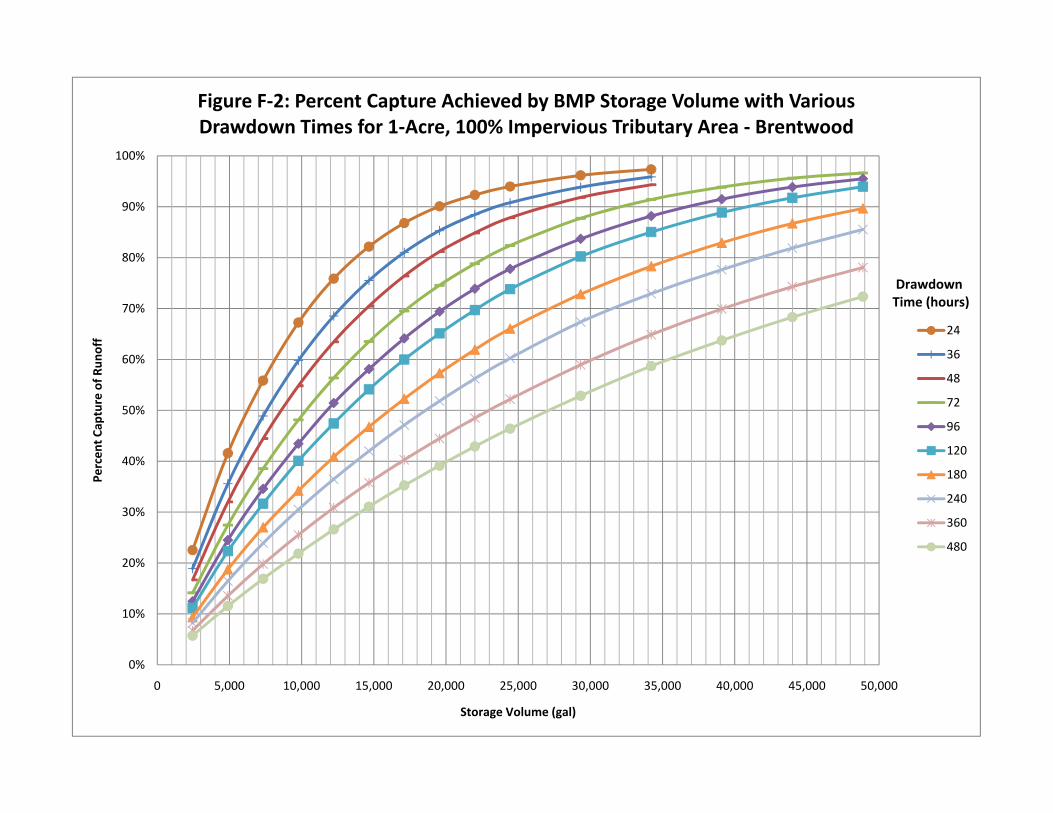
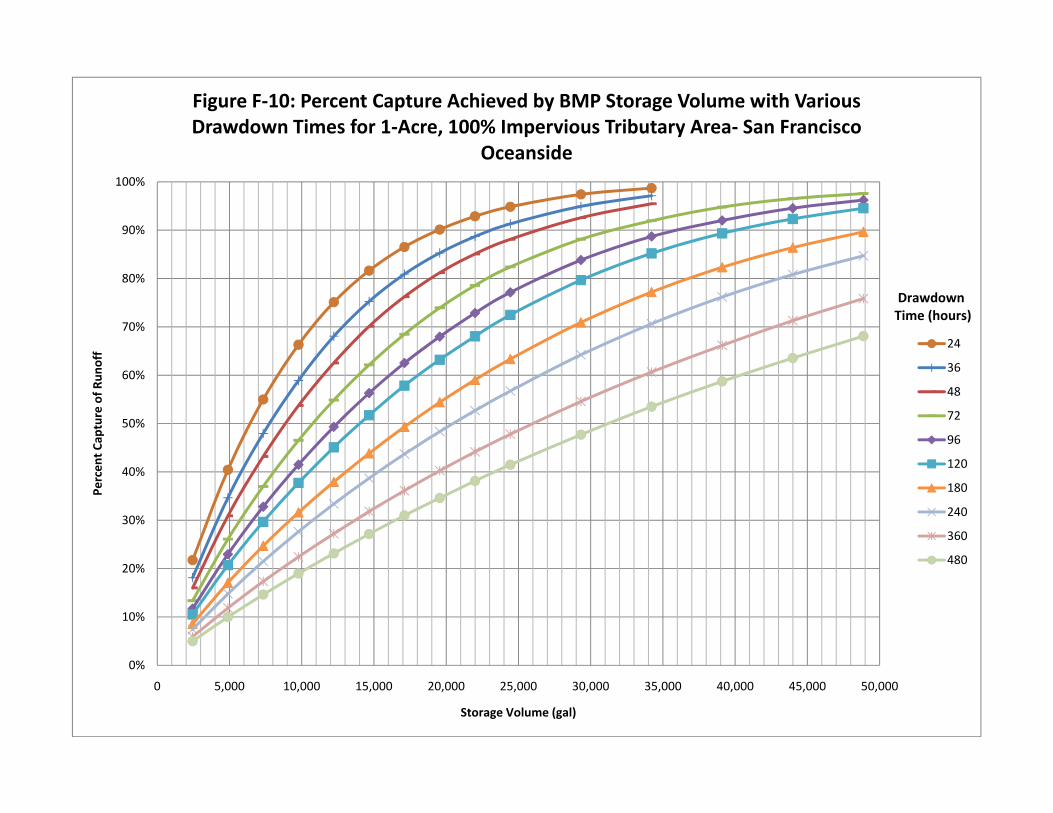
The figures in Appendix F display percent capture of long-term average annual stormwater runoff based on drawdown time and cistern volume (gallons), up to a 50,000 gallon cistern size. In Southern California design manuals, the infeasibility criteria drawdown time is 48 hours. However, a longer drawdown time may be desired to reduce the necessary daily demand to encourage feasibility. Also, a longer drawdown time allows for greater efficiency of the harvesting system in terms of potable water use requirements; if the cistern stores water for five days instead of two, there is less reliance on the back-up water supply.
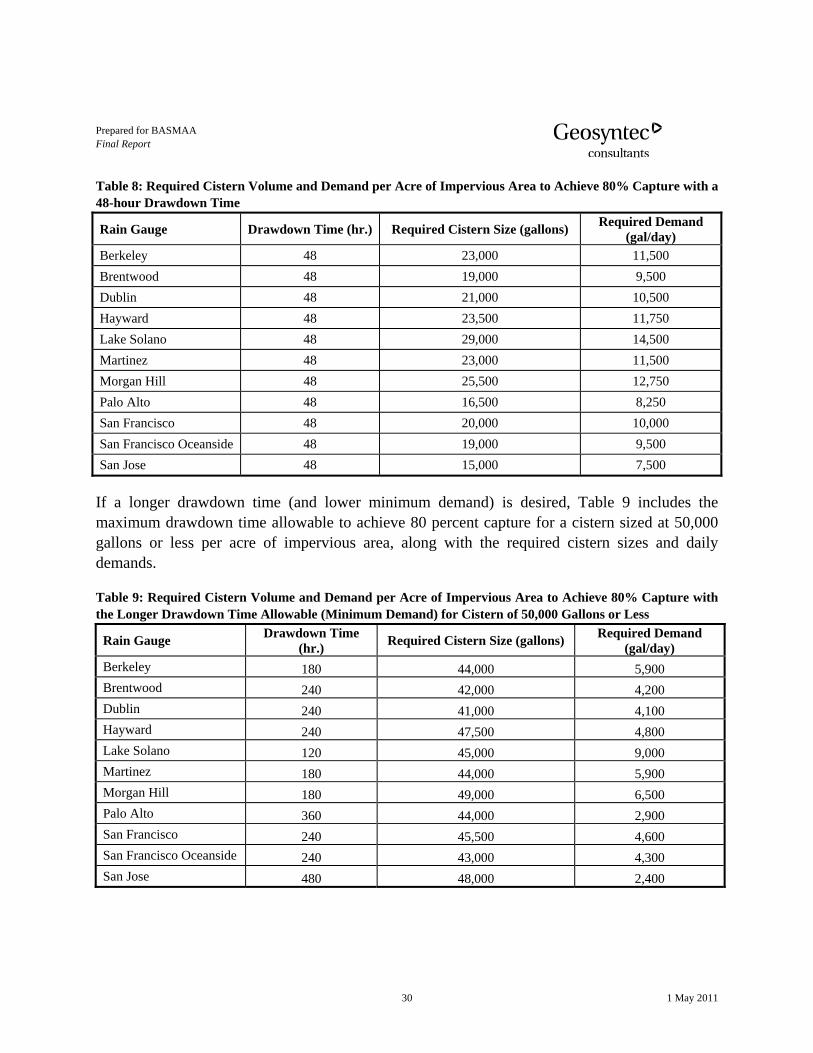
If a 48-hour drawdown is desired, the cistern volumes and demands per one-acre impervious tributary area required to achieve 80 percent capture by rainfall gauge are included in Table 8.
Prepared for BASMAA Final Report
30 1 May 2011
Table 8: Required Cistern Volume and Demand per Acre of Impervious Area to Achieve 80% Capture with a 48-hour Drawdown Time
Berkeley 48 23,000 11,500 Brentwood 48 19,000 9,500 Dublin 48 21,000 10,500 Hayward 48 23,500 11,750 Lake Solano 48 29,000 14,500 Martinez 48 23,000 11,500 Morgan Hill 48 25,500 12,750 Palo Alto 48 16,500 8,250 San Francisco 48 20,000 10,000 San Francisco Oceanside 48 19,000 9,500 San Jose 48 15,000 7,500
If a longer drawdown time (and lower minimum demand) is desired, Table 9 includes the maximum drawdown time allowable to achieve 80 percent capture for a cistern sized at 50,000 gallons or less per acre of impervious area, along with the required cistern sizes and daily demands.
Table 9: Required Cistern Volume and Demand per Acre of Impervious Area to Achieve 80% Capture with the Longer Drawdown Time Allowable (Minimum Demand) for Cistern of 50,000 Gallons or Less
(gal/day) Berkeley 180 44,000 5,900 Brentwood 240 42,000 4,200 Dublin 240 41,000 4,100 Hayward 240 47,500 4,800 Lake Solano 120 45,000 9,000 Martinez 180 44,000 5,900 Morgan Hill 180 49,000 6,500 Palo Alto 360 44,000 2,900 San Francisco 240 45,500 4,600 San Francisco Oceanside 240 43,000 4,300 San Jose 480 48,000 2,400
Prepared for BASMAA Final Report
31 1 May 2011
While the required cistern sizes are twice as large as those required for a 48-hour drawdown time, the daily demand required is significantly less.
If another rainwater harvesting and use system size or drawdown time is desired, the nomographs provided in Appendix F can be used to determine the required daily demand to achieve 80 percent capture. Trace vertically up from the x-axis to the 80 percent capture line to determine the appropriate drawdown time needed. The daily demand required can be determined from the following equation:
Demand = (VolumeRWH)/ (DD/ 24)
Where:
Demand = Required daily demand, gallons
VolumeRWH = Desired rainwater harvest and use system volume, gallons
DD = Required drawdown time, hours
Discussion of Sizing Requirements
Quicker metrics for determining whether a project might meet the demand requirements for 80 percent capture include what is called here the ‘Toilet Users to Impervious Area’ (TUTIA) ratio and the ‘Effective Irrigated Area to Impervious Area’ (EIATIA) ratio. These ratios determine the thresholds of toilet users (for indoor demands) or irrigated area (for outdoor demands) per impervious acre tributary to a rainwater harvesting system based on the demand requirements stated above.
TUTIA Ratios
TUTIA ratios for land uses included in Table 5 above are included in Table 10 below for both current water usage (3.45 gallons per toilet flush and 1.6 gallons per urinal flush) and California Green Building Code conservation water usage (1.6 gallons per toilet flush and 1.0 gallons per urinal flush).
Prepared for BASMAA Final Report
32 1 May 2011
Table 10: TUTIA Ratios for Typical Land Uses for Rain Gauges Analyzed
Rain Gauge Required Demand1
(gal/day)
Toilet Users per Impervious Acre (TUTIA)2
Residential Office/Retail Schools Industrial
Current CGBC3 Current CGBC Current CGBC Current CGBC
Assumed Per Capita Use per Day (gal/day) 4 18 8.6 14 6.9 66 34 11 5.4
Berkeley 5,900 320 690 420 860 90 170 540 1,090 Brentwood 4,200 230 490 300 610 60 120 380 780 Dublin 4,100 220 480 290 590 60 120 370 760 Hayward 4,800 260 560 340 700 70 140 440 890 Lake Solano 9,000 490 1050 640 1,300 140 270 820 1,670 Martinez 5,900 320 690 420 860 90 170 540 1090 Morgan Hill 6,500 350 760 460 940 100 190 590 1,200 Palo Alto 2,900 160 340 210 420 40 90 260 540 San Francisco 4,600 250 530 330 670 70 140 420 850 San Francisco Oceanside 4,300 230 500 310 620 70 130 390 800 San Jose 2,400 130 280 170 350 40 70 220 440 Footnotes: 1 For a 50,000 or less gallon tank to achieve 80 percent capture within maximum allowable drawdown time (Table 9). 2 The TUTIA ratios are based on employee toilet users per impervious acre. These ratios were calculated using the daily toilet and urinal water usage from Table 5, which are per employee and encompass usage by visitors and students within the daily demand (assumes about 5 students per school employee). 3 CGBC = California Green Building Code Requirements water usage accounting for water conservation. 4 From Table 5, Toilet and Urinal Water Usage per Resident or Employee.
EIATA Ratios
Comparing the required daily demands for rainwater harvesting systems for both 48-hour drawdown times and maximum drawdown times to daily demands per irrigated acre, it becomes evident that the required demands are many times larger than irrigation demands. This can be translated into an ‘Effective Irrigated Area to Impervious Area’ (EIATIA) ratio by dividing the required rainwater harvesting system demand by the daily irrigation demand (shown in Table 7). Since both demands are calculated on a per acre basis, the EIATIA ratio represents the number of acres of irrigated area needed per acre of impervious surface to meet the demand needed for 80 percent capture. EIATIA ratios were analyzed for the rain gauges used for analysis and the evapotranspiration data listed in Table F-1. These ratios, as well as the required total imperviousness (assuming a project includes the impervious tributary area and the irrigated area only) are included in Table 11.
San Jose 2,400 San Jose 470 5.1 16% 940 2.6 28% Footnotes: 1 To achieve 80 percent capture within maximum allowable drawdown time (Table 9). 2 Closest location selected, from Table F-1. 3 From Table 7.
3.3.3 Summary
In summary, TUTIA ratios indicate that dense land uses would be required to provide the needed demand to make rainwater harvesting feasible in the MRP area. A project must have sufficiently high toilet flushing uses to achieve 80 percent capture within the maximum allowable drawdown time (see Table 9 for maximum allowable drawdown time for a 50,000 gallon tank or less). For instance, approximately 280 to 1,050 residential toilet users (roughly 90 – 130 dwelling units per acre5) are required, depending on location, per impervious acre to meet the demand needed for 80 percent capture with the maximum allowable drawdown time and CA Green Building Code flush requirements. Meeting the demand requirements would entail a very dense housing
5 Assuming three residents per dwelling unit.
Prepared for BASMAA Final Report
34 1 May 2011
development. Similarly, office/retail, industrial, and school land uses6 require high ratios of employee toilet users.
The analysis also reveals that the feasibility of rainwater harvesting to achieve C.3 compliance where irrigation is the principal demand is unlikely. The required effective irrigable area to impervious area ratios are high, ranging from 2.6 to 21.4, resulting in project percent imperviousness that are under 20 percent for most parts of the Bay Area. New and redevelopment projects are unlikely to have the large amounts of irrigable area to meet the required demand, aside from some park or golf course projects.
3.4 Step 3. Biotreatment
If the project proponent determines in Step 2 that infiltration measures and devices and rainwater harvesting are infeasible for the project or DMA, then biotreatment measures may be implemented in compliance with Provision C.3.c.
Hundreds of bioretention facilities are currently in operation in the Bay Area. Facilities of similar design, using current criteria, can meet the “biotreatment” requirements in the MRP. However, in addition to biotreatment, bioretention facilities as currently designed also achieve significant infiltration and evapotranspiration. Over the past nine years, Bay Area permittees have adapted, implemented, and continuously improved these criteria to optimize infiltration performance. Among these improvements are to locate underdrains near the top of the gravel storage layer for facilities where underlying soils provide sufficient drainage that the facility will not hold stagnant water for long periods. Permittees are also following studies elsewhere, and conducting their own in situ studies, to better characterize the amount of infiltration and evapotranspiration achieved by bioretention facilities. The addition of empirical data will help further our understanding of the feasibility of achieving the targeted level of infiltration and evapotranspiration.
Additional information on design of bioretention facilities is provided in the guidance manuals developed by the countywide stormwater programs.
While infiltration and harvesting measures are designed to reduce the volume of stormwater runoff draining to the storm drain, many biotreatment measures also provide some volume reduction benefits via infiltration or evapotranspiration. Incidental infiltration in biotreatment
6 Note that the TUTIA ratio for schools represents the number of employees at the school; to calculate the total number of employee and student occupants required, the TUTIA ratio would have to be multiplied by 6.
Prepared for BASMAA Final Report
35 1 May 2011
measures was discussed in a publication by Strecker, Quigley, Urbonas, and Jones (Strecker et al, 2004). That study observed as much as 40 percent volume reduction through incidental infiltration. A recent summary of the studies in the ASCE BMP Database found that bioretention with an underdrain reduced influent volume by 61 percent on average (Geosyntec, 2011).
3.5 Feasibility/Infeasibility Criteria Summary
The sequential process for establishing the feasibility/infeasibility of harvest and use, infiltration and evapotranspiration begins with assessing site design measures and determining the amount of Self-Treating Areas and Self-Retaining Areas on the project site. If a project consists entirely of properly-sized Self-Retaining Areas, Areas Draining to Self-Retaining Areas, and/or Self-Treating Areas, then it complies with site design and treatment requirements of the MRP. Criteria for sizing Self-Retaining Areas, Areas Draining to Self-Retaining Areas, and/or Self-Treating Areas are presented in Section 3.1.
If there are remaining impervious areas with stormwater runoff to be treated, then the project proponent must assess the feasibility to treat the C.3.d. amount of stormwater runoff via infiltration measures or devices and/or rainwater harvesting measures. If it is infeasible to fully treat the C.3.d stormwater runoff amount using either of the two measures, then a project proponent implements biotreatment. Infiltration measures and devices that are sized with a reasonable design standard will feasibly achieve the 80 percent capture objective for sites with soils having hydraulic conductivities above 1.6 inches per hour in all MRP areas except in the vicinity of the Dublin and Hayward gages. Reasonably sized infiltration measures and devices cannot achieve the 80 percent capture objective for all other locations within the MRP area. Rainwater harvesting would require dense land uses to provide the needed demand to achieve 80 percent capture with the maximum allowable drawdown time and CA Green Building Code flush requirements. The use of rainwater harvesting to achieve C.3 compliance where irrigation is the principal demand is infeasible, aside from some park or golf course projects.
Biotreatment measures as currently designed (bioretention) locate the underdrain near the top of the gravel storage layer. This type of facility will achieve significant infiltration and evapotranspiration (as predicted in the performance evaluation in Appendix E) where site conditions allow for an unlined facility. Studies being conducted in the Bay Area and elsewhere will better characterize the amount of infiltration and evapotranspiration achieved by bioretention facilities.
Prepared for BASMAA Final Report
36 1 May 2011
4. IMPLEMENTATION AND REPORTING
The criteria and procedures recommended in this Report will be incorporated into the Permittees’ local and/or countywide guidance documents for compliance with Provision C.3. requirements for new development and redevelopment projects. Beginning December 1, 2011, when the LID site design, source control and treatment requirements in Provision C.3.c take effect, and throughout the remaining term of the MRP, Permittees will require applicants to apply the feasibility/infeasibility criteria and procedures to Regulated Projects as part of the development of stormwater quality control plans for those projects.
MRP Provisions C.3.c.i.(2)(b)(v) and C.3.c.iii.(2) require the Permittees to prepare a status report on their experience with the application of the feasibility/infeasibility criteria and procedures for submittal to the Water Board by December 1, 2013. The status report must contain the following information:
• Discussion of the most common feasibility and infeasibility criteria employed since implementation of Provision C.3.c requirements, including site specific examples;
• Discussion of barriers, including institutional and technical site specific constraints, to implementation of harvesting and use, infiltration or evapotranspiration, and proposed strategies for removing these identified barriers;
• If applicable, discussion of proposed changes to feasibility and infeasibility criteria and rationale for the changes; and
• Guidance for Permittees to make consistent and appropriate determination of the feasibility of harvesting and use, infiltration, or evapotranspiration for each Regulated Project.
In addition to the data tracked and reported annually by the Permittees for approved development projects per C.3.b.v., Permittees will also need to track the feasibility/infeasibility criteria employed and reasons for determinations of infeasibility on Regulated Projects, beginning December 1, 2011, in order to provide the data for preparation of the status report. Methodologies for tracking and reporting these data will be developed in coordination with the BASMAA Development Committee.
Prepared for BASMAA Final Report
37 1 May 2011
5. REFERENCES
Alameda Countywide Clean Water Program, 2010. C.3 Stormwater Technical Guidance, Version 2.1, October 19, 2010.
Allen P. Davis Field Performance of Bioretention: Hydrology Impacts. Journal of Hydrologic Engineering. 2008.
ASCE/EPA (American Society of Civil Engineers Urban Water Resources Research Council and United States Environmental Protection Agency), 2003, International Stormwater Best Management Practices Database.
ASHRAE. 2009. Standard 189.1-2009, Standard for the Design of High-Performance, Green Buildings, Except Low-Rise Residential Buildings.
Bay-Friendly Landscape Guidelines. 2010. Sustainable Practices for the Landscape Professional. Website at www.stopwaste.org
Belinda E. Hatt, Tim D. Fletcher, Ana Deletic. 2009. Hydrologic and pollutant removal performance of stormwater biofiltration systems at the field scale. Journal of Hydrology 365 (2009) 310–321
Bryan Berkompas, Kurt W. Marx, Heidi M. Wachter, Doug Beyerlein, and Bob Spencer. 2008. A Study of Green Roof Hydrologic Performance in the Cascadia Region, ASCE Conf. Proc. 333, 8 (2008), DOI:10.1061/41009(333)8
Burian, S.J. and D. Jones, 2010. National Assessment of Rainwater Harvesting as a Stormwater Best Management Practice: Challenges, Needs, and Recommendations. Proceedings of the 2010 International Low Impact Development Conference, April 2010.
California Department of Food and Agriculture. 2010. Encycloweedia: Program Details. Website at encycloweedia.
California Irrigation Management information System (CIMIS). 2010. Reference Evapotranspiration (ETo) Maps. Department of Water Resources (DWR), Office of Water Use Efficiency.
California Invasive Plant Council. 2010. Website at www.cal-ipc.org.
Center for Watershed Protection, 2008. Technical Memorandum: The Runoff Reduction Method. Developed for Extreme measure Makeover and Virginia Stormwater Regulations & Handbook Technical Assistance.
City of Philadelphia, 2008. Stormwater Management Guidance Manual, Version 2.0. Prepared by Philadelphia Water Department Office of Watersheds.
City of San Jose, City Council Policy. 2006. Post-Construction Urban Runoff Management. Revised August 15, 2006.
City of Seattle, 2009. Stormwater Manual Vol. 3: Stormwater Flow Control & Water Quality Treatment Technical Requirements Manual. Directors Rules for Seattle Municipal Code Chapters 22.800-22.808.
Contra Costa Clean Water Program, 2010. C.3 Stormwater Guidebook, Fifth Edition, October 20, 2010.
DiGiovanni, K; Gaffin, S and FA Montalto (2009) Green Roof Hydrology: Results from a Small-Scale Lysimeter Setup (Bronx, NY). Proceedings of the 2010 International LID Conference "Redefining Water in the City" April 11-14, 2010 Westin Airport Hotel, San Francisco, CA
Facility for Advancing Water Biofiltration. 2008. Advancing the Design of Stormwater Biofiltration. June 2008
Fairfield-Suisun Urban Runoff Management Program, 2006. Storm Water Requirement for Development Projects, July 20, 2006.
Federal Energy Management Program (FEMP). 2004. Federal Technology Alert: Green Roofs. September 2004.
Geosyntec Consultants and Wright Water Engineers, Inc., 2011. Technical Summary: Volume Reduction. January, 2011.
H. Yang, D. C. Florence, E. L. McCoy, W. A. Dick and P. S. Grewal. 2009. Design and hydraulic characteristics of a field-scale. Water Science & Technology (59.9)
Houng Li; Lucas J. Sharkey; William F. Hunt; and Allen P. Davis. 2009. Mitigation of Impervious Surface Hydrology Using Bioretention in North Carolina and Maryland. Journal of Hydrologic Engineering. 2009 (407).
Hutchinson, D., Abrams, P., Retzlaff, R., & Liptan, T. (2003). Stormwater Monitoring Two Ecoroofs in Portland, Oregon, USA. City of Portland, Bureau of Environmental Services. Retrieved October 17, 2006 from http://www.portlandonline.com/shared/cfm/image.cfm?id=63098
Jane Clary, Marcus Quigley, Andrew Earles, Marc Leisenring, Eric Strecker, and Jonathan Jones. 2009. Integration of Low Impact Development Studies into the International Stormwater BMP Database. ASCE Conf. Proc. 342, 124 (2009), DOI:10.1061/41036(342)124.
Jensen, M.A., J. Steffen, S.J. Burian, and C. Pomeroy, 2010. Do Rainwater Harvesting Objectives of Water Supply and Stormwater Management Conflict? Proceedings of the 2010 International Low Impact Development Conference, April 2010.
Los Angeles County, 2009a. Low Impact Development Standards. County Code, Title 12 Chapter 12.84.
Los Angeles County, 2009b. County of Los Angeles Low Impact Development Standards Manual. January, 2009.
LARWQCB, 2010. Order R4-2010-0108, NPDES Permit No. CAS004002. Waste Discharge Requirements for Stormwater (Wet Weather) and Non-stormwater (Dry Weather) Discharges from the Municipal Separate Storm Sewer Systems within the Ventura County Watershed Protection District, County of Ventura and Incorporated Cities therein. July 8, 2010.
Michael E. Dietz and John C. Clausen. 2005. A Field Evaluation of Rain Garden Flow and Pollutant Treatment. Water, Air, and Soil Pollution (2005) 167: 123–138
Orange County Department of Public Works, 2010. Orange County Watersheds Drainage Area Master Plan (DAMP), May 2010.
Portland Bureau of Environmental Services. 2006. Stormwater Management Facility Monitoring Report Summary: Sustainable Stormwater Management Program. Obtained 12/2011.
Robert G. Traver. 2010. Experience from Long Term Monitoring of a Bioinfiltration BMP. 2nd National LID Conference.
Sacramento Stormwater Quality Partnership, 2007. Stormwater Quality Design Manual for the Sacramento and South Placer Regions, May 2007.
San Mateo Countywide Water Pollution Prevention Program, 2010. C.3 Stormwater Technical Guidance, Version 2.0, October 20, 2010.
Santa Clara Valley Urban Runoff Pollution Prevention Program, 2004. C.3 Stormwater Guidebook, Updated May 2006.
SARWQCB, 2009. Order No. R8-2009-0030, NPDES No. CAS618030. Waste Discharge Requirements for the County of Orange, Orange County Flood Control District and the Incorporated Cities of Orange County within the Santa Ana Region Areawide Urban Stormwater Runoff Orange County.
SDRWQCB, 2009. Order No. R9-2009-0002, NPDES No. CAS0108740. Waste Discharge Requirements of Runoff from the Municipal Separate Storm Sewer Systems (MS4s) Draining the Watershed of the County of Orange, The Incorporated Cities of Orange County, and the Orange County Flood Control District within the San Diego Region.
Prepared for BASMAA Final Report
40 1 May 2011
Selbig, W.R., and Bannerman, R.T., 2008. A Comparison of Runoff Quantity and Quality from Two Small Basins Undergoing Implementation of Conventional- and Low-Impact- Development (LID) Strategies: Cross Plains, Wisconsin, Water Years 1999–2005. U.S. Geological Survey Scientific Investigations Report 2008–5008, 57 pgs. http://pubs.water.usgs.gov/sir2008-5008
Simmons, M.T., B. Gardiner, S. Windhager and J. Tinsley. 2008. Green roofs are not created equal: the hydrologic and thermal performance of six different extensive green roofs and reflective and non-reflective roofs in a sub-tropical climate. Urban Ecosystems. 11:335-337.
State Water Resources Control Board, 2009. National Pollutant Discharge Elimination System (NPDES) General Permit for Storm Water Discharges Associated with Construction and Land Disturbance Activities, Order No. 2009-0009-DWQ, NPDES No. CAS000002. Adopted on September 2, 2009. Effective on July 1, 2010.
Strecker, E.W., Quigley, M.M., Urbonas, B. and J. Jones., 2004. Analyses of the Expanded EPA/ASCE International BMP Database and Potential Implications for BMP Design, In Proceedings of the World Water and Environmental Resources Congress, Salt Lake City, Utah, American Society of Civil Engineers.
Sussex, J.F., 2010. Implementing Low Impact Development for Sustainable Transportation Infrastructure in King County, Washington. Proceedings of the 2010 International Low Impact Development Conference, April 2010.
USEPA, 2009. Technical Guidance on Implementing the Stormwater Runoff Requirements for Federal Projects under Section 438 or the Energy Independence and Security Act. USEPA Office of Water, December 2009. www.epa.gov/owow/nps/lid/section438
U.S. Dept. of Agriculture. Soil Conservation Service and Forest Service. n.d. Computerized soils and interpretive maps (automating soil survey maps). Alameda County West, Alameda County East, Contra Costa County West, Contra Costa County East, San Mateo County West, San Mateo County East, Santa Clara County West, Santa Clara County East, and Solano County. Obtained December 20, 2010.
USEPA, 2010. Green Infrastructure Case Studies: Municipal Policies for Managing Stormwater with Green Infrastructure. August, 2010. EPA-841-F-10-004.
VA DCR, 2010. Virginia DCR Stormwater Design Specification No. 6: Rainwater Harvesting. Version 1.9, April 26, 2010.
Ventura Countywide Stormwater Quality Management Program, 2010. Technical Guidance Manual for Stormwater Control Measures, November 2010. http://www.vcstormwater.org/technicalguidancemanual.html
W. F. Hunt; A. R. Jarrett; J. T. Smith; and L. J. Sharkey. 2006. Evaluating Bioretention Hydrology and Nutrient Removal at Three Field Sites in North Carolina. Journal of Irrigation and Drainage Engineering. December 2006.
APPENDIX A
Hydrologic Soil Group Classification (HSG) Figures
Tracy
San Mateo
San Jose
Concord
Oakland
Livermore
Discovery Bay
Hydrologic Soil Group Classification (HSG) Alameda County, CA
Figure
A-1P:\GIS\BASMAA_LID\Projects\MRP_Soils_Alameda.mxd, WHL, February 28, 2010
Oakland Office February 2011
8 0 84 Miles
³
LegendMRP AreaCounty BoundaryUrban Areas
Hydrologic Soil GroupABCD
Note: Areas not classified were identified as"urban" in soil survey documentation andwere not assessed in the absence of acccessible soils.
San Rafael--Novato
San Francisco
Concord
Oakland
Antioch
Vallejo
Livermore
Hydrologic Soil Group Classification (HSG) Contra Costa County, CA
Figure
A-2P:\GIS\BASMAA_LID\Projects\MRP_Soils_Contra_Costa.mxd, WHL, February 28, 2010
Oakland Office February 2011
6 0 63 Miles
³
LegendMRP AreaCounty BoundaryUrban Areas
Hydrologic Soil GroupABCD
Note: Areas not classified were identified as"urban" in soil survey documentation andwere not assessed in the absence of acccessible soils.
Oakland
South San Francisco
Half Moon Bay
Hydrologic Soil Group Classification (HSG)San Mateo County, CA
Figure
A-3P:\GIS\BASMAA_LID\Projects\MRP_Soils_San_Mateo.mxd, WHL, February 28, 2011
Oakland Office February 2011
6 0 63 Miles
³
LegendMRP Area
County Boundary
Urban Areas
Hydrologic Soil GroupA
B
C
D
Note: Areas not classified were identified as "urban" in soil survey documentation andwere not assessed in the absence of acccessible soils.
HollisterHollister
Santa Cruz
Hollister
San Jose
Watsonville
Santa Cruz
Gilroy--Morgan Hill
Hollister
AromasWatsonville
Hydrologic Soil Group Classification (HSG) Santa Clara County, CA
Figure
A-4P:\GIS\BASMAA_LID\Projects\MRP_Soils_Santa_Clara.mxd, WHL, February 28, 2011
Oakland Office February 2011
8 0 84 Miles
³
LegendMRP AreaCounty BoundaryUrban Areas
Hydrologic Soil GroupABCD
Note: Areas not classified were identified as"urban" in soil survey documentation andwere not assessed in the absence of acccessible soils.
Concord
Concord
Vallejo
Napa
Fairfield
Antioch
San Francisco--Oakland
Vacaville
Fairfield Southwest
Fairfield Southwest
Hydrologic Soil Group Classification (HSG)Solano County, CA
Figure
A-5P:\GIS\BASMAA_LID\Projects\MRP_Soils_Solano.mxd, WHL, February 28, 2011
Oakland Office February 2011
4 0 42 Miles
³
LegendMRP AreaCounty BoundaryUrban Areas
Hydrologic Soil GroupABCD
Note: Areas not classified were identified as"urban" in soil survey documentation andwere not assessed in the absence of acccessible soils.
Tracy
San Jose
Oakland
Tracy
Livermore
Discovery Bay
Saturated Hydraulic Conductivity (Ksat) and Precipitation Polygons
Alameda County, CA
Figure
A-6P:\GIS\BASMAA_LID\Projects\MRP_Soils_Alameda.mxd, WHL, February 28, 2011
Oakland Office February 2011
8 0 84 Miles
³
Note: Saturated hydraulic conductivities (Ksat) presented are NRCS "representative" values in the absence of complete coverage of "low" value.
This section provides the results of the literature review and discussion of documented case studies where retention-based BMPs have been demonstrated to be feasible.
1.1 Self-Retaining and Self-Treating Areas
1.1.1 Self-Retaining and Self-Treating Areas
Self-Retaining (S-R) and Self-Treating (S-T) Areas, also known as hydrologic source controls (HSCs), are a class of ET BMPs designed to be integrated into the Project site. These BMPs retain or treat the stormwater runoff produced from the S-R or S-T area and reduce the volume (and potentially the rate) of stormwater discharge to the downstream system. S-R and S-T areas are differentiated from other LID BMPs by a high level of integration into site design and less strict engineering design criteria.
Self-Retaining (S-R) areas are also called “zero discharge” areas and are intended to retain or infiltrate the portion of the stormwater runoff that requires treatment. S-R Areas are designed to retain the first one inch of rainfall without producing runoff. Additionally, the bypassed volume must flow off-site without flowing onto pavement. S-R Areas are generally concave landscaped areas and are designed to store water via berms or grading.
Self-Treating (S-T) Areas are landscaped or turf areas that are appropriately amended and vegetated to provide pollutant removal before draining off-site or to the storm drain system. Examples include: upslope undeveloped areas that are designed to drain around a development, and grassed slopes that drain off-site to an existing storm drain system. In addition to these examples, green roofs are considered to be a type of S-T area. Green roofs are roofing systems that include a soil/vegetative cover over a waterproof membrane, and are designed to filter, absorb and evapotranspire precipitation. There are two types of green roof systems: extensive, which is a light weight system, and intensive, which is a heavier system that allows for larger plants but requires additional maintenance.
Street trees are another type of S-T BMP, and are designed to intercept and treat rainfall. Street trees provide several aesthetic and stormwater benefits, including peak flow control, increased infiltration and evapotranspiration, and runoff temperature reduction. As precipitation is intercepted by the canopy, processes including evapotranspiration and infiltration reduce the treatment volume that drains to downstream BMPs. Street trees provide additional benefit with shading, which reduces the “heat island effect” as well as the temperature of adjacent impervious surfaces over which stormwater flows, thus decreasing the heat transferred to the downstream water body. Tree roots also strengthen the soil structure and provide infiltrative pathways, simultaneously reducing erosion potential and enhancing infiltration.
B-2
1.1.2 Literature Review – S-R and S-T Areas
The following sections summarize the S-R and S-T Area feasibility criteria found in the literature review.
1.1.2.1 Orange County
New development and redevelopment projects within Orange County are subject to the requirements of one of two municipal separate storm sewer system (MS4) permits depending on location: the Santa Ana Region MS4 permit (Order No. R8-2009-0030) or the San Diego Region MS4 Permit (Order No. R9-2009-0002). These permits require that LID retention BMPs be implemented to the maximum extent feasible to control runoff volumes on projects subject to the new development and redevelopment criteria. Biotreatment BMPs may only be considered if infiltration, harvest and use, and evapotranspiration BMPs cannot feasibly be implemented.
The Orange County guidance states that, in general, S-R and S-T Areas would not be expected to cause a risk that would exclude its use from any project. In some cases, S-R and S-T Areas may have unintended consequences such as decreasing the project density or resulting in greater dry season irrigation demand. S-R and S-T Areas may always be considered but should be selected with consideration for maintaining target project density. Low water use landscaping requirements should be granted higher priority in BMP selection than promoting stormwater evapotranspiration via S-R and S-T Areas.
Green roofs may be considered wherever they are consistent with applicable codes and ordinances. These BMPs are encouraged but not required to be considered in assessing feasibility. Green roofs are considered to be beyond the MEP for technical, economical, and societal reasons:
• The increased use of irrigation water and plant life requiring water is inapposite to the direction of state legislation (AB1881) mandating landscaping water efficiency.
• Long term data regarding maintenance of a green roof, in a Mediterranean climate prone to high winds and fire hazard is not easily available.
• The practical limitations of requiring individual homeowners and small business owners to irrigate and maintain a green roof are untested.
• The majority of current building codes and the fire code do not specifically address green roof construction, and it is unknown how this requirement may conflict with other building code provisions or upcoming mandatory solar requirements.
• Studies of cost-benefit and cost-effectiveness of green roofs have often not considered costs of additional structural requirements, which may comprise a large portion of green roof costs.
B-3
• Although green roofs have been encouraged in several locations across the country, there are no known locations in the US where implementation of green roofs has been required in an implemented permit in order to meet the MEP standard.
Where green roofs are selected as an option, consideration should be given for overall water demands which may increase as a result of an increase in the amount of area potentially requiring irrigation during the dry periods. However, for a project with very high density, green roofs could provide almost complete treatment for the water quality design storm (sidewalks and minor surface areas would also need treatment) and, for some projects, could provide a cost-saving when other benefits (heating and cooling reductions, etc.) are factored in.
1.1.2.2 Ventura County
The Ventura County MS4 Permit (Order No. R4-2010-0108) requires that retention BMPs be used onsite to reduce the “Effective Impervious Area” or EIA to five percent or less of the total project area, unless infeasible. Impervious surfaces are rendered “ineffective” if the design storm volume is fully retained onsite using infiltration, reuse, and/or evapotranspiration retention BMPs. Projects that demonstrate technical infeasibility are eligible to use biofiltration BMPs to achieve the EIA performance standard.
Technical infeasibility criteria for evapotranspiration facilities listed in the draft TGM including the following:
1. Green roofs are not required to be considered for all project locations and types; this evapotranspiration BMP is considered optional subject to the approval of the permitting authority.
1.1.2.3 Virginia Department of Conservation and Recreation
Virginia Department of Conservation and Recreation feasibility factors for green roofs are outlined in Specification No. 5 and include the following (paraphrased from VA DCR, 2010):
1. Roof must have structural capacity to support the additional weight of the plants and planting media as well as the additional water that will be captured by the green roof.
2. Vegetated roofs can be installed on rooftops with slopes up to 25% if baffles, grids, or strips are used to prevent slippage of media. The treatment volume, however, is maximized with flatter slopes.
3. Certain roof materials may leach pollutants through planting media, including treated wood and galvanized metal and may not be appropriate for green roofs.
4. Design must comply with Virginia Uniform Statewide Building Code as well as local planning and zoning authority requirements.
B-4
1.1.2.4 Federal Facilities/EISA
Federal facilities examples included the following infeasibility conditions applicable to S-R and S-T Areas (USEPA, 2009):
• Modifications to an existing building to manage stormwater are not feasible due to structural or plumbing constraints or other factors as identified by the facility owner/operator.
• Retention and/or use of stormwater onsite or discharge of stormwater onsite via infiltration has a significant adverse effect on the site or the down gradient water balance of surface waters, ground waters or receiving watershed ecological processes.
• State and local requirements or permit requirements that prohibit water collection or make it technically infeasible to use certain GI/LID techniques.
• Compliance with the Section 438 requirements would result in the retention and/or use of stormwater on the site such that an adverse water balance impact may occur to the receiving surface water body or ground water.
1.1.3 S-R and S-T Area Case Studies
BASMAA member agencies received a request for project attribute information for green roof projects that had, at a minimum, been approved for implementation, if not constructed. A total of five responses were received identifying green roof projects within the MRP area. Five fully implemented green roof treatment systems from various regions of the Bay Area were selected to be studied at greater depth. An overview of these five projects is presented in Table 1 below. Case study summaries are provided in Appendix C.
1.2 Infiltration and Incidental Evapotranspiration BMPs
1.2.1 Infiltration and Treatment Systems
Infiltration refers to the use of the filtration, adsorption, and biological decomposition properties of soils to remove pollutants prior to the intentional routing of runoff to the subsurface for groundwater recharge. Infiltration treatment systems, a type of retention BMP, include infiltration basins, infiltration trenches, bioretention without an underdrain, dry wells, and permeable pavement without an underdrain. Infiltration can provide multiple benefits including pollutant removal, hydromodification control, groundwater recharge, and flood control.
Impervious area dispersion, which refers to the practice of routing runoff from impervious areas, such as rooftops, walkways, and patios, onto the surface of adjacent pervious areas, is also considered to provide infiltrative reduction of runoff. Runoff is dispersed uniformly via splash block or dispersion trench and soaks into the ground as it moves slowly across the surface of the pervious area.
B-5
Conditions that can limit the use of infiltration include soil properties, geotechnical concerns, and potential adverse impacts on groundwater quality. Technical infeasibility for infiltration treatment systems may result from the following conditions which are listed in the MRP:
1. Locations where seasonal high groundwater would be within 10 feet of the base of the LID treatment measure.
2. Locations within 100 feet of a groundwater well used for drinking water.
3. Development sites where pollutant mobilization in the soil or groundwater is a documented concern.
4. Locations with potential geotechnical hazards.
5. Smart growth and infill or redevelopment sites where the density and/or nature of the project would create significant difficulty for compliance with the onsite volume retention requirement.
6. Locations with tight clay soils that significantly limit the infiltration of stormwater.
1.2.2 Literature Review – Infiltration BMPs
LID and retention BMP requirements for new development/redevelopment projects have been included in recent stormwater permits in Southern California and nationally. The following sections summarize a few of these permit requirements and the infiltration feasibility criteria that have been developed to implement the requirements.
1.2.2.1 Orange County
Preliminary implementation guidance is provided in a draft Model Water Quality Management Plan (WQMP) and Technical Guidance Document (TGD)1. The draft TGD introduces a phased feasibility analysis, which, in Level I, determines if retention BMPs “shall”, “may”, or “shall not” be used, and, in Level II, demonstrates that retention has been implemented to the maximum extent practicable (MEP) (Orange County Department of Public Works, 2010).
The Level I screening process consists of a series of questions which aim at determining stormwater retention suitability and effectiveness, in an effort to establish the best retention BMP
1 The Orange County Stormwater Program in north Orange County is updating its Model Water Quality Management Plan (WQMP) in response to permit requirements from the Santa Ana Regional Water Quality Control Board. The permit requires the incorporation of low impact development and hydromodification requirements in new development and significant redevelopment projects and development of a companion Technical Guidance Document. A Draft Model WQMP (available here) and the companion draft Technical Guidance Document (available here) were submitted to the Santa Ana Regional Water Quality Control Board on May 24, 2010. Final documents are under development and must be submitted to the Regional Water Board before May 22, 2011.
B-6
type for a project. The process is applied to a project using a Level I screening worksheet. After retention BMPs that must be used and/or shall be considered for a project have been evaluated, the user applies the Level II screening process to those BMPs.
The Level II screening process consists of a series of worksheets which aim at helping the user ‘maximize’ the volume retained by retention BMPs. This is performed by analyzing whether TGD criteria have been considered and applied to the project stormwater management design. These include application of hydrologic source controls2, use of specified high priority infiltration BMPs, and other criteria.
Level I infiltration criteria are listed below; a single ‘yes’ answer amongst the questions below indicates that infiltration shall not be used and shall not be considered further in evaluating feasibility:
• Would stormwater infiltration result in significant risks to drinking water quality and groundwater quality that cannot be reasonably and technically mitigated? Factors that may pose an unmitigatable risk to groundwater quality include:
o Seasonally high groundwater is less than 10 feet below the designed bottom of the infiltration facility for aquifers managed for water quality or with significant connectivity to aquifers managed for groundwater quality.
o Seasonally high groundwater is less than 5 feet below the designed bottom of the infiltration facility for aquifers not managed for groundwater quality and without significant connectivity to aquifers managed for groundwater quality.
o Horizontal distance to a water supply well is less than 100 feet.
o Infiltration of stormwater from project land uses would result in significant risks to drinking water quality and groundwater quality that cannot be reasonably and technically mitigated through methods such isolation of sources and/or pre-treatment of runoff prior to infiltration.
• For brownfield sites or adjacent sites, would stormwater infiltration result in a significant risk of mobilizing or moving contamination that cannot be reasonably and technically avoided, as documented by a site-specific or available watershed study with sufficient resolution to positively identify areas where stormwater infiltration should not be conducted? The documenting study shall have sufficient resolution to positively identify areas where stormwater infiltration should be restricted.
• Where a groundwater pollutant plume (man-made or natural) is under the site or in close proximity, would stormwater infiltration result in a significant risk of causing or
2 Hydrologic source controls (HSCs) are a class of LID BMPs integrated with site design that retain stormwater runoff and reduce the volume (and potentially the rate) of stormwater discharge to the downstream system. HSCs are differentiated from retention and biotreatment classes of LID BMPs by their higher level of integration with a site and by less strict engineering design criteria. An example includes routing roof runoff into adjacent landscaped areas.
B-7
contributing to plume movement that cannot be reasonably and technically avoided, as documented by a site-specific study or available watershed study? The documenting study shall have sufficient resolution to positively identify areas where stormwater infiltration should be restricted.
• Would stormwater infiltration result in significantly increased risks of geotechnical hazards such as liquefaction or landslides that cannot be reasonably and technically mitigated as documented by a geotechnical professional or available watershed study? The documenting study shall have sufficient resolution to positively identify areas where stormwater infiltration should be restricted.
• Would infiltration of runoff violate downstream water rights? While it is not anticipated that infiltration of runoff would violate water rights in Orange County, water law in California is complex, and the TGD does not exclude the possibility that a rightful water rights claim could restrict infiltration of stormwater. The South County Permit contemplates the potential for stormwater management activities to violate water rights at F.3.d.(6)(d).
Infiltration is not required to be considered (but may be considered as an option) if any of the following “effectiveness” conditions are met:
• Project is located in HSG D soils per regional maps, the project meets criteria to use regional maps for infiltration screening per the TGD, and the site geotechnical investigation, if otherwise required, identifies presence of soil characteristics which support categorization as D soils. Measured infiltration rate after accounting for soil amendments is < 0.3 inches per hour in the vicinity of proposed BMPs Infiltration should be measured as described in the TGD, which includes protocol that account for the effect of soil amendments. Soil amendments would not be expected to increase the effective infiltration rate of a soil if the limiting horizon for infiltration lies below the amended zone (in this case, it would increase storage, but not infiltration rate). Soil amendments would be expected to effectively increase infiltration rates if the limiting horizon for infiltration occurs near the proposed bottom of the infiltration basin and the entire depth of this layer can be amended.
• Reduction of runoff over predeveloped conditions would be partially or fully inconsistent with watershed-scale management strategies and/or would impair the beneficial uses of the receiving water. The allowable level of runoff reduction must be documented in a site-specific study or watershed plan, and it must be demonstrated that infiltration BMPs would exceed the allowable level of runoff reduction.
• Increase in infiltration over predeveloped conditions would be partially or fully inconsistent with watershed-scale management strategies and/or would cause impairments to downstream beneficial uses, such as change of seasonality of ephemeral washes. The level of allowable increase in infiltration must be documented in a site-specific study or watershed plan, and it must be demonstrated that stand-alone infiltration
B-8
BMPs would exceed the allowable level of increase in infiltration or what level could be infiltrated as a partial consideration.
• A RWQCB Executive Officer-approved watershed-based plan has identified a subregional or regional BMP opportunity and demonstrated that this opportunity meets the following criteria:
o The subregional/regional BMP is located such that the project would drain to the BMP prior to discharge to a Waters of the US, or the use of Waters of the US to convey water to the subregional/regional BMP meets the requirements of the TGD, and
o The subregional/regional BMP is sufficiently sized to receive runoff from the project,
o The subregional/regional BMP is sited and designed such that it will provide greater overall benefit than would be achieved by infiltration of stormwater on-site, including combined considerations of pollutant loading, hydrologic loading, groundwater recharge, potable water demand, and Smart Growth goals.
o The subregional/regional BMP will be adequately maintained into perpetuity.
1.2.2.2 Ventura County
Feasibility screening criteria are presented in the draft Ventura County Technical Guidance Manual (TGM) (Ventura Countywide Stormwater Quality Management Program, 2010). Technical infeasibility criteria for infiltration facilities listed in the draft TGM, and include the following:
1. Locations where seasonal high groundwater or mounded groundwater beneath an infiltration BMP is within 5 feet of the bottom of the infiltration BMP.
2. Locations on the project site where soils are mapped with Ventura Hydrology Manual Soil Numbers 1-3 or site-specific analyses show that the soils have an infiltration rate less than 0.5 inches per hour.
3. Locations on the project site within 100 feet of a groundwater well used for drinking water, non-potable wells, drain fields, and springs; locations less than 50 feet away from slopes steeper than 15 percent or an alternative setback established by the geotechnical expert for the project; and locations less than eight feet from building foundations or an alternative setback established by the geotechnical expert for the project.
4. Brownfield development sites or other locations where pollutant mobilization is a documented concern, unless a site-specific analysis determines that infiltration would not be detrimental.
5. Locations with potential geotechnical hazards established by the geotechnical professional for the project.
B-9
6. Projects with high-risk areas such as service/gas stations, truck stops, and heavy industrial sites, unless a site-specific evaluation demonstrates that:
a. Treatment is provided to address pollutants of concern, and/or
b. High risks areas are isolated from stormwater runoff or infiltration areas with little chance of spill migration.
7. Locations where reduction of surface runoff may potentially impair beneficial uses of the receiving water as documented in a site-specific study (e.g., California Environmental Quality Act (CEQA) analysis) or watershed plan.
8. Locations where an increase in infiltration over natural conditions could potentially cause impairments to downstream beneficial uses, such as change of seasonality of ephemeral washes, as confirmed through a site-specific study.
9. BMPs that are not allowable per current federal, state or local codes are considered infeasible.
To address a technical infeasibility site condition listed in the Ventura Permit that is similar to MRP site infeasibility condition #5,3 the draft Ventura TGM includes the following infeasibility criteria:
10. The following project types where the density and/or nature of the project would create significant difficulty for compliance with the requirement to reduce EIA to ≤5%:
a. Redevelopment projects (as defined in Section1.5).
b. Infill projects that meet the following conditions:
i. The project is consistent with applicable general plan designation, and all applicable general plan policies, and applicable zoning designation and regulations;
ii. The proposed development occurs on a project site of no more than five acres substantially surrounded by urban uses;
iii. The project site has no value as habitat for endangered, rare, or threatened species;
iv. Approval of the project would not result in any significant effects relating to traffic, noise, air quality, or water quality; and
v. The site can be adequately served by all required utilities and public services (modified from State Guidelines § 15332).
vi. Smart Growth projects, which are defined as new development and redevelopment projects that occur within existing urban areas designed to achieve the majority of the following principles:
3 Site condition #5 is “smart growth and infill or redevelopment sites where the density and/or nature of the project would create significant difficulty for compliance with the onsite volume retention requirement.”
B-10
1. Create a range of housing opportunities and choices;
2. Create walkable neighborhoods;
3. Mix land uses;
4. Preserve open space, natural beauty, and critical areas;
5. Farmland preservation may also be considered for projects occurring outside the City Urban Restriction Boundary (CURB) but within existing urban centers.
6. Provide a variety of transportation choices;
7. Includes transit oriented development (development located within an average 2,000 foot walk to a bus or train station).
8. Strengthen and direct development towards existing communities; and
9. Take advantage of compact building design.
The City or County Planning Division in which a project is proposed will ultimately determine whether a project meets these Smart Growth criteria.
c. Pedestrian/bike trail projects.
d. Permittee’s flood control, drainage, and wet utilities projects.
e. Historical preservation projects.
f. Low income housing that occurs within existing urban areas.
The TGM includes guidelines for determining the maximum volume feasibly retained and/or biofiltered. These guidelines include recommendations for the percent of a site that could feasibly be dedicated to infiltration BMPs to meet the retention BMP requirement (see Table 3-1 of the draft TGM).4
1.2.2.3 County of Los Angeles LID Ordinance and Manual
Chapter 12.84 of the Los Angeles County Municipal Code requires the use of LID standards in development projects. Chapter 12.84 requires that applicable development projects (LA County, 2009a) meet the following conditions:
• Mimic undeveloped stormwater and urban runoff rates and volumes in any storm event up to and including the “50-year capital design storm event,” as defined by the Los Angeles County department of Public Works (LACDPW);
4 The Ventura County TGM is located on the Ventura County Watershed Protection District website at: (http://portal.countyofventura.org/portal/page/portal/PUBLIC_WORKS/Watershed_Protection_District/About_Us/VCWPD_Divisions/Water_and_Environmental_Resources/Water_Quality
B-11
• Prevent pollutants of concern from leaving the development site in stormwater as the result of storms, up to and including a water quality design storm event; and
• Minimize hydromodification impacts to natural drainage systems.
To meet these standards, development projects that consist of five or more residential units, or nonresidential development, shall comply with the following:
• The excess volume (ΔV, defined as the post-developed runoff volume minus the pre-developed runoff volume for the 85th percentile storm event) from each lot upon which such development is occurring, shall be infiltrated at the lot level. Or in the alternative, the excess volume from the entire development site, including streets and public right-of-way, shall be infiltrated in sub-regional facilities. The tributary area of a sub-regional facility shall be limited to five acres, but may be exceeded with approval of the Director of LACDPW. When infiltration of all excess volume is not technically feasible, on-site storage, reuse, or other water conservation uses of the excess volume is required and shall be implemented as authorized by the Director of LACDPW.
If compliance with the above LID requirements is technically infeasible, in whole or in part, the project must incorporate design features demonstrating compliance with the LID requirements to the maximum extent practicable. The LID goals of increasing groundwater recharge, enhancing water quality, and preventing degradation to downstream natural drainage courses are considered by LACDPW in the determination of infeasibility.
The LA County LID Standards Manual (LA County, 2009b) outlines site conditions where infiltration may not be possible:
• Locations where seasonal high groundwater is within 10 feet of the surface.
• Within 100 feet of a groundwater well used for drinking water.
• Brownfield development sites or other locations where pollutant mobilization is a documented concern.
• Locations with potential geotechnical hazards as outlined in a report prepared and stamped by a licensed geotechnical engineer.
• Locations with natural, undisturbed soil infiltration rates of less than 0.5 inches per hour that do not support infiltration-based BMPs.
• Locations where infiltration could cause adverse impacts to biological resources.
• Development projects in which the use of infiltration BMPs would conflict with local, State or Federal ordinances or building codes.
• Locations where infiltration would cause health and safety concerns.
B-12
1.2.2.4 USEPA Green Infrastructure Program Review
In August 2010, the United States Environmental Protection Agency (USEPA) conducted a green infrastructure review of city programs (USEPA, 2010). This document was reviewed to identify programs that may have LID-related feasibility requirements and implementation guidance. The cities of Philadelphia, PA and Seattle, WA were identified as having developed procedures for determining infiltration feasibility, described below.
1.2.2.4.1 Philadelphia, PA
The Philadelphia city code contains four areas of stormwater requirements: channel protection, flood protection, water quality, and site design requirements to reduce imperviousness. The water quality component requires all new and redevelopment projects greater than 15,000 square feet to infiltrate the volume of one inch of rainfall from all directly connected impervious surfaces (for each storm). The code requires the “design professional” to follow procedures outlined in the Stormwater Management Manual to determine whether the site is appropriate for infiltration (City of Philadelphia, 2008). The procedures include:
• A “hotspot investigation”, which determines whether there is subsurface contamination at the site. The Philadelphia Manual contains steps to procure data for the site, including aerial photos and maps, and lists land uses that are prohibited for infiltration based on associated contaminants.
• Soil infiltration testing procedures, which require ASTM testing methods for soils. The Philadelphia Manual includes the infiltration testing section from the Pennsylvania Stormwater Best Management Practices Manual. The Pennsylvania manual includes soil infiltration rates between 0.1 inches per hour and 10 inches per hour as a guideline. The Manual states that while very low permeability soil is still feasible for infiltration, BMPs may require a very large surface area.
• Procedures for determining effects of infiltration on subsurface stability of historic fill. The Manual includes steps to determine whether fill exists, verify fill conditions, rate existing structures stability, and apply these findings towards a determination of infiltration feasibility.
The Philadelphia Manual also includes watershed maps for site planning.
1.2.2.4.2 Seattle, WA
The City of Seattle, WA implemented stormwater standards which require all projects with greater than 2,000 square feet of new or replaced impervious surfaces to compost amend all disturbed pervious areas and implement green stormwater infrastructure practices to the maximum extent feasible (MEF). For impervious areas greater than 10,000 square feet, flow control performance-based thresholds must also be demonstrated. The City of Seattle Public
B-13
Utilities Department of Planning and Development released a Stormwater Manual5 in November 2009 to provide guidance on these requirements.
Infiltration feasibility is determined using an infiltration feasibility flowchart contained in the Stormwater Manual. The flowchart will not permit infiltration facilities if the following conditions exist:
1. The site is in a Landslide-Prone Critical Area (as defined by the Regulations for Environmental Critical Areas, Seattle Municipal Code 25.09).
2. The site is not within required setback above a Steep Slope Critical Area (as defined by the Regulations for Environmental Critical Areas, Seattle Municipal Code 25.09) or other setback requirements cannot be met. Setback requirements include:
a. 5 feet from property lines
b. Setbacks from structures (on- and off-site)
c. 100 feet from drinking water supply wells or springs
d. Setbacks from groundwater protection areas
e. 10 feet from underground storage tanks
f. 100 feet from proposed or existing septic systems or drain fields
g. 100 feet from a contaminated site or abandoned landfill
3. The design infiltration rate after reduction by a correction factor exceeds 10 inches/hour or is less than 0.25 in/hr.
a. A geotechnical report must be provided to evaluate the feasibility of infiltration as determined by a PIT test to measure infiltration rates. Correction factors that must be applied to determine the design infiltration rates are included in the Stormwater Manual Appendix.
4. If site is located in a Peat Settlement Prone Critical Area (as defined by the Regulations for Environmental Critical Areas, Seattle Municipal Code 25.09) and infiltration results in a net loss in infiltration capacity.
5. If runoff from 5,000 to 10,000 sf of impervious surfaces is to be infiltrated on-site and:
a. Greater than 5,000 sf of pollution generating impervious surface or ¾ acre lawn and landscaped area is to be infiltrated on-site AND seasonal high groundwater or impermeable layer is less than 3 feet below bottom of facility (as determined by a detailed subsurface evaluation); OR
5 The City of Seattle Public Utilities Department of Planning and Development released a Stormwater Manual and it is located on the Seattle.gov website at: http://www.seattle.gov/dpd/codes/dr/DR2009-17.pdf
B-14
b. Less than 5,000 sf of pollution generating impervious surface or ¾ acre lawn and landscaped area is to be infiltrated on-site AND seasonal high groundwater or impermeable layer is less than 1 foot below bottom of proposed facility (as determined by a detailed subsurface evaluation).
6. If runoff from greater than 10,000 sf of impervious surface is to be infiltrated on site and:
a. Infiltration determined to be infeasible per an in-depth subsurface evaluation; OR
b. Infiltration determined to be feasible per an in-depth subsurface evaluation AND seasonal high groundwater or impermeable layer is less than 3 feet from the bottom of proposed facility.
A detailed subsurface evaluation includes analyses to determine the design infiltration rate and seasonal high groundwater levels using test hole or test pit explorations and piezometer readings.
An in-depth subsurface evaluation includes:
7. Assessment and documentation of infiltration receptors (i.e. soil layers), including:
a. Depth to groundwater and impermeable layers,
b. Seasonal variation of groundwater table,
c. Groundwater flow direction and gradient,
d. Volumetric water holding capacity,
e. Horizontal hydraulic conductivity of saturated zone,
f. Lateral extent of infiltration receptor, and
g. Impact of infiltration on groundwater table.
8. Groundwater level monitoring, using a minimum of three groundwater monitoring wells to establish a three-dimensional relationship for the water table.
1.2.2.5 Virginia Department of Conservation and Recreation
The Virginia Department of Conservation and Recreation (DCR) developed new stormwater standards which emphasize runoff reduction. A literature review was developed for DCR and others by the Center for Watershed Protection, in support of DCR’s Regulation and Handbook revision processes. The runoff reduction method includes applying site design practices to minimize impervious cover, applying runoff reduction practices, and computing pollutant removal (CWP, 2008). BMP pollutant removal efficiencies as well as feasibility of different control practices are outlined in the Virginia DCR Stormwater Design Specifications created for each control practice. Feasibility factors for infiltration practices are outlined in Specification No. 8 and include the following (paraphrased from VA DCR, 2010):
B-15
9. The maximum contributing drainage area (CDA) to an individual infiltration practice should be less than 2 acres and as close to 100% impervious as possible.
10. Required building setbacks vary based on design scale and include:
a. For impervious area of 250 to 2,500 sq ft, a 5 foot down-gradient setback and a 25 up-gradient set-back should be included.
b. For impervious area of 2,500 to 20,000 sq ft, a 10 foot down-gradient setback and 50 foot up-gradient setback should be included.
c. For impervious area of 20,000 to 100,000 sq ft, a 25 foot down-gradient and 100 foot up-gradient setback should be included.
d. Conventional and small scale infiltration practices should be located a minimum horizontal distance of:
i. 100 feet from any water supply well
ii. 50 feet from septic systems
iii. 5 feet down-gradient from dry or wet utility lines
11. Infiltration practices must be located 200 feet from down-gradient slopes greater than 20%, and CDA slopes should be less than 15%.
12. The base of the infiltration practice must be at least 2 feet (vertically) above the seasonal high water table or bedrock layer.
13. The minimum infiltration rate is 0.5 inch/hour as confirmed by an on-site infiltration evaluation. Native soils must have silt/clay content less than 40% and clay content less than 20%.
14. Previously graded or disturbed sites are not considered good candidates for infiltration due to compaction. Additionally, infiltration practices should never be located above fill soils.
15. Infiltration practices are not intended to treat sites with high sediment loading.
1.2.2.6 Federal Facilities/EISA
Federal facilities are also subject to a stormwater standard outlined in Section 438 of the 2007 Energy Independence and Security Act (EISA). Development and redevelopment projects with a footprint greater than 5,000 square feet must maintain or restore the predevelopment hydrology of the site with respect to rate, volume, and duration of flow to the MEP. USEPA guidance on EISA recommends that stormwater retention and/or use be utilized to the maximum extent technically feasible to meet this standard. Technical infeasibility is not defined explicitly in the guidance document, but examples of site conditions that may prevent retention are included. The guidance explicitly states that “a single one of these characteristics is very unlikely to preclude
B-16
meeting the performance standard, but a combination of factors may”. The examples included are the following (USEPA, 2009):
• The conditions on the site preclude the use of infiltration practices due to the presence of shallow bedrock, contaminated soils, near surface groundwater or other factors such as underground facilities or utilities.
• The design of the site precludes the use of soil amendments, plantings of vegetation or other designs that can be used to infiltrate and evapotranspirate runoff.
• Small project sites where the lot is too small to accommodate infiltration practices adequately sized to infiltrate the volume of runoff from impervious surfaces.
• Soils that cannot be sufficiently amended to provide for the requisite infiltration rates.
• Situations where site use is inconsistent with the capture and use of stormwater or other physical conditions on site that preclude the use of plants for evapotranspiration or bioinfiltration.
• Retention and/or use of stormwater onsite or discharge of stormwater onsite via infiltration has a significant adverse effect on the site or the down gradient water balance of surface waters, ground waters or receiving watershed ecological processes.
• State and local requirements or permit requirements that prohibit water collection or make it technically infeasible to use certain GI/LID techniques.
• Compliance with the Section 438 requirements would result in the retention and/or use of stormwater on the site such that an adverse water balance impact may occur to the receiving surface water body or ground water.
Documentation of the following is also required:
• Site evaluation and soils analysis.
• Calculations for the 95th percentile rainfall event or the pre-development runoff volumes and rates to identify the volume of stormwater requiring management.
• Documentation of modifications to the performance design objective based on technical constraints (site-specific METF determination).
• The site design and stormwater management practices employed on the site.
• Design calculations for each stormwater management practice employed.
• The respective volume of stormwater managed by each practice and the whole system.
• Operations and maintenance protocols for the stormwater management system.
B-17
1.2.3 Literature Review – Bioinfiltration BMPs
Volume reduction in stormwater best management practices (BMPs) refers to the retention of stormwater runoff via infiltration or evapotranspiration, thus reducing the volume of runoff discharged to the storm sewer.
While retention BMPs are designed to reduce the volume of runoff draining to the storm sewer, some bioinfiltration BMPs, which are designed to treat and release runoff, also provide volume reduction benefits. This section summarizes available literature for conclusions regarding volume reduction in bioinfiltration/biotreatment BMPs.
The ASCE International BMP database does not provide information regarding bioretention design specifications. However, the median volume reduction attributed to bioretention cells was 57% with a mean of 61%. Quartile ranges, 25th and 75th percentiles were 45% and 74%, respectively (Wright Water and Geosyntec, 2010).
The Facility for Advancing Biofiltration within Monash University (State of Victoria, Australia) constructed a series of lined pilot bioretention cells and deployed sophisticated atmospheric equipment to measure volume loss due to evapotranspiration. Results of the study suggest that approximately 20% to 30% of inflows were lost to evapotranspiration given the climate of the Melbourne region and plant palette (FAWB, 2010).
Hydrologic monitoring was carried out on a single bioretention cell implemented on the Villanova University campus (Villanova, PA outside of Philadelphia, PA) that was designed to treat the 1.5 inch storm from approximately 1.5 acres of parking lot and lawn. Monitoring results indicated that effluent volumes were 40% of influent volumes, thus 60% of volume was infiltrated or evapotranspired (Traver, 2010).
Six bioretention cells were monitored in the Raleigh, North Carolina area with a media layer depth ranging from 2.5 to 4 feet. The primary focus of the study was discussing pollutant removal, though the author does state that volume reductions ranging from 33% to 50% could be attributed to the bioretention cells (NC State, 2006).
Hunt el al. (2006) presents hydrologic monitoring results from three bioretention cells for discrete storm events observed in the Greensboro and Chapel Hill areas of North Carolina. The author concluded that the monitored bioretention cells retained (infiltrated or evapotranspired) an average of 93% of the influent volume in the summer months and 46% of the influent volume in the winter months. The bioretention cells, sized to be between 5% and 7% of the impervious tributary area, were implemented with varying amended soil matrices with saturated hydraulic conductivities ranging from 3 to 15 inches/hour when measured three years after construction. All cells were designed with an underdrain below 1.5 feet of gravel and 4 feet of amended soil.
Two small bioretention cells with footprints of 28 m2 were implemented at the University of Maryland Campus (College Park, MD) and monitored extensively. Bioretention media consisted
B-18
of 50% sand, 30% topsoil, and 20% compost by volume consistent with regional guidelines with a small layer of gravel packed around the underdrain. These cells were also implemented with a polypropylene liner to minimize the migration of water into or out of the system for research purposes. Volume reduction for these two cells was determined to be 23% for cell A and 18% for cell B. Volume reductions were limited to soil retention and loss to evapotranspiration (Davis, 2008).
A single bioretention cell was implemented to treat a 4500 m2 car park in the Melbourn region of the state of Victoria, Australia and was subsequently monitored extensively. The bioretention was divided into three separate sub-cells, each 1.5 m wide, 10 m long, and 0.7 m deep, to treat runoff. Each sub-cell was lined to prevent infiltration and contained a perforated 100 mm diameter PVC pipe to collect treated stormwater. Cell 1 contained a sandy loam, Cell 2 contained 80% sandy loam, 10% vermiculite and 10% perlite, and Cell 3 contained 80% sandy loam, 10% compost, and 10% mulch. The cells’ average volume reduction was 33% with a range from 15-83% for simulated storms. The paper does not attribute one end of the range to a given sub-cell (Hatt et al., 2009).
The hydrologic performance of six bioretention cells implemented in Greensboro area of North Carolina and the College Park area of Maryland is summarized in a review paper published by Li et al. in 2009. Bioretention sizing varied between 2% and 6% surface to drainage ratio, though all six cells were implemented with either a perforated or corrugated plastic 15 cm underdrain. Ponding depths ranged from 10 to 30 inches. Volume reduction ranged from 40% to 99% (Li et al., 2009).
A vertically stratified bioretention cell, containing a 1.3 m deep anaerobic zone in addition to a 0.5 m aerobic zone, was implemented and monitored extensively in the field at the Ohio Agricultural Research and Development Center (OARDC), a campus of The Ohio State University in Wooster, Ohio. Each zone included a 0.1 m perforated underdrain with media comprised of sand and top soil in a ratio of 6:2.2 and between 3.2 and 12.7 mm of gravel. The saturated hydraulic conductivity of the media was 12 cm/hr (4.7 in/hr). The stratified bioretention cell yielded a 42% volume reduction (Yang el al., 2009). A series of bioretention cells were implemented in the Madison, Wisconsin region using household tools to amend the clay parent material with sand. No underdrains were present. Each bioretention cell was planted with either turf grass or natural prairie grass and had saturated hydraulic conductivities ranging from 2.5 to 4.2 in/hr. Different combinations of soil and plant palette yielded a volume reduction of between 75 and 93% (USGS, 2010).
The Portland Bureau of Environmental Service (BES) implemented a rain garden without an underdrain in silty soils with a saturated hydraulic conductivity of 1.8-3 in/hr in Portland, OR. Monitoring the rain garden showed a volume reduction of 94% (Portland BES, 2006).
A lined bio-infiltration facility sized for a 1 inch storm was implemented and monitored in Haddam, CT. The 2 foot deep sandy loam media had an infiltration rate of 1.5 in/hr. A 4 inch
B-19
perforated pipe was placed in 5.9 inches of 1 inch diameter base media. Monitoring showed a 98% reduction in runoff (Dietz, 2005).
1.2.4 Infiltration Case Studies
BASMAA member agencies received a request for project attribute information for infiltration BMPs that had, at a minimum, been approved for implementation, if not constructed. A total of 25 responses were received that contained sufficient information to identify that the specific projects were in fact designed to infiltrate and did not include underdrains. Five planned or implemented infiltration BMPs from various regions of the Bay Area were selected to be studied at greater detail. An overview of these five infiltration BMPs is presented in Table 11 below. Case study summaries presenting more BMP attribute information are provided in Appendix C.
Table 1: Overview of Selected Infiltration BMP Case Studies
Location Project Name Infiltration BMP Type
Tributary Description
Underlying Soil Description
Design Attributes Meeting Provision
C.3
City of Fremont
Bay Street Parking Lot Permeable Pavement Parking lot of 0.3
acres.
Hydrologic Soil Group D with an infiltration rate of 0.25 inches per hour
System was designed to capture the 100-year storm event and would meet/exceed C.3.
City of San Jose
The Village Parking Lot Infiltration Basin
The parking lot was designed as an overflow parking lot with 70% imperviousness.
Underlying soils are clays (Hydrologic Soil Group D).
System was sized to meet C.3.
City of Burlingame
Sustainable Streets and Parking Lots Demonstration Project
Rain Garden (bioretention without underdrain) and infiltration trench
Parking Lot and building roof runoff draining to new Rain Garden and Curb Extension with 0.6 acres of new landscaped area
Sandy Loam / Fine Sand / and Gravel with an infiltration rate of 0.17 inches per hour.
All runoff captured on site. No overflow present; project would meet C.3.
City of Daly City
Habitat for Humanity 36-Condominium Development
Infiltration chambers
Residential Condominium Development on 0.69 acre site.
Colma Sand with an infiltration rate of 2.5 inches per hour.
System was sized to meet C.3.
1.3 Rainwater Harvesting
1.3.1 Rainwater Harvesting Systems
Rainwater harvesting systems capture and store stormwater runoff for later use. These systems are engineered to store a specified volume of water with no surface discharge until this volume is exceeded. Storage facilities that can be used to harvest rainwater include cisterns (above ground tanks), open storage reservoirs (e.g., ponds and lakes), and underground storage devices (tanks, vaults, pipes, arch spans, and proprietary storage systems). Uses of captured water may potentially include irrigation demand, indoor non-potable demand, industrial process water
B-20
demand, or other demands. Rainwater harvesting systems typically include several components: (1) methods to divert runoff to the storage device, (2) an overflow for when the storage device is full, and (3) a distribution system to get the water to where it is intended to be used. Harvesting systems typically include pretreatment to remove large sediment and vegetative debris. Systems used for internal uses may require an additional level of treatment prior to use.
1.3.2 Literature Review – Rainwater Harvesting
The following sections summarize the rainwater harvesting feasibility criteria found in the literature review.
1.3.2.1 Orange County
Level I rainwater harvesting and use criteria for Orange County are listed below, A single ‘yes’ answer to any of the following question indicates that harvest and use should not be considered in Orange County:
• Does use of harvested water for the type of demand on the project violate codes or ordinances in effect at the time of project application?
• Would harvest and use of runoff violate downstream water rights? While it is not anticipated that infiltration of runoff would violate water rights in Orange County, water law in California is complex, and the TGD does not exclude the possibility that a rightful water rights claim could restrict infiltration of stormwater. The South County Permit contemplates the potential for stormwater management activities to violate water rights at F.3.d.(6)(d).
Harvest and use BMP effectiveness is determined from another set of questions. Harvest and use systems are not required to be considered in Orange County if any of the following conditions are met:
• The site is designated for reclaimed water use for irrigation and/or toilet flushing and insufficient demand is available for both reclaimed and harvested stormwater use.
• No landscape irrigation demand exists for periods of longer than 1 week following an 85th percentile, 24-hour storm event as documented by a certified landscape design professional, and the project is single family residential land use or multi-family land use with density < 7 dwellings units per acre, or commercial with FAR < 1.0. Intent: sufficient demand for harvested rainwater would be very unlikely to be present in these land uses.
• Reduction of runoff over predeveloped conditions would be partially or fully inconsistent with watershed-based management strategies and/or would impair beneficial uses of the receiving water. The level of allowable reduction must be documented in a site-specific
B-21
study or watershed study, and it must be demonstrated that stand-alone harvest and use BMPs would exceed the allowable level of reduction.
• A technically-based study of economic feasibility and/or cost-effectiveness has been approved by the RWQCB Executive Officer that addresses the feasibility of harvest and use and provides criteria for when harvest and use would be economically infeasible, and the project meets the criteria described by this study.
• A RWQCB Executive Officer-approved watershed-based plan has identified a subregional or regional BMP opportunity and demonstrated that this opportunity meets the following criteria:
o The subregional/regional BMP is located such that the project would drain to the BMP prior to discharge to a Waters of the US, or the use of Waters of the US to convey water meets the requirements of the TGD, and
o The subregional/regional BMP is sufficiently sized to receive runoff from the project, and
o The subregional/regional BMP is sited and designed such that it will provide greater overall benefit than would be achieved by harvest and use BMPs on-site, including combined considerations of pollutant loading, hydrologic loading, groundwater recharge, potable water demand, and Smart Growth goals.
o The subregional/regional BMP will be adequately maintained into perpetuity.
1.3.2.2 Ventura County
Technical infeasibility criteria for rainwater harvesting facilities listed in the draft TGM including the following:
• Projects that do not provide sufficient demand for harvested stormwater. Demand estimation should include consideration of requirements for Title 22 treatment of stormwater for indoor uses, requirements to use reclaimed water for indoor and outdoor uses, and low water use landscaping requirements (see Technical Effectiveness Screening).
• BMPs that are not allowable per current federal, state or local codes are considered infeasible.
1.3.2.3 LA County LID Ordinance and Manual
The LA County LID Standards Manual (LA County, 2009b) outlines where storage and reuse of the ΔV may not be possible:
B-22
• Projects that would not provide sufficient irrigation or (where permitted) domestic grey water demand for use of stored runoff, due to limited landscaping or extensive use of low water use plant palettes in landscaped areas.
• Projects that are required to use reclaimed water for irrigation of landscaping.
• Development projects in which the storage and reuse of stormwater runoff would conflict with local, state or federal ordinances or building codes.
• Locations where storage facilities would cause potential geotechnical hazards as outlined in a report prepared and stamped by a licensed geotechnical engineer.
• Locations where storage facilities would cause health and safety concerns.
1.3.2.4 Virginia DCR - Rainwater Harvesting Feasibility
Virginia Department of Conservation and Recreation feasibility factors for rainwater harvesting practices are outlined in Specification No. 6 and include the following (paraphrased from VA DCR, 2010):
• Available space is needed to house the tank and any overflow.
• Site topography and tank location should be considered as they relate to all of the inlet and outlet invert elevations in the rainwater harvesting system. Locating storage tanks in low areas will make it easier to route roof drains from buildings to cisterns.
• Underground storage tanks are most appropriate in areas where the tank can be buried above the water table. The tank should be located in a manner that will not be subject it to flooding.
• Storage tanks should only be placed on native soils or on fill in accordance with the manufacturer's guidelines. The bearing capacity of the soil upon which the cistern will be placed should be considered, as full cisterns can be very heavy.
• All underground utilities must be taken into consideration during the design of underground rainwater harvesting systems. Appropriate minimum setbacks from septic drainfields should be observed, as specified by Virginia law and regulations.
• The contributing drainage area (CDA) to the cistern is the impervious area draining to the tank. In general, only rooftop surfaces should be included in the CDA. Parking lots and other paved areas can be used in rare circumstances with appropriate treatment (oil/water separators) and approval of the locality.
• The quality of the harvested rainwater will vary according to the roof material over which it flows. Water harvested from certain types of rooftops, such as asphalt sealcoats, tar and gravel, painted roofs, galvanized metal roofs, sheet metal or any material that may contain asbestos may leach trace metals and other toxic compounds. In general, harvesting rainwater from such roofs should be avoided, unless new information
B-23
determines that these materials are sufficient for the intended use and are allowed by Virginia laws and regulations.
• Designers should also note that the pH of rainfall in Virginia tends to be acidic (ranging from 4.5 to 5.0), which may result in leaching of metals from the roof surface, tank lining or water laterals to interior connections. Once rainfall leaves rooftop surfaces, pH levels tend to be slightly higher, ranging between 5.5 to 6.0. Limestone or other materials may be added in the tank to buffer acidity, if desired.
• Harvesting rainwater can be an effective method to prevent contamination of rooftop runoff, which would result from mixing it with ground-level runoff from a stormwater hotspot operation. In some cases, however, industrial roof surfaces may also be designated as stormwater hotspots.
• Cistern overflow devices should be designed to avoid causing ponding or soil saturation within 10 feet of building foundations. Storage tanks should be designed to be watertight to prevent water damage when placed near building foundations.
• Whenever possible, underground rainwater harvesting systems should be placed in areas without vehicle traffic or be designed to support live loads from heavy trucks, a requirement that may significantly increase construction costs.
1.3.2.5 Federal Facilities/EISA
Federal facilities examples included the following infeasibility conditions for rainwater harvesting (USEPA, 2009):
• Water harvesting and use are not practical or possible because the volume of water used for irrigation, toilet flushing, industrial make-up water, wash-waters, etc. is not significant enough to warrant the design and use of water harvesting and use systems.
• Modifications to an existing building to manage stormwater are not feasible due to structural or plumbing constraints or other factors as identified by the facility owner/operator.
• Retention and/or use of stormwater onsite or discharge of stormwater onsite via infiltration has a significant adverse effect on the site or the down gradient water balance of surface waters, ground waters or receiving watershed ecological processes.
• State and local requirements or permit requirements that prohibit water collection or make it technically infeasible to use certain GI/LID techniques.
• Compliance with the Section 438 requirements would result in the retention and/or use of stormwater on the site such that an adverse water balance impact may occur to the receiving surface water body or ground water.
B-24
1.3.3 Rainwater Harvesting Case Studies
BASMAA member agencies received a request for project attribute information for rainwater harvesting systems that had, at a minimum, been approved for implementation, if not constructed. A total of six responses were received identifying rainwater harvesting projects within the MRP area. Five fully implemented rainwater harvesting systems were selected to be studied at greater depth. An overview of these five harvesting systems is presented in Table 22 below. Case study summaries are provided in Appendix C.
Table 2: Overview of Selected Rainwater Harvesting Case Studies
Location Project Name Tributary Description Project Rationale Design Attributes Meeting
Provision C.3
City of Oakland
Mills College Betty Irene Moore Natural Sciences Building
13,000 square foot impervious roof area.
Building received LEED Platinum certification with added educational benefit.
Runoff redirected to 2,000 gallon former mayonnaise container. System not sized to meet C.3.
City of Oakland
Mills College Lorry I. Lokey Graduate School of Business
12,000 square foot green roof area.
Building received LEED gold certification with added educational benefit.
Runoff redirected to 4,000 cistern. System not sized to meet C.3.
City of San Mateo Magnolia Place
Infill development with 52 residential units.
Pursuing LEED certification (not constructed).
100% of runoff expected to be directed to a cistern for use in toilet flushing and landscaping (project in design phase).
Unincorporated Contra Costa County (Martinez Area)
Central Concrete, Inc.
Hydrologically isolated 11,423 square foot concrete batch process area.
Discharge prevention and compliance with Industrial General Permit, water cost savings.
Stormwater harvesting sump sized for the 100 year event and exceeds C.3.
City of Oakland
StopWaste.org Building
Approximately 7,000 square foot commercial roof area.
Building sustainability demonstration project.
Rainwater harvesting system not sized to meet C.3.
APPENDIX C
Case Studies
Infiltration BMPs:
1. Bay Street Parking Lot, City of Fremont
2. The Villages Parking Lot, City of San Jose
3. Sustainable Streets and Parking Lots Demonstration Project, City of Burlingame
4. Habitat for Humanity Condominium Development, City of Daly City
Rainwater Harvesting BMPs:
1. Mills College Natural Sciences Building, City of Oakland
2. Mills College Lokey Graduate School of Business, City of Oakland
3. Magnolia Place, City of San Mateo
4. Central Concrete, Unincorporated Contra Costa County (Martinez Area)
5. StopWaste.org Building, City of Oakland
Infiltration BMP Case Study 1
Bay Street Parking Lot, City of Fremont
Introduction to Project
Bay Street Parking lot consists of 43 spaces occupying approximately 13,870 square feet located at 4112 Bay St. in Fremont, CA.
Installed BMPs
Pervious pavement with an underlying infiltration bed was installed on the entirety of the parking lot (not just the parking stalls). Infiltration testing of underlying soils yielded a measured infiltration rate of 0.8 inches/hour. A safety factor of 4 was incorporated into the design infiltration rate of 0.25 inches per hour. The infiltration bed was comprised of clean-washed, uniformly graded aggregate lined with geotextile fabric. No underdrain was included.
Costs associated with the projected totaled $672,000 with staff time accounting for $113,000 and construction costs accounting for $558,000.
Project Outcome
The pervious pavement system was designed to capture the 100-year storm event and therefore would meet the C.3.d requirement.
Lessons Learned From This Example
No lessons learned have been identified at this time.
Acknowledgements/References
City of Fremont, Shannan Young
Transportation and Operations Department Environmental Services Division 39550 Liberty Street Fremont CA 94538
The tributary area consists of a 0.4 acre parking lot, located at 2000 The Villages Fairway Drive, San Jose, CA.
Installed BMPs
The parking lot was designed as an overflow parking lot, and is 70% impervious. The tributary area drains to an infiltration basin. No under drain was incorporated into the design. Infiltration media material is comprised of a layer of river rock over a 4-inch sand bed sitting over native clay soils (depth to groundwater is approximately 20- to 30-feet). The infiltration basin has a floor area 954 square feet, and is approximately 3-feet deep, resulting in approximately 2,862 cubic feet with a (regression constant) drain time equal to 48-hours. Also, according to the approved Stormwater Control Plan (SCP), this basin is oversized as 0.48 feet of runoff over a 17,580 square foot tributary area would only require am 843.84 cubic foot infiltration basis. An overflow catch basin was implemented just below the rim height (3-feet) of the infiltration basin. Capital costs and operations and maintenance costs are not available at this time.
Project Outcome
The stormwater infiltration basin treating the project was sized using the Urban Runoff Quality Management (URQM) Approach consistent with the Santa Clara Valley Urban Runoff Pollution Prevention Program (SCVURPPP) to meet the C.3.d requirement.
Lessons Learned From This Example
No lessons learned have been identified at this time.
Sustainable Streets and Parking Lots Demonstration Project, City of Burlingame
Introduction to Project
The project consists of routing runoff from 1.32 acres of an existing parking lot and building roof into a rain garden BMP adding 0.06 acres of new landscaped area. The imperviousness after construction was 15%.
Installed BMPs
A 0.06 acre bioretention facility (rain garden) and a 0.01 acre planter box (curb extension) were installed at the Project. All runoff is captured by the facility and infiltrated on site. The soil underlying the project is a mix of sandy loam, fine sand, and gravel.
Capital costs and operations and maintenance costs are not available at this time.
Project Outcome
An infiltration test using a double ring infiltrometer (consistent with ASTM D3385) was conducted by a contractor and yielded a rate of 0.1 inches per hour. A second infiltration test using an unspecified method yielded a natural soil infiltration rate of 0.17 inches per hour.
Total discharge to the rain garden from 1.32 acres equals 0.251 cubic feet per second (cfs) for a 30 year storm event. The bioswale was designed and installed as a 4’-0” wide trapezoidal channel with 5.5 inch depth. The Q for this design is 0.43 cfs or almost twice the amount required by the C3 guidelines.
Total discharge to the curb extension from 0.11 acres of street runoff requires 0.285 cfs (cubic feet per second) for a 30 year event. The 6’-4” wide trapezoidal channel was installed with a 3” depth. The cfs for this design is 0.33 exceeding the 0.285 cfs required by the C3 guidelines.
Construction costs associated with this stormwater BMP was $203,688 without accounting for design or engineering time estimated at an additional $70,000. Operations and maintenance costs were estimated to total approximately $35,000 per year largely for vegetation management.
\Lessons Learned From This Example
The retention area was increased post-construction to contain a greater volume of runoff. Rip rap was later installed in the bioretention area to prevent erosion.
The city required that the contractor test imported soil permeability before final installation. The infiltration test failed the first time but was redone and the test was passed. This type of test is critical to success of an infiltration system.
Habitat for Humanity Condominium Development, City of Daly City
Introduction to Project
Residential Condominium Development with 52 dwelling units per acre with an associated covered parking area on a 0.69 acre site that was previously utilized with auto-related uses & 100% impervious. The expected imperviousness of this development (not constructed yet) will be 56%.
Installed BMPs
Infiltration will occur in Stormtech SC-740 infiltration chambers draining to Colma Sands. Infiltration chamber sizing analysis states that infiltration rate is 2.5 in/hr. No infiltration bed will be material present.
Project Outcome
Infiltration vaults were sized for the ten year storm using the rational method supplemented by California Department of Transportation resources (runoff coefficient and time of concentration) and are expected to meet MRP C.3.d requirements.
Lessons Learned From This Example
No lessons learned have been identified at this time.
Mills College Betty Irene Moore Natural Sciences Building, City of Oakland
Introduction to Project
• Project size: Building 26,000 square feet with approximately 13,000 square feet draining to the cistern.
• Land Use: Education residential roof
• Reason for selecting rainwater harvesting: LEED Platinum building certification, LEED Platinum stormwater certification, and sustainability demonstration for student education.
Installed BMPs
The Mills College Natural Science building (26,000 sq ft) received a LEED Platinum stormwater rating in 2007. Roof runoff is "artfully" conveyed to 2,000 gallon former mayonnaise container for subsequent use leading to an estimated potable water use savings of 57,400 gallons. Water formerly recirculated through a fountain in dry weather that has since ceased due to evaporative losses. Rain water is treated with a UV and particulate filter that can be seen when entering the building.
• Rainwater harvesting from the building’s roof area (100% imperviousness) was constructed in 2007 and is fully operational.
• Costs of Installation and O&M: Estimated rainwater harvesting system cost of $350,000.
• Permitting Processes/ Health Department Issues: Permitting process brought about the implementation of the UV filter. No significant permitting hurdles were encountered.
Project Outcome
• Volumetric or Water Quality Data: Cistern capable of retaining 60,000 gallons. Literature states that approximately 45% of rainfall would be captured.
• Effectiveness in meeting MRP C.3.d requirement: The rainwater harvesting system was designed for non-stormwater benefits and was not sized to meet MRP C.3.d
Lessons Learned From This Example
• Lessons learned: Potable water make up water is required during periods of dry weather to allow for toilet flushing to continue. Evaporative loss from the fountain reduced the volume of water available for use.
Acknowledgements/References
Karen Feeney
Campus Architect, Mills College
510-430-2323
Rainwater Harvesting BMP Case Study 2
Mills College Lorry I. Lokey Graduate School of Business, City of Oakland
Introduction to Project
• Project size: Building 28,000 square feet with approximately 12,000 square feet draining to a 4,000 gallon cistern.
• Land Use: Education residential roof
• Reason for selecting rainwater harvesting: LEED Gold building certification and sustainability demonstration for student education.
Installed BMPs
The Mills College Lokey Graduate School of Business (28,000 sq ft) received a LEED Gold stormwater rating in 2009. The Lokey rainwater harvesting system has been coupled with a green roof. Runoff from the green roof is conveyed to a 4,000 gallon cistern via a large “scupper.” Captured water is used in toilet flushing. Cistern size was selected following a demand analysis conducted by the Integral Group. Cistern sizing calculations were not available for reference. Publically available literature states that water savings are expected to total approximately 100,000 gallons per year.
• Costs of Installation and O&M: Cost of building was $21.4 million, cost of rainwater harvesting system not available.
• Permitting Processes/ Health Department Issues: No significant permitting hurdles were encountered.
Project Outcome
• Volumetric or Water Quality Data: Cistern capable of retaining 4,000 gallons. Literature states that approximately 100,000 gallons of water would be saved.
• Effectiveness in meeting MRP C.3.d requirement: The rainwater harvesting system was designed for non-stormwater benefits and was not sized to meet MRP C.3.d.
Lessons Learned From This Example
Captured rainwater running off of green roof contains tannins and is slightly brown in color. Restroom users have a tendency to flush the toilet before use and after use leading to greater water consumption.
Acknowledgements/References
Karen Feeney
Campus Architect, Mills College
Rainwater Harvesting BMP Case Study 3
Magnolia Place, City of San Mateo
Introduction to Project
• Project size: Project footprint of 32,000 square feet with a 20,000 square foot roof area that has received planning approval. Rainwater harvesting system design specifications are still in flux. Preliminary cistern size is expected to be 130,000 gallons.
• Land Use: Multi-family residential roof
• Soil Conditions: San Francisco Bay Mud (Hydrologic Soil Group D)
• Reason for selecting rainwater harvesting: Developer is pursuing LEED Gold or Platinum certification.
Installed BMPs
A rainwater harvesting system designed to capture runoff from the roof of a 52 unit multi-family residential infill redevelopment project (100% imperviousness) has received planning approval and has not been constructed at this time. The Magnolia Place rainwater harvesting system is expected to capture 100% of the rainfall for use in toilet flushing and landscaping.
• Costs of Installation and O&M: Installation costs still in flux but estimated at $100,000 for the system as a whole.
• Permitting Processes/ Health Department Issues: Permitting process is in the initial stages as planning approval was just recently secured.
Project Outcome
• Volumetric or Water Quality Data: Civil engineering design specifications in flux.
• Effectiveness in meeting MRP C.3.d requirement: Civil engineering design specifications in flux.
Lessons Learned From This Example
• Lessons learned: Interest in implementing a rainwater harvesting system came from LEED subtracting points for having more parking spots than needed for residents. Developer is using extra parking use spaces as the location of the cistern.
Central Concrete, Unincorporated Contra Costa County (Martinez Area)
Introduction to Project
• Project size: 11,423 square feet of a concrete batch facility is hydrologically isolated and drains to a 36,000 gallon sump. Harvested water retained and used in concrete batch process.
• Land Use: Industrial
• Reason for selecting rainwater harvesting: Retention of stormwater and prevention of discharge to comply with Industrial General Permit. Captured water used in batch process.
Installed BMPs
Central Concrete has confined processes that have the potential to affect stormwater pH to an isolated area of the site where all stormwater runoff is captured downgradient in a 36,000 gallon sump. The sump was sized 100 year storm event, following extensive modeling of stormwater generation, process water generation, and water use for batch processes with the goal of zero discharge from the area.
• Costs of Installation and O&M: The area draining to the sump was engineered to address seismic concerns. Total capital costs were $250,000 with an average annual maintenance cost of approximately $55,400.
• Permitting Processes/ Health Department Issues: No permitting issues were encountered.
Project Outcome
• Volumetric or Water Quality Data: Modeling conducted to support sump sizing estimated an average annual retention of 186,000 gallons per year.
• Effectiveness in meeting MRP C.3.d requirement: The rainwater harvesting component of the system was sized for the 100 year event and therefore exc
Lessons Learned From This Example
• Lessons learned: No lessons learned provided at this time.
Acknowledgements/References
Steve Brussee
Central Concrete, Inc.
510-774-4020
Rainwater Harvesting BMP Case Study 5
StopWaste.org Building, City of Oakland
Introduction to Project
• Project size: 2-Story, 14,000 square foot building located at 1537 Webster Street in Downtown Oakland.
• Land Use: Commercial roof.
• Reason for selecting rainwater harvesting: Rainwater harvesting system one component of a number of sustainable practices implemented in the building.
Installed BMPs
• BMP Type/ Description: Remodeled commercial building, originally built in 1926, was retrofitted with two wall mounted cisterns that are 144 and 180 gallons.
• Costs of Installation and O&M: Costs were not available at this time.
• Permitting Processes/ Health Department Issues: Costs were not available at this time.
Project Outcome
• Volumetric or Water Quality Data: LEED application states that water demand of 106 gallons in the month of July for drip irrigation and toilet flushing would be provided by captured rainwater. Estimated.
• Effectiveness in meeting MRP C.3.d requirement: Rainwater harvesting system was not sized to meet MRP C.3.d.
Lessons Learned From This Example
• Lessons learned: No lessons learned identified at this time.
Acknowledgements/References
StopWaste.Org
510-891-6500
APPENDIX D
Interceptor Trees
D-1
1. INTERCEPTOR TREES
New or existing trees on the project site can obtain “credits” for a certain square footage of Self-Treating Area, due to their ability to capture and evapotranspire rainfall, based on the type and size of the tree. This section provides a summary of the methodology various manuals and permits determine interceptor tree credit.
1.1 2007 Stormwater Quality Design Manual for the Sacramento South Placer County
The 2007 Stormwater Quality Design Manual for the Sacramento and South Placer Regions1 contains a fact sheet for Interceptor Trees (See Fact Sheet INT below), which includes design and feasibility considerations associated with interceptor trees such as space concerns, structural concerns, and maintenance considerations. The 2007 Design Manual considers three types of trees: 1) new evergreen trees, 2) new deciduous trees, and 3) existing trees. Credits are given in terms of square footage of area considered to be self-treating per interceptor tree. 100 square feet of credit is given for each new deciduous tree and 200 square feet of credit is given for each new evergreen tree. The credit for existing trees is the square-footage equal to one-half of the existing tree canopy.
Appendix D-1 for commercial projects and Appendix D-2 for residential projects2 provide calculation worksheets to determine runoff reduction credits, with Form D-2b specifically for interceptor trees. Additionally, Appendix D-3 provides a list of trees qualifying for interceptor tree runoff reduction credits, which are particularly suitable for the Sacramento and South Placer regions.
1.2 2006 City of San Jose Post-Construction Urban Runoff Management Policy
The 2006 City of San Jose Post-Construction Urban Runoff Management Policy3 requires all new and redevelopment projects to implement Post-Construction Best Management Practices (BMPs) and Treatment Control Measures (TCMs) to the maximum extent practicable. This Policy also establishes specified design standards for Post-Construction TCMs for applicable projects. Post-Construction Treatment Control Measure Tree Credits are provided for new trees planted within 30 feet of impervious surfaces and for existing trees kept on a site if the trees’ canopies are within 20 feet of impervious surfaces. 100 square feet of credit is given for each new deciduous tree, and 200 square feet of credit is given for each new evergreen tree. The credit for
1 The 2007 Stormwater Quality Design Manual for the Sacramento and South Placer Regions can be found at the Sacramento Stormwater Quality Partnership website at: http://www.sactostormwater.org/SSQP/development/DesignManual.asp 2 An Excel version of the runoff reduction Credit Worksheets from Appendix D of the 2007 Design Manual can be found at the same website at: http://www.sactostormwater.org/SSQP/development/DesignManual.asp 3 The 2006 City of San Jose Post-Construction Urban Runoff Management Policy can be found at: http://www.sanjoseca.gov/planning/stormwater/Policy_6-29_Memo_Revisions.pdf
D-2
existing trees is the square-footage equal to one-half of the existing tree canopy. No more than 25% of a site’s impervious surface can be treated through the use of trees. Trees required by the City of San Jose for tree removal mitigation, to fulfill City of San Jose street tree requirements, or to meet storm water treatment facility planting requirements are not counted toward Post-Construction Treatment Control Measure Credit.
1.3 2009 Construction General Permit
The State Water Resources Control Board adopted the NPDES General Permit for Stormwater Discharges Associated with Construction and Land Disturbance Activities4 (Construction General Permit) (Order No. 2009-0009-DWQ), on September 2, 2009. It became effective on July 1, 2010. The 2009 Construction General Permit references the 2007 Stormwater Quality Design Manual for the Sacramento and South Placer Regions in its methodology of determining runoff reduction credits for new trees. 100 square feet of credit is given for each new deciduous tree and 200 square feet of credit is given for each new evergreen tree. The credit for existing trees is calculated by identifying the square footage using the average diameter at 4.5 ft above grade. Appendix 2.15 provides a worksheet to determine post-construction water balance performance standards, with a Tree Planting Credit Worksheet provided specifically for interceptor trees. Table D-1 below compares the interceptor tree design criteria between the 2007 Stormwater Quality Design Manual for Sacramento & South Placer Regions, the 2006 City of San Jose Post-Construction Urban Runoff Management Policy, and the 2009 Construction General Permit. These design criteria determines of the extent of the self-treating area of interceptor trees.
4 The 2009 Construction General Permit can be found at the State Water Resources Control Board website at: http://www.waterboards.ca.gov/water_issues/programs/stormwater/constpermits.shtml 5 An Excel version of the Post-Construction Water Balance Performance Standard Spreadsheet from Appendix 2-1 of the 2009 Construction general permit can be found at the same website at: http://www.waterboards.ca.gov/water_issues/programs/stormwater/constpermits.shtml
D-3
Table D-1: Design Criteria for Interceptor Trees
Reference Location and Size Species and Soil Installation and
Maintenance 2007 SW Quality Design Manual for Sacramento & South Placer Regions (Factsheet INT; Appendix D)
Plant within 25 feet of ground-level impervious surface; Space so crowns do not overlap at 15 yrs of growth; 15 gallon container (min); Do not plant trees near overhead utilities and lighting, underground utilities, signage, septic systems, curb/gutter and sidewalks, paved surfaces, and building foundations.
Qualifying species listed in Table INT 1 and Appendix D-3; Drainage and soil type must support selected tree species in Table INT-1 and Appendix D-3; Amended soils may be required.
Avoid compaction; Install grass no closer than 24 inches from trunk; Add 4-6 inches deep of hardwood mulch, 6 inches away from trunk; Permanent irrigation system may be required; Avoid excess irrigation due to mosquito issues; Pruning and removal and replacement of diseased/ damaged tree may be required.
2006 City of San Jose Post-Construction Urban Runoff Management Policy (P. 4 & 10)
Plant within 30 feet of ground-level impervious surface; Existing trees within 20 feet of ground-level impervious surface.
Species should be suitable for site conditions and design intent; Drainage and soil type must support selected tree species.
Trees should be self-sustaining and long-lived; Protection during construction should be in the form of minimizing disruption of the root system.
2009 Construction General Permit (Appendix 2)
Average diameter at 4.5 ft above grade (i.e. diameter at breast height) is 12 inch.
No specs No specs
Table D-2 includes a comparison of the interceptor tree credits between the various guidance documents and permits. Table D-2: Interceptor Tree Credits
Source
New Evergreen Trees (ft2)
New Deciduous Trees (ft2)
Existing Trees (ft2)
2007 SW Quality Design Manual 200 100
Calculate by identifying the square footage equal to one half of the existing tree canopy, measured within the drip line. The resulting square footage divided by the total site square footage is equal to the IRP. This calculation is simplified in 2007 Manual Appendix D-1 and D-2.
City of San Jose Post-Construction Policy
200 100 Calculate by identifying the square footage equal to one half of the existing tree canopy.
Construction General Permit (Order No. 2009-0009-DWQ)
200 100 Calculate by identifying the square footage using the average diameter at 4.5 ft above grade.
Runoff Reduction Control Measure Fact Sheet Interceptor Trees
Stormwater Quality Design Manual for the Sacramento and South Placer Regions May 2007 INT-1
Description Interceptor trees are those used in residential and commercial settings as part of the stormwater quality management plan to reduce runoff and pollution from the development project. Interceptor trees can be placed on residential lots, throughout landscape corridors, in commercial parking lots, and along street frontages. Trees installed in municipal right-of-ways may be protected through ordinances and can provide years of aesthetic benefit.
Siting Considerations
• Soils: Drainage and soil type must support selected tree species. • Location: Locate within 25 feet of impervious surface. • Other structures: Maintain appropriate distance from infrastructure and structures that could be
damaged by roots and avoid overhead power lines, underground utilities, septic systems, sidewalks, curbs, patios, etc.
Vector Considerations • Potential for mosquitoes due to standing water where excess irrigation is applied or planter box is
not designed to properly drain.
Advantages • Reduces the amount of pollutants entering the storm drain system. • Can reduce size of downstream stormwater quality treatment measure(s) by reducing the volume
required to treat. • Enhances aesthetic values. • Provides shade to cool pavement and reduces surface runoff temperatures. • Aids in removal of air pollutants and noise reduction. • Shade trees required by the permitting agency may be counted as interceptor trees. • Extends life of asphalt paving.
Limitations • Fire safety may be a consideration in areas with increased risk for fire hazard.
Maintenance Recommendations (Low1) • Pruning of trees may be required to maintain tree, ensure safety, and prevent damage to
structures. • Diseased/damaged tree, and those with poor structure should be removed and replaced as soon as
possible. • Irrigation system may be required in perpetuity.
1 Compared to stormwater quality treatment control measures discussed in Chapter 6.
Runoff Reduction Control Measure Fact Sheet Interceptor Trees
Stormwater Quality Design Manual for the Sacramento and South Placer Regions INT-2 May 2007
How do interceptor trees protect water quality? Interceptor trees are ideal for all projects, including those where space is limited, in which trees can be placed along street frontages and in common space. Urban areas with higher numbers of trees exhibit hydrology more similar to natural conditions compared to urban areas without a tree canopy. Trees intercept storm water and retain a significant volume of the captured water on their leaves and branches allowing for evaporation and providing runoff reduction benefits. For example, a large oak tree can intercept and retain more than 500 to 1,000 gallons of rainfall in a given year (Cappiella, 2004). While the most effective Interceptor Trees are large canopied evergreen trees, deciduous trees can also provide a benefit. For example, a leafless Bradford pear will retain more than one half the amount of precipitation intercepted by an evergreen cork oak (Xiao et al., 2000).
The shade provided by trees keeps the ground under the trees cooler, thereby reducing the amount of heat gained in runoff that flows over the surface under the trees. This attenuation of heat in storm water helps control increases in stream temperatures. On slopes, tree roots hold soil in place and prevent erosion.
Planning and Siting Considerations Check with the local permitting agency about requirements for trees located in public utility easements. A tree permit may be required to plant, prune or remove such trees. Also, consultation with an arborist is recommended for selecting and locating appropriate tree species for the unique site conditions.
New trees • Select trees from a list of approved species established by the permitting agency (see Table INT-1
for examples, but check with appropriate agency for verification). Native species and those with a larger canopy at maturity are generally preferred, depending on available space for root and canopy.
• Select tree species based on the soils found on the site, available water, and aesthetics. Soil in planter areas may be amended to satisfy species requirements. Consult a landscape architect or arborist to ensure suitability of species for site conditions and design intent.
• Do not plant monocultures of same family, genus and/or cultivar. Do not plant trees too close together.
• Interceptor trees should be incorporated into the site’s general landscaping plan, but trees designated for storm water credits must be clearly labeled on plans submitted for local agency approval and other planning submittals.
• Do not place trees near structures that may be damaged by the growing root system. These include, but are not limited to, overhead utilities and lighting, underground utilities, signage, septic systems, curb/gutter and sidewalks, paved surfaces, building foundations and existing trees. Utilize approved root barriers (deflectors) when trees are planted close to infrastructure, per the local permitting agency standards.
Existing trees • New landscaping under existing trees must be carefully planned to avoid any grade changes and
any excess moisture in trunk area, depending on tree species. Existing plants which are compatible as to irrigation requirements and which compliment the trees as to color, texture and form are to be saved.
• Grade changes greater than six inches within the critical root zone should be avoided. Also, soil compaction and texture in the drip-line area greatly affect tree survival.
Runoff Reduction Control Measure Fact Sheet Interceptor Trees
Stormwater Quality Design Manual for the Sacramento and South Placer Regions May 2007 INT-3
Examples of Suitable uses of Interceptor Trees
Residential: large and small subdivisions, small-scale developments, located in or out of municipal right-of-way. The tree pictured is an evergreen Camphor.
Commercial: plazas and courtyards, landscape areas in parking lots and road frontages.
Industrial: Employee parking lots, entryway features, and road frontages.
Parks and Open Space: parking lots, park hardscape areas.
Variations Three types of interceptor trees are discussed in this fact sheet: 1) new evergreen trees, 2) new deciduous trees, and 3) existing trees.
New Evergreen Trees Evergreen trees provide the greatest benefit to water quality. Generally, the larger the tree and the smaller the leaves, the more rain is intercepted. Further, evergreen trees retain their leaves throughout the rainy season.
New Deciduous Trees Since the interceptor tree’s water quality benefit increases with increasing surface area of leaves and branches, deciduous trees, which lose their leaves early in the Central Valley’s rainy season, have less value than evergreen trees. However, even deciduous trees contribute to interception and shading, and credits are applied for inclusion of such trees in site plans.
Runoff Reduction Control Measure Fact Sheet Interceptor Trees
Stormwater Quality Design Manual for the Sacramento and South Placer Regions INT-4 May 2007
Existing Trees Conservation of existing trees provides aesthetic value to a site as well as a water quality benefit. Credits may be applied for protected trees located within 25 feet of an impervious surface, as long as the trees are not located in the designated “open space” for the project, for which credit has already been applied.
Design Criteria Design criteria for interceptor trees are listed in Table INT-1.
Table INT-1. Design Criteria for Interceptor Trees Also see Appendix D for information on calculating runoff reduction credits and a list of Trees Qualifying for Interceptor Tree Runoff Reduction Credits.
Variation Parameter Criteria All Planted Trees Size 15 gallon container (min.) Location Must be planted within 25 feet of ground-level
impervious surfaces. Must not be spaced such that the crowns overlap (at 15 years of growth).
Installation and Irrigation Trees must be installed and irrigated in accordance with local permitting agency Landscaping Standards.
New Evergreen and Deciduous Trees
See Appendix D for suggested tree species meeting size requirement.
Existing Trees Species Any landscape appropriate tree species
Construction Considerations New trees
• Do not allow soil in planter areas to be compacted during construction. • Do not allow soil in planter areas to become contaminated with construction related materials
such as lime or limestone gravel. • Install irrigation system according to proper specifications. • When installing lawn around trees, install the grass no closer than 24 inches from the trunk. • Install protective fencing if construction is ongoing, to avoid damage to new trees. • Mulch with hardwood chips (not redwood or cedar)
Existing trees • Proposed development plans and specifications must clearly state protection procedures for trees
that are to be preserved. • Existing trees must be protected during construction through the use of high-visibility
construction fencing set at the outer limit of the critical root zone. The fence must prevent equipment traffic and storage under the trees. Excavation within this zone should be accomplished by hand, and roots 1/2" and larger should be preserved. It is recommended that pruning of the branches or roots be completed by, or under the supervision of, an arborist. Soil compaction under trees should to be avoided.
• Ensure that trees that receive irrigation continue to be watered during and after construction.
Runoff Reduction Control Measure Fact Sheet Interceptor Trees
Stormwater Quality Design Manual for the Sacramento and South Placer Regions May 2007 INT-5
Long-Term Maintenance Maintenance recommendations for interceptor trees are provided in Table INT-2. The property owner is responsible for all costs associated with the maintenance.
Trees that are removed or die should be replaced with similar species, or all water quality benefits will be lost. Trees should be properly pruned for safety purposes, to protect structures, or for the improvement of the health and structure of the tree. The property owner is responsible for all costs associated with the replacement of interceptor trees.
Table INT-2. Inspection and Maintenance Recommendations for Interceptor Trees
Activity Description
Removal of Leaves and Debris:
Fallen leaves and debris from tree foliage should be raked and removed regularly to prevent the material from being washed into the storm water. Nuisance vegetation around the tree should be removed when discovered. Dead vegetation should be pruned from the tree on a regular basis.
Pruning It is recommended that a certified arborist or similarly qualified professional be retained to prune trees, or the property owner should learn proper pruning methods. A tree should never be topped. Topping is the practice of removing major portions of a large tree’s crown by cutting branches to stubs or to the trunk. Tree topping shortens the life of the tree, creates weakly attached limbs prone to breakage, decay and disfigures the tree. It also eliminates the interception canopy.
Mulching Add 4-6 inch deep hardwood mulch around newly planted trees and shrubs (avoid redwood and cedar, it is light and blows away and does not decompose fast enough to be beneficial to the soil health and tree's growth).
Irrigation An irrigation system should be installed at the time of planting and maintained during the establishment period or, if necessary to maintain the tree, in perpetuity.
Pesticides and Fertilizers
Minimize the use of chemicals to only what is necessary to maintain the health of the tree. Consider using mulch around the base of the tree as a substitute to fertilizer. Do not place mulch within six inches of the trunk of the tree.
Lawn maintenance Keep lawn at least 24 inches from trunk of tree. Competition from turfgrass stunts tree growth, and even additional fertilizer and water will
not overcome this effect. A bare area around the trunk also helps prevent injury to the tree from a mower or string trimmer. Trunk wounds to a young tree can have a severe dwarfing effect.
Other Activities Plant evergreen shrubs and ground covers around trees when possible. Care should be taken when digging near tree roots. Once tree has become established, planting of vegetation near base of tree and subsequent watering of such vegetation may result in over-saturation and damage to the tree.
Removal/ Replacement
See Long-term Maintenance
Runoff Reduction Control Measure Fact Sheet Interceptor Trees
Stormwater Quality Design Manual for the Sacramento and South Placer Regions INT-6 May 2007
References • Schueler T., Swann C., Wright T, and S. Sprinkle. 2004. Urban Subwatershed Restoration
Manual No 8: Pollution Source Control Practices. Version 1.0. Center for Watershed Protection. Ellicot City, MD. July 2004.
• Cappiella, K. 2004. Urban Watershed Forestry Manual (draft). Prepared for USDA Northeastern Area State and Private Forestry. Center for Watershed Protection, Ellicott City, MD.
• City of Davis Community Forest Management Plan , September 11, 2002. http://www.cityofdavis.org/pcs/trees/cfmp.cfm
• City of Portland Stormwater Management Manual. Revision 3, September 1, 2004. • National Menu of Best Management Practices for Storm Water Phase II. United State
• Post-Construction Urban Runoff Management. City Council Policy. City of San Jose, California. February 3, 1998.
• Start at the Source - Design Guidance Manual for Stormwater Quality Protection, Bay Area Stormwater Managemnt Agencies Association, 1999.
• SMRC, The Stormwater Manager’s Resource Center. Manual Builder. http://www.stormwatercenter.net/Manual_Builder/Credits/SITE/reforestation.htm
• Xiao Q., and E.G. McPherson. 2003. Rainfall interception by Santa Monica's municipal urban forest. Urban Ecosystems
• Xiao, Q., E.G. McPherson, S.L. Ustin and M.E. Grismer. 2000. A new approach to modeling tree rainfall interception. Journal of Geophysical Research 105(D23) :29,173-29,188.
• Xiao, Q. 1998. Rainfall interception by urban forests. Davis, CA: University of California. Ph.D. Dissertation.
• Xiao, Q., E.G. McPherson, S.L. Ustin, M.E. Grismer, and J.R. Simpson. 2000. Winter rainfall interception by two mature open grown trees in Davis, CA. Hydrological Processes. 14(4) :763-784.
Photo Credits
All photographs provided by Dena Parish and Shannon Brown, ECORP Consulting, Inc., Rocklin, CA
Construction General Permit (Order No. 2009-0009-DWQ) Appendix 2 – Post-Construction Water Balance Performance Standard Spreadsheet
(Step 1a) If you know the 85th percentile storm event for your location enter it in the box below
(Step 1b) If you can not answer 1a then select the county where the project is located (click on the cell to the right for drop-down): This will determine the average 85th percentile 24 hr. storm event for your site, which will appear under precipitation to left.
(Step 1c) If you would like a more percise value select the location closest to your site. If you do not recgonize any of these locations, leave this drop-down menu at location. The average value for the County will be used.
Project Name: (Step 2) Indicate the Soil Type (dropdown menu to right):
Waste Discharge Identification (WDID):
(Step 3) Indicate the existing dominant non-built land Use Type (dropdown menu to right):
Date:(Step 4) Indicate the proposed dominant non-built land Use Type (dropdown menu to right):
Sub Drainage Area Name (from map):
Acres
(Step 5) Total Project Site Area:
(Step 6) Sub-watershed Area:
Percent of total project :Based on the County you indicated above, we have included the 85 percentile average 24 hr event - P85 (in)^ for your area.
in
The Amount of rainfall needed for runoff to occur (Existing runoff curve number -P from existing RCN (in)^)
In (Step 7) Sub-watershed Conditions
P used for calculations (in) (the greater of the above two criteria) In Sub-watershed Area (acres)
Acres^Available at www.cabmphandbooks.com Existing Rooftop Impervious Coverage
Existing Non-Rooftop Impervious Coverage
Proposed Rooftop Impervious Coverage
Proposed Non-Rooftop Impervious Coverage
CreditsPorous Pavement
Tree Planting
Pre-Project Runoff Volume (cu ft) Cu.Ft.Downspout Disconnection
Project-Related Runoff Volume Increase w/o credits (cu ft) Cu.Ft.
Impervious Area DisconnectionGreen Roof
Stream Buffer
Vegetated Swales
Subtotal
Subtotal Runoff Volume Reduction Credit
(Step 9) Impervious Volume Reduction Credits
Rain Barrels/CisternsSoil Quality Cu. Ft.
Subtotal Runoff Volume Reduction
Total Runoff Volume Reduction Credit
Cu. Ft.
0.00
0.00
0.00 0
0
0
LONE PINE COTTONWOOD PH
Runoff Calculations
0.00Sq Ft
Sq Ft
Soil Type
0.00
0.00
Square FeetAcres0
0
0
0.00
0.00
Cu. Ft.
Volume (cubic feet)
0.00
0.00
Error, value too high
00.00
Cu. Ft.
Cu.Ft.
Cu. Ft.
0
0
0
00.00
0
Post-Construction Water Balance Calculator
Acres
0.00
0.00
Non-Built Land Use Type Pre Development
User may make changes from any cell that is orange or brown in color (similar to the cells to the immediate right). Cells in green are calculated for you.
Project Information
INYO
Optional
You have achieved your minimum requirements
Project-Related Volume Increase with Credits (cu ft) 0
Design Storm
0
0.00
Optional
Runoff Curve Numbers
Complete Either
Non-Built Land Use Type Post Development
Existing Runoff Curve Number
Complete EitherOptional
Optional
Calculated Acres
0
Proposed Development Runoff Curve Number
0.50
0.50
Construction General Permit (Order No. 2009-0009-DWQ) Appendix 2 – Post-Construction Water Balance Performance Standard Spreadsheet
Tree Planting Credit Worksheet
Tree Canopy Credit CriteriaNumber of Trees
Planted Area Credit (acres)35 0.1860 0.15
Square feet Under Canopy
4000 0.09
6500 0.15
Return to Calculator* credit amount based on credits from Stormwater Quality Design Manual for the Sacramento and South Placer Regions
Please fill out a tree canopy credit worksheet for each project sub-watershed.
Number of proposed evergreen trees to be planted (credit = number of trees x 0.005)*Number of proposed deciduous trees to be planted (credit = number of trees x 0.0025)*
Square feet under an existing tree canopy, that will remain on the property, with an average diameter at 4.5 ft above grade (i.e., diameter at breast height or DBH) is LESS than 12 in diameter.
Please describe below how the project will ensure that these trees will be maintained.
Square feet under an existing tree canopy that will remain on the property, with an average diameter at 4.5 ft above grade (i.e., diameter at breast height or DBH) is 12 in diameter or GREATER.
APPENDIX E
Bioinfiltration Modeling Input Data and Results
Bioinfiltration Modeling Data
The USEPA Stormwater Management Model Version 5.0 (SWMM5.0) was used to simulate the long term average retention efficiency of a range of bioinfiltration design configurations for nine National Climate Data Center (NCDC) precipitation gages located throughout the San Francisco Bay Area. One Contra Costa County Department of Public Work gage was also incorporated due to the decommissioning of the NCDC gage in eastern Alameda and Contra Costa Counties and one Alameda County Flood Control and Water District gage was used in lieu of a decommissioned Hayward gage.
SWMM was selected for this analysis as it is a relatively simple, open source, continuous simulation model that has well-demonstrated capability for simulation of stormwater runoff processes in urban environments and simulating transient storage mechanisms in measures. Assumed SWMM input parameters are provided in Table E-1. Precipitation and evapotranspiration inputs are presented in Table E-1. Modeling for each precipitation gage incorporated evapotranspiration rates consistent with those presented by the California Irrigation Management System (CIMIS) monthly reference evapotranspiration map.
Table E-1: SWMM Simulation Input Parameters
SWMM Parameters Units Values
Period of Simulation years See Table 10 Wet time step seconds 600 Wet/dry time step seconds 600 Dry time step seconds 14,400 Precipitation inches Hourly precipitation data for gages presented in
Table 13. Impervious Manning’s n 0.012 Pervious Manning’s n 0.25 Hypothetical drainage area acres 1 Shape Rectangular, 250 ft flow path length Impervious fraction modeled Range from 0 to 100% with intervals of 10% Slope ft/ft 0.05 Evaporation inches See Table 10 Depression storage, impervious inches 0.02, based on Table 5-14 in SWMM manual (James
and James, 2000) Storage Volume cu-ft Varied over continuous range as discrete multipliers
on design capture storm depth. Drawdown Rate cfs Varied over continuous range to represent discrete
drawdown times.
Table E-2: SWMM Precipitation Inputs
NCDC Precipitation
Gage ID
NCDC Precipitation
Gage Location
Modeled Period Start
Date
Modeled Period End
Date
Days in Period
Avg. Annual Rainfall (inch)
040693 Berkeley 7/1/1962 1/3/2010 15582 19.98
041060 Brentwood 3/3/1955 1/24/2010 13179 14.92
Hayward Trym St.
Gage1
Hayward 7/1/1971 5/19/2005 12377 22.45
044712 Lake Solano 12/5/1950 11/30/2010 17376 21.20
0453712 Martinez 7/1/1948 12/29/2003 20881 20.33
045853 Morgan Hill 11/1/1957 2/5/2011 22583 17.90
046646 Palo Alto 9/3/1953 9/3/2010 7881 13.98
047769 San Francisco Airport
7/3/1940 2/5/2011 22581 19.98
047821 San Jose 9/3/2000 9/3/2007 22581 13.61
047767 San Francisco Oceanside
7/1/1948 12/31/2008 22098 19.61
Dublin Fire Station3
Dublin 9/20/1973 11/30/2010 13586 12.69
Footnotes: 1 Time-series dataset provided by Alameda County Flood Control and Water Conservation District and subject to their quality control and quality assurance (QA/QC). 2 NCDC record replaced by revised NCDC time-series dataset provided by Contra Costa County Flood Control and Water Conservation District. 3 Time-series dataset provided by Contra Costa County Flood Control and Water Conservation District and subject to their quality control and quality assurance (QA/QC). Each bioinfiltration simulation was represented as a one acre catchment draining to a bioinfiltration measure sized as 4 percent of the tributary area and using other standard design criteria. Amended soil media within the bioinfiltration measure were assumed to be a loamy sand, consistent with the Model Bioretention Soil Media Specifications (BASMAA, 2010), with a depth of 18 inches. Surface ponding depth was assumed to be six inches. All permutations of bioinfiltration design and tributary percent impervious values presented in Table 7 were modeled for each precipitation station.