38
v APS-footprint methodology - Pig fattening and breeding Blonk Consultants | Blonk Sustainability Tools DATE: 21-1-2021
v
APS-footprint methodology - Pig fattening and breeding Blonk Consultants | Blonk Sustainability Tools
DATE: 21-1-2021

Blonk Consultants helps companies, governments and civil society organisations put sustainability into practice. Our team of dedicated consultants works closely with our clients to deliver clear and practical advice based on sound, independent research. To ensure optimal outcomes we take an integrated approach that encompasses the whole production chain.
Title APS-footprint methodology - Pig fattening and breeding Date 21-1-2021 Place Gouda, NL Authors Nicolo’ Braconi Blonk Consultants Roline Broekema
Hans Blonk Blonk Consultants Blonk Consultants
Blonk Consultants| Blonk Sustainability Tools (+31) 0182 579970
Groen van Prinsterersingel 45 www.blonkconsultants.nl
2805 TD Gouda [email protected]
APS-footprint methodology - Pig fattening and breeding
4 BLONK CONSULTANTS | BLONK SUSTAINABILITY TOOLS - 2021
Table of contents 1. Introduction .................................................................................................................................................... 6
2. System definition ............................................................................................................................................ 7
2.1 Upstream systems connected to the pig APSs ...................................................................................... 9
2.2 Downstream systems connected to the pig APSs ............................................................................... 10
3. Required parameters.................................................................................................................................... 10
3.1 Herd composition ................................................................................................................................ 10
3.1.1 Breeding farm .................................................................................................................................. 10
3.1.2 Fattening farm ................................................................................................................................. 12
3.2 Inputs ................................................................................................................................................... 12
3.2.1 Feed ................................................................................................................................................. 12
3.2.2 Water .............................................................................................................................................. 13
3.2.3 Bedding material ............................................................................................................................. 13
3.2.4 Energy .............................................................................................................................................. 13
3.3 Outputs ................................................................................................................................................ 13
3.3.1 Functional unit (reference unit) ...................................................................................................... 14
3.3.2 Allocation ........................................................................................................................................ 14
4. Emissions modelling ..................................................................................................................................... 14
4.1 N excretion .......................................................................................................................................... 16
4.1.1 Baseline: FCR Red Meat - IPCC TIER 2 ............................................................................................. 16
4.2 TAN excretion ...................................................................................................................................... 17
4.2.1 Baseline: FCR Red Meat - EMEP/EEA .............................................................................................. 17
4.3 VS excretion ......................................................................................................................................... 18
4.3.1 Baseline: FCR Red Meat - IPCC TIER 2 ............................................................................................. 18
4.4 Methane enteric production ............................................................................................................... 18
4.4.1 Baseline: FCR Red Meat - IPCC Tier 2 .............................................................................................. 18
4.5 Methane emissions (from manure management) .............................................................................. 18
4.5.1 Baseline: FCR Red Meat - IPCC TIER 2 ............................................................................................. 18
4.6 Direct N2O emissions ........................................................................................................................... 19
4.6.1 Baseline: FCR Red Meat - IPCC TIER 2 ............................................................................................. 19
4.7 Indirect N2O emissions ........................................................................................................................ 20
4.7.1 Baseline: FCR Red Meat - IPCC TIER 2 ............................................................................................. 20
4.8 NH3 emissions ...................................................................................................................................... 20
4.8.1 Baseline: FCR Red Meat - EMEP/EEA 2013 TIER 2 ........................................................................... 20
4.9 Other N emissions ............................................................................................................................... 21
4.9.1 Baseline: FCR Red Meat - EMEP/EEA 2013 TIER 2 ........................................................................... 21
4.10 Non-Methane Volatile Organic Compound (NMVOC) emissions ........................................................ 21
5 BLONK CONSULTANTS | BLONK SUSTAINABILITY TOOLS - 2021
4.10.1 Baseline: FCR Red Meat - EMEP/EEA 2013 TIER 2 ...................................................................... 21
4.11 Particulate Matter (PM) emissions ...................................................................................................... 22
4.11.1 Baseline: FCR Red Meat - EMEP/EEA 2013 TIER 2 ...................................................................... 22
5. APS reference systems for pigs .................................................................................................................... 23
5.1 Reference system for the Netherlands ................................................................................................ 23
5.1.1 Breeding phase ................................................................................................................................ 23
5.1.2 Fattening phase ............................................................................................................................... 26
References ............................................................................................................................................................ 36
6 BLONK CONSULTANTS | BLONK SUSTAINABILITY TOOLS - 2021
1. Introduction This document explains the methodology used for the pig production system in the Animal Production System
(APS) Footprint (APS-footprint) tool. It is accompanying the APS-footprint tool general documentation (Blonk
Consultants, 2020).
The APS-footprint framework enables to conduct environmental footprint calculations based on background
datasets, parameters defined by the user and modelling of emissions according to specified standards and
guidelines. Pig systems may vary in design and environmental performance due to differences in herd
composition, grazing periods, housing types, feeding regimes and manure management systems. The pig APS
module enables a user to model these different characteristics and investigate how they influence environmental
impacts. The methodological framework regarding allocation, functional units, boundary definitions and
emission modelling are based on published and recognized international guidelines (EMEP/EEA, 2016; IPCC,
2006a; TS Red meat FCR, 2019). There are two exceptions (inconsistency). The first is the consideration of
manure, currently accounted as a residual flow; according to FCR Red Meat manure leaving the farm should
account for inorganic fertilizer substitution (in development). The second is the use of economic allocation
(instead of biophysical allocation, in development) at sow piglet systems. The tool can also be used by users with
only conceptual knowledge of Life Cycle Assessment.
This methodology describes all the activities and impacts related to the pig production system, including
emissions due to manure management. The pig production system is characterized by two modules: the
production of piglets by the sow (pig breeding APS module) and the fattening of the piglets for pork (pig fattening
APS module). This document covers both subsystems, identifies the parameters required to model these
subsystems and proposes the appropriate calculations of the emissions. Both pig APS modules are connected to
other APS-footprint modules (e.g. compound feed module) or to background databases to enable complete
calculations of the environmental contribution of the lifecycle.
The definition of the pig APSs, and how these are connected to other the feed production system (cultivation
and processing of feed ingredients) can be found on chapter 2.
The cultivation emissions modelling is currently based on the Agri-footprint 5.0 database, and is therefore
consistent with the agricultural modelling rules of the PEF and the GFLI methodology (Blonk, van Passen, &
Broekema, 2020; European Commission, 2018b; Van Paassen, Braconi, Kuling, Durlinger, & Gual, 2019a). The
processing of crops into feed ingredients is also currently based on Agri-footprint 5.0 (Van Paassen et al., 2019a)
and is also compliant to the Feed PEFCR modelling rules.
Chapter 3 defines and explains the parameters required in the pig APS modules (herd composition data: chapter
3.1, input data: chapter 3.2, output data: chapter 3.3). The parameters described there need to be defined by
the user to calculate the LCIA. Pre-defined systems (reference systems) can be also selected by the user. These
are described in chapter 5.
Chapter 4 describes the modelling of nutrient excretions, emissions from enteric fermentation and emissions
connected to manure management. It also contains default values for the required parameters.
Identified limitations of the APS-footprint tool and its methodology are mainly the lack of capability of accounting
for changes happening outside the boundaries, the lack of detailed herd or animal metabolism model (therefore
relying on user inputs) and current lack of Data Quality Rating (DQR) system or uncertainty analysis. More
detailed information can be found in chapter 3.3 of the APS-footprint tool general methodology document (Blonk
Consultants, 2020).
7 BLONK CONSULTANTS | BLONK SUSTAINABILITY TOOLS - 2021
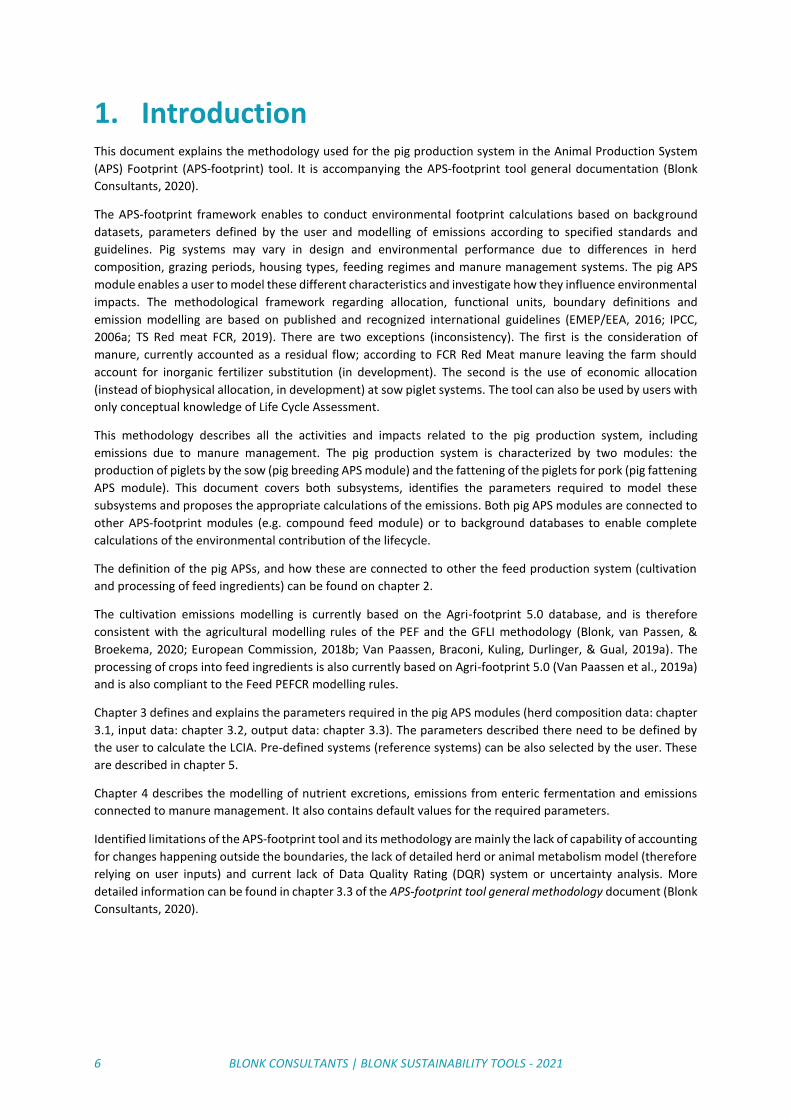
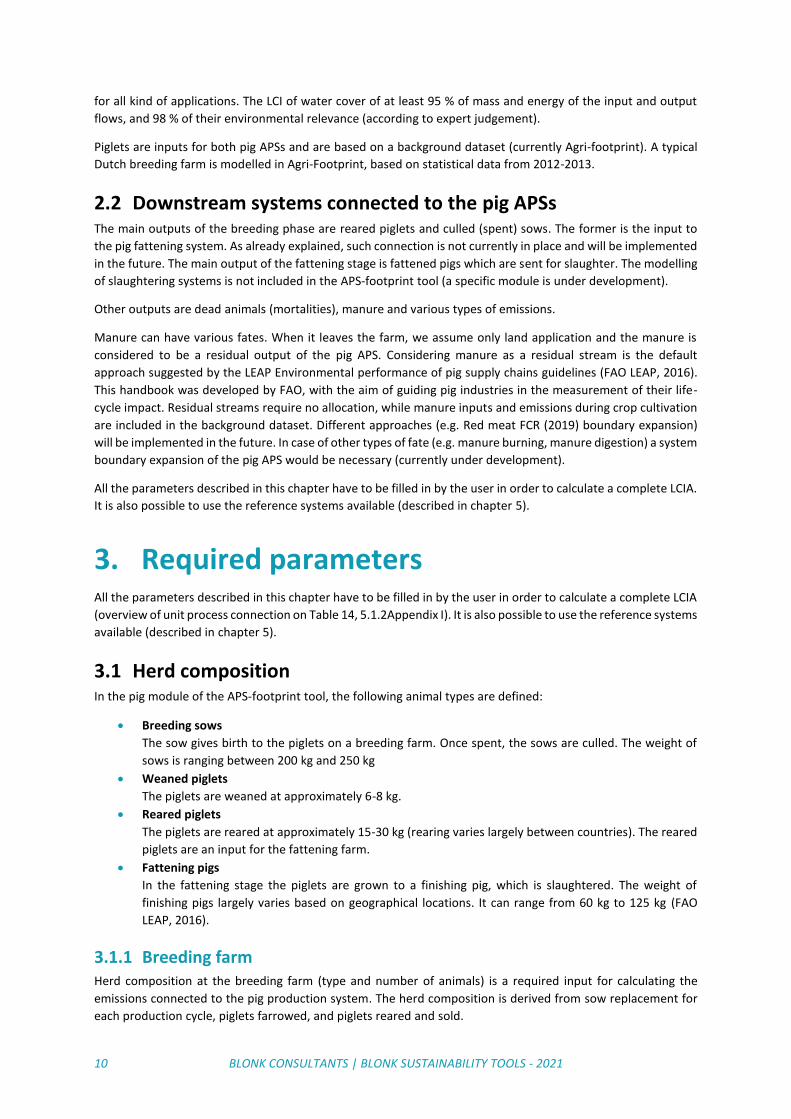
2. System definition The pig production system is characterized by two sub-systems: breeding and fattening (Figure 1 and Figure 2,
respectively). In this methodology document we cover intensive systems (small-scale, medium-scale and large)
as defined in the LEAP guidelines (FAO LEAP, 2016). Intensive systems are characterized by being essentially
specific to the production of meat and its large-scale marketization, differently from extensive systems, usually
focused on auto-sustainment. In intensive systems, pigs are kept indoor or sheltered with separate pens for
fatteners, boars, gestating sows and sows with litters (FAO LEAP, 2016), while the farrowing sows are often
placed in gestation crates.
In the APS-footprint module for pigs it is possible to change parameters and implement interventions on both
the piglet breeding phase and on the pig fattening phase. Both have a relevant contribution to overall impacts
(piglets on average 25% and fattening around 75% of environmental impact) (TS Red meat FCR, 2019).
The pig breeding APS system is characterized by three housing systems. These are automatically generated by
the tool when creating a new project, and all three needs to be filled in by the user (or by using a reference
system as the starting point). In the replacement sow housing piglet (gilts) are grown up to first insemination. In
the gestation & weaning system housing the sows goes through gestation and farrowing, followed by piglet
weaning. Finally, weaned piglets are grown in the rearing housing, to a weight acceptable for being moved to the
fattening stage.
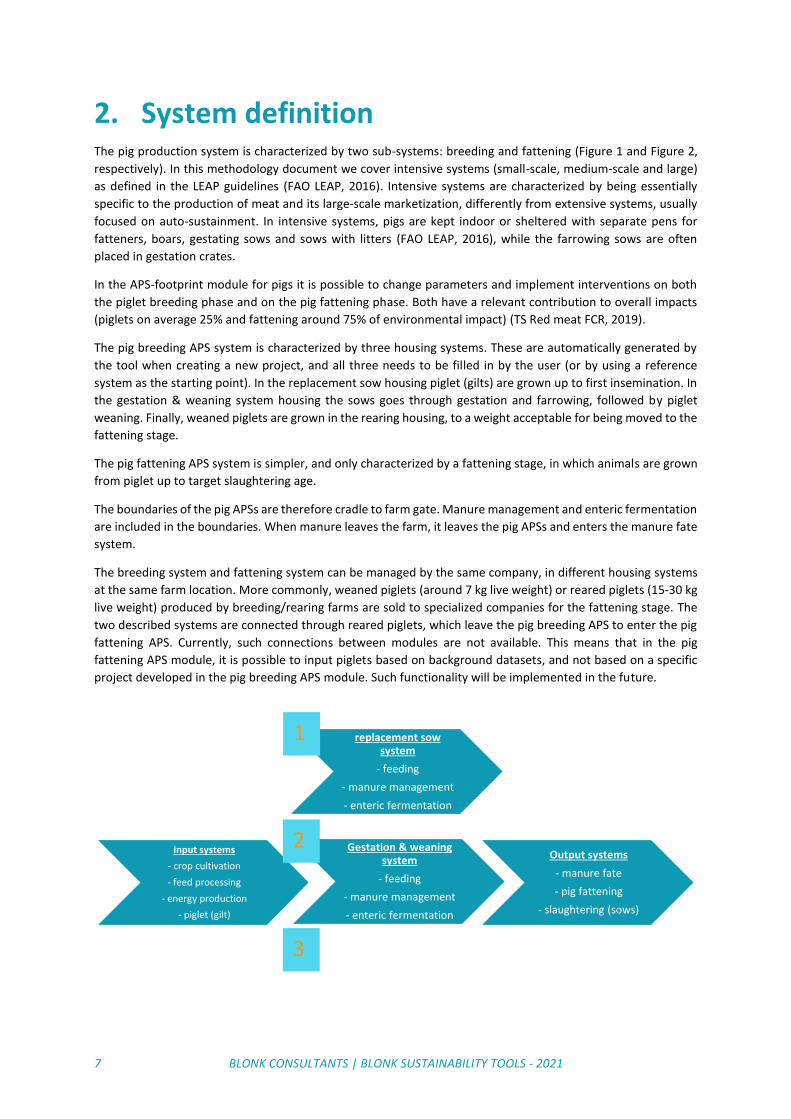
The pig fattening APS system is simpler, and only characterized by a fattening stage, in which animals are grown
from piglet up to target slaughtering age.
The boundaries of the pig APSs are therefore cradle to farm gate. Manure management and enteric fermentation
are included in the boundaries. When manure leaves the farm, it leaves the pig APSs and enters the manure fate
system.
The breeding system and fattening system can be managed by the same company, in different housing systems
at the same farm location. More commonly, weaned piglets (around 7 kg live weight) or reared piglets (15-30 kg
live weight) produced by breeding/rearing farms are sold to specialized companies for the fattening stage. The
two described systems are connected through reared piglets, which leave the pig breeding APS to enter the pig
fattening APS. Currently, such connections between modules are not available. This means that in the pig
fattening APS module, it is possible to input piglets based on background datasets, and not based on a specific
project developed in the pig breeding APS module. Such functionality will be implemented in the future.
replacement sow system
- feeding
- manure management
- enteric fermentation
Input systems
- crop cultivation
- feed processing
- energy production
- piglet (gilt)
Gestation & weaning system
- feeding
- manure management
- enteric fermentation
Output systems
- manure fate
- pig fattening
- slaughtering (sows)
1
2
3
8 BLONK CONSULTANTS | BLONK SUSTAINABILITY TOOLS - 2021
Figure 1: Systems diagram of the pig breeding system.
Figure 2: Systems diagram of the pig fattening system.
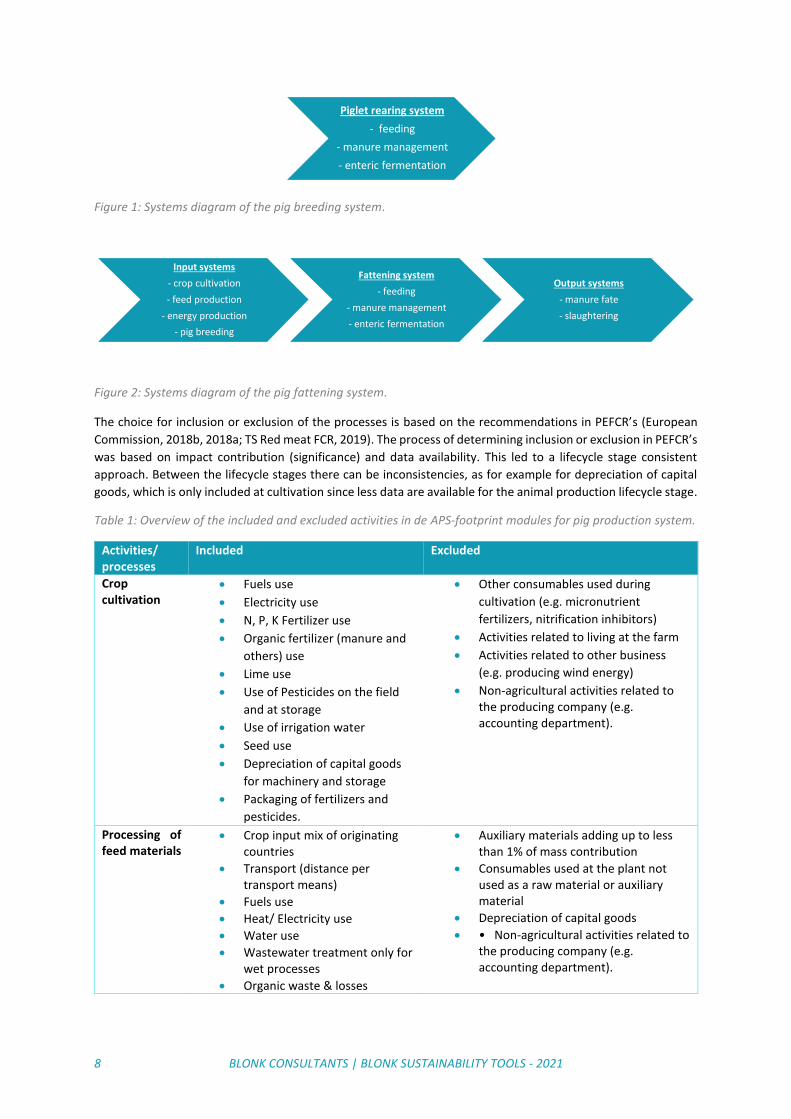
The choice for inclusion or exclusion of the processes is based on the recommendations in PEFCR’s (European
Commission, 2018b, 2018a; TS Red meat FCR, 2019). The process of determining inclusion or exclusion in PEFCR’s
was based on impact contribution (significance) and data availability. This led to a lifecycle stage consistent
approach. Between the lifecycle stages there can be inconsistencies, as for example for depreciation of capital
goods, which is only included at cultivation since less data are available for the animal production lifecycle stage.
Table 1: Overview of the included and excluded activities in de APS-footprint modules for pig production system.
Activities/ processes
Included Excluded
Crop cultivation
• Fuels use
• Electricity use
• N, P, K Fertilizer use
• Organic fertilizer (manure and
others) use
• Lime use
• Use of Pesticides on the field
and at storage
• Use of irrigation water
• Seed use
• Depreciation of capital goods
for machinery and storage
• Packaging of fertilizers and
pesticides.
• Other consumables used during
cultivation (e.g. micronutrient
fertilizers, nitrification inhibitors)
• Activities related to living at the farm
• Activities related to other business
(e.g. producing wind energy)
• Non-agricultural activities related to the producing company (e.g. accounting department).
Processing of feed materials
• Crop input mix of originating countries
• Transport (distance per transport means)
• Fuels use
• Heat/ Electricity use
• Water use
• Wastewater treatment only for wet processes
• Organic waste & losses
• Auxiliary materials adding up to less than 1% of mass contribution
• Consumables used at the plant not used as a raw material or auxiliary material
• Depreciation of capital goods
• • Non-agricultural activities related to the producing company (e.g. accounting department).
Piglet rearing system
- feeding
- manure management
- enteric fermentation
Input systems
- crop cultivation
- feed production
- energy production
- pig breeding
Fattening system
- feeding
- manure management
- enteric fermentation
Output systems
- manure fate
- slaughtering

9 BLONK CONSULTANTS | BLONK SUSTAINABILITY TOOLS - 2021
• Auxiliary materials (processing aids)
Animal farm (no cultivation)
• Replacement animals
• Feed materials
• Transport (distance per transport means)
• Fuels use
• Electricity use
• Use of water
• Other Consumables used at the farm than animals and feed
• Depreciation of capital goods
• Veterinary service
• Non-agricultural activities related to the producing company (e.g. accounting department).
Implementation of organic or free-range pig production systems will be considered at a later stage in the APS-
footprint development. In organic systems and free-range systems, the housing system may be a place for shelter
with access to free-range areas. Also, slaughtering is not included in the system boundaries and will be developed
in APS-footprint at a later stage.
2.1 Upstream systems connected to the pig APSs In both breeding and fattening APSs, relevant inputs are feed, energy, water, bedding materials and piglets.
Currently, Agri-footprint 5.0 (Van Paassen et al., 2019a; Van Paassen, Braconi, Kuling, Durlinger, & Gual, 2019b)
is the main source of data for feed ingredients, additives, energy and other inputs. Other databases, such as the
GFLI database or EF database will be linked to APS-footprint in the future. It is also possible to import user
specific system process LCI data related to feed production into APS-footprint.
Feed is the main input of the pig APSs. Feed production includes the cultivation and processing of crop and
minerals and additives production.
Cultivation datasets in Agri-footprint include land occupation, water inputs, fuel production and burning during
agricultural machinery use, electricity production, inorganic fertilizer production, pesticide production, capital
goods and emissions at transport of inputs, impact of capital goods production, and emissions from pesticides,
manure, urea and inorganic fertilizers (N2O direct and indirect, C2O and NH3 to air; nitrate, phosphorus and
heavy metals leaching to water; heavy metals emission to air).
Cultivation dataset are compliant with guidelines. More detailed information can be found in:
• LEAP Animal Feed Guidelines (FAO LEAP, 2015);
• PEFCR Feed for food producing animals (European Commission, 2018a).
• Draft GFLI methodology document (2020)
The energy data set contains the whole supply chain of the fuels from exploration over extraction and
preparation to transport of fuels to the power plants. All relevant and known transport processes used are
included. Overseas transports including rail and truck transport to and from major ports for imported bulk
resources are included. Furthermore, all relevant and known pipeline and / or tanker transport of gases and oil
imports are included. Coal, crude oil, natural gas and uranium production are modelled according to the specific
import situation. Diesel, gasoline, technical gases, fuel oils, basic oils and residues production such as bitumen
are modelled via a country-specific, refinery parameterized model. Furthermore, Specific technology standards
of heat plants regarding efficiency, firing technology, flue-gas desulphurisation, NOx removal and dedusting are
included. The data set contains the whole supply chain of the fuels from exploration over extraction and
preparation to transport of fuels to the heat plants. Furthermore, the data set comprises the infrastructure as
well as end-of-life of the plant.
For water inputs, the following operations are modelled in the background database: aeration (oxidation),
filtration, water softening (decarbonisation) and disinfection, all based on average European technologies and in
accordance with values found in the literature. The result of these operations is potable water from groundwater
10 BLONK CONSULTANTS | BLONK SUSTAINABILITY TOOLS - 2021
for all kind of applications. The LCI of water cover of at least 95 % of mass and energy of the input and output
flows, and 98 % of their environmental relevance (according to expert judgement).
Piglets are inputs for both pig APSs and are based on a background dataset (currently Agri-footprint). A typical
Dutch breeding farm is modelled in Agri-Footprint, based on statistical data from 2012-2013.
2.2 Downstream systems connected to the pig APSs The main outputs of the breeding phase are reared piglets and culled (spent) sows. The former is the input to
the pig fattening system. As already explained, such connection is not currently in place and will be implemented
in the future. The main output of the fattening stage is fattened pigs which are sent for slaughter. The modelling
of slaughtering systems is not included in the APS-footprint tool (a specific module is under development).
Other outputs are dead animals (mortalities), manure and various types of emissions.
Manure can have various fates. When it leaves the farm, we assume only land application and the manure is
considered to be a residual output of the pig APS. Considering manure as a residual stream is the default
approach suggested by the LEAP Environmental performance of pig supply chains guidelines (FAO LEAP, 2016).
This handbook was developed by FAO, with the aim of guiding pig industries in the measurement of their life-
cycle impact. Residual streams require no allocation, while manure inputs and emissions during crop cultivation
are included in the background dataset. Different approaches (e.g. Red meat FCR (2019) boundary expansion)
will be implemented in the future. In case of other types of fate (e.g. manure burning, manure digestion) a system
boundary expansion of the pig APS would be necessary (currently under development).
All the parameters described in this chapter have to be filled in by the user in order to calculate a complete LCIA.
It is also possible to use the reference systems available (described in chapter 5).
3. Required parameters All the parameters described in this chapter have to be filled in by the user in order to calculate a complete LCIA
(overview of unit process connection on Table 14, 5.1.2Appendix I). It is also possible to use the reference systems
available (described in chapter 5).
3.1 Herd composition In the pig module of the APS-footprint tool, the following animal types are defined:
• Breeding sows
The sow gives birth to the piglets on a breeding farm. Once spent, the sows are culled. The weight of
sows is ranging between 200 kg and 250 kg
• Weaned piglets
The piglets are weaned at approximately 6-8 kg.
• Reared piglets
The piglets are reared at approximately 15-30 kg (rearing varies largely between countries). The reared
piglets are an input for the fattening farm.
• Fattening pigs
In the fattening stage the piglets are grown to a finishing pig, which is slaughtered. The weight of
finishing pigs largely varies based on geographical locations. It can range from 60 kg to 125 kg (FAO
LEAP, 2016).
3.1.1 Breeding farm Herd composition at the breeding farm (type and number of animals) is a required input for calculating the
emissions connected to the pig production system. The herd composition is derived from sow replacement for
each production cycle, piglets farrowed, and piglets reared and sold.
11 BLONK CONSULTANTS | BLONK SUSTAINABILITY TOOLS - 2021
To model the system, the annual average population (AAP) for each animal type needs to be defined. We suggest
basing the AAP on primary data derived from an on-farm herd census. If this is not possible, we suggest using or
developing a herd population model. This should be based on animal replacement rates for each animal type
together with mortality rates, empty periods and eventual managerial decisions. Equations are proposed to
estimate the AAP for piglets and sows. A fall-back approach would be to use data available in statistics, scientific
literature or to use the available reference systems in the APS-footprint tool (described in chapter 5).
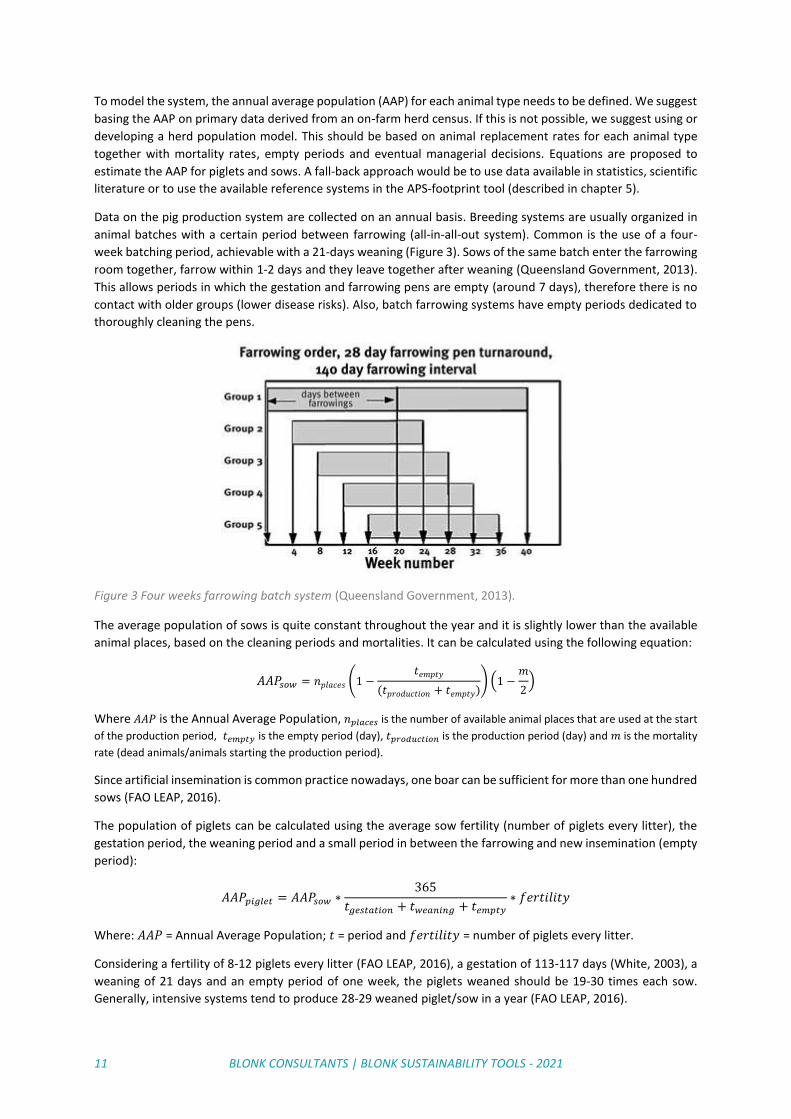
Data on the pig production system are collected on an annual basis. Breeding systems are usually organized in
animal batches with a certain period between farrowing (all-in-all-out system). Common is the use of a four-
week batching period, achievable with a 21-days weaning (Figure 3). Sows of the same batch enter the farrowing
room together, farrow within 1-2 days and they leave together after weaning (Queensland Government, 2013).
This allows periods in which the gestation and farrowing pens are empty (around 7 days), therefore there is no
contact with older groups (lower disease risks). Also, batch farrowing systems have empty periods dedicated to
thoroughly cleaning the pens.
Figure 3 Four weeks farrowing batch system (Queensland Government, 2013).
The average population of sows is quite constant throughout the year and it is slightly lower than the available
animal places, based on the cleaning periods and mortalities. It can be calculated using the following equation:
𝐴𝐴𝑃𝑠𝑜𝑤 = 𝑛𝑝𝑙𝑎𝑐𝑒𝑠 (1 −𝑡𝑒𝑚𝑝𝑡𝑦
(𝑡𝑝𝑟𝑜𝑑𝑢𝑐𝑡𝑖𝑜𝑛 + 𝑡𝑒𝑚𝑝𝑡𝑦)) (1 −
𝑚
2)
Where 𝐴𝐴𝑃 is the Annual Average Population, 𝑛𝑝𝑙𝑎𝑐𝑒𝑠 is the number of available animal places that are used at the start
of the production period, 𝑡𝑒𝑚𝑝𝑡𝑦 is the empty period (day), 𝑡𝑝𝑟𝑜𝑑𝑢𝑐𝑡𝑖𝑜𝑛 is the production period (day) and 𝑚 is the mortality
rate (dead animals/animals starting the production period).
Since artificial insemination is common practice nowadays, one boar can be sufficient for more than one hundred
sows (FAO LEAP, 2016).
The population of piglets can be calculated using the average sow fertility (number of piglets every litter), the
gestation period, the weaning period and a small period in between the farrowing and new insemination (empty
period):
𝐴𝐴𝑃𝑝𝑖𝑔𝑙𝑒𝑡 = 𝐴𝐴𝑃𝑠𝑜𝑤 ∗365
𝑡𝑔𝑒𝑠𝑡𝑎𝑡𝑖𝑜𝑛 + 𝑡𝑤𝑒𝑎𝑛𝑖𝑛𝑔 + 𝑡𝑒𝑚𝑝𝑡𝑦
∗ 𝑓𝑒𝑟𝑡𝑖𝑙𝑖𝑡𝑦
Where: 𝐴𝐴𝑃 = Annual Average Population; 𝑡 = period and 𝑓𝑒𝑟𝑡𝑖𝑙𝑖𝑡𝑦 = number of piglets every litter.
Considering a fertility of 8-12 piglets every litter (FAO LEAP, 2016), a gestation of 113-117 days (White, 2003), a
weaning of 21 days and an empty period of one week, the piglets weaned should be 19-30 times each sow.
Generally, intensive systems tend to produce 28-29 weaned piglet/sow in a year (FAO LEAP, 2016).
12 BLONK CONSULTANTS | BLONK SUSTAINABILITY TOOLS - 2021
The rearing of the piglets starts after weaning when the sow is separated from her litter. Piglets are grown until
a target weight. The target weight is dependent on the country-specific practices. In the Netherlands, where the
piglets are usually grown to a target weight of 25 kg and assuming weaning at 3 weeks, the rearing period lasts
approximately 8 weeks.
3.1.2 Fattening farm In the fattening stage, the production system is also based on batches. Few days per year are dedicated to
sanitation. Since a production period is shorter than one year (e.g. 120 days), an animal place will host more
animals throughout the year (e.g. > 3).
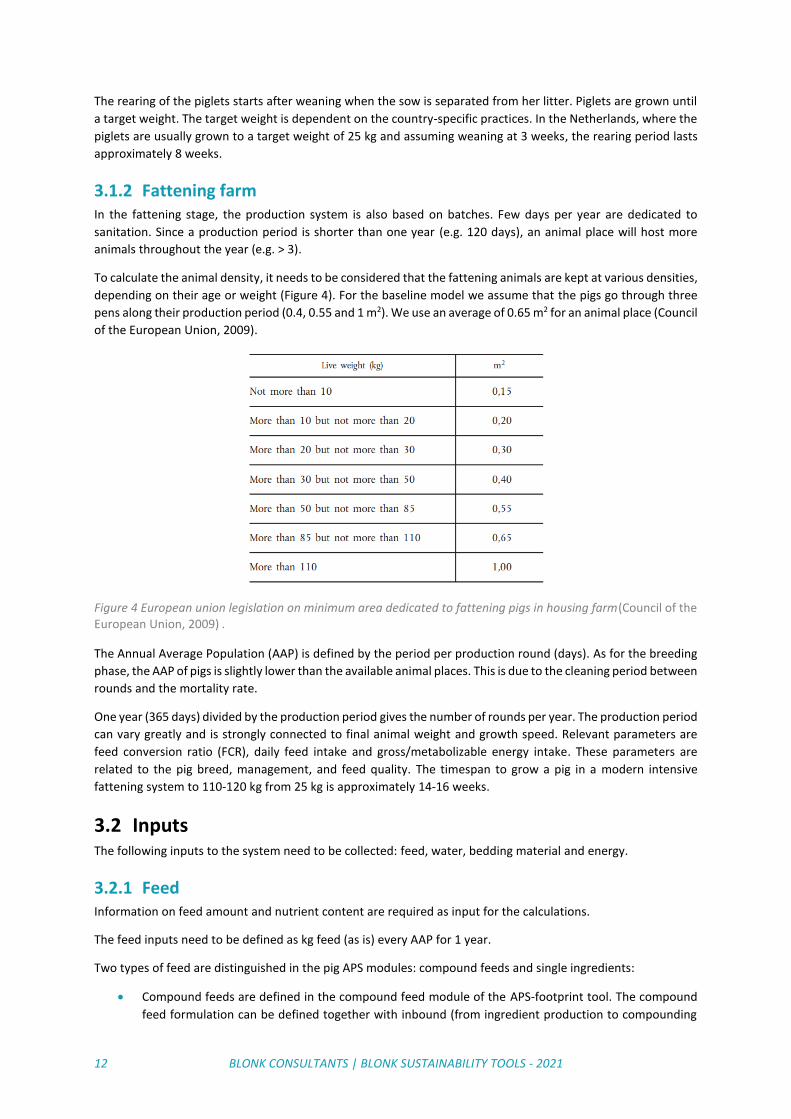
To calculate the animal density, it needs to be considered that the fattening animals are kept at various densities,
depending on their age or weight (Figure 4). For the baseline model we assume that the pigs go through three
pens along their production period (0.4, 0.55 and 1 m2). We use an average of 0.65 m2 for an animal place (Council
of the European Union, 2009).
Figure 4 European union legislation on minimum area dedicated to fattening pigs in housing farm(Council of the European Union, 2009) .
The Annual Average Population (AAP) is defined by the period per production round (days). As for the breeding
phase, the AAP of pigs is slightly lower than the available animal places. This is due to the cleaning period between
rounds and the mortality rate.
One year (365 days) divided by the production period gives the number of rounds per year. The production period
can vary greatly and is strongly connected to final animal weight and growth speed. Relevant parameters are
feed conversion ratio (FCR), daily feed intake and gross/metabolizable energy intake. These parameters are
related to the pig breed, management, and feed quality. The timespan to grow a pig in a modern intensive
fattening system to 110-120 kg from 25 kg is approximately 14-16 weeks.
3.2 Inputs The following inputs to the system need to be collected: feed, water, bedding material and energy.
3.2.1 Feed Information on feed amount and nutrient content are required as input for the calculations.
The feed inputs need to be defined as kg feed (as is) every AAP for 1 year.
Two types of feed are distinguished in the pig APS modules: compound feeds and single ingredients:
• Compound feeds are defined in the compound feed module of the APS-footprint tool. The compound
feed formulation can be defined together with inbound (from ingredient production to compounding
13 BLONK CONSULTANTS | BLONK SUSTAINABILITY TOOLS - 2021
feed mill) and outbound (from compounding feed mill to farm) transportation and energy use. The APS
default ingredient list is based on Agri-footprint 5.0 (Van Paassen et al., 2019a). Ingredients can be
uploaded upon user request.
• Single ingredient production is also based on Agri-footprint 5.0 (Van Paassen et al., 2019a). Single
ingredients include feed that are directly fed to animals without including them in a compound feed.
This usually happens when they are produced at farm. These include wet co-products (spent brewers
and distillers grain) and crops (grains, beets and legumes).
Besides the amount of different types of feed fed, some feed nutrition related characteristics have to be defined
by the user, such as: digestibility, overall gross energy (GE) intake and crude protein content in the overall diet.
Such characteristics should be calculated as a weighted average of the overall diet based on the characteristics
at product level. How these relate to the emissions modelling is explained in chapter 0.
We suggest deriving the feed input parameters (ration and characteristics) from on-farm primary data. If this is
not possible, we suggest using or developing a biophysical model able to predict the feed requirements for each
animal type. This should be based on the animal weight and growth, piglet production and animals nutritional
characteristics. The model should estimate the energy and nutritional characteristics of the outputs, model losses
(from maintenance, activity, pregnancy, manure and urine) and derive the input requirements (for more detail
look into IPCC (2006a)). A fall-back approach would be to use data available in statistics, scientific literature or to
use the available reference systems in the APS-footprint tool (described in chapter 5).
3.2.2 Water There are multiple types of water use on the pig farm. Water is consumed by the animals as drinking water.
Water is also used on the farm for management purposes like cleaning or manure management. In practice,
water can also be used for irrigation of on-farm crops. Irrigation water is already included in the background LCI,
such that the total water input on the pig farm is equal to all water use except the water used for irrigation of
crops.
3.2.3 Bedding material Bedding materials include grain straw, shredded corn stalks, wood chips, sawdust, shredded paper, etc. (source).
It needs to be defined per AAP per year.
3.2.4 Energy Electricity use is needed for many farm activities Typical activities are lighting, ventilation, air scrubbers,
automated feed and water rationing and water recirculation. Country-specific electricity sources should be
considered (usually from national averages) (FAO LEAP, 2016). If farm data are used as inputs, the specific share
for animal farming should be derived. Electricity use related to other farm activities such as cultivation or for the
house of the farm should be subtracted.
Natural gas and diesel use are mainly relevant for the piglets/sow system, maintaining temperature for piglets.
Different is the situation for fattening stage: there is no or low need for heating the production houses. Based on
the type of system, especially the manure management system, and on the level of automation, the energy input
can vary. When using farm data, take notice of not including other activities at the farm.
3.3 Outputs From the breeding phase the main outputs are reared piglets and spent sows for slaughtering. The amount of
spent sow output depends on the replacement rate (%), that needs to be multiplied by the AAP.
The output of the fattening stage is the live weight of finishing pigs.
Not all the animal considered in AAP survive the production period, therefore the amount of output should be
corrected. Dead animals cannot be commercialized as food or feed products and are removed to specific
rendering facilities. Mortality output is currently not considered in the pig APS module. We intend to include the
14 BLONK CONSULTANTS | BLONK SUSTAINABILITY TOOLS - 2021
possibility to define the output of mortalities (kg) and to model the fate of mortalities (e.g. rendering,
composting, incineration) in the future.
Another output of the system is manure, possibly mixed with bedding material. The quantification and choice of
management systems are described chapter 4.
3.3.1 Functional unit (reference unit) The LCA results are calculated per functional unit. The functional unit of the breeding system is 1 kg liveweight
of piglets to be sold. The functional unit of the fattening system is 1 kg liveweight of fattened pig for slaughter
according to the quality requirements of slaughtering in scope.
3.3.2 Allocation Allocation will be used to distribute the overall environmental impacts to the different outputs. Economic
allocation is applied. This is an inconsistency compared to the FCR Red Meat (TS Red meat FCR, 2019), that
suggest a biophysical allocation as defined in the LEAP guidelines on pig productions (FAO LEAP, 2016).
Data on price of piglets and sow live weight expressed as euro/kg are currently based on default prices.
The default approach for manure is considering it as applied to land and as a residual stream (cut-off), resulting
in no environmental burden or benefit attributed to manure. This as a default approach is suggested by the FAO
LEAP (2016). In the future, options to select different approaches will be made available (e.g. (TS Red meat FCR,
2019) boundary expansion approach or manure allocation since considered as co-product).
4. Emissions modelling The core of the pig APS modules is the calculation of the emissions. This chapter explains the emission models
implemented in the pig modules of APS-footprint.
The emissions modelled in the pig APS module are:
• Methane (CH4) from enteric fermentation;
• CH4 from manure;
• Direct dinitrogen monoxide (also called nitrous oxide) (N2O) from manure;
• Indirect N2O from leaching of manure;
• Indirect N2O from volatilization of ammonia (NH3) and nitrogen oxides (NOx);
• Non-methane volatile organic compounds (NMVOC) from manure;
• Particulate matter (TSP, PM2.5 and PM10) from manure.
In APS-footprint, the modelling of emissions is based on published and recognized guidelines, methodologies,
reports (like the one accompanying national inventory reports) or peer-reviewed scientific studies.
Leaching of nitrate (NO3 ֿ) and phosphorus (P), and emissions of heavy metals (e.g. Cu, Zn) are currently not
modelled in the pig APS modules. This is mainly because methodologies for these emissions are complex and not
well developed, and therefore, not covered by any recognized and accepted guideline. This is a large limitation
for the correctness and interpretation of impact related to marine eutrophication, freshwater eutrophication,
and toxicity related impacts. Expansions of the pig APS modules with the modelling of N and P leaching and heavy
metals is currently under development for future updates.
As extensively explained in the general methodology document (Blonk Consultants, 2020), each APS-footprint
module is designed to handle multiple emission calculation method. An APS method is a set of models that
estimate the above-mentioned emissions. This means that the LCIA of a defined animal system can be calculated
with different methodological approaches for emissions calculation. Currently, one baseline APS method is
available for the pig APS modules. This is the FCR Red Meat method that is completely based on the Red meat
15 BLONK CONSULTANTS | BLONK SUSTAINABILITY TOOLS - 2021
FCR framework (TS Red meat FCR, 2019). The FCR Red Meat is the main document of reference, since it is the
most comprehensive and recent. It uses IPCC and EEA/EMEP calculation rules to present a standardized way to
calculate not only climate change, but 16 different impact categories. The methodology also contains Blonk
Consultants specific knowledge on the subject, such as the on-farm use of emission reduction systems. The
development of other APS methods is currently investigated (e.g. APS method based on the Dutch National
Inventory Report or LEAP methodology).
The different models that compose the baseline FCR Red Meat method calculate the considered emissions based
on the parameters defined by the user plus additional default parameters.
Depending on the Tier level, the considered models calculate emissions with different approaches. The difference
between the three Tier levels can sometime be difficult to define. This is because IPCC (2006b) and EMEP/EEA
(2016) are guidelines that give indications on how countries should estimate their yearly emissions. This means
that different Tier levels can be sometimes (e.g. for direct N2O emissions) based on the same equation, but
dependent on the data input used (country-specific vs non country-specific). The APS module use parameters
defined by the users, so they can be very specific (primary data) or really generic data (proxy). In general, we
defined the Tier level as follow:
• Tier 1 emissions model: calculates the emission based on a default emissions factor (EF) that is based
on the average number of animals present on farm (e.g. kg PM2.5/pig AAP/year)
• Tier 2 emissions model: usually a two-step approach, were at first an excretion is calculated (e.g.
Nitrogen - N - excretion) based on a full or partial balance. Full balance calculations account for all input
and output flows. Partial balances simplify the model by using e.g. a default retention factor. The second
step uses one or multiple default EFs to translate the excretion into emissions (e.g. kg N2O-N /kg N
excreted)
• Tier 3 emissions model: uses complex biophysical model to estimates excretions, together with EFs that
are measured or based on more advanced country specific methodologies, compared to the defaults.
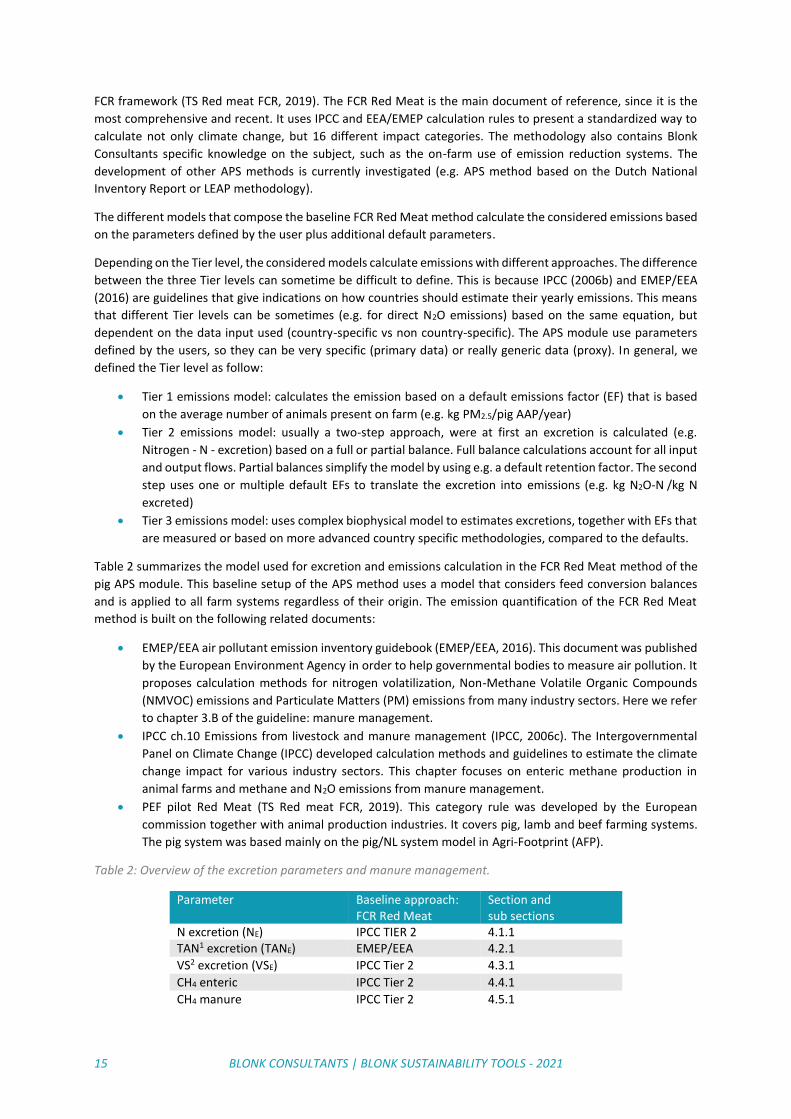
Table 2 summarizes the model used for excretion and emissions calculation in the FCR Red Meat method of the
pig APS module. This baseline setup of the APS method uses a model that considers feed conversion balances
and is applied to all farm systems regardless of their origin. The emission quantification of the FCR Red Meat
method is built on the following related documents:
• EMEP/EEA air pollutant emission inventory guidebook (EMEP/EEA, 2016). This document was published
by the European Environment Agency in order to help governmental bodies to measure air pollution. It
proposes calculation methods for nitrogen volatilization, Non-Methane Volatile Organic Compounds
(NMVOC) emissions and Particulate Matters (PM) emissions from many industry sectors. Here we refer
to chapter 3.B of the guideline: manure management.
• IPCC ch.10 Emissions from livestock and manure management (IPCC, 2006c). The Intergovernmental
Panel on Climate Change (IPCC) developed calculation methods and guidelines to estimate the climate
change impact for various industry sectors. This chapter focuses on enteric methane production in
animal farms and methane and N2O emissions from manure management.
• PEF pilot Red Meat (TS Red meat FCR, 2019). This category rule was developed by the European
commission together with animal production industries. It covers pig, lamb and beef farming systems.
The pig system was based mainly on the pig/NL system model in Agri-Footprint (AFP).
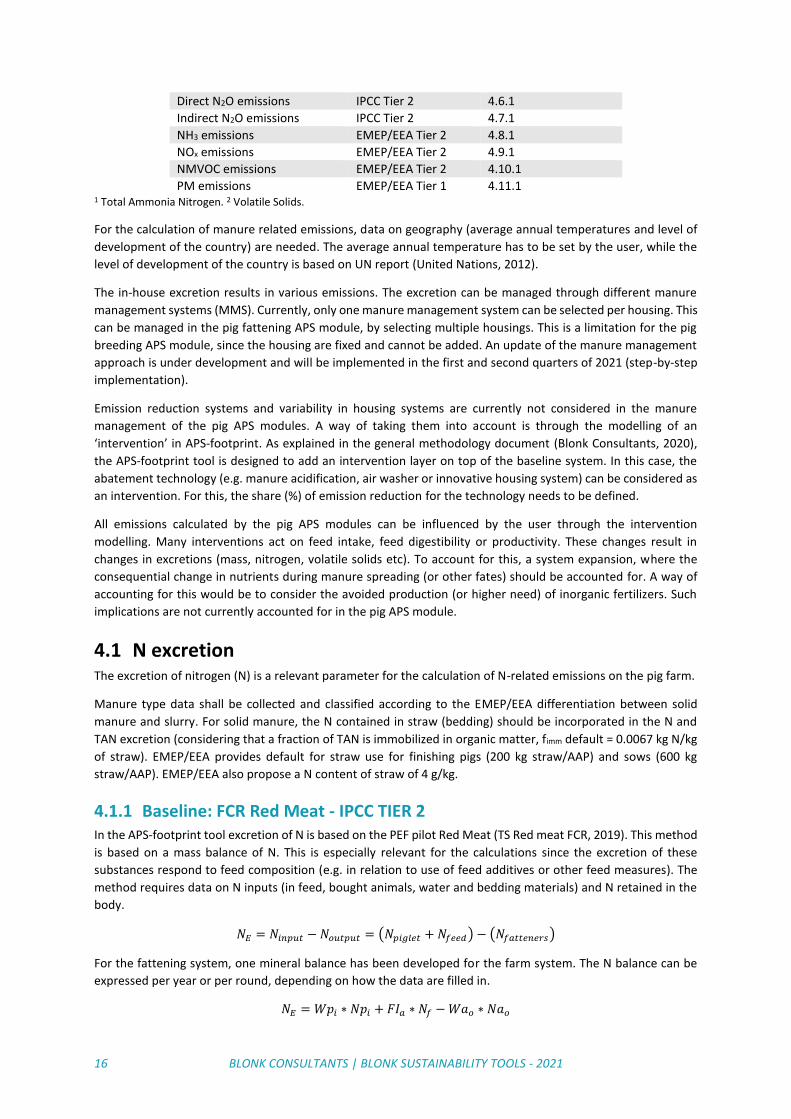
Table 2: Overview of the excretion parameters and manure management.
Parameter Baseline approach: FCR Red Meat
Section and sub sections
N excretion (NE) IPCC TIER 2 4.1.1 TAN1 excretion (TANE) EMEP/EEA 4.2.1
VS2 excretion (VSE) IPCC Tier 2 4.3.1
CH4 enteric IPCC Tier 2 4.4.1
CH4 manure IPCC Tier 2 4.5.1
16 BLONK CONSULTANTS | BLONK SUSTAINABILITY TOOLS - 2021
Direct N2O emissions IPCC Tier 2 4.6.1
Indirect N2O emissions IPCC Tier 2 4.7.1
NH3 emissions EMEP/EEA Tier 2 4.8.1
NOx emissions EMEP/EEA Tier 2 4.9.1
NMVOC emissions EMEP/EEA Tier 2 4.10.1
PM emissions EMEP/EEA Tier 1 4.11.1 1 Total Ammonia Nitrogen. 2 Volatile Solids.
For the calculation of manure related emissions, data on geography (average annual temperatures and level of
development of the country) are needed. The average annual temperature has to be set by the user, while the
level of development of the country is based on UN report (United Nations, 2012).
The in-house excretion results in various emissions. The excretion can be managed through different manure
management systems (MMS). Currently, only one manure management system can be selected per housing. This
can be managed in the pig fattening APS module, by selecting multiple housings. This is a limitation for the pig
breeding APS module, since the housing are fixed and cannot be added. An update of the manure management
approach is under development and will be implemented in the first and second quarters of 2021 (step-by-step
implementation).
Emission reduction systems and variability in housing systems are currently not considered in the manure
management of the pig APS modules. A way of taking them into account is through the modelling of an
‘intervention’ in APS-footprint. As explained in the general methodology document (Blonk Consultants, 2020),
the APS-footprint tool is designed to add an intervention layer on top of the baseline system. In this case, the
abatement technology (e.g. manure acidification, air washer or innovative housing system) can be considered as
an intervention. For this, the share (%) of emission reduction for the technology needs to be defined.
All emissions calculated by the pig APS modules can be influenced by the user through the intervention
modelling. Many interventions act on feed intake, feed digestibility or productivity. These changes result in
changes in excretions (mass, nitrogen, volatile solids etc). To account for this, a system expansion, where the
consequential change in nutrients during manure spreading (or other fates) should be accounted for. A way of
accounting for this would be to consider the avoided production (or higher need) of inorganic fertilizers. Such
implications are not currently accounted for in the pig APS module.
4.1 N excretion The excretion of nitrogen (N) is a relevant parameter for the calculation of N-related emissions on the pig farm.
Manure type data shall be collected and classified according to the EMEP/EEA differentiation between solid
manure and slurry. For solid manure, the N contained in straw (bedding) should be incorporated in the N and
TAN excretion (considering that a fraction of TAN is immobilized in organic matter, fimm default = 0.0067 kg N/kg
of straw). EMEP/EEA provides default for straw use for finishing pigs (200 kg straw/AAP) and sows (600 kg
straw/AAP). EMEP/EEA also propose a N content of straw of 4 g/kg.
4.1.1 Baseline: FCR Red Meat - IPCC TIER 2 In the APS-footprint tool excretion of N is based on the PEF pilot Red Meat (TS Red meat FCR, 2019). This method
is based on a mass balance of N. This is especially relevant for the calculations since the excretion of these
substances respond to feed composition (e.g. in relation to use of feed additives or other feed measures). The
method requires data on N inputs (in feed, bought animals, water and bedding materials) and N retained in the
body.
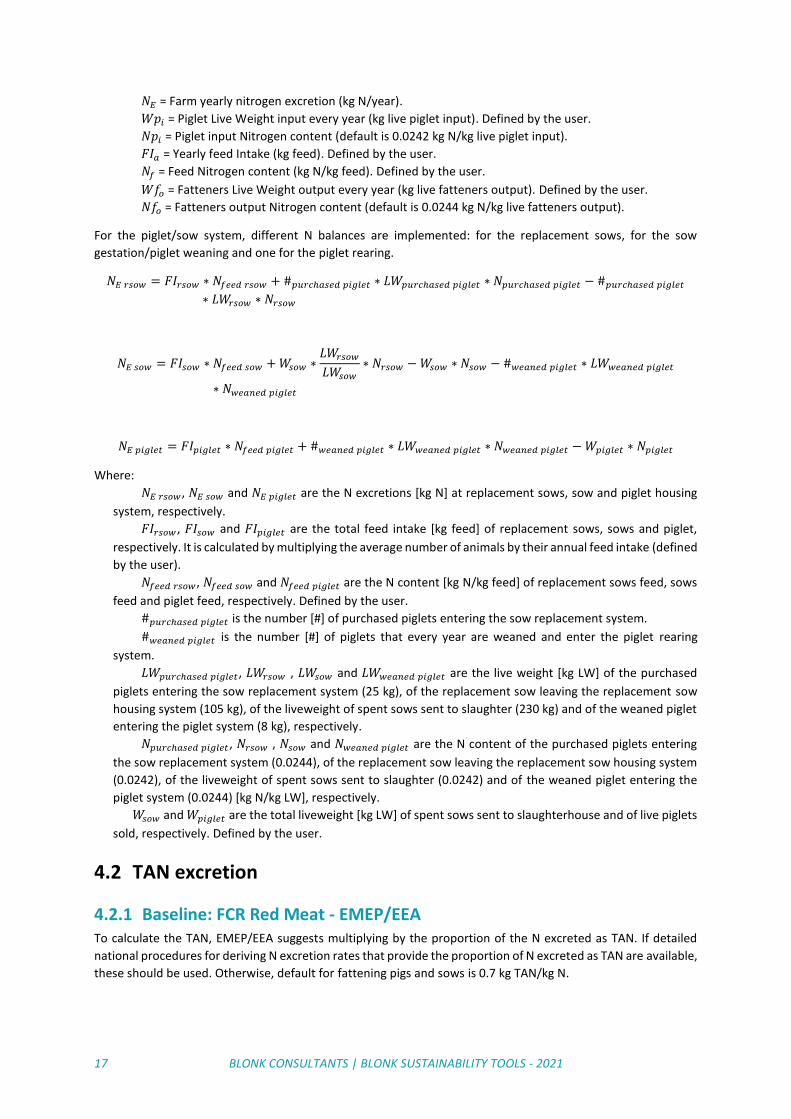
𝑁𝐸 = 𝑁𝑖𝑛𝑝𝑢𝑡 − 𝑁𝑜𝑢𝑡𝑝𝑢𝑡 = (𝑁𝑝𝑖𝑔𝑙𝑒𝑡 + 𝑁𝑓𝑒𝑒𝑑) − (𝑁𝑓𝑎𝑡𝑡𝑒𝑛𝑒𝑟𝑠)
For the fattening system, one mineral balance has been developed for the farm system. The N balance can be
expressed per year or per round, depending on how the data are filled in.
𝑁𝐸 = 𝑊𝑝𝑖 ∗ 𝑁𝑝𝑖 + 𝐹𝐼𝑎 ∗ 𝑁𝑓 − 𝑊𝑎𝑜 ∗ 𝑁𝑎𝑜
17 BLONK CONSULTANTS | BLONK SUSTAINABILITY TOOLS - 2021
𝑁𝐸 = Farm yearly nitrogen excretion (kg N/year).
𝑊𝑝𝑖 = Piglet Live Weight input every year (kg live piglet input). Defined by the user.
𝑁𝑝𝑖 = Piglet input Nitrogen content (default is 0.0242 kg N/kg live piglet input).
𝐹𝐼𝑎 = Yearly feed Intake (kg feed). Defined by the user.
𝑁𝑓 = Feed Nitrogen content (kg N/kg feed). Defined by the user.
𝑊𝑓𝑜 = Fatteners Live Weight output every year (kg live fatteners output). Defined by the user.
𝑁𝑓𝑜 = Fatteners output Nitrogen content (default is 0.0244 kg N/kg live fatteners output).
For the piglet/sow system, different N balances are implemented: for the replacement sows, for the sow
gestation/piglet weaning and one for the piglet rearing.
𝑁𝐸 𝑟𝑠𝑜𝑤 = 𝐹𝐼𝑟𝑠𝑜𝑤 ∗ 𝑁𝑓𝑒𝑒𝑑 𝑟𝑠𝑜𝑤 + #𝑝𝑢𝑟𝑐ℎ𝑎𝑠𝑒𝑑 𝑝𝑖𝑔𝑙𝑒𝑡 ∗ 𝐿𝑊𝑝𝑢𝑟𝑐ℎ𝑎𝑠𝑒𝑑 𝑝𝑖𝑔𝑙𝑒𝑡 ∗ 𝑁𝑝𝑢𝑟𝑐ℎ𝑎𝑠𝑒𝑑 𝑝𝑖𝑔𝑙𝑒𝑡 − #𝑝𝑢𝑟𝑐ℎ𝑎𝑠𝑒𝑑 𝑝𝑖𝑔𝑙𝑒𝑡
∗ 𝐿𝑊𝑟𝑠𝑜𝑤 ∗ 𝑁𝑟𝑠𝑜𝑤
𝑁𝐸 𝑠𝑜𝑤 = 𝐹𝐼𝑠𝑜𝑤 ∗ 𝑁𝑓𝑒𝑒𝑑 𝑠𝑜𝑤 + 𝑊𝑠𝑜𝑤 ∗𝐿𝑊𝑟𝑠𝑜𝑤
𝐿𝑊𝑠𝑜𝑤
∗ 𝑁𝑟𝑠𝑜𝑤 − 𝑊𝑠𝑜𝑤 ∗ 𝑁𝑠𝑜𝑤 − #𝑤𝑒𝑎𝑛𝑒𝑑 𝑝𝑖𝑔𝑙𝑒𝑡 ∗ 𝐿𝑊𝑤𝑒𝑎𝑛𝑒𝑑 𝑝𝑖𝑔𝑙𝑒𝑡
∗ 𝑁𝑤𝑒𝑎𝑛𝑒𝑑 𝑝𝑖𝑔𝑙𝑒𝑡
𝑁𝐸 𝑝𝑖𝑔𝑙𝑒𝑡 = 𝐹𝐼𝑝𝑖𝑔𝑙𝑒𝑡 ∗ 𝑁𝑓𝑒𝑒𝑑 𝑝𝑖𝑔𝑙𝑒𝑡 + #𝑤𝑒𝑎𝑛𝑒𝑑 𝑝𝑖𝑔𝑙𝑒𝑡 ∗ 𝐿𝑊𝑤𝑒𝑎𝑛𝑒𝑑 𝑝𝑖𝑔𝑙𝑒𝑡 ∗ 𝑁𝑤𝑒𝑎𝑛𝑒𝑑 𝑝𝑖𝑔𝑙𝑒𝑡 − 𝑊𝑝𝑖𝑔𝑙𝑒𝑡 ∗ 𝑁𝑝𝑖𝑔𝑙𝑒𝑡
Where:
𝑁𝐸 𝑟𝑠𝑜𝑤, 𝑁𝐸 𝑠𝑜𝑤 and 𝑁𝐸 𝑝𝑖𝑔𝑙𝑒𝑡 are the N excretions [kg N] at replacement sows, sow and piglet housing
system, respectively.
𝐹𝐼𝑟𝑠𝑜𝑤 , 𝐹𝐼𝑠𝑜𝑤 and 𝐹𝐼𝑝𝑖𝑔𝑙𝑒𝑡 are the total feed intake [kg feed] of replacement sows, sows and piglet,
respectively. It is calculated by multiplying the average number of animals by their annual feed intake (defined
by the user).
𝑁𝑓𝑒𝑒𝑑 𝑟𝑠𝑜𝑤, 𝑁𝑓𝑒𝑒𝑑 𝑠𝑜𝑤 and 𝑁𝑓𝑒𝑒𝑑 𝑝𝑖𝑔𝑙𝑒𝑡 are the N content [kg N/kg feed] of replacement sows feed, sows
feed and piglet feed, respectively. Defined by the user.
#𝑝𝑢𝑟𝑐ℎ𝑎𝑠𝑒𝑑 𝑝𝑖𝑔𝑙𝑒𝑡 is the number [#] of purchased piglets entering the sow replacement system.
#𝑤𝑒𝑎𝑛𝑒𝑑 𝑝𝑖𝑔𝑙𝑒𝑡 is the number [#] of piglets that every year are weaned and enter the piglet rearing
system.
𝐿𝑊𝑝𝑢𝑟𝑐ℎ𝑎𝑠𝑒𝑑 𝑝𝑖𝑔𝑙𝑒𝑡, 𝐿𝑊𝑟𝑠𝑜𝑤 , 𝐿𝑊𝑠𝑜𝑤 and 𝐿𝑊𝑤𝑒𝑎𝑛𝑒𝑑 𝑝𝑖𝑔𝑙𝑒𝑡 are the live weight [kg LW] of the purchased
piglets entering the sow replacement system (25 kg), of the replacement sow leaving the replacement sow
housing system (105 kg), of the liveweight of spent sows sent to slaughter (230 kg) and of the weaned piglet
entering the piglet system (8 kg), respectively.
𝑁𝑝𝑢𝑟𝑐ℎ𝑎𝑠𝑒𝑑 𝑝𝑖𝑔𝑙𝑒𝑡 , 𝑁𝑟𝑠𝑜𝑤 , 𝑁𝑠𝑜𝑤 and 𝑁𝑤𝑒𝑎𝑛𝑒𝑑 𝑝𝑖𝑔𝑙𝑒𝑡 are the N content of the purchased piglets entering
the sow replacement system (0.0244), of the replacement sow leaving the replacement sow housing system
(0.0242), of the liveweight of spent sows sent to slaughter (0.0242) and of the weaned piglet entering the
piglet system (0.0244) [kg N/kg LW], respectively.
𝑊𝑠𝑜𝑤 and 𝑊𝑝𝑖𝑔𝑙𝑒𝑡 are the total liveweight [kg LW] of spent sows sent to slaughterhouse and of live piglets
sold, respectively. Defined by the user.
4.2 TAN excretion
4.2.1 Baseline: FCR Red Meat - EMEP/EEA To calculate the TAN, EMEP/EEA suggests multiplying by the proportion of the N excreted as TAN. If detailed
national procedures for deriving N excretion rates that provide the proportion of N excreted as TAN are available,
these should be used. Otherwise, default for fattening pigs and sows is 0.7 kg TAN/kg N.
18 BLONK CONSULTANTS | BLONK SUSTAINABILITY TOOLS - 2021
4.3 VS excretion
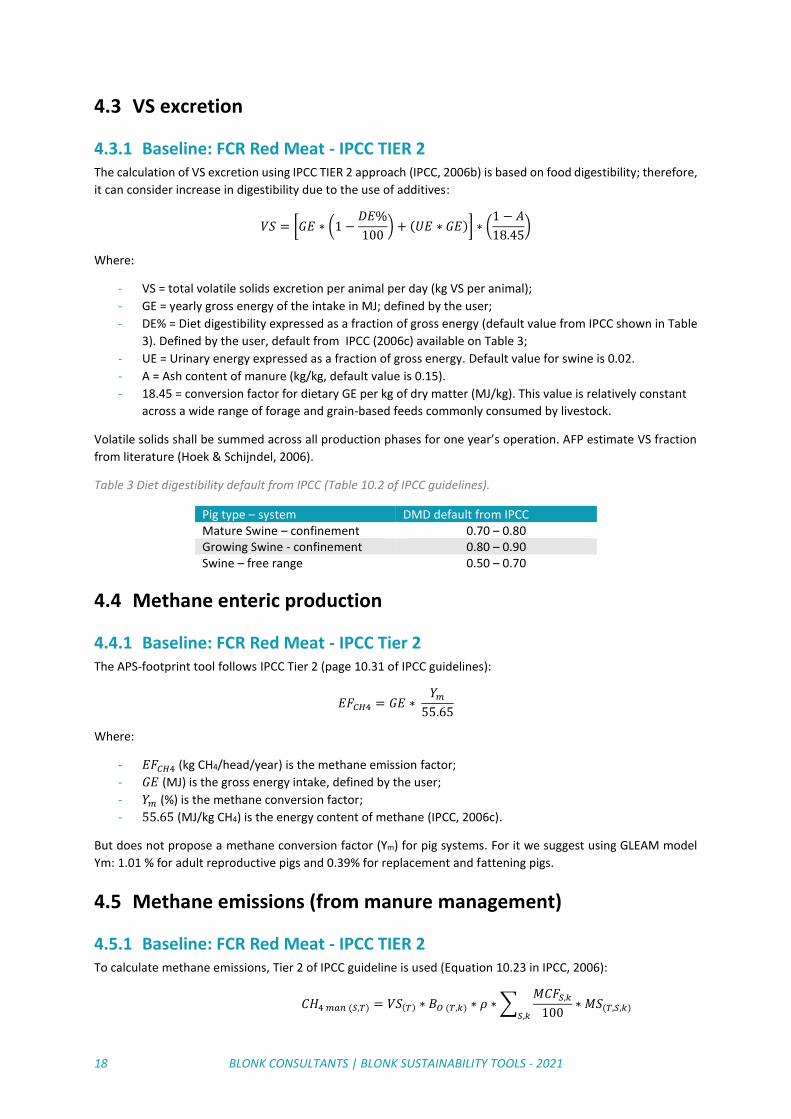
4.3.1 Baseline: FCR Red Meat - IPCC TIER 2 The calculation of VS excretion using IPCC TIER 2 approach (IPCC, 2006b) is based on food digestibility; therefore,
it can consider increase in digestibility due to the use of additives:
𝑉𝑆 = [𝐺𝐸 ∗ (1 −𝐷𝐸%
100) + (𝑈𝐸 ∗ 𝐺𝐸)] ∗ (
1 − 𝐴
18.45)
Where:
- VS = total volatile solids excretion per animal per day (kg VS per animal);
- GE = yearly gross energy of the intake in MJ; defined by the user;
- DE% = Diet digestibility expressed as a fraction of gross energy (default value from IPCC shown in Table
3). Defined by the user, default from IPCC (2006c) available on Table 3;
- UE = Urinary energy expressed as a fraction of gross energy. Default value for swine is 0.02.
- A = Ash content of manure (kg/kg, default value is 0.15).
- 18.45 = conversion factor for dietary GE per kg of dry matter (MJ/kg). This value is relatively constant
across a wide range of forage and grain-based feeds commonly consumed by livestock.
Volatile solids shall be summed across all production phases for one year’s operation. AFP estimate VS fraction
from literature (Hoek & Schijndel, 2006).
Table 3 Diet digestibility default from IPCC (Table 10.2 of IPCC guidelines).
Pig type – system DMD default from IPCC Mature Swine – confinement 0.70 – 0.80 Growing Swine - confinement 0.80 – 0.90 Swine – free range 0.50 – 0.70
4.4 Methane enteric production
4.4.1 Baseline: FCR Red Meat - IPCC Tier 2 The APS-footprint tool follows IPCC Tier 2 (page 10.31 of IPCC guidelines):
𝐸𝐹𝐶𝐻4 = 𝐺𝐸 ∗ 𝑌𝑚
55.65
Where:
- 𝐸𝐹𝐶𝐻4 (kg CH4/head/year) is the methane emission factor;
- 𝐺𝐸 (MJ) is the gross energy intake, defined by the user;
- 𝑌𝑚 (%) is the methane conversion factor;
- 55.65 (MJ/kg CH4) is the energy content of methane (IPCC, 2006c).
But does not propose a methane conversion factor (Ym) for pig systems. For it we suggest using GLEAM model
Ym: 1.01 % for adult reproductive pigs and 0.39% for replacement and fattening pigs.
4.5 Methane emissions (from manure management)
4.5.1 Baseline: FCR Red Meat - IPCC TIER 2 To calculate methane emissions, Tier 2 of IPCC guideline is used (Equation 10.23 in IPCC, 2006):
𝐶𝐻4 𝑚𝑎𝑛 (𝑆,𝑇) = 𝑉𝑆(𝑇) ∗ 𝐵𝑂 (𝑇,𝑘) ∗ 𝜌 ∗ ∑𝑀𝐶𝐹𝑆,𝑘
100𝑆,𝑘∗ 𝑀𝑆(𝑇,𝑆,𝑘)
19 BLONK CONSULTANTS | BLONK SUSTAINABILITY TOOLS - 2021
Where:
- 𝐶𝐻4 𝑚𝑎𝑛 (𝑇) is the yearly methane emission from manure management S per animal type T (kg year-
1);
- 𝑉𝑆(𝑇) is the amount of yearly volatile solids per animal type T (kg year-1) (chapter 4.3.1);
- 𝐵𝑂 (𝑇) is the maximum emissions potential (m3-CH4 kg-VS-1) ((provided in Table 10A-7 and Table
10A-8 Of IPCC guideline: 0.48 for north American pig/sow, 0.45 for sow/pigs in Europe and Oceania,
0.29 for the rest of the world);
- 𝑀𝐶𝐹𝑆,𝑘 is the integrated methane conversion factor (provided in IPCC (2006a) Table 10.17: lagoon
66-80%, liquid/slurry 17-80%, solid storage 2-5%, drylot 1-2%, pit <1month 3-30%, pit >1month 17-
80%, daily spread 0,1-1%, digester 10%, other 1%);
- ρ is the density of methane (0.67 kg CH4/m3) (IPCC, 2006a);
- 𝑀𝑆(𝑇,𝑆,𝑘) is the fraction of manure (from livestock type T and in climate region k) handled using a
specific manure management system.
Since the MCF parameter is based on temperature, information on geographical location of the farm are
required.
Currently only one manure management system can be selected. In the future, if different manure management
systems are in place, the VS should be redistributed accordingly to the share of management system, using then
the specific MCF. With this method, no other disposal of manure (landfill, compost etc..) are considered.
4.6 Direct N2O emissions
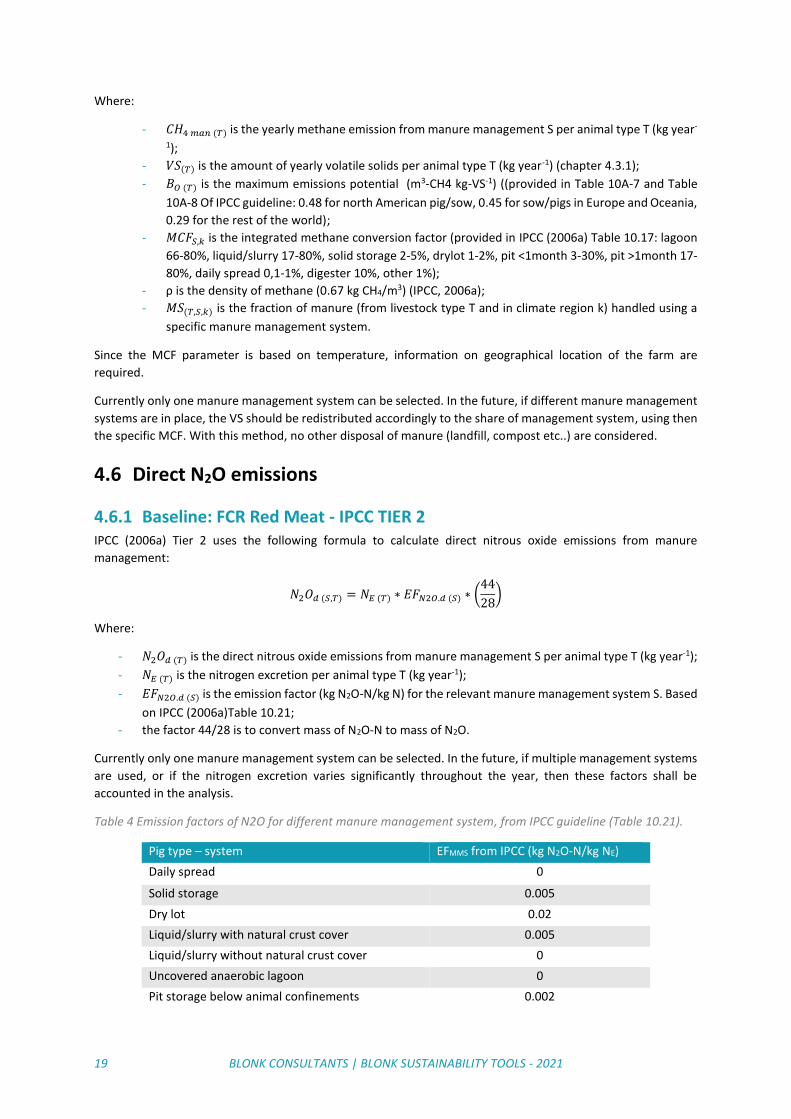
4.6.1 Baseline: FCR Red Meat - IPCC TIER 2 IPCC (2006a) Tier 2 uses the following formula to calculate direct nitrous oxide emissions from manure
management:
𝑁2𝑂𝑑 (𝑆,𝑇) = 𝑁𝐸 (𝑇) ∗ 𝐸𝐹𝑁2𝑂.𝑑 (𝑆) ∗ (44
28)
Where:
- 𝑁2𝑂𝑑 (𝑇) is the direct nitrous oxide emissions from manure management S per animal type T (kg year-1);
- 𝑁𝐸 (𝑇) is the nitrogen excretion per animal type T (kg year-1);
- 𝐸𝐹𝑁2𝑂.𝑑 (𝑆) is the emission factor (kg N2O-N/kg N) for the relevant manure management system S. Based
on IPCC (2006a)Table 10.21;
- the factor 44/28 is to convert mass of N2O-N to mass of N2O.
Currently only one manure management system can be selected. In the future, if multiple management systems
are used, or if the nitrogen excretion varies significantly throughout the year, then these factors shall be
accounted in the analysis.
Table 4 Emission factors of N2O for different manure management system, from IPCC guideline (Table 10.21).
Pig type – system EFMMS from IPCC (kg N2O-N/kg NE)
Daily spread 0
Solid storage 0.005
Dry lot 0.02
Liquid/slurry with natural crust cover 0.005
Liquid/slurry without natural crust cover 0
Uncovered anaerobic lagoon 0
Pit storage below animal confinements 0.002
20 BLONK CONSULTANTS | BLONK SUSTAINABILITY TOOLS - 2021
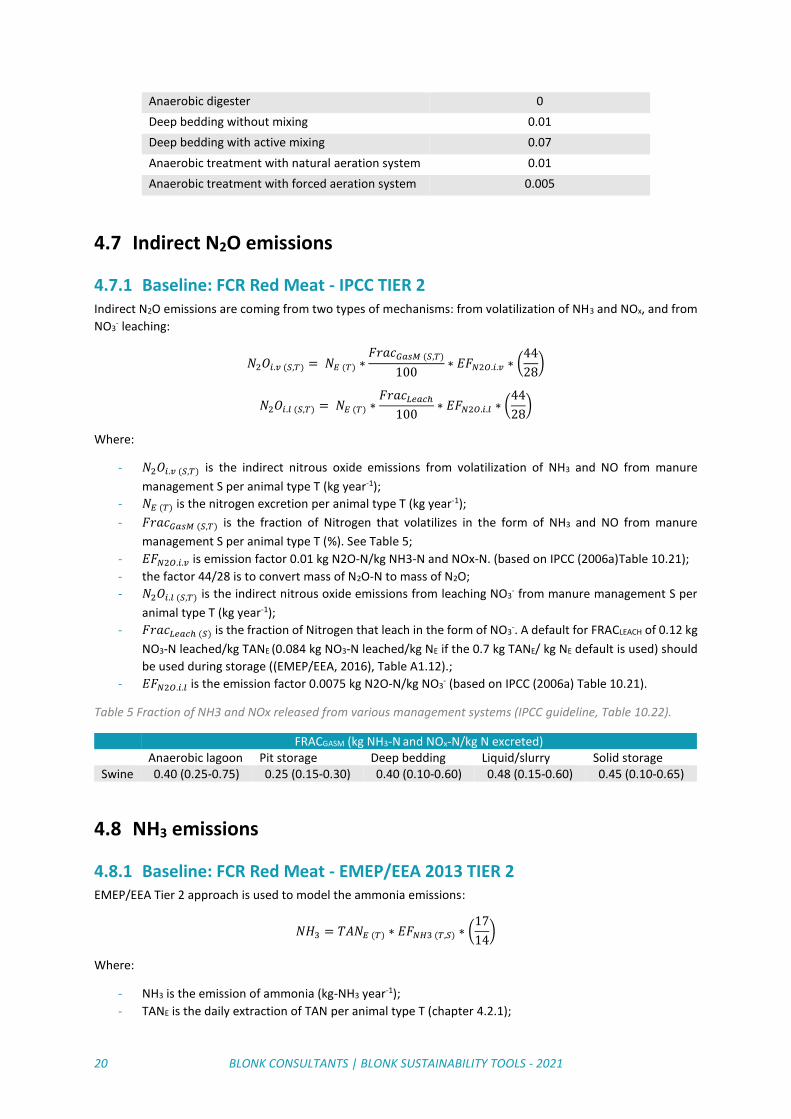
Anaerobic digester 0
Deep bedding without mixing 0.01
Deep bedding with active mixing 0.07
Anaerobic treatment with natural aeration system 0.01
Anaerobic treatment with forced aeration system 0.005
4.7 Indirect N2O emissions
4.7.1 Baseline: FCR Red Meat - IPCC TIER 2 Indirect N2O emissions are coming from two types of mechanisms: from volatilization of NH3 and NOx, and from
NO3- leaching:
𝑁2𝑂𝑖.𝑣 (𝑆,𝑇) = 𝑁𝐸 (𝑇) ∗𝐹𝑟𝑎𝑐𝐺𝑎𝑠𝑀 (𝑆,𝑇)
100∗ 𝐸𝐹𝑁2𝑂.𝑖.𝑣 ∗ (
44
28)
𝑁2𝑂𝑖.𝑙 (𝑆,𝑇) = 𝑁𝐸 (𝑇) ∗𝐹𝑟𝑎𝑐𝐿𝑒𝑎𝑐ℎ
100∗ 𝐸𝐹𝑁2𝑂.𝑖.𝑙 ∗ (
44
28)
Where:
- 𝑁2𝑂𝑖.𝑣 (𝑆,𝑇) is the indirect nitrous oxide emissions from volatilization of NH3 and NO from manure
management S per animal type T (kg year-1);
- 𝑁𝐸 (𝑇) is the nitrogen excretion per animal type T (kg year-1);
- 𝐹𝑟𝑎𝑐𝐺𝑎𝑠𝑀 (𝑆,𝑇) is the fraction of Nitrogen that volatilizes in the form of NH3 and NO from manure
management S per animal type T (%). See Table 5;
- 𝐸𝐹𝑁2𝑂.𝑖.𝑣 is emission factor 0.01 kg N2O-N/kg NH3-N and NOx-N. (based on IPCC (2006a)Table 10.21);
- the factor 44/28 is to convert mass of N2O-N to mass of N2O;
- 𝑁2𝑂𝑖.𝑙 (𝑆,𝑇) is the indirect nitrous oxide emissions from leaching NO3- from manure management S per
animal type T (kg year-1);
- 𝐹𝑟𝑎𝑐𝐿𝑒𝑎𝑐ℎ (𝑆) is the fraction of Nitrogen that leach in the form of NO3-. A default for FRACLEACH of 0.12 kg
NO3-N leached/kg TANE (0.084 kg NO3-N leached/kg NE if the 0.7 kg TANE/ kg NE default is used) should
be used during storage ((EMEP/EEA, 2016), Table A1.12).;
- 𝐸𝐹𝑁2𝑂.𝑖.𝑙 is the emission factor 0.0075 kg N2O-N/kg NO3- (based on IPCC (2006a) Table 10.21).
Table 5 Fraction of NH3 and NOx released from various management systems (IPCC guideline, Table 10.22).
FRACGASM (kg NH3-N and NOx-N/kg N excreted) Anaerobic lagoon Pit storage Deep bedding Liquid/slurry Solid storage Swine 0.40 (0.25-0.75) 0.25 (0.15-0.30) 0.40 (0.10-0.60) 0.48 (0.15-0.60) 0.45 (0.10-0.65)
4.8 NH3 emissions
4.8.1 Baseline: FCR Red Meat - EMEP/EEA 2013 TIER 2 EMEP/EEA Tier 2 approach is used to model the ammonia emissions:
𝑁𝐻3 = 𝑇𝐴𝑁𝐸 (𝑇) ∗ 𝐸𝐹𝑁𝐻3 (𝑇,𝑆) ∗ (17
14)
Where:
- NH3 is the emission of ammonia (kg-NH3 year-1);
- TANE is the daily extraction of TAN per animal type T (chapter 4.2.1);
21 BLONK CONSULTANTS | BLONK SUSTAINABILITY TOOLS - 2021
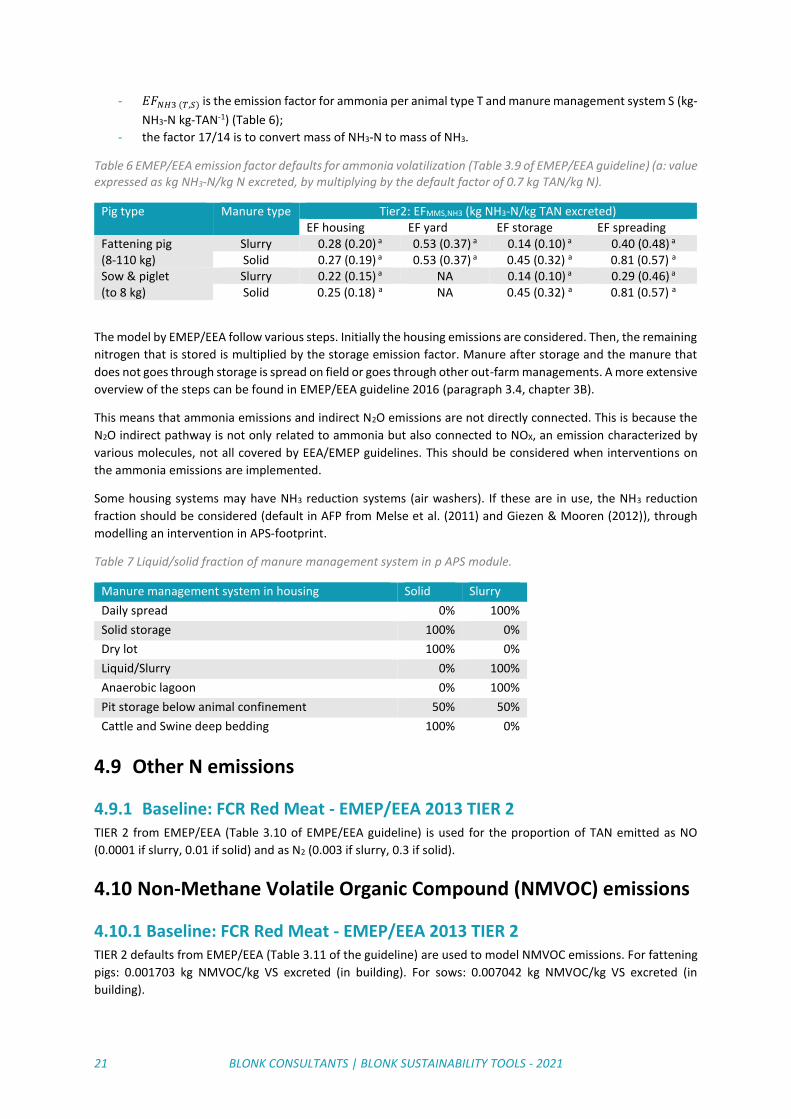
- 𝐸𝐹𝑁𝐻3 (𝑇,𝑆) is the emission factor for ammonia per animal type T and manure management system S (kg-
NH3-N kg-TAN-1) (Table 6);
- the factor 17/14 is to convert mass of NH3-N to mass of NH3.
Table 6 EMEP/EEA emission factor defaults for ammonia volatilization (Table 3.9 of EMEP/EEA guideline) (a: value expressed as kg NH3-N/kg N excreted, by multiplying by the default factor of 0.7 kg TAN/kg N).
Pig type Manure type Tier2: EFMMS,NH3 (kg NH3-N/kg TAN excreted) EF housing EF yard EF storage EF spreading
Fattening pig (8-110 kg)
Slurry 0.28 (0.20) a 0.53 (0.37) a 0.14 (0.10) a 0.40 (0.48) a Solid 0.27 (0.19) a 0.53 (0.37) a 0.45 (0.32) a 0.81 (0.57) a
Sow & piglet (to 8 kg)
Slurry 0.22 (0.15) a NA 0.14 (0.10) a 0.29 (0.46) a Solid 0.25 (0.18) a NA 0.45 (0.32) a 0.81 (0.57) a
The model by EMEP/EEA follow various steps. Initially the housing emissions are considered. Then, the remaining
nitrogen that is stored is multiplied by the storage emission factor. Manure after storage and the manure that
does not goes through storage is spread on field or goes through other out-farm managements. A more extensive
overview of the steps can be found in EMEP/EEA guideline 2016 (paragraph 3.4, chapter 3B).
This means that ammonia emissions and indirect N2O emissions are not directly connected. This is because the
N2O indirect pathway is not only related to ammonia but also connected to NOX, an emission characterized by
various molecules, not all covered by EEA/EMEP guidelines. This should be considered when interventions on
the ammonia emissions are implemented.
Some housing systems may have NH3 reduction systems (air washers). If these are in use, the NH3 reduction
fraction should be considered (default in AFP from Melse et al. (2011) and Giezen & Mooren (2012)), through
modelling an intervention in APS-footprint.
Table 7 Liquid/solid fraction of manure management system in p APS module.
Manure management system in housing Solid Slurry
Daily spread 0% 100%
Solid storage 100% 0%
Dry lot 100% 0%
Liquid/Slurry 0% 100%
Anaerobic lagoon 0% 100%
Pit storage below animal confinement 50% 50%
Cattle and Swine deep bedding 100% 0%
4.9 Other N emissions
4.9.1 Baseline: FCR Red Meat - EMEP/EEA 2013 TIER 2 TIER 2 from EMEP/EEA (Table 3.10 of EMPE/EEA guideline) is used for the proportion of TAN emitted as NO
(0.0001 if slurry, 0.01 if solid) and as N2 (0.003 if slurry, 0.3 if solid).
4.10 Non-Methane Volatile Organic Compound (NMVOC) emissions
4.10.1 Baseline: FCR Red Meat - EMEP/EEA 2013 TIER 2 TIER 2 defaults from EMEP/EEA (Table 3.11 of the guideline) are used to model NMVOC emissions. For fattening
pigs: 0.001703 kg NMVOC/kg VS excreted (in building). For sows: 0.007042 kg NMVOC/kg VS excreted (in
building).
22 BLONK CONSULTANTS | BLONK SUSTAINABILITY TOOLS - 2021
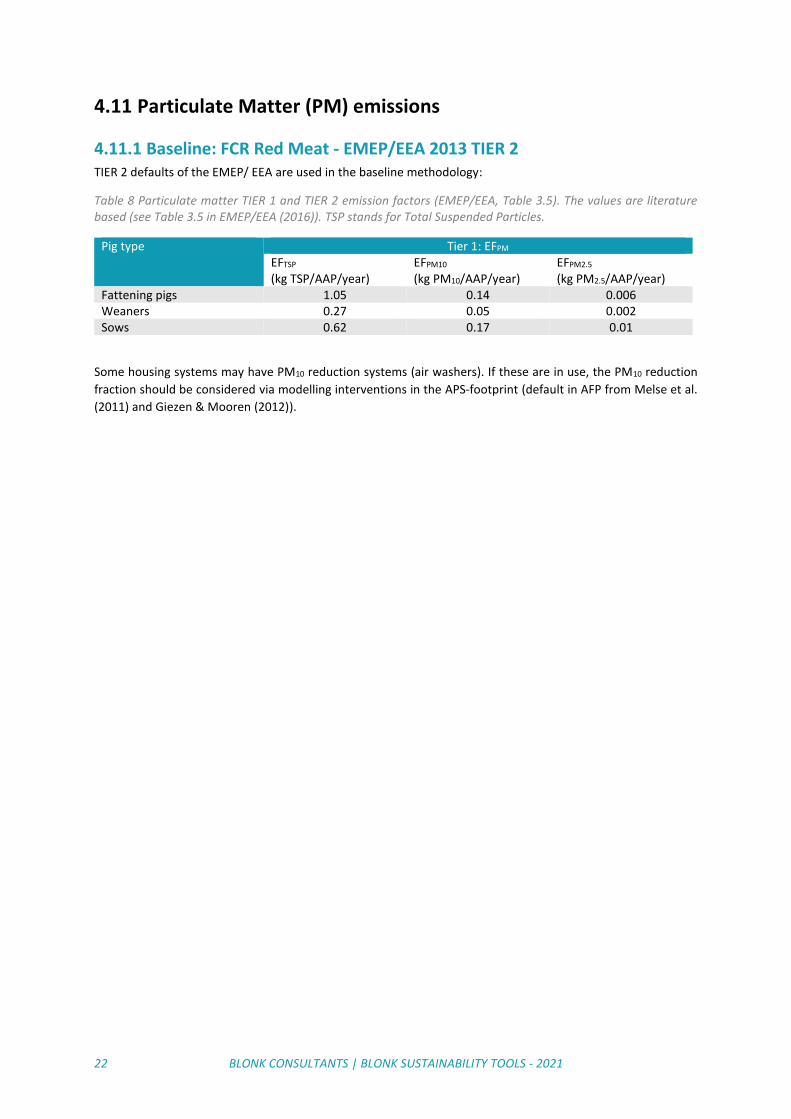
4.11 Particulate Matter (PM) emissions
4.11.1 Baseline: FCR Red Meat - EMEP/EEA 2013 TIER 2 TIER 2 defaults of the EMEP/ EEA are used in the baseline methodology:
Table 8 Particulate matter TIER 1 and TIER 2 emission factors (EMEP/EEA, Table 3.5). The values are literature based (see Table 3.5 in EMEP/EEA (2016)). TSP stands for Total Suspended Particles.
Pig type Tier 1: EFPM EFTSP
(kg TSP/AAP/year) EFPM10
(kg PM10/AAP/year) EFPM2.5
(kg PM2.5/AAP/year) Fattening pigs 1.05 0.14 0.006 Weaners 0.27 0.05 0.002 Sows 0.62 0.17 0.01
Some housing systems may have PM10 reduction systems (air washers). If these are in use, the PM10 reduction
fraction should be considered via modelling interventions in the APS-footprint (default in AFP from Melse et al.
(2011) and Giezen & Mooren (2012)).
23 BLONK CONSULTANTS | BLONK SUSTAINABILITY TOOLS - 2021
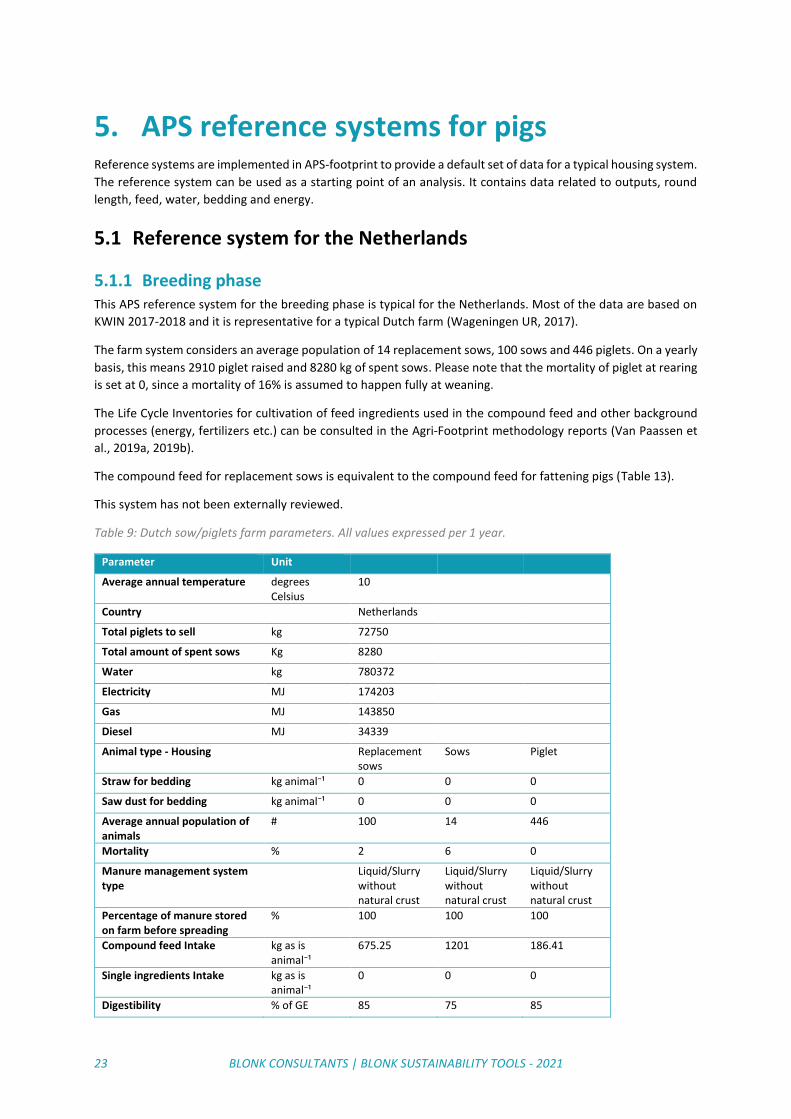
5. APS reference systems for pigs Reference systems are implemented in APS-footprint to provide a default set of data for a typical housing system.
The reference system can be used as a starting point of an analysis. It contains data related to outputs, round
length, feed, water, bedding and energy.
5.1 Reference system for the Netherlands
5.1.1 Breeding phase This APS reference system for the breeding phase is typical for the Netherlands. Most of the data are based on
KWIN 2017-2018 and it is representative for a typical Dutch farm (Wageningen UR, 2017).
The farm system considers an average population of 14 replacement sows, 100 sows and 446 piglets. On a yearly
basis, this means 2910 piglet raised and 8280 kg of spent sows. Please note that the mortality of piglet at rearing
is set at 0, since a mortality of 16% is assumed to happen fully at weaning.
The Life Cycle Inventories for cultivation of feed ingredients used in the compound feed and other background
processes (energy, fertilizers etc.) can be consulted in the Agri-Footprint methodology reports (Van Paassen et
al., 2019a, 2019b).
The compound feed for replacement sows is equivalent to the compound feed for fattening pigs (Table 13).
This system has not been externally reviewed.
Table 9: Dutch sow/piglets farm parameters. All values expressed per 1 year.
Parameter Unit
Average annual temperature degrees Celsius
10
Country
Netherlands
Total piglets to sell kg 72750
Total amount of spent sows Kg 8280
Water kg 780372
Electricity MJ 174203
Gas MJ 143850
Diesel MJ 34339
Animal type - Housing
Replacement sows
Sows Piglet
Straw for bedding kg animal⁻¹ 0 0 0
Saw dust for bedding kg animal⁻¹ 0 0 0
Average annual population of animals
# 100 14 446
Mortality % 2 6 0
Manure management system type
Liquid/Slurry without natural crust
Liquid/Slurry without natural crust
Liquid/Slurry without natural crust
Percentage of manure stored on farm before spreading
% 100 100 100
Compound feed Intake kg as is animal⁻¹
675.25 1201 186.41
Single ingredients Intake kg as is animal⁻¹
0 0 0
Digestibility % of GE 85 75 85
24 BLONK CONSULTANTS | BLONK SUSTAINABILITY TOOLS - 2021
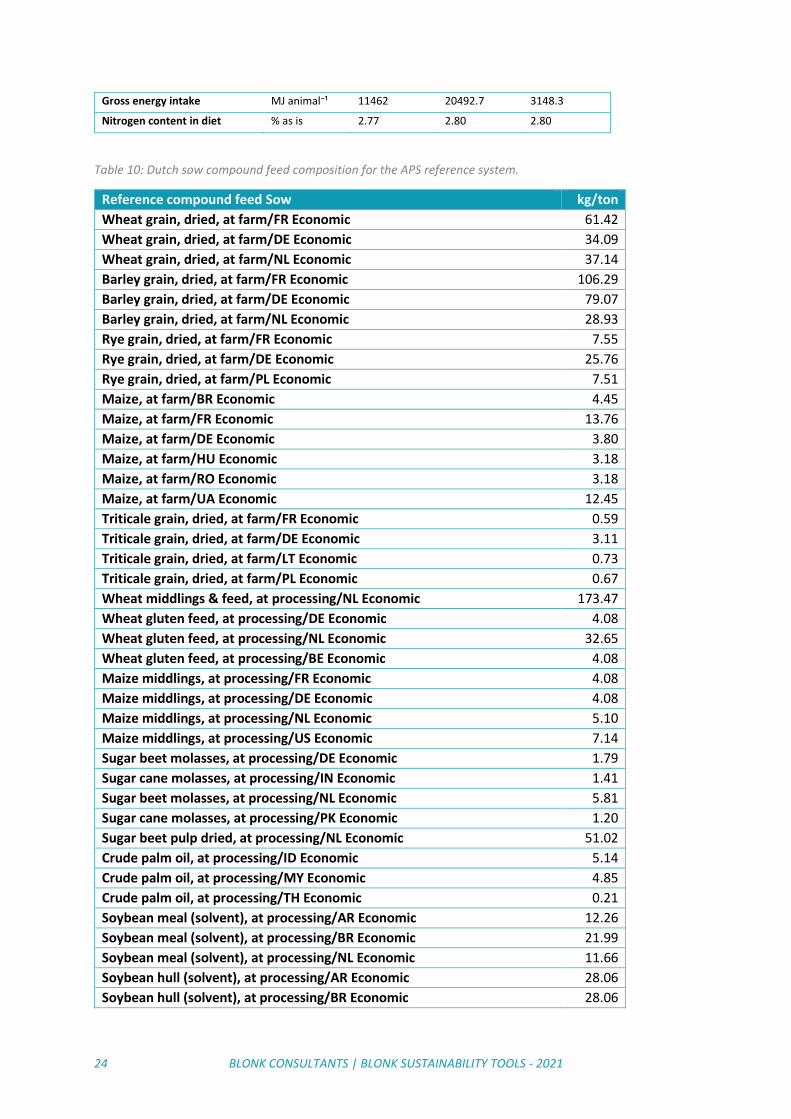
Gross energy intake MJ animal⁻¹ 11462 20492.7 3148.3
Nitrogen content in diet % as is 2.77 2.80 2.80
Table 10: Dutch sow compound feed composition for the APS reference system.
Reference compound feed Sow kg/ton
Wheat grain, dried, at farm/FR Economic 61.42
Wheat grain, dried, at farm/DE Economic 34.09
Wheat grain, dried, at farm/NL Economic 37.14
Barley grain, dried, at farm/FR Economic 106.29
Barley grain, dried, at farm/DE Economic 79.07
Barley grain, dried, at farm/NL Economic 28.93
Rye grain, dried, at farm/FR Economic 7.55
Rye grain, dried, at farm/DE Economic 25.76
Rye grain, dried, at farm/PL Economic 7.51
Maize, at farm/BR Economic 4.45
Maize, at farm/FR Economic 13.76
Maize, at farm/DE Economic 3.80
Maize, at farm/HU Economic 3.18
Maize, at farm/RO Economic 3.18
Maize, at farm/UA Economic 12.45
Triticale grain, dried, at farm/FR Economic 0.59
Triticale grain, dried, at farm/DE Economic 3.11
Triticale grain, dried, at farm/LT Economic 0.73
Triticale grain, dried, at farm/PL Economic 0.67
Wheat middlings & feed, at processing/NL Economic 173.47
Wheat gluten feed, at processing/DE Economic 4.08
Wheat gluten feed, at processing/NL Economic 32.65
Wheat gluten feed, at processing/BE Economic 4.08
Maize middlings, at processing/FR Economic 4.08
Maize middlings, at processing/DE Economic 4.08
Maize middlings, at processing/NL Economic 5.10
Maize middlings, at processing/US Economic 7.14
Sugar beet molasses, at processing/DE Economic 1.79
Sugar cane molasses, at processing/IN Economic 1.41
Sugar beet molasses, at processing/NL Economic 5.81
Sugar cane molasses, at processing/PK Economic 1.20
Sugar beet pulp dried, at processing/NL Economic 51.02
Crude palm oil, at processing/ID Economic 5.14
Crude palm oil, at processing/MY Economic 4.85
Crude palm oil, at processing/TH Economic 0.21
Soybean meal (solvent), at processing/AR Economic 12.26
Soybean meal (solvent), at processing/BR Economic 21.99
Soybean meal (solvent), at processing/NL Economic 11.66
Soybean hull (solvent), at processing/AR Economic 28.06
Soybean hull (solvent), at processing/BR Economic 28.06
25 BLONK CONSULTANTS | BLONK SUSTAINABILITY TOOLS - 2021
Rapeseed meal (solvent), at processing/BE Economic 4.29
Rapeseed meal (solvent), at processing/DE Economic 20.78
Rapeseed meal (solvent), at processing/NL Economic 15.76
Sunflower seed meal (solvent), at processing/AR Economic 9.98
Sunflower seed meal (solvent), at processing/NL Economic 13.81
Sunflower seed meal (solvent), at processing/UA Economic 6.83
Palm kernel expeller, at processing/ID Economic 56.41
Palm kernel expeller, at processing/MY Economic 25.22
Fat from animals, consumption mix, at feed compound plant/NL Economic 5.10
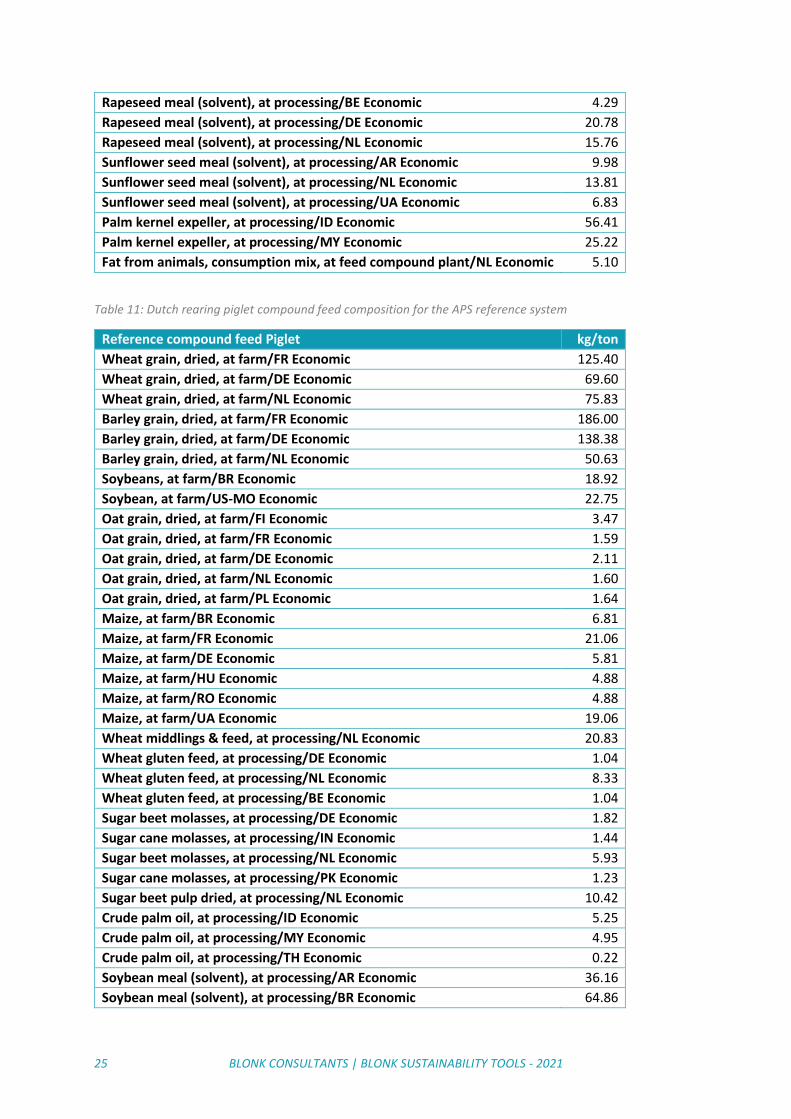
Table 11: Dutch rearing piglet compound feed composition for the APS reference system
Reference compound feed Piglet kg/ton
Wheat grain, dried, at farm/FR Economic 125.40
Wheat grain, dried, at farm/DE Economic 69.60
Wheat grain, dried, at farm/NL Economic 75.83
Barley grain, dried, at farm/FR Economic 186.00
Barley grain, dried, at farm/DE Economic 138.38
Barley grain, dried, at farm/NL Economic 50.63
Soybeans, at farm/BR Economic 18.92
Soybean, at farm/US-MO Economic 22.75
Oat grain, dried, at farm/FI Economic 3.47
Oat grain, dried, at farm/FR Economic 1.59
Oat grain, dried, at farm/DE Economic 2.11
Oat grain, dried, at farm/NL Economic 1.60
Oat grain, dried, at farm/PL Economic 1.64
Maize, at farm/BR Economic 6.81
Maize, at farm/FR Economic 21.06
Maize, at farm/DE Economic 5.81
Maize, at farm/HU Economic 4.88
Maize, at farm/RO Economic 4.88
Maize, at farm/UA Economic 19.06
Wheat middlings & feed, at processing/NL Economic 20.83
Wheat gluten feed, at processing/DE Economic 1.04
Wheat gluten feed, at processing/NL Economic 8.33
Wheat gluten feed, at processing/BE Economic 1.04
Sugar beet molasses, at processing/DE Economic 1.82
Sugar cane molasses, at processing/IN Economic 1.44
Sugar beet molasses, at processing/NL Economic 5.93
Sugar cane molasses, at processing/PK Economic 1.23
Sugar beet pulp dried, at processing/NL Economic 10.42
Crude palm oil, at processing/ID Economic 5.25
Crude palm oil, at processing/MY Economic 4.95
Crude palm oil, at processing/TH Economic 0.22
Soybean meal (solvent), at processing/AR Economic 36.16
Soybean meal (solvent), at processing/BR Economic 64.86
26 BLONK CONSULTANTS | BLONK SUSTAINABILITY TOOLS - 2021
Soybean meal (solvent), at processing/NL Economic 34.40
Rapeseed meal (solvent), at processing/BE Economic 2.19
Rapeseed meal (solvent), at processing/DE Economic 10.60
Rapeseed meal (solvent), at processing/NL Economic 8.04
Sunflower seed meal (solvent), at processing/AR Economic 6.79
Sunflower seed meal (solvent), at processing/NL Economic 9.40
Sunflower seed meal (solvent), at processing/UA Economic 4.65
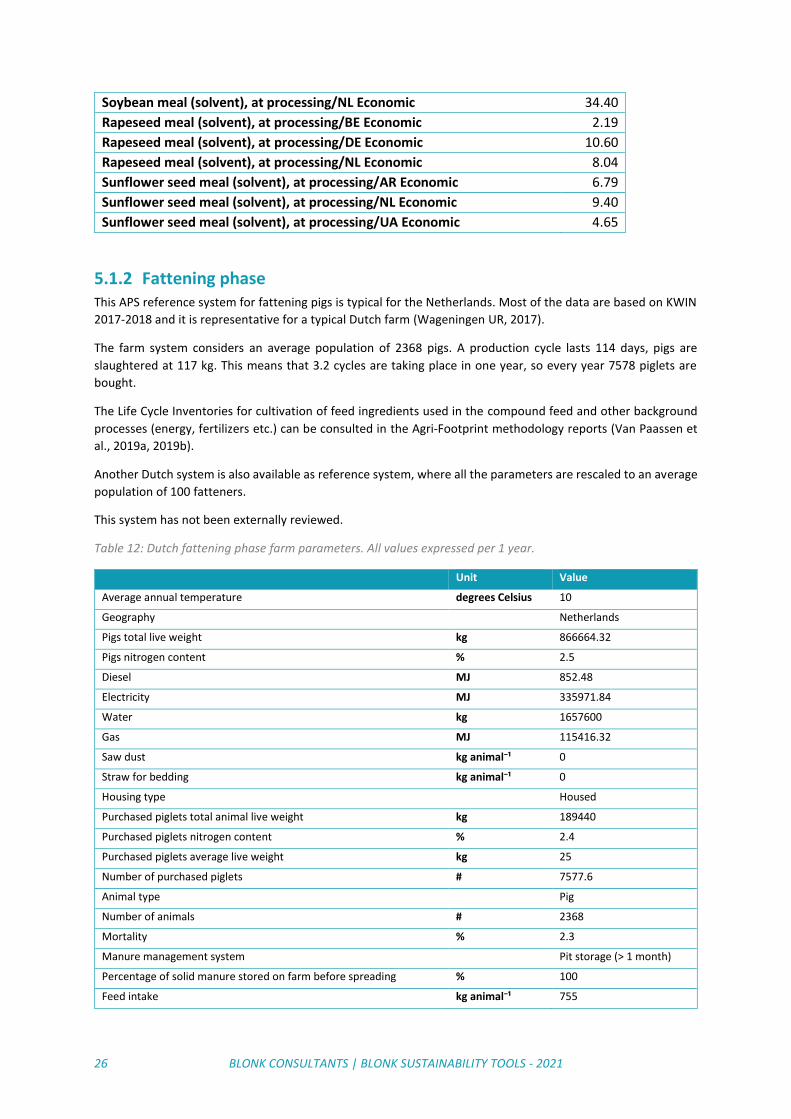
5.1.2 Fattening phase This APS reference system for fattening pigs is typical for the Netherlands. Most of the data are based on KWIN
2017-2018 and it is representative for a typical Dutch farm (Wageningen UR, 2017).
The farm system considers an average population of 2368 pigs. A production cycle lasts 114 days, pigs are
slaughtered at 117 kg. This means that 3.2 cycles are taking place in one year, so every year 7578 piglets are
bought.
The Life Cycle Inventories for cultivation of feed ingredients used in the compound feed and other background
processes (energy, fertilizers etc.) can be consulted in the Agri-Footprint methodology reports (Van Paassen et
al., 2019a, 2019b).
Another Dutch system is also available as reference system, where all the parameters are rescaled to an average
population of 100 fatteners.
This system has not been externally reviewed.
Table 12: Dutch fattening phase farm parameters. All values expressed per 1 year.
Unit Value
Average annual temperature degrees Celsius 10
Geography Netherlands
Pigs total live weight kg 866664.32
Pigs nitrogen content % 2.5
Diesel MJ 852.48
Electricity MJ 335971.84
Water kg 1657600
Gas MJ 115416.32
Saw dust kg animal⁻¹ 0
Straw for bedding kg animal⁻¹ 0
Housing type Housed
Purchased piglets total animal live weight kg 189440
Purchased piglets nitrogen content % 2.4
Purchased piglets average live weight kg 25
Number of purchased piglets # 7577.6
Animal type Pig
Number of animals # 2368
Mortality % 2.3
Manure management system Pit storage (> 1 month)
Percentage of solid manure stored on farm before spreading % 100
Feed intake kg animal⁻¹ 755
27 BLONK CONSULTANTS | BLONK SUSTAINABILITY TOOLS - 2021
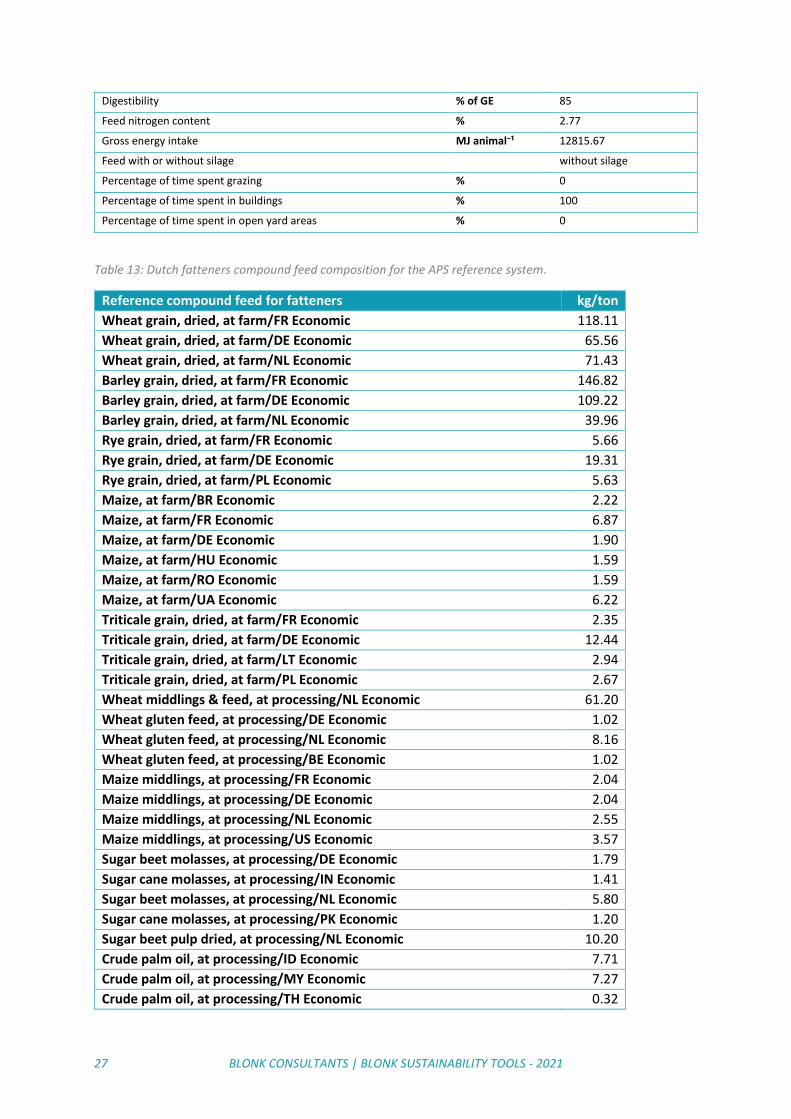
Digestibility % of GE 85
Feed nitrogen content % 2.77
Gross energy intake MJ animal⁻¹ 12815.67
Feed with or without silage without silage
Percentage of time spent grazing % 0
Percentage of time spent in buildings % 100
Percentage of time spent in open yard areas % 0
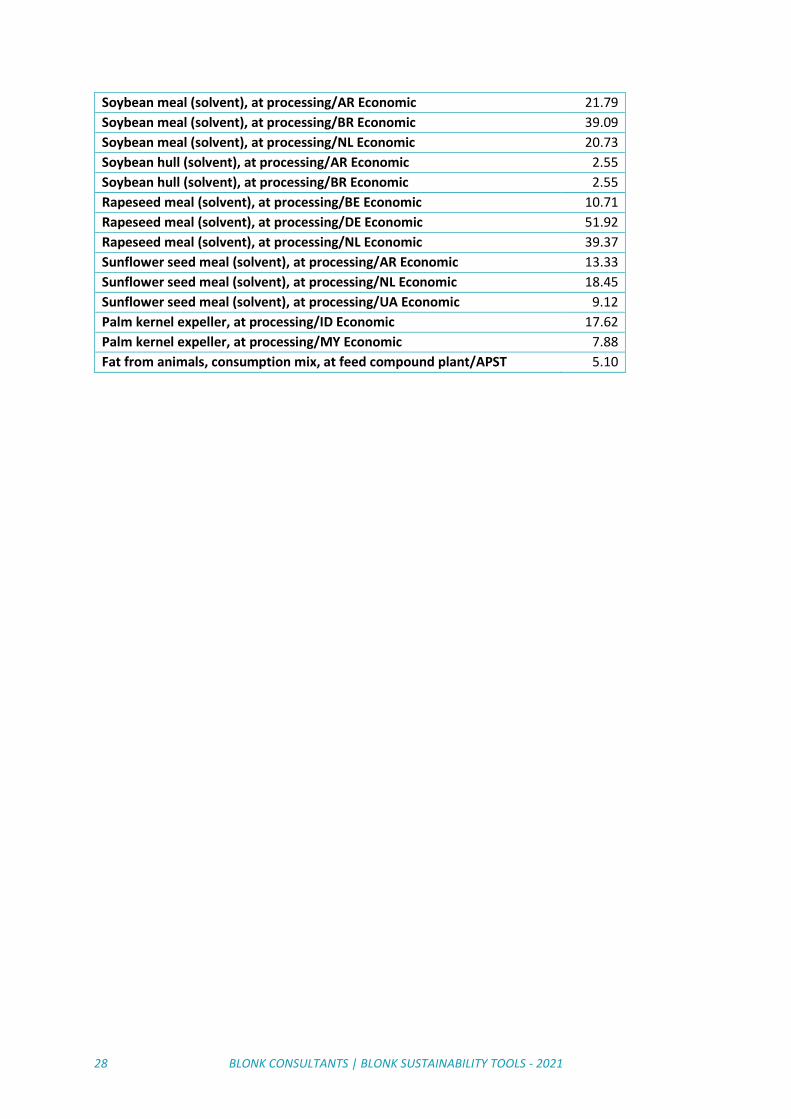
Table 13: Dutch fatteners compound feed composition for the APS reference system.
Reference compound feed for fatteners kg/ton
Wheat grain, dried, at farm/FR Economic 118.11
Wheat grain, dried, at farm/DE Economic 65.56
Wheat grain, dried, at farm/NL Economic 71.43
Barley grain, dried, at farm/FR Economic 146.82
Barley grain, dried, at farm/DE Economic 109.22
Barley grain, dried, at farm/NL Economic 39.96
Rye grain, dried, at farm/FR Economic 5.66
Rye grain, dried, at farm/DE Economic 19.31
Rye grain, dried, at farm/PL Economic 5.63
Maize, at farm/BR Economic 2.22
Maize, at farm/FR Economic 6.87
Maize, at farm/DE Economic 1.90
Maize, at farm/HU Economic 1.59
Maize, at farm/RO Economic 1.59
Maize, at farm/UA Economic 6.22
Triticale grain, dried, at farm/FR Economic 2.35
Triticale grain, dried, at farm/DE Economic 12.44
Triticale grain, dried, at farm/LT Economic 2.94
Triticale grain, dried, at farm/PL Economic 2.67
Wheat middlings & feed, at processing/NL Economic 61.20
Wheat gluten feed, at processing/DE Economic 1.02
Wheat gluten feed, at processing/NL Economic 8.16
Wheat gluten feed, at processing/BE Economic 1.02
Maize middlings, at processing/FR Economic 2.04
Maize middlings, at processing/DE Economic 2.04
Maize middlings, at processing/NL Economic 2.55
Maize middlings, at processing/US Economic 3.57
Sugar beet molasses, at processing/DE Economic 1.79
Sugar cane molasses, at processing/IN Economic 1.41
Sugar beet molasses, at processing/NL Economic 5.80
Sugar cane molasses, at processing/PK Economic 1.20
Sugar beet pulp dried, at processing/NL Economic 10.20
Crude palm oil, at processing/ID Economic 7.71
Crude palm oil, at processing/MY Economic 7.27
Crude palm oil, at processing/TH Economic 0.32
28 BLONK CONSULTANTS | BLONK SUSTAINABILITY TOOLS - 2021
Soybean meal (solvent), at processing/AR Economic 21.79
Soybean meal (solvent), at processing/BR Economic 39.09
Soybean meal (solvent), at processing/NL Economic 20.73
Soybean hull (solvent), at processing/AR Economic 2.55
Soybean hull (solvent), at processing/BR Economic 2.55
Rapeseed meal (solvent), at processing/BE Economic 10.71
Rapeseed meal (solvent), at processing/DE Economic 51.92
Rapeseed meal (solvent), at processing/NL Economic 39.37
Sunflower seed meal (solvent), at processing/AR Economic 13.33
Sunflower seed meal (solvent), at processing/NL Economic 18.45
Sunflower seed meal (solvent), at processing/UA Economic 9.12
Palm kernel expeller, at processing/ID Economic 17.62
Palm kernel expeller, at processing/MY Economic 7.88
Fat from animals, consumption mix, at feed compound plant/APST 5.10

29 BLONK CONSULTANTS | BLONK SUSTAINABILITY TOOLS - 2021
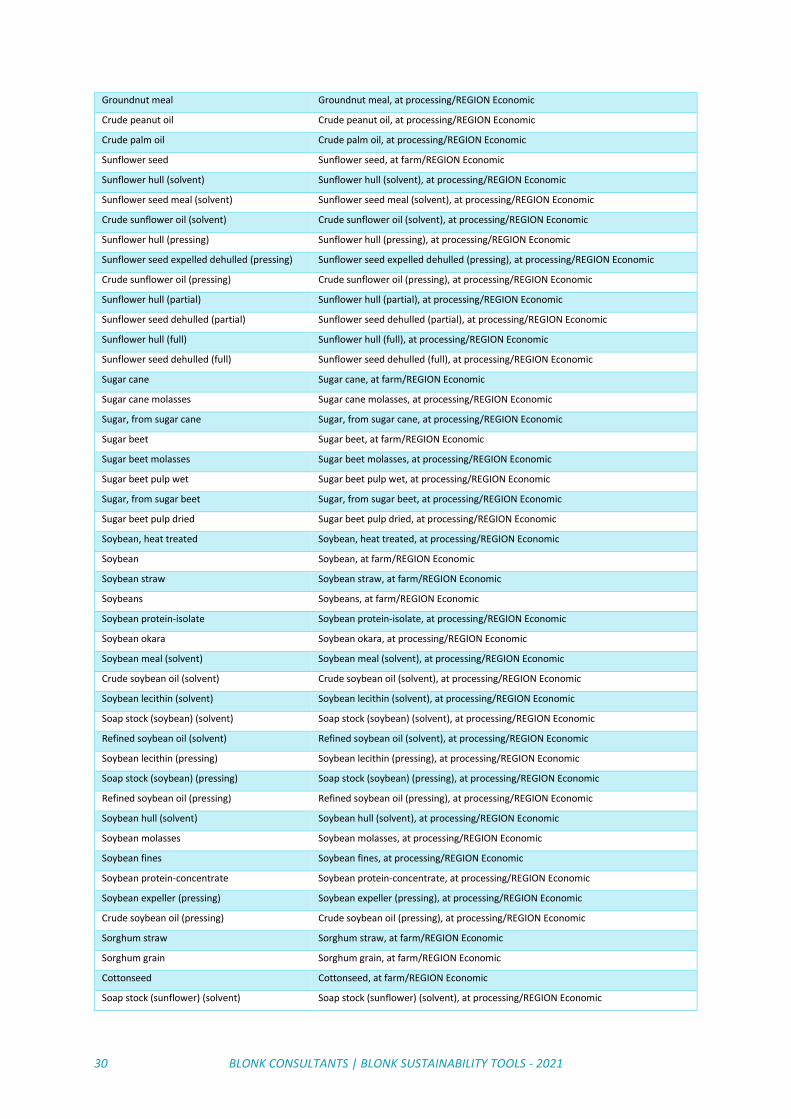
Appendix I Table 14 Unit process connection in the current default implementation of Agri-Footprint database.
Input Input process
Electricity, European countries Electricity mix, AC, consumption mix, at consumer, < 1kV REGION S System - Copied from ELCD
Electricity, non-European countries Electricity mix, AC, consumption mix, at consumer, < 1kV/REGION Economic
Gas, European countries Process steam from natural gas, heat plant, consumption mix, at plant, MJ, REGION S System - Copied from ELCD
Gas, non-European countries Process steam from natural gas, heat plant, consumption mix, at plant, MJ, EU-27 S System - Copied from ELCD
Diesel Energy, from diesel burned in machinery/RER Economic
Water Drinking water, water purification treatment, production mix, at plant, from groundwater RER S System - Copied from ELCD
Purchased gilts for sow replacement Piglet, at farm/NL Economic
Purchased piglets Piglet, at farm/NL Economic
Straw for bedding Wheat straw, at farm/REGION Economic
Saw dust Saw dust, wet, measured as dry mass {GLO}| market for | APOS, S - Copied from Ecoinvent
Sea ship Transport, sea ship, 80000 DWT, 80%LF, middle, default/GLO Economic
Truck Transport, truck >20t, EURO4, 80%LF, default/GLO Economic
Train Transport, freight train, electricity, bulk, 50%LF, flat terrain, default/GLO Economic
Inland ship Transport, barge ship, bulk, 5500t, 80%LF, default/GLO Economic
Fat from animals Fat from animals, at processing/REGION Economic
Animal meal Animal meal, at processing/REGION Economic
ValAMINO®, 98.0% L-Valine ValAMINO®, 98.0% L-Valine, at Evonik plant/SK
TrypAMINO®, 98.0% L-Tryptophan TrypAMINO®, 98.0% L-Tryptophan, at Evonik plant/SK
ThreAMINO®, 98.5% L-Threonine ThreAMINO®, 98.5% L-Threonine, at Evonik plant/HU
MetAMINO®, 99% DL-Methionine MetAMINO®, 99% DL-Methionine, at Evonik plant/BE
Biolys®, 54.6% L-Lysine Biolys®, 54.6% L-Lysine, at Evonik plant/US
Whey powder dried Whey powder dried, at processing/REGION Economic
Wheat grain, winter, dried Wheat grain, winter, dried, at farm/REGION Economic
Wheat straw, winter Wheat straw, winter, at farm/REGION Economic
Wheat grain, spring, dried Wheat grain, spring, dried, at farm/REGION Economic
Wheat straw, spring Wheat straw, spring, at farm/REGION Economic
Wheat grain, durum, dried Wheat grain, durum, dried, at farm/REGION Economic
Wheat straw, durum Wheat straw, durum, at farm/REGION Economic
Wheat grain, dried Wheat grain, dried, at farm/REGION Economic
Wheat straw Wheat straw, at farm/REGION Economic
Wheat gluten meal Wheat gluten meal, at processing/REGION Economic
Wheat gluten feed Wheat gluten feed, at processing/REGION Economic
Wheat bran, from wet milling Wheat bran, from wet milling, at processing/REGION Economic
Wheat starch Wheat starch, at processing/REGION Economic
Wheat bran, from dry milling Wheat bran, from dry milling, at processing/REGION Economic
Wheat middlings & feed Wheat middlings & feed, at processing/REGION Economic
Wheat germ Wheat germ, at processing/REGION Economic
Wheat flour Wheat flour, at processing/REGION Economic
Vinasse dried, at plant Vinasse dried, at plant/REGION Economic
Triticale grain, dried Triticale grain, dried, at farm/REGION Economic
Triticale straw Triticale straw, at farm/REGION Economic
Dairy cow co-product, feed grade Dairy cow co-product, feed grade, at slaughterhouse/REGION Economic
30 BLONK CONSULTANTS | BLONK SUSTAINABILITY TOOLS - 2021
Groundnut meal Groundnut meal, at processing/REGION Economic
Crude peanut oil Crude peanut oil, at processing/REGION Economic
Crude palm oil Crude palm oil, at processing/REGION Economic
Sunflower seed Sunflower seed, at farm/REGION Economic
Sunflower hull (solvent) Sunflower hull (solvent), at processing/REGION Economic
Sunflower seed meal (solvent) Sunflower seed meal (solvent), at processing/REGION Economic
Crude sunflower oil (solvent) Crude sunflower oil (solvent), at processing/REGION Economic
Sunflower hull (pressing) Sunflower hull (pressing), at processing/REGION Economic
Sunflower seed expelled dehulled (pressing) Sunflower seed expelled dehulled (pressing), at processing/REGION Economic
Crude sunflower oil (pressing) Crude sunflower oil (pressing), at processing/REGION Economic
Sunflower hull (partial) Sunflower hull (partial), at processing/REGION Economic
Sunflower seed dehulled (partial) Sunflower seed dehulled (partial), at processing/REGION Economic
Sunflower hull (full) Sunflower hull (full), at processing/REGION Economic
Sunflower seed dehulled (full) Sunflower seed dehulled (full), at processing/REGION Economic
Sugar cane Sugar cane, at farm/REGION Economic
Sugar cane molasses Sugar cane molasses, at processing/REGION Economic
Sugar, from sugar cane Sugar, from sugar cane, at processing/REGION Economic
Sugar beet Sugar beet, at farm/REGION Economic
Sugar beet molasses Sugar beet molasses, at processing/REGION Economic
Sugar beet pulp wet Sugar beet pulp wet, at processing/REGION Economic
Sugar, from sugar beet Sugar, from sugar beet, at processing/REGION Economic
Sugar beet pulp dried Sugar beet pulp dried, at processing/REGION Economic
Soybean, heat treated Soybean, heat treated, at processing/REGION Economic
Soybean Soybean, at farm/REGION Economic
Soybean straw Soybean straw, at farm/REGION Economic
Soybeans Soybeans, at farm/REGION Economic
Soybean protein-isolate Soybean protein-isolate, at processing/REGION Economic
Soybean okara Soybean okara, at processing/REGION Economic
Soybean meal (solvent) Soybean meal (solvent), at processing/REGION Economic
Crude soybean oil (solvent) Crude soybean oil (solvent), at processing/REGION Economic
Soybean lecithin (solvent) Soybean lecithin (solvent), at processing/REGION Economic
Soap stock (soybean) (solvent) Soap stock (soybean) (solvent), at processing/REGION Economic
Refined soybean oil (solvent) Refined soybean oil (solvent), at processing/REGION Economic
Soybean lecithin (pressing) Soybean lecithin (pressing), at processing/REGION Economic
Soap stock (soybean) (pressing) Soap stock (soybean) (pressing), at processing/REGION Economic
Refined soybean oil (pressing) Refined soybean oil (pressing), at processing/REGION Economic
Soybean hull (solvent) Soybean hull (solvent), at processing/REGION Economic
Soybean molasses Soybean molasses, at processing/REGION Economic
Soybean fines Soybean fines, at processing/REGION Economic
Soybean protein-concentrate Soybean protein-concentrate, at processing/REGION Economic
Soybean expeller (pressing) Soybean expeller (pressing), at processing/REGION Economic
Crude soybean oil (pressing) Crude soybean oil (pressing), at processing/REGION Economic
Sorghum straw Sorghum straw, at farm/REGION Economic
Sorghum grain Sorghum grain, at farm/REGION Economic
Cottonseed Cottonseed, at farm/REGION Economic
Soap stock (sunflower) (solvent) Soap stock (sunflower) (solvent), at processing/REGION Economic
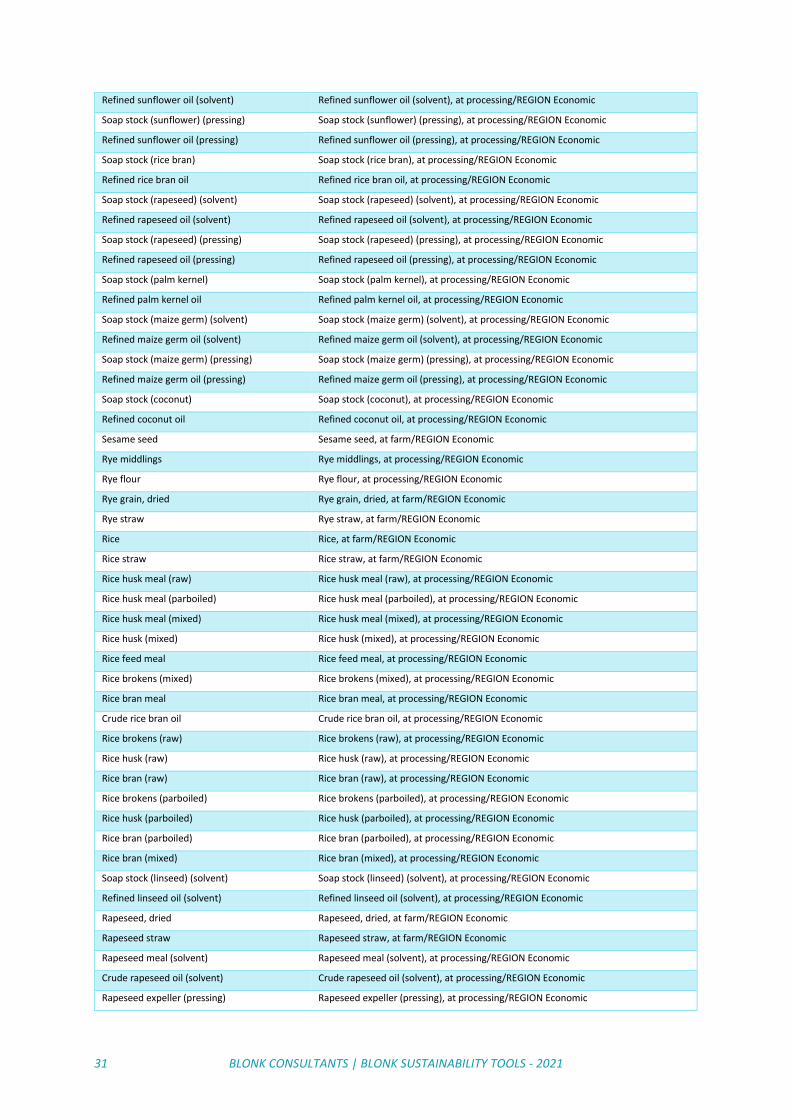
31 BLONK CONSULTANTS | BLONK SUSTAINABILITY TOOLS - 2021
Refined sunflower oil (solvent) Refined sunflower oil (solvent), at processing/REGION Economic
Soap stock (sunflower) (pressing) Soap stock (sunflower) (pressing), at processing/REGION Economic
Refined sunflower oil (pressing) Refined sunflower oil (pressing), at processing/REGION Economic
Soap stock (rice bran) Soap stock (rice bran), at processing/REGION Economic
Refined rice bran oil Refined rice bran oil, at processing/REGION Economic
Soap stock (rapeseed) (solvent) Soap stock (rapeseed) (solvent), at processing/REGION Economic
Refined rapeseed oil (solvent) Refined rapeseed oil (solvent), at processing/REGION Economic
Soap stock (rapeseed) (pressing) Soap stock (rapeseed) (pressing), at processing/REGION Economic
Refined rapeseed oil (pressing) Refined rapeseed oil (pressing), at processing/REGION Economic
Soap stock (palm kernel) Soap stock (palm kernel), at processing/REGION Economic
Refined palm kernel oil Refined palm kernel oil, at processing/REGION Economic
Soap stock (maize germ) (solvent) Soap stock (maize germ) (solvent), at processing/REGION Economic
Refined maize germ oil (solvent) Refined maize germ oil (solvent), at processing/REGION Economic
Soap stock (maize germ) (pressing) Soap stock (maize germ) (pressing), at processing/REGION Economic
Refined maize germ oil (pressing) Refined maize germ oil (pressing), at processing/REGION Economic
Soap stock (coconut) Soap stock (coconut), at processing/REGION Economic
Refined coconut oil Refined coconut oil, at processing/REGION Economic
Sesame seed Sesame seed, at farm/REGION Economic
Rye middlings Rye middlings, at processing/REGION Economic
Rye flour Rye flour, at processing/REGION Economic
Rye grain, dried Rye grain, dried, at farm/REGION Economic
Rye straw Rye straw, at farm/REGION Economic
Rice Rice, at farm/REGION Economic
Rice straw Rice straw, at farm/REGION Economic
Rice husk meal (raw) Rice husk meal (raw), at processing/REGION Economic
Rice husk meal (parboiled) Rice husk meal (parboiled), at processing/REGION Economic
Rice husk meal (mixed) Rice husk meal (mixed), at processing/REGION Economic
Rice husk (mixed) Rice husk (mixed), at processing/REGION Economic
Rice feed meal Rice feed meal, at processing/REGION Economic
Rice brokens (mixed) Rice brokens (mixed), at processing/REGION Economic
Rice bran meal Rice bran meal, at processing/REGION Economic
Crude rice bran oil Crude rice bran oil, at processing/REGION Economic
Rice brokens (raw) Rice brokens (raw), at processing/REGION Economic
Rice husk (raw) Rice husk (raw), at processing/REGION Economic
Rice bran (raw) Rice bran (raw), at processing/REGION Economic
Rice brokens (parboiled) Rice brokens (parboiled), at processing/REGION Economic
Rice husk (parboiled) Rice husk (parboiled), at processing/REGION Economic
Rice bran (parboiled) Rice bran (parboiled), at processing/REGION Economic
Rice bran (mixed) Rice bran (mixed), at processing/REGION Economic
Soap stock (linseed) (solvent) Soap stock (linseed) (solvent), at processing/REGION Economic
Refined linseed oil (solvent) Refined linseed oil (solvent), at processing/REGION Economic
Rapeseed, dried Rapeseed, dried, at farm/REGION Economic
Rapeseed straw Rapeseed straw, at farm/REGION Economic
Rapeseed meal (solvent) Rapeseed meal (solvent), at processing/REGION Economic
Crude rapeseed oil (solvent) Crude rapeseed oil (solvent), at processing/REGION Economic
Rapeseed expeller (pressing) Rapeseed expeller (pressing), at processing/REGION Economic
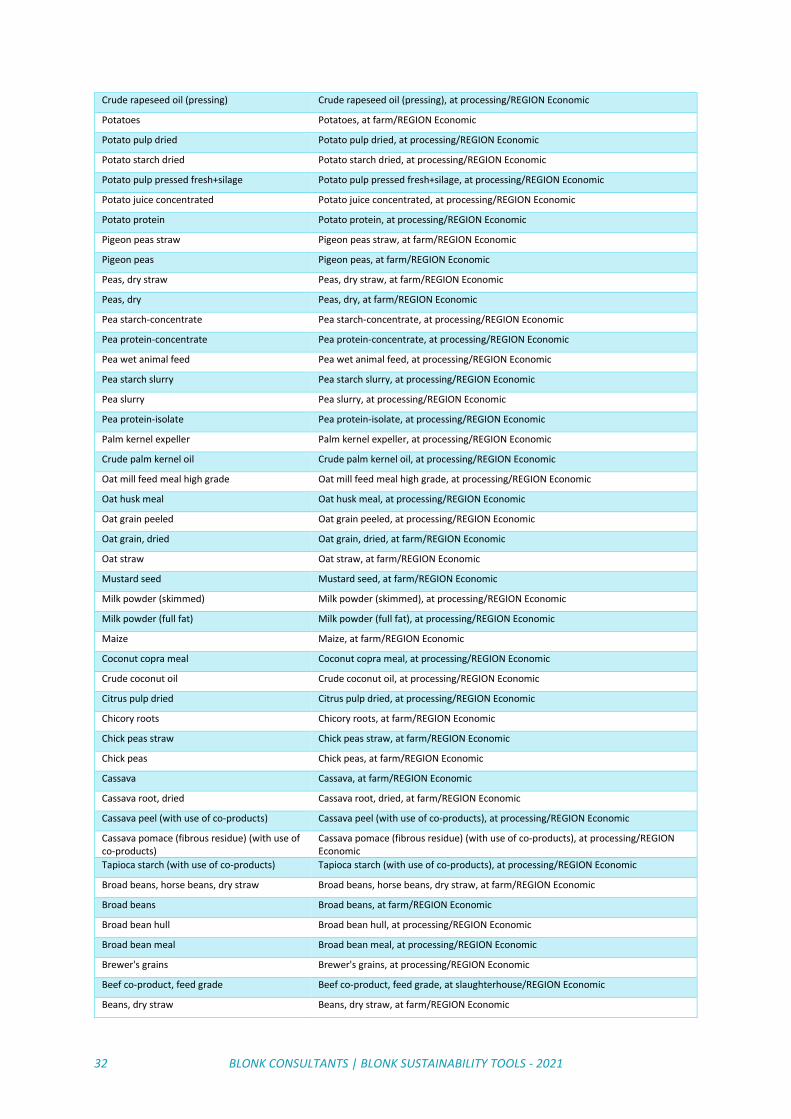
32 BLONK CONSULTANTS | BLONK SUSTAINABILITY TOOLS - 2021
Crude rapeseed oil (pressing) Crude rapeseed oil (pressing), at processing/REGION Economic
Potatoes Potatoes, at farm/REGION Economic
Potato pulp dried Potato pulp dried, at processing/REGION Economic
Potato starch dried Potato starch dried, at processing/REGION Economic
Potato pulp pressed fresh+silage Potato pulp pressed fresh+silage, at processing/REGION Economic
Potato juice concentrated Potato juice concentrated, at processing/REGION Economic
Potato protein Potato protein, at processing/REGION Economic
Pigeon peas straw Pigeon peas straw, at farm/REGION Economic
Pigeon peas Pigeon peas, at farm/REGION Economic
Peas, dry straw Peas, dry straw, at farm/REGION Economic
Peas, dry Peas, dry, at farm/REGION Economic
Pea starch-concentrate Pea starch-concentrate, at processing/REGION Economic
Pea protein-concentrate Pea protein-concentrate, at processing/REGION Economic
Pea wet animal feed Pea wet animal feed, at processing/REGION Economic
Pea starch slurry Pea starch slurry, at processing/REGION Economic
Pea slurry Pea slurry, at processing/REGION Economic
Pea protein-isolate Pea protein-isolate, at processing/REGION Economic
Palm kernel expeller Palm kernel expeller, at processing/REGION Economic
Crude palm kernel oil Crude palm kernel oil, at processing/REGION Economic
Oat mill feed meal high grade Oat mill feed meal high grade, at processing/REGION Economic
Oat husk meal Oat husk meal, at processing/REGION Economic
Oat grain peeled Oat grain peeled, at processing/REGION Economic
Oat grain, dried Oat grain, dried, at farm/REGION Economic
Oat straw Oat straw, at farm/REGION Economic
Mustard seed Mustard seed, at farm/REGION Economic
Milk powder (skimmed) Milk powder (skimmed), at processing/REGION Economic
Milk powder (full fat) Milk powder (full fat), at processing/REGION Economic
Maize Maize, at farm/REGION Economic
Coconut copra meal Coconut copra meal, at processing/REGION Economic
Crude coconut oil Crude coconut oil, at processing/REGION Economic
Citrus pulp dried Citrus pulp dried, at processing/REGION Economic
Chicory roots Chicory roots, at farm/REGION Economic
Chick peas straw Chick peas straw, at farm/REGION Economic
Chick peas Chick peas, at farm/REGION Economic
Cassava Cassava, at farm/REGION Economic
Cassava root, dried Cassava root, dried, at farm/REGION Economic
Cassava peel (with use of co-products) Cassava peel (with use of co-products), at processing/REGION Economic
Cassava pomace (fibrous residue) (with use of co-products)
Cassava pomace (fibrous residue) (with use of co-products), at processing/REGION Economic
Tapioca starch (with use of co-products) Tapioca starch (with use of co-products), at processing/REGION Economic
Broad beans, horse beans, dry straw Broad beans, horse beans, dry straw, at farm/REGION Economic
Broad beans Broad beans, at farm/REGION Economic
Broad bean hull Broad bean hull, at processing/REGION Economic
Broad bean meal Broad bean meal, at processing/REGION Economic
Brewer's grains Brewer's grains, at processing/REGION Economic
Beef co-product, feed grade Beef co-product, feed grade, at slaughterhouse/REGION Economic
Beans, dry straw Beans, dry straw, at farm/REGION Economic
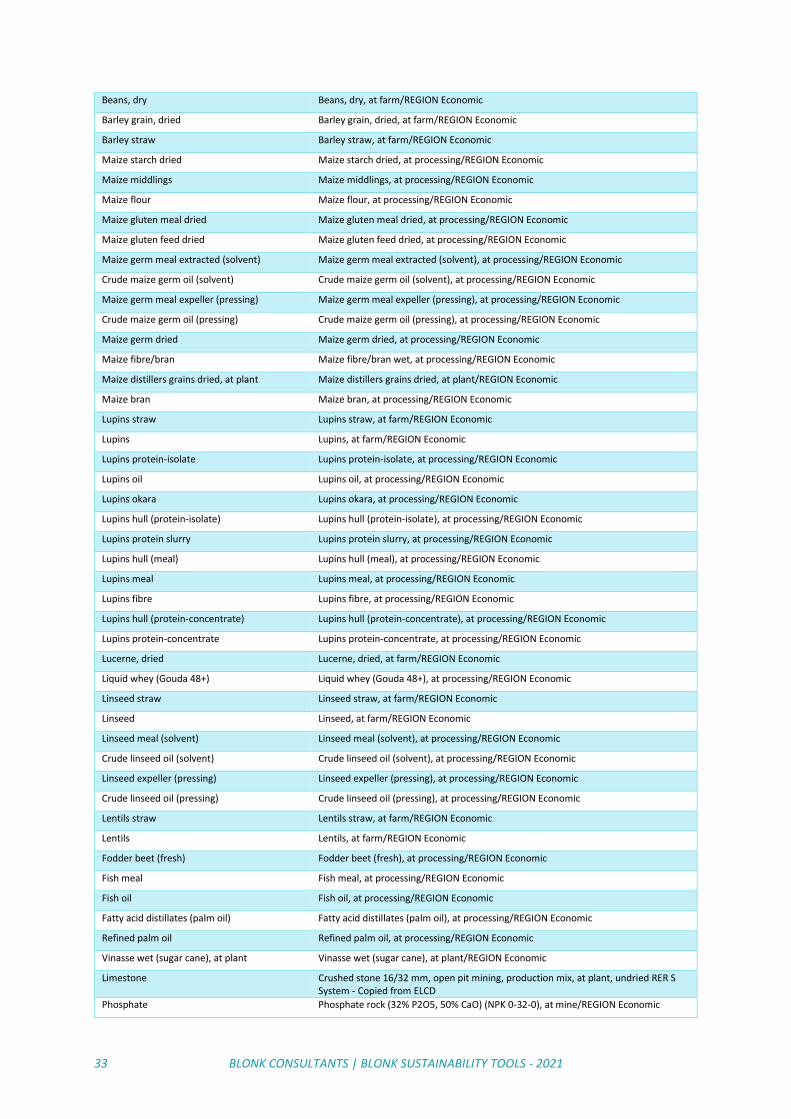
33 BLONK CONSULTANTS | BLONK SUSTAINABILITY TOOLS - 2021
Beans, dry Beans, dry, at farm/REGION Economic
Barley grain, dried Barley grain, dried, at farm/REGION Economic
Barley straw Barley straw, at farm/REGION Economic
Maize starch dried Maize starch dried, at processing/REGION Economic
Maize middlings Maize middlings, at processing/REGION Economic
Maize flour Maize flour, at processing/REGION Economic
Maize gluten meal dried Maize gluten meal dried, at processing/REGION Economic
Maize gluten feed dried Maize gluten feed dried, at processing/REGION Economic
Maize germ meal extracted (solvent) Maize germ meal extracted (solvent), at processing/REGION Economic
Crude maize germ oil (solvent) Crude maize germ oil (solvent), at processing/REGION Economic
Maize germ meal expeller (pressing) Maize germ meal expeller (pressing), at processing/REGION Economic
Crude maize germ oil (pressing) Crude maize germ oil (pressing), at processing/REGION Economic
Maize germ dried Maize germ dried, at processing/REGION Economic
Maize fibre/bran Maize fibre/bran wet, at processing/REGION Economic
Maize distillers grains dried, at plant Maize distillers grains dried, at plant/REGION Economic
Maize bran Maize bran, at processing/REGION Economic
Lupins straw Lupins straw, at farm/REGION Economic
Lupins Lupins, at farm/REGION Economic
Lupins protein-isolate Lupins protein-isolate, at processing/REGION Economic
Lupins oil Lupins oil, at processing/REGION Economic
Lupins okara Lupins okara, at processing/REGION Economic
Lupins hull (protein-isolate) Lupins hull (protein-isolate), at processing/REGION Economic
Lupins protein slurry Lupins protein slurry, at processing/REGION Economic
Lupins hull (meal) Lupins hull (meal), at processing/REGION Economic
Lupins meal Lupins meal, at processing/REGION Economic
Lupins fibre Lupins fibre, at processing/REGION Economic
Lupins hull (protein-concentrate) Lupins hull (protein-concentrate), at processing/REGION Economic
Lupins protein-concentrate Lupins protein-concentrate, at processing/REGION Economic
Lucerne, dried Lucerne, dried, at farm/REGION Economic
Liquid whey (Gouda 48+) Liquid whey (Gouda 48+), at processing/REGION Economic
Linseed straw Linseed straw, at farm/REGION Economic
Linseed Linseed, at farm/REGION Economic
Linseed meal (solvent) Linseed meal (solvent), at processing/REGION Economic
Crude linseed oil (solvent) Crude linseed oil (solvent), at processing/REGION Economic
Linseed expeller (pressing) Linseed expeller (pressing), at processing/REGION Economic
Crude linseed oil (pressing) Crude linseed oil (pressing), at processing/REGION Economic
Lentils straw Lentils straw, at farm/REGION Economic
Lentils Lentils, at farm/REGION Economic
Fodder beet (fresh) Fodder beet (fresh), at processing/REGION Economic
Fish meal Fish meal, at processing/REGION Economic
Fish oil Fish oil, at processing/REGION Economic
Fatty acid distillates (palm oil) Fatty acid distillates (palm oil), at processing/REGION Economic
Refined palm oil Refined palm oil, at processing/REGION Economic
Vinasse wet (sugar cane), at plant Vinasse wet (sugar cane), at plant/REGION Economic
Limestone Crushed stone 16/32 mm, open pit mining, production mix, at plant, undried RER S System - Copied from ELCD
Phosphate Phosphate rock (32% P2O5, 50% CaO) (NPK 0-32-0), at mine/REGION Economic
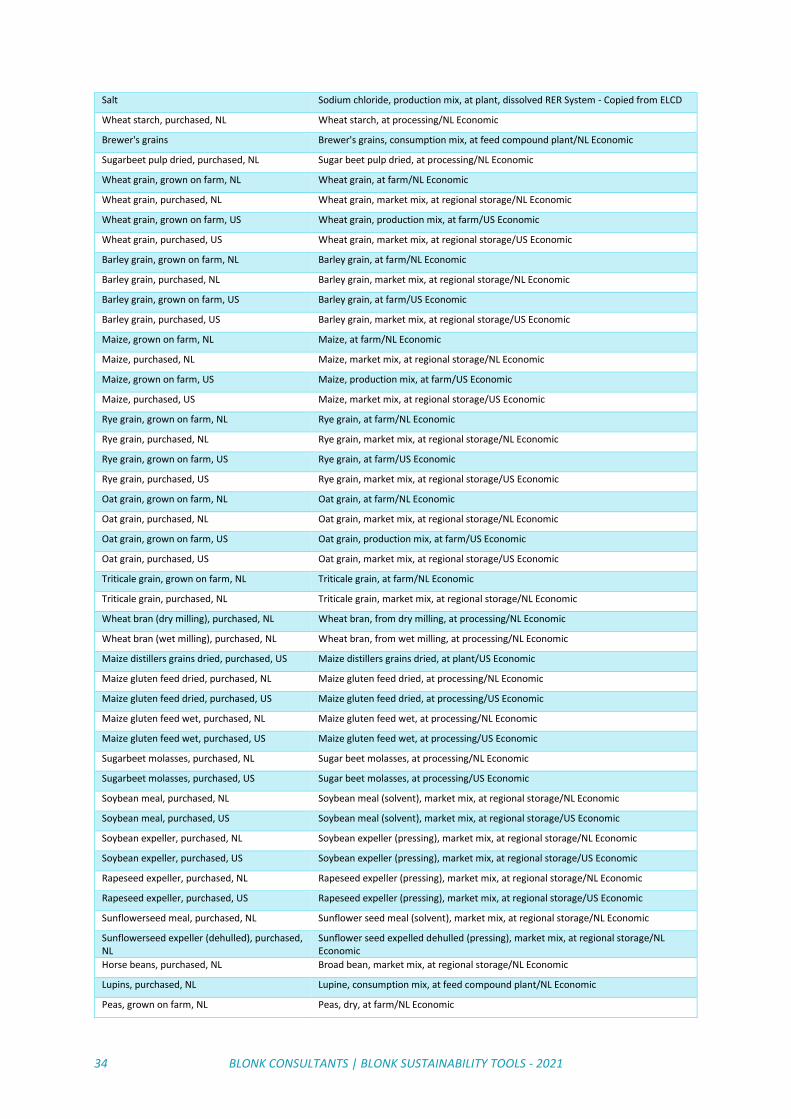
34 BLONK CONSULTANTS | BLONK SUSTAINABILITY TOOLS - 2021
Salt Sodium chloride, production mix, at plant, dissolved RER System - Copied from ELCD
Wheat starch, purchased, NL Wheat starch, at processing/NL Economic
Brewer's grains Brewer's grains, consumption mix, at feed compound plant/NL Economic
Sugarbeet pulp dried, purchased, NL Sugar beet pulp dried, at processing/NL Economic
Wheat grain, grown on farm, NL Wheat grain, at farm/NL Economic
Wheat grain, purchased, NL Wheat grain, market mix, at regional storage/NL Economic
Wheat grain, grown on farm, US Wheat grain, production mix, at farm/US Economic
Wheat grain, purchased, US Wheat grain, market mix, at regional storage/US Economic
Barley grain, grown on farm, NL Barley grain, at farm/NL Economic
Barley grain, purchased, NL Barley grain, market mix, at regional storage/NL Economic
Barley grain, grown on farm, US Barley grain, at farm/US Economic
Barley grain, purchased, US Barley grain, market mix, at regional storage/US Economic
Maize, grown on farm, NL Maize, at farm/NL Economic
Maize, purchased, NL Maize, market mix, at regional storage/NL Economic
Maize, grown on farm, US Maize, production mix, at farm/US Economic
Maize, purchased, US Maize, market mix, at regional storage/US Economic
Rye grain, grown on farm, NL Rye grain, at farm/NL Economic
Rye grain, purchased, NL Rye grain, market mix, at regional storage/NL Economic
Rye grain, grown on farm, US Rye grain, at farm/US Economic
Rye grain, purchased, US Rye grain, market mix, at regional storage/US Economic
Oat grain, grown on farm, NL Oat grain, at farm/NL Economic
Oat grain, purchased, NL Oat grain, market mix, at regional storage/NL Economic
Oat grain, grown on farm, US Oat grain, production mix, at farm/US Economic
Oat grain, purchased, US Oat grain, market mix, at regional storage/US Economic
Triticale grain, grown on farm, NL Triticale grain, at farm/NL Economic
Triticale grain, purchased, NL Triticale grain, market mix, at regional storage/NL Economic
Wheat bran (dry milling), purchased, NL Wheat bran, from dry milling, at processing/NL Economic
Wheat bran (wet milling), purchased, NL Wheat bran, from wet milling, at processing/NL Economic
Maize distillers grains dried, purchased, US Maize distillers grains dried, at plant/US Economic
Maize gluten feed dried, purchased, NL Maize gluten feed dried, at processing/NL Economic
Maize gluten feed dried, purchased, US Maize gluten feed dried, at processing/US Economic
Maize gluten feed wet, purchased, NL Maize gluten feed wet, at processing/NL Economic
Maize gluten feed wet, purchased, US Maize gluten feed wet, at processing/US Economic
Sugarbeet molasses, purchased, NL Sugar beet molasses, at processing/NL Economic
Sugarbeet molasses, purchased, US Sugar beet molasses, at processing/US Economic
Soybean meal, purchased, NL Soybean meal (solvent), market mix, at regional storage/NL Economic
Soybean meal, purchased, US Soybean meal (solvent), market mix, at regional storage/US Economic
Soybean expeller, purchased, NL Soybean expeller (pressing), market mix, at regional storage/NL Economic
Soybean expeller, purchased, US Soybean expeller (pressing), market mix, at regional storage/US Economic
Rapeseed expeller, purchased, NL Rapeseed expeller (pressing), market mix, at regional storage/NL Economic
Rapeseed expeller, purchased, US Rapeseed expeller (pressing), market mix, at regional storage/US Economic
Sunflowerseed meal, purchased, NL Sunflower seed meal (solvent), market mix, at regional storage/NL Economic
Sunflowerseed expeller (dehulled), purchased, NL
Sunflower seed expelled dehulled (pressing), market mix, at regional storage/NL Economic
Horse beans, purchased, NL Broad bean, market mix, at regional storage/NL Economic
Lupins, purchased, NL Lupine, consumption mix, at feed compound plant/NL Economic
Peas, grown on farm, NL Peas, dry, at farm/NL Economic
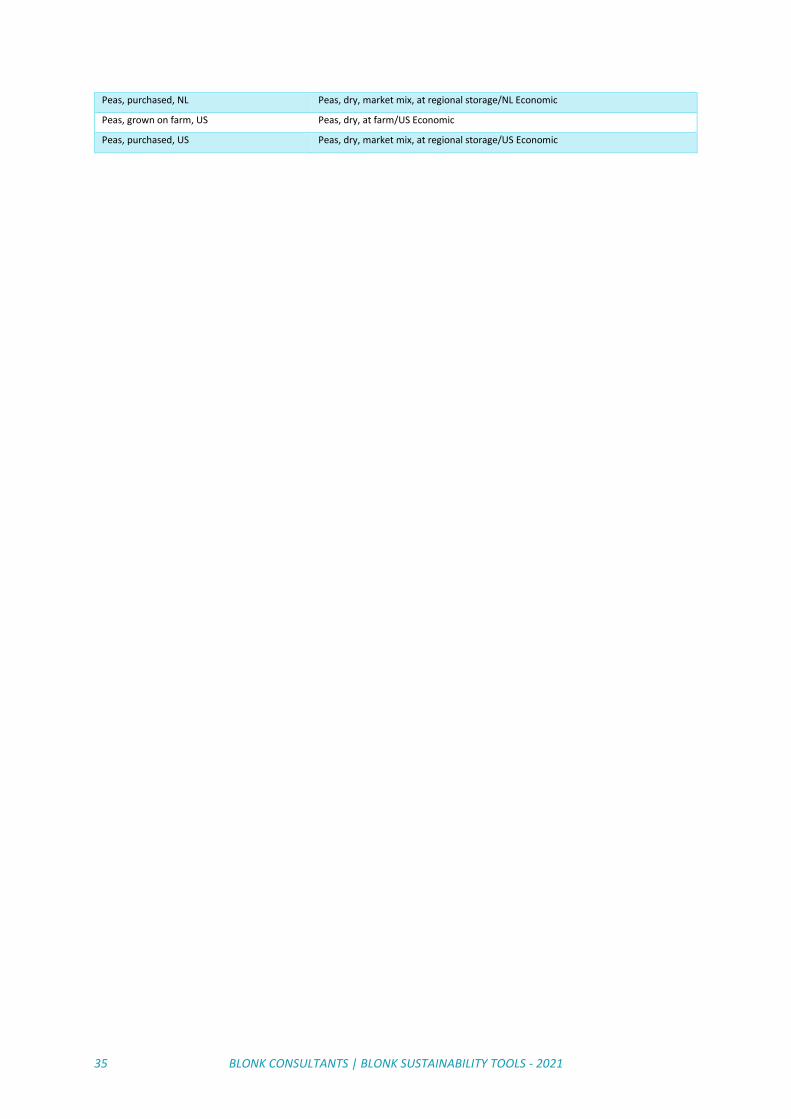
35 BLONK CONSULTANTS | BLONK SUSTAINABILITY TOOLS - 2021
Peas, purchased, NL Peas, dry, market mix, at regional storage/NL Economic
Peas, grown on farm, US Peas, dry, at farm/US Economic
Peas, purchased, US Peas, dry, market mix, at regional storage/US Economic
36 BLONK CONSULTANTS | BLONK SUSTAINABILITY TOOLS - 2021
References Blonk Consultants. (2020). APS-footprint tool general methodology. Gouda, the Netherlands.
Blonk, H., van Passen, M., & Broekema, R. (2020). GFLI methodolgy v1 2020 draft 25 sep 2020.
Council of the European Union. (2009). COUNCIL DIRECTIVE 2008/120/EC of 18 December 2008 laying down minimum standards for the protection of pigs. Official Journal of the European Union, (5), 5–13.
EMEP/EEA. (2016). Chapter 3.B Manure Management. EMEP/EEA Air Pollutant Emission Inventory Guidebook 2016, 62.
European Commission. (2018a). PEFCR Feed for food producing animals. Brussels, Belgium. Retrieved from http://ec.europa.eu/environment/eussd/smgp/pdf/PEFCR_feed.pdf
European Commission. (2018b). Product Environmental Footprint Category Rules Guidance. PEFCR Guidance document, - Guidance for the development of Product Environmental Footprint Category Rules (PEFCRs), version 6.3, December 2017. Retrieved from https://ec.europa.eu/environment/eussd/smgp/pdf/PEFCR_guidance_v6.3.pdf
FAO LEAP. (2015). Environmental performance of animal feeds supply chains - Guidelines for assessment. Retrieved from http://www.fao.org/partnerships/leap/resources/resources/en/
FAO LEAP. (2016). Environmental performance of pig supply chains - Draft for public review. Retrieved from http://www.fao.org/3/a-bl094e.pdf
Giezen, E., & Mooren, L. (2012). Veehouderij: ammoniak, geur en fijnstof 2009. Trends in stikstofbelasting, geurhinder en fijnstofbelasting. ’s Hertogenbosch.
Hoek, K. W. Van Der, & Schijndel, M. W. Van. (2006). RIVM-rapport 680125002 Methane and nitrous oxide emissions from animal manure management, 1990-2003.
IPCC. (2006a). Chapter 10: Emissions from livestock and manure management. In: IPCC Guidelines for National Greenhouse Gas Inventories, Prepared by the National Greenhouse Gas Inventories Programme (eds Eggleston S, Buendia L, Miwa K, Ngara T, Tanabe K). Cambridge University Press, Cambridge, United Kingdom, 10.1–10.87.
IPCC. (2006b). IPCC Guidelines for National Greenhouse Gas Inventories. Emissions from livestock and manure management. (Vol. 4 chp 10). Geneva, Switzerland.
IPCC. (2006c). IPCC Guidelines for National Greenhouse Gas Inventories. Retrieved from http://www.ipcc-nggip.iges.or.jp/public/2006gl/index.html
Melse, R. W., Hol, J. M. G., Mosquera, J., Nijeboer, G. M., Huis, J. W. H., Hattum, T. G. Van, … Ogink, N. W. M. (2011). Monitoringsprogramma experimentele gecombineerde luchtwassers op veehouderijbedrijven. Lelystad.
Queensland Government. (2013). Batch farrowing. Retrieved from https://www.daf.qld.gov.au/business-priorities/agriculture/animals/pigs/piggery-management/production-performance/batch-farrowing
TS Red meat FCR. (2019). FCR RED MEAT; Update Screening study.
United Nations. (2012). Country classification: Data sources, country classifications and aggregation methodology. https://doi.org/10.1787/migr_outlook-2003-6-en
Van Paassen, M., Braconi, N., Kuling, L., Durlinger, B., & Gual, P. (2019a). Agri-footprint 5.0 - Part 1: Methodology and Basic Principles. Gouda, the Netherlands. Retrieved from https://www.agri-footprint.com/wp-content/uploads/2019/11/Agri-Footprint-5.0-Part-1-Methodology-and-basic-principles-17-7-2019.pdf
Van Paassen, M., Braconi, N., Kuling, L., Durlinger, B., & Gual, P. (2019b). Agri-footprint 5.0 - Part 2: Desciption of Data. Gouda, the Netherlands. Retrieved from https://www.agri-footprint.com/wp-content/uploads/2019/11/Agri-Footprint-5.0-Part-2-Description-of-data-17-7-2019-for-web.pdf
37 BLONK CONSULTANTS | BLONK SUSTAINABILITY TOOLS - 2021
Wageningen UR. (2017). Kwantitatieve Informatie Veehouderij 2017-2018 (33rd ed.). Wageningen UR Livestock Research.
White, M. (2003). Farrowing Process. Retrieved from www.nadis.org.uk/disease-a-z/pigs/farrowing-process/
5-1 BLONK CONSULTANTS | BLONK SUSTAINABILITY TOOLS - 2021
Blonk Consultants | Blonk Sustainability Tools (+31) 0182 579970
Groen van Prinsterersingel 45 www.blonkconsultants.nl
2805 TD Gouda [email protected]
Blonk Consultants helps companies, governments and civil society organisations put sustainability into practice. Our team of dedicated consultants works closely with our clients to deliver clear and practical advice based on sound, independent research. To ensure optimal outcomes we take an integrated approach that encompasses the whole production chain.


