70
APSE SOLUTIONS Waste, Street Cleansing & Parks Services Dave Henrys Associate Consultant APSE Solutions www.apse.org.uk
| Date post: | 09-May-2018 |
| Category: |
Documents |
| Upload: | hoangthuan |
| View: | 217 times |
| Download: | 1 times |

APSE SOLUTIONS Waste, Street Cleansing
& Parks Services
Dave Henrys Associate Consultant
APSE Solutions
www.apse.org.uk

APSE Solutions
• Understanding demand management • Innovation and income generation • Applying performance analysis to
service transformation
–Best practise case studies
• What is demand management?
Demand management is a planning methodology used to manage and forecast the demand of products and services.
Understanding demand management

Understanding demand management
The problem Austerity – reducing budgets
Demand – continues to rise
Understanding demand management
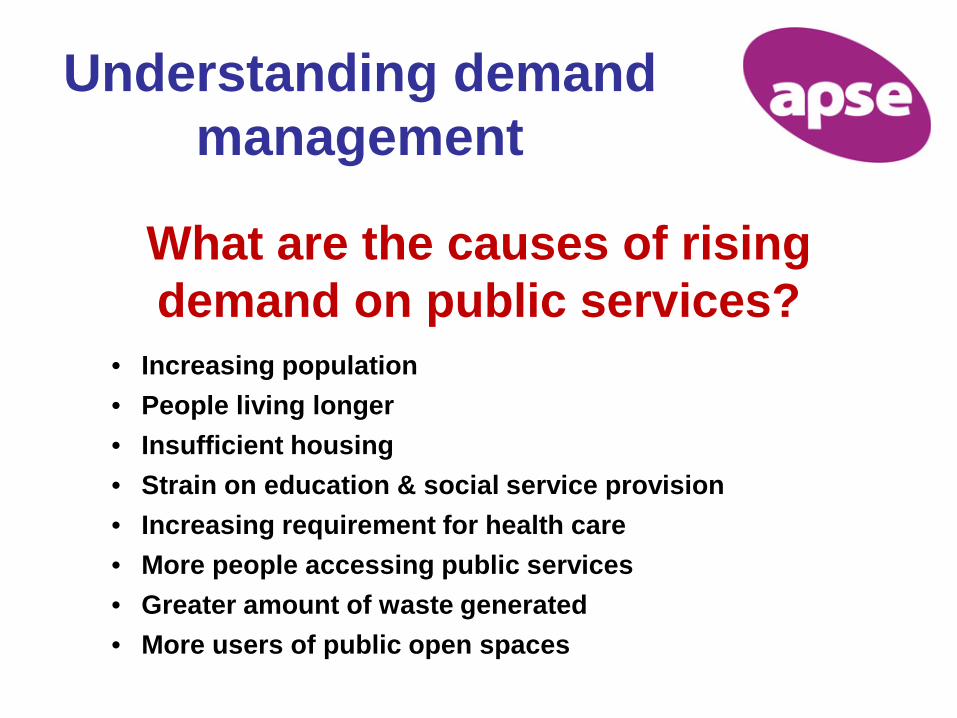
What are the causes of rising demand on public services?
• Increasing population • People living longer • Insufficient housing • Strain on education & social service provision • Increasing requirement for health care • More people accessing public services • Greater amount of waste generated • More users of public open spaces

Understanding demand management

Understanding demand management
Can demand exceed supply ? • Demand
• Infinite? • Uncontrollable? • Unchangeable? • Unmeetable?
• Supply
• Rationed by funding • Sole focus of managers

Back to Basics
Why do we do what we do?
• Social policy • Some things are important to everybody • Public health • Social well being • Economic well-being
• Cost/benefit of public services • Public provision can be more efficient than the market

Back to Basics
Why do we do what we do? • What is the service for? • Where does demand come from? • Does it tackle root causes i.e. Could demand be reduced by
doing something else? • How predictable is demand? • How much is failure demand and reworking? • What adds value? • Whose value?
Understanding demand management
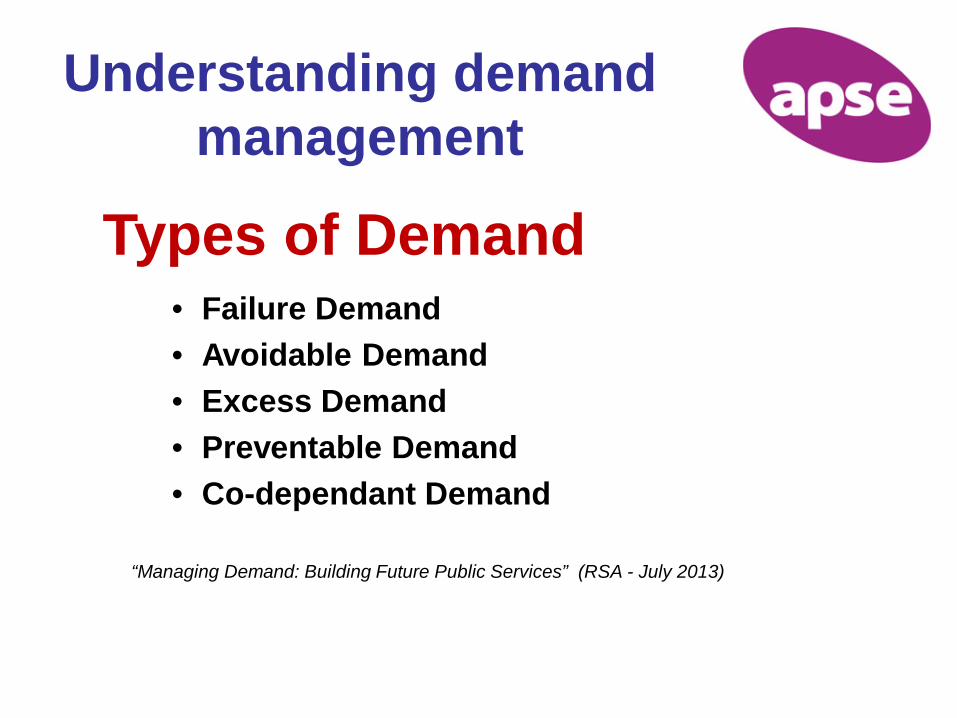
Types of Demand • Failure Demand • Avoidable Demand • Excess Demand • Preventable Demand • Co-dependant Demand
“Managing Demand: Building Future Public Services” (RSA - July 2013)

Failure Demand – Cause & Effect Service failure
Failure to meet
demand
Demand builds up
Demand becomes irresistible
Unplanned allocation of resources
Reduced efficiency
Increased cost
Understanding demand management
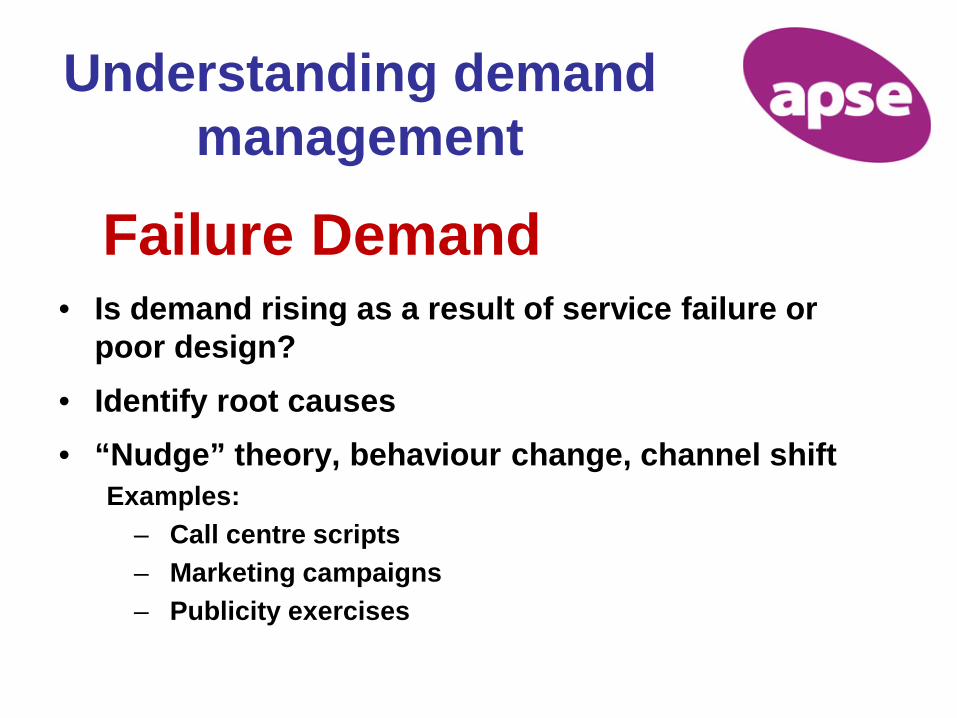
Failure Demand • Is demand rising as a result of service failure or
poor design? • Identify root causes • “Nudge” theory, behaviour change, channel shift
Examples: – Call centre scripts – Marketing campaigns – Publicity exercises

Understanding demand management
Avoidable & Excess Demand • Is service demand arising from certain behaviours
that could be changed? • Is the state providing more than is needed or
inadvertently creating demand through dependency? • Are people accessing services that they don’t
strictly need? (e.g. Hospital A&E services) • Shifting investment towards prevention
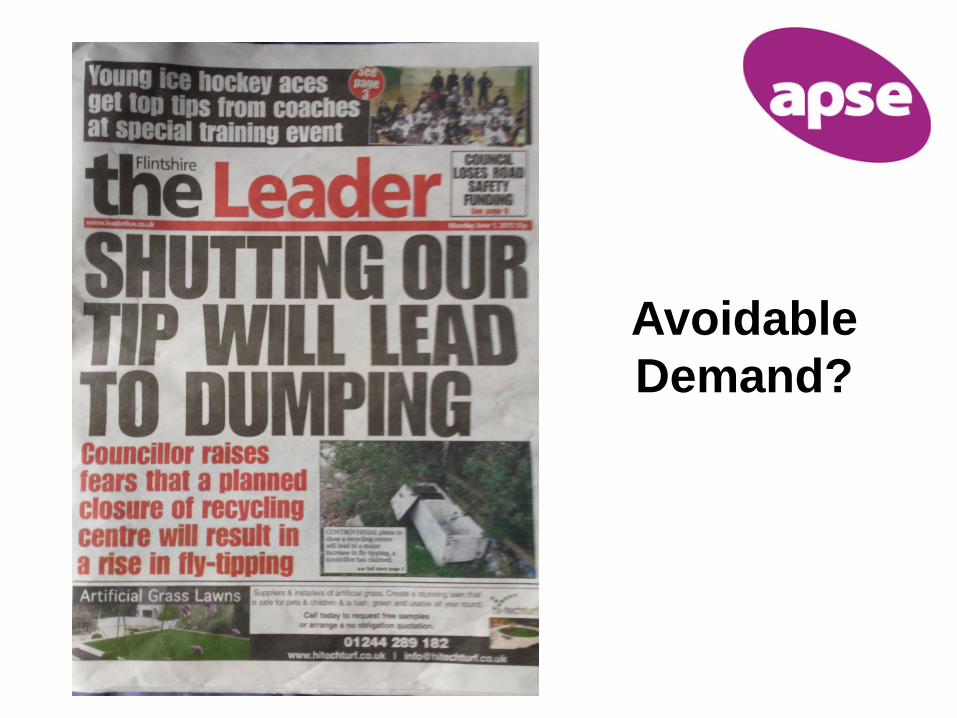
Avoidable Demand?

Understanding demand management
Avoidable & Excess Demand • Encourage behaviour change / “Nudge” theory
Examples: – Charging for bulky waste collection – Fine people for littering
• Change eligibility criteria Example: - Adult social care criteria
• Is the impact what is actually required? Example: - Street sweeping
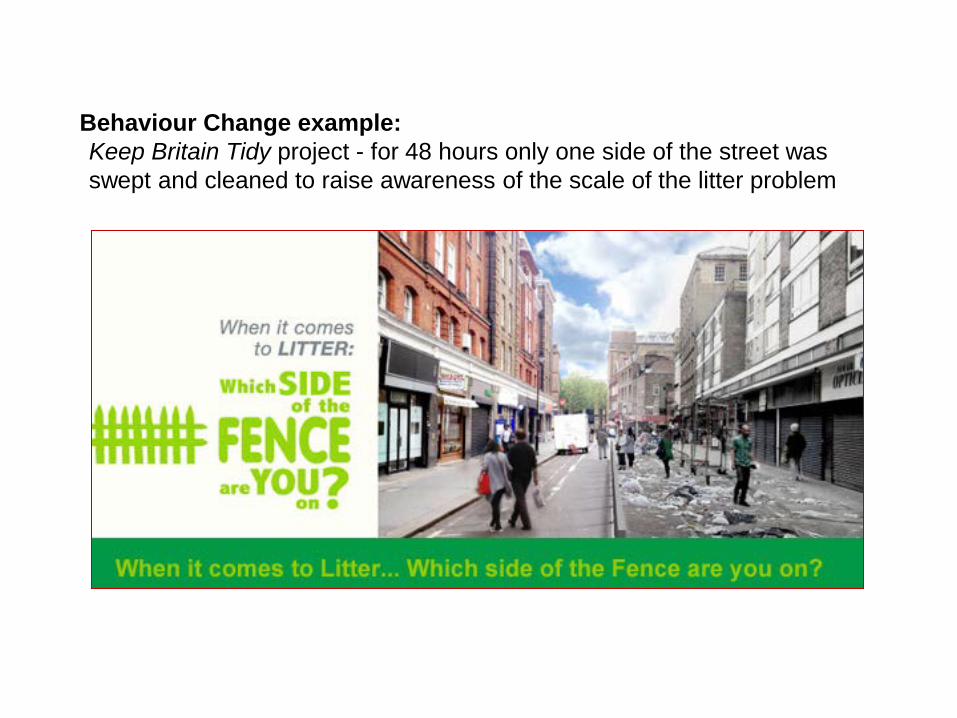
Behaviour Change example: Keep Britain Tidy project - for 48 hours only one side of the street was swept and cleaned to raise awareness of the scale of the litter problem

“Nudge” theory example: The picture of a fly in the urinals at Schiphol Airport has been touted as a simple, inexpensive way to reduce cleaning costs.
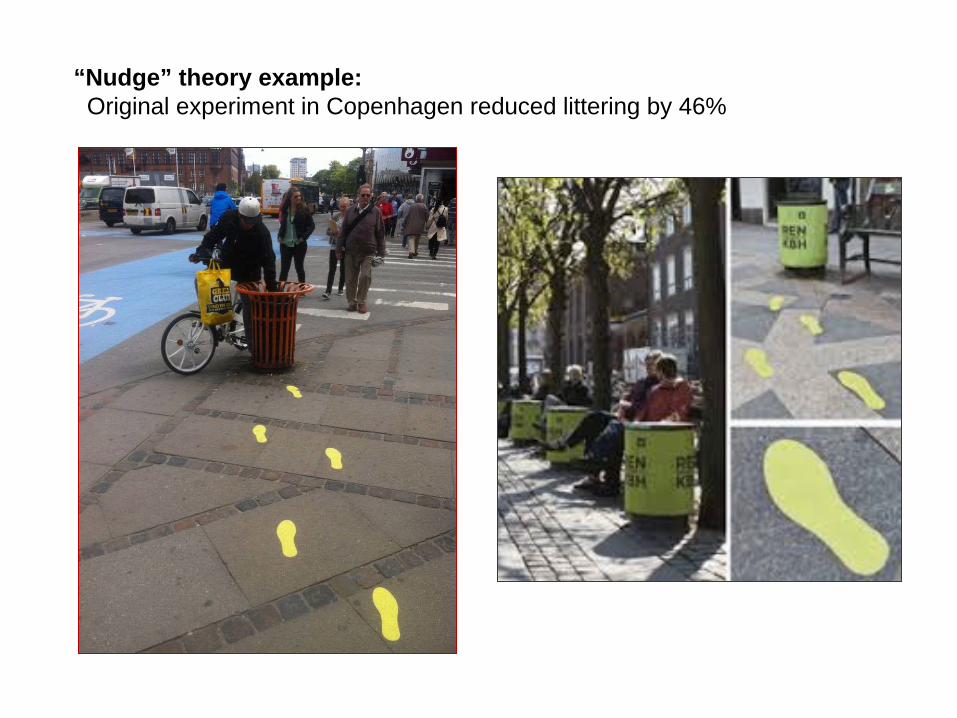
“Nudge” theory example: Original experiment in Copenhagen reduced littering by 46%
Understanding demand management
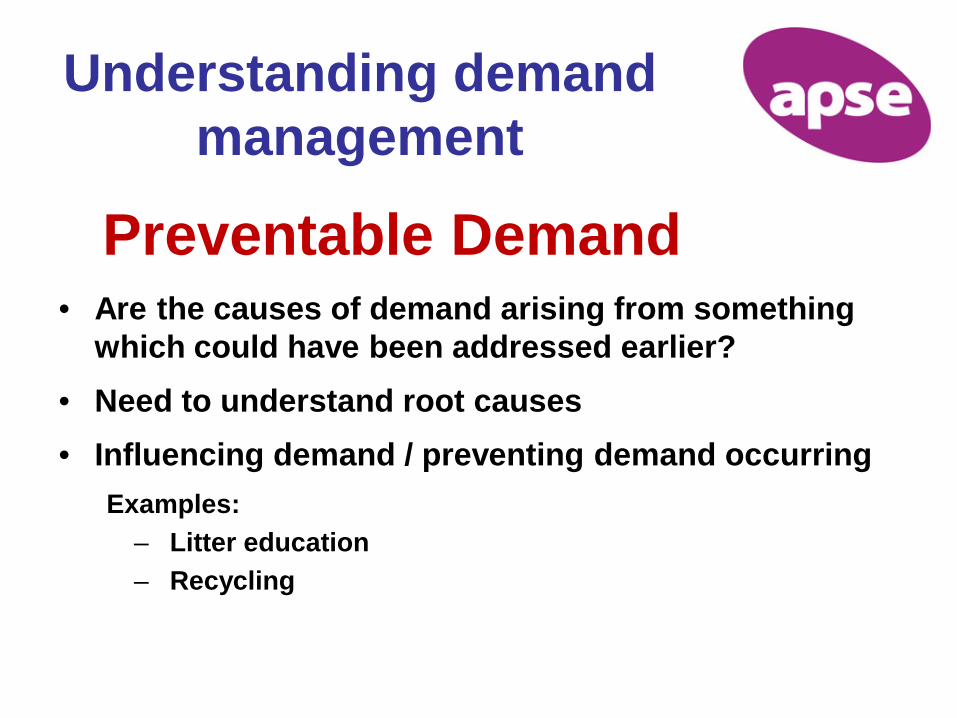
Preventable Demand • Are the causes of demand arising from something
which could have been addressed earlier? • Need to understand root causes • Influencing demand / preventing demand occurring
Examples: – Litter education – Recycling
Understanding demand management
Co-dependent Demand • Demand that impacts on different services • What strategies can be put into place to help build
the resilience and social and economic productivity of communities?
• Alternative strategies to uncover community and personal capacity
• Partnering opportunities

How Predictable is Demand?

Constant demand • Refuse Collection • CCTV Monitoring
Volatile demand • Housing Repairs • Call Centres
Examples of Types of Demand
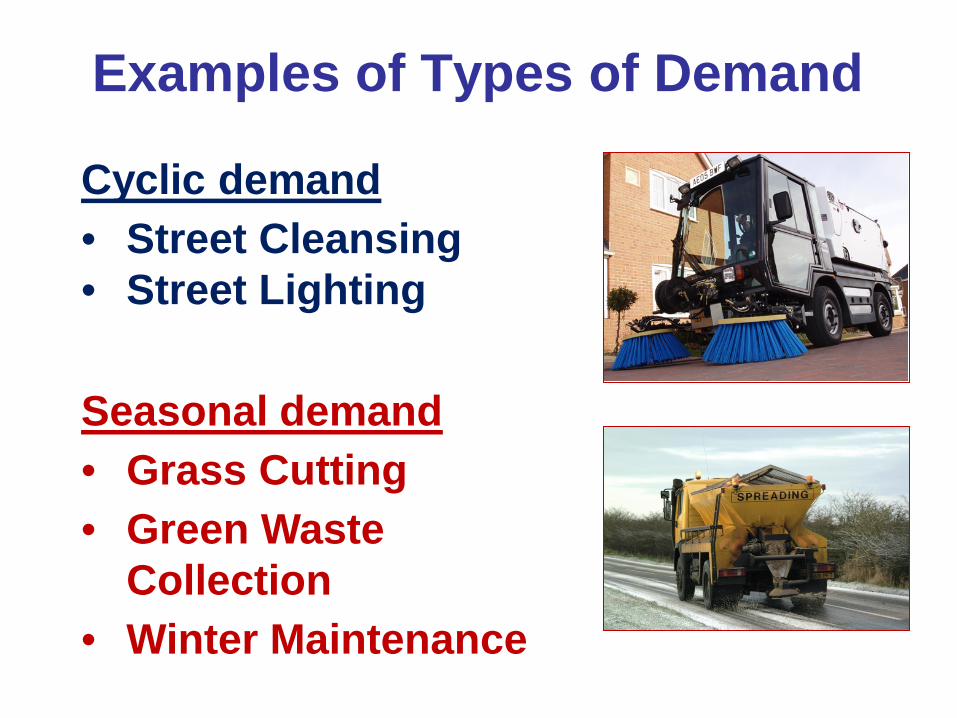
Cyclic demand • Street Cleansing • Street Lighting
Seasonal demand • Grass Cutting • Green Waste
Collection • Winter Maintenance
Examples of Types of Demand
• Understanding demand • Changing the nature of
demand • Reducing it? • Growing it? • Redirecting it?
• Looking to the future
Developing a systematic approach

Understanding demand / Developing alternatives
• Understanding where current demand comes from
• Critical Examination • Meeting the demand
• Working methods • Working hours
• Innovation

WHAT is achieved? Is It Necessary? (if so - WHY?)
What ELSE could be done?
What SHOULD be done?
WHERE is it done? WHY THERE? Where ELSE could it be done?
Where SHOULD it be done?
WHEN is it done? WHY THEN? When ELSE could it be done?
When SHOULD it be done?
WHO does it? WHY THAT PERSON? Who ELSE could do it? Who SHOULD do it?
HOW is it done WHY THAT WAY? How ELSE could it be done?
How SHOULD it be done?
Critical Examination
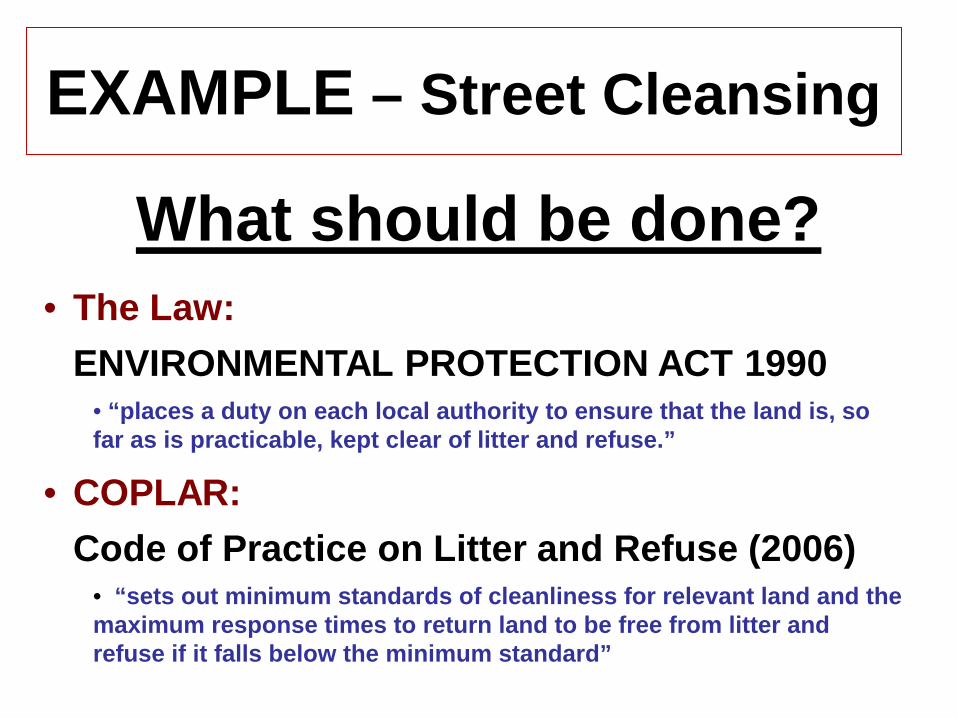
• The Law: ENVIRONMENTAL PROTECTION ACT 1990
• “places a duty on each local authority to ensure that the land is, so far as is practicable, kept clear of litter and refuse.”
• COPLAR: Code of Practice on Litter and Refuse (2006)
• “sets out minimum standards of cleanliness for relevant land and the maximum response times to return land to be free from litter and refuse if it falls below the minimum standard”
What should be done?
EXAMPLE – Street Cleansing
Where should it be done? Zoning is based on the intensity of activity in the area, from people and vehicles • High intensity of use (busy public areas)
• Medium intensity of use (‘everyday’ areas, including most housing areas occupied by people most of the time)
• Low intensity of use (lightly trafficked areas that do not impact upon most people’s lives most of the time)
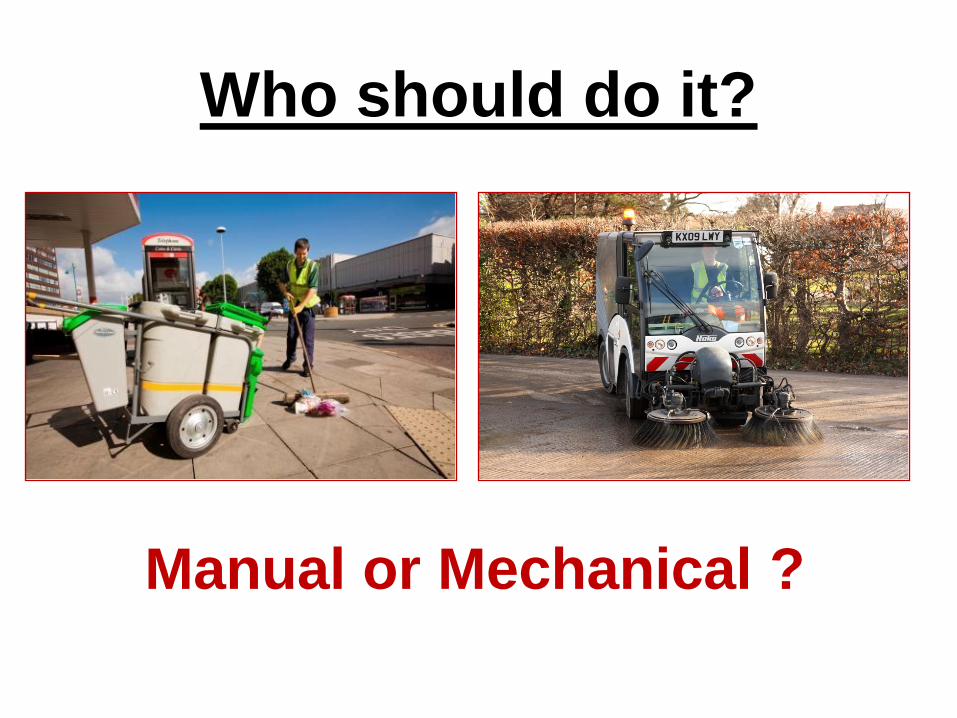
Who should do it?
Manual or Mechanical ?
How should it be done? • Sweeping routes based on time
study data to match zonings? • Neighbourhood / area based? • Mix of manual & mechanical
using local knowledge • Timing of operation for most
efficient use of resources
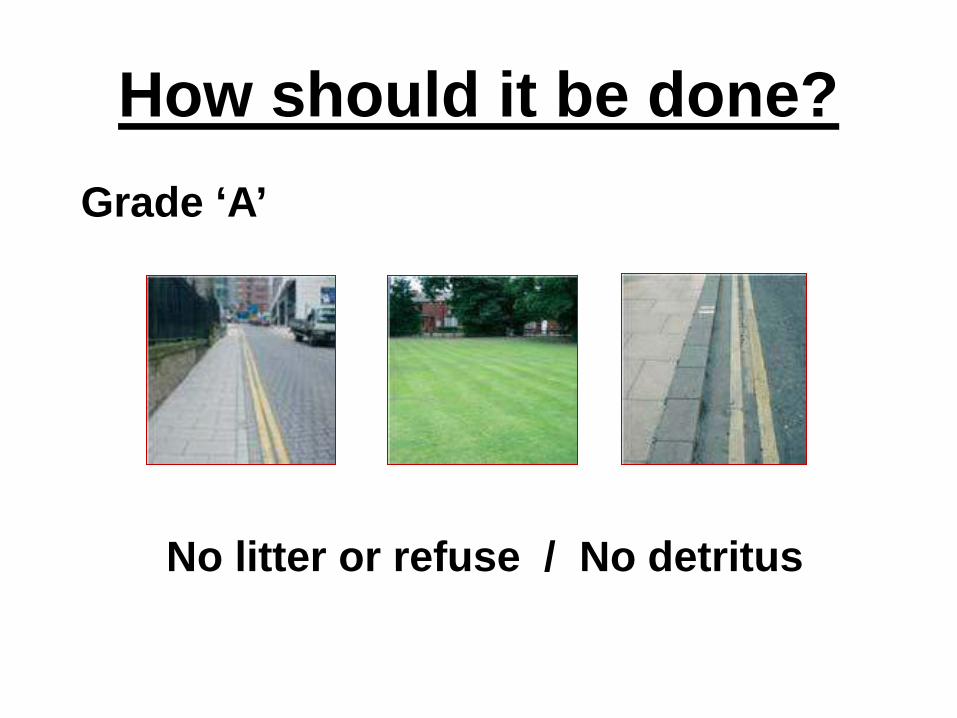
How should it be done? Grade ‘A’
No litter or refuse / No detritus
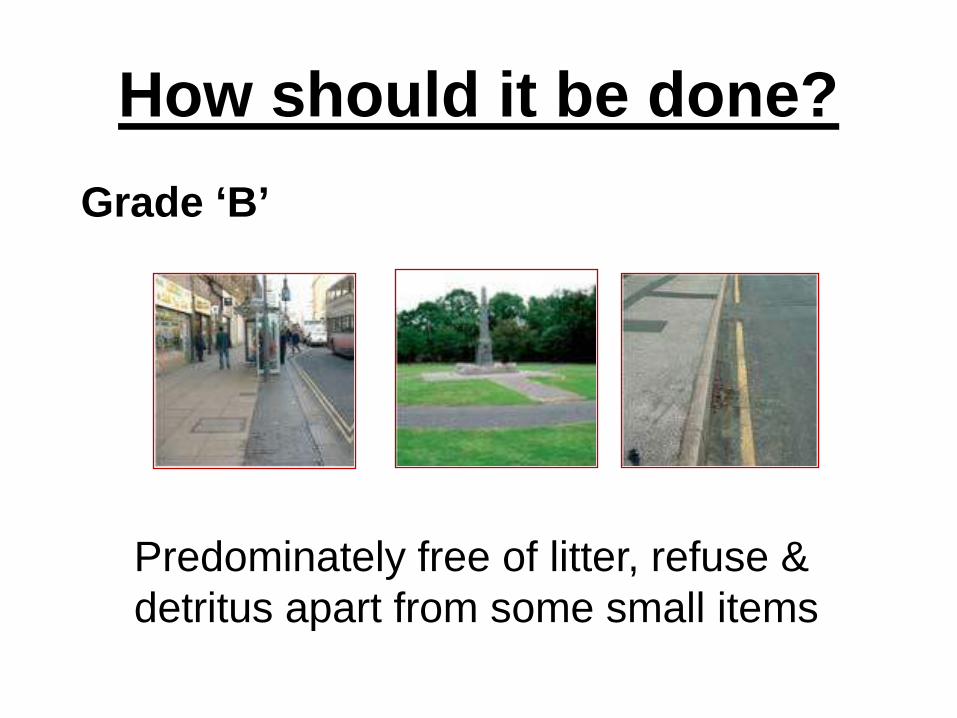
How should it be done? Grade ‘B’
Predominately free of litter, refuse & detritus apart from some small items
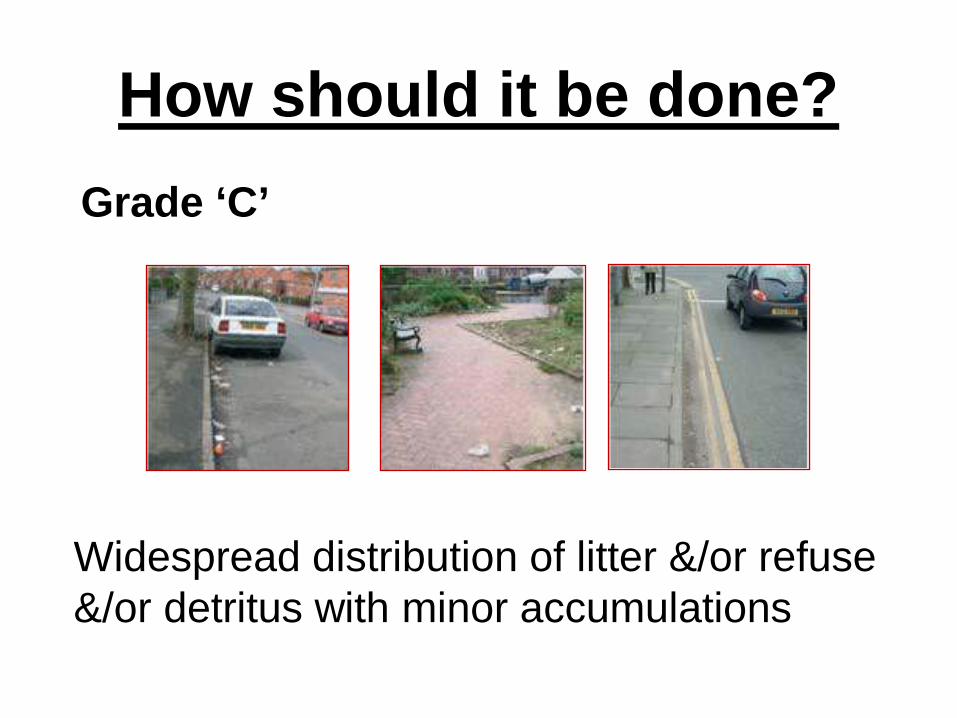
How should it be done? Grade ‘C’
Widespread distribution of litter &/or refuse &/or detritus with minor accumulations
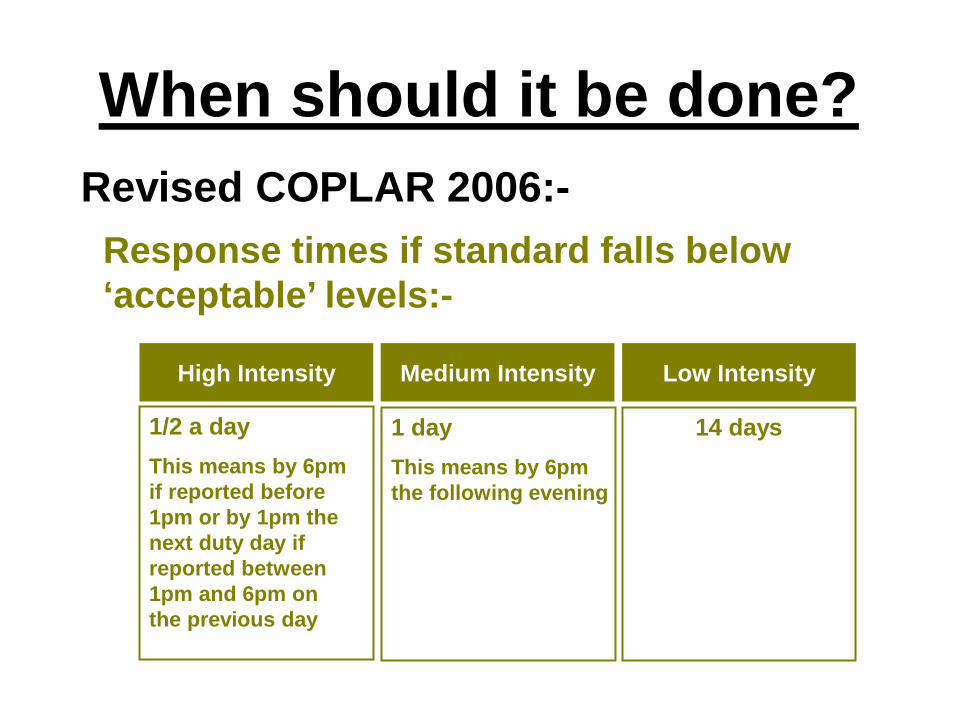
When should it be done? Revised COPLAR 2006:-
Response times if standard falls below ‘acceptable’ levels:-
High Intensity Medium Intensity Low Intensity
1/2 a day
This means by 6pm if reported before 1pm or by 1pm the next duty day if reported between 1pm and 6pm on the previous day
1 day
This means by 6pm the following evening
14 days
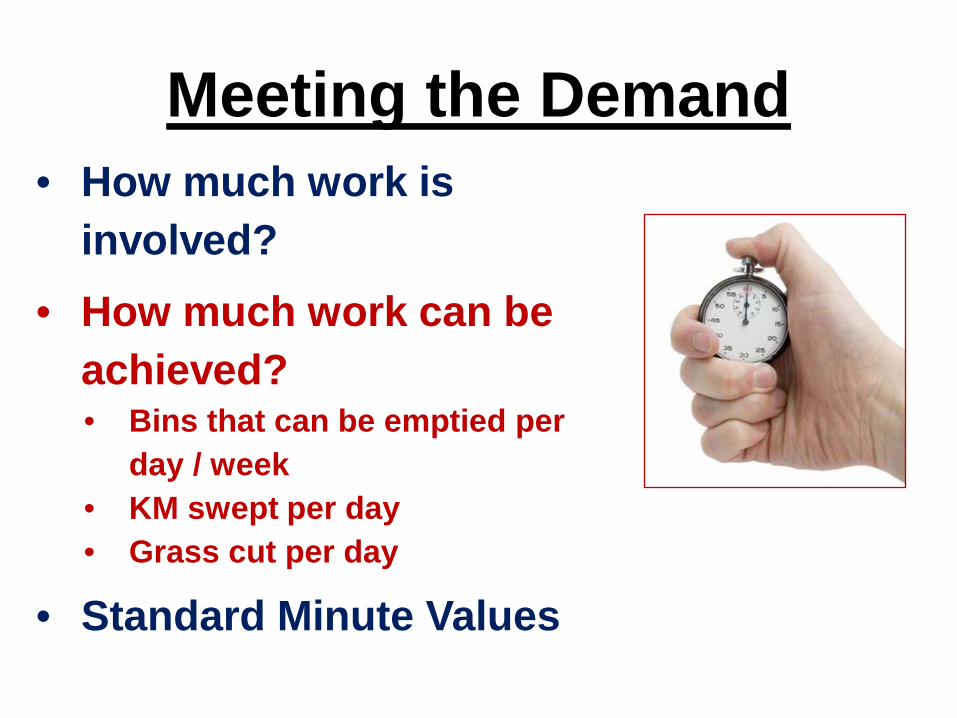
Meeting the Demand • How much work is
involved? • How much work can be
achieved? • Bins that can be emptied per
day / week • KM swept per day • Grass cut per day
• Standard Minute Values

Matching human resources to service needs
• These are extraordinary times • Thinking “outside the box” is
required • Business demand – need to go
back to basics? • Service needs may have to change
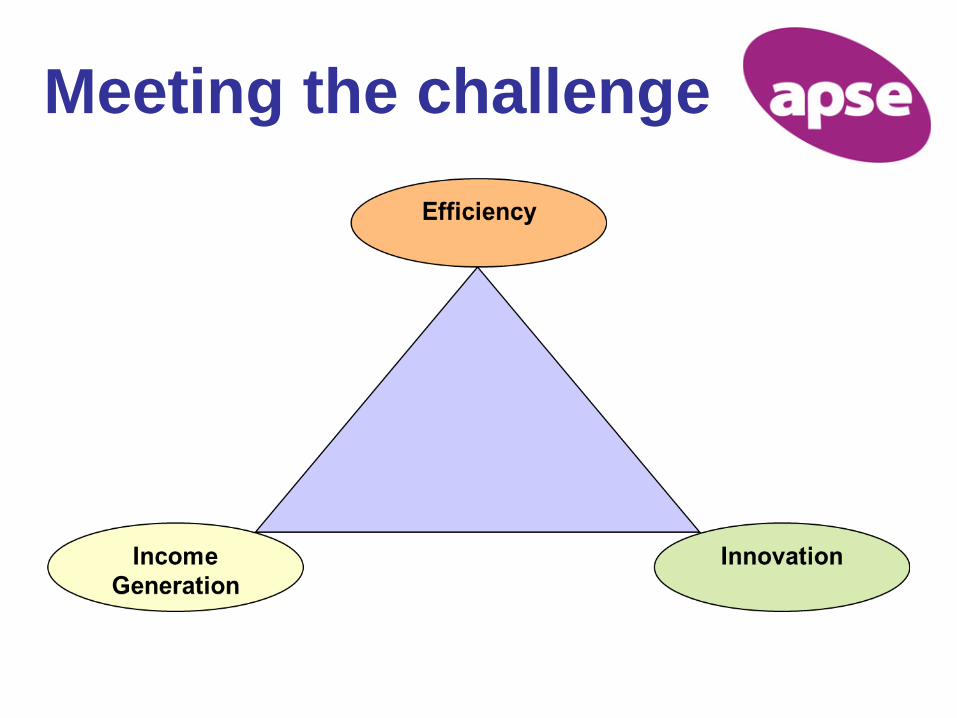
Meeting the challenge

Blue Ocean Strategy Demand Innovation
Blue Ocean Strategy
Key principles: W Chan Kim & Renee Mauborgne Blue Ocean Strategy Unit: INSEAD • Value innovation • Thinking beyond competition strategy • Creating new demand • Finding uncontested market space • Avoiding commoditisation of product
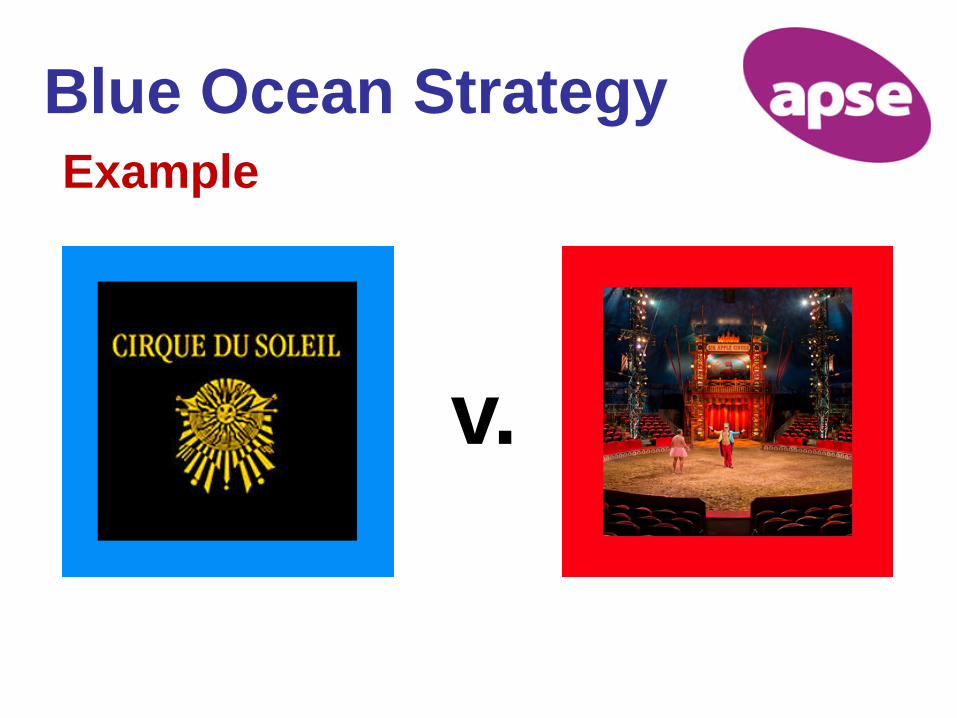
Blue Ocean Strategy Example
v.

Blue Ocean Strategy Example
v.

Blue Ocean Strategy In a public service context
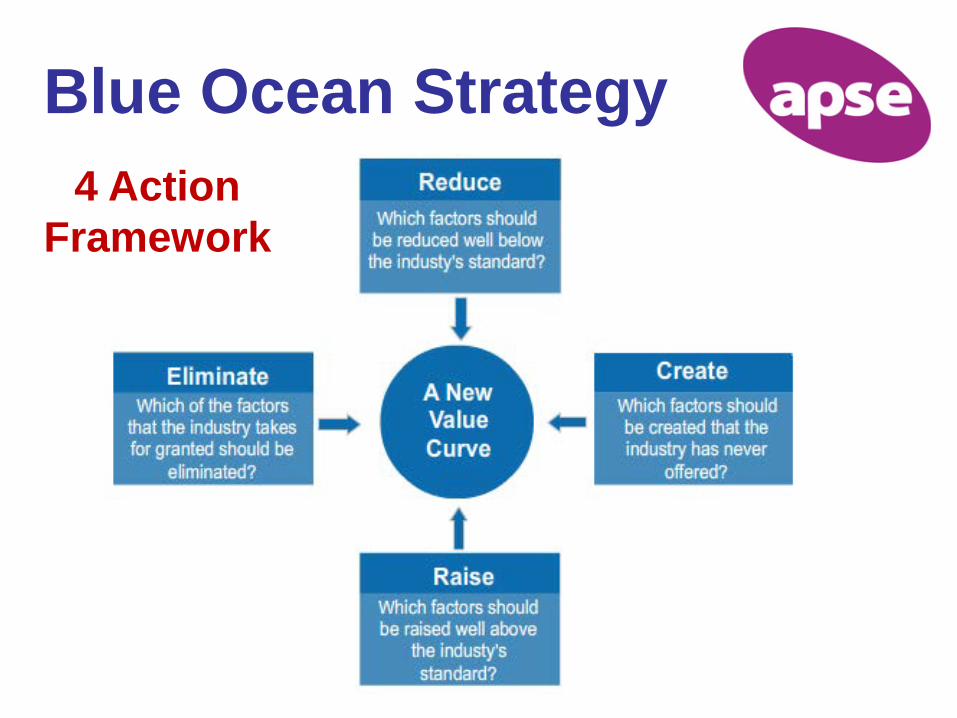
Blue Ocean Strategy 4 Action
Framework

McDonalds - Value Curve
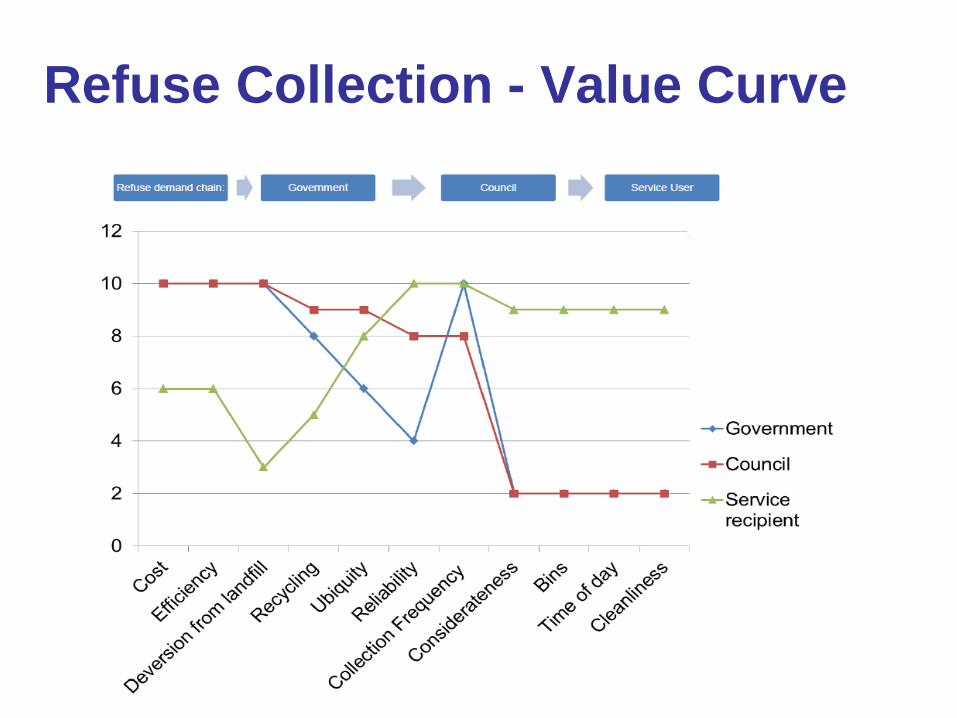
Refuse Collection - Value Curve
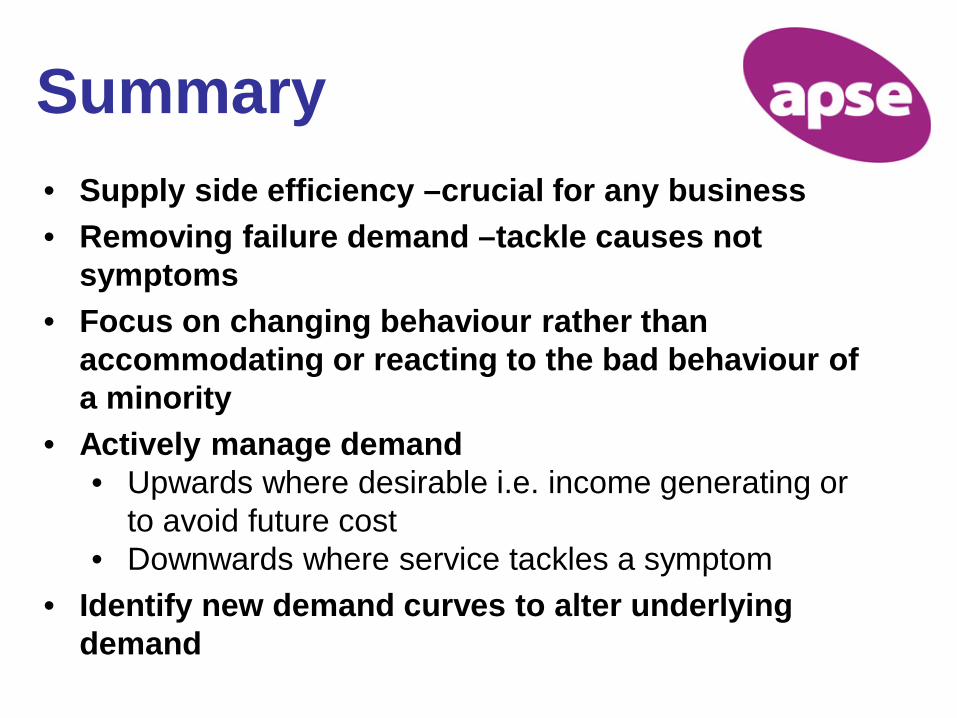
Summary • Supply side efficiency –crucial for any business • Removing failure demand –tackle causes not
symptoms • Focus on changing behaviour rather than
accommodating or reacting to the bad behaviour of a minority
• Actively manage demand • Upwards where desirable i.e. income generating or
to avoid future cost • Downwards where service tackles a symptom
• Identify new demand curves to alter underlying demand

Commercialism, entrepreneurialism & the local authority
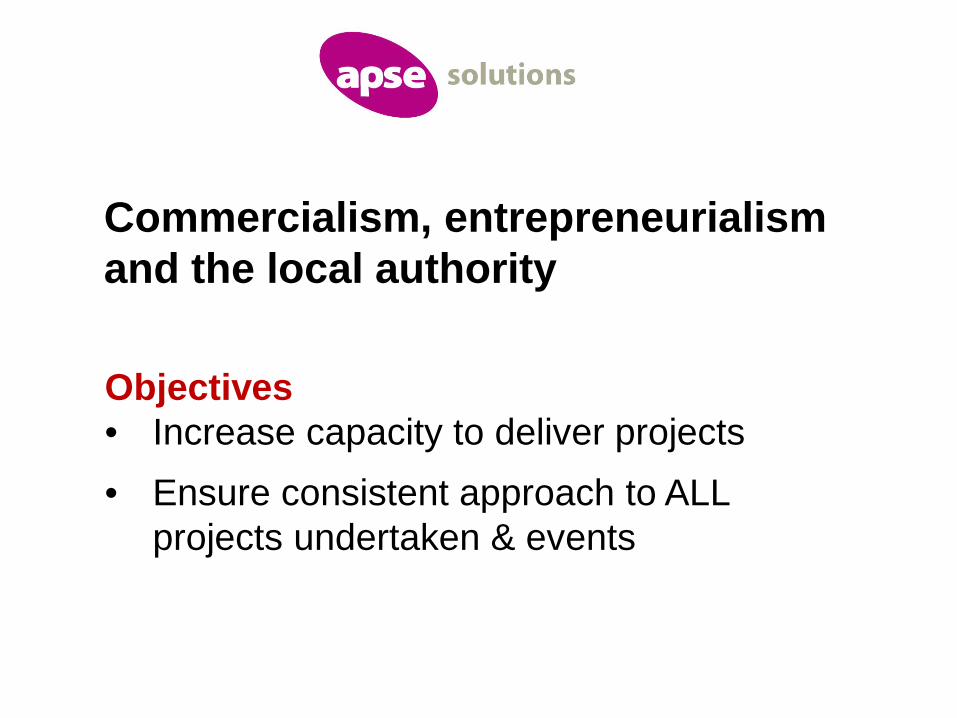
Commercialism, entrepreneurialism and the local authority
Objectives • Increase capacity to deliver projects • Ensure consistent approach to ALL
projects undertaken & events

What do we mean by Commercial?
• Income generation • Understanding markets • Being competitive • Maximising value of the
public pound • Acting like the private sector?
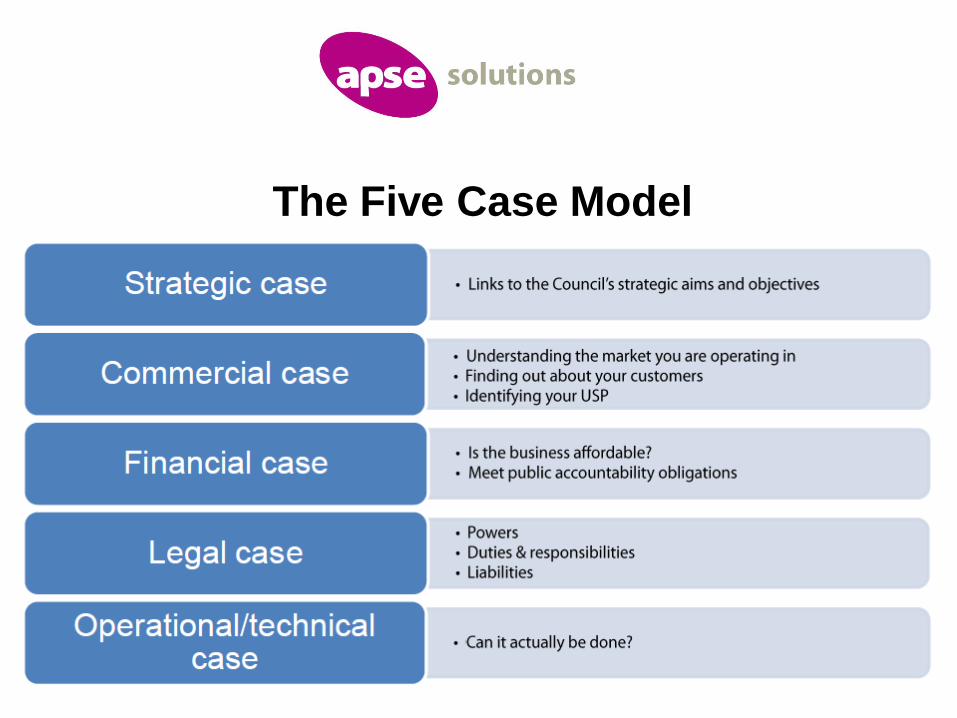
The Five Case Model
Important points to note
• Risk Assessment needed as trading is inherently risky
• Must not undermine core business of local authority service delivery
• Needs a corporate “buy-in” rather than departmental silos
• A business case must be made

Legal Case
• Local Government Act 2003 • S93 Charging Power • S95 Trading through a company
Can charge for a service that is authorised to be undertaken, but not required as an enactment
Legal Case • Localism Act 2011
• General power of competence • Power to do anything that individuals generally
may do (inc. anything “unlike anything” that public bodies do)
• Anywhere in the UK or abroad • For commercial purpose or otherwise • For the benefit of the authority and its area or
persons resident or otherwise
Pricing • Price is determined by what purchasers are
prepared to pay for the product • However there will be no product if the price is
not high enough to make production worth while
• In perfect competition price would be equal to marginal cost i.e. there would be no profit but suppliers would break even and be able to service their debts

What we need to know • What our costs will be within a defined period?
• Fixed cost • Variable cost
• What price is achievable for the product? • At various levels of supply
• What total sales are achievable within the period? • At various price levels

So we can work out … • Whether income will be enough to cover costs
technically includes normal profit • Whether we might return a profit, i.e. earn more
than we spend • The timescale over which this happens to:
• Project cash-flow • Work out funding requirement to cover cost
before income begins to exceed outgoings
“Marketplace success goes to those companies / organisations best matched to the current environment imperatives –those who can deliver what people are ready to buy”
Philip Kotler “Marketing Management”

Could be achieved through: • Distinctive design • Branding • Performance • Price • USP
• key to identify this and communicate it to customers
Product differentiation
Branding
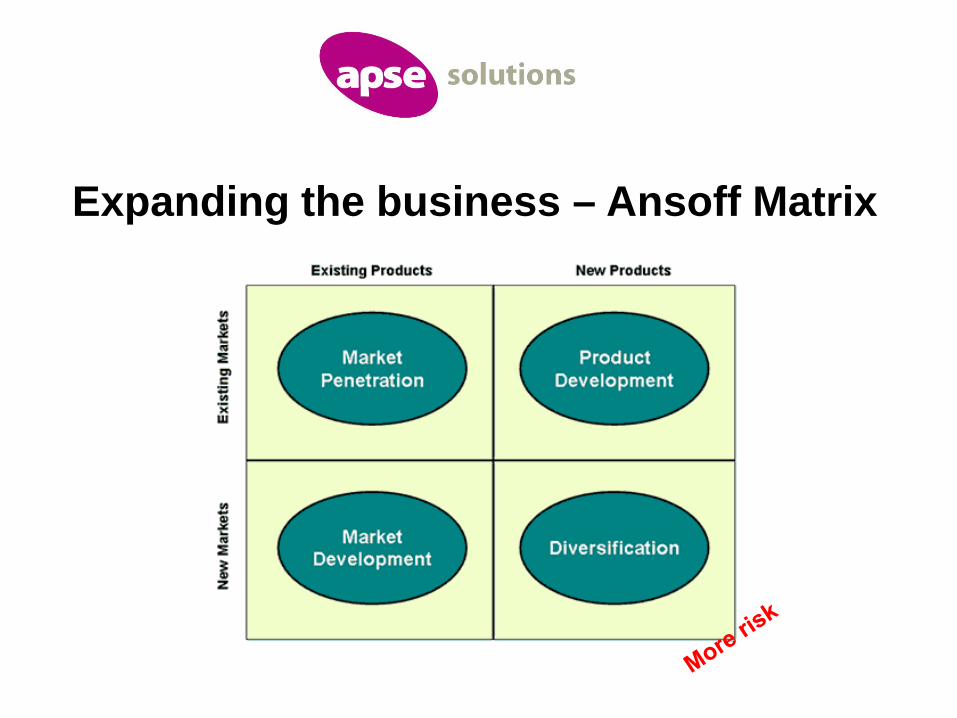
Expanding the business – Ansoff Matrix
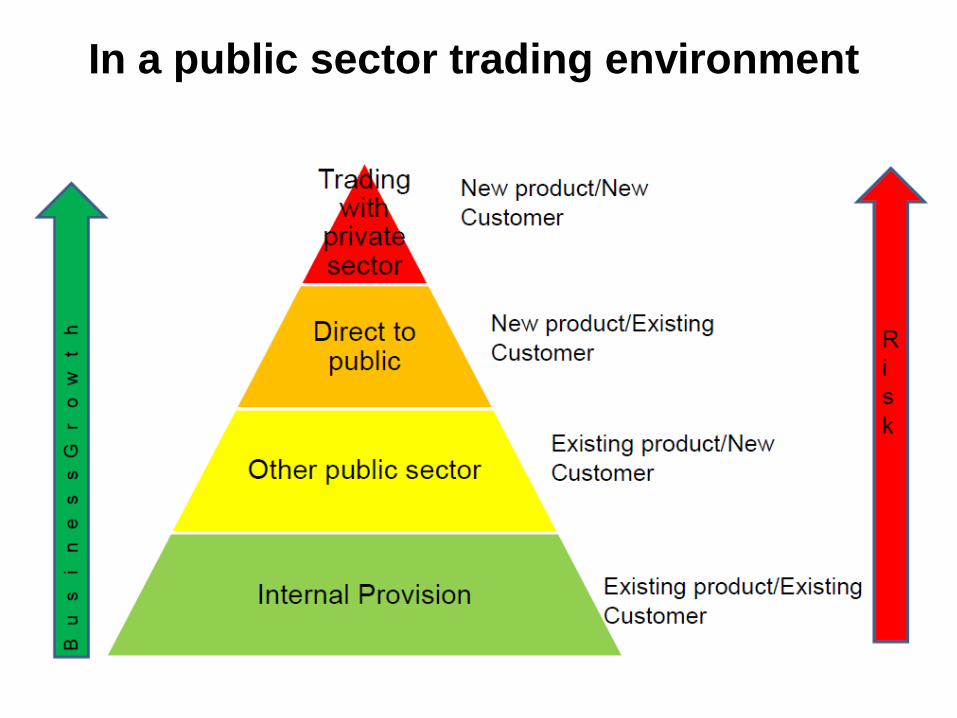
In a public sector trading environment
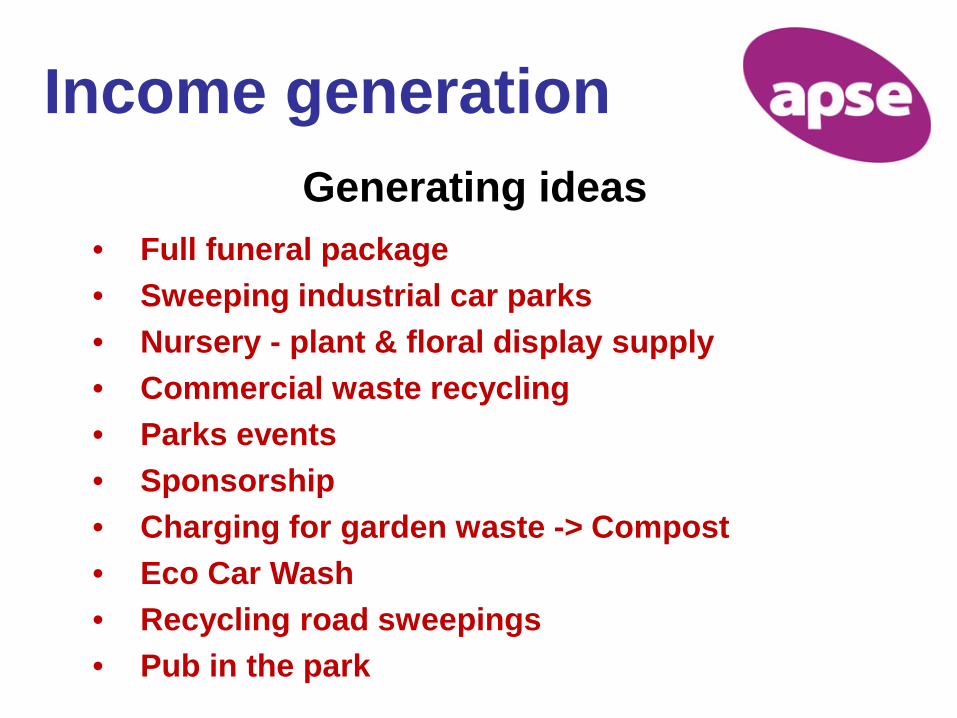
Income generation Generating ideas
• Full funeral package • Sweeping industrial car parks • Nursery - plant & floral display supply • Commercial waste recycling • Parks events • Sponsorship • Charging for garden waste -> Compost • Eco Car Wash • Recycling road sweepings • Pub in the park

Applying performance analysis to service
transformation
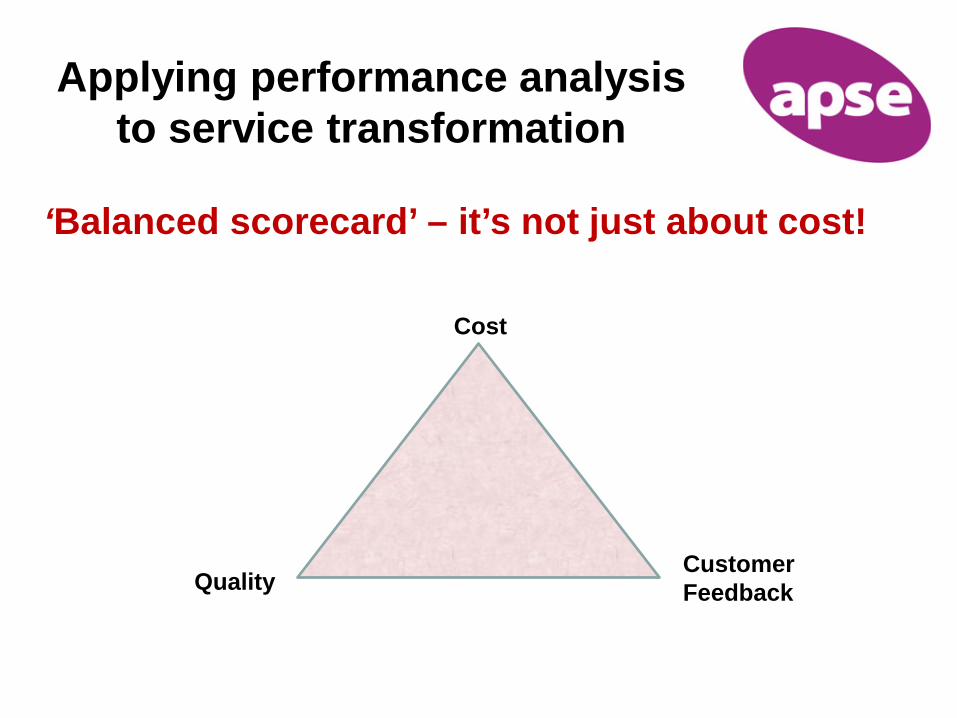
‘Balanced scorecard’ – it’s not just about cost!
Cost
Quality Customer Feedback
Applying performance analysis to service transformation
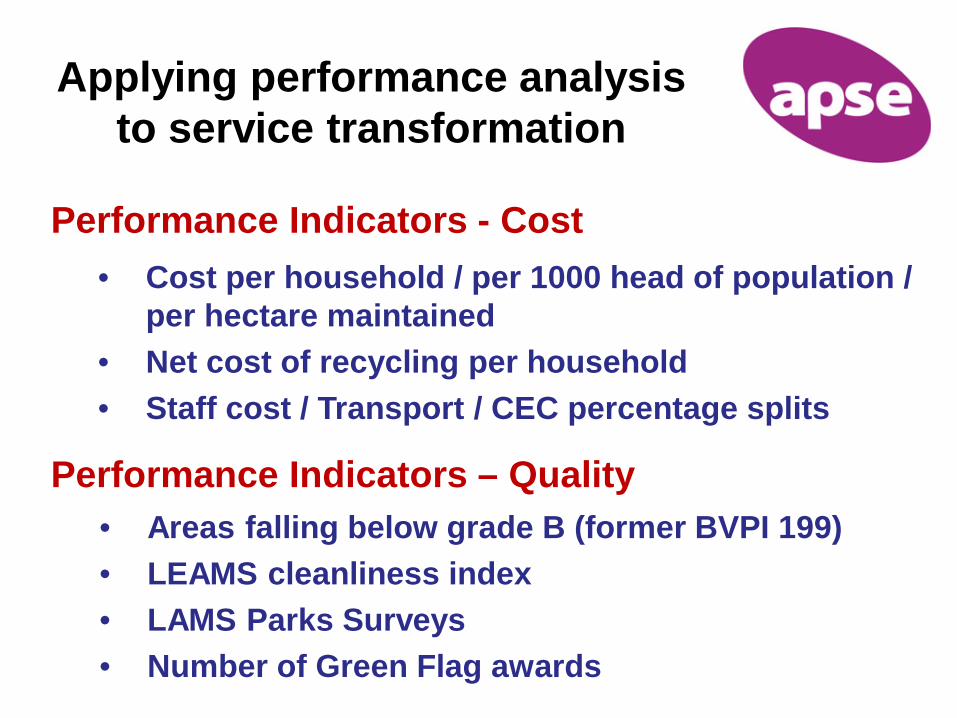
Performance Indicators - Cost
Applying performance analysis to service transformation
• Cost per household / per 1000 head of population / per hectare maintained
• Net cost of recycling per household • Staff cost / Transport / CEC percentage splits
Performance Indicators – Quality • Areas falling below grade B (former BVPI 199) • LEAMS cleanliness index • LAMS Parks Surveys • Number of Green Flag awards

Performance Indicators – Quality (continued)
Applying performance analysis to service transformation
• Tonnes of domestic waste sent for recycling per household
• Percentage of households covered by kerbside recycling collections
• Quality assurance & consultation
Performance Indicators - Customer Satisfaction • Latest survey scores
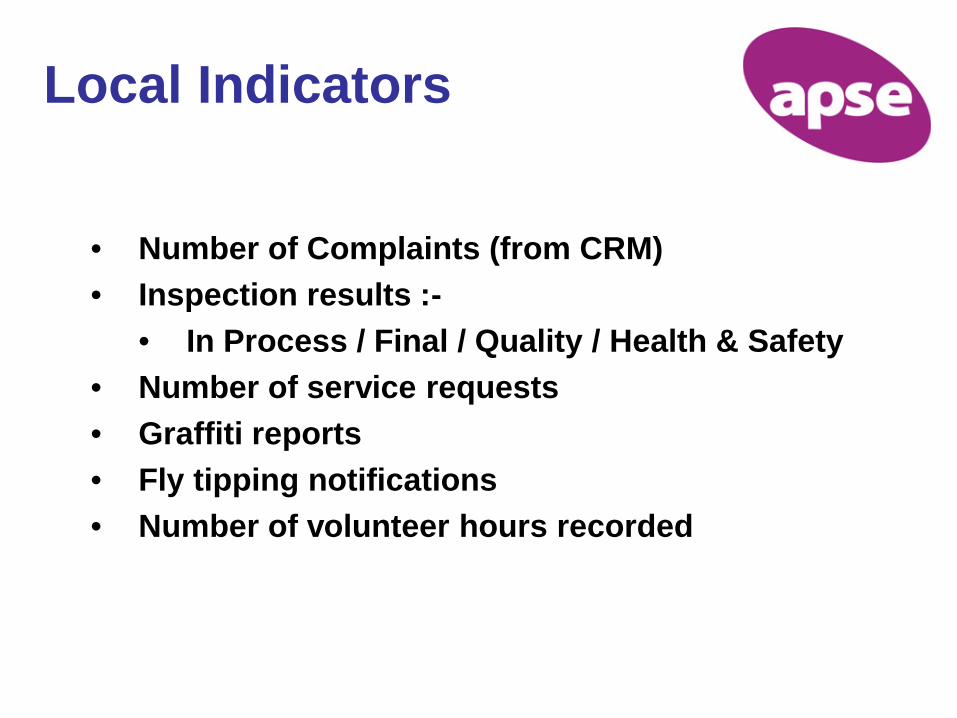
Local Indicators
• Number of Complaints (from CRM) • Inspection results :-
• In Process / Final / Quality / Health & Safety • Number of service requests • Graffiti reports • Fly tipping notifications • Number of volunteer hours recorded

www.apse.org.uk

www.apse.org.uk
Contact details Dave Henrys
Email: [email protected]
APSE Solutions - enquiries to Andy Mudd, Principal Consultant
Email: [email protected]
Association for Public Service Excellence
2nd floor Washbrook House, Lancastrian Office Centre, Talbot Road, Old Trafford, Manchester M32 0FP.
telephone: 0161 772 1810 fax: 0161 772 1811
web:www.apse.org.uk


![Ansoff Revisited [1]](https://static.documents.pub/doc/80x56/577d20e11a28ab4e1e93fbda/ansoff-revisited-1.jpg)
