20
Chapter 7 Current and Future Air Quality – Desert Nonattainment Areas South Coast Air Quality Management District Cleaning the air that we breathe... TM

Chapter 7Current and Future Air Quality –
Desert Nonattainment Areas
South Coast Air Quality Management DistrictCleaning the air that we breathe...TM

CHAPTER 7
CURRENT AND FUTURE AIR QUALITY
– DESERT NONATTAINMENT AREAS
Introduction
Air Quality Setting
Future Air Quality
Conclusions

Chapter 7: Current & Future Air Quality – Desert Nonattainment Areas
7-1
INTRODUCTION
The District has jurisdiction over the South Coast Air Basin and the desert portion of
Riverside County in the Salton Sea Air Basin. Figure 7-1 shows a map of the area
and topography. The Coachella Valley, located in the desert portion of Riverside
County does not exceed the federal standard for PM2.5. However, it exceeds the
PM10 federal standard on days when high wind events cause transport of windblown
dust from both disturbed and natural desert areas (these days can be flagged as
exceptional events1
under U.S. EPA regulations). Also, the Coachella Valley
exceeds the federal 8-hour ozone standards, both the 1997 standard (0.08 ppm, or 80
ppb) and the lower 2008 standard (0.075 ppm, or 75 ppb). For both ozone standards,
the Coachella Valley is classified as a “severe” ozone nonattainment area. This
chapter summarizes the current air quality setting for the Coachella Valley and the
most recent updates to the attainment status.
While the 2007 AQMP addressed and satisfied the Clean Air Act (CAA) planning
requirements for the Coachella Valley, the 2012 AQMP specifically addresses CAA
planning requirements for the 24-hour PM2.5 standard in the South Coast Air Basin
and not in the Coachella Valley, which is designated by U.S. EPA as
unclassifiable/attainment of this standard. Since the Coachella Valley is not in
attainment of the federal 8-hour ozone standards, this chapter will address the current
status of ozone air quality and provide the latest projections of future ozone levels,
based on the latest emissions inventories and modeling efforts. However, the 2007
AQMP adequately addressed and satisfied the CAA planning requirements for ozone
in the Coachella Valley, and this chapter is for information only. This AQMP
confirms that with the latest emissions and modeling projections, the strategy toward
attainment of the federal ozone standards in the Coachella Valley remains effective.
On April 18, 2003, U.S. EPA approved the Coachella Valley State Implementation
Plan (2003 CVSIP), which addressed future year attainment of the PM10 standards
and incorporated the latest mobile source emissions model results and planning
assumptions. Over the past five years, annual average PM10 concentrations have
met the levels of the revoked federal annual standard (50 µg/m3), and peak 24-hour
1The U.S. EPA Exceptional Events Rule, Treatment of Data Influence by Exceptional Events, became effective May
21, 2007. The previous U.S. EPA Natural Events Policy for Particulate Matter was issued on May 30, 1996.
Under the Exceptional Events Rule, U.S. EPA allows certain data to be flagged in the U.S. EPA Air Quality System
(AQS) database and not considered for NAAQS attainment status when that data is influenced by exceptional
events, such as high winds, wildfires, volcanoes, or some cultural events (Independence Day fireworks) that meet
strict requirements.

Final 2012 AQMP
7-2
average PM10 concentrations have not exceeded the current federal standard (150
µg/m3). The Coachella Valley is currently eligible for redesignation as attainment
(after high-wind natural events were flagged under the Exceptional Events Rule).
Requests have been made to U.S. EPA to redesignate the Coachella Valley and South
Coast Air Basin as attainment for PM10; the redesignations are still pending at this
time2. Since the 2012 AQMP does not include new modeling efforts for PM10,
future projections for Coachella Valley PM10 levels in the 2003 CVSIP are still
applicable.
Like the South Coast Air Basin, the Coachella Valley is a rapidly growing area, as
shown in Table 7-1. By 2030, the population in the Coachella Valley is projected to
more than double that of 2000. On a percentage basin, the Coachella Valley growth
exceeds that of the Basin. This population growth is taken into account in the
emissions projections for future years, used to demonstrate attainment of the air
quality standards.
TABLE 7-1
Historic Population and Projections for South Coast Air Basin and Coachella Valley
AREA 1980 1990 2000 2010 2020 2030
South Coast Air Basin 10,500,000 13,022,000 14,681,000 15,759,412 16,901,492 18,129,690
Coachella Valley 139,000 267,000 320,892 439,357 558,321 710,430
2 U.S. EPA has requested additional temporary PM10 monitoring in the southeastern Coachella Valley to further
assess windblown dust in that area; this project is currently ongoing.

Chapter 7: Current & Future Air Quality – Desert Nonattainment Areas
7-3
FIGURE 7-1
Location and Topography of the Coachella Valley (Dashed red box indicates the San Gorgonio Pass;
SCAQMD Coachella Valley air monitoring stations at Palm Springs and Indio)
AIR QUALITY SETTING
Air Quality Summary
In 2011, the District monitored air quality at two permanent locations in the Riverside
county portion of the Salton Sea Air Basin (SSAB), both in the Coachella Valley.
One air monitoring station (Palm Springs) is located closer to the San Gorgonio Pass,
predominantly downwind of the densely populated Basin. The other station (Indio)

Final 2012 AQMP
7-4
is located further into the Coachella Valley, on the predominant downwind side of the
main population areas of the Coachella Valley. A summary of the recent and historic
air pollution data collected in the Coachella Valley is included in Appendix II.
Information on the health effects associated with criteria air pollutants are
summarized in Chapter 2 and detailed in Appendix I.
Attainment Status
In 2011, air pollutant concentrations in the Coachella Valley exceeded state and
federal standards for both ozone and PM10. However, the two days that exceeded
the federal 24-hour PM10 standard were associated with high-wind natural events and
have been flagged in the U.S. EPA Air Quality System (AQS) database to be
excluded for comparison to the National Ambient Air Quality Standards (NAAQS), as
allowed by the U.S. EPA Exceptional Events Rule. After application of the U.S.
EPA Exceptional Event Rule (and its predecessor, the Natural Events Policy) to high
wind natural events in the Coachella Valley, no days since the mid-1990s have
exceeded the federal 24-hour PM10 standard at Indio or Palm Springs. As a result,
the District requested that U.S. EPA redesignate the Coachella Valley from
nonattainment to attainment of the PM10 NAAQS. Further action by U.S. EPA on
this request is still pending. The current federal NAAQS attainment designations for
the Coachella Valley are presented in Table 7-2.
The maximum concentrations of ozone, PM2.5, PM10, nitrogen dioxide (NO2),
carbon monoxide (CO), and sulfate (SO42-
) recorded at these locations in 2011 are
shown in Figure 7-2, as percentages of the state and federal standards. Figure 7-3
shows the Coachella Valley design value3 for ozone, PM2.5 and PM10 for the 3-year
period 2009-2011, as percentages of the current and revoked federal standards.
3 A design value is a statistic that describes the air quality status of a given area relative to the level and form of the
National Ambient Air Quality Standards (NAAQS). For most criteria pollutants, the design value is a 3-year
average and takes into account the form of the short-term standard (e.g., 98th
percentile, fourth high value, etc.).

Chapter 7: Current & Future Air Quality – Desert Nonattainment Areas
7-5
TABLE 7-2
National Ambient Air Quality Standards (NAAQS) Attainment Status
Coachella Valley Portion of the Salton Sea Air Basin
CRITERIA
POLLUTANT AVERAGING TIME DESIGNATION
a)
ATTAINMENT
DATE b)
1979
1-Hour Ozonec)
1-Hour
(0.12 ppm) Nonattainment (Severe-17)
11/15/2007
(not timely attained)c)
1997
8-Hour Ozoned)
8-Hour
(0.08 ppm) Nonattainment (Severe-15) 6/15/2019
2008
8-Hour Ozone
8-Hour
(0.075 ppm) Nonattainment (Severe-15) 12/31/2027
CO 1-Hour (35 ppm)
8-Hour (9 ppm) Unclassifiable/Attainment Unclassifiable/Attainment
NO2e)
1-Hour (100 ppb) Unclassifiable/Attainment Unclassifiable/Attainment
Annual (0.053 ppm) Unclassifiable/Attainment Unclassifiable/Attainment
SO2f)
1-Hour (75 ppb) Designations Pending Designations Pending
24-Hour (0.14 ppm)
Annual (0.03 ppm) Unclassifiable/Attainment Unclassifiable/Attainment
PM10 24-hour (150 µg/m3) Nonattainment (Serious)g)
12/31/2006
(redesignation
request submitted)g)
PM2.5 24-Hour (35 µg/m
3)
Annual (15.0 µg/m3)
Unclassifiable/Attainment Unclassifiable/Attainment
Lead 3-Months Rolling
(0.15 µg/m3)
Unclassifiable/Attainment Unclassifiable/Attainment
a) U.S. EPA often only declares Nonattainment areas; everywhere else is listed as Unclassifiable/Attainment or
Unclassifiable
b) A design value below the NAAQS for data through the full year or smog season prior to the attainment date is
typically required for attainment demonstration
c) 1-hour ozone standard (0.13 ppm) was revoked, effective June 15, 2005; the Southeast Desert Modified Air Quality
Management Area, including the Coachella Valley, did not attain this standard based on 2005-2007 data and has
some continuing obligations under the former standard (latest 2009-2011 data shows attainment)
d) 1997 8-hour ozone standard (0.08 ppm) was reduced (0.075 ppm), effective May 27, 2008; the 1997 ozone standard
and most related implementation rules remain in place until the 1997 standard is revoked by U.S. EPA
e) New NO2 1-hour standard, effective August 2, 2010; attainment designations January 20, 2012; annual NO2
standard retained
f) The 1971 Annual and 24-hour SO2 standards were revoked, effective August 23, 2010; however, these 1971
standards will remain in effect until one year after U.S. EPA promulgates area designations for the 2010 SO2 1-hour
standard. Area designations expected in 2012 with Unclassifiable /Attainment designation likely for SSAB
Coachella Valley
g) Annual PM10 standard was revoked, effective December 18, 2006; redesignation request to Attainment of the 24-
hour PM10 standard is pending with U.S. EPA

Final 2012 AQMP
7-6
FIGURE 7-2
Coachella Valley 2011 Maximum Pollutant Concentrations as
Percent of State and Federal Standards
FIGURE 7-3
Coachella Valley 3-Year (2009-2011) Design Values as Percent of Federal Standards
0
50
100
150
200
250
Ozone
(1-Hour)
Ozone
(8-Hour)
PM2.5
(24-Hour)
PM2.5
(Annual)
PM10
(24-Hour)
Nitrogen
Dioxide
(1-Hour)
Carbon
Monoxide
(8-Hour)
Sulfate
(24-Hour)
Percen
t o
f S
tan
da
rd
State Standard
Federal Standard
Level of Standard
123%
109%
91%
42%
48%
68%
56%
0%
20%
40%
60%
80%
100%
120%
140%
20088-HourOzone
19978-HourOzone
1-HourOzone
(Revoked)
24-HourPM2.5
AnnualPM2.5
24-HourPM10
AnnualPM10
(Revoked)
De
sig
nV
alu
es
as
P
erc
en
t o
f S
tan
dard
s
Federal Standard

Chapter 7: Current & Future Air Quality – Desert Nonattainment Areas
7-7
PM10
PM10 is measured daily at both Indio and Palm Springs by supplementing the
(primary) 1-in-3-day Federal Reference Method (FRM) filter sampling at Indio and
the 1-in-6-day FRM sampling at Palm Springs with (secondary) continuous hourly
Federal Equivalent Method (FEM) measurements at both stations.
Although exceedances of the ozone standard in the Coachella Valley area are due to
the transport of ozone from the densely populated areas of the upwind Basin, the same
cannot be said for PM10 exceedances. PM10 in the Coachella Valley is primarily
due to locally generated sources of fugitive dust (e.g., construction activities, re-
entrained dust from paved and unpaved road travel, and natural wind-blown sources)
and not as a result of secondary PM generated from precursor gaseous emissions.
The Coachella Valley is subject to frequent high winds that generate wind-blown sand
and dust, leading to high episodic PM10 concentrations, especially from disturbed soil
and natural desert blowsand areas. PM10 is the only pollutant which has sometimes
reached higher concentrations in the SSAB than in the Basin. On some of the high
days, transport of wind-generated dust and sand occurs with relatively light winds in
the Coachella Valley, when deeply entrained dust from desert thunderstorm outflows
travels to the Coachella Valley from the desert areas of southeastern California,
Arizona, Nevada or northern Mexico. All days in recent years that exceeded the 24-
hour federal PM10 standard at Indio or Palm Springs would not have exceeded except
for the contribution of windblown dust and sand due to strong winds in the upwind
source area (high-wind natural events).
In 2011, two high-wind exceptional events occurred in the Coachella Valley that
caused high 24-hour PM10 concentrations (397 and 344 µg/m3, at Palm Springs and
Indio, respectively on July 3; 375 and 265 µg/m3 at Indio and Palm Springs,
respectively on August 28). Both of these days had high PM10 due to strong
outflows from thunderstorms over Arizona and northern Mexico that deeply entrained
dust and sand and transported it to the Coachella Valley. They have been flagged as
high-wind exceptional events in accordance with the U.S. EPA Exceptional Events
Rule, with further documentation and U.S. EPA concurrence pending. After flagging
these high-wind natural events, the federal 24-hour and former annual PM10
standards were not exceeded in the Riverside County part of the SSAB in 2011.
Therefore, the maximum 24-hour and annual average PM10 concentrations were 120
µg/m3 and 32.6 µg/m
3, 77 percent and 65 percent of the current 24-hour federal PM10

Final 2012 AQMP
7-8
standard (150 µg/m3) and the revoked annual federal standard (50 µg/m
3),
respectively.
When considering the form of the federal PM10 standards, after taking the
exceptional events into account, the 3-year (2009-2011) design values for the
Coachella Valley are 68 percent of the 24-hour PM10 NAAQS and 56 percent of the
revoked annual PM10 NAAQS. For the year 2011 and without the two exceptional
events included, the Coachella Valley maximum 24-hour average PM10 concentration
(120 µg/m3) was 77 percent of the federal 24-hour PM10 standard (150 µg/m
3) and
238 percent of the state 24-hour standard (50 µg/m3). The annual average PM10
concentration (32.6 µg/m3) was 65 percent of the revoked federal annual PM10
standard (50 µg/m3) and 151 percent of the state annual PM10 standard (20 µg/m
3).
In 2011, the state 24-hour PM10 standard (50 µg/m3) was exceeded on a maximum of
19 days (21 days if the high-wind events are included) in the Coachella Valley, which
is 5.2 percent of the sampling days (FRM and FEM data combined). The state
annual standard (20 µg/m3) was also exceeded. The maximum annual average PM10
concentration was 151 percent of the state standard. Figure 7-4 shows the trend of
the annual average PM10 concentrations in the Coachella Valley for the station
showing the highest PM10 measurements from 1990 through 2011.
FIGURE 7-4
Coachella Valley Trend of Annual Average PM2.5 and PM10, 1990-2011
0
10
20
30
40
50
60
70
80
90
1990 1992 1994 1996 1998 2000 2002 2004 2006 2008 2010
PM
Co
nce
ntr
atio
n (µ
g/m
3 )
PM10 Annual PM2.5 Annual
Coachella Valley Particulate Air Quality Trends 1990-2011
Chapter 7: Current & Future Air Quality – Desert Nonattainment Areas
7-9
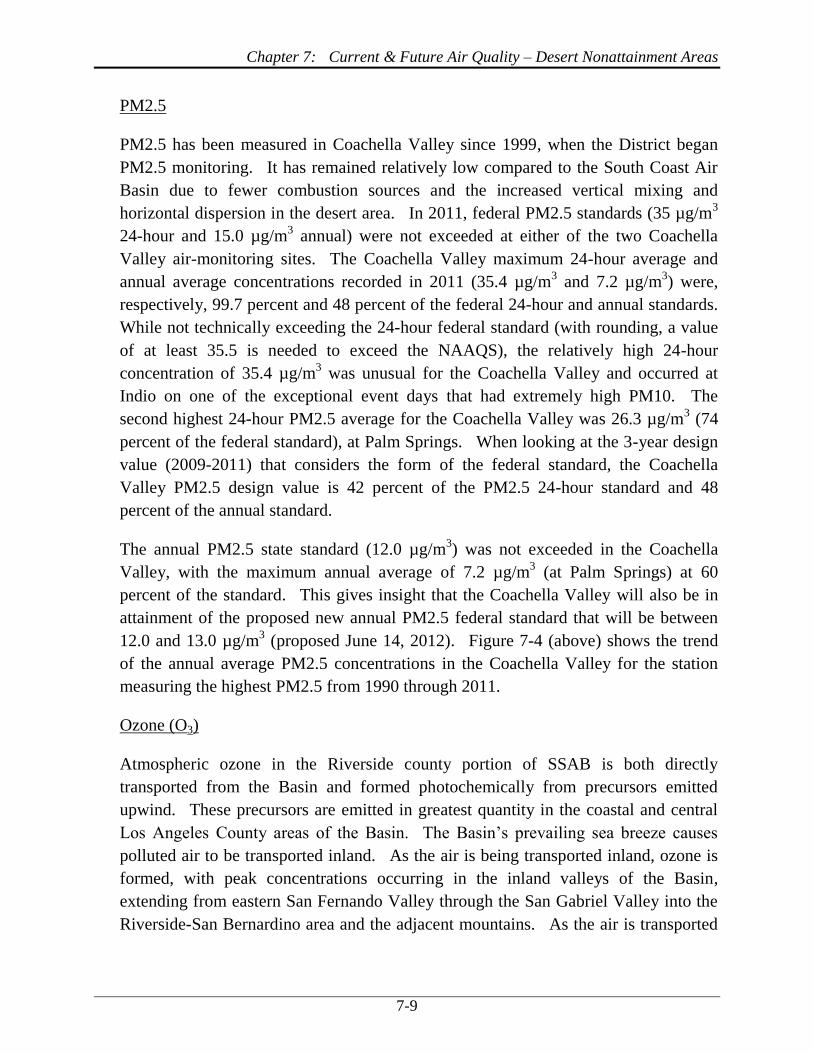
PM2.5
PM2.5 has been measured in Coachella Valley since 1999, when the District began
PM2.5 monitoring. It has remained relatively low compared to the South Coast Air
Basin due to fewer combustion sources and the increased vertical mixing and
horizontal dispersion in the desert area. In 2011, federal PM2.5 standards (35 µg/m3
24-hour and 15.0 µg/m3 annual) were not exceeded at either of the two Coachella
Valley air-monitoring sites. The Coachella Valley maximum 24-hour average and
annual average concentrations recorded in 2011 (35.4 µg/m3 and 7.2 µg/m
3) were,
respectively, 99.7 percent and 48 percent of the federal 24-hour and annual standards.
While not technically exceeding the 24-hour federal standard (with rounding, a value
of at least 35.5 is needed to exceed the NAAQS), the relatively high 24-hour
concentration of 35.4 µg/m3 was unusual for the Coachella Valley and occurred at
Indio on one of the exceptional event days that had extremely high PM10. The
second highest 24-hour PM2.5 average for the Coachella Valley was 26.3 µg/m3 (74
percent of the federal standard), at Palm Springs. When looking at the 3-year design
value (2009-2011) that considers the form of the federal standard, the Coachella
Valley PM2.5 design value is 42 percent of the PM2.5 24-hour standard and 48
percent of the annual standard.
The annual PM2.5 state standard (12.0 µg/m3) was not exceeded in the Coachella
Valley, with the maximum annual average of 7.2 µg/m3 (at Palm Springs) at 60
percent of the standard. This gives insight that the Coachella Valley will also be in
attainment of the proposed new annual PM2.5 federal standard that will be between
12.0 and 13.0 µg/m3 (proposed June 14, 2012). Figure 7-4 (above) shows the trend
of the annual average PM2.5 concentrations in the Coachella Valley for the station
measuring the highest PM2.5 from 1990 through 2011.
Ozone (O3)
Atmospheric ozone in the Riverside county portion of SSAB is both directly
transported from the Basin and formed photochemically from precursors emitted
upwind. These precursors are emitted in greatest quantity in the coastal and central
Los Angeles County areas of the Basin. The Basin’s prevailing sea breeze causes
polluted air to be transported inland. As the air is being transported inland, ozone is
formed, with peak concentrations occurring in the inland valleys of the Basin,
extending from eastern San Fernando Valley through the San Gabriel Valley into the
Riverside-San Bernardino area and the adjacent mountains. As the air is transported

Final 2012 AQMP
7-10
still further inland into the desert areas, ozone concentrations typically decrease due to
dilution, although ozone standards can be exceeded.
In 2011, the former 1-hour federal ozone standard level was not exceeded in the
Coachella Valley. The maximum 1-hour concentration measured was 0.124 ppm,
just below (99 percent) the former 1-hour federal standard (0.125 ppm is required to
exceed). The 1997 8-hour federal ozone standard (0.08 ppm) was exceeded on 18
days. The most recent (2008) and more stringent 8-hour federal standard (0.075
ppm) was exceeded on 54 days. The maximum 8-hour ozone concentration was
0.098 ppm (129 percent of the 2008 standard and 115 percent of the 1997 standard).
Ozone concentrations and the number of days exceeding the federal ozone standard
are greatest in summer, with no exceedances during the winter months.
The 1-hour and 8-hour state ozone standards were exceeded on 25 days and 78 days,
respectively, in the Coachella Valley in 2011. The 1-hour ozone health advisory
level (0.15 ppm) has not been exceeded in the Coachella Valley area since 1999. No
1-hour Stage 1 episode levels (0.20 ppm) have been recorded in the Coachella Valley
area since 1989.
Figure 7-5 shows the trend of the annual highest ozone concentrations (1-hour and 8-
hour averages) measured in the Coachella Valley between 1990 and 2011. Figure 7-
6 shows the annual number of days exceeding federal ozone standards at Coachella
Valley monitoring sites for the years 1990-2011.

Chapter 7: Current & Future Air Quality – Desert Nonattainment Areas
7-11
FIGURE 7-5
Trends of Coachella Valley Maximum 1-hour and 8-hour Ozone Concentrations, 1990-2011
FIGURE 7-6
Coachella Valley Federal and State Ozone Trends, 1990-2011
(Number of Days Exceeding Standards)
0.00
0.02
0.04
0.06
0.08
0.10
0.12
0.14
0.16
0.18
0.20
1990 1992 1994 1996 1998 2000 2002 2004 2006 2008 2010
Ozo
ne
Co
nce
ntr
atio
n (p
pm
)
8-Hour Ozone 1-Hour Ozone
0
20
40
60
80
100
120
Day
s Ex
cee
din
g
8-Hour Federal (2008) 1-Hour Federal 8-Hour State 1-Hour State
Coachella Valley Ozone Air Quality Trends 1990-2011
Final 2012 AQMP
7-12
Other Criteria Pollutants
Carbon monoxide (CO) was measured at one Coachella Valley air monitoring station
(Palm Springs) in 2011. Neither the federal nor state standards were exceeded.
The maximum 8-hour average CO concentration recorded in 2011 (0.6 ppm) was less
than 7 percent of both the federal and state standards. The maximum 1-hour CO
concentration (3.0 ppm) was 8 percent of the federal and 15 percent of the state 1-
hour CO standards. Historical carbon monoxide air quality and trends in the
Riverside county SSAB area show that the area has not exceeded the federal CO
standards in nearly three decades.
Nitrogen dioxide (NO2) was measured at one station in the Coachella Valley in 2011.
The maximum annual average NO2 concentration (8.0 ppb) was approximately 15
percent of the federal annual standard and 27 percent of the state annual standard.
The maximum 1-hour average concentration (44.7 ppb) was 44 percent of the new
(2010) federal and 25 percent of the state 1-hour standard.
Sulfur dioxide (SO2) concentrations were not measured in the Riverside County
SSAB in 2011. Historical measurements have shown SO2 concentrations to be well
below the state and federal standards and there are no significant emissions sources
in the Coachella Valley.
Sulfate (SO42-
) from PM10 was measured at one station in the Coachella Valley in
2011. The maximum 24-hour average sulfate concentration was 5.7 µg/m3 (23
percent of the 25 µg/m3 state sulfate standard). There is no federal sulfate standard.
Lead (Pb) concentrations were not measured at either of the two Coachella Valley air
monitoring stations in 2011. Measurements in past years have shown concentrations
to be less than the state and federal standards and no major sources of lead emissions
are located in the Coachella Valley.
Pollutant Transport
The pollutant transport pathway from the South Coast Air Basin to the Salton Sea
Air Basin is through the San Gorgonio Pass (sometimes referred to as the Banning
Pass) to the Coachella Valley.4 The transport pathway to the Coachella Valley is
well documented and this phenomenon has been studied considerably in the past.
4 Keith, R.W. 1980. A Climatological Air Quality Profile: California’s South Coast Air Basin. Staff Report,
South Coast Air Quality Management District.

Chapter 7: Current & Future Air Quality – Desert Nonattainment Areas
7-13
An experiment to study this transport pathway concluded that the South Coast Air
Basin was the source of the observed high oxidant levels in the Coachella Valley.5
Transport from Anaheim to Palm Springs was directly identified with an inert sulfur
hexafluoride tracer release.6 A comprehensive study of transport from the South
Coast Air Basin to the Salton Sea Air Basin confirmed the ozone transport pathways
to the Coachella Valley.7
Ozone pollutant transport to the Coachella Valley can be demonstrated by examining
averaged ozone concentration by time of day for various stations along the transport
corridor from Los Angeles County to the Coachella Valley. Figure 7-7 shows the
diurnal distribution of averaged 1-hour ozone concentrations for the May-October
smog season, by hour for 2011. The Coachella Valley transport route is represented,
starting at Central Los Angeles in the main emissions source region and passing
through Riverside-Rubidoux and Banning and finally through San Gorgonio Pass to
Palm Springs in the Coachella Valley. Near the source regions, ozone peaks occur
just after at mid-day (1:00 to 2:00 p.m. Pacific Standard Time, PST), on average,
during the peak of incoming solar radiation and therefore the peak of ozone
production. Downwind of the source region, ozone peaks occur later in the day as
ozone and ozone precursors are transported downwind and photochemical reactions
continue. At Palm Springs, ozone concentration peaks occur between 5:00 and 6:00
p.m. PST. If this peak were locally generated, it would be occurring closer to near
mid-day, as is seen in the major source areas of the South Coast Air Basin, and not in
the late afternoon or early evening, as is seen at Palm Springs.
5 Kauper, E.K. 1971. Coachella Valley Air Quality Study. Final Report, Pollution Res. & Control Corp.,
Riverside County Contract & U.S. Public Health Service Grant No. 69-A-0610 RI. 6 Drivas, P.J., and F.H. Shair. 1974. A Tracer Study of Pollutant Transport in the Los Angeles Area. Atmos.
Environ. 8: 1155-1163. 7 Smith, T.B., et al. 1983. The Impact of Transport from the South Coast Air Basin on Ozone Levels in the
Southeast Desert Air Basin. CARB Research Library Report No. ARB-R-83-183. ARB Contract to
MRI/Caltech.

Final 2012 AQMP
7-14
FIGURE 7-7
Diurnal Profile of 2011 Hourly Ozone Concentrations
along the Coachella Valley Transport Route
(Hours in Pacific Standard Time, Averaged for the May-October Ozone Season by Hour)
Palm Springs also exhibits an early ozone concentration increase that is not seen in
the South Coast Air Basin near the main emissions source areas (i.e., Los Angeles and
Rubidoux). The stations in the South Coast have more local NOx emissions (mostly
from mobile sources) to help scavenge the ozone after dark when the ozone
production photochemistry ceases. The Coachella Valley has limited local NOx
emissions to help scavenge the ozone at night. This elevated overnight ozone
contributes to an early morning bump in the Coachella Valley ozone concentrations,
starting around 8 a.m. PST, with the ample sunlight and strong overnight temperature
inversions in the desert. Ozone concentrations in this area reach an initial peak
before noon and then drop slightly with increased mixing in the early afternoon,
before climbing to the daily peak as the normal onshore flow reaches the Coachella
Valley through the San Gorgonio Pass, transporting new ozone from the South Coast
Air Basin.
0
25
50
75
0 1 2 3 4 5 6 7 8 9 10 11 12 13 14 15 16 17 18 19 20 21 22 23
Ho
url
y O
3C
on
cen
tra
tio
n (
pp
b)
HOUR (PST)
Los Angeles Rubidoux Banning Palm Springs

Chapter 7: Current & Future Air Quality – Desert Nonattainment Areas
7-15
Emissions Inventories
For illustrative purposes only, Table 7-3A shows base year (2008) and future-year
emission inventories for the Coachella Valley, based on the AQMP inventory
methodology as described in Appendix III. Emissions, in tons per day, of volatile
organic compounds (VOC), oxides of nitrogen (NOx), carbon monoxide (CO), sulfur
oxides (SOx), PM10, PM2.5 and ammonia (NH3) are shown. Table 7-3B adds the
Coachella Valley emissions for the Competitive Power Ventures, LLC (CPV)
Sentinel power plant, as it is projected to be operational in Desert Hot Springs in 2014
and after. The corresponding inventories for the South Coast Air Basin are shown
for comparison in Table 7-3C. The South Coast Air Basin emissions, typically
upwind of the Coachella Valley, overwhelm the locally-generated emissions.
Depending on the pollutant, emissions in the South Coast Air Basin are 10 to over 350
times greater than emissions in the Coachella Valley. It is clear that improved air
quality in the Coachella Valley depends on reduced emissions in the South Coast Air
Basin. This is further illustrated by the trends in ozone air quality described earlier.
TABLE 7-3A
Coachella Valley Annual Average Emissions for Base Year (2008) and Future Years
COACHELLA VALLEY EMISSIONS (TONS/DAY)
YEAR VOC NOx CO SOx PM10 PM2.5 NH3
2008 15.60 32.27 76.13 0.14 17.13 3.92 2.55
2012 13.34 23.62 64.38 0.14 15.33 3.49 2.46
2014 13.25 21.89 60.72 0.15 17.23 3.48 2.46
2017 13.39 19.06 56.59 0.17 19.61 3.75 2.41
2019 13.38 16.73 53.66 0.18 20.97 3.86 2.38
2020 13.39 15.72 53.15 0.18 21.57 3.92 2.39
2023 14.12 13.22 52.85 0.20 23.25 4.18 2.37
2030 16.08 12.65 56.99 0.24 26.62 4.73 2.39
2035 16.24 13.15 60.01 0.27 28.17 4.90 2.40

Final 2012 AQMP
7-16
TABLE 7-3B
Coachella Valley Annual Average Emissions for Base Year (2008) and Future Years with the
CPV Sentinel Power Plant Emissions starting in 2014
COACHELLA VALLEY EMISSIONS (TONS/DAY) WITH CPV SENTINEL POWER PLANT
YEAR VOC NOx CO SOx PM10 PM2.5 NH3
2008 15.60 32.27 76.13 0.14 17.13 3.92 2.55
2012 13.34 23.62 64.38 0.14 15.33 3.49 2.46
2014 13.37 22.28 61.26 0.17 17.43 3.68 2.46
2017 13.51 19.45 57.13 0.19 19.81 3.95 2.41
2019 13.50 17.12 54.20 0.20 21.17 4.06 2.38
2020 13.51 16.11 53.69 0.20 21.77 4.12 2.39
2023 14.24 13.61 53.39 0.22 23.45 4.38 2.37
2030 16.20 13.04 57.53 0.26 26.82 4.93 2.39
2035 16.36 13.54 60.55 0.29 28.37 5.10 2.40
TABLE 7-3C
South Coast Air Basin Annual Average Emissions for Base Year (2008) and Future Years
SOUTH COAST AIR BASIN EMISSIONS (TONS/DAY)
Year VOC NOx CO SOx PM10 PM2.5 NH3
2008 592.71 757.25 2880.52 54.24 167.22 79.83 108.59
2012 478.92 550.00 2306.35 23.93 154.73 71.76 102.92
2014 451.11 506.22 2094.59 18.40 155.34 69.89 102.13
2017 427.43 451.63 1867.07 18.05 158.99 70.26 99.62
2019 414.70 404.93 1715.54 17.61 161.24 70.18 97.76
2020 411.66 385.03 1675.50 17.60 162.58 70.29 97.15
2023 405.85 328.14 1583.20 18.12 164.33 70.69 95.72
2030 406.72 289.27 1501.25 20.00 171.47 73.19 97.31
2035 386.80 285.84 1473.01 21.76 173.40 72.85 96.65

Chapter 7: Current & Future Air Quality – Desert Nonattainment Areas
7-17
FUTURE AIR QUALITY
In the 2007 AQMP and the subsequent SIP submittal, the District requested that U.S.
EPA redesignate the Riverside County portion of the Salton Sea Air Basin from
“Serious” nonattainment to “Severe-15” and extend the attainment date of the 1997 8-
hour ozone standard (80 ppb) to 2019. This Severe-15 nonattainment redesignation
was approved by U.S. EPA and subsequently applied to the nonattainment
designation for the new 2008 8-hour ozone standard (75 ppb), for a new attainment
date of December 31, 2027. This chapter is intended to update the progress toward
attainment of the current ambient air quality standards; it is not an update to the
Ozone SIP attainment demonstration. A new Ozone SIP attainment demonstration
for the 2008 ozone standard will be required to be submitted to U.S. EPA in 2015.
The CAA requires that ozone nonattainment areas designated as serious and above
use a regional photochemical model to demonstrate attainment. To meet this
requirement, the Community Multi-scale Air Quality (CMAQ) modeling system is
used in this analysis for the Coachella Valley. To provide further confidence with
the CMAQ model and to establish consistency with the 2007 AQMP, comparisons
were also made with the Comprehensive Air Quality Model with Extensions (CAMx),
with comparable results. The complete SCAQMD modeling system and its
application is described in detail in Chapter 5 and Appendix V, along with base and
future year results, sensitivity analyses and performance evaluations. To develop
relative response factors (RRFs) to project future air quality, CMAQ was run using a
full 3-month period (June, July and August of 2008; 91 days) during the peak of the
ozone season. During this period, seven well-defined, multi-day high ozone episodes
occurred that ranked high in terms of meteorological potential for ozone production.
Of the modeled days in 2008, the 1997 8-hour federal ozone standard was exceeded
on 75 days in the South Coast Air Basin and 19 days in the Coachella Valley.
The 8-hour average ozone design values (based on a 5-year weighted average as
recommended in U.S. EPA modeling guidance) for the Coachella Valley air quality
stations, Palm Springs and Indio, in base year 2008 were 96 ppb and 86 ppb,
respectively. The baseline emissions inventory assumes no further control beyond
existing rules and regulations. Between 2008 and 2019, controls are being
implemented in the South Coast Air Basin to reduce emissions.
The results of the CMAQ model simulations and corresponding RRFs using the
baseline emissions for 2019 project a maximum 8-hour concentration in the Coachella
Valley of 84 ppb, meeting the 1997 federal ozone standard. The CMAQ simulations
of the future year ozone using the baseline regional emissions indicate that the 2008

Final 2012 AQMP
7-18
federal 8-hour ozone standard (75 ppb) will not be attained in the Coachella Valley by
the 2027 attainment date. However, using the Final 2012 AQMP controlled
emissions inventory, the Coachella Valley attains the 2008 federal ozone standard by
2024, in advance of the required attainment date. Further details of the future-year
air quality projections in South Coast Air Basin and the Coachella Valley are
presented in Appendix V.
CONCLUSIONS
With the Severe-15 ozone nonattainment designation, the Coachella Valley attainment
date for the 1997 8-hour federal ozone NAAQS is in 2019. Modeling simulations of
the ozone episodes indicate that the 1997 federal 8-hour standard will be attained in
the Coachella Valley in 2019 with no additional emissions controls. The attainment
date for the more stringent 2008 8-hour federal ozone standard is 2027. With future
emissions controls in place in the South Coast Air Basin, the 2008 federal 8-hour
federal ozone standard will be attained in the Coachella Valley by 2024, three years in
advance of the attainment date for that standard. Future emissions reductions
implemented in the South Coast Air Basin will ensure timely attainment of existing
standards, and also help to achieve potentially more stringent PM2.5 and ozone
standards in the future.


