June 20, 2014 Mr. Robert Cooper Office of Stormwater Management Virginia Department of Environmental Quality Re: Approval Request for Manufactured Treatment Device, Aqua-Swirl ® Stormwater Treatment System Dear Mr. Cooper, AquaShield TM , Inc. is pleased to submit information in support of this approval request for the Aqua- Swirl ® Stormwater Treatment System. This approval request is submitted in accordance with Guidance Memo No. 14-2009 dated May 15, 2014, Interim Use of Stormwater MTDs. We are requesting that the Aqua-Swirl ® be granted a Total Phosphorus (TP) removal credit of 40% based on NJCAT-verified field testing of an Aqua-Swirl ® Model AS-5 for 80% TSS removal efficiency following the TARP Tier II protocol. The Aqua-Swirl ® currently holds NJDEP Laboratory Certification and Washington State Department of Ecology General Use Level Designation (GULD) for Pretreatment and Conditional Use Level Designation (CULD) for Basic (TSS) treatment. The CULD is based on the NJCAT-verified field test allowing the Aqua-Swirl ® to be used as a standalone device for 80% TSS removal efficiency on a per storm event basis. The following documents are attached for your evaluation in support of this 40% TP removal credit approval request: Attachment 1, MTD Registration Form NJCAT Field Test Verification Report for Aqua-Swirl ® Model AS-5, November 2012 NJCAT Field Test Summary Letter, February 15, 2013 NJDEP Aqua-Swirl ® Laboratory Test Certification Letter, August 31, 2011 Washington State Department of Ecology GULD and CULD for Aqua-Swirl ® , October 2013 Aqua-Swirl ® Inspection & Maintenance Manual AquaShield TM Limited Warranty Thank you for considering this information, and of course please let me know if additional information is needed at this time. Respectfully submitted, AquaShield TM , Inc. Mark B. Miller, P.G. Research Scientist 2733 Kanasita Drive, Suite 111 • Chattanooga, TN 37343 • Phone (423) 870-8888 • www.aquashieldinc.com
Transcript
June 20, 2014
Mr. Robert Cooper
Office of Stormwater Management
Virginia Department of Environmental Quality
Re: Approval Request for Manufactured Treatment Device,
Aqua-Swirl® Stormwater Treatment System
Dear Mr. Cooper,
AquaShieldTM
, Inc. is pleased to submit information in support of this approval request for the Aqua-
Swirl® Stormwater Treatment System. This approval request is submitted in accordance with Guidance
Memo No. 14-2009 dated May 15, 2014, Interim Use of Stormwater MTDs.
We are requesting that the Aqua-Swirl® be granted a Total Phosphorus (TP) removal credit of 40% based
on NJCAT-verified field testing of an Aqua-Swirl® Model AS-5 for 80% TSS removal efficiency
following the TARP Tier II protocol. The Aqua-Swirl® currently holds NJDEP Laboratory Certification
and Washington State Department of Ecology General Use Level Designation (GULD) for Pretreatment
and Conditional Use Level Designation (CULD) for Basic (TSS) treatment. The CULD is based on the
NJCAT-verified field test allowing the Aqua-Swirl® to be used as a standalone device for 80% TSS
removal efficiency on a per storm event basis.
The following documents are attached for your evaluation in support of this 40% TP removal credit
approval request:
Attachment 1, MTD Registration Form
NJCAT Field Test Verification Report for Aqua-Swirl® Model AS-5, November 2012
NJCAT Field Test Summary Letter, February 15, 2013
NJDEP Aqua-Swirl® Laboratory Test Certification Letter, August 31, 2011
Washington State Department of Ecology GULD and CULD for Aqua-Swirl®, October 2013
Aqua-Swirl® Inspection & Maintenance Manual
AquaShieldTM
Limited Warranty
Thank you for considering this information, and of course please let me know if additional information is
needed at this time.
Respectfully submitted,
AquaShieldTM
, Inc.
Mark B. Miller, P.G.
Research Scientist
27
33
Kan
asi
ta D
riv
e,
Su
ite 1
11 •
Ch
att
an
oo
ga
, T
N 3
73
43
• P
ho
ne (
423)
870-8
88
8 •
ww
w.a
qu
ash
ield
inc.c
om
1
Attachment 1
Manufactured Treatment Device (MTD) Registration
1. Manufactured Treatment Device Name:
Aqua-Swirl® Stormwater Treatment System
2. Company Name: AquaShieldTM
, Inc.
Mailing Address: 2733 Kanasita Drive, Suite 111
City: Chattanooga
State: Tennessee
Zip: 37343
3. Contact Name (to whom questions should be addressed): Mark B. Miller
3.1 Introduction 8 3.2 Site and System Description 8 3.3 Sampling Design 9 3.4 Test Equipment and Apparatus 13 3.5 Test Methods and Procedures 13 3.6 Precipitation Measurements 14 3.7 Flow Measurements 14 3.8 Stormwater Data Collection 15 3.9 Treatment System Maintenance 17
4. Technology System Performance 17
4.1 Data Quality Assessment 17 4.2 Test Results 18 4.3 Statistical Analysis 22 4.4 Summary 24
5. Performance Verification 25
6. Net Environmental Benefit 26
7. References 26
Appendix A: Individual Storm Events 27
3
List of Tables
Table 1 Summary of Analytical Methods 14 Table 2 Summary of Storm Sampling Events – Storm Duration 15 Table 3 Storm Characteristics-(duration, size, peak intensity and peak loading rate) 16 Table 4 Influent PSD Summary (percent finer than each sieve/filter) 18 Table 5 Summary of TSS and SSC Removal Efficiencies and Influent Organic Content 19 Table 6 Captured Sediment PSD in Swirl Chamber 20 Table 7 Suspended Solids Event Sum of Loads Removal Efficiencies 23 Table 8 Storm Characteristics vs. Performance 24
4
List of Figures
Figure 1 Aqua-Swirl® Mode of Operation 8
Figure 2 Site Location Map 10 Figure 3 Site Plan 11 Figure 4 Sample Locations 12 Figure 5 Storm Intensity vs. Peak Loading Rate 16
Figure 6 Field Test PSD vs. Laboratory PSD 19 Figure 7 Sediment Accumulation Profile in AS-5 Swirl Chamber 21 Figure 8 Swirl Chamber PSD - Influent (side), Center, Effluent (side) 22 Figure 9 AS-5 Field Performance Curves 25
5
1. Introduction 1.1 New Jersey Corporation for Advance Technology (NJCAT) Program NJCAT is a not-for-profit corporation to promote in New Jersey the retention and growth of technology-based businesses in emerging fields such as environmental and energy technologies. NJCAT provides innovators with the regulatory, commercial, technological and financial assistance required to bring their ideas to market successfully. Specifically, NJCAT functions to:
• Advance policy strategies and regulatory mechanisms to promote technology commercialization;
• Identify, evaluate, and recommend specific technologies for which the regulatory and commercialization process should be facilitated;
• Facilitate funding and commercial relationships/alliances to bring new technologies to market and new business to the state; and
• Assist in the identification of markets and applications for commercialized technologies.
The technology verification program specifically encourages collaboration between vendors and users of technology. Through this program, teams of academic and business professionals are formed to implement a comprehensive evaluation of vendor specific performance claims. Thus, suppliers have the competitive edge of an independent third party confirmation of claims. Pursuant to N.J.S.A. 13:1D-134 et seq. (Energy and Environmental Technology Verification Program) the New Jersey Department of Environmental Protection (NJDEP) and NJCAT have established a Performance Partnership Agreement (PPA) whereby NJCAT performs the technology verification review and NJDEP certifies that the technology meets the regulatory intent and that there is a net beneficial environmental effect of the technology. In addition, NJDEP/NJCAT work in conjunction to develop expedited or more efficient timeframes for review and decision-making of permits or approvals associated with the verified/certified technology. The PPA also requires that: • The NJDEP shall enter into reciprocal environmental technology agreements concerning the
evaluation and verification protocols with the United States Environmental Protection Agency, other local required or national environmental agencies, entities or groups in other states and New Jersey for the purpose of encouraging and permitting the reciprocal acceptance of technology data and information concerning the evaluation and verification of energy and environmental technologies; and
• The NJDEP shall work closely with the State Treasurer to include in State bid specifications,
as deemed appropriate by the State Treasurer, any technology verified under the Energy and Environment Technology Verification Program.
6
1.2 Interim Certification AquaShieldTM, Inc. (AquaShieldTM) manufactures a stormwater treatment system known as the Aqua-Swirl® Stormwater Treatment System. Treatment to stormwater runoff is accomplished via hydrodynamic separation technology. AquaShieldTM received NJCAT verification of claims for the Aqua-Swirl® Stormwater Treatment System in September 2005 and a Conditional Interim Certification (CIC) was issued by NJDEP dated November 28, 2005 based upon the results of independent laboratory studies. The Aqua-Swirl® received Manufactured Treatment Device (MTD) Laboratory Test Certification from NJDEP effective September 1, 2011. This certification was issued subsequent to rescinding the Conditional Interim Certification for the Aqua-Swirl®. The current laboratory certification status applies to all eligible hydrodynamic separators. A major condition of the 2005 CIC was the execution of a field evaluation in accordance with the Technology Acceptance Reciprocity Partnership (TARP) Tier II Protocol (TARP, 2003) and New Jersey Tier II Stormwater Test Requirements—Amendments to TARP Tier II Protocol (NJDEP, 2006). A Quality Assurance Project Plan (QAPP) for the Field Evaluation was completed in December of 2009 and revised in May 2010; monitoring activities commenced in March 2009. The TARP Tier II Protocol is designed to evaluate Total Suspended Solids (TSS) removal on an annual basis.
1.3 Applicant Profile
AquaShieldTM manufactures stormwater treatment systems used worldwide to protect sensitive receiving waters from the harmful effects of stormwater. The commitment of AquaShieldTM to provide quality environmental solutions began in the early 1980s with its founder solving surface water and groundwater contaminant issues at industrial and commercial facilities through his previously owned environmental consulting/contracting companies. The first product, a catch basin insert (now known as the Aqua-Guardian™), was introduced in 1997 for use at point source problem sites such as gas stations, fast food restaurants and high traffic parking lots. The AquaShieldTM stormwater filtration technology expanded into underground structures in 1999 with the installation of a "treatment train" structure utilizing pretreatment sediment removal incorporated with a filtration chamber to remove fine contaminants. This became the Aqua-FilterTM Stormwater Filtration System.
Early in 2000, AquaShieldTM formed its corporate office in Chattanooga, Tennessee. AquaShieldTM received patents for treatment systems that integrated hydrodynamic swirl separation technology for pretreatment with high flow filtration technology in a single device. In 2001, the stand- alone Aqua-Swirl® hydrodynamic swirl concentrator was introduced to meet the increasing requests for primary pollutant removal of sediment and floatable debris and oils. Accordingly, AquaShieldTM offers three essential patented alternatives for treating stormwater and industrial runoff: the Aqua-Swirl® Stormwater Treatment System, the Aqua-FilterTM Stormwater Filtration System, and the Aqua-Guardian™ Catch Basin Insert. Other derivatives of these core products have been adapted for customers needing further enhanced water treatment. These products distinguish themselves from other systems with their high performance and lightweight construction material, providing flexibility and adaptation to site-specific conditions. Each product arrives at the project job site completely assembled and ready for installation.
7
1.4 Key Contacts
Richard S. Magee, Sc.D., P.E., BCEE Technical Director NJ Corporation for Advanced Technology Center for Environmental Systems Stevens Institute of Technology Castle Point on Hudson Hoboken, NJ 07030 201-216-8081 973-879-3056 mobile [email protected]
Mr. J. Kelly Williamson President AquaShieldTM Inc. 2705 Kanasita Drive Chattanooga, Tennessee 37343 423-870-8888 [email protected]
Mr. Mark B. Miller, P.G. Research Scientist AquaShieldTM, Inc. 2705 Kanasita Drive Chattanooga, Tennessee 37343 423-870-8888 [email protected]
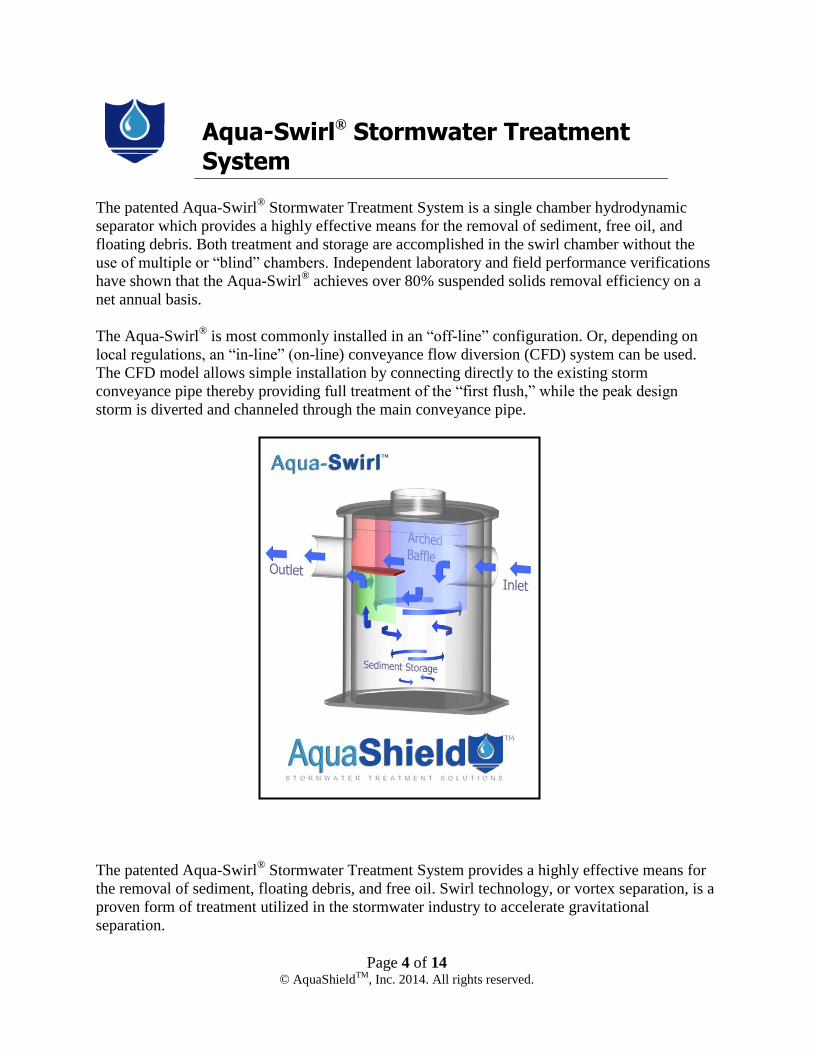
2. The Aqua-Swirl® Stormwater Treatment System The Aqua-Swirl® is a single chamber hydrodynamic separator that provides for the removal of sediment, debris and free-floating oil. The Aqua-Swirl® uses a swirl chamber as the effective horizontal treatment area that creates a swirling or vortex motion. The decreasing flow rate in the swirl chamber causes suspended material to fall out of suspension and settle to the bottom of the chamber. An inner arched baffle minimizes the potential for oil and debris to be discharged. Operation begins when stormwater enters the Aqua-Swirl® through a tangential inlet pipe which produces a circular (or vortex) flow pattern that causes contaminants to settle. Since stormwater flow is intermittent by nature, the Aqua-Swirl® retains water between storm events providing both dynamic and quiescent settling of inorganic solids. Dynamic settling occurs during each storm event, while the quiescent settling takes place between successive storms. A combination of gravitational and hydrodynamic drag forces allows the solids to drop out of the flow and migrate toward the center of the chamber where velocities are the lowest. It is recognized that the small sized settleable solids in stormwater runoff exhibit low settling velocities. Therefore, the volume of water retained in the Aqua-Swirl® provides the quiescent settling that increases suspended sediment removal performance. Furthermore, due to finer sediment adhering onto larger particles, these large particles settle rather than remain in suspension.
The Aqua-Swirl® provides full treatment of the most contaminated first flush, while the cleaner peak storm flow is diverted and channeled through the main conveyance pipe. The treated flow exits the Aqua-Swirl® behind the arched inner baffle. The top of the baffle is sealed across the treatment channel, thereby eliminating any possibility of floatable pollutants to escape the system. A vent pipe is extended up the riser to expose the back side of the baffle to atmospheric conditions, thereby preventing a siphon from forming at the bottom of the baffle. Figure 1 illustrates stormwater flow through the Aqua-Swirl® treatment unit. The Aqua-Swirl® can be operated in an offline configuration providing full treatment of the first flush with installation of additional manhole structures for diverging flow to the Aqua-Swirl® for treatment and converging back to the exiting main conveyance storm drainage.
Figure 1. Aqua-Swirl® Mode of Operation Cleanout of captured material is required when the sediment storage capacity has been reached. The depth to the sediment pile can easily be determined using a stadia rod or tape. A vacuum truck is typically used to remove the accumulated sediment and debris. 3. Technology System Evaluation: Project Plan 3.1 Introduction The TARP field test of the Aqua-Swirl® Model AS-5 (5-ft. swirl diameter chamber; 45 ft3 sediment storage capacity) that is the subject of this report (AECOM 2012) was conducted by AECOM, 4 Neshaminy Interplex, Suite 300, Trevose, Pennsylvania 19053. Prior to initiating the field test the source area rainfall and pollutant characteristics were reviewed with NJCAT and confirmed as acceptable for performing a TARP field study.
Outlet
9
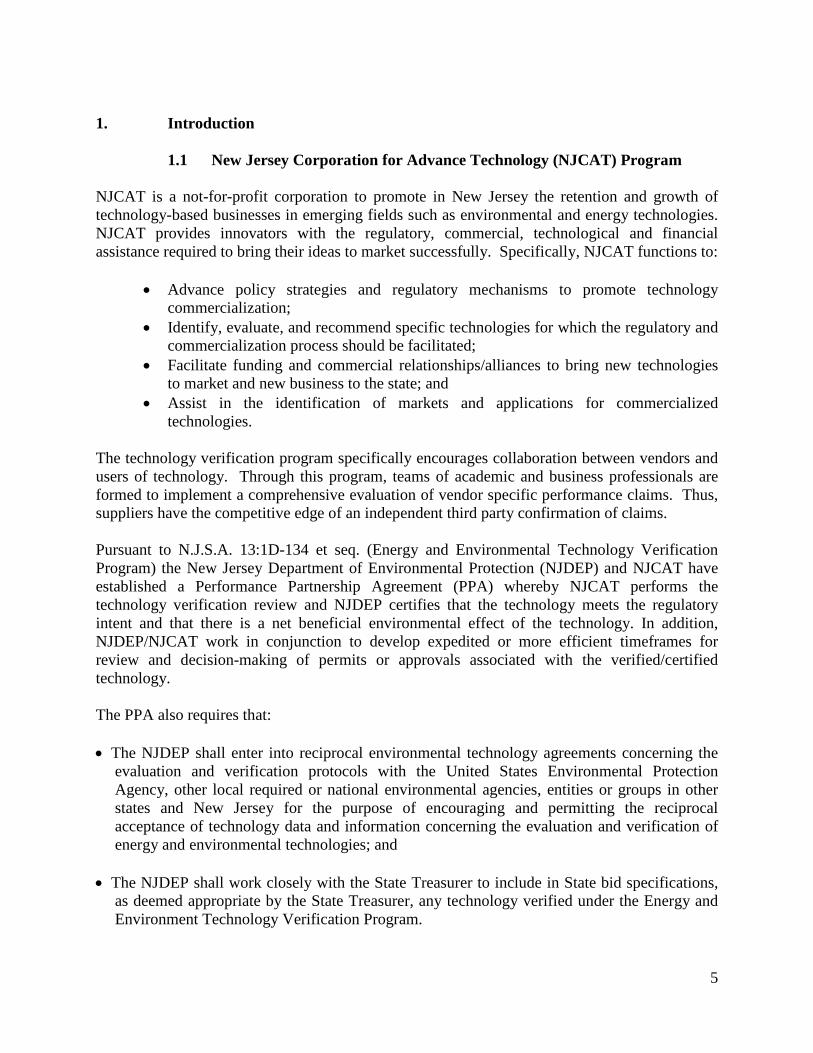
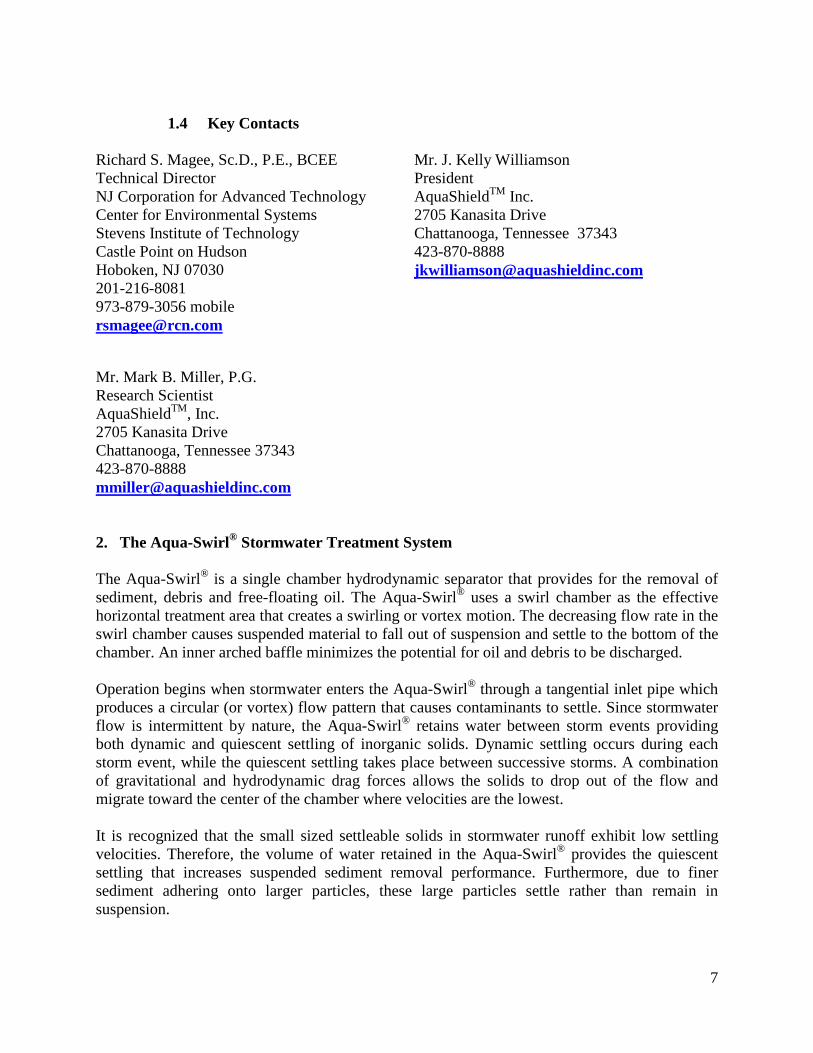
3.2 Site and System Description Field verification testing was conducted at the Burnt Mills Shopping Center in Silver Spring, Montgomery County, Maryland. The test site drainage area is an asphalt covered parking lot with landscaped areas and roof runoff on an urban retail shopping center. The total drainage area is estimated at 1.19 acres. An offline Aqua-Swirl® AS-5 treatment unit was installed as the upstream component of a treatment train system to provide sediment removal from parking lot stormwater runoff. An aerial site plan of the Burnt Mills Shopping Center is presented as Figure 2. A site plan of the Burnt Mills Shopping Center including the location of the Aqua-Swirl® is presented as Figure 3. Parking lot stormwater runoff is collected in catch basins and conveyed to the Aqua-Swirl® via underground piping. Specific requirements for field verification testing under the TARP Tier II protocol includes the definition of a qualified storm event, representative sample collection, the number of storm events required to be tested and specific conditions regarding the influent characteristics of the stormwater to be treated. Qualified storm event sampling is defined as:
• a storm event with at least 0.1 inch of rainfall; • a minimum inter-event period of six hours, where cessation of flow from the system is
the inter-event period; • flow-weighted composite samples were obtained covering a minimum of 60% of the total
storm flow, including as much of the first 20% of the storm as possible; and • a minimum of six water quality samples were collected per storm event.
3.3 Sampling Design
Sampling activities involved the collection of stormwater influent and effluent sample pairs during qualified storm events. Sampling procedures were developed according to guidance given in TARP and in the "Field Sampling Procedures Manual," NJDEP, August 2005. The influent and effluent samples were collected from locations that were as close in proximity to the Aqua-Swirl® as possible to minimize potential sources of contamination that would impact the Best Management Practice (BMP) efficiency data. Influent samples were collected immediately upstream of the Aqua-Swirl®. Piping from the divergence structure conveys stormwater to the Aqua-Swirl®. Effluent samples were collected from the effluent pipe that leads directly from the swirl chamber to the downstream component of the treatment train system. Figure 4 presents the sampling locations for the Aqua-Swirl®.
10
11
12
13
3.4 Test Equipment and Apparatus The ISCO Portable Sampler Model 6712 was used as the programmable automatic sampler for field verification testing. This sampler can be programmed to collect specific sample volumes over specified time periods and can be used in conjunction with an area velocity meter to allow flow proportional composite sampling. An ISCO 750 Area Velocity Meter was used to record flow during a storm event. The ISCO 750 uses Doppler technology to measure average velocity in the flow stream. A pressure transducer measures liquid depth to determine flow area. The ISCO 6712, when interfaced with the ISCO 750, calculates flow rate (cubic feet per second) by multiplying the area (square feet) of the flow stream by its average velocity (feet per second). A liquid level actuator was used to simultaneously activate the ISCO 750 Area Velocity Meter and the ISCO 6712 sampler once flow was present ensuring that the first flush of each storm event was sampled. Six influent and effluent sample pairs were collected and submitted to the laboratory for 17 of the 18 storm events. For the 18th event five samples were collected and submitted. Collected samples were transferred through a cone sample splitter (Dekaport Cone Sample Splitter) fitted with a 4-inch diameter 1,000 micron (μm) sieve. Particles smaller than 1,000 µm passed through the sieve and were collected in sample bottles. The sample bottles were placed on ice and promptly shipped to the laboratory to ensure that all analytical methodology holding times were met. The TARP requirement for a minimum of six samples to be collected from each storm was interpreted that a minimum of six individual composite samples of the influent and effluent were required to be submitted for laboratory analysis. The six individual sample analytical results were then averaged to establish an overall influent and effluent composite analytical result. For 17 of the 18 events a total of twenty-four 1-liter aliquots were collected during each sampling event providing the volume required to prepare six individual composite samples for laboratory analysis. For one event only twenty 1-liter aliquots were collected since the samplers shut off due to insufficient flow (liquid level actuator). The collection of six individual samples from 24 aliquots provided additional data concerning the fluctuation of influent loading and removal efficiency over the storm period, and well exceeded the TARP guidelines of a minimum of six and a goal of 10 sample aliquots collected during each storm. Due to the need to collect sufficient sample volumes for the required analyses, storm durations had to be conservatively predicted which led to varying sampling durations, and consequently event coverage, within the rainfall period. Sampling was suspended when the 24 1-liter aliquots were collected.
3.5 Test Methods and Procedures Table 1 presents the analytical methods used for the field testing program. Suspended sediment was determined by both the Total Suspended Solids (TSS) and Suspended Sediment Concentration (SSC) methods. Total Volatile Suspended Solids (TVSS) analysis was also performed to assess the organic content of the suspended sediment. The TSS, SSC and TVSS results are reported as mg/L by the laboratory. Particle size distribution (PSD) was determined by serial filtration techniques using sieves sized at 1,000, 500, 250, 125, 63 µm and filter paper at 1.5 µm.
14
Table 1 Summary of Analytical Methods
Parameter Matrix Method Reference
Total Suspended Solids Suspended-Sediment Concentration
Total Volatile Suspended Solids
Water (Influent, Effluent)
SM 2540D ASTM D3977
EPA Method 160.4
Particle Size Distribution Water (Influent, Effluent) Serial Filtration Method
All analyses of samples were performed by a NELAC and New Jersey certified laboratory, Test America, Inc. of Burlington, Vermont.
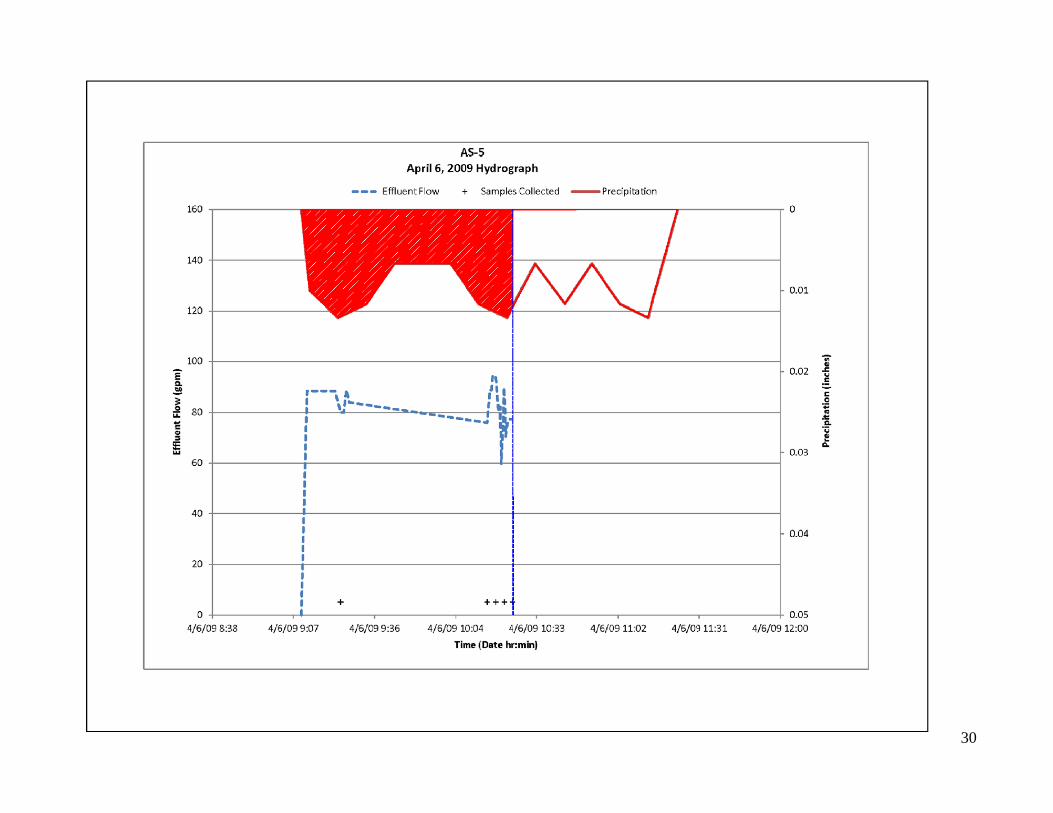
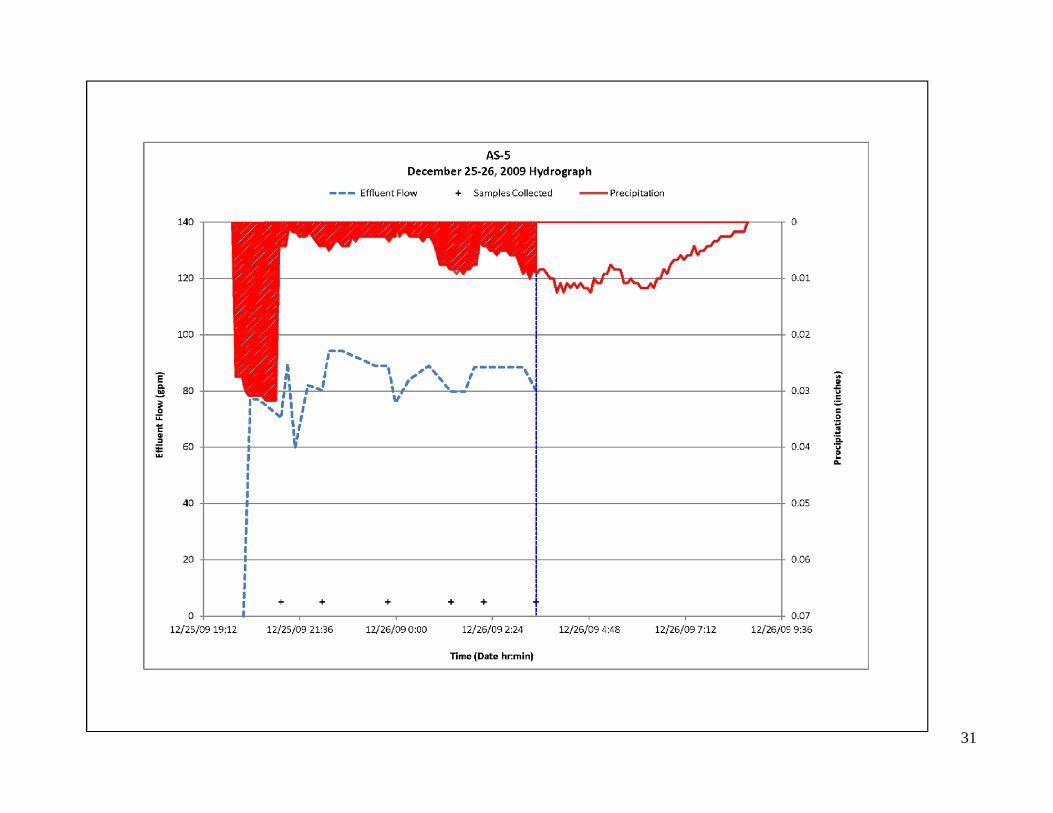
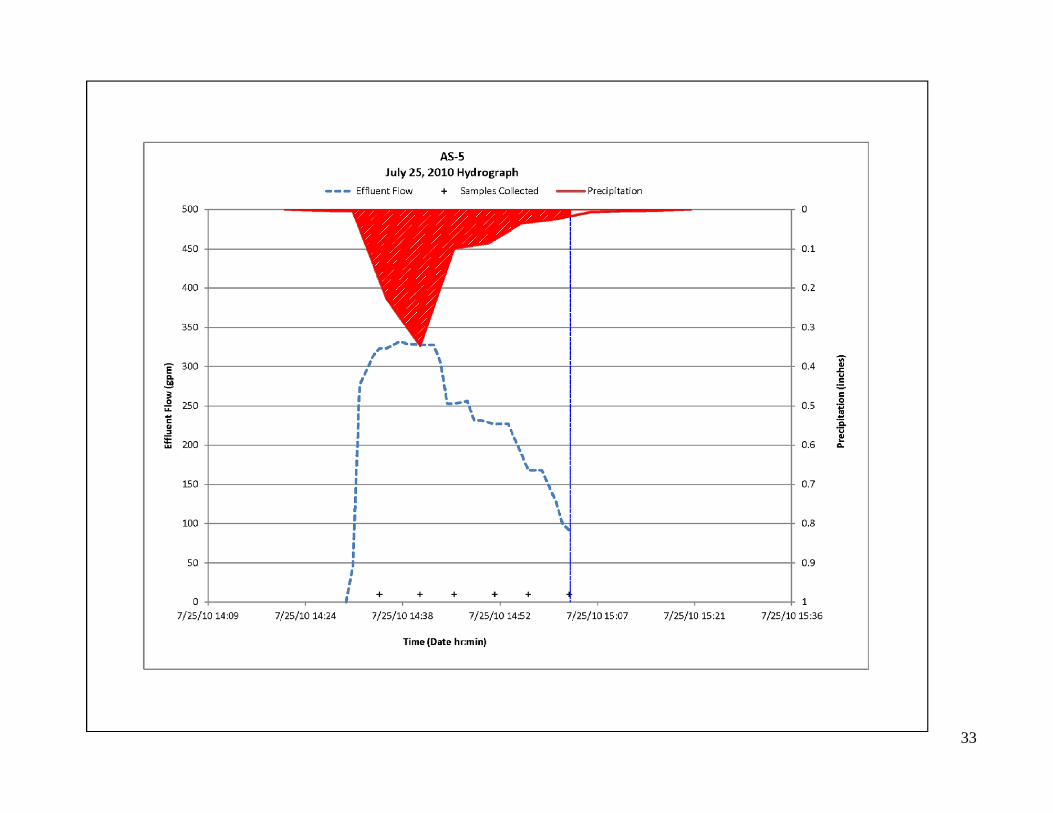
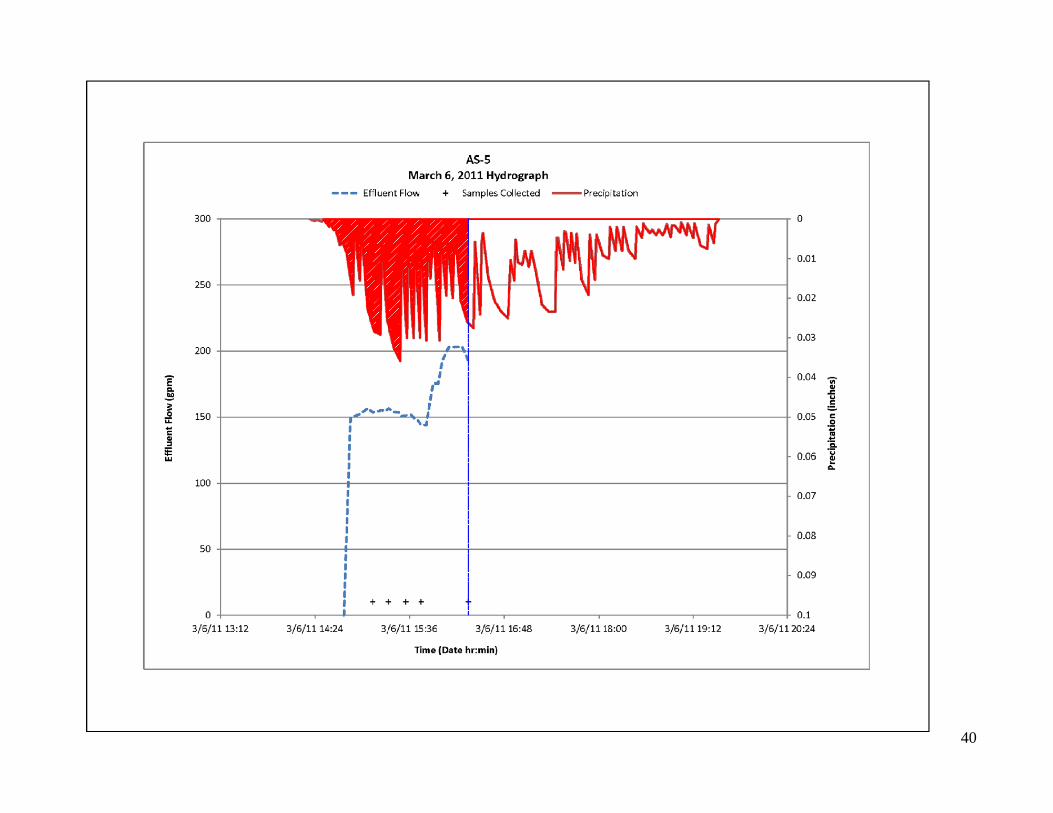
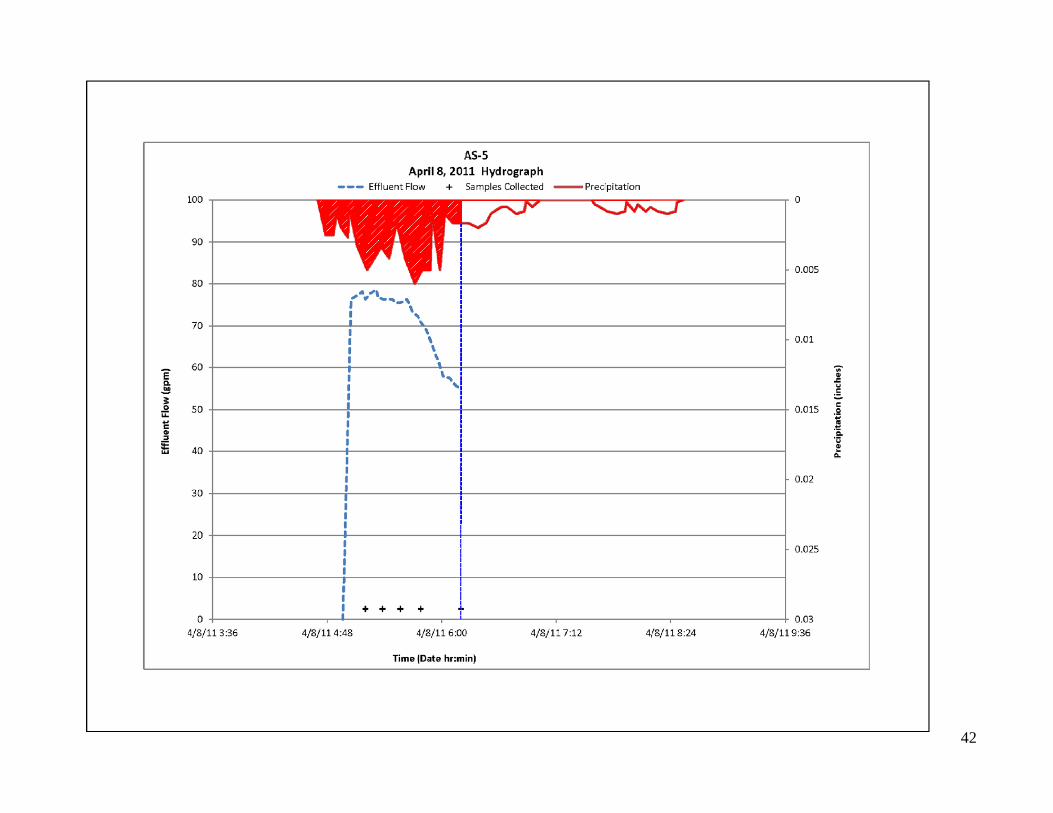
3.6 Precipitation Measurements An on-site rain gauge was used to measure the total precipitation for each sampling event. In addition, the nearest available documented weather station (Kemp Mill/Silver Spring), located approximately 1.5 miles from the Burnt Mills Shopping Center, was used to verify qualified storm events and the total precipitation for each sampling event. The weather station’s recorded precipitation data over time was also used to determine rainfall intensity during each sampling event. Table 2 presents a summary of the sampling precipitation events and sampling duration for each event. The total precipitation sampled was 15.16 inches with storm sizes ranging from a low of 0.11 inches to a high of 4.40 inches. TARP guidelines specify that a minimum qualifying event is 0.1 inches. Storm durations ranged from 30 minutes to 12 hours 5 minutes. The average precipitation during the stormwater sampling program was 0.84 inches. The storm duration coverage for each storm fluctuated from 30 to 80 percent with an overall average sampling time period of the storms of 60%. Storm durations were estimated based upon the recorded precipitation at the Kemp Mill/Silver Spring weather station, which only had a 2.6% variance from the test site measured participation. For all storm events, samples were collected from the first 20% of the total storm event flow. Hydrographs of the recorded effluent flows over time during each sampling event and the measured precipitation over time as recorded at the Kemp Mill/Silver Spring weather station were developed and are presented in Appendix A. The hydrographs provide a graphic illustration of the recorded flows, rainfall intensity and when flow-weighted composite samples were collected during each storm event. The hydrographs also provide a graphic presentation of the sampling duration for each storm event; the area under the precipitation curve illustrates the percent storm coverage (Table 3).
3.7 Flow Measurements Flows were recorded during each sampling event, downloaded and summarized to provide flow measurements for each sampling interval. These flow measurements were used to calculate
15
hydraulic loading rates to the Aqua-Swirl® as well as to determine mass loading of suspended solids during each sampling event.
Table 2 Summary of Storm Sampling Events – Storm Duration
Sampling Event Sample Date Storm Duration
Storm Size
Sampling Duration
Storm
Coverage (%)
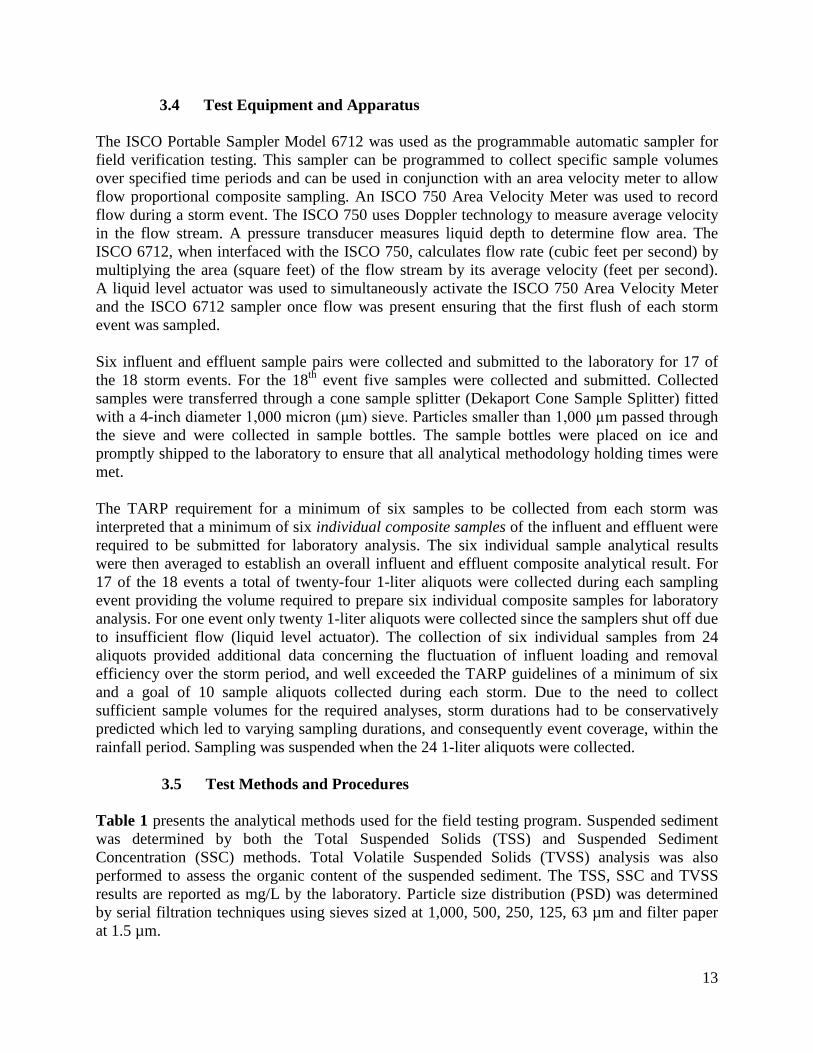
(hr:min) (inches) (hr:min) 1 March 14, 2009 0:30 0.11 0:22 70 2 April 1, 2009 0:50 0.18 0:33 70 3 April 6, 2009 2:00 0.15 1:15 60 4 December 25-26, 2009 11:45 0.56 7:22 60 5 January 17, 2010 4:48 0.59 3:15 70 6 July 25, 2010 0:46 0.55 0:38 80 7 August 12, 2010 3:00 1.82 1:42 60 8 September 12, 2010 3:45 0.61 2:59 80 9 September 29-30, 2010 12:05 4.40 4:52 40 10 December 1, 2010 6:20 0.71 3:12 50 11 December 11, 2010 3:40 0.72 1:25 40 12 February 25, 2011 2:15 0.29 1:30 70 13 March 6, 2011 4:50 1.42 1:59 40 14 March 15-16, 2011 5:06 0.42 3:00 60 15 April 8, 2011 3:55 0.52 1:31 40 16 April 28, 2011 2:19 0.23 1:33 70 17 May 14, 2011 3:05 0.85 1:12 40 18 June 16, 2011 3:20 1.03 0:59 30 Average 0.84 60 Total 15.16
3.8 Stormwater Data Collection
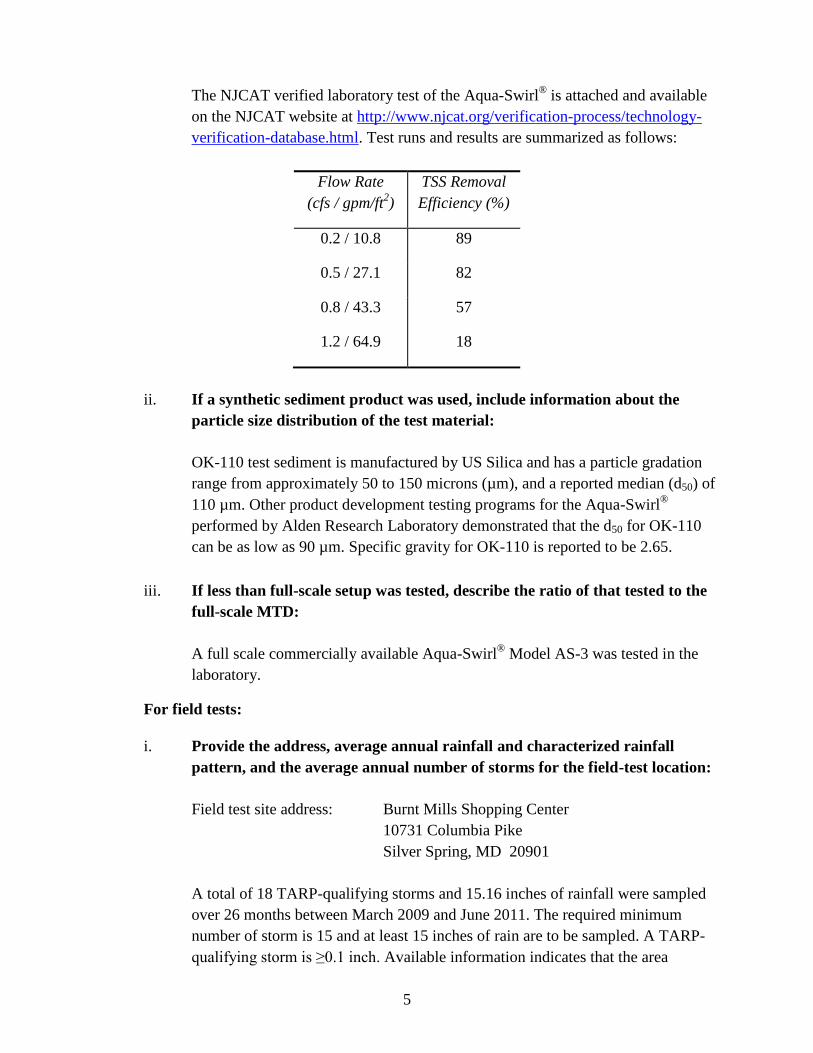
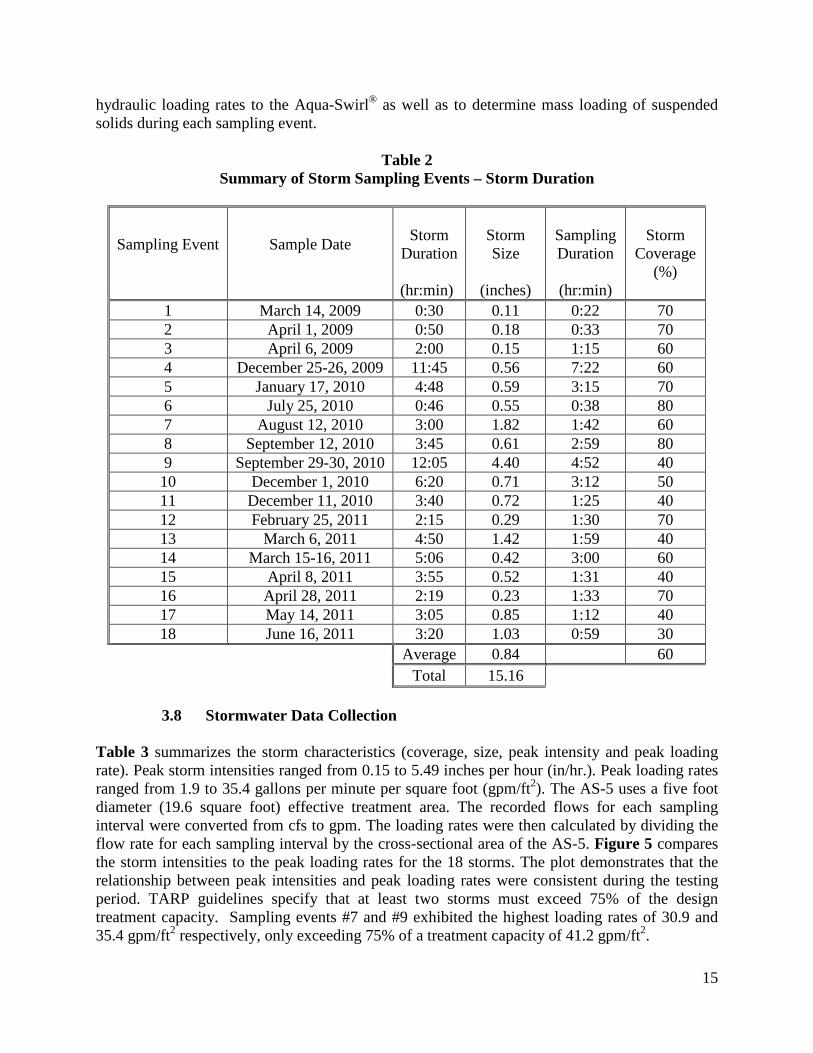
Table 3 summarizes the storm characteristics (coverage, size, peak intensity and peak loading rate). Peak storm intensities ranged from 0.15 to 5.49 inches per hour (in/hr.). Peak loading rates ranged from 1.9 to 35.4 gallons per minute per square foot (gpm/ft2). The AS-5 uses a five foot diameter (19.6 square foot) effective treatment area. The recorded flows for each sampling interval were converted from cfs to gpm. The loading rates were then calculated by dividing the flow rate for each sampling interval by the cross-sectional area of the AS-5. Figure 5 compares the storm intensities to the peak loading rates for the 18 storms. The plot demonstrates that the relationship between peak intensities and peak loading rates were consistent during the testing period. TARP guidelines specify that at least two storms must exceed 75% of the design treatment capacity. Sampling events #7 and #9 exhibited the highest loading rates of 30.9 and 35.4 gpm/ft2 respectively, only exceeding 75% of a treatment capacity of 41.2 gpm/ft2.
Rate Date (hr:min) (inches) (%) (in/hr) (gpm/ft2) 1 March 14, 2009 0:30 0.11 60 0.26 4.1 2 April 1, 2009 0:50 0.18 50 0.46 8.1 3 April 6, 2009 2:00 0.15 60 0.26 4.8 4 December 25-26, 2009 11:45 0.56 60 0.38 4.8 5 January 17, 2010 4:48 0.59 60 0.42 10.4 6 July 25, 2010 0:46 0.55 100 1.21 16.9 7 August 12, 2010 3:00 1.82 90 5.49 30.9 8 September 12, 2010 3:45 0.61 80 0.49 13.1 9 September 29-30, 2010 12:05 4.40 20 2.56 35.4 10 December 1, 2010 6:20 0.71 70 1.82 4.1 11 December 11, 2010 3:40 0.72 50 0.58 2.3 12 February 25, 2011 2:15 0.29 80 0.25 4.1 13 March 6, 2011 4:50 1.42 50 0.46 11.0 14 March 15-16, 2011 5:06 0.42 40 0.35 1.9 15 April 8, 2011 3:55 0.52 80 0.15 3.4 16 April 28, 2011 2:19 0.23 90 0.23 12.5 17 May 14, 2011 3:05 0.85 20 0.47 5.7 18 June 16, 2011 3:20 1.03 80 0.91 13.1 Average 0.84 60 0.93 10.4
Total 15.16
Figure 5. Storm Intensity vs. Peak Loading Rate
17
Sizing a hydrodynamic separator is typically based on a peak design water quality flow. This peak flow is calculated by one of several different methodologies that can include the USDA Natural Resources Conservation Service (NRCS) methodology, the Rational Method or the Modified Rational Method. Utilizing the NRCS methodology to size a hydrodynamic separator for this site, pertinent site-specific data was entered into Technical Release 20 – Computer Program for Project Formulation: Hydrology (TR-20). This sizing method established a peak runoff flow rate of 2.3 cfs which required installation of an Aqua-Swirl® AS-5 (NJDEP certified water quality treatment flow rate (WQTFR) of 52.6 gpm/ft²). Field test data indicates a maximum storm intensity of 5.49 in/hr. with an associated peak loading rate of 30.9 gpm/ft². The highest peak loading rate recorded was 35.4 gpm/ft2 with an associated maximum storm intensity of 2.56 in/hr. Unfortunately, these two storms did not generate a loading rate greater than 75% of the NJDEP certified WQTFR of 52.6 gpm/ft2, thus limiting the field verification WQTFR to 41.2 gpm/ft2. These results demonstrate that a calculated site design loading rate may not actually occur within the field testing program timeline.
3.9 Treatment System Maintenance Annual maintenance of the Aqua-Swirl® system was conducted at the Burnt Mills Shopping Center by technicians affiliated with the Montgomery County Stormwater Sewer Maintenance Program. A vacuum truck was used to empty all captured materials (floatables and settleable solids) and flush the Aqua-Swirl® and associated catch basins and divergence and convergence structures. Continued inspections of the Aqua-Swirl® during the testing program indicated that the device exhibited long term functionality and had been properly maintained as recommended by the manufacturer. Disposal of recovered materials from the Aqua-Swirl® was not the responsibility of AquaShieldTM or its agent(s) during the testing program. 4. Technology System Performance
4.1 Data Quality Assessment In accordance with the QAPP, quality assurance/quality control (QA/QC) samples were collected during the certification program to confirm the precision and accuracy of the sampling and analysis program. Two types of QA/QC samples were collected: field duplicates and field blanks. Field duplicate stormwater samples were collected in identical, laboratory prepared bottles and analyzed for the same parameters. The field duplicate sample was collected at the same location and from the same sample aliquot as the original sample. One field duplicate stormwater sample and one field blank sample was collected for each of the last 15 sampling events (the first three sampling events characterized the site). The field blank was collected by pouring laboratory provided distilled/deionized water through the cone sample splitter into a decontaminated sample bottle, then into the appropriate sample containers for analysis. Field duplicate analytical results showed acceptable reproducibility of the majority of sampling events. There were two isolated events with field duplicate sample results that were outliers; however, the overall relative percent difference (RPD) indicated acceptable reproducibility in
18
sampling results. The overall average RPD was within 30%. If the two identified outliers (3/15/2011 and 5/14/2011) were not included, the average RPD decreased to less than 20% which is the RPD objective identified in the QAPP. All field blank results were below the method detection limits with the exception of two sampling events (12/11/2010 and 4/8/2011) that exhibited very low TVSS, TSS and SSC concentrations compared to measured influent and effluent concentrations.. The field blank results confirmed that the decontamination procedures used for the sampling apparatus and the cone splitter were effective at minimizing any cross contamination during sampling and analysis. Review of the overall QA/QC procedures and analytical results confirmed that the field sampling procedures and analytical methodologies employed produced reliable and representative analytical results.
4.2 Test Results Particle Size Distributions (PSD) Influent samples from three storm events were analyzed for PSD by the serial filtration method. Table 4 summarizes the influent particle size gradations. Average particle sizes from the three samples exhibited 72% silt (2 to 63 µm), 20% very-fine to fine-grained sand (>63 to 250 µm), 2% medium-grained sand (>250 to 500 µm) and 6% coarse sand (>500 to 1,000 µm) .
Table 4 Influent PSD Summary (percent finer than each sieve/filter)
Storm Event 1,000 µm
500 µm
250 µm
125 µm
63 µm
1.5 µm
September 12, 2010 100.00 97.41 92.48 84.44 62.96 0.00 December 1, 2010 100.00 93.16 90.99 87.19 73.71 0.00 December 11, 2010 100.00 92.04 91.59 85.08 78.56 0.00
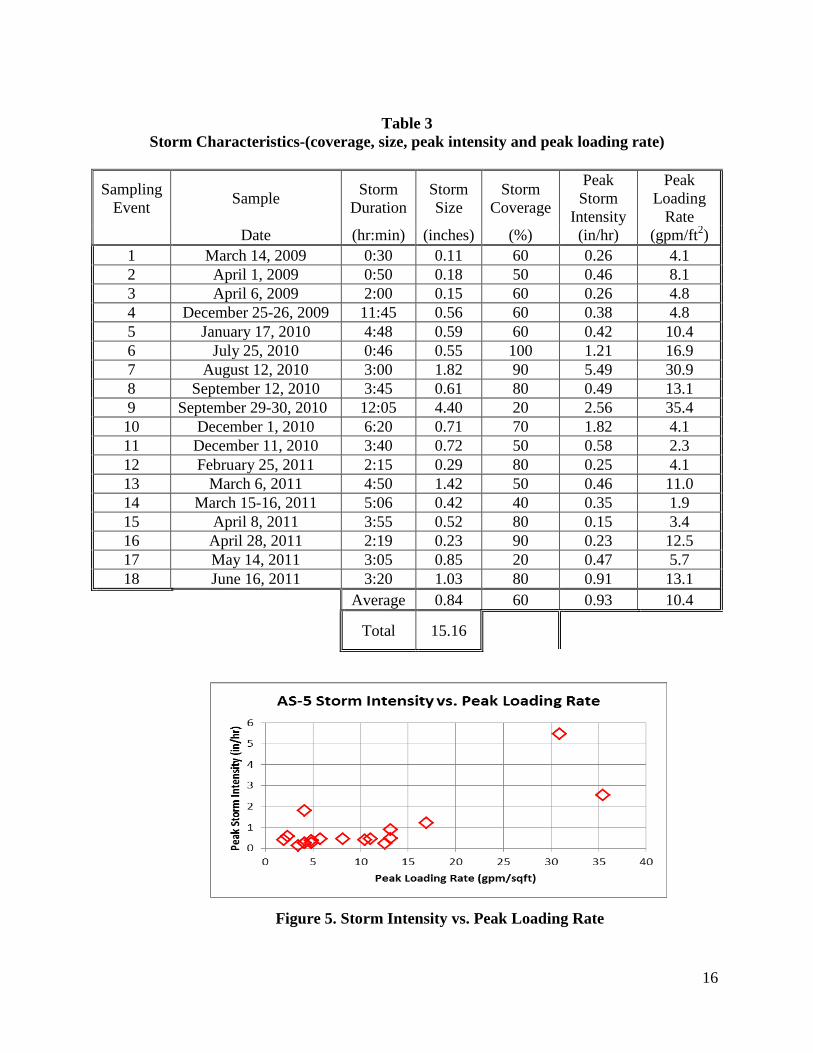
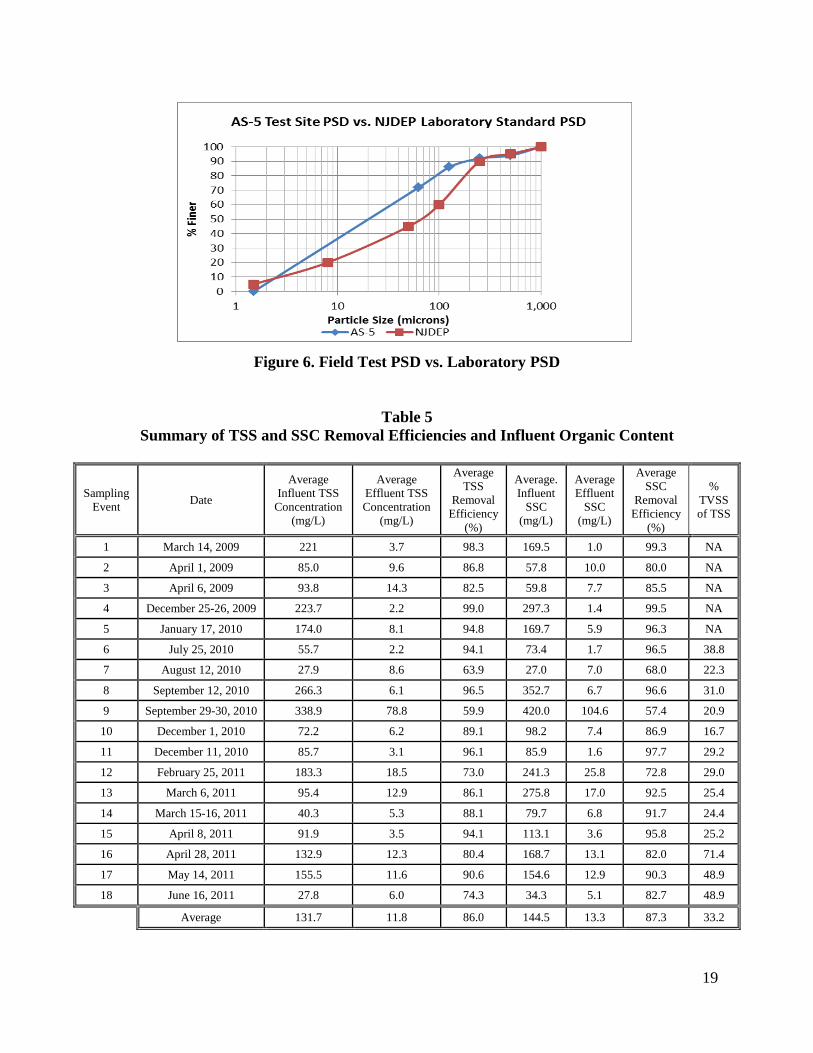
Average 100.00 94.20 91.68 85.57 71.74 0.00 TARP protocol specifies that influent particles PSD d50 be <100 µm in size. The site PSD complies with the testing protocol and indicates a clay-loam texture sediment influent. Figure 6 compares the test site influent PSD to the NJDEP laboratory test PSD standard for hydrodynamic separators. The graph indicates overall that the test site particulates were finer grained than the NJDEP PSD standard. Particulate Matter Removal Efficiency Six influent and effluent sample pairs (in one case only 5 pairs) were composited for laboratory analysis from the 24 (or in one case 20) 1-liter aliquots that were collected during each sampling event. Table 5 summarizes the average of the six (or 5) TSS and SSC influent and effluent results and the average of the six (or 5) removal efficiencies for each stormwater event.
19
Figure 6. Field Test PSD vs. Laboratory PSD
Table 5 Summary of TSS and SSC Removal Efficiencies and Influent Organic Content
Sampling Event Date
Average Influent TSS
Concentration (mg/L)
Average Effluent TSS Concentration
(mg/L)
Average TSS
Removal Efficiency
(%)
Average. Influent
SSC (mg/L)
Average Effluent
SSC (mg/L)
Average SSC
Removal Efficiency
(%)
% TVSS of TSS
1 March 14, 2009 221 3.7 98.3 169.5 1.0 99.3 NA
2 April 1, 2009 85.0 9.6 86.8 57.8 10.0 80.0 NA
3 April 6, 2009 93.8 14.3 82.5 59.8 7.7 85.5 NA
4 December 25-26, 2009 223.7 2.2 99.0 297.3 1.4 99.5 NA
5 January 17, 2010 174.0 8.1 94.8 169.7 5.9 96.3 NA
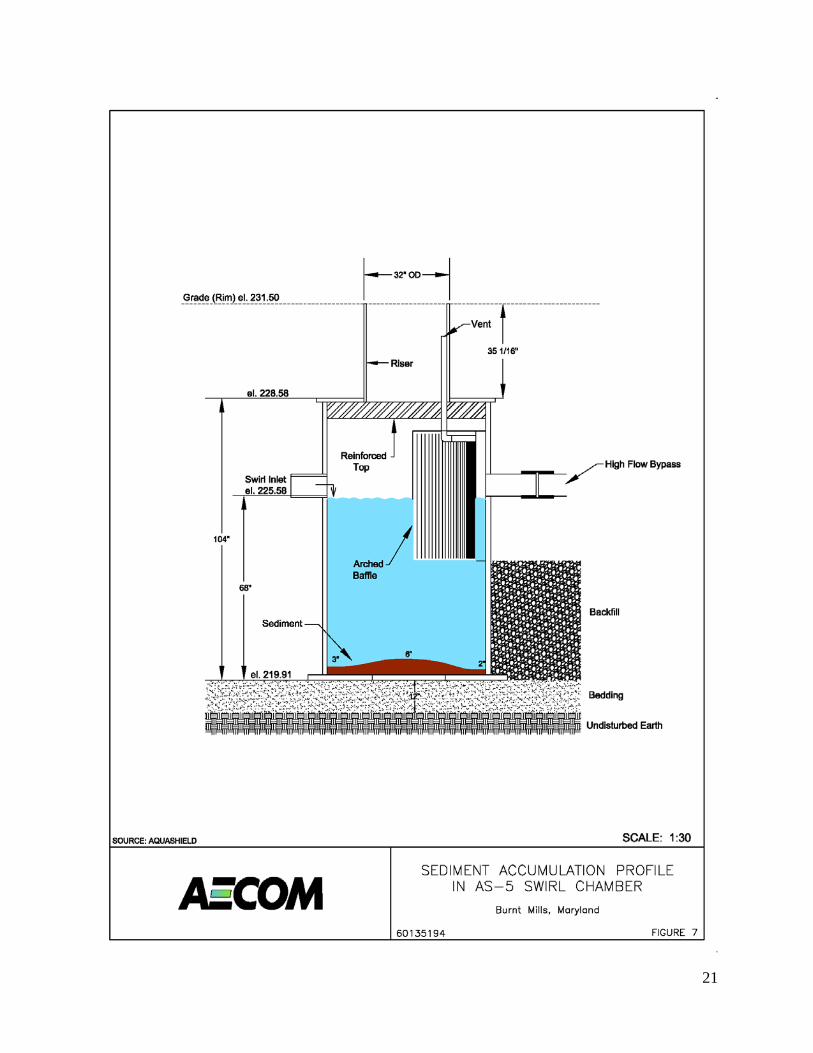
Cumulative average sediment removal efficiencies for the 18 storms was 86% for the TSS method and 87% for the SSC method. Individual removal efficiencies ranged from 60 to 99% for TSS, and 57 to 99% for SSC. Average influent TSS and SSC concentrations were 132 and 145 mg/L, respectively. Average effluent TSS and SSC concentrations were 12 and 13 mg/L, respectively. Data indicates that the sediment concentrations determined by the TSS and SSC methods compare closely. The average TVSS removal rate was 68%, with an average influent concentration of 39 mg/L. The percentage TVSS of the TSS concentrations averaged 33% (Table 5). It is concluded that the influent TSS concentrations and percentages of organic material in the suspended sediment are acceptable for this field evaluation program. Particle Size Distribution of Captured Sediment In order to determine the PSD of the solids that had settled and have been retained within the swirl chamber since the prior maintenance event on November 30, 2010, three sediment samples were collected on October 13, 2011. Samples were collected on the influent side, center and effluent side of the accumulated sediment layer. The PSD analysis was performed by the serial filtration method as cited above. Table 6 summarizes the PSD of samples retained in the swirl chamber. Figure 7 illustrates the accumulated form of the captured sediment in cross-sectional view. The influent side, center and effluent side locations were measured to be three, six and two inches thick, respectively. As designed, the vortex motion of water within the swirl chamber provides for the capture of sediment and retention toward the center of the chamber. AquaShield cites a maximum of 30 inches sediment depth to trigger a maintenance event. This is based on a cone shaped sediment pile such that the edges of the cone measure 24 inches up from the base and the crest (top) of the cone measures 36 inches up from the base.
Average 100.00% 81.29% 68.65% 49.86% 42.90% 0.00% The swirl chamber PSD data indicates that the solids retained within the tested Aqua-Swirl® can be classified a sandy-clay textured sediment. Average particle sizes from the three swirl chamber sediment samples exhibited 43% silt (2 to 63 µm), 26% very-fine to fine-grained sand (>63 to 250 µm), 12% medium-grained sand (>250 to 500 µm) and 19% coarse sand (>500 to 1,000 µm).
21
22
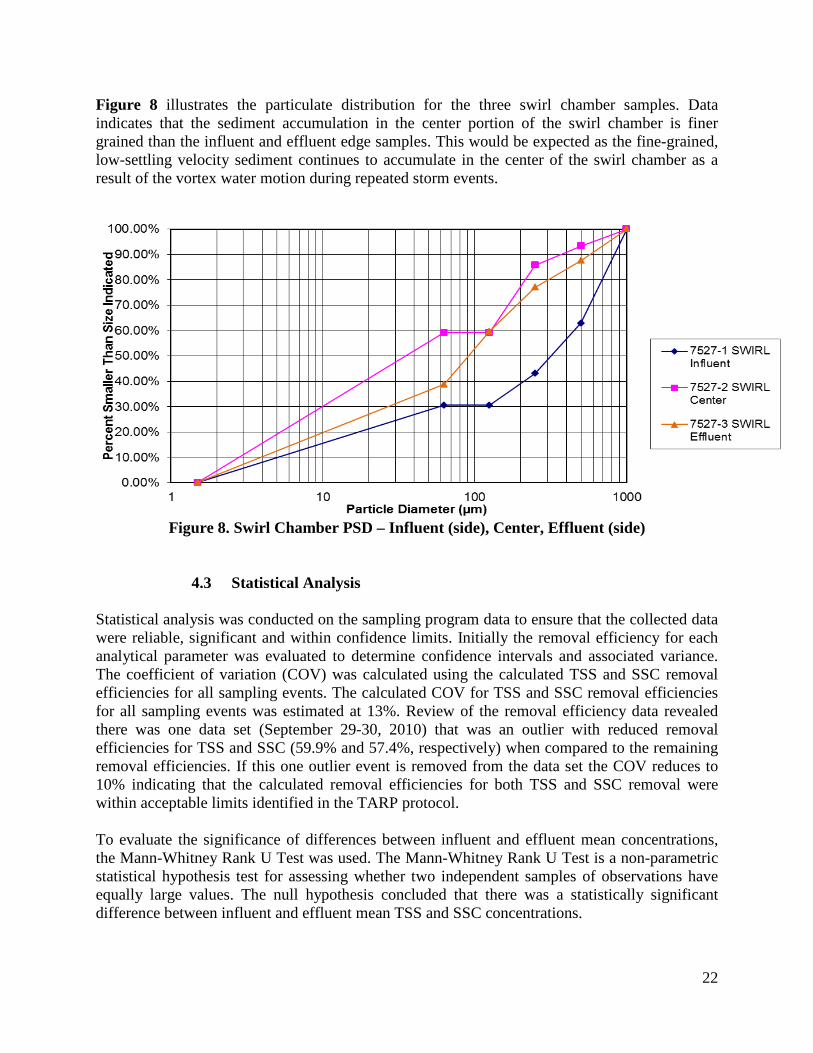
Figure 8 illustrates the particulate distribution for the three swirl chamber samples. Data indicates that the sediment accumulation in the center portion of the swirl chamber is finer grained than the influent and effluent edge samples. This would be expected as the fine-grained, low-settling velocity sediment continues to accumulate in the center of the swirl chamber as a result of the vortex water motion during repeated storm events.
4.3 Statistical Analysis Statistical analysis was conducted on the sampling program data to ensure that the collected data were reliable, significant and within confidence limits. Initially the removal efficiency for each analytical parameter was evaluated to determine confidence intervals and associated variance. The coefficient of variation (COV) was calculated using the calculated TSS and SSC removal efficiencies for all sampling events. The calculated COV for TSS and SSC removal efficiencies for all sampling events was estimated at 13%. Review of the removal efficiency data revealed there was one data set (September 29-30, 2010) that was an outlier with reduced removal efficiencies for TSS and SSC (59.9% and 57.4%, respectively) when compared to the remaining removal efficiencies. If this one outlier event is removed from the data set the COV reduces to 10% indicating that the calculated removal efficiencies for both TSS and SSC removal were within acceptable limits identified in the TARP protocol. To evaluate the significance of differences between influent and effluent mean concentrations, the Mann-Whitney Rank U Test was used. The Mann-Whitney Rank U Test is a non-parametric statistical hypothesis test for assessing whether two independent samples of observations have equally large values. The null hypothesis concluded that there was a statistically significant difference between influent and effluent mean TSS and SSC concentrations.
23
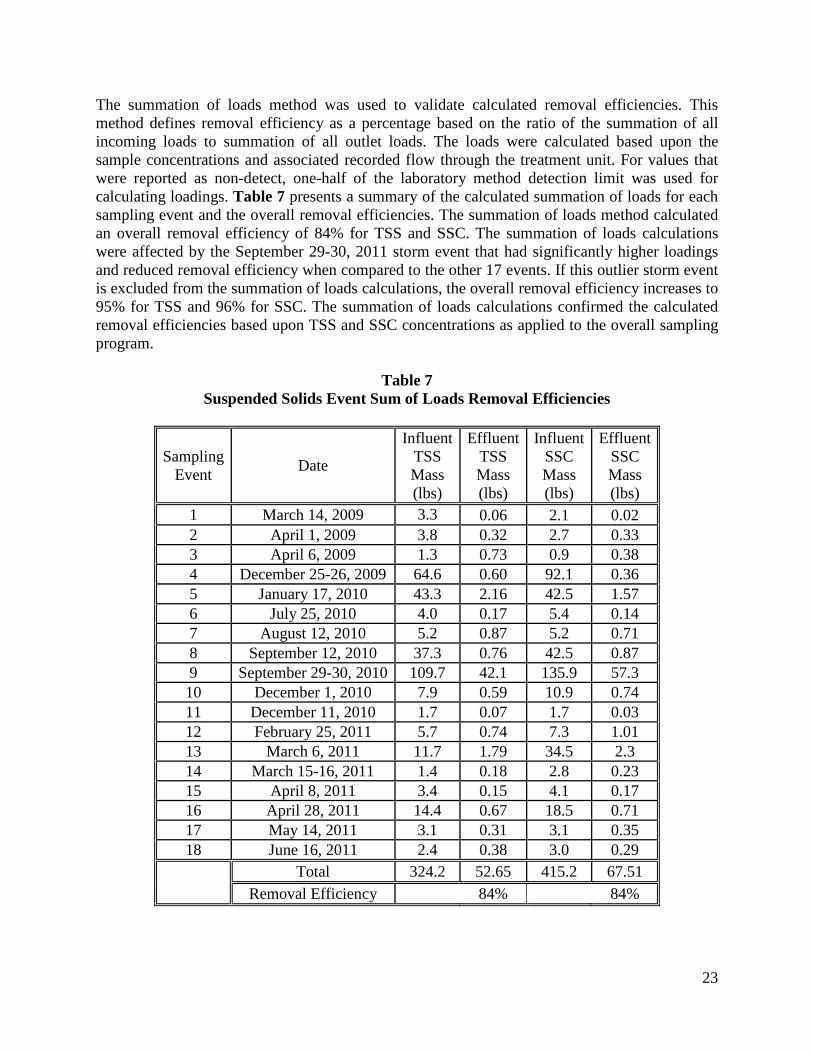
The summation of loads method was used to validate calculated removal efficiencies. This method defines removal efficiency as a percentage based on the ratio of the summation of all incoming loads to summation of all outlet loads. The loads were calculated based upon the sample concentrations and associated recorded flow through the treatment unit. For values that were reported as non-detect, one-half of the laboratory method detection limit was used for calculating loadings. Table 7 presents a summary of the calculated summation of loads for each sampling event and the overall removal efficiencies. The summation of loads method calculated an overall removal efficiency of 84% for TSS and SSC. The summation of loads calculations were affected by the September 29-30, 2011 storm event that had significantly higher loadings and reduced removal efficiency when compared to the other 17 events. If this outlier storm event is excluded from the summation of loads calculations, the overall removal efficiency increases to 95% for TSS and 96% for SSC. The summation of loads calculations confirmed the calculated removal efficiencies based upon TSS and SSC concentrations as applied to the overall sampling program.
Table 7 Suspended Solids Event Sum of Loads Removal Efficiencies
Sampling Event Date
Influent TSS Mass (lbs)
Effluent TSS Mass (lbs)
Influent SSC Mass (lbs)
Effluent SSC Mass (lbs)
1 March 14, 2009 3.3 0.06 2.1 0.02 2 April 1, 2009 3.8 0.32 2.7 0.33 3 April 6, 2009 1.3 0.73 0.9 0.38 4 December 25-26, 2009 64.6 0.60 92.1 0.36 5 January 17, 2010 43.3 2.16 42.5 1.57 6 July 25, 2010 4.0 0.17 5.4 0.14 7 August 12, 2010 5.2 0.87 5.2 0.71 8 September 12, 2010 37.3 0.76 42.5 0.87 9 September 29-30, 2010 109.7 42.1 135.9 57.3 10 December 1, 2010 7.9 0.59 10.9 0.74 11 December 11, 2010 1.7 0.07 1.7 0.03 12 February 25, 2011 5.7 0.74 7.3 1.01 13 March 6, 2011 11.7 1.79 34.5 2.3 14 March 15-16, 2011 1.4 0.18 2.8 0.23 15 April 8, 2011 3.4 0.15 4.1 0.17 16 April 28, 2011 14.4 0.67 18.5 0.71 17 May 14, 2011 3.1 0.31 3.1 0.35 18 June 16, 2011 2.4 0.38 3.0 0.29
Total 324.2 52.65 415.2 67.51
Removal Efficiency 84% 84%
24
4.4 Summary Table 8 summarizes the storm characteristics (duration, size, intensity, peak loading rate) as well as the associated sediment removal efficiencies. Figure 9 presents performance curves based upon both the TSS and SSC analytical results. The curves are derived for any given storm by plotting average removal efficiency (%) against peak surface area loading rate (gpm/ft2). The TSS and SSC performance curves are similar, with the SSC curve showing slightly higher performance
4 December 25-26, 2009 99.0 99.5 11:45 0.56 0.38 4.8
5 January 17, 2010 94.8 96.3 4:48 0.59 0.42 10.4 6 July 25, 2010 94.1 96.5 0:46 0.55 1.21 16.9 7 August 12, 2010 63.9 68.0 3:00 1.82 5.49 30.9 8 September 12, 2010 96.5 96.6 3:45 0.61 0.49 13.1
9 September 29-30, 2010 59.9 57.4 12:05 4.40 2.56 35.4
10 December 1, 2010 89.1 86.9 6:20 0.71 1.82 4.1 11 December 11, 2010 96.1 97.7 3:40 0.72 0.58 2.3 12 February 25, 2011 73.0 72.8 2:15 0.29 0.25 4.1 13 March 6, 2011 86.1 92.5 4:50 1.42 0.46 11.0 14 March 15-16, 2011 88.1 91.7 5:06 0.42 0.35 1.9 15 April 8, 2011 94.1 95.8 3:55 0.52 0.15 3.4 16 April 28, 2011 80.4 82.0 2:19 0.23 0.23 12.5 17 May 14, 2011 90.6 90.3 3:05 0.85 0.47 5.7 18 June 16, 2011 74.3 82.7 3:20 1.03 0.91 13.1 Average 86.0 87.3 0.84 0.93 10.4 Total 15.16
25
Figure 9. AS-5 Field Performance Curves
5. Performance Verification A 27-month field test of an Aqua-Swirl® Model AS-5 has been completed at an urban shopping center in Silver Spring, Montgomery County, Maryland. Analytical results and performance analysis from 18 storm events and over 15 inches of rainfall demonstrated that 78% of the storms achieved greater than 80% TSS removal efficiency and 83% of the storms achieved greater than 80% SSC removal efficiency for the clay-loam textured sediment influent. The TARP requirement that a minimum of six samples be collected from each storm was interpreted by AECOM that a minimum of six individual composite samples of the influent and effluent were required to be submitted for laboratory analysis. To ensure that sufficient sample volumes were collected for the required analyses, storm durations had to be conservatively predicted which led to varying sampling durations, and consequently event coverage, within the rainfall period. The storm duration coverage for each storm fluctuated from 30 to 80 percent with an overall average sampling duration of 60%. The storm flow coverage (round to the nearest 10%) varied between 20 and 100 percent with an overall average storm event coverage of 60%. For all storm events, samples were collected from the first 20% of the total storm event flow. TARP qualifying storms require flow-weighted composite samples be obtained covering a minimum of 60% of the total storm flow. An average of 60% storm flow coverage and 60% storm duration coverage was achieved over the field testing period. Six of the 18 sampled storm events had flow coverage below 60%. Analysis of the TSS and SSC removal efficiencies for
26
these six events indicated slightly lower removal efficiencies than for the other 12 qualifying events. Consequently, utilizing these six storms for the AS-5 performance evaluation resulted in a lower average removal efficiency and a more conservative assessment. Similarly, seven storm events had less than 60% storm duration coverage; these events also had slightly lower removal efficiencies than for the other 11 storm events. Finally, the four storm sampling events that fell below either 60% storm flow coverage or 60% storm duration coverage had slightly lower removal efficiencies than for the other 14 storm events. Hence, it is concluded that including the results from all 18 storms resulted in a lower overall removal efficiency for the AS-5 and consequently a more conservative performance evaluation. This is also true when evaluating the suspended solids event sum of loads removal efficiencies (Table 7). The relatively high TSS and SSC removal efficiencies for the AS-5 achieved under typical rainfall conditions for the geographic area was largely a result of the resulting storm intensities sampled over the 27-month field performance test. Specifically, 10 (55.6%) of the 18 storm events had peak loading rates below 25% of an Aqua-Swirl® stormwater treatment system loading rate of 41.2 gpm/ft2 and another 6 events (33.3%) had peak loading rates between 10- 20 gpm/ft2. 6. Net Environmental Benefit The Aqua-Swirl® Model AS-5 requires no input of raw material, has no moving parts and therefore uses no water or energy other than that provided by stormwater runoff. For the 18 storm events monitored during the 27-month monitoring period the mass of materials captured and retained by the Aqua-Swirl® Model AS-5 would otherwise have been released to the environment. 7. References AECOM (2010). Quality Assurance Project Plan for Field Performance Verification Testing of the Aqua-Swirl® Model AS-5 Stormwater Treatment System, Burnt Mills Shopping Center, Silver Spring, Maryland. Kennedy, John B. and Neville, Adam M. Basic Statistical Methods for Engineers and Scientists. Second Edition, Pun-Donnelly Publisher, New York. New Jersey Department of Environmental Protection (NJDEP). (2006). New Jersey Tier II Stormwater Test Requirements-Amendment to TARP Tier II Protocol. Trenton, New Jersey. Available online: http://water.usgs.gov/osw/pubs/WRIR00-419l.pdf Technology Acceptance and Reciprocity Partnership (TARP). (2003). The Technology Acceptance Reciprocity Partnership for Protocol for Stormwater Best Management Practice Demonstrations. United States Environmental Protection Agency (USEPA). (2006). Data Quality Assessment: A Reviewer’s Guide EPA Q
Center for Environmental Systems Stevens Institute of Technology
Castle Point Station Hoboken, NJ 07030-0000
February, 15, 2013
Mr. Mark B. Miller, P.G. AquaShield™, Inc. 2705 Kanasita Dr. Chattanooga, TN 37343
Re: Aqua-Swirl® Stormwater Treatment System Mark, A 27-month field test of an Aqua-Swirl® Model AS-5 has been completed at an urban shopping center in Silver Spring, Montgomery County, Maryland. Analytical results and performance analysis from 18 storm events and over 15 inches of rainfall demonstrated that 78% of the storms achieved greater than 80% TSS removal efficiency and 83% of the storms achieved greater than 80% SSC removal efficiency for the clay-loam textured sediment influent. The TARP requirement that a minimum of six samples be collected from each storm was interpreted by AECOM, independent environmental testing entity, that a minimum of six individual composite samples of the influent and effluent were required to be submitted for laboratory analysis. To ensure that sufficient sample volumes were collected for the required analyses, storm durations had to be conservatively predicted which led to varying sampling durations, and consequently event coverage, within the rainfall period. The storm duration coverage for each storm fluctuated from 30 to 80 percent with an overall average sampling duration of 60%. The storm flow coverage (rounded to the nearest 10%) varied between 20 and 100 percent with an overall average storm event coverage of 60%. For all storm events, samples were collected from the first 20% of the total storm event flow. The relatively high TSS and SSC removal efficiencies for the AS-5 achieved under typical rainfall conditions for the geographic area was largely a result of the resulting storm intensities sampled over the 27-month field performance test. Unfortunately, none of the storms generated a loading rate greater than 75% of the NJDEP certified Water Quality Treatment Flow Rate (WQTFR) of 52.6 gpm/ft2, thus limiting the field
verification WQTFR to 41.2 gpm/ft2. Further, 10 (55.6%) of the 18 storm events had peak loading rates below 25% of an Aqua-Swirl® WQTFR of 41.2 gpm/ft2 and another 6 events (33.3%) had peak loading rates between 10- 20 gpm/ft2. The Aqua-Swirl®, having a WQTFR of 41.2 gpm/ft2, has demonstrated a suspended sediment removal efficiency in excess of 80% on a net annual basis for a clay-loam textured sediment in this field test. NJCAT is pleased to provide a copy of the verification report, “NJCAT Technology Verification – Aqua-Swirl® Model AS-5 Stormwater Treatment System”, detailing the procedures that evaluated the technology performance. The report documents the final verification of the Aqua-Swirl® technology having completed field evaluation in accordance with the TARP Tier II Protocol (TARP, 2003) and New Jersey Tier II Stormwater Test Requirements—Amendments to TARP Tier II Protocol (NJDEP, 2006). The report is available for downloading from the NJCAT website at: http://www.njcat.org/verification/Verifications_detail.cfm?LinkAdvID=103146 Regards,
Richard S. Magee, Sc.D., P.E., BCEE Technical Director
October 2013
GENERAL USE LEVEL DESIGNATION FOR PRETREATMENT
CONDITIONAL USE LEVEL DESIGNATION FOR BASIC TREATMENT
For
AquaShieldTM
, Inc.’s Aqua-Swirl® Stormwater Treatment System
Ecology’s Decision:
Based on AquaShieldTM
, Inc. application submissions, Ecology hereby issues the following
use level designations:
1. General Use Level Designation (GULD) for the Aqua-Swirl® for pretreatment use (a)
ahead of infiltration treatment, or (b) to protect and extend the maintenance cycle of a
Basic or Enhanced Treatment device (e.g., sand or media filter). This GULD applies to
Aqua-SwirlTM
units sized at water quality design flow rate of no more than 23 GPM/sf
at the Water Quality design flow rate.
2. Conditional Use Level Designation (CULD) for the Aqua-Swirl® for standalone Basic (TSS)
treatment, sized at a water quality design flow rate of rate of no more than 23 GPM/sf.
3. The water quality design flow rates are calculated using the following procedures:
Western Washington: for treatment installed upstream of detention or retention,
the water quality design flow rate is the peak 15-minute flow rate as calculated using
the latest version of the Western Washington Hydrology Model or other Ecology-
approved continuous runoff model.
Eastern Washington: For treatment installed upstream of detention or retention,
the water quality design flow rate is the peak 15-minute flow rate as calculated using
one of the three methods described in Chapter 2.2.5 of the Stormwater Management
Manual for Eastern Washington (SWMMEW) or local manual.
Entire State: For treatment installed downstream of detention, the water quality
design flow rate is the full 2-year release rate of the detention facility.
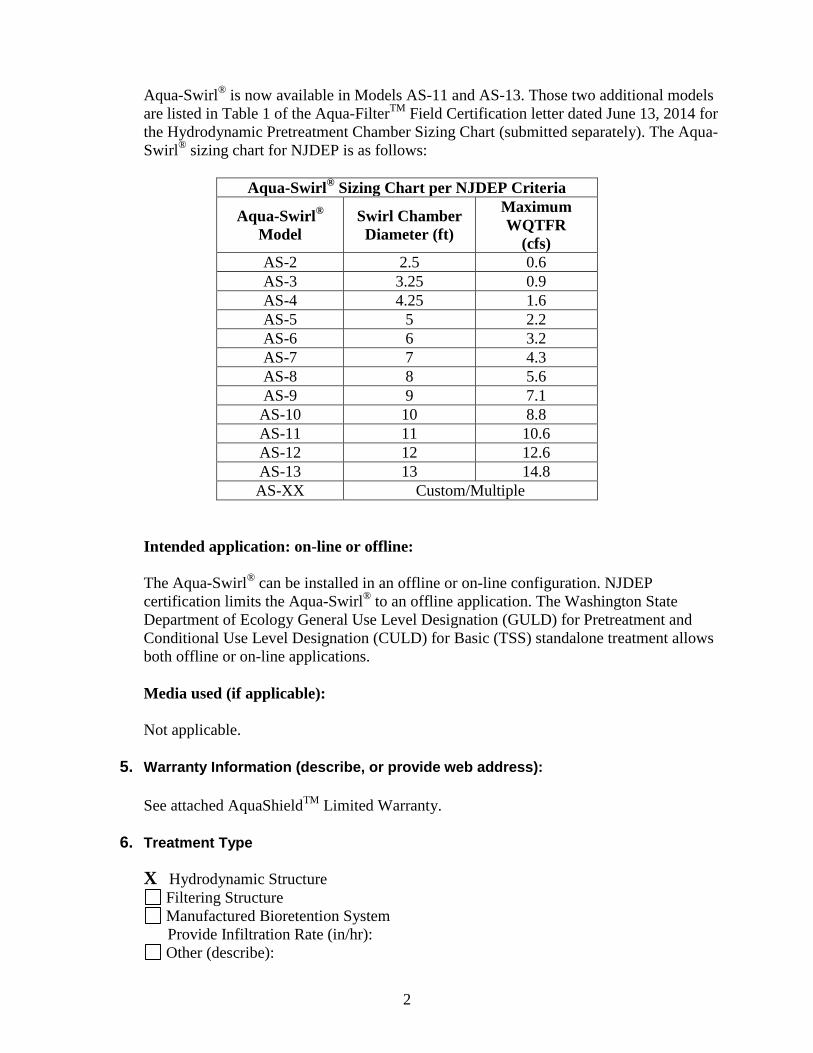
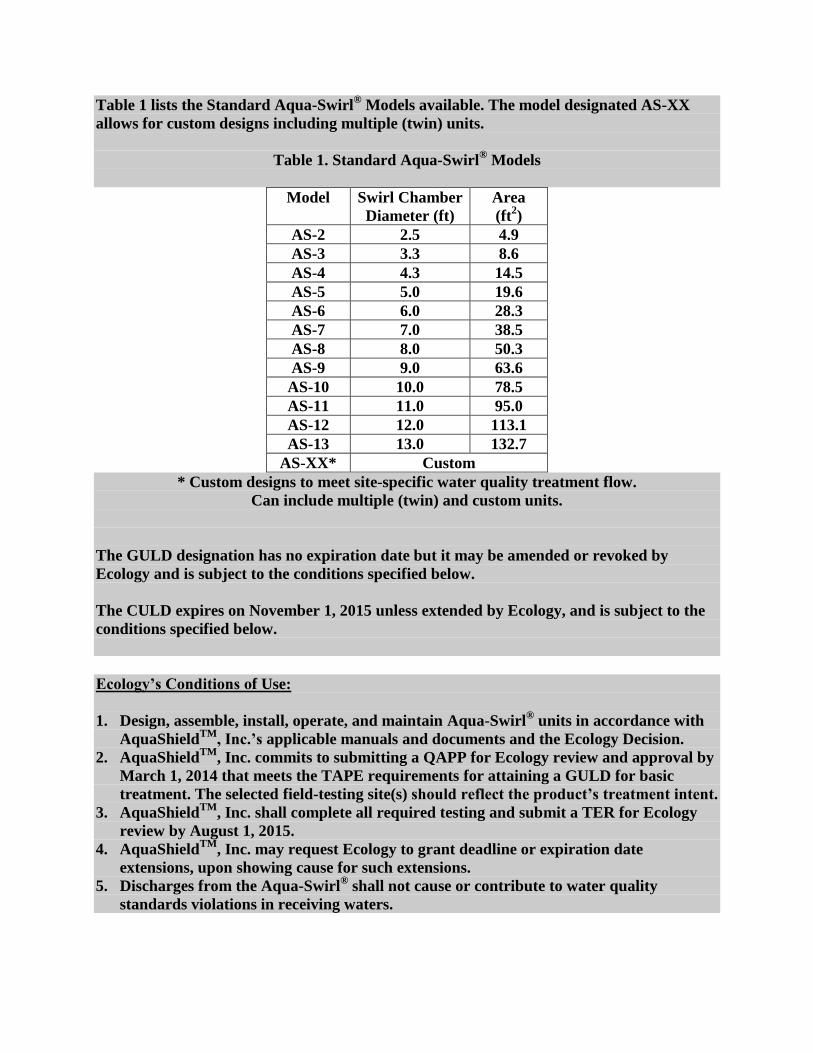
Table 1 lists the Standard Aqua-Swirl® Models available. The model designated AS-XX
allows for custom designs including multiple (twin) units.
Table 1. Standard Aqua-Swirl® Models
Model Swirl Chamber
Diameter (ft)
Area
(ft2)
AS-2 2.5 4.9
AS-3 3.3 8.6
AS-4 4.3 14.5
AS-5 5.0 19.6
AS-6 6.0 28.3
AS-7 7.0 38.5
AS-8 8.0 50.3
AS-9 9.0 63.6
AS-10 10.0 78.5
AS-11 11.0 95.0
AS-12 12.0 113.1
AS-13 13.0 132.7
AS-XX* Custom
* Custom designs to meet site-specific water quality treatment flow.
Can include multiple (twin) and custom units.
The GULD designation has no expiration date but it may be amended or revoked by
Ecology and is subject to the conditions specified below.
The CULD expires on November 1, 2015 unless extended by Ecology, and is subject to the
conditions specified below.
Ecology’s Conditions of Use:
1. Design, assemble, install, operate, and maintain Aqua-Swirl® units in accordance with
AquaShieldTM
, Inc.’s applicable manuals and documents and the Ecology Decision.
2. AquaShieldTM
, Inc. commits to submitting a QAPP for Ecology review and approval by
March 1, 2014 that meets the TAPE requirements for attaining a GULD for basic
treatment. The selected field-testing site(s) should reflect the product’s treatment intent.
3. AquaShieldTM
, Inc. shall complete all required testing and submit a TER for Ecology
review by August 1, 2015.
4. AquaShieldTM
, Inc. may request Ecology to grant deadline or expiration date
extensions, upon showing cause for such extensions.
5. Discharges from the Aqua-Swirl®
shall not cause or contribute to water quality
standards violations in receiving waters.
Applicant: AquaShieldTM
, Inc.
Applicant’s Address: 2719 Kanasita Drive
Chattanooga, TN 37343
Application Documents:
Aqua-Filter™ Stormwater Treatment System, Application for Stormwater Quality
Treatment Pilot Use Designation (Short-Term) for Basic, Enhanced, Oil, and Treatment
Train Treatment in Western Washington submitted to Stan Ciuba, Washington State
Department of Ecology (August 21, 2003)
NJCAT Technology Verification: Aqua-Swirl™ Concentrator and Aqua-Filter™
Stormwater Treatment System (September 2005)
NJCAT Technology Verification. Aqua-Swirl®
Model AS-5 Stormwater Treatment
System, AquaShield™, Inc. November 2012
NJCAT Field Test Verification Report Letter, Aqua-Swirl® Model AS-5, February 15,
2013.
Applicant’s Use Level Request:
General Use Level Designation as a Basic Treatment device in accordance with Ecology’s 2012
Stormwater Management Manual for Western Washington.
Applicant’s Performance Claims:
Based on laboratory studies, the Aqua-Swirl® Model AS-3, has been shown to have a total
suspended solids removal efficiency (measured as suspended sediment concentration) of 60%
when operated at 60% of its water quality treatment flow using OK-110 silica with a d50 particle
size of 110 microns, and average influent of 320 mg/L and zero initial sediment loading.
Ecology’s Recommendations:
Ecology finds that:
AquaShieldTM
, Inc. qualifies for the opportunity to demonstrate, through field-testing in
the Pacific Northwest, whether the Aqua-Swirl® can attain Ecology’s Basic treatment
goals. The GULD approval for Pre-Treatment using the Aqua-Swirl® remains in effect.
Findings of Fact:
1. The Aqua-Swirl®, sized at no more than 23 GPM/sf, should provide equivalent performance
to a presettling basin as defined in the most recent version of Stormwater Management
Manual for Western Washington, Volume V, Chapter 6 (BMP T6.10). Note: This reference
applies to use in Eastern Washington as well.
2. Tennessee Tech University completed laboratory testing for removal of US Silica OK-110
silica using an Aqua-Swirl® Model AS-3. Laboratory results for this 50 to 125-micron silica
showed 80% removal at about 23 GPM/sf operating rate. Estimated annual TSS removal
efficiency, based on Portland, ME rainfall, is 91%.
3. Findings from the NJCAT Technology Verification report for field testing an Aqua-Swirl®
Model AS-5 include:
a. Aqua-Swirl® monitored 18 storm events in Maryland from 2009 through 2011.
b. Influent TSS was greater than 100 mg/L for 8 events. Average annual TSS removal
was 86.6 percent.
c. Influent TSS was less than 100 mg/L for 10 events. Effluent TSS for all 10 events
was less than 20 mg/L.
d. Influent particle size was 72 percent silt (based on three samples).
e. Aqua-Swirl® monitored the system up to a maximum of 41.2 GPM/sf. They
maintained an 80 percent removal of TSS per storm event up to approximately 23
GPM/sf.
Other Aqua-Swirl® Related Issues to be Addressed By the Company:
1. Resuspension: The Aqua-Swirl® Model AS-5 field test included 16 storm events at less than
23 GPM/sf. Effluent TSS for these 16 storms was less than 20 mg/L and averaged 7.9 mg/L.
Influent TSS ranged from 27.8 to 266.3 mg/L and averaged 125.3 mg/L. Given the lack of
resuspension at less than 23 GPM/sf, users can install the Aqua-Swirl® off-line or on-line.
2. AquaShield should test the system under normal operating conditions, such as partially
filling the swirl concentrator with pollutants. Results obtained for “clean” systems may not
be representative of typical performance.
Technology Description: Download at http://www.aquashieldinc.com