Page 1
1 1 2 2
1 Department of Agriculture, Fisheries and Forestry (DAFF), Bribie Island Research Centre, Woorim, Qld, Australia;2 Department of Agriculture, Fisheries and Forestry, Health and Food Sciences Precinct, Coopers Plains, Qld, Australia
This study examined the nutritional composition of the
intertidal marine polychaete Perinereis helleri (Nereididae)
when artificially cultured in sand filters treating mariculture
wastewater. Moisture levels in harvested P. helleri ranged
from 758 to 855 g kg�1, and ash, from 23 to 61 g kg�1 wet
matter (WM). Stocking density and graded size after
harvest significantly affected their composition. Higher total
lipid contents were found in large (>0.6 g) P. helleri
(16–19 g kg�1 WM) and those grown at the lowest density
(1000 m�2: 18 g kg�1 WM) than in small (≤0.6 g) ones
(14 g kg�1 WM) and those grown at the highest densities
(4000–6000 m�2: 13–16 g kg�1 WM). Several fatty acids
within a very broad profile (some 30 identified) reflected this
pattern, yet their ARA/EPA/DHA ratios were relatively
unaffected. Feeding the polychaete-assisted sand filters
(PASF) with fish meal to increase worm biomass productiv-
ity significantly increased their DHA content. Other compo-
nents (e.g. protein, phospholipids, cholesterol, carbohydrate,
amino acids, nitrogen, minerals and bromophenols) and
nutritional factors (e.g. maturity, feeding seaweed and ende-
mic shrimp viral content) were also investigated. Results
suggest that PASF-produced P. helleri have a well-balanced
nutritional profile for penaeid shrimp and fish broodstock.
KEY WORDS: amino acids, biosecurity, broodstock nutrition,
lipids, minerals, Nereididae
Received 30 April 2013; accepted 14 August 2013
Correspondence: P.J. Palmer, Bribie Island Research Centre, PO Box
2066, Woorim, Qld 4507, Australia. E-mail: [email protected]
Nutritious diets for broodstock underpin successful opera-
tions for cultured species throughout the world. Maturation
diets need to be palatable and digestible and provide suffi-
cient energy and a balance of essential nutrients to facili-
tate high reproductive success. In particular, marine fish
and shrimp broodstock are known to have requirements
for a range of essential fatty acids which they cannot syn-
thesize themselves (Izquierdo et al. 2001; Wouters et al.
2001). These have traditionally been supplied by lipids in
live and fresh/frozen diets mainly comprising a range of
marine organisms including squid, bivalve molluscs, crusta-
ceans and polychaetes (Marsden et al. 1992; Meunpol et al.
2005; Hoa et al. 2009). Although polychaetes are the most
expensive of these diets, they are widely considered indis-
pensible in commercial penaeid maturation diets (Harrison
1990; Kawahigashi 1998). However, their supplies are still
largely dependent on wild populations, so can be affected
by overfishing and habitat disturbances (Scaps 2003). Also,
their nutritional contents are known to vary according to
seasonal and environmental conditions (Garcia-Alonso
et al. 2008), and their biosecurity status has recently been
questioned (Vijayan et al. 2005). These factors suggest that
alternative feeds or alternative production strategies for
suitable polychaete species are needed.
To improve reliability of content and supply for shrimp
maturation, several researchers have turned to replacement
or supplementation of live and fresh/frozen feeds with for-
mulated feeds (Wouters et al. 2001). These have been basi-
cally modelled on the measured contents of shrimp
broodstock (mature ovaries: Hoa et al. 2009) and some of
their more common natural feeds (e.g. squid and mussel:
Marsden et al. 1997; polychaetes: Meunpol et al. 2005). A
few studies have incorporated polychaetes into manufac-
tured feeds for targeted nutrition and their chemical attrac-
tant properties (Palmer & Slattery 2009; Chung et al.
2011). However, in maturation practices, compounded diets
are still almost always used in combination with fresh feeds
(see Coman et al. 2007; Turchini et al. 2009), where intact
polychaetes have remained an integral part of commercial
. . . . . . . . . . . . . . . . . . . . . . . . . . . . . . . . . . . . . . . . . . . . . . . . . . . . . . . . . . . . . . . . . . . . . . . . . . . . . . . . . . . . . . . . . . . . . .
ª 2014 The State of Queensland (through the Department of Agriculture, Fisheries and Forestry). Aquaculture Nutrition © 2014 JohnWiley & Sons Ltd
2014 doi: 10.1111/anu.12129. . . . . . . . . . . . . . . . . . . . . . . . . . . . . . . . . . . . . . . . . . . . . . . . . . . . . . . . . . . . . . . . . . . . . . . . . . . . . . . . . . . . . . . . . .
Aquaculture Nutrition
Page 2
shrimp broodstock nutrition. Their neutral lipids and long-
chain polyunsaturated fatty acids (lcPUFA) are thought to
contribute significantly to gonadal maturation (Middleditch
et al. 1980; Lytle et al. 1990; Nguyen et al. 2012). In addi-
tion, they have been found to contain several substances
that directly stimulate the endocrine system in penaeid
shrimp (e.g. steroids: Laufer et al. 1997; prostaglandin:
Croz et al. 1988; Poltana et al. 2005; Meunpol et al. 2010;
progesterone: Meunpol et al. 2007). These combined fac-
tors demonstrate the importance of reliable, biosecure poly-
chaete supplies for future developments in the marine
shrimp (and fish) farming industry.
The development of polychaete-assisted sand filters
(PASF) for treating mariculture wastewater (Palmer 2010)
has created the opportunity to produce large quantities of
polychaetes from waste nutrients in land-based marine
farming systems. The PASF system can be applied to
wastewater from broad-scale mariculture ponds for on-
farm recirculation or environmentally benign discharge.
Its main actions are to capture the phytoplankton (and
other suspended debris) that proliferate in the water col-
umn of outdoor semi-intensive cultures and present it in
a metered way as food to polychaetes that are cultured in
sand filtration beds. It can provide a functional link
between particulate organic and inorganic nutrients in
integrated systems and at large scale has recently been
shown to significantly reduce suspended solids, total nitro-
gen and total phosphorus levels in wastewater at commer-
cial shrimp and fish farms (DAFF, unpublished data).
Given this desirable broad-scale water treatment amenity,
its application may expand in the future where environ-
mentally sustainable, biosecure seafood production sys-
tems and increasing amounts of polychaete biomass are
sought.
To date, relatively small quantities of Perinereis helleri
have been cultured in Queensland in conjunction with the
development and testing of the PASF system. However,
this product has successfully replaced marine bloodworms
(Marphysa sp.) in fish and shrimp hatcheries and in fishing
bait markets (P.J. Palmer, pers. obs.). Because its nutri-
tional content and biosecurity status were important
aspects for these uses, studies were undertaken regarding
its proximate composition, fatty and amino acids and other
potentially active nutritional compounds, as well as routine
screening for endemic shrimp viruses. This article docu-
ments the nutritional status of P. helleri grown in func-
tional PASF systems and investigates the ways that
environmental factors and commercial imperatives may
affect their most important nutritional attributes.
Several hundred mature P. helleri collected from Moreton
Bay in South East Queensland (Long. 153°E, Lat. 27°S) in
2005 formed the initial breeding nucleus. These were
spawned and incubated using proprietary methods. One-
month-old cultured juveniles were stocked and grown in
PASF systems at increasing scales of application from 2005
to 2010. Broodstock collected from PASF beds gave rise to
subsequent generations each year.
To obtain polychaete biomass for analyses, random sam-
ples of the sand substrate were removed from PASF beds
and worms within were separated from the sand using
2-mm sieves. Further separation from mucus-laden silt was
undertaken on bulk using the worms’ active movement
through larger (8-mm) sieves, and all worms were then
purged en masse in clean sea water. Samples for nutritional
content analyses were purged for 4 h, sorted, drip-dried on
bulk (20 s in a fine net), placed into plastic bags and frozen
in 50- to 100-g lots by placing directly into a �80 °C ultra-
freezer. Each sorted sample constituted pools of several
hundred worms in the specified categories. These were
thawed and homogenized immediately prior to analysis.
Two Queensland State Government laboratories undertook
the majority of biomass analyses. In 2005 and 2006, official
AOAC (2000) methods were used at the Innovative Food
Technologies Laboratory at Hamilton, Brisbane. Proximate
analyses involved moisture, total lipid (including free fatty
acids, triacylglycerols and membrane-bound phospholipids),
fat (hexane-soluble material extracted under reflux), total
nitrogen, total phosphorous, protein (by calculation), ash,
carbohydrate (by difference), cholesterol (after Kovacs et al.
1979) and energy (FSANZ Food Standards Code Vol 2)
assessments. Phospholipid analyses used high-performance
liquid chromatography calibrated using phosphatidylcho-
line, phosphatidylethanolamine, lysophosphatidylethanol-
amine and sphingomyelin. Bromophenols were assessed
using stable isotope dilution analysis in combination with
solid-phase microextraction according to the methods
described by Fuller et al. (2008). Minerals were assessed by
ALS Environmental, Brisbane, Australia, using emission
spectrophotometry (ICP-AES).
From 2007 to 2010, biomass analyses were undertaken
at the Animal Research Institute, Yeerongpilly, Brisbane.
. . . . . . . . . . . . . . . . . . . . . . . . . . . . . . . . . . . . . . . . . . . . . . . . . . . . . . . . . . . . . . . . . . . . . . . . . . . . . . . . . . . . . . . . . . . . . .
ª 2014 The State of Queensland (through the Department of Agriculture, Fisheries and Forestry). Aquaculture Nutrition © 2014 JohnWiley & Sons Ltd
Page 3
Lipids were extracted from the sample with chloroform/
methanol by the method of Folch et al. (1957). Total lipid
was determined gravimetrically on an aliquot of the extract
by drying for 4 h at 80 °C in a preweighed glass vial. A
further aliquot of the extract was taken for fatty acid
analysis. The lipid fatty acids in the extract were derivitized
to their fatty acid methyl esters (FAME) using 14% boron
trifluoride–methanol (Van Wijngaarden 1967). FAME were
analysed on an Agilent Technologies 6890 gas chromato-
graph using split injection with helium carrier gas and a
flame ionization detector. The column used was a DB23
fused-silica capillary column, 30 m 9 0.25 mm, with a
0.25-lm coating (J&W Agilent Technologies, Melbourne,
Vic., Australia). Column oven temperature was held at
140 °C for 5 min and then elevated at 3 °C min�1 to
210 °C where it was held until all FAME of interest had
been eluted. FAME were identified by comparing their
retention times with those of authentic standards (Sigma-
Aldrich Co, Sydney, NSW, Australia) and were quantified
by comparison with the response of an internal standard,
heneicosanoic acid. Unknown fatty acids were tentatively
identified by GC-MS analysis of their 3-pyridylcarbinol
esters (Christie 2003) using an Agilent Technologies 5973
Mass Selective Detector with electron-impact ionization at
70 eV.
An aliquot of the lipid extract was prepared for choles-
terol analysis by removing the lipids by saponification and
extracting the cholesterol into hexane (Okshima 2001).
Cholesterol was then determined by reversed-phase HPLC
using a Shimadzu LC-10 Avp fitted with a Luna 5-lm
C18(2), 250 9 4.6 mm column (Phenomenex, Lane Cove,
NSW, Australia) with methanol at 1 mL min�1 as mobile
phase. A PDA detector at 218 nm was used to quantify
the cholesterol against an external standard (Sigma-
Aldrich Co, Sydney, NSW, Australia). The phospholipid
profile of the lipid extract was determined by normal-
phase HPLC using a Shimadzu LC-10 Avp fitted with
a 4-lm NovaPak silica 150 9 3.9 mm column (Waters,
Rydalmere, NSW, Australia) and an ELSD detector using
the chromatographic conditions described by Avalli &
Contarini (2005). Phospholipids were quantified against a
mixture of authentic standards (Sigma-Aldrich Co, Syd-
ney, NSW, Australia).
Results were analysed with GenStat (2011) using one- or
two-way ANOVA (with the replicate sand beds being the
experimental units and pooled worms within beds taken as
subsamples) and LSD pairwise comparison of means.
To also test PASF-grown P. helleri for endemic marine
shrimp viruses, live worms were submitted for PCR testing
at the Tropical and Aquatic Animal Health Laboratory,
Biosecurity Queensland, Townsville, Australia. Samples sub-
mitted included pools selected at random from (i) PASF
beds (concrete-raceway-based cultures) at the Bribie Island
Research Centre (BIRC) in 2008 and 2010, (ii) several sepa-
rate larger-scale PASF beds at a commercial Penaeus mon-
odon farm in 2009 and (iii) four PASF beds at Farm A and
single PASF beds at Farms B and C. In 2008, the pool of
worms was purged in clean sea water for 4 h and shipped
overnight to the laboratory. From 2009, worms were purged
for >24 h prior to shipping. Upon arrival at the laboratory,
several worms in each pool were diced into 2- to 3-mm-long
pieces, placed in nucleic acid stabilizer and homogenized to
produce a supernatant for total nucleic acid extraction.
These were tested for yellowhead virus (YHV)/gill-associ-
ated virus (GAV) using the IQ2000© nested RT-PCR detec-
tion kit (GeneReach Biotechnology Corp., Taichung,
Taiwan), for infectious haematopoietic and hypodermal
necrosis virus (IHHNV) using the PCR method described by
Tang et al. (2007) and for Mourilyan virus (MoV) using a
RT-nested PCR method described by Cowley et al. (2005).
Worm size and maturity In 2005, P. helleri grown in a
PASF system housed within a 8.6-m2 concrete raceway at
BIRC were randomly sampled on three separate occasions
to provide material for proximate analyses. On each occa-
sion, harvested worms were visually sorted into small
(≤0.6 g) and large (>0.6 g) individuals. This divide was
based on observations that lucrative bait markets in Aus-
tralia accept P. helleri down to a size of 0.6 g. Because rec-
reational fishers prefer to use the larger worms that are
more easily hooked and smaller worms tend to be more
easily spread between broodstock without the need for
chopping (which can also foul the water in broodstock
tanks), producers will likely grade harvested worms into
these two size classes.
On the last sampling occasion in 2005, because the worms
were reaching maturity, they were initially also separated
into non-maturing and maturing groups, with maturing
worms separated into males (red) and females (green), and
non-maturing worms sorted for size as above.
Supplemental feeding with seaweed In 2006, P. helleri
grown in PASF systems housed in experimental plastic tubs
(0.4 m2; 200 L) were studied. For some beds, a layer of the
seaweed (Enteromorpha prolifera) which the worms avidly
consumed was physically maintained over the surface of
. . . . . . . . . . . . . . . . . . . . . . . . . . . . . . . . . . . . . . . . . . . . . . . . . . . . . . . . . . . . . . . . . . . . . . . . . . . . . . . . . . . . . . . . . . . . . .
ª 2014 The State of Queensland (through the Department of Agriculture, Fisheries and Forestry). Aquaculture Nutrition © 2014 JohnWiley & Sons Ltd
Page 4
beds for 1 month prior to harvest. In this case, worms har-
vested from tubs (several hundred worms pooled from
three tubs in each category) were not size sorted, and
because samples were taken before the onset of final matu-
ration, they were also not separated by sex.
Pooled samples of P. helleri taken from the raceway and
tubs in 2005 and 2006 were also assessed for their minerals
and bromophenols contents, and the proximate and miner-
als composition of the seaweed fed to the worms was also
assessed.
Worm size and density Perinereis helleri harvested from
two worm density experiments in 2007 were investigated
for their proximate, fatty acid and amino acid composi-
tions. Three stocking densities (1000, 2000 and 4000 m�2;
n = 2) were used in a tub-based (as described previously)
trial, and two stocking densities (2000 and 6000 m2; n = 3)
were used in a tank-based (1.84 m2; 2000 L) trial. The tub-
based experiment was undertaken at BIRC, and the tank-
based experiment was undertaken at a commercial shrimp
(P. monodon) farm. These experiments were undertaken
simultaneously at the two sites and were again based on
the standardized operations of PASF systems stocked with
1-month-old juveniles. The entire contents of each tub and
tank were harvested after 4-month operation and sorted
into small and large individuals as previous.
Supplemental feeding with fish meal An experiment per-
formed in 2010 with focus on commercial PASF designs
also provided worm biomass from different treatments for
analyses. This trial used polyethylene plastic pond liners to
form larger-scale sand filtration beds (approximately
60 m2) of various designs at two shrimp (P. monodon)
farms (A and B) and one fish (Sillago ciliata) farm (C).
Physical differences between beds at different farms
involved a completely outdoor, low-profile design at Farm
A (four beds studied), a shade-house-covered in-ground
design at Farm B (one bed) and an outdoor concrete-tank-
supported design at Farm C (one bed). All beds were again
stocked with 1-month-old P. helleri juveniles at 2000 m�2
and supplied daily with the farms’ wastewater.
Two of the four beds at Farm A were provided with sup-
plemental feed based on recommendations for marine
worm culture by Poltana et al. (2007). Accordingly, fish
meal was spread evenly over these beds on a daily basis
using the rates described in Fig. 1. Worm biomass was har-
vested from one square metre of each bed after 107, 115
and 125 days at Farms A, B and C, respectively. In each
case, the worms sampled were purged for 24 h in clean sea
water at ambient temperature before freezing samples for
nutritional analyses.
Small P. helleri grown in the concrete raceway in 2005
returned marginally higher (P < 0.05) moisture contents
and lower (P < 0.02) fat and energy levels than large ones
(Table 1). Mature females had comparatively low moisture
levels and returned the highest fat contents for P. helleri
samples analysed in 2005 and 2006. Females, and to a les-
ser extent males, also had relatively high levels of carbohy-
drate compared with small and large P. helleri. The
proximate results for P. helleri grown in tubs without the
seaweed layer did not differ greatly from those which had
been feeding on E. prolifera, except in having somewhat
elevated ash content.
There were few apparent differences between the mineral
contents of P. helleri samples analysed in 2005 (Table 2).
The lack of replication prevented statistical comparisons;
however, the large pool of worms (several hundred) that
constituted each sample meant that the results were robust.
In general, it appeared that small worms had higher levels
of sodium and zinc than large worms, whilst females
returned higher levels of calcium, magnesium, potassium and
sulphur than males and all other worm samples analysed.
The worms were particularly high in sodium, potassium,
sulphur, phosphorus (P), magnesium and calcium and, to a
lesser extent, iron and zinc.
Large P. helleri tended to contain more bromophenols
than small ones and had the highest total levels for the
0
50
100
150
200
250
300
350
400
450
500
0 1 2 3 4 5 6 7 8 9 10 11 12 13 14 15 16 17 18Age (weeks)
Feed
(g)
Nurseryrearing
Bedsstocked
Figure 1 Daily fish meal feeding rates applied to two 60-m2 beds
at Farm A in 2010.
. . . . . . . . . . . . . . . . . . . . . . . . . . . . . . . . . . . . . . . . . . . . . . . . . . . . . . . . . . . . . . . . . . . . . . . . . . . . . . . . . . . . . . . . . . . . . .
ª 2014 The State of Queensland (through the Department of Agriculture, Fisheries and Forestry). Aquaculture Nutrition © 2014 JohnWiley & Sons Ltd
Page 5
pooled samples studied (Table 2); 2,4-dibromophenol was
the dominant form identified in all samples.
The moisture and ash contents of P. helleri biomass pro-
duced in 2007 in tub- and tank-based trials were not
affected (P > 0.05) by density or graded size, with values
similar to those found in 2005 and 2006. Mean dry matter
contents were 203 � 3 g kg�1 for tubs and 182 � 6 g kg�1
for tanks (moisture in samples ranged from 777 to
855 g kg�1). The mean ash contents of harvested worms
(WM) were 47 � 2 g kg�1 for tubs and 36 � 2 g kg�1 for
tanks (samples ranged from 23 to 61 g kg�1).
Size had a pronounced (P < 0.005) effect on total lipid
contents in both trials in 2007, where smaller worms con-
sistently had lower lipid content (Table 3). Density also
had a highly significant (P < 0.001) effect on total lipid
content in the tub-based trial, but not in the tank-based
trial (P > 0.05) (Table 3). This tendency for higher lipid
content at lower densities was likely due to the worms
growing to larger sizes at the lowest density.
Large worms had higher (P < 0.005) levels of energy
than small worms in the tank-based trial, but in the tub-
based trial, the two graded sizes were similar (P > 0.05) for
this component (Table 3). Energy levels were also higher
(P < 0.05) in worms harvested from the lowest stocking
density used in the tub-based trial, and although a trend
for decreasing energy with increasing densities was appar-
ent, differences between the medium and high densities in
both trials were not significant (Table 3).
Neither size nor density affected the levels of cholesterol
(P > 0.05), where wet samples provided overall means
(�SE) of 1.37 � 0.03 g kg�1 in the tub-based trial and
0.95 � 0.02 g kg�1 in the tank-based trial. These values
were somewhat lower than those found for P. helleri in
2005 and 2006. Marginally higher levels of nitrogen (N)
and P were found in small compared with large worms in
both trials, but these differences were only significant in the
tub-based trial. In tubs, small worms (WM) had
21.8 � 0.2 g kg�1 N and 1.6 � 0 g kg�1 P, and large
worms had 20.2 � 0.3 g kg�1 N and 1.5 � 0 g kg�1 P; in
tanks, small worms had 19.5 � 0.8 g kg�1 N and 1.3 � 0.1 g
kg�1 P, and large worms had 17.9 � 0.7 g kg�1 N and
1.2 � 0.1 g kg�1 P.
Neither size nor density affected (P > 0.05) total or spe-
cific phospholipid levels in P. helleri in 2007. Overall mean
(�SE, n = 12) levels (dry matter – DM) of total phospho-
lipids were 19.6 � 1.2 mg g�1 in those from tubs and
13.7 � 2.2 mg g�1 in those from tanks. Mean levels in tubs
and tanks for phosphatidylethanolamine were 8.3 � 0.5 and
6.9 � 1.1 mg g�1, for phosphatidylinositol were 1.4 � 0.1
and 0.9 � 0.3 mg g�1, for phosphatidylcholine were
8.8 � 0.7 and 4 � 1.2 mg g�1 and for lysophosphatidylcho-
line were 1.2 � 0.2 and 1.8 � 0.4 mg g�1, respectively.
Phosphatidylserine and sphingomyelin were not detected in
these analyses.
Palmitic acid (C16:0) was the most heavily represented
fatty acid in P. helleri studies undertaken in 2007. It
occurred at levels more than twice that of the next most
heavily represented saturate, stearic acid (C18:0) (Table 4).
Of those mono- and polyunsaturated fatty acids identified,
5,8,11,14,17-eicosapentaenoic (C20:5 n-3; EPA) was most
heavily represented, followed closely by 7,10,13,16-docosa-
tetraenoic acid (C22:4 n-6), and then cis-vaccenic (C18:1
n-7), arachidonic (C20:4 n-6; ARA), 5-octadecenoic (C18:1
n-13) and 7,10,13,16,19-docosapentaenoic (C22:5 n-3) acids.
Table 1 Proximate composition (g kg�1 wet weight)* of Perinereis helleri grown in polychaete-assisted sand filters in 2005 and 2006
Component Small1 Large1 Male2 Female2 No seaweed3 With seaweed3 Seaweed4
Moisture 804.7 � 1.2a 792 � 2.9b 807 758 790 814 890
Fat5 10.7 � 0.7b 19.3 � 0.3a 12 36 15 17 5
Nitrogen 21.5 � 0.1a 21.3 � 0.3a 21.6 21.1 19.1 18.2 4.1
Protein6 134.7 � 0.9a 133 � 1.7a 135 132 120 114 26
Ash 38.7 � 0.7a 39.3 � 2.7a 23 32 61 37 43
Carbohydrate 11.3 � 0.9a 16 � 1.5a 23 42 14 18 36
Cholesterol 1.85 � 0.22a 2.09 � 0.26a 1.98 2.41 1.30 1.18 <0.01Energy7 2.88 � 0.01b 3.25 � 0.05a – – – – –
* Different superscripts within rows indicate significant (P < 0.05) differences.1 Means (�SE) for non-maturing small (≤0.6 g) and large (>0.6 g) worms grown in raceway in 2005 (n = 3 except for energy n = 2).2 Male and female worms approaching maturity grown in raceway in 2005 (n = 1).3 Randomly selected worms grown in tubs with or without seaweed supplementation in 2006 (n = 1).4 Supplementary feed (Enteromorpha prolifera).5 Includes triglycerides, cholesterol and cholesterol esters.6 Total nitrogen 9 6.25.7 MJ kg�1.
. . . . . . . . . . . . . . . . . . . . . . . . . . . . . . . . . . . . . . . . . . . . . . . . . . . . . . . . . . . . . . . . . . . . . . . . . . . . . . . . . . . . . . . . . . . . . .
ª 2014 The State of Queensland (through the Department of Agriculture, Fisheries and Forestry). Aquaculture Nutrition © 2014 JohnWiley & Sons Ltd
Page 6
Table 3 Mean (�SE) total lipid and energy contents* of Perinereis helleri following size grading or grown at different stocking densities in
polychaete-assisted sand filters in 2007. Data presented on a wet matter basis
Component Culture environment
Graded size1 Stocking density2
Small Large Low Medium High
Total lipid (g kg�1) Tubs 14.1 � 0.8b 16.2 � 1.1a 17.9 � 0.9a 14.4 � 0.7b 13.1 � 0.5c
Tanks 13.5 � 0.5b 18.6 � 1.1a – 16.7 � 1.7a 15.5 � 1.1a
Energy (MJ kg�1) Tubs 3.73 � 0.06a 3.65 � 0.1a 3.9 � 0.06a 3.63 � 0.08b 3.53 � 0.06b
Tanks 1.47 � 0.08b 1.99 � 0.09a – 1.75 � 0.16a 1.72 � 0.12a
* Within graded size or stocking density, different superscripts within rows indicate significant (P < 0.05) differences.1 n = 6 for small (≤0.6 g) or large (>0.6 g) worms.2 n = 4 for tubs at low (1000 m�2), medium (2000 m�2) and high (4000 m�2) densities; n = 6 for tanks at medium (2000 m�2) and high
(6000 m�2) densities.
Table 2 Mineral (mg kg�1) and bromophenol (ng g�1) contents for pooled samples of Perinereis helleri grown in polychaete-assisted sand
filters in 2005 and 2006. Data presented on a wet matter basis
Mineral Small1 Large1 Male2 Female2 Without seaweed3 With seaweed3 Seaweed4
Aluminium <50 <50 <50 <50 <50 <50 160
Antimony <5 <5 <5 <5 <5 <5 <5Arsenic 6 6 5 6 <5 <5 <5Barium <10 <10 <10 <10 <10 <10 <10Beryllium <1 <1 <1 <1 <1 <1 <1Boron <50 <50 <50 <50 <50 <50 <50Cadmium <1 <1 <1 <1 <1 <1 <1Calcium 350 360 390 740 320 300 940
Chromium <2 <2 <2 <2 8 4 <2Cobalt <2 <2 <2 <2 <2 <2 <2Copper <5 <5 5 <5 <5 6 <5Iron 100 90 60 60 200 130 1010
Lead <5 <5 <5 <5 <5 <5 <5Magnesium 1020 950 810 1260 890 1040 2200
Manganese <5 <5 7 7 <5 <5 24
Molybdenum <2 <2 <2 <2 <2 <2 <2Nickel <2 <2 <2 <2 4 <2 <2Phosphorus 1700 1600 2020 1580 1370 1440 530
Potassium 3200 3260 3250 4140 2860 2620 2910
Selenium <5 <5 <5 <5 <5 <5 <5Silver <2 <2 <2 <2 <2 <2 <2Sodium 6190 5350 5130 4600 5210 5610 9780
Strontium 6 5 5 6 5 5 13
Sulphur as S 2690 2700 2510 4660 2150 2530 3360
Tin <5 <5 <5 <5 <5 <5 <5Titanium <10 <10 <10 <10 <10 <10 <10Vanadium <5 <5 <5 <5 <5 <5 <5Zinc 48 29 12 20 29 20 9
Bromophenol
Total 87.4 124.6 – – 65.9 – –
2-bromophenol 2.3 2.7 – – 1.3 – –
4-bromophenol 1 2.1 – – 1.2 – –
2,4-dibromophenol 69.5 96.4 – – 46.3 – –
2,6-dibromophenol 8.2 14.9 – – 3.7 – –
2,4,6-tribromophenol 6.4 8.5 – – 13.4 – –
< reading was below the limit of test as stated.1 Small (≤0.6 g) or large (>0.6 g) worms grown in raceway in 2005.2 Male or female worms approaching maturity grown in raceway in 2005.3 Randomly selected worms grown in tubs without or with seaweed supplementation in 2006.4 Supplementary feed (Enteromorpha prolifera).
. . . . . . . . . . . . . . . . . . . . . . . . . . . . . . . . . . . . . . . . . . . . . . . . . . . . . . . . . . . . . . . . . . . . . . . . . . . . . . . . . . . . . . . . . . . . . .
ª 2014 The State of Queensland (through the Department of Agriculture, Fisheries and Forestry). Aquaculture Nutrition © 2014 JohnWiley & Sons Ltd
Page 7
Table 4 Mean (�SE, n = 6) fatty acid contents* (mg g�1) of small (≤0.6 g) and large (>0.6 g) Perinereis helleri grown in polychaete-assisted
sand filters in 2007. Data presented on a dry matter basis
Fatty acid Culture environment Small Large
Saturates
C14:0 Tubs 0.14 � 0.03b 0.21 � 0.01a
Tanks 0.16 � 0.01b 0.28 � 0.02a
C15:0 Tubs 0.2 � 0.02b 0.29 � 0.01a
Tanks 0.16 � 0.01b 0.25 � 0.02a
C16:0palmitic Tubs 4.01 � 0.64b 7.87 � 0.72a
Tanks 5.36 � 0.38** 12.38 � 0.87**
C17:0 Tubs 0.78 � 0.05a 1.16 � 0.04b
Tanks 0.67 � 0.03b 0.98 � 0.05a
C18:0stearic Tubs 2.27 � 0.17b 2.88 � 0.12a
Tanks 2.45 � 0.12b 3.48 � 0.16a
C20:0 Tubs 0.05 � 0.02** 0.06 � 0**
Tanks 0.07 � 0a 0.08 � 0a
C24:0 Tubs 0.03 � 0.02a 0.03 � 0.02a
Tanks 0.06 � 0.01a 0.07 � 0.01a
Mono- and polyunsaturates
C16:1 n-7 Tubs 0.54 � 0.11b 0.85 � 0.12a
Tanks 0.8 � 0.07b 1.57 � 0.11a
C18:1 n-131 Tubs 0.94 � 0.08b 1.62 � 0.12a
Tanks 1.25 � 0.07** 2.52 � 0.17**
C18:1 n-7cis-vaccenic Tubs 1.34 � 0.16b 2.41 � 0.15a
Tanks 1.91 � 0.14b 3.64 � 0.24a
C18:1 n-9 Tubs 0.47 � 0.08b 0.7 � 0.08a
Tanks 0.61 � 0.05b 1.15 � 0.07a
C18:2 n-6 Tubs 0.5 � 0.05a 0.54 � 0.05a
Tanks 0.61 � 0.03b 0.85 � 0.04a
C18:3 n-3 Tubs 0.19 � 0.05b 0.24 � 0.07a
Tanks 0.46 � 0.06b 0.79 � 0.1a
C20:1 n-7 Tubs 0.09 � 0.02b 0.12 � 0.01a
Tanks 0.14 � 0.01b 0.19 � 0.01a
C20:1 n-9 Tubs 0.36 � 0.09b 0.65 � 0.08a
Tanks 0.48 � 0.04b 0.97 � 0.06a
C20:1 n-11 Tubs 0.5 � 0.04b 0.8 � 0.04a
Tanks 0.67 � 0.04b 1.28 � 0.08a
5,11-C20:22 Tubs 0.19 � 0.05b 0.44 � 0.08a
Tanks 0.36 � 0.04b 0.94 � 0.06a
C20:2 n-6 Tubs 0.32 � 0.06b 0.56 � 0.08a
Tanks 0.45 � 0.03b 0.98 � 0.07a
C20:3 n-3 Tubs 0 � 0** 0.06 � 0.02**
Tanks 0.04 � 0.01b 0.2 � 0.03a
C20:4 n-6ARA Tubs 1.57 � 0.07a 1.55 � 0.06a
Tanks 1.21 � 0.05b 1.63 � 0.07a
C20:5 n-3EPA Tubs 3.08 � 0.13** 3.86 � 0.07**
Tanks 3.81 � 0.17a 4.62 � 0.18a
C22:1 n-9 Tubs 0.02 � 0.01b 0.06 � 0.01a
Tanks 0.01 � 0.01b 0.08 � 0.01a
7,13-C22:23 Tubs 1.52 � 0.06b 2.02 � 0.04a
Tanks 1.93 � 0.06b 2.65 � 0.06a
C22:4 n-67,10,13,16-docosatetraenoic Tubs 3 � 0.05b 3.66 � 0.11a
Tanks 2.4 � 0.11b 3.17 � 0.13a
C22:5 n-37,10,13,16,19-docosapentaenoic Tubs 0.76 � 0.02b 1.14 � 0.05a
Tanks 0.94 � 0.05b 1.17 � 0.05a
C22:5 n-6 Tubs 0.24 � 0.01b 0.31 � 0.01a
Tanks 0.12 � 0.01a 0.15 � 0.01a
C22:6 n-3DHA Tubs 0.23 � 0.01b 0.31 � 0.01a
Tanks 0.4 � 0.02b 0.55 � 0.04a
. . . . . . . . . . . . . . . . . . . . . . . . . . . . . . . . . . . . . . . . . . . . . . . . . . . . . . . . . . . . . . . . . . . . . . . . . . . . . . . . . . . . . . . . . . . . . .
ª 2014 The State of Queensland (through the Department of Agriculture, Fisheries and Forestry). Aquaculture Nutrition © 2014 JohnWiley & Sons Ltd
Page 8
In almost all cases, large worms had higher levels of spe-
cific fatty acids than small worms. Similarly, in most cases,
worms grown at the lowest densities had higher levels of
specific saturated and mono-/polyunsaturated fatty acids
(Table 5). Exceptions were 7,10,13,16-docosatetraenoic,
7,10,13,16,19-docosapentaenoic and 4,7,10,13,16-docosa-
pentaenoic (C22:5 n-6) acids, which were each detected at
similar (P > 0.05) levels in all densities compared in 2007.
There were significant interactions between density and
size for EPA, 11,14,17-eicosatrienoic (C20:3 n-3), nervonic
(C24:1 n-9) and arachidic (C20:0) acids in the tub-based trial
and for 5-octadecenoic and palmitic acids in the tank-based
trial in 2007 (see Table 6). Differences between small and
large worms were generally more pronounced in the higher
densities where greater competition slowed the growth. The
ARA/EPA/DHA ratios showed little change across the 2007
trials (see Tables 4 and 5) due to the similar proportional
effects of factors on each of these fatty acids. However,
compared with those of tubs, tank-based conditions did gen-
erally appear to generate higher EPA levels.
Other fatty acids that were detected at low levels, but
not affected (P > 0.05) by either size or density in tub- and
tank-based experiments in 2007 (not shown in Tables 4–6)
included octadecatetraenoic acid (C18:4 n-3) (0.03 � 0.01
and 0.15 � 0.02 mg g�1) and behenic acid (C22:0)
(0.01 � 0.01 and 0.03 � 0.01 mg g�1) (means � SE for
tubs and tanks provided, respectively).
Supplemental feeding with fish meal had few significant
effects on the proximate composition of P. helleri. It did
not affect (P > 0.05) their levels of moisture or ash at
Farm A (779–792 g kg�1 WM and 105–118 g kg�1 DM,
respectively), which were slightly lower than at the other
farms (Table 7). Differences in energy contents of P. helleri
between fed and unfed beds at Farm A were close to signif-
icant (P = 0.053), with fed beds demonstrating the highest
levels amongst all farms. Fat and total lipid levels at Farm
A (73–87 and 127–130 g kg�1, respectively) were also not
significantly affected by feeding the worms fish meal, but
were somewhat higher than levels returned for worms from
Farms B and C. Similar levels of cholesterol prevailed in
P. helleri across all three farms, although those from unfed
beds at Farm A did have significantly higher levels than
from fed beds. The N and P levels of worms at Farm A
(104 and 7.7–7.8 g kg�1, respectively) were not significantly
affected by this supplemental feeding and were quite simi-
lar to levels detected at Farms B and C (Table 7).
Levels of most saturated fatty acids were similar in fed
and unfed beds. Exceptions included the most prevalent
palmitic acid, which was higher (P < 0.05) in fed beds, and
behenic acid, which was identified at low levels in fed beds,
but was below the detection limits in all unfed beds (includ-
ing beds at Farms B and C – see Table 8). For the 22
mono- and polyunsaturates detected, ten were found at
similar (P > 0.05) levels in fed and unfed beds, and the
remainder were significantly higher in fed beds except for
9-eicosenoic (C20:1 n-11), 7,10,13,16-docosatetraenoic and
7,10,13,16,19-docosapentaenoic acids which were signifi-
cantly higher in unfed beds. Levels of DHA were particu-
larly enhanced by feeding fish meal, where mean levels in
P. helleri from fed beds were more than four times greater
than those from unfed beds. The ARA/EPA/DHA ratios
were similar for P. helleri sampled from Farms B and C,
but for similarly unfed beds at Farm A, the EPA ratio was
comparatively elevated. Levels of most other fatty acids in
P. helleri from unfed beds at Farm A were also well above
those found at the other two (unfed) farms; exceptions
were arachidic, behenic, linoleic (C18-2 n-6), ARA, docos-
adienoic (7,13-22:2), 7,10,13,16-docosatetraenoic and nerv-
onic acids.
Of the 18 amino acids studied in 2010 (Table 9), only four
were significantly affected by supplemental feeding with fish
Table 4 (Continued)
Fatty acid Culture environment Small Large
C24:1 n-9 Tubs 0.02 � 0.01** 0.07 � 0**
Tanks 0.01 � 0.01b 0.05 � 0.01a
ARA : EPA : DHA ratio Tubs 1 : 2: 0.1 1 : 2.5 : 0.2
Tanks 1 : 3.1 : 0.3 1 : 2.8 : 0.3
* Different superscripts within rows indicate significant (P < 0.05) differences.
** Significant (P < 0.05) interaction between density and size; see Table 6.1 Tentatively identified as cis-5-octadecenoic acid.2 Tentatively identified cis-5,cis-11-eicosadienoic acid.3 Tentatively identified as cis-7,cis-13-docosadienoic acid.
. . . . . . . . . . . . . . . . . . . . . . . . . . . . . . . . . . . . . . . . . . . . . . . . . . . . . . . . . . . . . . . . . . . . . . . . . . . . . . . . . . . . . . . . . . . . . .
ª 2014 The State of Queensland (through the Department of Agriculture, Fisheries and Forestry). Aquaculture Nutrition © 2014 JohnWiley & Sons Ltd
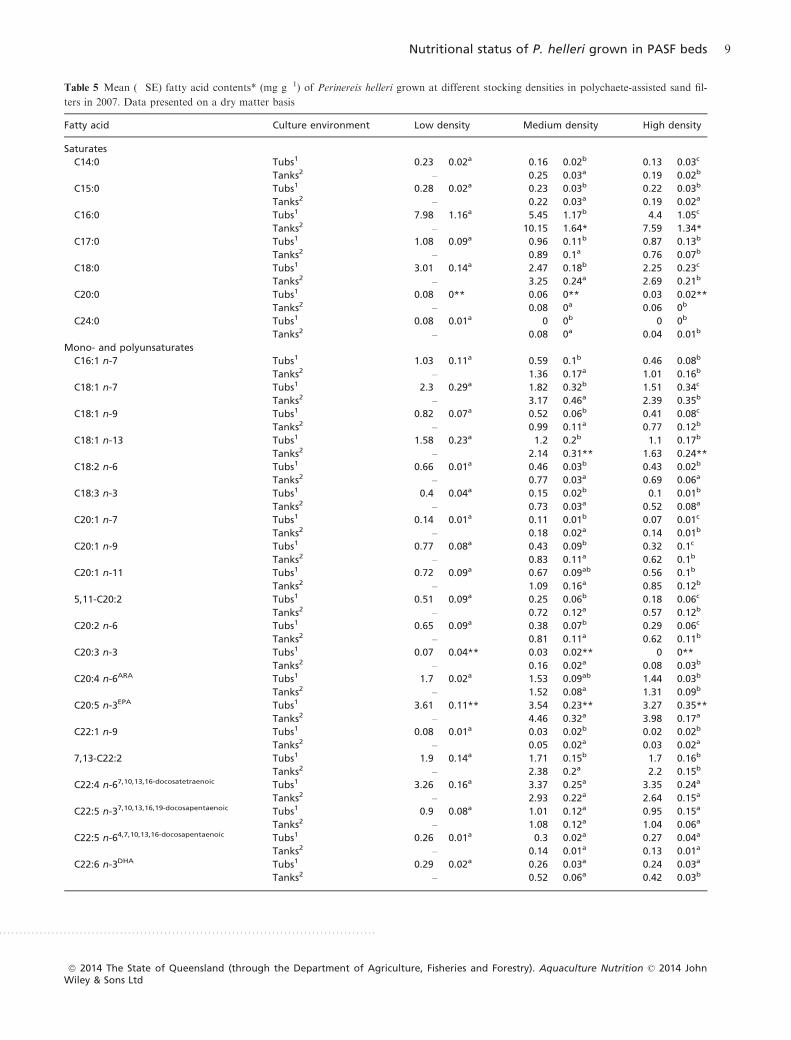
Page 9
Table 5 Mean (�SE) fatty acid contents* (mg g�1) of Perinereis helleri grown at different stocking densities in polychaete-assisted sand fil-
ters in 2007. Data presented on a dry matter basis
Fatty acid Culture environment Low density Medium density High density
Saturates
C14:0 Tubs1 0.23 � 0.02a 0.16 � 0.02b 0.13 � 0.03c
Tanks2 – 0.25 � 0.03a 0.19 � 0.02b
C15:0 Tubs1 0.28 � 0.02a 0.23 � 0.03b 0.22 � 0.03b
Tanks2 – 0.22 � 0.03a 0.19 � 0.02a
C16:0 Tubs1 7.98 � 1.16a 5.45 � 1.17b 4.4 � 1.05c
Tanks2 – 10.15 � 1.64* 7.59 � 1.34*
C17:0 Tubs1 1.08 � 0.09a 0.96 � 0.11b 0.87 � 0.13b
Tanks2 – 0.89 � 0.1a 0.76 � 0.07b
C18:0 Tubs1 3.01 � 0.14a 2.47 � 0.18b 2.25 � 0.23c
Tanks2 – 3.25 � 0.24a 2.69 � 0.21b
C20:0 Tubs1 0.08 � 0** 0.06 � 0** 0.03 � 0.02**
Tanks2 – 0.08 � 0a 0.06 � 0b
C24:0 Tubs1 0.08 � 0.01a 0 � 0b 0 � 0b
Tanks2 – 0.08 � 0a 0.04 � 0.01b
Mono- and polyunsaturates
C16:1 n-7 Tubs1 1.03 � 0.11a 0.59 � 0.1b 0.46 � 0.08b
Tanks2 – 1.36 � 0.17a 1.01 � 0.16b
C18:1 n-7 Tubs1 2.3 � 0.29a 1.82 � 0.32b 1.51 � 0.34c
Tanks2 – 3.17 � 0.46a 2.39 � 0.35b
C18:1 n-9 Tubs1 0.82 � 0.07a 0.52 � 0.06b 0.41 � 0.08c
Tanks2 – 0.99 � 0.11a 0.77 � 0.12b
C18:1 n-13 Tubs1 1.58 � 0.23a 1.2 � 0.2b 1.1 � 0.17b
Tanks2 – 2.14 � 0.31** 1.63 � 0.24**
C18:2 n-6 Tubs1 0.66 � 0.01a 0.46 � 0.03b 0.43 � 0.02b
Tanks2 – 0.77 � 0.03a 0.69 � 0.06a
C18:3 n-3 Tubs1 0.4 � 0.04a 0.15 � 0.02b 0.1 � 0.01b
Tanks2 – 0.73 � 0.03a 0.52 � 0.08a
C20:1 n-7 Tubs1 0.14 � 0.01a 0.11 � 0.01b 0.07 � 0.01c
Tanks2 – 0.18 � 0.02a 0.14 � 0.01b
C20:1 n-9 Tubs1 0.77 � 0.08a 0.43 � 0.09b 0.32 � 0.1c
Tanks2 – 0.83 � 0.11a 0.62 � 0.1b
C20:1 n-11 Tubs1 0.72 � 0.09a 0.67 � 0.09ab 0.56 � 0.1b
Tanks2 – 1.09 � 0.16a 0.85 � 0.12b
5,11-C20:2 Tubs1 0.51 � 0.09a 0.25 � 0.06b 0.18 � 0.06c
Tanks2 – 0.72 � 0.12a 0.57 � 0.12b
C20:2 n-6 Tubs1 0.65 � 0.09a 0.38 � 0.07b 0.29 � 0.06c
Tanks2 – 0.81 � 0.11a 0.62 � 0.11b
C20:3 n-3 Tubs1 0.07 � 0.04** 0.03 � 0.02** 0 � 0**
Tanks2 – 0.16 � 0.02a 0.08 � 0.03b
C20:4 n-6ARA Tubs1 1.7 � 0.02a 1.53 � 0.09ab 1.44 � 0.03b
Tanks2 – 1.52 � 0.08a 1.31 � 0.09b
C20:5 n-3EPA Tubs1 3.61 � 0.11** 3.54 � 0.23** 3.27 � 0.35**
Tanks2 – 4.46 � 0.32a 3.98 � 0.17a
C22:1 n-9 Tubs1 0.08 � 0.01a 0.03 � 0.02b 0.02 � 0.02b
Tanks2 – 0.05 � 0.02a 0.03 � 0.02a
7,13-C22:2 Tubs1 1.9 � 0.14a 1.71 � 0.15b 1.7 � 0.16b
Tanks2 – 2.38 � 0.2a 2.2 � 0.15b
C22:4 n-67,10,13,16-docosatetraenoic Tubs1 3.26 � 0.16a 3.37 � 0.25a 3.35 � 0.24a
Tanks2 – 2.93 � 0.22a 2.64 � 0.15a
C22:5 n-37,10,13,16,19-docosapentaenoic Tubs1 0.9 � 0.08a 1.01 � 0.12a 0.95 � 0.15a
Tanks2 – 1.08 � 0.12a 1.04 � 0.06a
C22:5 n-64,7,10,13,16-docosapentaenoic Tubs1 0.26 � 0.01a 0.3 � 0.02a 0.27 � 0.04a
Tanks2 – 0.14 � 0.01a 0.13 � 0.01a
C22:6 n-3DHA Tubs1 0.29 � 0.02a 0.26 � 0.03a 0.24 � 0.03a
Tanks2 – 0.52 � 0.06a 0.42 � 0.03b
. . . . . . . . . . . . . . . . . . . . . . . . . . . . . . . . . . . . . . . . . . . . . . . . . . . . . . . . . . . . . . . . . . . . . . . . . . . . . . . . . . . . . . . . . . . . . .
ª 2014 The State of Queensland (through the Department of Agriculture, Fisheries and Forestry). Aquaculture Nutrition © 2014 JohnWiley & Sons Ltd
Page 10
meal. Glutamic acid, glycine and serine occurred at higher
(P < 0.05) levels in P. helleri from unfed beds, whilst trypto-
phan occurred at higher (P < 0.05) levels in those from fed
beds. Glutamic acid had the highest representation of all
amino acids across all farms (85 � 2 g kg�1 DM), followed
by aspartic acid (55 � 1 g kg�1), glycine (49 � 5 g kg�1),
arginine (45 � 1 g kg�1) and then alanine (43 � 1 g kg�1).
In most cases, P. helleri from Farm A had lower levels of
specific amino acids than those from Farms B and C.
The pool of P. helleri sampled from the raceway-based
PASF at BIRC in 2008 tested PCR-negative for GAV and
IHHNV, but tested nested PCR-positive for MoV. A
301-nucleotide sequence obtained for the MoV-nested PCR
amplicon possessed 100% identity to the sequence of MoV
found in eastern Australian Penaeus monodon. P. helleri
sampled from a similar raceway culture at BIRC in 2010
tested PCR-negative for all three shrimp viruses.
Table 5 (Continued)
Fatty acid Culture environment Low density Medium density High density
C24:1 n-9 Tubs1 0.07 � 0.0** 0.03 � 0.02** 0.03 � 0.02**
Tanks2 – 0.03 � 0.01a 0.03 � 0.01a
ARA : EPA : DHA ratio Tubs1 1 : 2.1 : 0.2 1 : 2.3 : 0.2 1 : 2.3 : 0.2
Tanks2 – 1 : 2.9 : 0.3 1 : 3 : 0.3
* Different superscripts within rows indicate significant (P < 0.05) differences.
** Significant (P < 0.05) interaction of density and size; see Table 6.1 n = 4 at low (1000 m�2), medium (2000 m�2) and high (4000 m�2) densities.2 n = 6 at medium (2000 m�2) and high (6000 m�2) densities.
Table 6 The interaction between culture density and graded size: mean (�SE) fatty acid contents* (mg g�1) of small (≤0.6 g) and large
(>0.6 g) Perinereis helleri grown in polychaete-assisted sand filters in 2007. Data presented on a dry matter basis
Fatty acid
Culture
environment
Low density Medium density High density
Small Large Small Large Small Large
Saturates
C16:0palmitic Tanks2 – – 6.07 � 0.3c 14.23 � 0.49a 4.64 � 0.36d 10.53 � 0.34b
C20:0arachidic Tubs1 0.08 � 0a 0.07 � 0.01ab 0.06 � 0c 0.06 � 0bc 0 � 0d 0.06 � 0c
Mono- and polyunsaturates
C18:1 n-135-octadecenoic Tanks2 – – 1.4 � 0.07c 2.88 � 0.1a 1.11 � 0.03d 2.15 � 0.05b
C20:3 n-311,14,17-eicosatrienoic Tubs1 0 � 0c 0.13 � 0.01a 0 � 0c 0.06 � 0b 0 � 0c 0 � 0c
C20:5 n-3EPA Tubs1 3.41 � 0.02bc 3.8 � 0.03ab 3.15 � 0.01c 3.92 � 0.13a 2.69 � 0.06d 3.85 � 0.23a
C24:1 n-9nervonic Tubs1 0.06 � 0.01b 0.07 � 0a 0 � 0c 0.06 � 0b 0 � 0c 0.06 � 0b
* Different superscripts within rows indicate significant (P < 0.05) differences.1 n = 2 at low (1000 m�2), medium (2000 m�2) and high (4000 m�2) densities.2 n = 3 at medium (2000 m�2) and high (6000 m�2) densities.
Table 7 Mean (�SE) proximate composition* of Perinereis helleri
grown in polychaete-assisted sand filters in 2010 with (Farm A)
and without (Farms A, B and C) fish meal supplemental feeding.
Data presented as g kg�1 dry matter
Component
Farm A1
Farm B2 Farm C2Fed beds Unfed beds
Moisture3 779 � 2a 791.5 � 7.5a 817 795
Ash 104.5 � 2.5a 118 � 4a 140 123
Energy4 21.39 � 0.06a 20.96 � 0.09a 20.23 20.3
Fat5 73 � 3a 86.5 � 5.5a 61 50
Total lipid6 129.6 � 4a 127.3 � 1.9a 102.2 90.5
Cholesterol 8.69 � 0.11b 9.68 � 0.05a 10.32 8.58
Nitrogen 103.6 � 2.3a 103.6 � 3.8a 111.7 115.5
Phosphorus 7.7 � 0.2a 7.8 � 0.2a 8.2 7.8
* Different superscripts within rows indicate significant (P < 0.05)
differences.1 n = 2.2 n = 1.3 g kg�1 wet matter.4 MJ kg�1.5 Includes triglycerides, cholesterol and cholesterol esters.6 Includes free fatty acids, triacylglycerols and membrane-bound
phospholipids.
. . . . . . . . . . . . . . . . . . . . . . . . . . . . . . . . . . . . . . . . . . . . . . . . . . . . . . . . . . . . . . . . . . . . . . . . . . . . . . . . . . . . . . . . . . . . . .
ª 2014 The State of Queensland (through the Department of Agriculture, Fisheries and Forestry). Aquaculture Nutrition © 2014 JohnWiley & Sons Ltd
Page 11
The pool of worms from several PASF beds at the
P. monodon farm collected in 2009 was PCR-negative for
GAV, IHHNV and MoV, as were worms collected in 2010
from each of three shrimp and fish farms. The positive and
negative controls used in each PCR performed as expected
supporting the validity of the data.
Marine polychaete worms have been used for many years
throughout the world for fishing bait and to condition
shrimp and fish broodstock during maturation and prior to
spawning (Makinouchi & Primavera 1987; Olive 1999;
Hoa et al. 2009; Chung et al. 2011). Wild fisheries have
traditionally serviced these needs, but increasingly, poly-
chaetes are commercially cultured for leisure fishing and
marine hatchery applications (Olive 1999; Poltana et al.
2005; Palmer 2010; Limsuwatthanathamrong et al. 2012).
Polychaete inclusions in shrimp maturation diets tend to
range from 5 to 33% (Meunpol et al. 2005; Coman et al.
2007), where they are preferred offered live, but for conve-
nience are also supplied after thawing or in compounded
forms. Despite their relatively high cost, their demand for
use as bait and their functional advantages and preferences
for use over other broodstock feeds have contributed to
overexploitation, environmental impacts and market under-
supply in several countries (Scaps 2003). Aquaculture offers
an attractive solution to this, particularly as demonstrated
Table 8 Mean (�SE) fatty acid contents* (mg g�1) of Perinereis helleri grown in polychaete-assisted sand filters in 2010 with (Farm A) and
without (Farms A, B and C) fish meal supplemental feeding. Data presented on a dry matter basis
Fatty acid
Farm A1
Farm B2 Farm C2Fed beds Unfed beds
Saturates
C14:0 0.67 � 0.06a 0.8 � 0.01a 0.21 0.13
C15:0 0.56 � 0.02a 0.61 � 0.01a 0.28 0.19
C16:0palmitic 16.94 � 0.3a 12.35 � 0.4b 8.02 5.98
C17:0 1.74 � 0.07a 1.97 � 0.03a 1.17 0.81
C18:0 5.48 � 0.16a 4.63 � 0.04a 3.82 3.27
C19:0 0.2 � 0.01a 0.18 � 0.02a 0 0
C20:0arachidic 0.4 � 0.02a 0.41 � 0.03a 0.43 0.9
C22:0behenic 0.17 � 0.01a 0 � 0b 0 0
Mono- and polyunsaturates
C16:1 n-7 2.76 � 0.19a 2.47 � 0.04a 1.0 0.68
C18:1 n-7 4.10 � 0.15a 5.04 � 0.07a 2.42 2.24
C18:1 n-9 3.19 � 0.14a 1.3 � 0.04b 0.85 0.64
C18:1 n-13 1.98 � 0.03a 1.97 � 0.06a 1.68 1.38
C18:2 n-6linoleic 1.84 � 0.11a 0.92 � 0.02b 1.0 0.78
C18:3 n-3 1.37 � 0.11a 1.39 � 0.21a 0.44 0.78
C18:4 n-3 0.49 � 0.02a 0.17 � 0.01b 0 0
C20:1 n-7 0.16 � 0.01a 0.34 � 0.04a 0 0.1
C20:1 n-9 1.76 � 0.05a 1.16 � 0.04b 0.66 0.63
C20:1 n-119-eicosenoic 0.81 � 0.01b 1.12 � 0.02a 0.94 0.5
5,11-C20:2 1.53 � 0a 0.88 � 0.03b 0.41 0.32
C20:2 n-6 1.48 � 0.06a 1.14 � 0.06a 0.77 0.7
C20:3 n-3 0.14 � 0.01a 0.25 � 0.05a 0 0.1
C20:4 n-6ARA 2.35 � 0.08a 2.05 � 0.03a 2.31 1.97
C20:5 n-3EPA 4.68 � 0.04a 5.61 � 0.16a 4.31 3.81
C22:1 n-9 0.15 � 0a 0.1 � 0b 0 0
7,13-C22:2docosadienoic 2.91 � 0.05a 2.91 � 0.02a 3.01 1.93
C22:4 n-67,10,13,16-docosatetraenoic 2.99 � 0.06b 3.89 � 0.1a 4.11 2.96
C22:5 n-37,10,13,16,19-docosapentaenoic 1.17 � 0.01b 1.46 � 0.03a 1.0 0.89
C22:5 n-6 0.43 � 0a 0.14 � 0b 0 0.11
C22:6 n-3DHA 2.64 � 0.02a 0.62 � 0.06b 0.43 0.52
C24:1 n-9nervonic 0.31 � 0.01a 0 � 0b 0 0
ARA : EPA : DHA ratio 1 : 2 : 1.1 1 : 2.7 : 0.3 1 : 1.9 : 0.2 1 : 1.9 : 0.3
* Different superscripts within rows indicate significant (P < 0.05) differences.1 n = 2.2 n = 1.
. . . . . . . . . . . . . . . . . . . . . . . . . . . . . . . . . . . . . . . . . . . . . . . . . . . . . . . . . . . . . . . . . . . . . . . . . . . . . . . . . . . . . . . . . . . . . .
ª 2014 The State of Queensland (through the Department of Agriculture, Fisheries and Forestry). Aquaculture Nutrition © 2014 JohnWiley & Sons Ltd
Page 12
in this study within an integrated culture system where par-
ticular nutritional and biosecurity needs can be met with
simple adjustments to culture and postharvest management.
Furthermore, this localized conversion of waste nutrients
into valuable and functional products has potential to pro-
vide environmental and economic benefits for farms and,
importantly, the option to increase polychaete inclusions in
maturation diets for higher breeding successes.
Polychaetes are generally reported to contain a healthy
balance of nutrients and several factors that beneficially
affect reproductive performance and larval quality in crus-
taceans. As in other previous studies, the present work
found high concentrations of polyunsaturated fatty acids
(particularly omega 3 and omega 6), which have important
roles in membrane structures and metabolic processes and
are precursors to biosynthetic pathways involved in the in
vivo supply of sex steroids (Croz et al. 1988; Lytle et al.
1990; Izquierdo et al. 2001; Nguyen et al. 2012). For exam-
ple, ARA was found here in P. helleri at relatively high lev-
els. It is involved in the synthesis of prostaglandins which
have a broad set of physiological roles including the regula-
tion of reproduction in crustaceans (Harrison 1990;
Wouters et al. 2001; Meunpol et al. 2010). Several poly-
chaetes including some from this genus (Perinereis) have
been shown to contain these and other hormones that stim-
ulate ovarian development in one of the more difficult pen-
aeid species to breed, P. monodon (e.g. prostaglandin:
Poltana et al. 2005; progesterone, 17a-hydroxyprogester-
one: Meunpol et al. 2007, 2010; methyl farnesoate: Laufer
et al. 1997).
Reasonable proportions of lcPUFA, and particularly
ARA and EPA, are thought critical for crustacean matura-
tion diets (see Glencross 2009). Meunpol et al. (2005) docu-
mented a higher ratio of ARA compared with EPA (and
DHA) in both sand (Perinereis sp.) and mud (Marphysa
sp.) polychaetes that are commonly used for shrimp matu-
ration in Thailand. That work demonstrated improvements
in the condition of pond-reared male P. monodon fed diets
modelled on this balance. Limsuwatthanathamrong et al.
(2012) also recently reported higher proportions of ARA
than that of EPA and DHA in P. nuntia grown on shrimp
feed in Thailand. Other research has shown markedly dif-
ferent ratios within and between species (see summary in
Table 10), yet many of these are reportedly also routinely
used for shrimp broodstock with favourable results. For
example, in the blood (or mud) worm Marphysa sanguinea,
which has been much favoured by penaeid hatcheries in
Queensland over the last 20 years, Marsden et al. (1992)
found that ARA levels were about one-third lower than
those of EPA.
In the present study, feeding P. helleri in PASF beds
with fish meal significantly increased their DHA content.
This offers a convenient means to adjust their nutritional
profile especially because it also increases their biomass
production (DAFF, unpublished data). However, it is yet
to be determined whether this can provide nutritional
advantages over the common practice of cofeeding shrimp
with other fresh/frozen diets such as squid or green mussels
that are naturally high in DHA (Marsden et al. 1992). Par-
ticular polychaete species that are not generally promoted
for feeds in penaeid hatcheries, such as beachworms (Aus-
tralonuphis sp.) and lugworms (Arenicola cristata), are
reported to naturally have higher DHA than EPA (Lytle
et al. 1990; Marsden et al. 1992), whereas polychaetes that
are avidly promoted for this use tend to have much higher
EPA ratios and sometimes to extreme (e.g. Nereis diversi-
color: Bischoff et al. 2009; Glycera dibranchiata and N. viri-
dens: Lytle et al. 1990) (see Table 10). Nereis diversicolor in
particular has been studied in this regard by several
researchers. It appears to have higher ratios of EPA under
natural conditions, but reduced EPA relative to ARA and
DHA when fed fish food or aquaculture sludge (Garcia-
Alonso et al. 2008; Bischoff et al. 2009). In the present
Table 9 Mean (�SE) amino acid contents* (mg g�1) of Perinereis
helleri grown in polychaete-assisted sand filters in 2010 with (Farm
A) and without (Farms A, B and C) fish meal supplemental feed-
ing. Data presented on a dry matter basis
Amino acid
Farm A1
Farm
B2 Farm C2Fed beds Unfed beds
Alanine 42.04 � 0.5a 43.25 � 0.5a 45.89 38.68
Arginine 43.48 � 1.25a 43.85 � 0.47a 49.97 45.36
Aspartic acid 52.76 � 1.14a 54.52 � 0.95a 57.99 59.23
Cysteine 7.75 � 0.1a 7.76 � 0.03a 7.85 8.72
Glutamic acid 79.71 � 1.22b 85.7 � 0.53a 94.32 87.89
Glycine 37.6 � 0.35b 47.21 � 0.11a 55.86 69.14
Histidine 13.74 � 0.13a 13.3 � 0.2a 14.8 14.36
Isoleucine 21.99 � 0.01a 21.81 � 0.2a 25 24.22
Leucine 38.67 � 0.24a 38.34 � 0.43a 44.35 43.57
Lysine 37.02 � 0.0a 36.16 � 1.03a 43.35 40.2
Methionine 12.23 � 0.3a 11.34 � 0.36a 11.8 13.79
Phenylalanine 21.1 � 0.06a 20.69 � 0.29a 23.76 22.97
Proline 25.38 � 0.16a 26.23 � 0.29a 27.92 28.13
Serine 22.67 � 0.12b 24.75 � 0.16a 28.26 25.81
Threonine 25.82 � 0.27a 25.96 � 0.11a 28.04 27.95
Tryptophan 6.95 � 0.1a 6.22 � 0.08b 6.79 6.97
Tyrosine 19.21 � 0.32a 18.54 � 0.49a 21.53 20.37
Valine 24.53 � 0.43a 24.46 � 0.34a 27.59 25.81
* Different superscripts within rows indicate significant (P < 0.05)
differences.1 n = 2.2 n = 1.
. . . . . . . . . . . . . . . . . . . . . . . . . . . . . . . . . . . . . . . . . . . . . . . . . . . . . . . . . . . . . . . . . . . . . . . . . . . . . . . . . . . . . . . . . . . . . .
ª 2014 The State of Queensland (through the Department of Agriculture, Fisheries and Forestry). Aquaculture Nutrition © 2014 JohnWiley & Sons Ltd
Page 13
study, levels of EPA and ARA in fish-meal-fed P. helleri
were not significantly reduced, but their DHA content was
significantly increased. Those remarkably large ratio varia-
tions found in N. diversicolor between seasons and different
environmental conditions suggest that their fatty acid con-
tents may be more plastic and feed dependent than the ne-
reidid species studied herein.
For most fatty acids in this study, general trends in
results for different culture environments (i.e. tanks, tubs
and farms) were similar. In this respect, size (as the result
of physical sorting and mediated by density) had a more
distinct influence on the nutritional contents of P. helleri.
This is a different situation to that reported by Limsuwat-
thanathamrong et al. (2012) for cultured P. nuntia of dif-
ferent ages, because in the present study, different sized
worms were the same age, but had grown at different rates
due to competition and density effects within the same
beds. Large P. helleri (and those grown at lower densities)
tended to have higher fat and energy levels than small
P. helleri (and those grown at higher densities), and this
was reflected in many specific fatty acid results. As with
many other polychaete species, palmitic acid was the most
prevalent saturate, followed by stearic acid. Palmitic acid is
one of the most common fatty acids found in many ani-
mals, and it is the most prevalent fatty acid in the ovaries
and nauplii of several penaeid species (Wouters et al.
2001), so can be considered an important component in a
maturation diet for shrimp. Other than ARA, EPA and
DHA, P. helleri also had reasonably high representations
of many other mono- and polyunsaturated fatty acids with
16- to 24-carbon chain structures. These included some that
are commonly found in other polychaete species (e.g.
C18:1, C22:4, C22:5 classes) and some more specific ones
that are not and are of general interest because they con-
tained unusual configurations [e.g. six carbons between
double bonds instead of the usual three in cis-5,cis-11-ei-
cosadienoic acid (5,11-C20:2) and cis-7,cis-13-docosadienoic
acid (7,13-C22:2)].
Table 10 Ratios of ARA, EPA and DHA reported for various polychaete species under different environmental conditions
Author
Polychaete species common and
scientific names Locality and environmental conditions ARA/EPA/DHA ratio
Farrington et al. (1973) Catworm – Nephtys incisa US, Rhode Island – natural 1 : 19.3 : 11.8
Lytle et al. (1990) Bloodworm – Glycera dibranchiata US, Maine – natural 1 : 17.1 : 3.5
Bloodworm – Americonuphis reesei US, Panama – natural 1 : 3.8 : 2.4
Lugworm – Arenicola cristata US, Florida – natural 1 : 0.2 : 0.3
Sandworm – Nereis viridens US, Maine – natural 1 : 18.8 : 2.1
Marsden et al. (1992) Mudworm – Marphysa sanguinea Queensland – natural* 1 : 1.5 : 0.2
Beachworm – Onuphidae
(Australonuphis sp.)
Queensland – natural* 1 : 2.1 : 2.9
Luis & Passos (1995) Ragworm – Nereis diversicolor Portugal winter (Feb.) – natural 1 : 2.7 : 0.2
Portugal spring (May) – natural 1 : 2.6 : 0.3
Portugal summer (Aug.) – natural 1 : 2.5 : 0.2
Portugal autumn (Nov.) – natural 1 : 1.8 : 0.1
Costa et al. (2000) Ragworm – Nereis diversicolor Cultured – artificial fish feed ? : 7.8 : 4.9
Cultured – soy feed ? : 4.2 : 0.7
Olive et al. (2002) King ragworm – Nereis virens Cultured – terrestrial feed ? : 7.7 : 3.9
Lugworm – Arenicola marina Cultured – terrestrial feed ? : 1.5 : 0.9
Meunpol et al. (2005) Sandworm – Perinereis sp. Thailand – natural 1 : 1 : 0.2
Mudworm – Marphysa sp. Thailand – natural 1 : 0.6 : 0.1
Garcia-Alonso et al. (2008) Ragworm – Nereis diversicolor UK winter – natural 1 : 13.9 : 1
UK spring – natural 1 : 27.1 : 2.7
UK summer – natural 1 : 17.5 : 1.3
UK autumn – natural 1 : 13.3 : 2.1
Cultured – artificial fish feed 1 : 2.8 : 0.8
Cultured – eel sludge feed 1 : 5.2 : 1.3
Bischoff et al. (2009) Ragworm – Nereis diversicolor France – natural* 0 : 39 : 0
Cultured – integrated system* 1 : 4 : 0.8
Brown et al. (2011) King ragworm – Nereis virens Cultured – formulated worm feed* 1 : 6 : 3
Limsuwatthanathamrong
et al. (2012)
Sandworm – Perinereis nuntia Thailand summer – natural 1 : 0.6 : 0
Thailand winter – natural 1 : 1.1 : 0.4
Cultured – shrimp feed 1 : 0.8 : 0.6
Question marks indicate that this data was missing from the cited papers.
* Approximate ratios derived from graphical figures.
. . . . . . . . . . . . . . . . . . . . . . . . . . . . . . . . . . . . . . . . . . . . . . . . . . . . . . . . . . . . . . . . . . . . . . . . . . . . . . . . . . . . . . . . . . . . . .
ª 2014 The State of Queensland (through the Department of Agriculture, Fisheries and Forestry). Aquaculture Nutrition © 2014 JohnWiley & Sons Ltd
Page 14
Regarding other classes of lipids, phospholipids (PLs)
and sterols also have a wide range of important cellular
functions in crustaceans including cytoplasm and mem-
brane constituents and structures (Harrison 1990). Phos-
pholipids and cholesterol have high predominance in
mature shrimp ovaries and are therefore considered essen-
tial in maturation diets (Wouters et al. 2001). Both PLs
that Wouters et al. (2001) identified as being predominant
in shrimp ovaries (phosphatidylcholine and phosphatidyl-
ethanolamine) were well represented in approximately
equal ratios in P. helleri, and the levels of total PLs (1.4–
2% of DM) were in the order of the 2% of dietary intake
recommended for shrimp broodstock by Cahu et al. (1994).
This differed from P. nuntia in Thailand where only phos-
phatidylcholine was the main class identified (Limsuwat-
thanathamrong et al. 2012).
The dietary requirements for cholesterol by shrimp
broodstock are less clear. Because it is a precursor to ste-
roid hormones and comprises a large proportion of the
lipid in crustacean eggs and because they cannot synthesize
it or substantially replace it with other dietary sterols (Har-
rison 1990), it is likely that maturing broodstock would
require greater levels than immature shrimp. Compared
with levels of 0.3–0.4% recommended for diets of non-
maturing shrimp (Akiyama & Dominy 1989) and inclusion
levels ranging from 0.25 to 0.5% in maturation diets for
P. vannamei (Cahu et al. 1994) and P. monodon (Meunpol
et al. 2005) respectively, the levels found in P. helleri in the
present study (5–10 g kg�1 of DM) appear adequate. This
was up to twice the cholesterol levels reported for cultured
P. nuntia in Thailand (3–5 g kg�1 of DM: Limsuwatthana-
thamrong et al. 2012).
When compared with other commercial polychaete spe-
cies, P. helleri from PASF beds in this study had higher
total lipid levels than others studied from Queensland, but
lower levels than several from more temperate regions.
P. helleri grown under commercially relevant conditions at
three different farms returned dry matter fat and total lipid
levels ranging from 50 to 90 g kg�1 and 90 to 130 g kg�1,
respectively. This was similar to the lipid levels reported for
Perinereis sp. by Meunpol et al. (2005) (140 g kg�1 DM),
higher than the lipid levels reported for wild Australonuphis
sp. (30 g kg�1 DM) and M. sanguinea (40 g kg�1 DM) by
Marsden et al. (1992) and for Marphysa sp. by Meunpol
et al. (2005) (50 g kg�1 DM), but lower than the respective
fat and lipid levels reported for N. virens by Brown et al.
(2011) (240 g kg�1 DM) and Olive et al. (2002) (170 g kg�1
DM) and the maximum lipid levels reported for wild and
cultured N. diversicolor by Luis & Passos (1995)
(190 g kg�1 DM), Costa et al. (2000) (200 g kg�1 DM) and
Garcia-Alonso et al. (2008) (320 g kg�1 DM). As with
P. helleri in this study, Pocock et al. (1971) also found that
stage of maturity affected lipid accumulation and composi-
tion in N. virens, where ripening eggs accumulated triglyce-
rides and glycerol ether esters. Levels of fat in maturing
P. helleri females were more than twice that of small imma-
ture worms and three times the levels in maturing males,
mainly due to an accumulation of palmitic and cis-vaccenic
acids.
There is relatively less information for comparisons of
other components. Carbohydrate levels (g kg�1 DM) in
our P. helleri (60–80 g kg�1) were lower than levels found
by Brown et al. (2011) in N. virens (130–170 g kg�1). All
macrominerals identified by Akiyama & Dominy (1989) for
shrimp diets (calcium, phosphorus, potassium, magnesium
sodium, sulphur) except chlorine and some microminerals
(iron and zinc) were found at appreciable levels in P. hel-
leri. Compared with P. helleri, levels they recommended for
commercial shrimp feed were similar for zinc; higher for
calcium and phosphorus; and lower for potassium, magne-
sium, sodium and iron.
For protein, P. helleri showed a tendency for higher
protein levels in small compared with large worms (most
noticeable in the 2007 data). On a dry matter basis, our
small P. helleri had 670–690 g kg�1 protein (calculated
from nitrogen contents), whilst large ones had 620–
6460 g kg�1 protein. In comparison, Perinereis sp. in
Thailand were reported by Meunpol et al. (2005) to have
higher protein levels (64% DM) than Marphysa sp.
(510 g kg�1 DM), whilst Marsden et al. (1992) reported
750 g kg�1 and 690 g kg�1 in Australonuphis sp. and
M. sanguinea, respectively, and Brown et al. (2011)
reported 570–620 g kg�1 in cultured N. virens. The pro-
tein/lipid ratio for our farm-raised P. helleri in 2010
(6 : 1) aligned well with that recommended for shrimp
feed by Akiyama & Dominy (1989), and the higher
protein ratios from our earlier work in 2007 (up to 9 : 1
in small worms) suggest that P. helleri alone can pro-
vide adequate energy levels for shrimp. The amino acid
contents of P. helleri in 2010 were similar to those
reported by Marsden et al. (1992) for Australonuphis sp.
and M. sanguinea, except that four of those five most
heavily represented in P. helleri, namely glutamic acid,
aspartic acid, glycine and alanine, were not recorded in
that study. Arginine (45 g kg�1 DM) was the fourth most
prevalent amino acid in our P. helleri and the most preva-
lent amino acid found by Marsden et al. (1992) for both
of those other species (59–60 g kg�1 DM).
. . . . . . . . . . . . . . . . . . . . . . . . . . . . . . . . . . . . . . . . . . . . . . . . . . . . . . . . . . . . . . . . . . . . . . . . . . . . . . . . . . . . . . . . . . . . . .
ª 2014 The State of Queensland (through the Department of Agriculture, Fisheries and Forestry). Aquaculture Nutrition © 2014 JohnWiley & Sons Ltd
Page 15
Brominated phenols are other functional compounds
that have been found in many polychaete species (Whitfield
et al. 1999). They are thought to be used by lower marine
organisms for deterrence and chemical defence and have
also been found to have a range of other biological activi-
ties including antioxidant and antibacterial effects (Liu
et al. 2011). For humans, low levels in food (1–10 ng g�1)
are considered desirable, but excessive levels are unpalat-
able, and their use in aquaculture feeds to enhance product
flavour is a recent development (Fuller et al. 2008). Levels
found in P. helleri in the present study were on the lower
end of the very broad range of values found for many
other species in eastern Australia (see Whitfield et al.
1999).
Because the endemic shrimp viruses GAV, MoV and
IHHNV were not generally detected by PCR among
batches of P. helleri collected from PASF beds at four dif-
ferent mariculture sites in Queensland, there appear good
prospects for using worms reared in such systems as a die-
tary supplement for shrimp broodstock without them pos-
ing a virus transmission risk. Mourilyan virus, which is
unlisted, but remains under review by the World Organisa-
tion for Animal Health (OIE Aquatic Animal Health Code,
October 2011), was detected at low levels in P. helleri col-
lected from BIRC in 2008. It can occur at high prevalence
in P. monodon and P. japonicus in eastern Australia and is
considered to be endemic throughout South-East Asia and
the South Pacific (Cowley et al. 2005; Sellars et al. 2005).
Although this is the first report of MoV occurring in a
polychaete, interpretation of its significance requires cau-
tion as it was detected in only one sample of worms that
had not been purged for long (4 h) and at low levels pro-
viding no confidence of infection. The surface-feeding nat-
ure of this worm species coupled with the surface
concentration of pond detritus on PASF beds could be
expected to present excellent opportunity for infection
through ingestion of contaminants. Without productive
viral infections establishing in the worms, purging them of
their gut contents would be expected to remove such con-
taminants, and the long shelf-life of live P. helleri after har-
vest (several weeks) enhances this option. Extended purging
durations (>24 h) thus appear a logical solution for reduc-
ing risks of viruses remaining in the guts of worms reared
in PASF beds at shrimp farms where viral infections are
commonplace. However, this detection of MoV in P. helleri
suggests a need for future investigations into what purge
durations may be useful for viral clearance and to confirm
that they cannot support infections by problematic shrimp
viruses.
This research documents the main nutritional contents of
one intertidal polychaete species that can be successfully
grown in PASF beds. Because P. helleri has performed bet-
ter than P. nuntia in these developments in Queensland
(Palmer 2010), it has been the focus of most research to
date, but many other intertidal polychaete species may also
be suitable for this application. In particular, P. helleri
appears to have a well-balanced nutritional profile for
shrimp and fish broodstock when grown in this way and
offers a useful means to recover waste nutrients from land-
based mariculture farms in the Indo-Pacific region. This
work demonstrates new scope for the widespread produc-
tion of polychaetes with specific nutritional contents and
for various uses. It also demonstrates how PASF can pro-
vide controlled and sustainable supplies of this industrially
important commodity and a viable alternative to diminish-
ing wild polychaete resources.
This research was jointly supported by the Queensland
Government’s Department of Agriculture, Fisheries and
Forestry through their Aquaculture Research Programme
and by the Australian Government’s Department of Agri-
culture, Fisheries Forestry through their National Landcare
(Project No. 60945) and Caring for Our Country (Project
No. SEQC1418) Programs. The authors wish to thank
Richard Thaggard, Trevor Borchert, Catriona Morrison,
Daniel Willett, Mick Markey, Kelli Anderson and Mahdi
Green for technical support at BIRC and in the field. Also
thanks to Michael Gravel, Adam Pytko, Peter Martin,
Sharon Pun, Caterina Torrisi and Sue Poole for biomass
analyses; David Mayer for biometry assistance; Ian Ander-
son for disease screening; and Jeff Cowley and Peter Lee
for useful comments on the manuscript. We also gratefully
acknowledge the on-farm support provided by the Bullock
Creek Prawn Farm, Sunrise Seafoods and Creel Seafoods.
Akiyama, D.M. & Dominy, W.G. (1989) Penaeid shrimp nutrition
for the commercial feed industry. Texas Shrimp Farming Man-
ual, Volume 1: Grow-out Technology, Technical Report of
Texas Agricultural Extension Service and Texas A & M Univer-
sity Sea Grant College Program. pp. 50.
AOAC (2000) Official Methods of Analysis of AOAC Interna-
tional, 17th edn. Association of Analytical Communities, Gai-
thersburg, MD, USA.
Avalli, A. & Contarini, G. (2005) Determination of phospholipids
in dairy products by SPE/HPLC/ELSD. J. Chromatogr. A, 1071,
185–190.
. . . . . . . . . . . . . . . . . . . . . . . . . . . . . . . . . . . . . . . . . . . . . . . . . . . . . . . . . . . . . . . . . . . . . . . . . . . . . . . . . . . . . . . . . . . . . .
ª 2014 The State of Queensland (through the Department of Agriculture, Fisheries and Forestry). Aquaculture Nutrition © 2014 JohnWiley & Sons Ltd
Page 16
Bischoff, A.A., Fink, P. & Waller, U. (2009) The fatty acid compo-
sition of Nereis diversicolor cultured in an integrated recirculated
system: possible implications for aquaculture. Aquaculture, 296,
271–276.Brown, N., Eddy, S. & Plaud, S. (2011) Utilization of waste from a
marine recirculating fish culture system as a feed source for the
polychaete worm, Nereis virens. Aquaculture, 322–323, 177–183.Cahu, C., Guillaume, J.C., Stephan, G. & Chim, L. (1994) Influ-
ence of phospholipid and highly unsaturated fatty acids on
spawning rate and egg and tissue composition in Penaeus vanna-
mei fed semi-purified diets. Aquaculture, 126, 159–170.Christie, W.W. (2003) Lipid Analysis. Isolation, Separation, Identi-
fication and Structural Analysis of Lipids, 3rd edn. The Oily
Press, Bridgwater.
Chung, M.-Y., Liu, C.-H., Chen, Y.-N. & Cheng, W. (2011)
Enhancing the reproductive performance of tiger shrimp, Pena-
eus monodon, by incorporating sodium alginate in the brood-
stock and larval diets. Aquaculture, 312, 180–184.Coman, G.J., Arnold, S.J., Callaghan, T.R. & Preston, N.P. (2007)
Effect of two maturation diet combinations on reproductive per-
formance of domesticated Penaeus monodon. Aquaculture, 263,
75–83.Costa, P.F.E., Narciso, L. & da Fonseca, L.C. (2000) Growth, sur-
vival and fatty acid profile of Nereis diversicolor (O.F. Muller,
1776) fed on six different diets. Bull. Mar. Sci., 67, 337–343.Cowley, J.A., McCulloch, R.J., Rajendran, K.V., Cadogan, L.C.,
Spann, K.M. & Walker, P.J. (2005) RT-nested PCR detection of
Mourilyan virus in Australian Penaeus monodon and its tissue
distribution in healthy and moribund prawns. Dis. Aquat. Org.,
66, 91–104.Croz, L., Wong, L., Justine, G. & Gupta, M. (1988) Prostaglandins
and related compounds from the polychaete worm Americonuphis
reesei Fauchald (Onuphidae) as possible inducers of gonad matu-
ration in Penaeid shrimps. Rev. Biol. Trop., 36, 33l–332.Farrington, J.W., Quinn, J.G. & Davis, W.R. (1973) Fatty acid
composition of Nephtys incisa and Yoldia limatula. J. Fish. Res.
Board Canada, 30, 181–185.Folch, J., Lees, M. & Sloane Stanley, G.H. (1957) A simple
method for the isolation and purification of total lipides from
animal tissues. J. Biol. Chem., 226, 497–509.Fuller, S.C., Frank, D.C., Fitzhenry, M.J., Smyth, H.E. & Poole,
S.E. (2008) Improved approach for analyzing bromophenols in
seafood using stable isotope dilution analysis in combination
with SPME. J. Agric. Food Chem., 56, 8248–8254.Garcia-Alonso, J., M€uller, C.T. & Hardege, J.D. (2008) Influence
of food regimes and seasonality on fatty acid composition in the
ragworm. Aqua. Biol., 4, 7–13.GenStat. (2011) GenStat for Windows, Release 14.1. VSN Interna-
tional Ltd., Oxford.
Glencross, B.D. (2009) Exploring the nutritional demand for essen-
tial fatty acids by aquaculture species. Rev. Aquacul., 1, 71–124.Harrison, K.E. (1990) The role of nutrition in maturation, repro-
duction and embryonic development of decapod crustaceans: a
review. J. Shellfish Res., 9, 1–28.Hoa, N.D., Wouters, R., Wille, M., Thanh, V., Dong, T.K., Van
Hao, N. & Sorgeloos, P. (2009) A fresh-food maturation diet
with an adequate HUFA composition for broodstock nutrition
studies in black tiger shrimp Penaeus monodon (Fabricius, 1798).
Aquaculture, 297, 116–121.Izquierdo, M.S., Fernandez-Palacios, H. & Tacon, A.G.J. (2001)
Effect of broodstock nutrition on reproductive performance of
fish. Aquaculture, 197, 25–42.
Kawahigashi, D.K. (1998) Overview of commercial maturation
technology in the Western hemisphere. World Aquaculture Soci-
ety Conference Proceedings, Brazil, 98, 381–392.Kovacs, M.I.P., Anderson, W.E. & Ackman, R.G. (1979) A simple
method for the determination of cholesterol and some plant ster-
ols in fishery-based food products. J. Food Sci., 44, 1299–1301,1305.
Laufer, H., Paddon, J. & Paddon, M. (1997)A hormone enhancing
larva production in the pacific white shrimp, Penaeus vannamei.
World Aquaculture Society Forth Symposium on Aquaculture
in Central America: Focusing on Shrimp and Tilapia, Tegu-
cigalpa, Honduras. pp. 161–162.Limsuwatthanathamrong, M., Sooksai, S., Chunhabundit, S., Noi-
tung, S., Ngamrojanavanich, N. & Petsom, A. (2012) Fatty acid
profile and lipid composition of farm-raised and wild-caught
sandworms, Perinereis nuntia, the diet for marine shrimp brood-
stock. Asian J. Anim. Sci., 6, 65–75.Liu, M., Hansen, P.E. & Lin, X. (2011) Bromophenols in marine
algae and their bioactivities. Mar. Drugs, 9, 1273–1292.Luis, O.J. & Passos, A.M. (1995) Seasonal changes in lipid content
and composition of the polychaete Nereis (Hediste) diversicolor.
Comp. Biochem. Physiol., 111B, 579–586.Lytle, J.S., Lytle, T.F. & Ogle, J.T. (1990) Polyunsaturated fatty
acid profiles as a comparative tool in assessing maturation diets
of Penaeus vannamei. Aquaculture, 89, 287–299.Makinouchi, S. & Primavera, J.H. (1987) Maturation and spawn-
ing of Penaeus indicus using different ablation methods. Aquacul-
ture, 62, 73–81.Marsden, G., McGuren, J.M., Sarac, H.Z., Neill, A.R., Brock, I.J.
& Palmer, C.L. (1992) Nutritional composition of some natural
marine feeds used in prawn maturation. In: Proceedings of
Aquaculture Nutrition Workshop, Salamander Bay, 15–17 April
1991 (Allan, G.L & Dall, W. eds), pp. 82–86. NSW Fisheries,
Brackish Water Fish Culture Research Station, Salamander Bay,
Australia.
Marsden, G.E., McGuren, J.J., Hansford, S.W. & Burke, M.J.
(1997) A moist artificial diet for prawn broodstock: its effect on
the variable reproductive performance of wild caught Penaeus
monodon. Aquaculture, 149, 145–156.Meunpol, O., Meejing, P. & Piyatiratitivorakul, S. (2005) Matura-
tion diet based on fatty acid content for male Penaeus monodon
(Fabricius) broodstock. Aquacult. Res., 36, 1216–1225.Meunpol, O., Iam-Pai, S., Suthikrai, W. & Piyatiratitivorakul, S.
(2007) Identification of progesterone and 17a-hydroxyprogester-one in polychaetes (Perinereis sp.) and the effects of hormone
extracts on penaeid oocyte development in vitro. Aquaculture,
270, 485–492.Meunpol, O., Duangjai, E., Yoonpun, R. & Piyatiratitivorakul, S.
(2010) Detection of prostaglandin E2 in polychaete Perinereis sp.
and its effect on Penaeus monodon oocyte development in vitro.
Fish. Sci., 76, 281–286.Middleditch, B.S., Missler, S.R., Hines, H.B., McVey, J.B., Brown,
A., Ward, D.G. & Lawrence, A.L. (1980) Metabolic profiles of
penaeid shrimp: dietary lipids and ovarian maturation. J. Chro-
matogr., 195, 359–368.Nguyen, B.T., Koshio, S., Sakiyama, K., Ishikawa, M., Yokoy-
ama, S. & Kader, M.A. (2012) Effects of polychaete extracts on
reproductive performance of kuruma shrimp, Marsupenaeus
japonicus Bate. – Part II. Ovarian maturation and tissue lipid
compositions. Aquaculture, 334–337, 65–72.Okshima, T. (2001) Cholesterol. Current Protocols in Food Ana-
lytical Chemistry. John Wiley and Sons Inc., New York.
. . . . . . . . . . . . . . . . . . . . . . . . . . . . . . . . . . . . . . . . . . . . . . . . . . . . . . . . . . . . . . . . . . . . . . . . . . . . . . . . . . . . . . . . . . . . . .
ª 2014 The State of Queensland (through the Department of Agriculture, Fisheries and Forestry). Aquaculture Nutrition © 2014 JohnWiley & Sons Ltd
Page 17
Olive, P.J.W. (1999) Polychaete aquaculture and polychaete sci-
ence: a mutual synergism. Hydrobiologia, 402, 175–183.Olive, P.J.W., Craig, S., Cowin, P.B.D., Islam, M.D. & Ruther-
ford, G. (2002) The culture of Polychaeta as a contribution to
sustainable production of aquafeeds. Aquaculture Europe 2001.
Book of Abstracts European Aquaculture Society Special Publica-
tion, 32, 392–393.Palmer, P.J. (2010) Polychaete-assisted sand filters. Aquaculture,
306, 369–377.Palmer, P.J. & Slattery, S.L. (2009) Using wheat flour in the pro-
duction of organic banana prawns. In: Fisheries: Management,
Economics and Perspectives (McManus, N.F. & Bellinghouse,
D.S. eds), pp. 313–334. Nova Science Publications, New York,
USA.
Pocock, D.M.-E., Marsden, J.R. & Hamilton, J.G. (1971) Lipids
in an intertidal polychaete and their relation to maturation of
the worm. Comp. Biochem. Physiol., 39A, 683–697.Poltana, P., Lerkitkul, T., Anantasomboon, G., Wannapapho, W.,
Wongprasert, K., Olive, P.J.W. & Withyachumnarnkul, B. (2005)
Prostaglandins in the polychaete Perinereis nuntia and their recep-
tors in the ovary of the black tiger shrimp Penaeus monodon.
World Aquaculture Society Conference Proceedings, Bali.
Poltana, P., Lerkitkul, T., Pongtippatee-Taweepreda, P., Asuva-
pongpattana, S., Wongprasert, K., Sriurairatana, S., Chavadej,
J., Sobhon, P., Olive, P.J.W. & Withyachumnarnkul, B. (2007)
Culture and development of the polychaete Perinereis cf. nuntia.
Invertebr. Reprod. Dev., 50, 13–20.
Scaps, P. (2003) The exploitation and aquaculture of marine poly-
chaetes. B Soc Zool Fr, 128, 21–33.Sellars, M.J., Keys, S.J., Cowley, J.A., McCulloch, R.J. & Preston,
N.P. (2005) Association of Mourilyan virus with mortalities in
farm-reared Penaeus (Marsupenaeus) japonicus transferred to
maturation tank systems. Aquaculture, 252, 242–247.Tang, K.F.J., Navarro, S.A. & Lightner, D.V. (2007) PCR assay
for discriminating between infectious hypodermal and hemato-
poietic necrosis virus (IHHNV) and virus-related sequences in
the genome of Penaeus monodon. Dis. Aquat. Org., 74, 165–170.Turchini, G.M., Torstensen, B.E. & Ng, W.-K. (2009) Fish oil
replacement in finfish nutrition. Rev. Aquacul., 1, 10–57.Van Wijngaarden, D. (1967) Modified rapid preparation of fatty
acid esters from lipids for gas chromatographic analysis. Anal.
Chem., 39, 848–849.Vijayan, K.K., Raj, V.S., Balasubramanian, C., Alavandi, S.V., Se-
khar, V.T. & Santiago, T.C. (2005) Polychaete worms – a vector
for white spot syndrome virus (WSSV). Dis. Aquat. Org., 63,
107–111.Whitfield, F.B., Drew, M., Helidoniotis, F. & Svoronos, D. (1999)
Distribution of bromophenols in species of marine polychaetes
and bryozoans from eastern Australia and the role of such ani-
mals in the flavour of edible ocean fish and prawns (shrimp). J.
Agric. Food Chem., 47, 4756–4762.Wouters, R., Lavens, P., Nieto, J. & Sorgeloos, P. (2001) Penaeid
shrimp broodstock nutrition: an updated review on research and
development. Aquaculture, 202, 1–21.
. . . . . . . . . . . . . . . . . . . . . . . . . . . . . . . . . . . . . . . . . . . . . . . . . . . . . . . . . . . . . . . . . . . . . . . . . . . . . . . . . . . . . . . . . . . . . .
ª 2014 The State of Queensland (through the Department of Agriculture, Fisheries and Forestry). Aquaculture Nutrition © 2014 JohnWiley & Sons Ltd