Technical Report No. 07-03 Aquatic Biomonitoring at Red Dog Mine, 2006 National Pollution Discharge Elimination System Permit No. AK-003865-2 by Alvin G. Ott and William A. Morris Slimy Sculpin, Buddy Creek Photograph by Al Ott 2005 June 2007 Alaska Department of Natural Resources Office of Habitat Management and Permitting
Transcript
Technical Report No. 07-03
Aquatic Biomonitoring at Red Dog Mine, 2006 National Pollution Discharge Elimination System Permit No. AK-003865-2 by Alvin G. Ott and William A. Morris
Slimy Sculpin, Buddy Creek Photograph by Al Ott 2005
June 2007 Alaska Department of Natural Resources Office of Habitat Management and Permitting
The Alaska Department of Natural Resources administers all programs and activities free from discrimination based on race, color, national origin, age, sex, religion, marital status, pregnancy, parenthood, or disability. The department administers all programs and activities in compliance with Title VI of the Civil Rights Act of 1964, Section 504 of the Rehabilitation Act of 1973, Title II of the Americans with Disabilities Act of 1990, the Age Discrimination Act of 1975, and Title IX of the Education Amendments of 1972.
If you believe you have been discriminated against in any program, activity, or facility, or if you desire further information please write to DNR, 1300 College Road, Fairbanks, Alaska 99701; U.S. Fish and Wildlife Service, 4040 N. Fairfax Drive, Suite 300 Webb, Arlington, VA 22203; or O.E.O., U.S. Department of the Interior, Washington DC 20240.
For information on alternative formats for this and other department publications, please contact the department ADA Coordinator at (voice) 907-269-8549 or (TDD) 907-269-8411.
Aquatic Biomonitoring at Red Dog Mine, 2006 National Pollution Discharge Elimination System
Permit No. AK-003865-2
Technical Report No. 07-03
By
Alvin G. Ott and William A. Morris
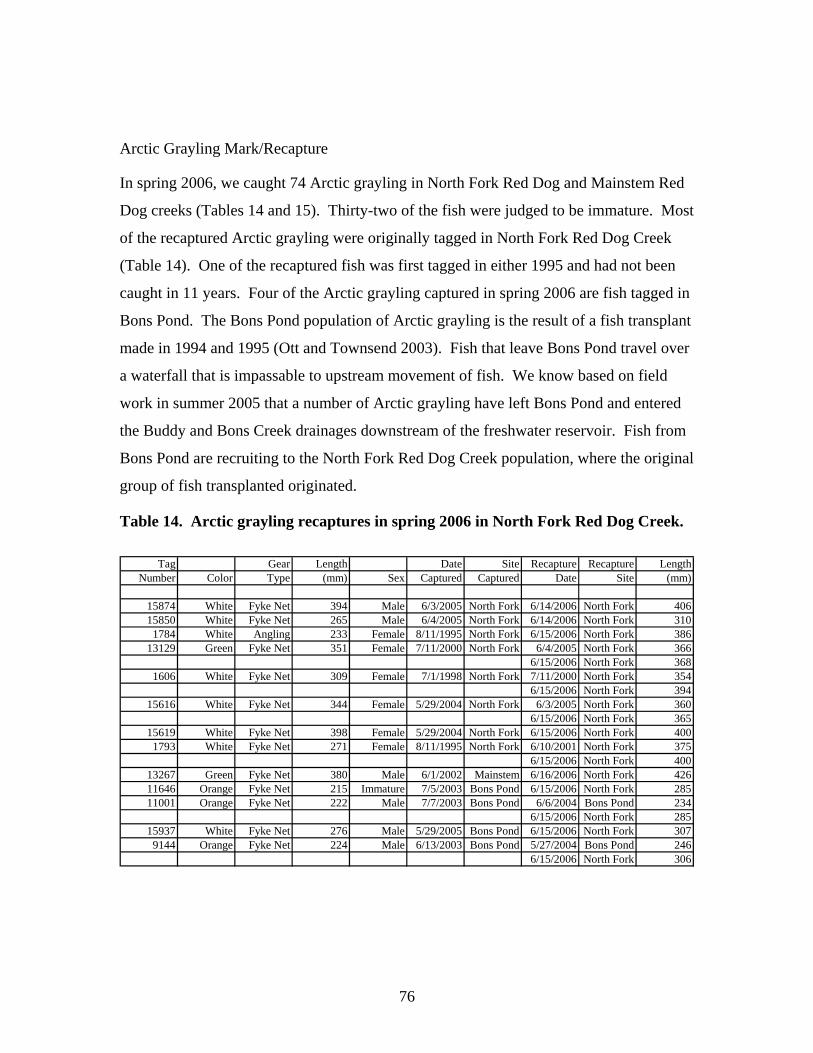
Kerry M. Howard Executive Director
Office of Habitat Management and Permitting Alaska Department of Natural Resources
Table of Contents
Table of Contents................................................................................................................. i List of Tables ..................................................................................................................... iii List of Figures .................................................................................................................... iv Acknowledgements........................................................................................................... vii Executive Summary ......................................................................................................... viii Introduction......................................................................................................................... 1 Structure of Report.............................................................................................................. 3 Location of Sample Sites .................................................................................................... 3 Description of Streams........................................................................................................ 5 Methods Used for NPDES Biomonitoring ......................................................................... 7 Results and Discussion ....................................................................................................... 8
Ikalukrok Creek, Station 7 .............................................................................................. 8 Site Description........................................................................................................... 8 Water Quality.............................................................................................................. 9 Invertebrate Community (Abundance, Density, Taxa richness, and Structure) ....... 12 Periphyton Standing Crop ........................................................................................ 14 Biomonitoring Summary, Ikalukrok Creek Station 7 ................................................ 14
Ikalukrok Creek, Upstream of Dudd Creek .................................................................. 15 Site Description......................................................................................................... 15 Water Quality............................................................................................................ 15 Invertebrate Community (Abundance, Density, Taxa Richness, and Structure) ...... 19 Periphyton Standing Crop ........................................................................................ 21 Biomonitoring Summary, Ikalukrok Creek Upstream of Dudd Creek ...................... 21
Ikalukrok Creek, Station 8 ............................................................................................ 22 Site Description......................................................................................................... 22 Invertebrate Community (Abundance, Density, Taxa Richness, and Structure) ...... 23 Periphyton Standing Crop ........................................................................................ 25 Biomonitoring Summary, Station 8........................................................................... 25
Ikalukrok Creek, Station 9 ............................................................................................ 26 Site Description......................................................................................................... 26 Water Quality............................................................................................................ 26 Invertebrate Community (Abundance, Density, Taxa Richness, and Structure) ...... 31 Periphyton Standing Crop ........................................................................................ 32 Biomonitoring Summary, Ikalukrok Creek Station 9 ................................................ 33
Table of Contents (concluded) Mainstem Red Dog Creek, Station 10 .......................................................................... 34
Site Description......................................................................................................... 34 Water Quality............................................................................................................ 34 Invertebrate Community (Abundance, Density, Taxa Richness, and Structure) ...... 39 Periphyton Standing Crop ........................................................................................ 40 Biomonitoring Summary, Mainstem Red Dog Creek Station 10 .............................. 41
North Fork Red Dog Creek, Station 12 ........................................................................ 42 Site Description......................................................................................................... 42 Water Quality............................................................................................................ 42 Invertebrate Community (Abundance, Density, Taxa Richness, and Structure) ...... 46 Periphyton Standing Crop ........................................................................................ 47 Biomonitoring Summary, North Fork Red Dog Creek Station 12 ............................ 48
Middle Fork Red Dog Creek ........................................................................................ 49 Site Description......................................................................................................... 49 Water Quality............................................................................................................ 50 Invertebrate Community (Abundance, Density, Taxa Richness, and Structure) ...... 53 Periphton Standing Crop .......................................................................................... 55 Biomonitoring Summary, Middle Fork Red Dog Creek Station 20 .......................... 56
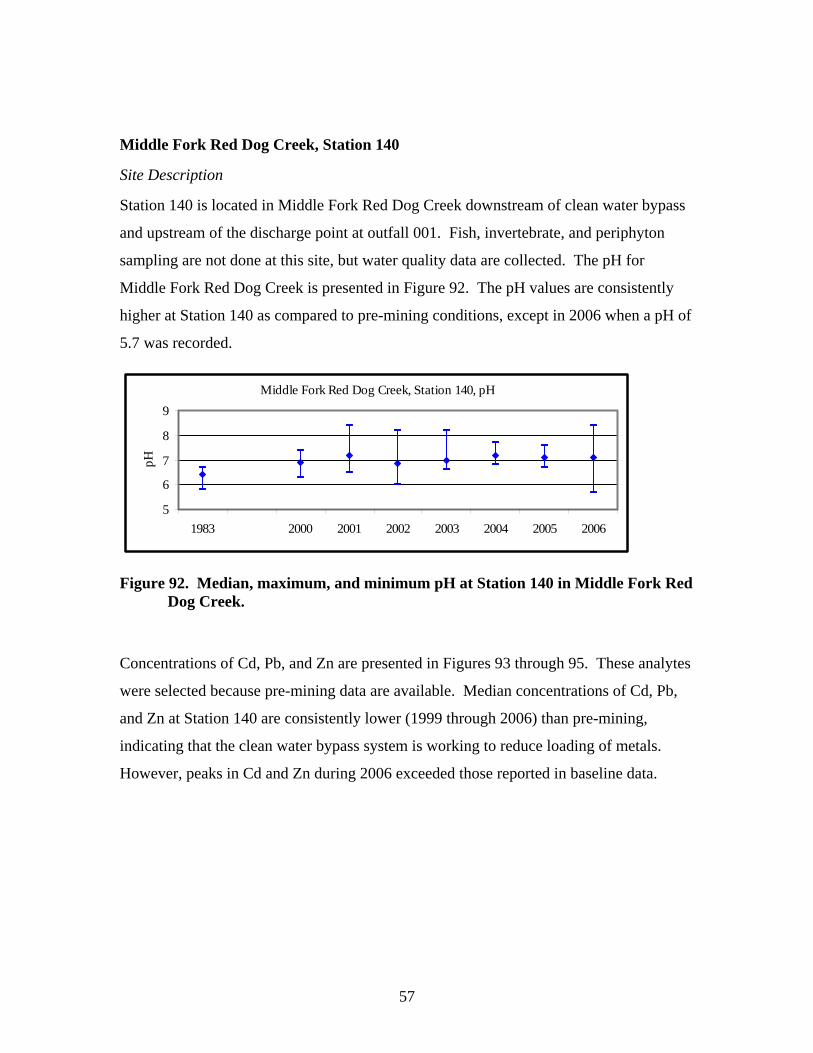
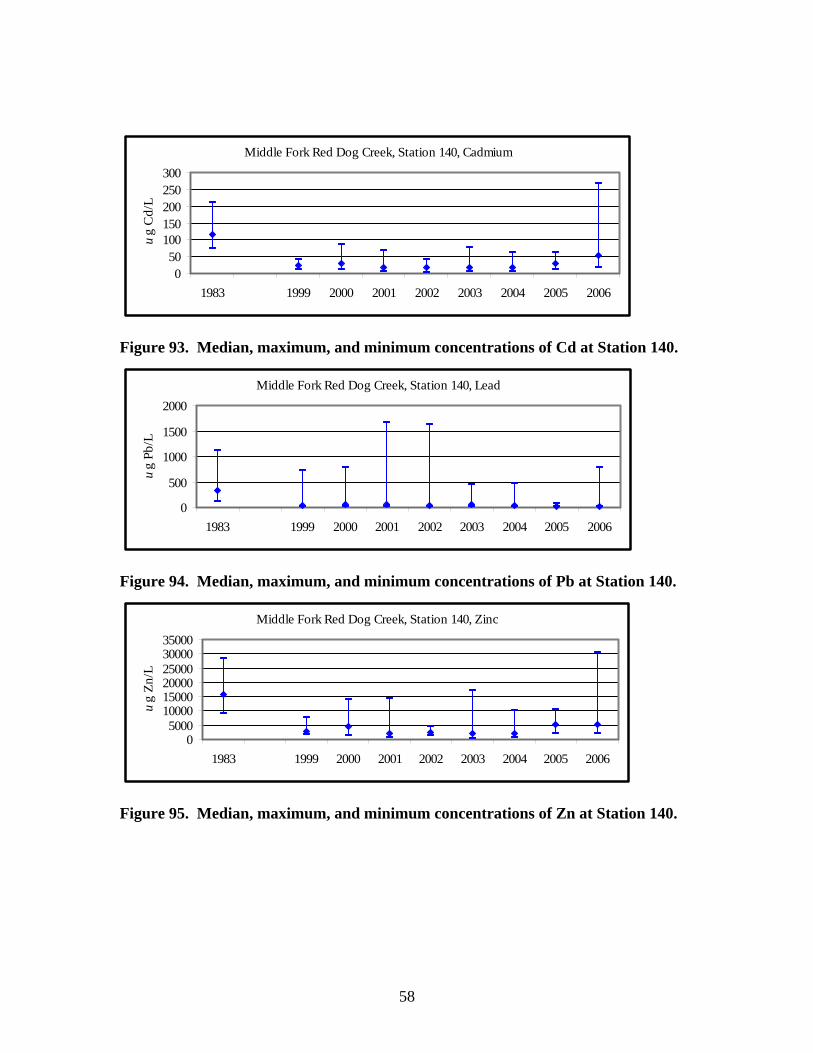
Middle Fork Red Dog Creek, Station 140 .................................................................... 57 Site Description......................................................................................................... 57
Distribution of Fish ....................................................................................................... 66 Overwintering Dolly Varden..................................................................................... 66 Chum Salmon ............................................................................................................ 67 Dolly Varden ............................................................................................................. 69 Arctic Grayling ......................................................................................................... 74 Slimy Sculpin............................................................................................................. 81
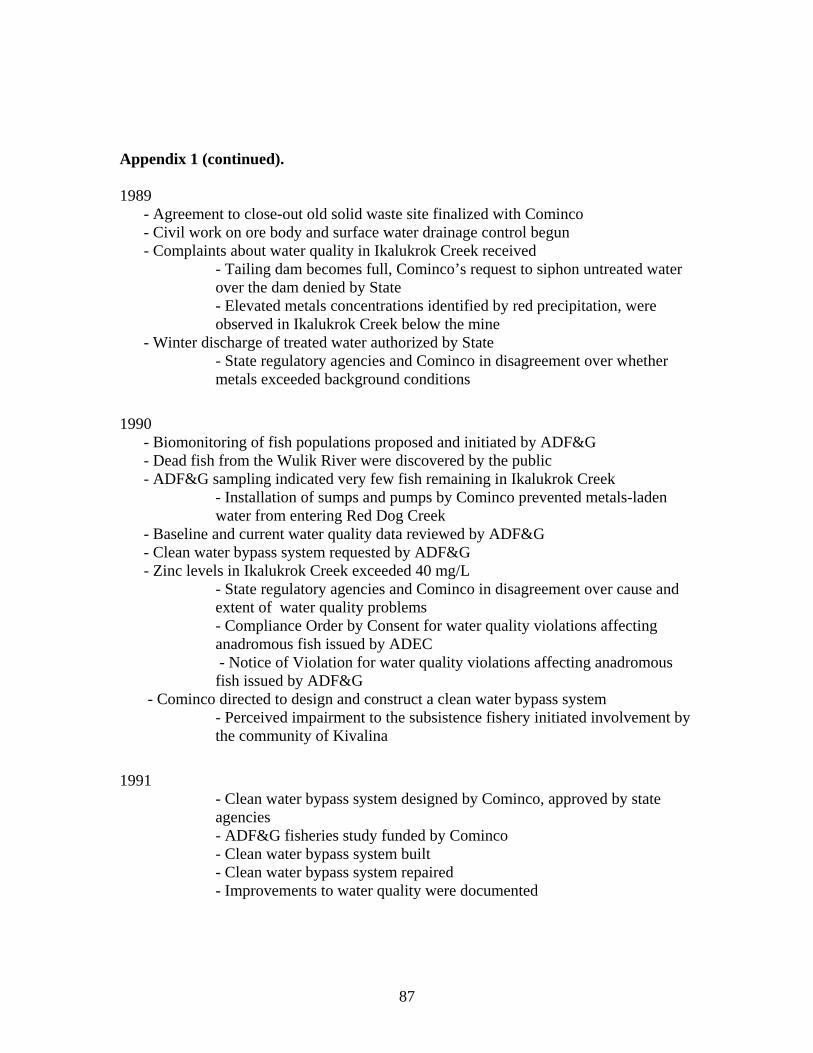
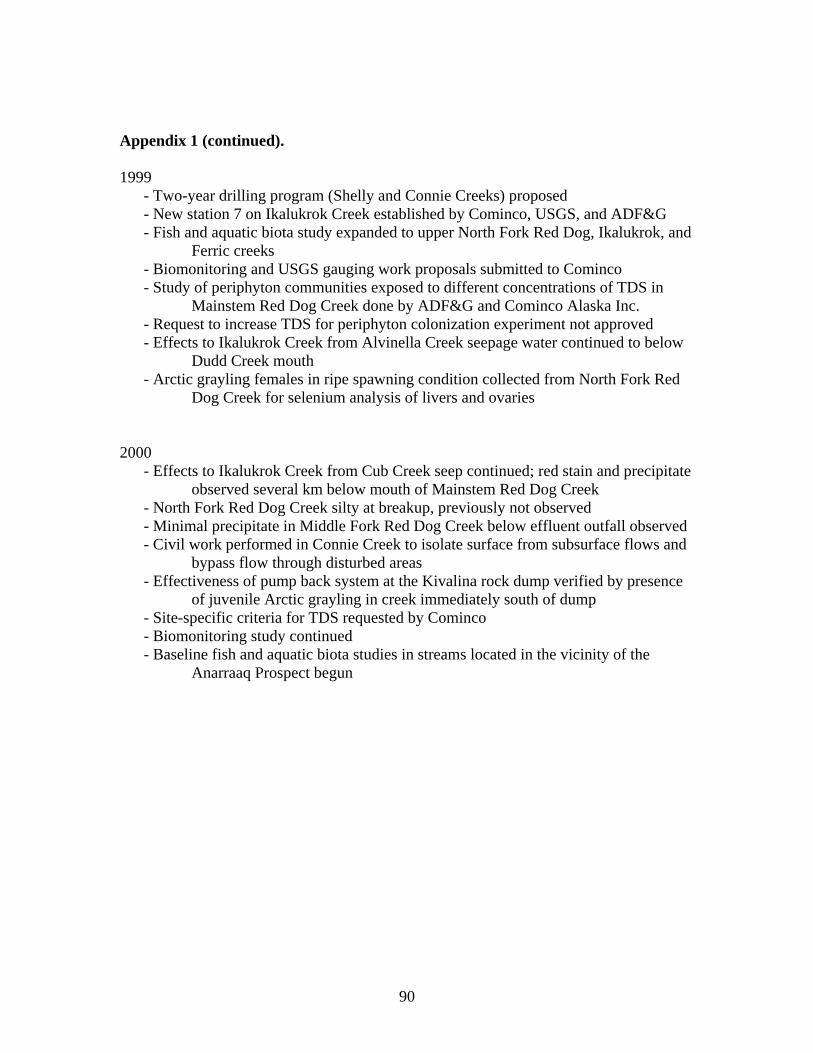
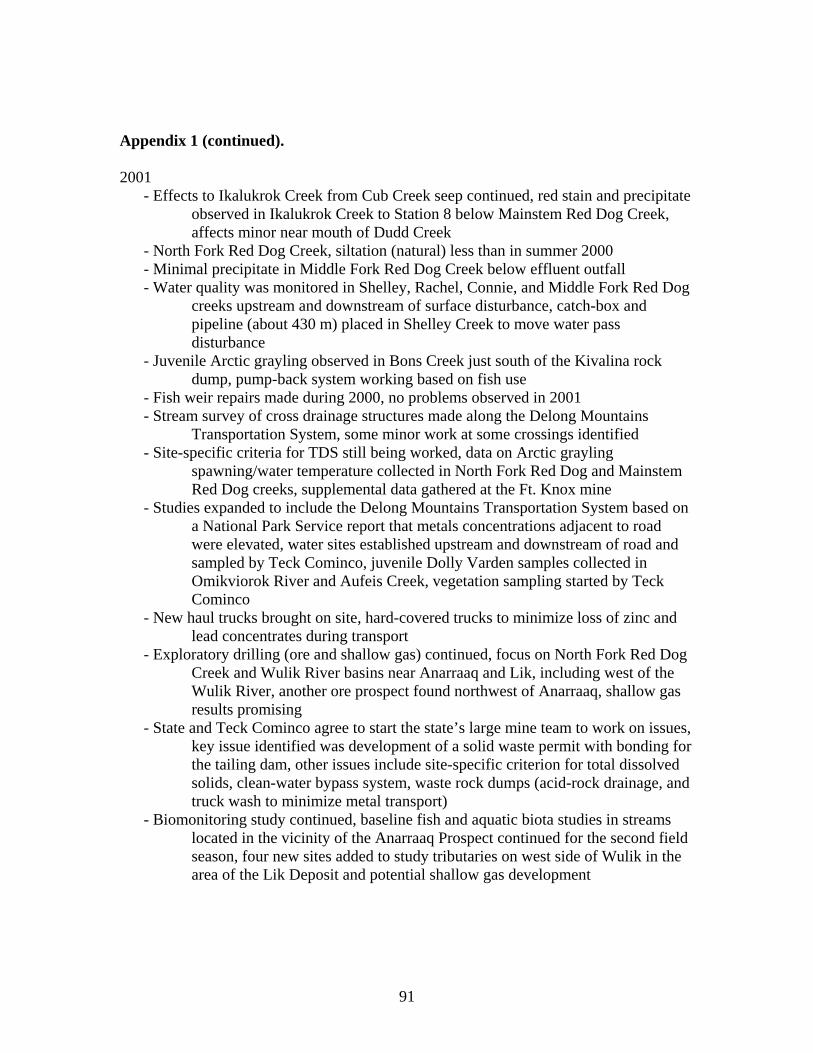
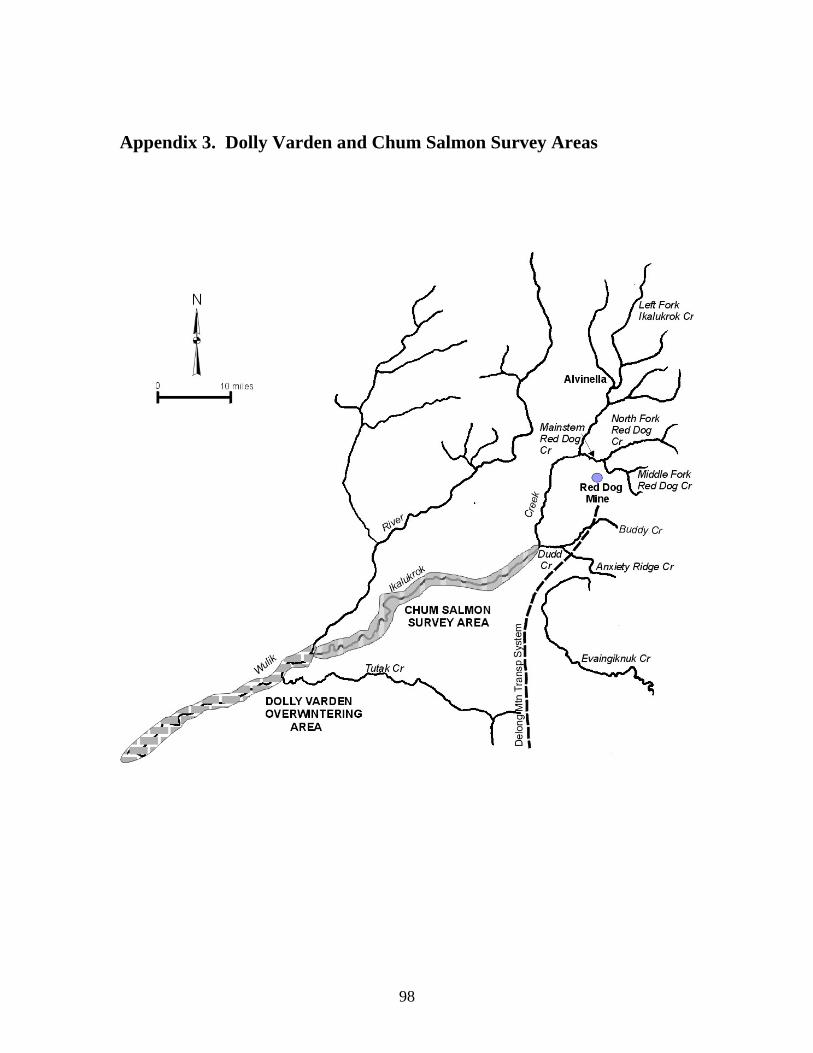
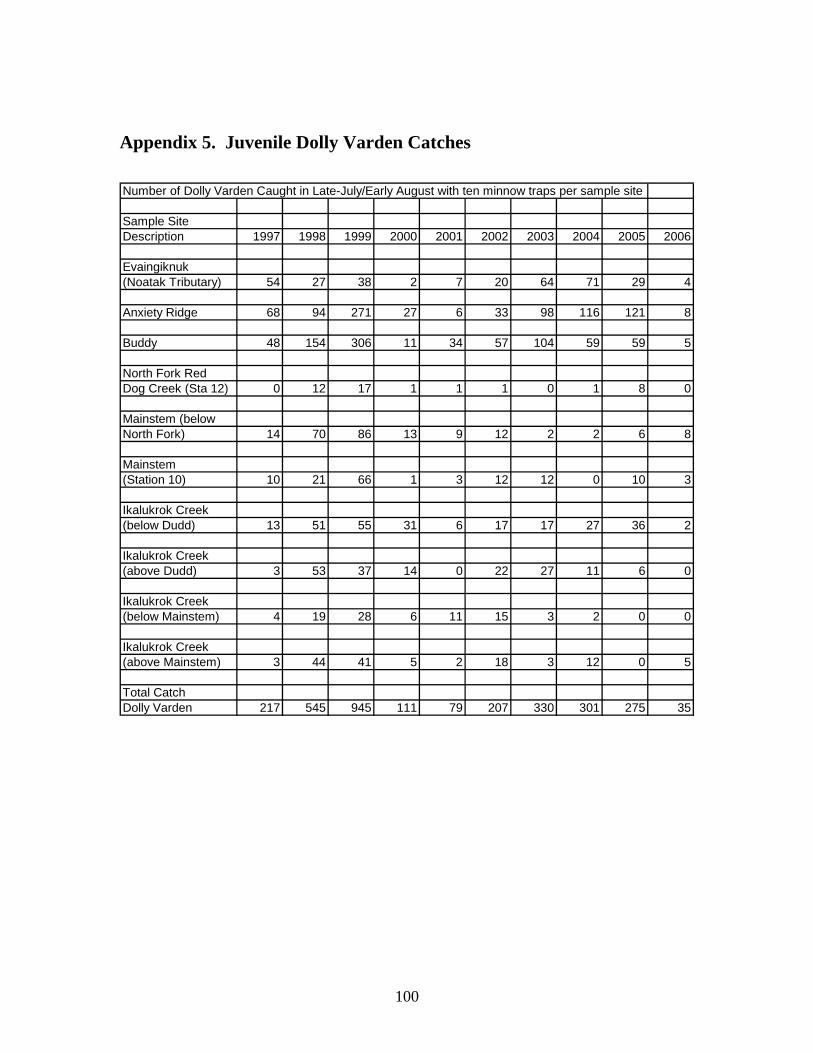
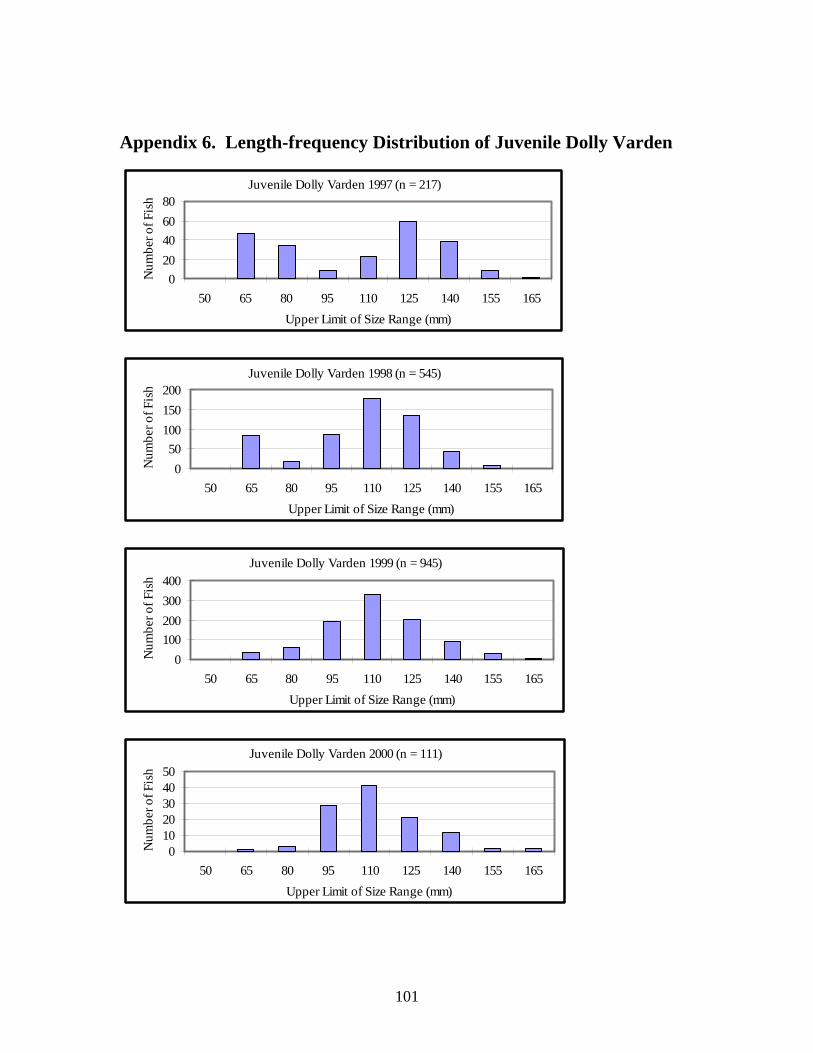
Literature Cited ................................................................................................................. 82 Appendix 1. Summary of Mine Development and Operations........................................ 86 Appendix 2. Dolly Varden Aerial Surveys ...................................................................... 97 Appendix 3. Dolly Varden and Chum Salmon Survey Areas ......................................... 98 Appendix 4. Juvenile Dolly Varden Sampling Sites ....................................................... 99 Appendix 5. Juvenile Dolly Varden Catches................................................................. 100 Appendix 6. Length-frequency Distribution of Juvenile Dolly Varden ........................ 101
ii
List of Tables
1. Location of sample sites for NPDES biomonitoring. .................................................... 3 2. Study sites and components required by NPDES Permit. ............................................. 5 3. Study sites and components of supplemental biomonitoring in 2006 ........................... 6 4. Ikalukrok Creek, Station 7, 1999 to 2006.................................................................... 14 5. Ikalukrok Creek, upstream of Dudd Creek, 1999 to 2006........................................... 21 6. Ikalukrok Creek, Station 8, 1999 to 2006. ................................................................... 25 7. Ikalukrok Creek, Station 9, 1999 to 2006. ................................................................... 33 8. Mainstem Red Dog Creek, Station 10, 1999 to 2006. ................................................. 41 9. North Fork Red Dog Creek, Station 12, 1999 to 2006 ................................................ 48 10. Middle Fork Red Dog Creek, Station 20, 1999 to 2006 ............................................ 56 11. Number of chum salmon adults in Ikalukrok Creek.................................................. 68 12. Location of juvenile Dolly Varden sample sites........................................................ 69 13. A summary of Arctic grayling spawning in Mainstem Red Dog Creek.................... 74 14. Arctic grayling recaptures in spring 2006 in North Fork Red Dog Creek................. 76 15. Arctic grayling caught in North Fork Red Dog and Mainstem Red Dog. ................. 77 16. Relative abundance of Arctic grayling fry in North Fork Red Dog Creek................ 80
iii
List of Figures
1. Location of the Red Dog Mine in northwestern Alaska. ............................................... 2 2. Location of sample sites in the Ikalukrok Creek drainage............................................. 4 3. Ikalukrok Creek downstream of Dudd Creek, Station 7................................................ 8 4. TDS concentrations in Ikalukrok Creek at Station 160. ................................................ 9 5. Median, maximum, and minimum concentrations of Al at Station 160...................... 10 6. Median, maximum, and minimum concentrations of Cd at Station 160. .................... 10 7. Median, maximum, and minimum concentrations of Cu at Station 160. .................... 10 8. Median, maximum, and minimum concentrations of Pb at Station 160...................... 11 9. Median, maximum, and minimum concentrations of Se at Station 160...................... 11 10. Median, maximum, and minimum concentrations of Zn at Station 160. .................. 11 11. Aquatic invertebrate abundance, Ikalukrok Creek at Station 7. ................................ 12 12. Aquatic invertebrate density, Ikalukrok Creek at Station 7. ...................................... 12 13. Aquatic invertebrate taxa richness, Ikalukrok Creek at Station 7.............................. 13 14. Percent EPT, Ikalukrok Creek at Station 7. ............................................................... 13 15. Average concentration of chlorophyll-a, Ikalukrok Creek at Station 7. .................... 14 16. Ikalukrok Creek upstream of Dudd Creek. ................................................................ 15 17. Median, maximum, and minimum TDS concentrations in Ikalukrok Creek............. 16 18. Median, maximum, and minimum concentrations of Al at Stations 73 or 150. ........ 17 19. Median, maximum, and minimum concentrations of Cd at Stations 73 or 150. ....... 17 20. Median, maximum, and minimum concentrations of Cu at Stations 73 or 150. ....... 17 21. Median, maximum, and minimum concentrations of Pb at Stations 73 or 150......... 18 22. Median, maximum, and minimum concentrations of Se at Stations 73 or 150. ........ 18 23. Median, maximum, and minimum concentrations of Zn at Stations 73 or 150......... 18 24. Aquatic invertebrate abundance, Ikalukrok Creek upstream of Dudd Creek. ........... 19 25. Aquatic invertebrate density, Ikalukrok Creek upstream of Dudd Creek.................. 19 26. Aquatic invertebrate taxa richness, Ikalukrok Creek upstream of Dudd Creek. ....... 20 27. Percent EPT, Ikalukrok Creek upstream of Dudd Creek........................................... 20 28. Average concentration of chlorophyll-a, Ikalukrok Creek upstream of Dudd Creek.21 29. Ikalukrok Creek downstream of Mainstem Red Dog Creek, Station 8. .................... 22 30. Aquatic invertebrate abundance, Ikalukrok Creek at Station 8. ................................ 23 31. Aquatic invertebrate density, Ikalukrok Creek at Station 8. ...................................... 23 32. Aquatic invertebrate taxa richness, Ikalukrok Creek at Station 8.............................. 24 33. Percent EPT, Ikalukrok Creek at Station 8. ............................................................... 24 34. Average concentration of chlorophyll-a, Ikalukrok Creek at Station 8. .................... 25 35. Ikalukrok Creek upstream of Mainstem Red Dog Creek, Station 9. ......................... 26 36. Median, maximum, and minimum pH at Station 9 in Ikalukrok Creek. ................... 27 37. Median, maximum, and minimum concentrations of Al at Station 9........................ 28 38. Median, maximum, and minimum concentrations of Cd at Station 9. ...................... 28 39. Median, maximum, and minimum concentrations of Cu at Station 9. ...................... 28 40. Median, maximum, and minimum concentrations of Pb at Station 9........................ 29
iv
List of Figures (continued). 41. Median, maximum, and minimum concentrations of Se at Station 9........................ 29 42. Median, maximum, and minimum concentrations of Zn at Station 9. ...................... 29 43. Median, maximum, and minimum concentrations of Cd at Station 9 ....................... 30 44. Median, maximum, and minimum concentrations of Zn at Station 9 ....................... 30 45. Aquatic invertebrate abundance, Ikalukrok Creek at Station 9. ................................ 31 46. Aquatic invertebrate density, Ikalukrok Creek at Station 9. ...................................... 31 47. Aquatic invertebrate taxa richness, Ikalukrok Creek at Station 9.............................. 32 48. Percent EPT, Ikalukrok Creek at Station 9. ............................................................... 32 49. Average concentration of chlorophyll-a, Ikalukrok Creek at Station 8. .................... 33 50. Mainstem Red Dog Creek, Station 10. ...................................................................... 34 51. TDS concentrations in Mainstem Red Dog Creek, Station 10. ................................. 35 52. Peak water temperatures in Mainstem Red Dog Creek in spring 2006. .................... 36 53. Median, maximum, and minimum pH values, Mainstem Red Dog Creek................ 36 54. Median, maximum, and minimum concentrations of Al at Station 10...................... 37 55. Median, maximum, and minimum concentrations of Cd at Station 10. .................... 37 56. Median, maximum, and minimum concentrations of Cu at Station 10. .................... 37 57. Median, maximum, and minimum concentrations of Pb at Station 10...................... 38 58. Median, maximum, and minimum concentrations of Se at Station 10...................... 38 59. Median, maximum, and minimum concentrations of Zn at Station 9. ...................... 38 60. Aquatic invertebrate abundance, Mainstem Red Dog Creek at Station 10................ 39 61. Aquatic invertebrate density, Mainstem Red Dog Creek at Station 10. .................... 39 62. Aquatic invertebrate taxa richness, Mainstem Red Dog Creek at Station 10............ 40 63. Percent EPT, Mainstem Red Dog Creek at Station 10. ............................................. 40 64. Average concentration of chlorophyll-a, Mainstem Red Dog Creek at Station 10. .. 41 65. North Fork Red Dog Creek, Station 12. .................................................................... 42 66. Total suspended sediment in North Fork Red Dog Creek at Station 12.................... 43 67. Median, maximum, and minimum concentrations of Al at Station 12...................... 43 68. Median, maximum, and minimum concentrations of Cd at Station 12. .................... 44 69. Median, maximum, and minimum concentrations of Cu at Station 12. .................... 44 70. Median, maximum, and minimum concentrations of Pb at Station 12...................... 44 71. Median, maximum, and minimum concentrations of Se at Station 12...................... 45 72. Median, maximum, and minimum concentrations of Zn at Station 12. .................... 45 73. Aquatic invertebrate abundance, North Fork Red Dog Creek at Station 12.............. 46 74. Aquatic invertebrate density, North Fork Red Dog Creek at Station 12. .................. 46 75. Aquatic invertebrate taxa richness, North Fork Red Dog Creek at Station 12. ......... 47 76. Percent EPT, North Fork Red Dog Creek at Station 12 ............................................ 47 77. Average concentration of chlorophyll-a, North Fork Red Dog Creek....................... 48 78. Middle Fork Red Dog Creek, Station 20 ................................................................... 49 79. Median, maximum, and minimum pH at Station 20 in Middle Fork ........................ 50 80. Middle Fork Red Dog Creek, just below mine effluent discharge. ........................... 51 81. Median, maximum, and minimum concentrations of Al at Station 20...................... 51
v
List of Figures (concluded). 82. Median, maximum, and minimum concentrations of Cd at Station 20. .................... 52 83. Median, maximum, and minimum concentrations of Cu at Station 20. .................... 52 84. Median, maximum, and minimum concentrations of Pb at Station 20...................... 52 85. Median, maximum, and minimum concentrations of Se at Station 20...................... 53 86. Median, maximum, and minimum concentrations of Zn at Station 20. .................... 53 87. Aquatic invertebrate abundance, Middle Fork Red Dog Creek at Station 20. .......... 54 88. Aquatic invertebrate density, Middle Fork Red Dog Creek at Station 20. ................ 54 89. Aquatic invertebrate taxa richness, Middle Fork Red Dog Creek at Station 20........ 54 90. Percent EPT, Middle Fork Red Dog Creek at Station 20. ......................................... 55 91. Average concentration of chlorophyll-a, Middle Fork Red Dog Creek .................... 55 92. Median, maximum, and minimum pH at Station 140 in Middle Fork ...................... 57 93. Median, maximum, and minimum concentrations of Cd at Station 140. .................. 58 94. Median, maximum, and minimum concentrations of Pb at Station 140.................... 58 95. Median, maximum, and minimum concentrations of Zn at Station 140. .................. 58 96. Average Al concentrations of all fish collected from 1999 to 2006.......................... 60 97. Average Cd concentrations of all fish collected from 1999 to 2006 ......................... 60 98. Average Cu concentrations of all fish collected from 1999 to 2006 ......................... 60 99. Average Pb concentrations of all fish collected from 1999 to 2006.......................... 61 100. Average Se concentrations of all fish collected from 1999 to 2006. ....................... 61 101. Average Zn concentrations of all fish collected from 1999 to 2006........................ 61 102. Average Hg concentrations of all fish collected from 1999 to 2006. ...................... 62 103. Median, maximum, and minimum concentrations of Al (dry weight). ................... 62 104. Median, maximum, and minimum concentrations of Cd (dry weight).................... 63 105. Median, maximum, and minimum concentrations of Cu (dry weight).................... 63 106. Median, maximum, and minimum concentrations of Pb (dry weight). ................... 64 107. Median, maximum, and minimum concentrations of Se (dry weight). ................... 64 108. Median, maximum, and minimum concentrations of Zn (dry weight).................... 65 109. Median, maximum, and minimum concentrations of Hg (dry weight). .................. 65 110. The number of Dolly Varden estimated in the Wulik River.................................... 66 111. Number of Dolly Varden in Anxiety Ridge Creek. ................................................. 70 112. Number of Dolly Varden in Buddy Creek............................................................... 70 113. Catches of juvenile Dolly Varden in Anxiety Ridge (ANX) and Buddy ................ 71 114. Catches of juvenile Dolly Varden in upper Mainstem Red Dog (UMS)................. 72 115. Dolly Varden caught in fyke nets in North Fork Red Dog Creek in spring ............ 73 116. Peak daily water temperatures in Mainstem Red Dog and North Fork ................... 75 117. Slimy sculpin caught in Ikalukrok, Red Dog, Buddy, and Anxiety Ridge.............. 81
vi
Acknowledgements
We thank Teck Cominco Alaska Inc. (TCAK) for financial and logistical support that
enabled us to conduct aquatic biomonitoring work at the Red Dog Mine. We specifically
acknowledge the support provided by Mr. Jim Kulas, Mr. Mark Thompson, and Mr. John
Martinisko of TCAK.
We thank Ms. Jackie Timothy, Ms. Kerry Howard, Ms. Laura Jacobs, and Mr. Jack
Winters with the Office of Habitat Management and Permitting (Alaska Department of
Natural Resources) for their help with field and laboratory work. Mr. Fred DeCicco,
Alaska Department of Fish and Game, conducted the fall Dolly Varden (Salvelinus
malma) aerial surveys and collected the fall sample of adult Dolly Varden from the Wulik
River. The University of Alaska Fairbanks allowed us to use their equipment for
chlorophyll analyses.
We thank Dr. Phyllis Weber Scannell (Scannell Technical Services) for reviewing and
updating the long-term water quality data base with 2006 information. Ms. Nora Foster
(NRF Taxonomic Services) was responsible for sorting and identification of aquatic
invertebrates collected with drift nets.
vii
Executive Summary
●Concentrations of Cd and Zn generally are lower at sample stations located downstream of the Red Dog Mine when compared with pre-mining data. At Station 10 in Mainstem Red Dog Creek the median concentrations of Cd, Pb, and Zn are lower from 1999 through 2006 as compared to baseline data. However, we do see several peak Pb and Al concentrations at Station 10 that exceed baseline data. In Ikalukrok Creek upstream of Mainstem Red Dog Creek (Station 9), both Cd and Zn increased from 1999 through 2001 as compared with baseline data, but have remained stable since 2002 with the exception of some higher concentrations in summer 2006. Water quality changes at Station 9 are most likely related to a very active mineral seep at Cub Creek.
●Chlorophyll-a concentrations are lowest for all sample years at Station 20 in Middle Fork Red Dog Creek. Generally chlorophyll-a concentrations are highest in North Fork Red Dog Creek. At Station 9 (Ikalukrok Creek upstream of Mainstem Red Dog Creek), chlorophyll-a concentrations track very closely with Zn and Cd concentrations measured over similar time frames. Improved water quality in Ikalukrok Creek in recent years has resulted in increased periphyton standing crop at Station 9. Overall, chlorophyll-a concentrations seem to accurately represent the sample sites and serve as a valid indicator of basic biological productivity.
●Aquatic invertebrates from the NPDES sample sites demonstrate a high degree of variability among sites and years. Overall densities of aquatic invertebrates are highest in North Fork Red Dog Creek – the most productive stream currently being sampled for invertebrates under the NPDES permit. Aquatic invertebrate data appear to be representative of productivity at a given site, but variability among site and years is very high.
●Concentrations of total dissolved solids (TDS) at Station 160 (Ikalukrok Creek downstream of Dudd Creek) never exceeded 500 mg/L during summer 2006. TDS concentrations at Station 10, in Mainstem Red Dog Creek, did not exceed 1,500 mg/L during 2006. A TDS site specific criterion (SSC) of 1,500 mg/L during Arctic grayling spawning was made by ADEC and became effective on February 15, 2006. The US Environmental Protection Agency approved the 1,500 mg/L TDS SSC on April 21, 2006. In spring 2006, Arctic grayling spawning in Mainstem Red Dog Creek probably began on May 30 and was judged to be complete by June 15.
●Adult Dolly Varden from the Wulik River have been sampled for metals concentrations in gill, kidney, liver, muscle, and reproductive tissue since 1990. In 1997, Se was added to the analyte list and in 2003, Hg and Ca were added. None of the analytes measured have been found to accumulate in muscle tissue. Various analytes concentrate in specific tissues: Al in gill; Cd in kidney; Cu in liver; Pb in gill; Se in kidney and ovary; and Zn in ovary.
viii
Executive Summary (concluded).
●The number of overwintering Dolly Varden is estimated each fall in the Wulik River. Estimates vary annually. There is no indication, based on surveys conducted before and after mining, that the estimated number of fish overwintering in the Wulik River has exhibited a trend of increasing or decreasing numbers. Aerial surveys before mine development found that 90% of the Dolly Varden in the Wulik River are located below the mouth of Ikalukrok Creek. Surveys, post mining, have continued to find that 90% of the Dolly Varden counted during the fall survey are found below the mouth of Ikalukrok Creek.
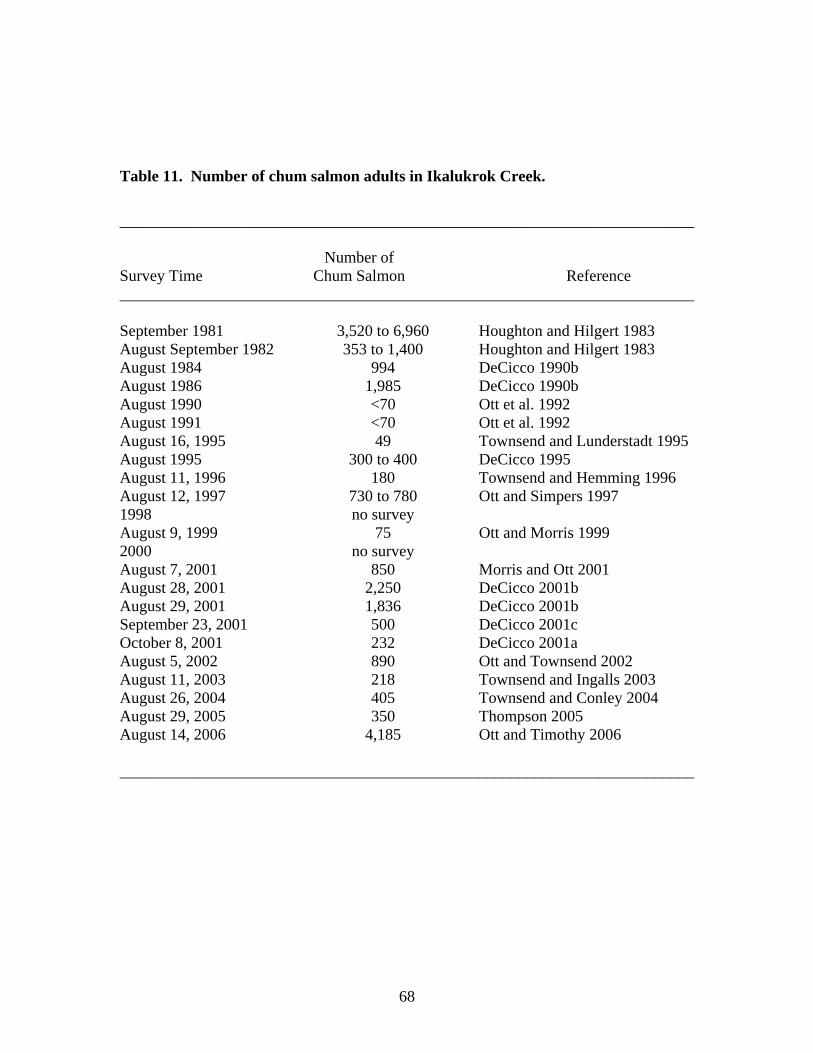
●Annual aerial surveys are made to assess the distribution of chum salmon in Ikalukrok Creek from its mouth (i.e., confluence with Wulik River) upstream to Dudd Creek. Counts of adult chum salmon after mine development in 1990 and 1991 were lower than reported in baseline studies. Surveys began in 1995, with the highest return of chum salmon seen in fall 2006. The highest number of chinook salmon seen was in the fall of 2004. Large returns of chum salmon in recent years (2001, 2002, and 2006) are indicators that the population has recovered from the low counts made in the early 1990s.
●Juvenile Dolly Varden were not caught in all sample reaches in fall 2006. Catches in 2006 were the lowest recorded since 1997. Presence of resident Dolly Varden using North Fork Red Dog Creek in spring continued to be confirmed by fyke net catches.
●Arctic grayling spawn in North Fork Red Dog and Mainstem Red Dog creeks each spring. We estimated the Arctic grayling population in North Fork Red Dog and Mainstem Red Dog creeks at 870 fish in spring 2001. Relative abundance of fry varies annually and recruitment to the population does not occur each year. The last year where recruitment may have occurred is 1999. In spring 2006, we observed a post-spawning outmigration of large mature Arctic grayling during our spring sample period – we have not seen this occur during previous spring sampling events. The cold temperatures in North Fork Red Dog Creek continued well beyond the normal time frame for Arctic grayling spawning. We believe that Arctic grayling entered North Fork Red Dog Creek in late May and due to cold water temperatures, abandoned spawning.
•Premining slimy sculpin abundance is not known, but baseline data reports indicate that this species was numerous in the Ikalukrok Creek drainage. Catches of slimy sculpin in the Ikalukrok Creek drainage NPDES sample sites indicate an increasing trend from 2000 through 2005, but not in 2006. Lower numbers of slimy sculpin in 2006 were due, in part, to a reduced sample effort (i.e., July sample did not occur due to high water). Increasing numbers of slimy sculpin through 2005 appeared to reflect general improvement in water quality due to mine operations and water treatment and natural decreases in the Cub Creek seep located in the upper Ikalukrok Creek drainage.
ix
Introduction
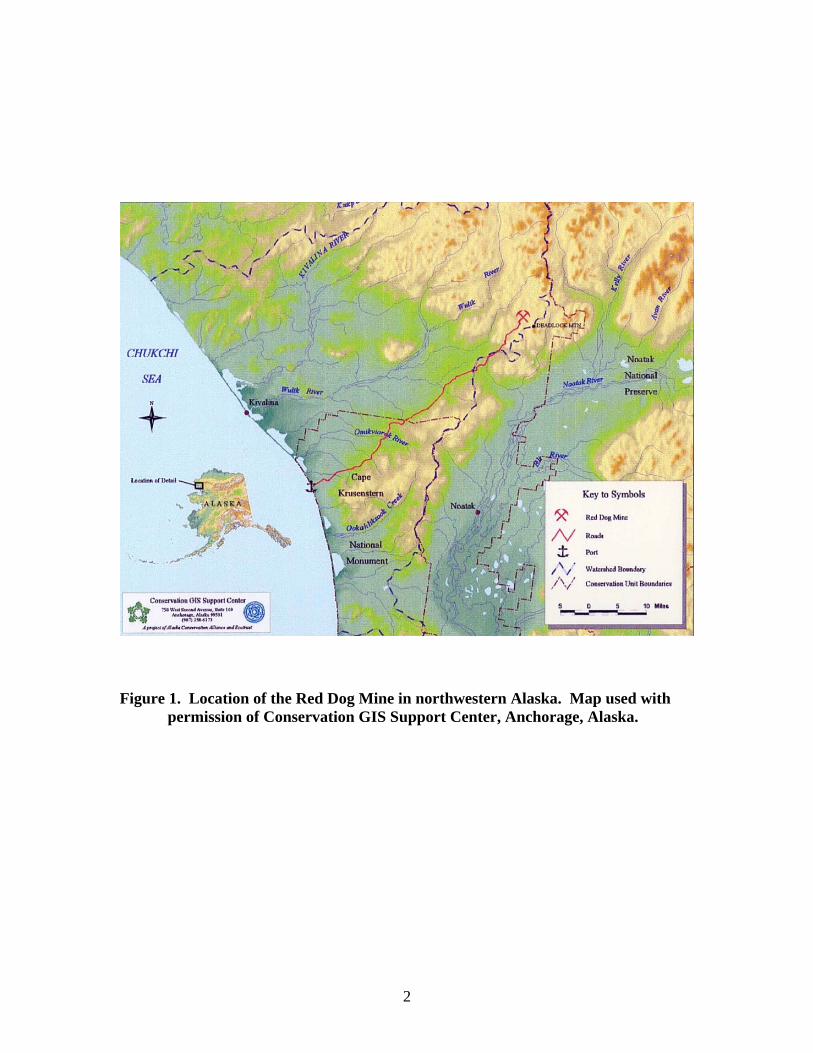
The Red Dog zinc (Zn) and lead (Pb) deposit is located in northwestern Alaska, about
130 km north of Kotzebue and 75 km inland from the Chukchi Sea coast (Figure 1).
Mine operations and facilities and surrounding vegetation and wildlife are described in
Weber Scannell and Ott (1998). A chronology of development and operations at the Red
Dog Mine is presented in Appendix 1. Aquatic resources in the Wulik River drainage are
described in Weber Scannell et al. 2000.
In July 1998, the US Environmental Protection Agency (EPA) issued a draft National
Pollution Discharge Elimination System Permit No. AK-003865-2 (NPDES Permit) to
Teck Cominco Alaska Inc. (TCAK) to allow discharge of up to 2.418 billion gallons of
treated effluent per year. The Alaska Department of Environmental Conservation
(ADEC) issued a Certificate of Reasonable Assurance and the NPDES became effective
August 28, 1998. The NPDES Permit was modified effective August 23, 2003, to
include ADEC’s authorization of two mixing zones for total dissolved solids in Mainstem
Red Dog and Ikalukrok creeks.
The NPDES Permit requires biomonitoring of fish, aquatic invertebrates, and periphyton
in streams downstream of and adjacent to the Red Dog Mine. Although the NPDES
Permit expired August 28, 2003, it was administratively extended until such time as a
new permit is issued. Aquatic biomonitoring has continued annually as required by the
NPDES Permit. Our report contains results of studies undertaken by the Alaska
Department of Natural Resources (ADNR) in 2006 and comparisons of the 2006 data
with previous years.
Figure 1. Location of the Red Dog Mine in northwestern Alaska. Map used with permission of Conservation GIS Support Center, Anchorage, Alaska.
2
Structure of Report
Results of water quality monitoring, estimates of periphyton standing crop, and aquatic
invertebrate sampling are given for each site for the years sampled (1999 to 2006).
Following presentation of these results by individual site is a table summarizing changes
in biotic communities and water quality conditions. Metals concentration data for adult
Dolly Varden (Salvelinus malma) collected from the Wulik River are then presented.
Aerial survey estimates of overwintering Dolly Varden in the Wulik River and chum
salmon (Oncorhynchus keta) spawners in Ikalukrok Creek are covered next. Finally,
biological monitoring data for Dolly Varden juveniles, Arctic grayling (Thymallus
arcticus), and slimy sculpin (Cottus cognatus) are discussed.
Location of Sample Sites
Biomonitoring is conducted in streams adjacent to and downstream of the Red Dog Mine
as required under the EPA NPDES Permit No. AK-003865-2 (Table 1, Figure 2). A
description of the site location and the Station Number identification, where one exists,
are presented in Table 1.
Table 1. Location of sample sites for NPDES biomonitoring. ________________________________________________________________________ Stream of Site Name Station Number ________________________________________________________________________ Ikalukrok Creek downstream of Dudd Creek Station 7 Ikalukrok Creek upstream of Dudd Creek no station # Ikalukrok Creek downstream of Mainstem Red Dog Creek Station 8 Ikalukrok Creek upstream of Mainstem Red Dog Creek Station 9 Mainstem Red Dog Creek Station 10 North Fork Red Dog Creek Station 12 Middle Fork Red Dog Creek Station 20 ________________________________________________________________________
3
Figure 2. Location of sample sites in the Ikalukrok Creek drainage for aquatic invertebrate and periphyton sampling. The Ikalukrok Creek site upstream of Dudd Creek does not have a numerical description.
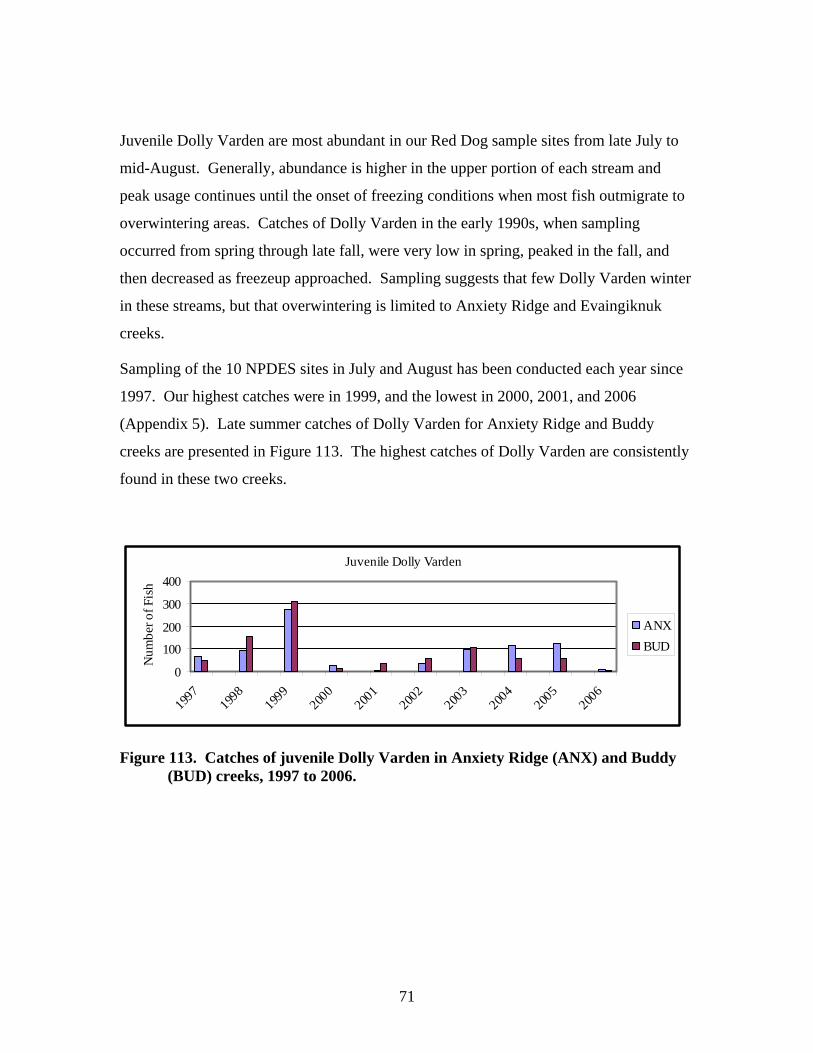
4
Description of Streams
All streams in this study are in the Wulik River drainage, except for Evaingiknuk Creek,
which is in the Noatak River drainage. Station numbers correspond either to those used
by Dames and Moore (1983) during baseline studies or to the current water quality
program being conducted by TCAK. Water quality and fish data collected during
baseline studies (1979 to 1982) represent pre-mining conditions. Each component and
location listed in Table 2 is required by NPDES Permit No. AK-003865-2. ADNR and
ADEC conduct additional sampling that is supplemental to the requirements under the
NPDES Permit to further our understanding of the aquatic communities (Table 3).
Table 2. Study sites and components required by NPDES Permit.
________________________________________________________________________ Ikalukrok Creek Stations 7, 8, periphyton (as chlorophyll-a, mg/m2) 9, and upstream of Dudd Creek aquatic invertebrates (taxa richness, density) Creek fish presence and use Mainstem Red Dog (10), North Fork periphyton (as chlorophyll-a, mg/m2) Red Dog (12) and Middle Fork Red aquatic invertebrates (taxa richness, density) Dog (20) Creeks fish presence and use Ikalukrok Creek chum salmon aerial survey Wulik River Dolly Varden fall aerial survey Anxiety Ridge, Evaingiknuk, and fish presence and use Buddy Creeks ________________________________________________________________________
5
Table 3. Study sites and components of supplemental biomonitoring in 2006.1
________________________________________________________________________ Ikalukrok Creek, upstream aerial Arctic grayling surveys of Mainstem Red Dog Creek Mainstem Red Dog Creek juvenile Dolly Varden, whole body metal analyses fish presence and use downstream of North Fork spawning condition of Arctic grayling (spent, ripe) mark-recapture of Arctic grayling North Fork Red Dog Creek spawning condition of Arctic grayling (spent, ripe) mark-recapture of Arctic grayling Buddy Creek, below waterfalls periphyton (as chlorophyll-a, mg/m2) aquatic invertebrates (taxa richness, density) juvenile Dolly Varden, whole body metal analyses Buddy Creek, above Haul Road periphyton (as chlorophyll-a, mg/m2) aquatic invertebrates (taxa richness, density) fish presence and use Bons Creek, below Bons Pond periphyton (as chlorophyll-a, mg/m2) aquatic invertebrates (taxa richness, density) fish presence and use Bons Pond fish presence and use mark-recapture of Arctic grayling Arctic grayling population estimate Bons Creek, above Bons Pond periphyton (as chlorophyll-a, mg/m2) aquatic invertebrates (taxa richness, density) fish presence and use spawning condition of Arctic grayling (spent, ripe) mark-recapture of Arctic grayling ________________________________________________________________________ 1draft technical report in preparation summarizing aquatic biomonitoring in Bons and
Buddy creeks and Bons Pond covering data collected in 2004, 2005, and 2006.
6
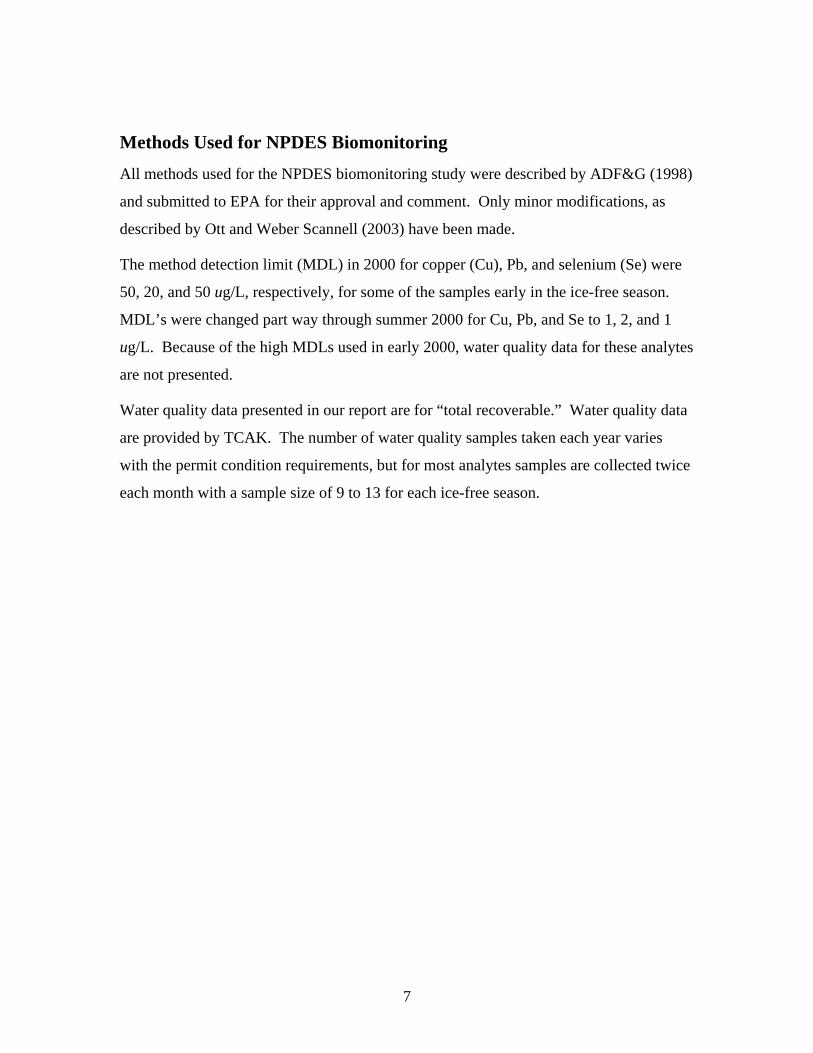
Methods Used for NPDES Biomonitoring
All methods used for the NPDES biomonitoring study were described by ADF&G (1998)
and submitted to EPA for their approval and comment. Only minor modifications, as
described by Ott and Weber Scannell (2003) have been made.
The method detection limit (MDL) in 2000 for copper (Cu), Pb, and selenium (Se) were
50, 20, and 50 ug/L, respectively, for some of the samples early in the ice-free season.
MDL’s were changed part way through summer 2000 for Cu, Pb, and Se to 1, 2, and 1
ug/L. Because of the high MDLs used in early 2000, water quality data for these analytes
are not presented.
Water quality data presented in our report are for “total recoverable.” Water quality data
are provided by TCAK. The number of water quality samples taken each year varies
with the permit condition requirements, but for most analytes samples are collected twice
each month with a sample size of 9 to 13 for each ice-free season.
7
Results and Discussion
Ikalukrok Creek, Station 7
Site Description
Ikalukrok Creek, downstream of Dudd Creek (Station 7, Figure 3) is about 10 to 40 m
wide with depths from 0.3 to 1.2 m. The substrate consists of small to medium gravel
with prevalent gravel bars at low flows. Ikalukrok and Dudd creeks are not completely
mixed at Station 7; complete mixing of the two creeks under various flow conditions
occurs about 8 km downstream of their confluence.
Figure 3. Ikalukrok Creek downstream of Dudd Creek, Station 7.
8
Water Quality
In May 1999, the stream gauge and monitoring station near Dudd Creek (Station 7) was
moved about 8 km downstream on Ikalukrok Creek (Station 160). Station 160 is located
below complete mixing of Dudd and Ikalukrok creeks. Baseline water quality data are
from Station 7, but water quality data are from Station 160 for 1999 through 2006.
Concentrations of total dissolved solids (TDS) at Station 160 are shown in Figure 4.
During summer 2006, TDS concentrations did not exceed 500 mg/L. The highest TDS
concentration was 486 mg/L on October 1, 2006. The wastewater discharge is regulated
to ensure that TDS does not exceed 500 mg/L at Station 160 from July 25 through the
end of the discharge season. Dolly Varden and chinook (Oncorhynchus tshawytscha) and
chum salmon spawn in Ikalukrok Creek downstream of Station 160.
Ikalukrok Creek, Station 160, TDS
0100200300400500600
5/11/0
65/2
5/06
6/8/06
6/22/0
6
7/6/06
7/20/0
6
8/3/06
8/17/0
68/3
1/06
9/14/0
69/2
8/06
10/12
/06
mg/
L TD
S
Figure 4. TDS concentrations in Ikalukrok Creek at Station 160.
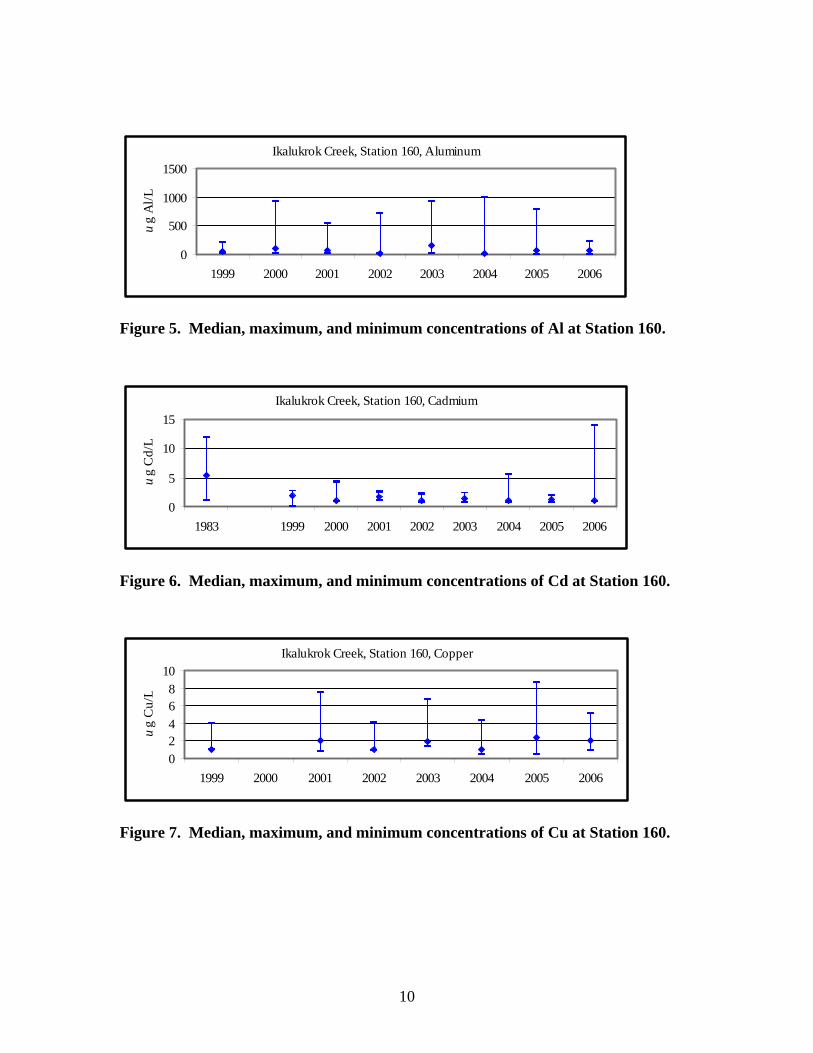
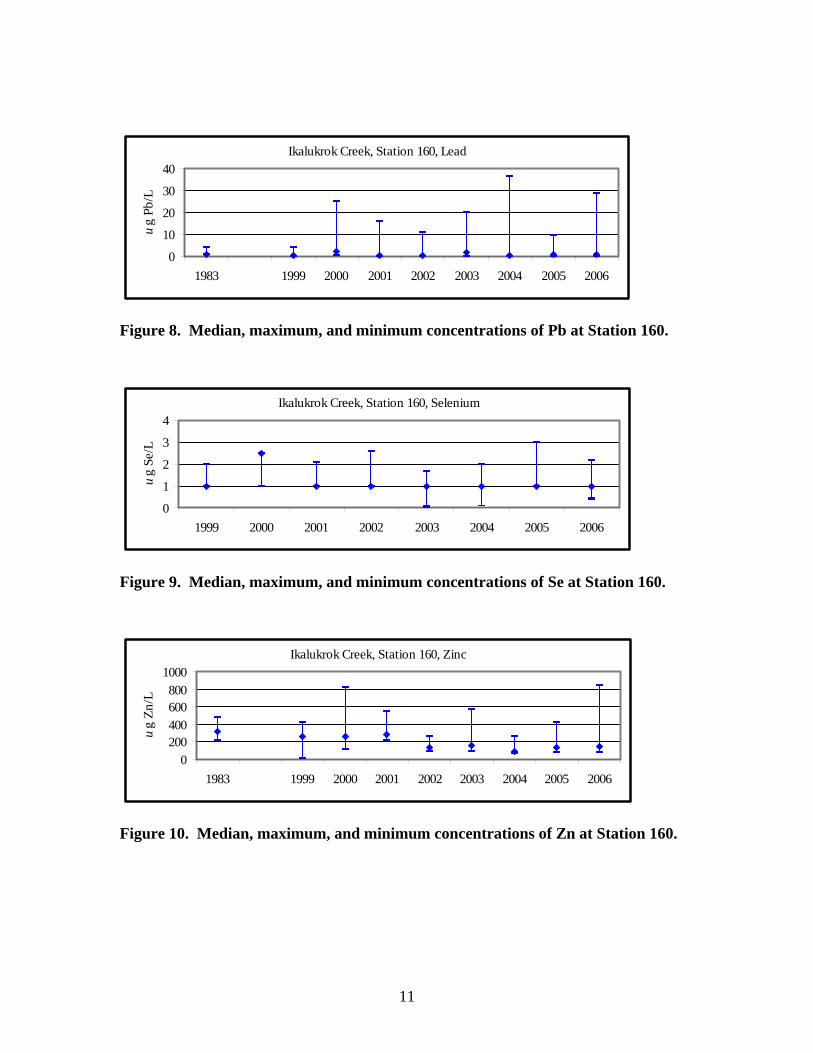
Concentrations of aluminum (Al), cadmium (Cd), Cu, Pb, Se, and Zn are presented in
Figures 5 through 10. Baseline data are only available for Cd, Pb, and Zn. Median Cd
and Zn concentrations are lower than baseline data. Median Pb concentrations vary with
respect to baseline data, but maximum concentrations are higher than pre-mining.
9
Ikalukrok Creek, Station 160, Aluminum
0
500
1000
1500
1999 2000 2001 2002 2003 2004 2005 2006
ug
Al/L
Figure 5. Median, maximum, and minimum concentrations of Al at Station 160.
Ikalukrok Creek, Station 160, Cadmium
0
5
10
15
1983 1999 2000 2001 2002 2003 2004 2005 2006
ug
Cd/
L
Figure 6. Median, maximum, and minimum concentrations of Cd at Station 160.
Ikalukrok Creek, Station 160, Copper
02468
10
1999 2000 2001 2002 2003 2004 2005 2006
ug
Cu/
L
Figure 7. Median, maximum, and minimum concentrations of Cu at Station 160.
10
Ikalukrok Creek, Station 160, Lead
0
10
20
30
40
1983 1999 2000 2001 2002 2003 2004 2005 2006
ug
Pb/L
Figure 8. Median, maximum, and minimum concentrations of Pb at Station 160.
Ikalukrok Creek, Station 160, Selenium
0
1
2
3
4
1999 2000 2001 2002 2003 2004 2005 2006
ug
Se/L
Figure 9. Median, maximum, and minimum concentrations of Se at Station 160.
Ikalukrok Creek, Station 160, Zinc
0200400600800
1000
1983 1999 2000 2001 2002 2003 2004 2005 2006
ug
Zn/L
Figure 10. Median, maximum, and minimum concentrations of Zn at Station 160.
11
Invertebrate Community (Abundance, Density, Taxa richness, and Structure)
Aquatic invertebrate abundance, density, taxa richness, and structure are presented in
Figures 11 through 14. Variability among sample years for both abundance and density
of aquatic invertebrates is high (Figures 11 and 12). In general, when abundance is
higher so is the density of aquatic invertebrates.
Aquatic Invertebrate Abundance, Ikalukrok Creek, Station 7
51
531 467
137
1188
171
693552
0
500
1000
1500
1999 2000 2001 2002 2003 2004 2005 2006
Ave
rage
/Net
Figure 11. Aquatic invertebrate abundance, Ikalukrok Creek at Station 7.
Aquatic Invertebrate Density, Ikalukrok Creek, Station 7
5.2
0.71.33.8 1.9
6.94.5
11.4
0
5
10
15
20
1999 2000 2001 2002 2003 2004 2005 2006
Ave
rage
/m3
Figure 12. Aquatic invertebrate density, Ikalukrok Creek at Station 7.
12
Total aquatic taxa in Ikalukrok Creek, downstream of Dudd Creek, varied from a low of
10 to a high of 24 (Figure 13). The proportion of Ephemoptera, Plecoptera, and
Tricoptera (EPT) were similar in 6 out of 8 years and ranged from a low of 8% to a high
of 39% (Figure 14). Aquatic invertebrate data indicate a productive community at
Station 7 in Ikalukrok Creek.
Aquatic Invertebrate Taxa Richness, Ikalukrok Creek, Station 7
13
24 18 2218
10
20
10
05
1015202530
1999 2000 2001 2002 2003 2004 2005 2006
Tota
l Tax
a
Figure 13. Aquatic invertebrate taxa richness, Ikalukrok Creek at Station 7.
Percent EPT, Ikalukrok Creek, Station 7
20% 19%18%
39%
17%8%
26%22%
0%10%20%30%40%50%
1999 2000 2001 2002 2003 2004 2005 2006
Perc
ent
Figure 14. Percent EPT, Ikalukrok Creek at Station 7.
13
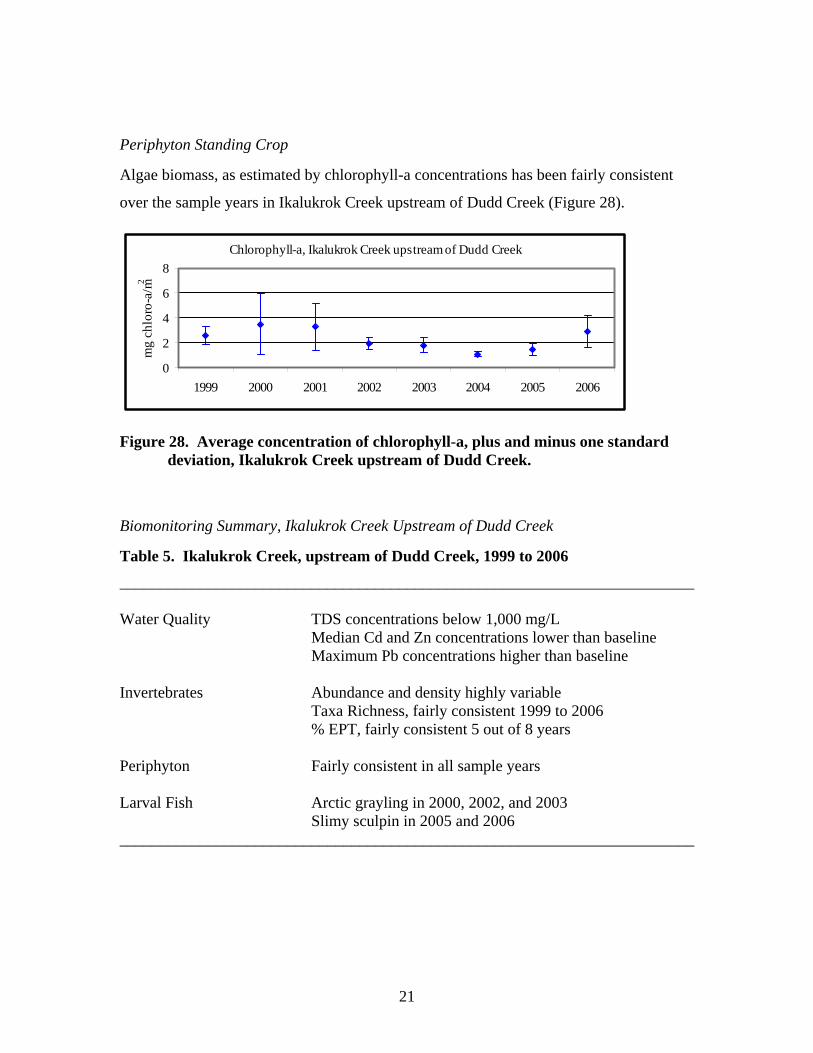
Periphyton Standing Crop
Algae biomass, as estimated by chlorophyll-a concentrations has been fairly consistent at
Station 7 with the highest concentrations seen in 2006 (Figure 15). All periphyton
samples are collected during early July, with the exception of 2006 when samples were
taken in early August due to high water conditions during most of July, 2006.
Chlorophyll-a, Ikalukrok Creek, Station 7
0
2
4
6
8
1999 2000 2001 2002 2003 2004 2005 2006
mg
chlo
ro-a
/m2
Figure 15. Average concentration of chlorophyll-a, plus and minus one standard deviation, Ikalukrok Creek at Station 7.
Biomonitoring Summary, Ikalukrok Creek Station 7
Table 4. Ikalukrok Creek, Station 7, 1999 to 2006 ________________________________________________________________________ Water Quality TDS concentrations below 500 mg/L Median Cd and Zn concentrations lower than baseline Maximum Pb concentrations higher than baseline Invertebrates Abundance and density highly variable Taxa Richness, fairly consistent 2003 to 2006 % EPT, fairly consistent 6 out of 8 years Periphyton Fairly consistent 5 out of 8 years, peak in August 2006 Larval Fish Arctic grayling in 2000, 2002, 2003, and 2004 Slimy sculpin in 2004 and 2006 ________________________________________________________________________
14
Ikalukrok Creek, Upstream of Dudd Creek
Site Description
Ikalukrok Creek, upstream of Dudd Creek, is a wide, fairly shallow stream up to 40 m
wide and 0.5 to 1.5 m deep during summer low flows (Figure 16). Flows in Ikalukrok
Creek, when this August 2006 photograph was taken, were much higher than summer
low flow conditions. Pools along cut banks or adjacent to rock bluffs are 2 to 4 m deep.
The substrate consists mostly of small cobble mixed with medium sized gravel.
Streambanks are heavily vegetated with willows, herbaceous plants, and grasses.
Figure 16. Ikalukrok Creek upstream of Dudd Creek.
Water Quality
Water is not sampled in Ikalukrok Creek at our monitoring site, but samples are collected
at Station 73 (1999 and 2000) and at Station 150 (2001 to 2006) located upstream of
Dudd Creek, but below the mouth of Mainstem Red Dog Creek.
15
Station 150 is located below the complete mixing of Mainstem Red Dog Creek with
Ikalukrok Creek. Only a few minor tributaries enter Ikalukrok Creek between the mouths
of Mainstem Red Dog and Ikalukrok creeks. Station 150 is a relatively new station
located about 9 km upstream of our biomonitoring site. Concentrations of TDS in
Ikalukrok Creek are not to exceed 1,000 mg/L at the end of the mixing zone. TDS
concentrations did not exceed the limit of 1,000 mg/L as provided for in ADEC’s
authorized mixing zone (Figure 17).
Total Dissolved Solids, Ikalukrok Creek at Stations 73 or 150
0200400600800
1000
1999 2000 2001 2002 2003 2004 2005 2006
mg/
L TD
S
Figure 17. Median, maximum, and minimum TDS concentrations in Ikalukrok Creek at Stations 73 or 150.
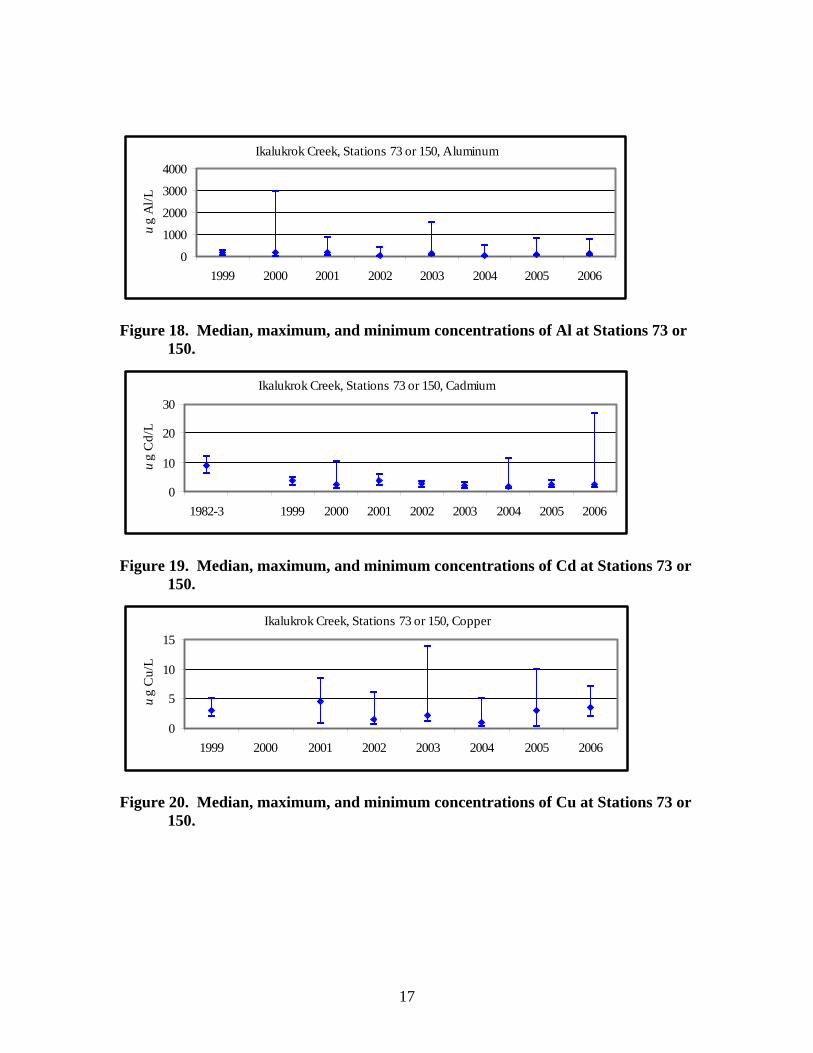
Concentrations of Al, Cd, Cu, Pb, Se, and Zn are presented in Figures 18 through 23.
Baseline data only are available for Cd, Pb, and Zn. Median Cd and Zn concentrations
from 1999 through 2006 are lower than baseline data. Median Pb concentrations are
similar to those reported in the baseline data. Maximum Pb concentrations post-mining,
in some years, are higher than baseline data.
16
Ikalukrok Creek, Stations 73 or 150, Aluminum
0
1000
2000
3000
4000
1999 2000 2001 2002 2003 2004 2005 2006
ug
Al/L
Figure 18. Median, maximum, and minimum concentrations of Al at Stations 73 or 150.
Ikalukrok Creek, Stations 73 or 150, Cadmium
0
10
20
30
1982-3 1999 2000 2001 2002 2003 2004 2005 2006
ug
Cd/
L
Figure 19. Median, maximum, and minimum concentrations of Cd at Stations 73 or 150.
Ikalukrok Creek, Stations 73 or 150, Copper
0
5
10
15
1999 2000 2001 2002 2003 2004 2005 2006
ug
Cu/
L
Figure 20. Median, maximum, and minimum concentrations of Cu at Stations 73 or 150.
17
Ikalukrok Creek, Stations 73 or 150, Lead
020406080
100
1981-2 1999 2000 2001 2002 2003 2004 2005 2006
ug
Pb/L
Figure 21. Median, maximum, and minimum concentrations of Pb at Stations 73 or 150.
Ikalukrok Creek, Stations 73 or 150, Selenium
0
1
2
3
4
1999 2000 2001 2002 2003 2004 2005 2006
ug
Se/L
Figure 22. Median, maximum, and minimum concentrations of Se at Stations 73 or 150.
Ikalukrok Creek, Stations 73 or 150, Zinc
0
500
1000
1500
2000
1982-3 1999 2000 2001 2002 2003 2004 2005 2006
ug
Zn/L
Figure 23. Median, maximum, and minimum concentrations of Zn at Stations 73 or 150.
18
Invertebrate Community (Abundance, Density, Taxa Richness, and Structure)
Aquatic invertebrate abundance, density, taxa richness, and structure are presented in
Figures 24 through 27. Considerable variability in aquatic invertebrate abundance and
density are shown in Figures 24 and 25. The lowest densities occurred in 1999, 2002,
and 2004 – these are the same years that densities were lowest at Station 7 in Ikalukrok
Creek. The pattern between these two sites in terms of abundance and density is similar.
Aquatic Invertebrate Abundance, Ikalukrok Creek Upstream of Dudd Creek
242372
646
246
895
320
913
324
0200400600800
1000
1999 2000 2001 2002 2003 2004 2005 2006
Ave
rage
/Net
Figure 24. Aquatic invertebrate abundance, Ikalukrok Creek upstream of Dudd Creek.
Aquatic Invertebrate Density, Ikalukrok Creek Upstream of Dudd Creek
31.8
0.6
2.9
4.85.4
7.3
1.3
02468
10
1999 2000 2001 2002 2003 2004 2005 2006
Ave
rage
/m3
Figure 25. Aquatic invertebrate density, Ikalukrok Creek upstream of Dudd Creek.
19
Total aquatic taxa in Ikalukrok Creek upstream of Dudd Creek are reported in Figure 26.
Taxa richness is fairly consistent among sample years ranging from a low of 13 to a high
of 22 (Figure 26).
Aquatic Invertebrate Taxa Richness, Ikalukrok Creek Upstream of Dudd Creek
20 182113 16 16
1522
05
1015202530
1999 2000 2001 2002 2003 2004 2005 2006
Tota
l Tax
a
Figure 26. Aquatic invertebrate taxa richness, Ikalukrok Creek upstream of Dudd Creek.
The proportion of EPT in the aquatic invertebrate samples peaked in 2001 at 53% (Figure
27). Peak percent EPT at Station 7 in Ikalukrok Creek downstream of Dudd Creek also
was seen in 2001. In 5 out of 8 sample years, the percent EPT was between 20 and 28%.
Percent EPT, Ikalukrok Creek Upstream of Dudd Creek
12%26%
53%
20%21%
6%
20%28%
0%10%20%30%40%50%60%70%
1999 2000 2001 2002 2003 2004 2005 2006
Perc
ent
Figure 27. Percent EPT, Ikalukrok Creek upstream of Dudd Creek.
20
Periphyton Standing Crop
Algae biomass, as estimated by chlorophyll-a concentrations has been fairly consistent
over the sample years in Ikalukrok Creek upstream of Dudd Creek (Figure 28).
Chlorophyll-a, Ikalukrok Creek upstream of Dudd Creek
0
2
4
6
8
1999 2000 2001 2002 2003 2004 2005 2006
mg
chlo
ro-a
/m2
Figure 28. Average concentration of chlorophyll-a, plus and minus one standard deviation, Ikalukrok Creek upstream of Dudd Creek.
Biomonitoring Summary, Ikalukrok Creek Upstream of Dudd Creek
Table 5. Ikalukrok Creek, upstream of Dudd Creek, 1999 to 2006 ________________________________________________________________________ Water Quality TDS concentrations below 1,000 mg/L Median Cd and Zn concentrations lower than baseline Maximum Pb concentrations higher than baseline Invertebrates Abundance and density highly variable Taxa Richness, fairly consistent 1999 to 2006 % EPT, fairly consistent 5 out of 8 years Periphyton Fairly consistent in all sample years Larval Fish Arctic grayling in 2000, 2002, and 2003 Slimy sculpin in 2005 and 2006 ________________________________________________________________________
21
Ikalukrok Creek, Station 8
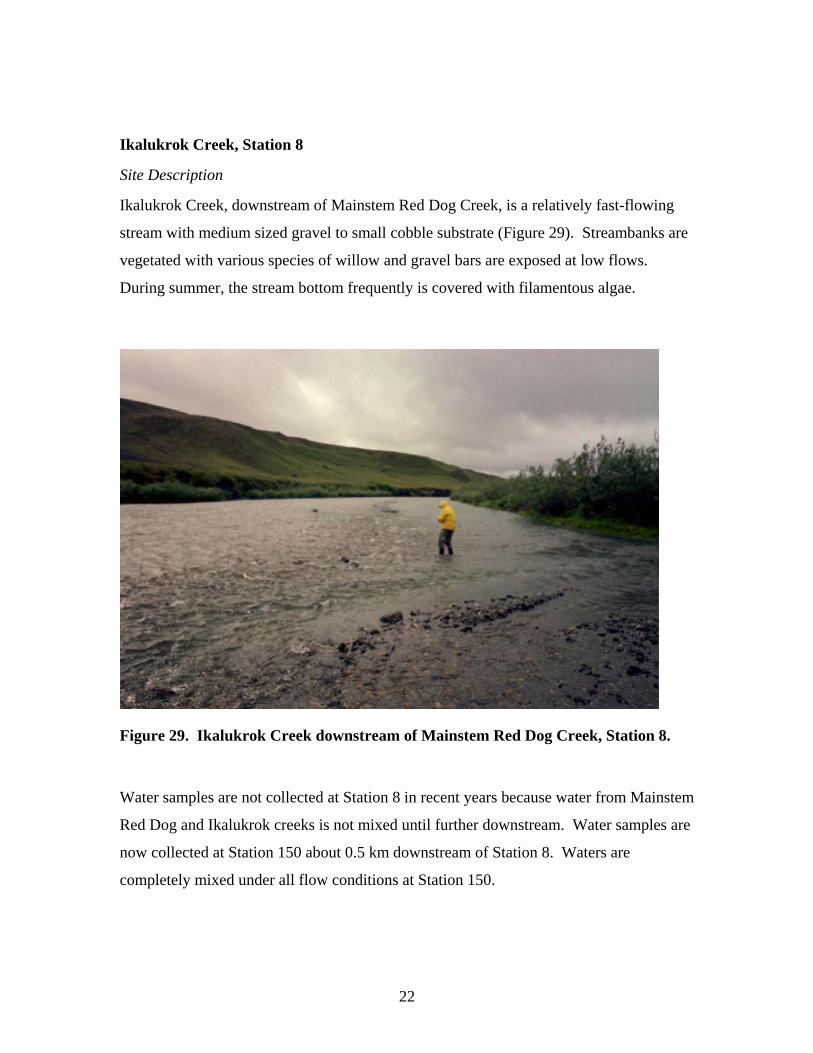
Site Description
Ikalukrok Creek, downstream of Mainstem Red Dog Creek, is a relatively fast-flowing
stream with medium sized gravel to small cobble substrate (Figure 29). Streambanks are
vegetated with various species of willow and gravel bars are exposed at low flows.
During summer, the stream bottom frequently is covered with filamentous algae.
Figure 29. Ikalukrok Creek downstream of Mainstem Red Dog Creek, Station 8.
Water samples are not collected at Station 8 in recent years because water from Mainstem
Red Dog and Ikalukrok creeks is not mixed until further downstream. Water samples are
now collected at Station 150 about 0.5 km downstream of Station 8. Waters are
completely mixed under all flow conditions at Station 150.
22
Invertebrate Community (Abundance, Density, Taxa Richness, and Structure)
Aquatic invertebrate abundance, density, taxa richness, and structure are presented in
Figures 30 through 34. Variability for both abundance and density among sample years
are high (Figures 30 and 31).
Aquatic Invertebrate Abundance, Ikalukrok Creek, Station 8
37 26
771
143 125
876
218
1280
0
500
1000
1500
1999 2000 2001 2002 2003 2004 2005 2006
Ave
rage
/Net
Figure 30. Aquatic invertebrate abundance, Ikalukrok Creek at Station 8.
Aquatic Invertebrate Density, Ikalukrok Creek, Station 8
0.7 0.3 1.3 0.5
6.21
2.543.2
9.9
-5
0
5
10
15
1999 2000 2001 2002 2003 2004 2005 2006
Ave
rage
/m3
Figure 31. Aquatic invertebrate density, Ikalukrok Creek at Station 8.
23
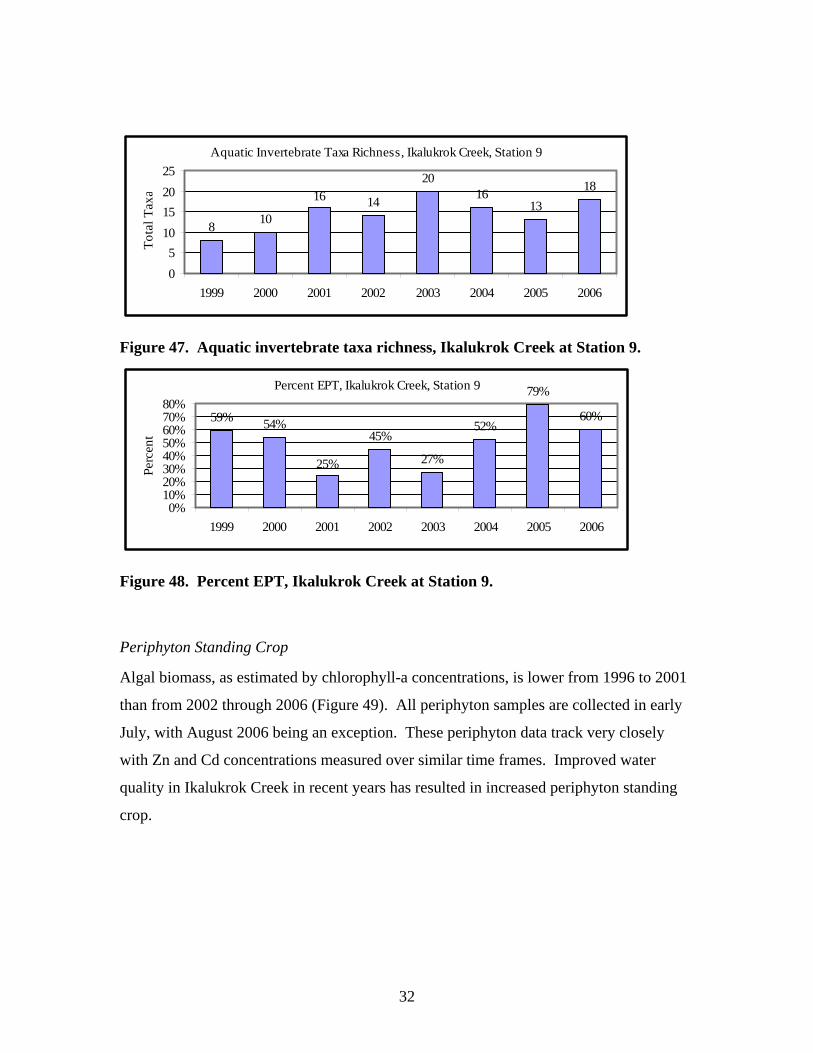
Total aquatic taxa present vary from a low of 10 to a high of 24 (Figure 32). Taxa
present generally have been higher the last four years (2003 to 2006). The proportion of
EPT in samples has been fairly consistent at Station 8 in Ikalukrok Creek and generally
as high or higher than the sites located downstream for the last three years (Figure 33).
Aquatic Invertebrate Taxa Richness, Ikalukrok Creek, Station 8
1310
22
1317
24 2424
05
1015202530
1999 2000 2001 2002 2003 2004 2005 2006
Tota
l Tax
a
Figure 32. Aquatic invertebrate taxa richness, Ikalukrok Creek at Station 8.
Percent EPT, Ikalukrok Creek, Station 8
24%35% 34% 38%
55% 60% 60%
23%
0%10%20%30%40%50%60%70%
1999 2000 2001 2002 2003 2004 2005 2006
Perc
ent
Figure 33. Percent EPT, Ikalukrok Creek at Station 8.
24
Periphyton Standing Crop
Algae biomass, as estimated by chlorophyll-a concentrations, has been consistent from
1999 through 2003, but higher from 2004 to 2006 (Figure 34).
Chlorophyll-a, Ikalukrok Creek, Station 8
0
5
10
15
1999 2000 2001 2002 2003 2004 2005 2006
mg
chlo
ro-a
/m2
Figure 34. Average concentration of chlorophyll-a, plus and minus one standard deviation, Ikalukrok Creek at Station 8.
Biomonitoring Summary, Station 8
Table 6. Ikalukrok Creek, Station 8, 1999 to 2006. ________________________________________________________________________ Water Quality Ikalukrok and Mainstem Red Dog creeks not mixed, no data presented Invertebrates Abundance and density highly variable Taxa Richness, higher in last four years (2003 to 2006) % EPT, higher in last three years (2004 to 2006) Periphyton Fairly consistent, but higher last three years (2004 to 2006) Larval Fish Arctic grayling in 2000 and 2002 ________________________________________________________________________
25
Ikalukrok Creek, Station 9
Site Description
Station 9 is located on Ikalukrok Creek upstream of the confluence with Mainstem Red
Dog Creek and near the US Geological Survey gauging station. Ikalukrok Creek, just
upstream of Mainstem Red Dog Creek, divides around a large partially vegetated island;
the right channel facing downstream carries most of the flow. The substrate consists of
gravel and cobble with some boulders with occasional side channels present (Figure 35).
Figure 35. Ikalukrok Creek upstream of Mainstem Red Dog Creek, Station 9.
Water Quality
Water quality at Station 9 is not affected by water discharged from the Red Dog water
treatment facility, but is affected by natural mineral seeps located upstream. Since our
fieldwork began in 1990, it was not until summer 1997 that we noticed visible effects to
26
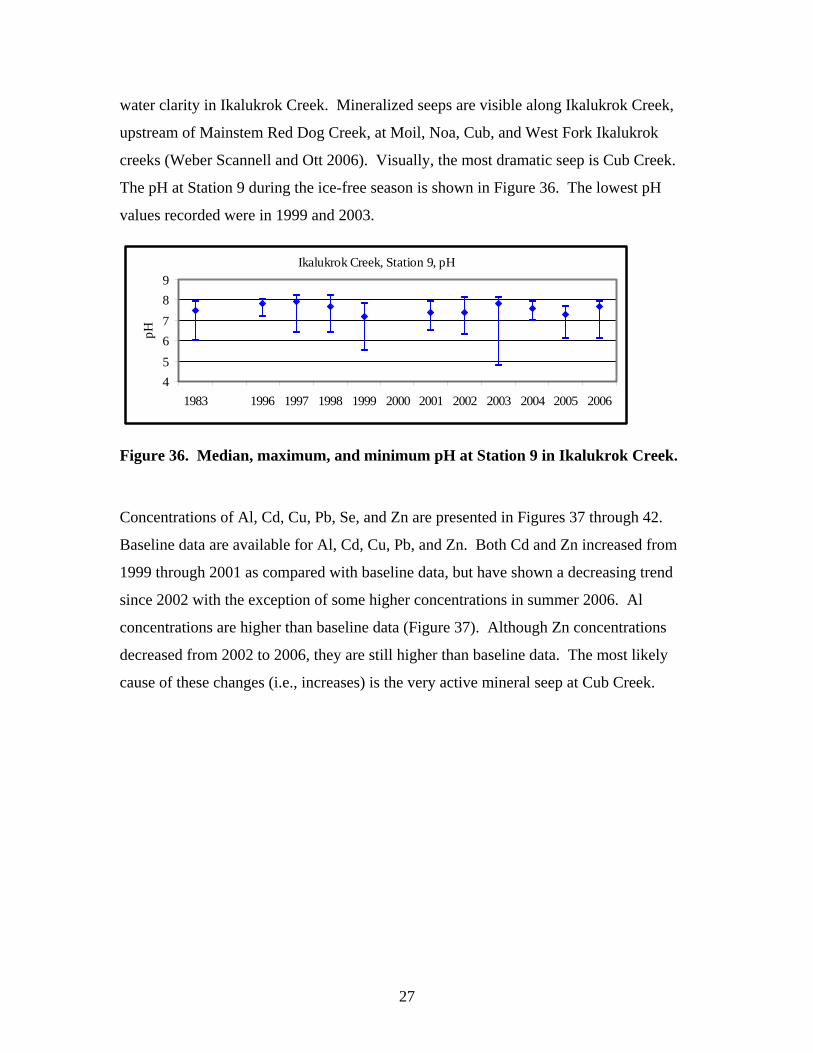
water clarity in Ikalukrok Creek. Mineralized seeps are visible along Ikalukrok Creek,
upstream of Mainstem Red Dog Creek, at Moil, Noa, Cub, and West Fork Ikalukrok
creeks (Weber Scannell and Ott 2006). Visually, the most dramatic seep is Cub Creek.
The pH at Station 9 during the ice-free season is shown in Figure 36. The lowest pH
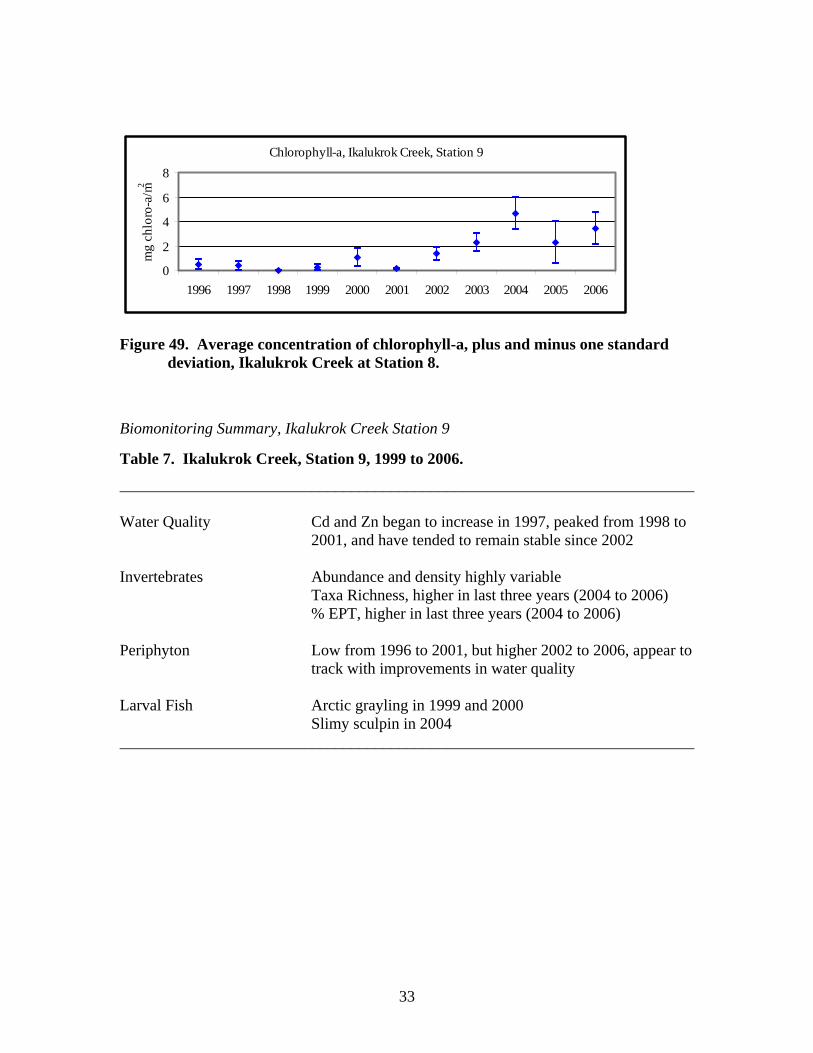
Figure 49. Average concentration of chlorophyll-a, plus and minus one standard deviation, Ikalukrok Creek at Station 8.
Biomonitoring Summary, Ikalukrok Creek Station 9
Table 7. Ikalukrok Creek, Station 9, 1999 to 2006.
________________________________________________________________________ Water Quality Cd and Zn began to increase in 1997, peaked from 1998 to 2001, and have tended to remain stable since 2002 Invertebrates Abundance and density highly variable Taxa Richness, higher in last three years (2004 to 2006) % EPT, higher in last three years (2004 to 2006) Periphyton Low from 1996 to 2001, but higher 2002 to 2006, appear to track with improvements in water quality Larval Fish Arctic grayling in 1999 and 2000 Slimy sculpin in 2004 ________________________________________________________________________
33
Mainstem Red Dog Creek, Station 10
Site Description
Mainstem Red Dog Creek varies in width from 3.5 to 18 m and water depths range from
0.06 to 2.5 m. The streambed consists mostly of gravel, small cobbles, and boulders
(Figure 50). The creek has some meanders and areas where the channel has shifted
location. Deep pools (>2 m) are found along cut banks with rock outcroppings. Dense
mats of filamentous green algae are common along reaches of the creek.
Figure 50. Mainstem Red Dog Creek, Station 10.
Water Quality
Discharge volume and quality from the water treatment system at Red Dog is regulated to
control the TDS concentrations in Mainstem Red Dog Creek. Concentrations of TDS
have been limited to 500 mg/L during Arctic grayling spawning in spring by permit
34
condition. However, a TDS site specific criterion (SSC) of 1,500 mg/L during Arctic
grayling spawning was made by ADEC and became effective on February 15, 2006. The
US Environmental Protection Agency approved the 1,500 mg/L TDS SSC on April 21,
2006. TDS concentrations at Station 10 in Mainstem Red Dog Creek during the 2006
discharge season are shown in Figure 51. TDS concentrations did not exceed the 1,500
mg/L SSC.
Mainstem Red Dog Creek, Station 10, TDS
0
500
1000
1500
5/11/2
006
5/25/2
006
6/8/20
06
6/22/2
006
7/6/20
06
7/20/2
006
8/3/20
06
8/17/2
006
8/31/2
006
9/14/2
006
9/28/2
006
10/12
/2006
mg
TDS/
L
Figure 51. TDS concentrations in Mainstem Red Dog Creek, Station 10.
Monitoring of the spring migration of adult Arctic grayling into Mainstem Red Dog and
North Fork Red Dog creeks continued in spring 2006 (Ott and Morris 2006a). Breakup
was late with a warming trend in late May, followed by cold weather and snow in early
June. Two fyke nets were fished in North Fork Red Dog Creek near Station 12. Angling
was used to capture Arctic grayling in North Fork Red Dog Creek downstream of the
fyke nets and in Mainstem Red Dog Creek. Turbidity and organic debris were high due
to extensive aufeis and associated erosion.
Fyke nets were set on June 11, but it was not until June 14 that we were able to extend
one of the net wings to block upstream movement of fish. Spent Arctic grayling females
were first caught on June 14. On June 15, 8 of 12 females handled were spent. On June
16, we caught 4 females (one spent, one had globby amorphous eggs, and two were either
non-spawners or fully recovered from spawning). We caught 12 Arctic grayling on June
17 (two males, 9 immature, and 1 female non-spawner or fully recovered).
35
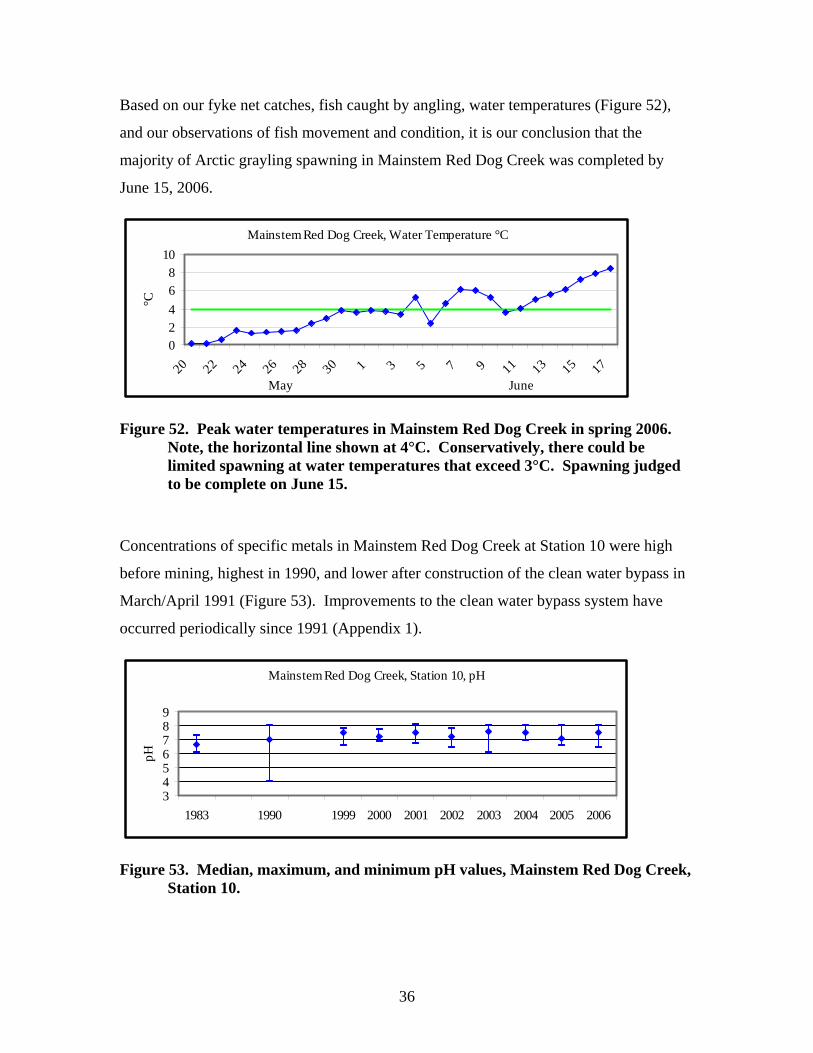
Based on our fyke net catches, fish caught by angling, water temperatures (Figure 52),
and our observations of fish movement and condition, it is our conclusion that the
majority of Arctic grayling spawning in Mainstem Red Dog Creek was completed by
June 15, 2006.
Mainstem Red Dog Creek, Water Temperature °C
02468
10
20 22 24 26 28 30 1 3 5 7 9 11 13 15 17May June
°C
Figure 52. Peak water temperatures in Mainstem Red Dog Creek in spring 2006. Note, the horizontal line shown at 4°C. Conservatively, there could be limited spawning at water temperatures that exceed 3°C. Spawning judged to be complete on June 15.
Concentrations of specific metals in Mainstem Red Dog Creek at Station 10 were high
before mining, highest in 1990, and lower after construction of the clean water bypass in
March/April 1991 (Figure 53). Improvements to the clean water bypass system have
occurred periodically since 1991 (Appendix 1).
Mainstem Red Dog Creek, Station 10, pH
3456789
1983 1990 1999 2000 2001 2002 2003 2004 2005 2006
pH
Figure 53. Median, maximum, and minimum pH values, Mainstem Red Dog Creek, Station 10.
36
Concentrations of Al, Cd, Cu, Pb, Se, and Zn are presented in Figures 54 through 59.
Median concentrations of Cd, Pb, and Zn are lower from 1999 through 2006 as compared
to baseline data. We see several peak Pb and Al concentrations that exceed baseline data.
Mainstem Red Dog Creek, Station 10, Aluminum
0
500
1000
1500
1983 1999 2000 2001 2002 2003 2004 2005 2006
ug
Al/L
Figure 54. Median, maximum, and minimum concentrations of Al at Station 10.
Mainstem Red Dog Creek, Station 10, Cadmium
0
50
100
150
1983 1999 2000 2001 2002 2003 2004 2005 2006
ug
Cd/
L
Figure 55. Median, maximum, and minimum concentrations of Cd at Station 10.
Mainstem Red Dog Creek, Station 10, Copper
0
510
15
20
1981-2 1999 2000 2001 2002 2003 2004 2005 2006
ug
Cu/
L
Figure 56. Median, maximum, and minimum concentrations of Cu at Station 10.
37
Mainstem Red Dog Creek, Station 10, Lead
0
100
200
300
400
1983 1999 2000 2001 2002 2003 2004 2005 2006
ug
Pb/L
Figure 57. Median, maximum, and minimum concentrations of Pb at Station 10.
Mainstem Red Dog Creek, Station 10, Selenium
012345
1999 2000 2001 2002 2003 2004 2005 2006
ug
Se/L
Figure 58. Median, maximum, and minimum concentrations of Se at Station 10.
Mainstem Red Dog Creek, Station 10, Zinc
0
5000
10000
15000
1983 1999 2000 2001 2002 2003 2004 2005 2006
ug
Zn/L
Figure 59. Median, maximum, and minimum concentrations of Zn at Station 9.
38
Invertebrate Community (Abundance, Density, Taxa Richness, and Structure)
Aquatic invertebrate abundance, density, taxa richness, and structure are presented in
Figures 60 through 63. High variability among years in abundance and density of aquatic
invertebrates is shown in Figures 60 and 61.
Aquatic Invertebrate Abundance, Mainstem Red Dog Creek, Station 10
22240
801
154
1101
85
575
282
0200400600800
10001200
1999 2000 2001 2002 2003 2004 2005 2006
Ave
rage
/Net
Figure 60. Aquatic invertebrate abundance, Mainstem Red Dog Creek at Station 10.
Aquatic Invertebrate Density, Mainstem Red Dog Creek, Station 10
0.6 0.3
3.44.3
8
33
1.3
02468
1012
1999 2000 2001 2002 2003 2004 2005 2006
Ave
rage
/m3
Figure 61. Aquatic invertebrate density, Mainstem Red Dog Creek at Station 10.
Taxa richness varied from a low of 10 in 2000 to a high of 20 in three different sample
years (Figure 62). Percent EPT in our samples was highly variable, with a high of 55%
in 2003 and a low of 5% in 2001 (Figure 63.
39
Aquatic Invertebrate Taxa Richness, Mainstem Red Dog Creek, Station 10
12 10
20
12
2017 15
20
05
10152025
1999 2000 2001 2002 2003 2004 2005 2006
Tota
l Tax
a
Figure 62. Aquatic invertebrate taxa richness, Mainstem Red Dog Creek at Station 10.
Percent EPT, Mainstem Red Dog Creek, Station 10
16%
43%
5%11%
55% 51%
17%
43%
0%10%20%30%40%50%60%70%
1999 2000 2001 2002 2003 2004 2005 2006
Perc
ent
Figure 63. Percent EPT, Mainstem Red Dog Creek at Station 10.
Periphyton Standing Crop
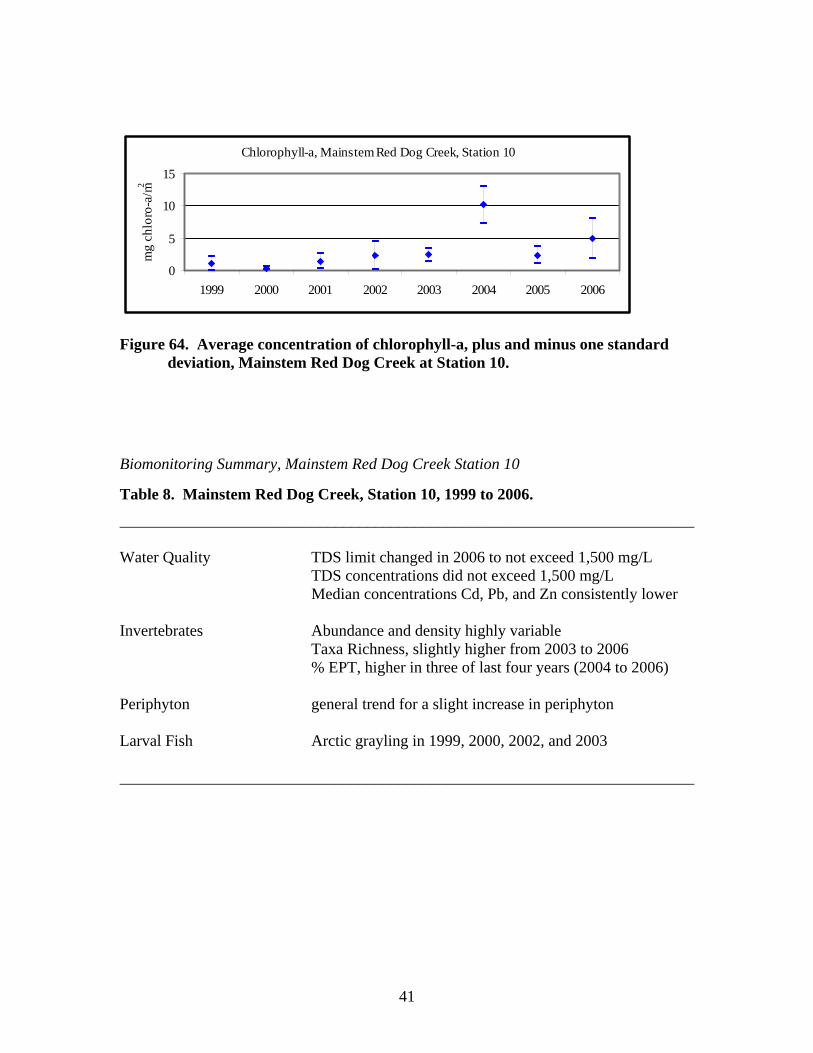
Algal biomass, as estimated by chlorophyll-a concentrations, is presented in Figure 64.
The highest periphyton standing crop measured from 1999 to 2006 was in 2004 when the
average concentration was 10.1 (Figure 64). There may be an indication that the trend
over time, within our sample period, has been for a slight increase in chlorophyll-a at
Station 10.
40
Chlorophyll-a, Mainstem Red Dog Creek, Station 10
0
5
10
15
1999 2000 2001 2002 2003 2004 2005 2006
mg
chlo
ro-a
/m2
Figure 64. Average concentration of chlorophyll-a, plus and minus one standard deviation, Mainstem Red Dog Creek at Station 10.
Biomonitoring Summary, Mainstem Red Dog Creek Station 10
Table 8. Mainstem Red Dog Creek, Station 10, 1999 to 2006. ________________________________________________________________________ Water Quality TDS limit changed in 2006 to not exceed 1,500 mg/L TDS concentrations did not exceed 1,500 mg/L Median concentrations Cd, Pb, and Zn consistently lower Invertebrates Abundance and density highly variable Taxa Richness, slightly higher from 2003 to 2006 % EPT, higher in three of last four years (2004 to 2006) Periphyton general trend for a slight increase in periphyton Larval Fish Arctic grayling in 1999, 2000, 2002, and 2003 ________________________________________________________________________
41
North Fork Red Dog Creek, Station 12
Site Description
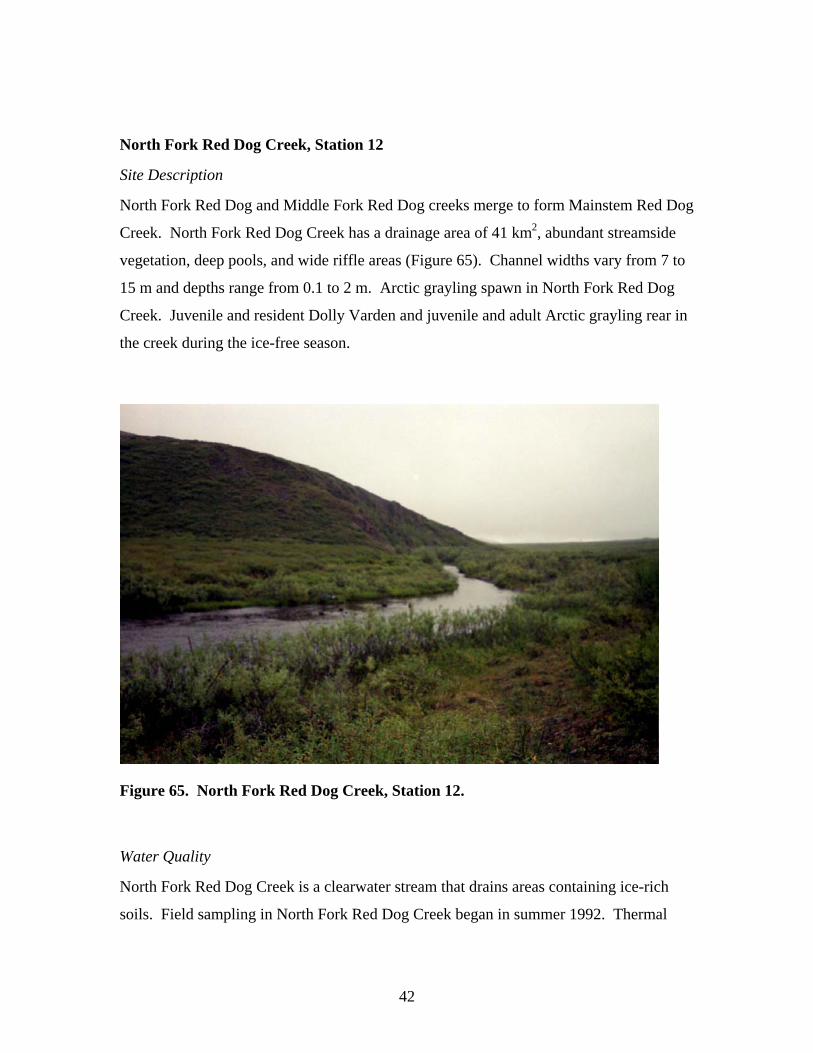
North Fork Red Dog and Middle Fork Red Dog creeks merge to form Mainstem Red Dog
Creek. North Fork Red Dog Creek has a drainage area of 41 km2, abundant streamside
vegetation, deep pools, and wide riffle areas (Figure 65). Channel widths vary from 7 to
15 m and depths range from 0.1 to 2 m. Arctic grayling spawn in North Fork Red Dog
Creek. Juvenile and resident Dolly Varden and juvenile and adult Arctic grayling rear in
the creek during the ice-free season.
Figure 65. North Fork Red Dog Creek, Station 12.
Water Quality
North Fork Red Dog Creek is a clearwater stream that drains areas containing ice-rich
soils. Field sampling in North Fork Red Dog Creek began in summer 1992. Thermal
42
degradation in the upper part of the drainage causing periodic increases in turbidity was
first seen in summer 2000. Turbid water conditions have been observed every year since
2000, but most times North Fork Red Dog Creek flows clear. Several years of total
suspended solids data are available (Figure 66). Generally, TDS concentrations are low,
but peaks are seen. The general trend appears to be for decreasing TDS concentrations in
the creek over time.
North Fork Red Dog Creek, Station 12, TSS
050
100150200250
2001 2002 2003 2004 2005 2006
mg/
L
Figure 66. Total suspended sediment in North Fork Red Dog Creek at Station 12.
Concentrations of Al, Cd, Cu, Pb, Se, and Zn are presented in Figures 67 through 72.
Maximum concentrations of Al and Pb have exceeded baseline data in some years, but
these peak concentrations may be related to sediment input from the upper part of the
basin. Median concentrations of Cd, Cu, and Pb appear slightly lower than baseline data.
North Fork Red Dog Creek, Station 12, Aluminum
0500
1000150020002500
1983 1999 2000 2001 2002 2003 2004 2005 2006
ug
Al/L
Figure 67. Median, maximum, and minimum concentrations of Al at Station 12.
43
North Fork Red Dog Creek, Station 12, Cadmium
05
10152025
1983 1999 2000 2001 2002 2003 2004 2005 2006
ug
Cd/
L
Figure 68. Median, maximum, and minimum concentrations of Cd at Station 12.
North Fork Red Dog Creek, Station 12, Copper
05
10152025
1983 1999 2000 2001 2002 2003 2004 2005 2006
ug
Cu/
L
Figure 69. Median, maximum, and minimum concentrations of Cu at Station 12.
North Fork Red Dog Creek, Station 12, Lead
05
10152025
1983 1999 2000 2001 2002 2003 2004 2005 2006
ug
Pb/L
Figure 70. Median, maximum, and minimum concentrations of Pb at Station 12.
44
North Fork Red Dog Creek, Station 12, Selenium
012345
1999 2000 2001 2002 2003 2004 2005 2006
ug
Se/L
Figure 71. Median, maximum, and minimum concentrations of Se at Station 12.
North Fork Red Dog Creek, Station 12, Zinc
0
100
200
300
400
1983 1999 2000 2001 2002 2003 2004 2005 2006
ug
Zn/L
Figure 72. Median, maximum, and minimum concentrations of Zn at Station 12.
45
Invertebrate Community (Abundance, Density, Taxa Richness, and Structure)
Aquatic invertebrate abundance, density, taxa richness, and structure are presented in
Figures 73 through 76. Invertebrate abundance in North Fork Red Dog Creek has ranged
from a low of 87 in 2004 to a high of 1,688 in 2006 (Figure 73). Density of aquatic
invertebrates also was highest in 2006 (Figure 74).
Aquatic Invertebrate Abundance, North Fork Red Dog Creek, Station 12
824497
1502
368
1165
87
575
1688
0
500
1000
1500
2000
1999 2000 2001 2002 2003 2004 2005 2006
Ave
rage
/Net
Figure 73. Aquatic invertebrate abundance, North Fork Red Dog Creek at Station 12.
Aquatic Invertebrate Density, North Fork Red Dog Creek, Station 12
05
1015202530
1999 2000 2001 2002 2003 2004 2005 2006
Ave
rage
/m3
Figure 74. Aquatic invertebrate density, North Fork Red Dog Creek at Station 12.
Taxa richness has been fairly consistent among sample years in North Fork Red Dog
Creek (Figure 75). Percent EPT in aquatic samples also has varied among the sample
years, but is trending upward with time (Figure 76).
46
Aquatic Invertebrate Taxa Richness, North Fork Red Dog Creek, Station 12
14 1318 17
26
19 2115
05
1015202530
1999 2000 2001 2002 2003 2004 2005 2006
Tota
l Tax
a
Figure 75. Aquatic invertebrate taxa richness, North Fork Red Dog Creek at Station 12.
Percent EPT, North Fork Red Dog Creek, Station 12
11%23%
9%
57%
23%35%
53%50%
0%10%20%30%40%50%60%
1999 2000 2001 2002 2003 2004 2005 2006
Perc
ent
Figure 76. Percent EPT, North Fork Red Dog Creek at Station 12
Periphyton Standing Crop
Algae biomass, as estimated by chlorophyll-a concentrations is presented in Figure 77.
Abundant algae is present every year, except summer 2004 (Figure 77). It is worth
noting that abundance and density of aquatic invertebrates also was the lowest measured
in 2004. In 2004, streambed materials were more heavily covered with sediment than in
other sample years.
47
Chlorophyll-a, North Fork Red Dog Creek, Station 12
02468
10
1999 2000 2001 2002 2003 2004 2005 2006
mg
chlo
ro-a
/m2
Figure 77. Average concentration of chlorophyll-a, plus and minus one standard deviation, North Fork Red Dog Creek at Station 12.
Biomonitoring Summary, North Fork Red Dog Creek Station 12
Table 9. North Fork Red Dog Creek, Station 12, 1999 to 2006
________________________________________________________________________ Water Quality Turbid water conditions first observed in 2000 Peak Al and Pb concentrations higher than baseline data Median concentrations of Cd, Cu, and Pb slightly lower Invertebrates Abundance is highly variable among sample years Density, higher than other sample sites in all but one year Taxa richness is fairly consistent %EPT, slight trend upwards with time Periphyton Fairly consistent in most years, except low in 2004 Larval Fish Arctic grayling in 1997, 1999, 2000, and 2001 ________________________________________________________________________
48
Middle Fork Red Dog Creek
Site Description
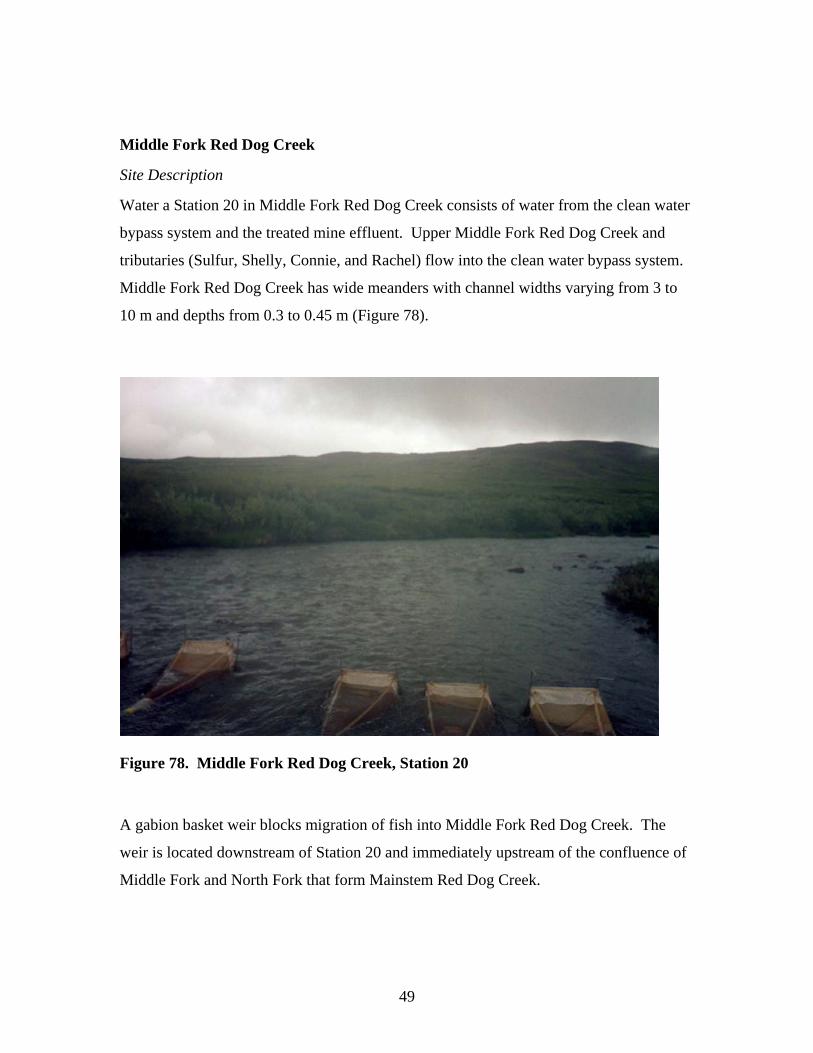
Water a Station 20 in Middle Fork Red Dog Creek consists of water from the clean water
bypass system and the treated mine effluent. Upper Middle Fork Red Dog Creek and
tributaries (Sulfur, Shelly, Connie, and Rachel) flow into the clean water bypass system.
Middle Fork Red Dog Creek has wide meanders with channel widths varying from 3 to
10 m and depths from 0.3 to 0.45 m (Figure 78).
Figure 78. Middle Fork Red Dog Creek, Station 20
A gabion basket weir blocks migration of fish into Middle Fork Red Dog Creek. The
weir is located downstream of Station 20 and immediately upstream of the confluence of
Middle Fork and North Fork that form Mainstem Red Dog Creek.
49
Water Quality
Before mining, the pH ranged from 5.7 to 6.9 in Middle Fork Red Dog Creek (Figure 79).
The pH values from 2000 through 2006 are higher than pre-mining. The higher pH
values are related to a higher pH in the wastewater mine effluent and higher pH values in
the clean water bypass due to interception of highly acidic waters by the dirty water
collection system that are then pumped to the tailing facility.
Middle Fork Red Dog Creek, Station 20, pH
456789
10
1982 1999 2000 2001 2002 2003 2004 2005 2006
pH
Figure 79. Median, maximum, and minimum pH at Station 20 in Middle Fork Red Dog Creek.
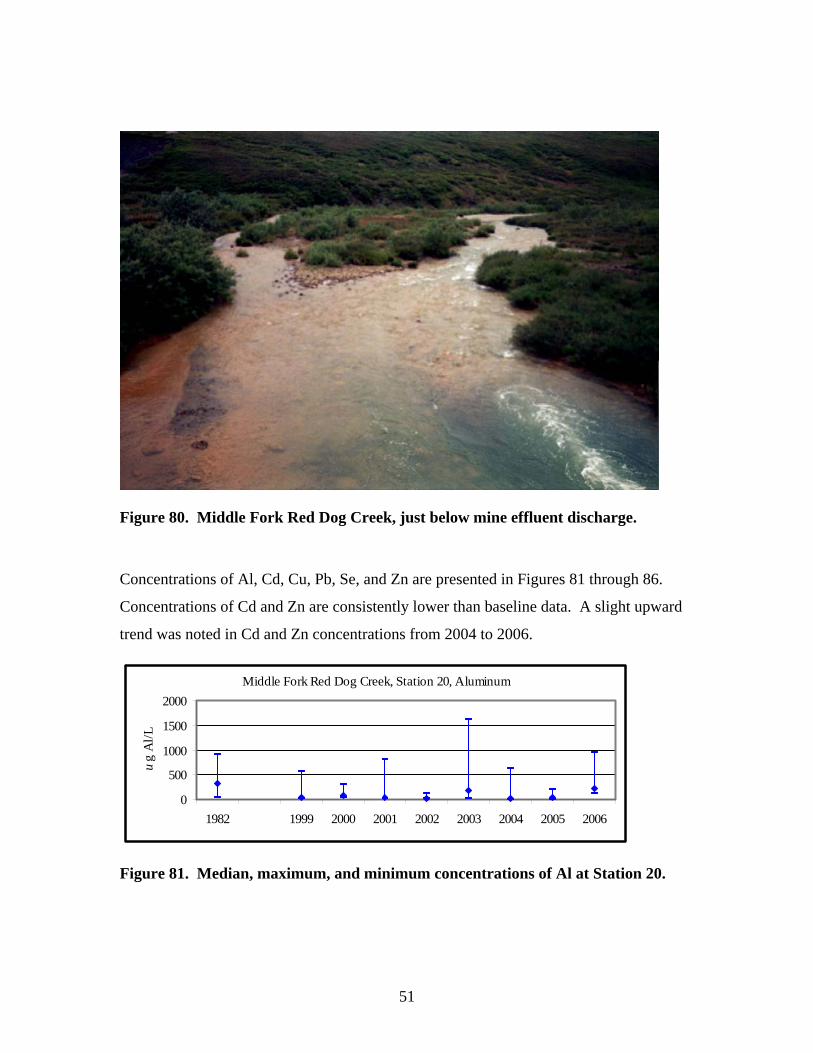
During our August 2006 Red Dog field trip, we observed a substantial amount of
precipitate (orange colored) and the water quality was opaque (Ott and Timothy 2006)
(Figure 80). The orange colored precipitate extended downstream of the effluent
discharge point for at least 1 km. The orange precipitate continued to be present
upstream of the discharge point. On August 9, 2006, we drove up the clean water bypass
access road and observed the following conditions: Sulfur Creek was clear; Shelly Creek
was clear; Connie Creek was orange; Rachel Creek was orange/yellow; and Middle Fork
Red Dog Creek upstream of the bypass was clear. TCAK proceeded to collect water
samples from these tributaries in the vicinity of the clean water bypass.
50
Figure 80. Middle Fork Red Dog Creek, just below mine effluent discharge.
Concentrations of Al, Cd, Cu, Pb, Se, and Zn are presented in Figures 81 through 86.
Concentrations of Cd and Zn are consistently lower than baseline data. A slight upward
trend was noted in Cd and Zn concentrations from 2004 to 2006.
Middle Fork Red Dog Creek, Station 20, Aluminum
0
500
1000
1500
2000
1982 1999 2000 2001 2002 2003 2004 2005 2006
ug
Al/L
Figure 81. Median, maximum, and minimum concentrations of Al at Station 20.
51
Middle Fork Red Dog Creek, Station 20, Cadmium
0
50
100
150
1982 1999 2000 2001 2002 2003 2004 2005 2006
ug
Cd/
L
Figure 82. Median, maximum, and minimum concentrations of Cd at Station 20.
Middle Fork Red Dog Creek, Station 20, Copper
0
10
20
30
40
1982 1999 2000 2001 2002 2003 2004 2005 2006
ug
Cu/
L
Figure 83. Median, maximum, and minimum concentrations of Cu at Station 20.
Middle Fork Red Dog Creek, Station 20, Lead
0200400600800
10001200
1982 1999 2000 2001 2002 2003 2004 2005 2006
ug
Pb/L
Figure 84. Median, maximum, and minimum concentrations of Pb at Station 20.
52
Middle Fork Red Dog Creek, Station 20, Selenium
0123456
1999 2000 2001 2002 2003 2004 2005 2006
ug
Se/L
Figure 85. Median, maximum, and minimum concentrations of Se at Station 20.
Middle Fork Red Dog Creek, Station 20, Zinc
0
5000
10000
15000
20000
1982 1999 2000 2001 2002 2003 2004 2005 2006
ug
Zn/L
Figure 86. Median, maximum, and minimum concentrations of Zn at Station 20.
Invertebrate Community (Abundance, Density, Taxa Richness, and Structure)
Aquatic invertebrate abundance, density, taxa richness, and structure are presented in
Figures 87 through 90. Abundance and density of aquatic invertebrates exhibits high
variability among sample years (Figures 87 and 88). Densities of aquatic invertebrates
generally are much lower here than in North Fork Red Dog Creek, but comparable with
Mainstem Red Dog Creek at Station 10. Total aquatic taxa ranged from 14 to 28 from
1999 to 2006. Percent EPT was highest in 2004 and 2006 – although the percentage is
higher, the abundance and density of all aquatic invertebrates was very low.
53
Aquatic Invertebrate Abundance, Middle Fork Red Dog Creek, Station 20
12672
284162
544
157
339
270
100200300400500600
1999 2000 2001 2002 2003 2004 2005 2006
Ave
rage
/Net
Figure 87. Aquatic invertebrate abundance, Middle Fork Red Dog Creek at Station 20.
Aquatic Invertebrate Density, Middle Fork Red Dog Creek, Station 20
0.71.5 0.9 0.4
5.63.9
2.61.7
0
2
4
6
8
1999 2000 2001 2002 2003 2004 2005 2006
Ave
rage
/m3
Figure 88. Aquatic invertebrate density, Middle Fork Red Dog Creek at Station 20.
Aquatic Invertebrate Taxa Richness, Middle Fork Red Dog Creek, Station 20
14 1620
16
2823
2016
05
101520253035
1999 2000 2001 2002 2003 2004 2005 2006
Tota
l Tax
a
Figure 89. Aquatic invertebrate taxa richness, Middle Fork Red Dog Creek at Station 20.
54
Percent EPT, Middle Fork Red Dog Creek, Station 20
10% 7%
20%15%
7%
21%
60%52%
0%10%20%30%40%50%60%
1999 2000 2001 2002 2003 2004 2005 2006
Perc
ent
Figure 90. Percent EPT, Middle Fork Red Dog Creek at Station 20.
Periphton Standing Crop
Algae biomass, as estimated by chlorophyll-a concentration, is presented in Figure 91.
Chlorophyll-a at Station 20 is consistently low and lower than measurements made at all
the other NPDES sample sites. Generally, chlorophyll-a in Middle Fork Red Dog Creek
is below detection limits.
Chlorophyll-a, Middle Fork Red Dog Creek, Station 20
0
0.2
0.4
0.6
0.8
1999 2000 2001 2002 2003 2004 2005 2006
mg
chlo
ro-a
/m2
Figure 91. Average concentration of chlorophyll-a, plus and minus one standard deviation, Middle Fork Red Dog Creek at Station 20.
55
Biomonitoring Summary, Middle Fork Red Dog Creek Station 20
Table 10. Middle Fork Red Dog Creek, Station 20, 1999 to 2006
________________________________________________________________________ Water Quality pH values higher than pre-mining Cd and Zn concentrations lower than pre-mining Slight upward trend in Cd and Zn from 2004 to 2006 Invertebrates Abundance is highly variable among sample years Density, generally much lower than other sites Taxa richness highly variable, appears to be decreasing %EPT higher in 2004 and 2006 Periphyton very low, all years Larval Fish none ________________________________________________________________________
56
Middle Fork Red Dog Creek, Station 140
Site Description
Station 140 is located in Middle Fork Red Dog Creek downstream of clean water bypass
and upstream of the discharge point at outfall 001. Fish, invertebrate, and periphyton
sampling are not done at this site, but water quality data are collected. The pH for
Middle Fork Red Dog Creek is presented in Figure 92. The pH values are consistently
higher at Station 140 as compared to pre-mining conditions, except in 2006 when a pH of
5.7 was recorded.
Middle Fork Red Dog Creek, Station 140, pH
5
6
7
8
9
1983 2000 2001 2002 2003 2004 2005 2006
pH
Figure 92. Median, maximum, and minimum pH at Station 140 in Middle Fork Red Dog Creek.
Concentrations of Cd, Pb, and Zn are presented in Figures 93 through 95. These analytes
were selected because pre-mining data are available. Median concentrations of Cd, Pb,
and Zn at Station 140 are consistently lower (1999 through 2006) than pre-mining,
indicating that the clean water bypass system is working to reduce loading of metals.
However, peaks in Cd and Zn during 2006 exceeded those reported in baseline data.
57
Middle Fork Red Dog Creek, Station 140, Cadmium
050
100150200250300
1983 1999 2000 2001 2002 2003 2004 2005 2006
ug
Cd/
L
Figure 93. Median, maximum, and minimum concentrations of Cd at Station 140.
Middle Fork Red Dog Creek, Station 140, Lead
0
500
1000
1500
2000
1983 1999 2000 2001 2002 2003 2004 2005 2006
ug
Pb/L
Figure 94. Median, maximum, and minimum concentrations of Pb at Station 140.
Middle Fork Red Dog Creek, Station 140, Zinc
05000
100001500020000250003000035000
1983 1999 2000 2001 2002 2003 2004 2005 2006
ug
Zn/L
Figure 95. Median, maximum, and minimum concentrations of Zn at Station 140.
58
Metals concentrations in Adult Dolly Varden, Wulik River
Since 1990, we have sampled adult Dolly Varden from the Wulik River at Station 2 near
Tutak Creek for metals concentrations (Al, Cd, Cu, Pb, and Zn) in gill, kidney, liver, and
muscle tissue (Weber Scannell et al. 2000). In 1997, we added Se and in 1998 we started
sampling reproductive tissues, when available. In 2003, we added Hg and Ca to the
analytes being tested. In 2004, 2005, and 2006, Dolly Varden tissues were analyzed for
Al, Cd, Cu, Pb, Se, Zn, and Hg. The number of fish in each sample period is 6, except
for fall 2002 when only 5 fish were caught.
The purpose of sampling adult Dolly Varden for metals concentrations is to monitor
long-term condition of fish over the life of the mine and to identify changes in metals
concentrations that may be related to mining activities. All laboratory work has been
done with Level III Quality Assurance.
Metals are know to concentrate preferentially in certain organs; however, the relationship
of organ concentration of metals to ambient environmental concentrations is unknown.
Concentrations of metals vary with season, age, size, weight, and feeding habits of fish
(Jenkins 1980) and in the case of anadromous Dolly Varden, the metals vary with
exposure to freshwater and marine environments. Our data from the Wulik River suggest
the following:
●Al concentrates in gill tissue (Figure 96); ●Cd concentrates in kidney tissue (Figure 97); ●Cu concentrates in liver tissue (Figure 98); ●Pb concentrates in gill tissue (Figure 99) ●Se concentrates in kidney and ovarian tissue (Figure 100); ●Zn concentrates in ovarian tissue (Figure 101); ●Hg concentrates in kidney tissue (Figure 102); ●none of the analytes concentrate in muscle tissue
59
Aluminum Dolly Varden
0
50
100
150
gills (n=97) muscle(n=96)
liver (n=96) kidney(n=96)
eggs (n=45) gonads(n=13)
mg
Al/K
g288
Figure 96. Average Al concentrations of all fish collected from 1999 to 2006, plus and minus one standard deviation.
Cadmium Dolly Varden
00.5
11.5
22.5
gills (n=96) muscle(n=96)
liver (n=96) kidney(n=96)
eggs (n=42) gonads(n=11)
mg
Cd/
Kg
Figure 97. Average Cd concentrations of all fish collected from 1999 to 2006, plus and minus one standard deviation.
Copper Dolly Varden
020406080
gills (n=96) muscle(n=96)
liver (n=96) kidney(n=96)
eggs (n=47) gonads(n=13)
mg
Cu/
Kg
Figure 98. Average Cu concentrations of all fish collected from 1999 to 2006, plus and minus one standard deviation.
60
Lead Dolly Varden
00.20.40.60.8
gills (n=97) muscle(n=96)
liver (n=96) kidney(n=96)
eggs (n=45) gonads(n=12)
mg
Pb/K
g
Figure 99. Average Pb concentrations of all fish collected from 1999 to 2006, plus and minus one standard deviation.
Selenium Dolly Varden
0
5
10
15
gills (n=97) muscle(n=96)
liver (n=96) kidney(n=96)
eggs (n=51) gonads(n=18)
mg
Se/K
g
Figure 100. Average Se concentrations of all fish collected from 1999 to 2006, plus and minus one standard deviation.
Zinc Dolly Varden
0100200300400500600
gills (n=96) muscle(n=96)
liver (n=96) kidney(n=96)
eggs (n=46) gonads(n=13)
mg
Zn/K
g
Figure 101. Average Zn concentrations of all fish collected from 1999 to 2006, plus and minus one standard deviation.
61
Mercury Dolly Varden
00.020.040.060.080.1
gills (n=48) muscle(n=48)
liver (n=48) kidney(n=48)
eggs (n=28) gonads(n=3)
mg
Hg/
Kg
Figure 102. Average Hg concentrations of all fish collected from 1999 to 2006, plus and minus one standard deviation.
Aluminum
Median concentrations of Al in gill tissue are highly variable within samples and between
the spring and fall sample events (Figure 103). No real pattern or trend appears to exist
for Al in gill tissue, other than the fact that it is highly variable.
Dolly Varden Gill Tissue, Aluminum
0
200400
600
800
spring
99fal
l 99
spring
00fal
l 00
spring
01fal
l 01
spring
02fal
l 02
spring
03fal
l 03
spring
04fal
l 04
spring
05fal
l 05
spring
06fal
l 06
mg
Al/K
g
1310
Figure 103. Median, maximum, and minimum concentrations of Al (dry weight) in Dolly Varden gill tissue (1999 to 2006). No baseline data for Al exists.
62
Cadmium
Median Cd concentrations in Dolly Varden kidney tissue from 1999 to 2006, both spring
and fall, are lower than baseline data (Figure 104). Fall-caught fish generally have lower
Cd concentrations than spring-caught fish. Over the last three years, Cd concentrations
have been stable and lower than those reported previously.
Dolly Varden Kidney Tissue, Cadmium
0123456
1982
n=4
spring
99fal
l 99
spring
00fal
l 00
spring
01fal
l 01
spring
02fal
l 02
spring
03fal
l 03
spring
04fal
l 04
spring
05fal
l 05
spring
06fal
l 06
mg
Cd/
Kg
Figure 104. Median, maximum, and minimum concentrations of Cd (dry weight) in Dolly Varden kidney tissue (1982 and 1999 to 2006).
Copper
Median copper concentrations in liver tissue are consistently higher than baseline data
(Figure 105). Spring-caught fish generally are higher in Cu than fall-caught fish.
Dolly Varden Liver Tissue, Copper
0255075
100125150
1982
n=5
spring
99fal
l 99
spring
00fal
l 00
spring
01fal
l 01
spring
02fal
l 02
spring
03fal
l 03
spring
04fal
l 04
spring
05fal
l 05
spring
06fal
l 06
mg
Cu/
Kg
Figure 105. Median, maximum, and minimum concentrations of Cu (dry weight) in Dolly Varden liver tissue (1982 and 1999 to 2006).
63
Lead
The concentration of Pb in Dolly Varden gill tissue from fish collected prior to mining
was below the detection limits (0.03 or 0.04 mg/Kg). Median concentrations of Pb in gill
tissue are higher than those reported in baseline data (Figure 106).
Dolly Varden Gill Tissue, Lead
00.250.5
0.751
1.251.5
1982
n=5
spring
99fal
l 99
spring
00fal
l 00
spring
01fal
l 01
spring
02fal
l 02
spring
03fal
l 03
spring
04fal
l 04
spring
05fal
l 05
spring
06fal
l 06
mg
Pb/K
g
3.1
Figure 106. Median, maximum, and minimum concentrations of Pb (dry weight) in Dolly Varden gill tissue (1982 and 1999 to 2006).
Selenium
Median Se concentrations in ovarian tissue are consistently higher in fall-caught fish
(Figure 107). Highest Se concentrations occurred in fall 2002 and fall 2005.
Dolly Varden Ovary Tissue, Selenium
05
10152025
sprin
g 99 n=
2
fall 9
9 n=3
fall 0
0 n=4
sprin
g 01 n=
4
fall 0
1 n=1
sprin
g 02 n=4
fall 0
2 n=4
sprin
g 03 n=2
fall 0
3 n=3
sprin
g 04 n
=3
fall 0
4 n=4
sprin
g 05 n=5
fall 0
5 n=4
sprin
g 06 n=
3
fall 0
6 n=4
mg
Se/K
g
Figure 107. Median, maximum, and minimum concentrations of Se (dry weight) in Dolly Varden ovary tissue (1999 to 2006). No baseline data for Se exists.
64
Zinc
Median Zn concentrations in ovarian tissue have remained fairly consistent during the
sample period (Figure 108). Generally, except for 2006, Zn concentrations are higher in
fall-caught fish.
Dolly Varden Ovary Tissue, Zinc
0200400600800
1000
fall 0
0 n=4
spring
01 n=
4
fall 0
1 n=1
spring
02 n=
4
fall 0
2 n=5
spring
03 n=
2
fall 0
3 n=3
spring
04 n=
3
fall 0
4 n=4
spring
05 n=
5
fall 0
5 n=4
spring
06 n=
3
fall 0
6 n=4
mg
Zn/K
g
Figure 108. Median, maximum, and minimum concentrations of Zn (dry weight) in Dolly Varden ovary tissue (1999 to 2006). No baseline data for Zn exists.
Mercury
Generally, the concentrations of Hg in all tissues, except kidney, are at or below the
detection limit of 0.02 mg/Kg. Hg concentrations in kidney tissue are similar from 2003
to 2006 (Figure 109).
Dolly Varden Kidney Tissue, Mercury
00.020.040.060.080.1
0.120.14
spring 03n=6
fall 03n=6
spring 04n=6
fall 04n=6
spring 05n=6
fall 05n=6
spring 06n=3
fall 06n=4
mg
Hg/
Kg
Figure 109. Median, maximum, and minimum concentrations of Hg (dry weight) in Dolly Varden kidney tissue (2003 to 2006). No baseline data for Hg exists.
65
Distribution of Fish Overwintering Dolly Varden
The Dolly Varden fall aerial survey in the Wulik River was conducted on October 5,
2006. Overall survey conditions were adequate, but not great. There was a west wind
near the coast that resulted in chop on the water, but the sky was clear. About halfway
through the survey it became overcast (DeCicco 2006). There appeared to be very few
small Dolly Varden on October 5, 2006 – normally there are large schools of small Dolly
Varden (1st year migrants 250 to 325 mm long). DeCicco’s 2006 estimate should be
considered to be the minimum number of fish present.
Number of Dolly Varden estimated in fall in the Wulik River varies annually (Figure
110, Appendix 2). Surveys conducted through fall 2006, suggest that over 90% of the
Dolly Varden are seen downstream of Ikalukrok Creek. Only in 2004 was the percent of
fish below Ikalukrok Creek less than 90% and as DeCicco (2004) stated, conditions for
aerial observations in the lower river in fall 2004 were poor due to overcast skies.
Estimated Dolly Varden
0
50000
100000
150000
1979
1981
1984
1988
1991
1993
1995
1997
1999
2002
2005
before mining during mining
Num
ber o
f Fis
h
downstreamupstream
Figure 110. The number of Dolly Varden estimated in the Wulik River.
66
Chum Salmon
ADNR conducts annual surveys to assess the distribution of adult chum salmon in
Ikalukrok Creek from its mouth (i.e., confluence with Wulik River) upstream to Dudd
Creek (Table 11 and Appendix 3). In fall 2006, we flew one helicopter survey along
Ikalukrok Creek from its mouth to its confluence with Dudd Creek. The survey was
conducted under partly cloudy skies, mild winds, and overall conditions were judged to
be good (Ott and Timothy 2006). Water levels were not high, but there was a slight off-
color to the water in the deeper reaches of the creek. Our estimate should be viewed as
the minimum number present as more fish were likely present than counted. Spawning
chum salmon were seen along the entire length of Ikalukrok Creek until about 8 km
downstream of Station 160 where few, if any chum salmon were seen. Our total count of
chum salmon was 4,185 – the highest number estimated since our surveys began in 1990.
Dead, spawned-out, chum salmon also were seen, but we estimated that these represented
less than 5% of the fish observed. No chinook salmon were observed in Ikalukrok Creek
or in a slough (N 67.56.45 W 163.24.91) where 56 spawners were seen in fall 2004.
Counts of chum salmon in Ikalukrok Creek after mine development in 1990 and 1991
were lower than reported in baseline studies. Surveys began again in 1995, with the
highest return of chum salmon seen in fall 2006. The most chinook salmon observed
during surveys was in fall 2004 and most of these fish were in a side slough of Ikalukrok
Creek. Large returns of chum salmon in recent years, particularly 2001, 2002, and 2006,
are good indications that the population has recovered from the low counts made in the
early 1990s.
67
Table 11. Number of chum salmon adults in Ikalukrok Creek. ________________________________________________________________________ Number of Survey Time Chum Salmon Reference ________________________________________________________________________ September 1981 3,520 to 6,960 Houghton and Hilgert 1983 August September 1982 353 to 1,400 Houghton and Hilgert 1983 August 1984 994 DeCicco 1990b August 1986 1,985 DeCicco 1990b August 1990 <70 Ott et al. 1992 August 1991 <70 Ott et al. 1992 August 16, 1995 49 Townsend and Lunderstadt 1995 August 1995 300 to 400 DeCicco 1995 August 11, 1996 180 Townsend and Hemming 1996 August 12, 1997 730 to 780 Ott and Simpers 1997 1998 no survey August 9, 1999 75 Ott and Morris 1999 2000 no survey August 7, 2001 850 Morris and Ott 2001 August 28, 2001 2,250 DeCicco 2001b August 29, 2001 1,836 DeCicco 2001b September 23, 2001 500 DeCicco 2001c October 8, 2001 232 DeCicco 2001a August 5, 2002 890 Ott and Townsend 2002 August 11, 2003 218 Townsend and Ingalls 2003 August 26, 2004 405 Townsend and Conley 2004 August 29, 2005 350 Thompson 2005 August 14, 2006 4,185 Ott and Timothy 2006 ________________________________________________________________________
68
Dolly Varden
Limited pre-mining juvenile Dolly Varden distribution and use data are available for
most of the streams in the vicinity of the Red Dog Mine, including Ikalukrok,
Evaingiknuk, Buddy, Mainstem Red Dog, and North Fork Red Dog creeks. In the early
1990s, we found the highest use by juvenile Dolly Varden occurred in Anxiety Ridge
Creek. Anxiety Ridge Creek was identified as the most productive stream system in the
project area by Houghton and Hilgert (1983). Buddy Creek, downstream of the falls
located below the haul road, was, however, not sampled during pre-mining site
investigations.
We have conducted annual sampling of juvenile Dolly Varden in Evaingiknuk, Anxiety
Ridge, and Ikalukrok creeks since 1990 to assess seasonal patterns of fish use. Since
1990, we have added new sample sites and increased the number of minnow traps per
sample site. Currently, we sample ten sites, as listed in Table 12 (Appendix 4) using ten
minnow traps per sample reach with a fishing time of 24 hours.
Table 12. Location of juvenile Dolly Varden sample sites. ________________________________________________________________________
Site Name Station No. Year Sampling Started ________________________________________________________________________ Evaingiknuk Creek 1990 Anxiety Ridge Creek 1990 Buddy Creek 1996 North Fork Red Dog Creek 12 1993 Mainstem Red Dog Creek 11 1995 Mainstem Red Dog Creek 10 1996 Ikalukrok Creek above Mainstem 9 1996 Ikalukrok Creek below Mainstem 8 1996 Ikalukrok Creek above Dudd 1990 Ikalukrok Creek below Dudd 7 1990 ________________________________________________________________________
69
Relative abundance (i.e., catches) of juvenile Dolly Varden varies considerably among
sample years (Figures 111 and 112). Natural environmental conditions such as duration
of breakup, patterns and magnitude of rainfall events, and ambient temperature affect
distribution of juveniles during the ice-free season. Perhaps the most substantial variable
affecting abundance is the number of age 1 fish present from the previous years spawning
population. Consecutive years of good recruitment of age 1 fish lead to high catches of
Dolly Varden followed by a substantial decrease in numbers when fish outmigrate as
Figure 111. Number of Dolly Varden in Anxiety Ridge Creek. Sample method ten minnow traps each year with a sample time in late July to late August of each year.
Figure 112. Number of Dolly Varden in Buddy Creek. Sample method ten minnow traps each year with a sample time in late July to late August of each year.
70
Juvenile Dolly Varden are most abundant in our Red Dog sample sites from late July to
mid-August. Generally, abundance is higher in the upper portion of each stream and
peak usage continues until the onset of freezing conditions when most fish outmigrate to
overwintering areas. Catches of Dolly Varden in the early 1990s, when sampling
occurred from spring through late fall, were very low in spring, peaked in the fall, and
then decreased as freezeup approached. Sampling suggests that few Dolly Varden winter
in these streams, but that overwintering is limited to Anxiety Ridge and Evaingiknuk
creeks.
Sampling of the 10 NPDES sites in July and August has been conducted each year since
1997. Our highest catches were in 1999, and the lowest in 2000, 2001, and 2006
(Appendix 5). Late summer catches of Dolly Varden for Anxiety Ridge and Buddy
creeks are presented in Figure 113. The highest catches of Dolly Varden are consistently
found in these two creeks.
Juvenile Dolly Varden
0
100
200
300
400
1997
1998
1999
2000
2001
2002
2003
2004
2005
2006
Num
ber o
f Fis
h
ANXBUD
Figure 113. Catches of juvenile Dolly Varden in Anxiety Ridge (ANX) and Buddy (BUD) creeks, 1997 to 2006.
71
Catches in Mainstem Red Dog Creek (upper and lower sample reaches) are presented in
Figure 114. From 1997 to 2001, catches followed a pattern similar to Anxiety Ridge and
Buddy creeks. However, lower catches have now been seen for the last five years.
Juvenile Dolly Varden
020406080
100
1997
1998
1999
2000
2001
2002
2003
2004
2005
2006
Num
ber o
f Fis
h
UMSLMS
Figure 114. Catches of juvenile Dolly Varden in upper Mainstem Red Dog (UMS) and lower Mainstem Red Dog (LMS) creeks, 1997 to 2006.
As we reported last year (Ott and Morris 2006b), a natural mineral seep located on Cub
Creek in upper Ikalukrok Creek has affected water quality. The Cub Creek seep is
located upstream of the mouth of Mainstem Red Dog Creek. Visible effects to water
clarity were first noted in 1997 and water quality data (1999 through 2006) indicate
generally improving conditions. One possible explanation for the continued low catches
of fish in Mainstem Red Dog Creek is that with improved water quality in Ikalukrok
Creek, more Dolly Varden moved upstream to rearing habitats in Ikalukrok Creek and its
tributaries (e.g., Grayling Junior Creek).
The length frequency distribution of juvenile Dolly Varden, especially the presence of
fry, indicates successful reproduction and survival. Dolly Varden less than 65 mm in late
July and early August are assumed to be age-0. Length frequency distributions of
juvenile Dolly Varden captured in fall 1997 through fall 2006 are presented in Appendix
6. Smolting can occur as early as age 2, but more commonly at age 3 (DeCicco 1990a).
Higher catches of Dolly Varden fry are seen in 1997, 1998, 1999, 2004, and 2005
(Appendix 6). Catches of Dolly Varden in 1997 and 1998 likely explain the large catch
72
of juvenile fish in fall 1999. Catches of Dolly Varden in both 2004 and 2005 were
relatively high, thus we expected fairly good catches in fall 2006. However, our catches
in fall 2006 were very low and other than the fact that water was generally high with
frequent rainstorm events in summer 2006, we have no apparent explanation.
During our spring sample event for Arctic grayling adults returning to North Fork Red
Dog Creek to spawn, we caught 27 Dolly Varden. The 27 Dolly Varden ranged in size
from 147 to 245 mm (Figure 115). The larger Dolly Varden caught each spring in North
Fork Red Dog Creek with fyke nets appear to be resident fish (i.e., larger than smolts,
obvious parr marks, and distinct orange/pink dots). In baseline studies, Houghton and
Hilgert (1983) only found one Dolly Varden in the headwaters of North Fork Red Dog
Creek. Our late May to early June sampling from 2000 through 2006 with fyke nets has
caught a number of resident Dolly Varden each year (Figure 115). It is not known
whether this consistent change in fish use is related to improved water quality in
Mainstem Red Dog Creek or simply due to increased sample effort and the use of fyke
nets.
Dolly Varden, North Fork Red Dog Creek
100150200250300
2000(n=18)
2001(n=43)
2002 (n=2) 2003(n=12)
2004(n=19)
2005(n=37)
2006(n=27)
Leng
th (m
m)
Figure 115. Dolly Varden caught in fyke nets in North Fork Red Dog Creek in spring during Arctic grayling spawning run.
73
Arctic Grayling
Before mine development, Arctic grayling adults migrated through Mainstem Red Dog
Creek in spring when discharge was high and metals concentrations low (EVS and Ott
Water Engineer 1983, Ward and Olson 1980, and Houghton and Hilgert 1983). Arctic
grayling moved through Mainstem Red Dog Creek to spawn in North Fork Red Dog
Creek, but no spawning was reported to occur in Mainstem Red Dog Creek. Arctic
grayling fry reared in North Fork Red Dog Creek and were displaced downstream by
high-water events or outmigrated as water temperatures cooled in the fall. Very few, if
any, juvenile Arctic grayling were found in North Fork Red Dog Creek during the ice-
free season.
Arctic Grayling Spawning
Water temperature is the most likely factor determining spawning time, emergence of fry,
and first year growth. We have closely monitored Arctic grayling spawning during
spring in North Fork Red Dog and Mainstem Red Dog creeks since 2001 (Table 13).
Table 13. A summary of Arctic grayling spawning in Mainstem Red Dog Creek from 2001 to 2006.
________________________________________________________________________ Date When Date When Number of Days Limited Spawning Spawning Complete Peak Temperatures Year Started (3°C) (Condition of Females) Exceeded 4°C1
2001 June 6 June 15 6 2002 May 29 June 8 8 2003 June 7 June 14 6 2004 May 25 May 31 4 2005 May 27 June 6 9 2006 May 30 June 15 10 ________________________________________________________________________ 1Does not include the day spawning was judged to be complete since the fyke net is worked in the early morning prior to peak temperatures on that day.
74
The purpose of the Arctic grayling spring sampling is to assess the condition of females
and determine when spawning in Mainstem Red Dog Creek is complete. Spawning
activity generally continues in North Fork Red Dog Creek after it is completed in
Mainstem Red Dog Creek as water temperatures warm more quickly in Mainstem Red
Dog Creek.
Mainstem Red Dog (Sta 10) and North Fork Red Dog (Sta 12) Creeks
02468
10
20 22 24 26 28 30 1 3 5 7 9 11 13 15 17
May June
Wat
er T
empe
ratu
re (°
C)
Station 12Station 10
Figure 116. Peak daily water temperatures in Mainstem Red Dog and North Fork Red Dog Creeks in spring 2006. Note, temperature probe in North Fork Red Dog Creek was not functioning until June 6.
We observed a post-spawning outmigration of large mature Arctic grayling during our
spring sample period – we have not seen this occur during previous spring sampling
events. The cold temperatures in North Fork Red Dog Creek continued well beyond the
normal time frame for Arctic grayling spawning. We believe that Arctic grayling entered
North Fork Red Dog Creek in late May and due to cold water temperatures, abandoned
spawning. We have noted similar findings with Arctic grayling at the Ft. Knox mine.
Last Chance Creek supports a spawning population of Arctic grayling, but only in those
years when aufeis is minimal and water temperatures warm to above 4°C during the
normal spawning time. Extensive aufeis in Last Chance Creek has kept water
temperatures below 4°C and has limited spawning to only spring 2004 and 2005 since the
spring of 1999 (Ott and Morris 2006).
75
Arctic Grayling Mark/Recapture
In spring 2006, we caught 74 Arctic grayling in North Fork Red Dog and Mainstem Red
Dog creeks (Tables 14 and 15). Thirty-two of the fish were judged to be immature. Most
of the recaptured Arctic grayling were originally tagged in North Fork Red Dog Creek
(Table 14). One of the recaptured fish was first tagged in either 1995 and had not been
caught in 11 years. Four of the Arctic grayling captured in spring 2006 are fish tagged in
Bons Pond. The Bons Pond population of Arctic grayling is the result of a fish transplant
made in 1994 and 1995 (Ott and Townsend 2003). Fish that leave Bons Pond travel over
a waterfall that is impassable to upstream movement of fish. We know based on field
work in summer 2005 that a number of Arctic grayling have left Bons Pond and entered
the Buddy and Bons Creek drainages downstream of the freshwater reservoir. Fish from
Bons Pond are recruiting to the North Fork Red Dog Creek population, where the original
group of fish transplanted originated.
Table 14. Arctic grayling recaptures in spring 2006 in North Fork Red Dog Creek.
Tag Gear Length Date Site Recapture Recapture LengthNumber Color Type (mm) Sex Captured Captured Date Site (mm)
15874 White Fyke Net 394 Male 6/3/2005 North Fork 6/14/2006 North Fork 40615850 White Fyke Net 265 Male 6/4/2005 North Fork 6/14/2006 North Fork 310
1784 White Angling 233 Female 8/11/1995 North Fork 6/15/2006 North Fork 38613129 Green Fyke Net 351 Female 7/11/2000 North Fork 6/4/2005 North Fork 366
6/15/2006 North Fork 3681606 White Fyke Net 309 Female 7/1/1998 North Fork 7/11/2000 North Fork 354
6/15/2006 North Fork 39415616 White Fyke Net 344 Female 5/29/2004 North Fork 6/3/2005 North Fork 360
6/15/2006 North Fork 36515619 White Fyke Net 398 Female 5/29/2004 North Fork 6/15/2006 North Fork 400
1793 White Fyke Net 271 Female 8/11/1995 North Fork 6/10/2001 North Fork 3756/15/2006 North Fork 400
13267 Green Fyke Net 380 Male 6/1/2002 Mainstem 6/16/2006 North Fork 42611646 Orange Fyke Net 215 Immature 7/5/2003 Bons Pond 6/15/2006 North Fork 28511001 Orange Fyke Net 222 Male 7/7/2003 Bons Pond 6/6/2004 Bons Pond 234
6/15/2006 North Fork 28515937 White Fyke Net 276 Male 5/29/2005 Bons Pond 6/15/2006 North Fork 307
9144 Orange Fyke Net 224 Male 6/13/2003 Bons Pond 5/27/2004 Bons Pond 2466/15/2006 North Fork 306
76
Table 15. Arctic grayling caught in North Fork Red Dog and Mainstem Red Dog Creek in spring 2006.
Tag Length Tag Scar Date SiteNumber Color Gear (mm) Sex Condition Recap Captured Captured
17680 Gray Fyke-Net 329 Male Ripe 6/12/2006 North Fork West Net17679 Gray Fyke-Net 255 Immature 6/12/2006 North Fork West Net17678 Gray Fyke-Net 290 Immature 6/12/2006 North Fork West Net17728 Gray Angling 465 Male Ripe 6/13/2006 Mainstem17727 Gray Fyke-Net 260 Immature 6/13/2006 North Fork East Net17726 Gray Fyke-Net 246 Immature 6/14/2006 North Fork West Net17725 Gray Fyke-Net 280 Female ? 6/14/2006 North Fork West Net17774 Gray Fyke-Net 240 Immature 6/14/2006 North Fork West Net15874 White Fyke-Net 406 Male Ripe Recap 6/14/2006 North Fork West Net17823 Gray Fyke-Net 355 Female Spent 6/14/2006 North Fork West Net17822 Gray Fyke-Net 311 Male Ripe 6/14/2006 North Fork West Net17821 Gray Fyke-Net 410 Female Ripe 6/14/2006 North Fork West Net17820 Gray Fyke-Net 274 Immature 6/14/2006 North Fork West Net17819 Gray Fyke-Net 354 Male Ripe 6/14/2006 North Fork West Net15850 White Fyke-Net 310 Male Not Ripe Recap 6/14/2006 North Fork West Net17818 Gray Fyke-Net 267 Immature 6/14/2006 North Fork West Net17817 Gray Fyke-Net 263 Immature 6/14/2006 North Fork West Net17816 Gray Fyke-Net 403 Female Ripe 6/14/2006 North Fork East Net17815 Gray Fyke-Net 379 Female Ripe 6/14/2006 North Fork East Net17814 Gray Fyke-Net 394 Female P/Spent 6/14/2006 North Fork East Net17813 Gray Fyke-Net 417 Male Ripe 6/15/2006 North Fork East Net17812 Gray Fyke-Net 251 Immature 6/15/2006 North Fork West Net17811 Gray Fyke-Net 264 Immature 6/15/2006 North Fork West Net11646 Orange Fyke-Net 285 Immature Recap 6/15/2006 North Fork West Net17810 Gray Angling 335 Female Ripe 6/15/2006 North Fork at Mainstem17809 Gray Angling 279 Immature 6/15/2006 North Fork at Mainstem
1784 White Angling 386 Female Spent Recap 6/15/2006 North Fork at Mainstem17835 Gray Angling 380 Female Spent 6/15/2006 North Fork at Mainstem11001 Orange Fyke-Net 285 Male Ripe Recap 6/15/2006 North Fork West Net13129 Green Fyke-Net 368 Female Spent Recap 6/15/2006 North Fork West Net
1606 White Fyke-Net 394 Female Spent Recap 6/15/2006 North Fork West Net17834 Gray Fyke-Net 346 Male Ripe 6/15/2006 North Fork West Net15937 White Fyke-Net 307 Male Ripe Recap 6/15/2006 North Fork West Net17833 Gray Fyke-Net 336 Immature 6/15/2006 North Fork West Net17832 Gray Fyke-Net 272 Immature 6/15/2006 North Fork West Net17831 Gray Fyke-Net 250 Immature 6/15/2006 North Fork West Net17830 Gray Fyke-Net 246 Immature 6/15/2006 North Fork West Net17829 Gray Fyke-Net 240 Immature 6/15/2006 North Fork West Net
77
Table 15. Arctic grayling (concluded).
Tag Length Tag Scar Date SiteNumber Color Gear (mm) Sex Condition Recap Captured Captured
15616 White Fyke-Net 365 Female Spent Recap 6/15/2006 North Fork East Net17828 Gray Fyke-Net 426 Male Ripe 6/15/2006 North Fork East Net17827 Gray Fyke-Net 404 Female Ripe 6/15/2006 North Fork East Net15619 White Fyke-Net 400 Female Ripe Recap 6/15/2006 North Fork East Net
Fyke-Net Female Spent 6/15/2006 North Fork East Net17826 Gray Fyke-Net 284 Immature 6/15/2006 North Fork East Net17825 Gray Fyke-Net 391 Female Spent 6/15/2006 North Fork East Net17874 Gray Fyke-Net 299 Male Ripe 6/15/2006 North Fork East Net17873 Gray Fyke-Net 332 Female Ripe 6/15/2006 North Fork East Net
1793 White Fyke-Net 400 Female P/Spent Recap 6/15/2006 North Fork East Net17872 Gray Fyke-Net 267 Immature 6/16/2006 North Fork West Net
9144 Orange Fyke-Net 306 Male Ripe Recap 6/16/2006 North Fork West Net17871 Gray Fyke-Net 279 Male Ripe 6/16/2006 North Fork West Net17870 Gray Angling 294 Male 6/16/2006 North Fork at Mainstem17869 Gray Angling 355 Male 6/16/2006 Mainstem17868 Gray Angling 343 Female ? 6/16/2006 Mainstem17867 Gray Angling 338 Female 6/16/2006 Mainstem17866 Gray Angling 295 Female ? 6/16/2006 Mainstem17865 Gray Angling 260 Immature 6/16/2006 Mainstem17864 Gray Angling 278 Female Spent 6/16/2006 Mainstem11001 Orange Angling 286 Male Ripe Recap 6/16/2006 Mainstem17894 Gray Fyke-Net 234 Immature 6/16/2006 North Fork West Net17893 Gray Fyke-Net 275 Immature 6/16/2006 North Fork West Net17892 Gray Fyke-Net 269 Immature 6/16/2006 North Fork West Net17891 Gray Fyke-Net 324 Male Ripe 6/16/2006 North Fork East Net17890 Gray Fyke-Net 320 Male Ripe 6/16/2006 North Fork East Net13267 Green Fyke-Net 426 Male Ripe Recap 6/16/2006 North Fork East Net17889 Gray Fyke-Net 399 Male Ripe 6/17/2006 North Fork East Net17888 Gray Fyke-Net 441 Male Ripe 6/17/2006 North Fork East Net17868 Gray Fyke-Net 343 Female ? Recap 6/17/2006 North Fork West Net17887 Gray Fyke-Net 327 Immature 6/17/2006 North Fork West Net17886 Gray Fyke-Net 281 Immature 6/17/2006 North Fork West Net17885 Gray Fyke-Net 277 Immature 6/17/2006 North Fork West Net17884 Gray Fyke-Net 255 Immature 6/17/2006 North Fork West Net17883 Gray Fyke-Net 261 Immature 6/17/2006 North Fork West Net17882 Gray Fyke-Net 244 Immature 6/17/2006 North Fork West Net17881 Gray Fyke-Net 278 Immature 6/17/2006 North Fork West Net17880 Gray Fyke-Net 260 Immature 6/17/2006 North Fork West Net17879 Gray Fyke-Net 262 Immature 6/17/2006 North Fork West Net
78
Arctic Grayling Fry
Since 1992, we have observed adult and fry Arctic grayling in North Fork Red Dog
Creek. We have visual observations of active spawning in North Fork Red Dog Creek
and have captured fry (12 to 15 mm long) in drift nets at Station 10 in Mainstem Red Dog
Creek and at Station 12 in North Fork Red Dog Creek. We also conduct visual surveys
along North Fork Red Dog Creek in July to assess relative abundance of fry (Table 16).
We have not observed large numbers of fry in North Fork Red Dog Creek since summer
1999 (Table 16).
Arctic Grayling Distribution
Aerial surveys for adult Arctic grayling in the Ikalukrok Creek drainage have been made
annually since summer 2000. In summer 2006, due to generally high water conditions
throughout most of the summer, aerial surveys for Arctic grayling were not done.
79
Table 16. Relative abundance of Arctic grayling fry in North Fork Red Dog Creek (1992 to 2006).
________________________________________________________________________ Relative Abundance Year of Fry Comments ________________________________________________________________________ 1992 high 100’s of fry, late July 1993 low Few fry in early August, high water 1994 low High water after spawning probably displaced fry 1995 low Fry small (<25 mm) in mid-July 1996 high Schools of 50 to 200 fry common 1997 high Average size of fry was 10 mm greater than in 1996 1998 low Cold water, late breakup, high water after spawning 1999 high Low flows, warm water after spawning, schools of 50 to 100 fry common 2000 low Cold water, late breakup, spawning 90% done June 13/14, fry small (<25 mm) and rare in mid-July 2001 low Cold water, late breakup, spawning 90% done June 19, fry small (<25 mm) and rare in mid-July 2002 low High flows, spawning 90% done June 8, fry small (<35 mm) in early August and rare, more fry seen in Ikalukrok Creek in early July, probably displaced by high water 2003 low Cold water, late breakup, spawning 90% done June 14, fry small (<25 mm) and rare in early August 2004 low Early breakup, spawning 90% done by May 31, fry (<30 mm) on July 10 2005 low Spawning 90% done by June 7, fry present in early July, several groups of 25 to 30 observed 2006 low Spawning partially abandoned due to cold water temperatures, no fry observed in early August, July surveys not possible due to high water ________________________________________________________________________
80
Slimy Sculpin
Houghton and Hilgert (1983) found slimy sculpin in Ikalukrok and Dudd creeks, but none
were found in the Red Dog Creek drainage. In 1995, we caught slimy sculpin in
Mainstem Red Dog and North Fork Red Dog creeks (Weber Scannell and Ott 1998).
Slimy sculpin are infrequently caught in the Red Dog Creek drainage and in Anxiety
Ridge Creek. Catches of slimy sculpin generally have been highest in Ikalukrok Creek
near Dudd Creek. The total catch of slimy sculpin for all sample areas, except
Evaingiknuk Creek, is presented in Figure 117. Catches were low in 2006 due to reduced
sample effort (i.e., July sample not done due to high water).
Figure 117. Slimy sculpin caught in Ikalukrok, Red Dog, Buddy, and Anxiety Ridge creeks, 1996 to 2006.
Trends in total numbers indicate an increasing presence of slimy sculpin from 1996
through 1999, with a decrease from 2000 to 2002, and then an increasing trend through
2005.
81
Literature Cited
ADF&G. 1998. Methods for aquatic life monitoring to satisfy requirements under NPDES Permit. NPDES AK-003865-2, Red Dog Mine Site. AK Dept. of Fish and Game, Habitat and Restoration Division. 23 pp.
Dames and Moore. 1983. Environmental baseline studies Red Dog project.
DeCicco, A.L. 2006. Wulik River aerial survey 2006. Letter to Office of Habitat Management and Permitting dated October 9, 2006. Fisheries Services and Supplies. Fairbanks, AK. 1 p.
DeCicco, A.L. 2005. Memorandum, 2005 Wulik River survey. AK Dept. of Fish and Game, Sport Fish Division. Fairbanks, AK. 1 p.
DeCicco, A.L. 2004. Red Dog trip report, September 11 to 15, 2004. Memorandum, AK Dept. of Fish and Game, Sport Fish Division. Fairbanks, AK. 2 pp.
DeCicco, A.L. 2002. 2002 Wulik River survey. October 14, 2002. Memorandum, AK Dept. of Fish and Game, Sport Fish Division. Fairbanks, AK. 1 p.
DeCicco, A.L. 2001a. 2001 Wulik River survey and Ikalukrok Creek, October 8, 2001. Memorandum, AK Dept. of Fish and Game, Sport Fish Division. Fairbanks, AK. 1 p.
DeCicco, A.L. 2001b. Ikalukrok Creek salmon, September 3, 2001. Memorandum, AK Dept. of Fish and Game, Sport Fish Division. Fairbanks, AK. 2 p.
DeCicco, A.L. 2001c. Ikalukrok Creek salmon, September 28, 2001. Memorandum, AK Dept. of Fish and Game, Sport Fish Division. Fairbanks, AK. 2 p.
DeCicco, A.L. 2000. Personal communication to Habitat and Restoration Division. November, 2000.
DeCicco, A.L. 1999. Memorandum, 1999 Wulik River survey. AK Dept. of Fish and Game, Sport Fish Division. Fairbanks, AK. 1 p.
DeCicco, A.L. 1998. Memorandum, 1998 Wulik River survey. AK Dept. of Fish and Game, Sport Fish Division. Fairbanks, AK. 1 p.
DeCicco, A.L. 1997. Memorandum, 1997 Wulik River survey. AK Dept. of Fish and Game, Sport Fish Division. Fairbanks, AK. 1 p.
DeCicco, A.L. 1996a. Memorandum, Wulik River survey. AK Dept. of Fish and Game, Sport Fish Division. Fairbanks, AK. 1 p.
DeCicco, A.L. 1996b. Abundance of Dolly Varden overwintering in the Wulik River, Northwest Alaska during 1994/1995. AK Dept. of Fish and Game, Sport Fish Fishery Data Series No. 96-3. Anchorage, AK.
82
Literature Cited (continued).
DeCicco, A.L. 1995. Personal communication. AK Dept. of Fish and Game, Sport Fish Division. Fairbanks, AK.
DeCicco, A.L. 1994. Memorandum, Wulik River survey. AK Dept. of Fish and Game, Sport Fish Division. Fairbanks, AK. 1 p.
DeCicco, A.L. 1993. Memorandum, Wulik River survey. AK Dept. of Fish and Game, Sport Fish Division. Fairbanks, AK. 1 p.
DeCicco, A.L. 1992. Memorandum, char surveys. AK Dept. of Fish and Game, Sport Fish Division. Fairbanks, AK. 2 pp.
DeCicco, A.L. 1991. Kotzebue trip report, August 16 to 27, 1991. AK Dept. of Fish and Game, Sport Fish Division. Fairbanks, AK. 5 pp.
DeCicco, A.L. 1990a. Life history of anadromous Dolly Varden (S. malma) in Northwestern Alaska. AK Dept. of Fish and Game, Sport Fish Division. Prepared for the 1990 meeting of the International Society of Arctic char fanatics in Murmansk, USSR. September 1990. 19 pp.
DeCicco, A.L. 1990b. Northwest Alaska Dolly Varden study 1989. Federal Aid in Sport Fish Restoration Act. AK Dept. of Fish and Game, Fishery Data Series No. 90-8. Fairbanks, AK. 42 pp.
DeCicco, A.L. 1990c. Trip report, Red Dog October 3 to 6, 1990. AK Dept. of Fish and Game, Sport Fish Division. Fairbanks, AK. 2 pp.
DeCicco, A.L. 1989. Memorandum, Wulik River char distribution. AK Dept. of Fish and Game, Sport Fish Division. Fairbanks, AK. 3 pp.
EVS Consultants Ltd and Ott Water Engineers. 1983. Toxicological, biophysical and chemical assessment of Red Dog, Delong Mountains, Alaska, 1982. Prepared for the Alaska Department of Environmental Conservation, Juneau, by G. Vigers, J. Barrett, R. Hoffman, J. Humphrey, D. Kathman, D. Konasewich, R. Olmsted, and B. Reid. 245 pp.
Houghton, J.F. and P.J. Hilgert. 1983. In Environmental baseline studies Red Dog project. Dames and Moore. 82 pp.
Jenkins, D.W. 1980. Biological monitoring of toxic trace metals. Vol. 1. Biological Monitoring and Surveillance. J EPA-600/3-80-089. 215 pp.
Morris, W.A. and A.G. Ott. 2001. Red Dog Trip Report (July 28 to August 9, 2001). AK. Dept. of Fish and Game. 9 pp.
83
Literature Cited (continued).
Ott, A.G. and J.L. Timothy. 2006. Red Dog trip report, August 9 to 16, 2006. AK Dept. of Natural Resources, Office of Habitat Management and Permitting. Juneau, AK. 3 pp.
Ott, A.G. and W.A. Morris. 2006c. Arctic grayling and burbot studies at the Fort Knox Mine, 2006. Technical Report No. 06-05. AK Dept. of Natural Resources, Office of Habitat Management and Permitting. Juneau, AK. 31 pp.
Ott, A.G. and W.A. Morris. 2006b. Aquatic biomonitoring at Red Dog mine, 2005. Technical Report No. 06-03. AK Dept. of Natural Resources, Office of Habitat Management and Permitting. Juneau, AK. 113 pp.
Ott, A.G. and W.A. Morris. 2006a. Red Dog spring trip report, June 10 to 17, 2006. AK Dept. of Natural Resources, Office of Habitat Management and Permitting. Juneau, AK. 6 pp.
Ott, A.G. and P.W. Scannell. 2003. Aquatic biomonitoring at Red Dog Mine, 2002. Technical Report No. 03-03. AK Dept. of Fish and Game, Habitat and Restoration Division. Juneau, AK. 116 pp.
Ott, A.G. and A.H. Townsend. 2003. A transplant of Arctic grayling to Bons Pond at the Red Dog Mine. AK Department of Natural Resources, Office of Habitat Management and Permitting. Juneau, AK. 36 pp.
Ott, A.G. and A.H. Townsend. 2002. Red Dog Trip Report (July 27 to August 7, 2002). AK Department of Fish and Game, Div. Habitat and Restoration, Fairbanks, AK. 7 pp.
Ott, A.G., P.K. Weber Scannell, and M.H. Robus. 1992. Fish monitoring study, Red Dog Mine in the Wulik River drainage, emphasis on Dolly Varden (Salvelinus malma). Technical Report No. 91-4. AK Dept. of Fish and Game, Habitat Division. Juneau, AK. 67 pp.
Ott, A.G. and W.A. Morris. 1999. Red Dog Mine Field Trip Report. August 7 - August 13, 1999. AK Department of Fish and Game, Div. Habitat and Restoration, Fairbanks, AK. 5 pp.
Ott, A.G. and S. Simpers. 1997. Red Dog Mine Field Trip Report. August 9 - August 15, 1997. AK Department of Fish and Game, Div. Habitat and Restoration, Fairbanks, AK. 9 pp.
Thompson, M. 2005. Electronic mail report to A.G. Ott on August 29, 2005. Teck-Cominco Alaska Inc. Red Dog Mine.
84
Literature Cited (concluded).
Townsend, A.H. and L. Conley. 2004. Red Dog field trip report, August 18 to 28, 2004. AK Dept. of Natural Resources, Office of Habitat Management and Permitting. Fairbanks, AK. 2 pp.
Townsend, A.H. and L. Ingalls. 2003. Red Dog Field Trip Report. August 6 to 13, 2003. Alaska Department of Natural Resources, Office of Habitat Management and Permitting, Fairbanks, AK. 3 pp.
Townsend, A.H. and C. Hemming. 1996. Red Dog Field Trip Report. August 9 - August 15, 1996. Alaska Department of Fish and Game, Habitat and Restoration Division, Fairbanks, AK.
Townsend, A.H. and C. Lunderstadt. 1995. Trip report, August 11 to 16, 1995. AK Dept. of Fish and Game, Habitat and Restoration Division. Fairbanks, AK. 7 pp.
Ward, D.L. and T.J. Olson. 1980. Baseline aquatic investigations of fishes and heavy metal concentrations in the Kivalina and Wulik Rivers, 1978-79. LGL Ecological Research Associates, Inc. Prepared for GCO Minerals Company. 89 pp.
Weber Scannell, P. and A.G. Ott. 2006. Aquatic baselines sampling, Wulik River drainage. Volume I: Summary of biological and water quality information. Technical Report No. 03-05. AK Dept. of Natural Resources, Office of Habitat Management and Permitting. Juneau, AK. 195 pp.
Weber Scannell P., A.G. Ott, and W.A. Morris. 2000. Fish and aquatic taxa report at Red Dog Mine, 1998-1999. Technical Report No. 00-03. AK Dept. of Fish and Game, Habitat and Restoration Division. Juneau, AK. 136 pp.
Weber Scannell P. and A.G. Ott. 1998. Fisheries resources and water quality, Red Dog Mine. Technical Report No. 98-02. AK Dept. of Fish and Game, Habitat and Restoration Division. Juneau, AK. 136 pp.
85
Appendix 1. Summary of Mine Development and Operations
1982
- Baseline studies initiated, Cominco agreement with NANA finalized 1983
- EIS process initiated, alternatives for mine and road to port site identified 1984
- Stream surveys conducted along proposed road by private consultant 1985
- Permit applications prepared for regulatory agencies - Implementation of wastewater treatment plant deferred to ADEC by ADF&G - Wastewater discharge limited to summer - Potential for acid rock drainage and metals mobilization not recognized
1986
- ADEC solid waste permit and bonding not required - ADEC permit preceded solid waste regulations - AIDEA bonds to build road and port site issued
1987
- Construction of road began, budget request to AIDEA prepared by ADF&G - Reimbursement agreement for logistics with ADF&G to monitor construction made by AIDEA
1988
- Ore body developed - Road and port site construction began
- Notice of Violation issued to AIDEA by ADF&G for failed road crossing by-passes
- Uniform Summons and Complaint issued for illegal water removal - AIDEA provided funding to ADF&G for monitoring - Rehabilitation plans for streams developed and implemented
86
Appendix 1 (continued). 1989
- Agreement to close-out old solid waste site finalized with Cominco - Civil work on ore body and surface water drainage control begun - Complaints about water quality in Ikalukrok Creek received
- Tailing dam becomes full, Cominco’s request to siphon untreated water over the dam denied by State - Elevated metals concentrations identified by red precipitation, were observed in Ikalukrok Creek below the mine
- Winter discharge of treated water authorized by State - State regulatory agencies and Cominco in disagreement over whether metals exceeded background conditions
1990 - Biomonitoring of fish populations proposed and initiated by ADF&G - Dead fish from the Wulik River were discovered by the public - ADF&G sampling indicated very few fish remaining in Ikalukrok Creek
- Installation of sumps and pumps by Cominco prevented metals-laden water from entering Red Dog Creek
- Baseline and current water quality data reviewed by ADF&G - Clean water bypass system requested by ADF&G - Zinc levels in Ikalukrok Creek exceeded 40 mg/L
- State regulatory agencies and Cominco in disagreement over cause and extent of water quality problems - Compliance Order by Consent for water quality violations affecting anadromous fish issued by ADEC - Notice of Violation for water quality violations affecting anadromous fish issued by ADF&G
- Cominco directed to design and construct a clean water bypass system - Perceived impairment to the subsistence fishery initiated involvement by the community of Kivalina
1991 - Clean water bypass system designed by Cominco, approved by state agencies - ADF&G fisheries study funded by Cominco - Clean water bypass system built - Clean water bypass system repaired - Improvements to water quality were documented
87
Appendix 1 (continued). 1992
- Fish study continued - Water quality improvements to downstream receiving water continued - Increasing water volume in tailing impoundment continued
- Water from dirty water collection system entering tailing impoundment increased volume
- Water treatment plant modifications made 1993
- Fish study continued - Sand filters to remove particulate zinc installed
1994
- Fish study continued - Use attainability studies of several streams initiated for reclassification - Water treatment capacity increased by thickening tank conversion - Wastewater discharge increased from 7.5 cfs to 23 cfs - Ore processing capability expanded by Cominco
1995
- Fish study expanded to include other aquatic biota - Work on stream reclassification and site-specific criteria continued by ADF&G
- Metals concentrations in the clean water bypass system increased; contributing sources were identified: Hilltop Creek (Zn), Shelly Creek (Cd), and Rachel Creek (Al)
- Clean water bypass system extended to collect water from Hilltop Creek - Reserves were doubled after exploration drilling located more ore - Possible metals contamination in Bons Creek identified by ADF&G
1996
- Public notice for stream reclassification sent out - Bons Creek water samples from above and below the Kivalina shale dump collected
- Fish and aquatic biota study continued
88
Appendix 1 (continued). 1997
- Stream reclassification incorporated into regulation (18 AAC 70.50) - Fish barrier constructed across Middle Fork Red Dog Creek - Water bypass around the Kivalina shale dump and interceptor trench at the head of
the tailing impoundment built - Gray-white precipitate observed in Middle Fork Red Dog Creek - Heavy red staining and precipitate seen in Ikalukrok Creek; originated from seep
near headwaters of Ikalukrok Creek, located upstream of mining activity - Laboratory experiments of TDS on egg fertilization and early egg development
initiated - Fish and aquatic biota studies continue - US EPA brings enforcement action for water quality violations; Cominco initiates
Supplemental Environmental Projects - Two-year aquatic community study in upper Ikalukrok Creek, above and below the
Red Dog Mine discharge initiated by ADF&G - Ground water monitoring wells installed and monitored below tailing dam by
Cominco 1998
- Wet fertilization studies to test effects of TDS on fish embryos continued - Draft 401 certification for a new NPDES permit prepared by ADEC and reviewed
by ADF&G - Discussed extension of the clean water bypass system up Shelly and Connie Creeks
to ensure bypass of clean water and collection of seepage water from newly disturbed areas
- Heavy red staining in headwaters of Ikalukrok Creek, originating from seep in headwaters of Ikalukrok Creek, upstream of mining activity, staining extends downstream about 30 km
- Site-specific criteria for Zn in Mainstem Red Dog and Ikalukrok Creeks approved by EPA
- Heavy rains cause an unanticipated release of water into Bons Creek from the Kivalina stockpile
- Plans to increase port site capacity for direct loading of ships released to public - NPDES permit reissued by US EPA - Two-year aquatic community study completed - Biomonitoring, including studies of fish and aquatic biota, required under 1998
NPDES permit
89
Appendix 1 (continued). 1999
- Two-year drilling program (Shelly and Connie Creeks) proposed - New station 7 on Ikalukrok Creek established by Cominco, USGS, and ADF&G - Fish and aquatic biota study expanded to upper North Fork Red Dog, Ikalukrok, and
Ferric creeks - Biomonitoring and USGS gauging work proposals submitted to Cominco - Study of periphyton communities exposed to different concentrations of TDS in
Mainstem Red Dog Creek done by ADF&G and Cominco Alaska Inc. - Request to increase TDS for periphyton colonization experiment not approved - Effects to Ikalukrok Creek from Alvinella Creek seepage water continued to below
Dudd Creek mouth - Arctic grayling females in ripe spawning condition collected from North Fork Red
Dog Creek for selenium analysis of livers and ovaries 2000
- Effects to Ikalukrok Creek from Cub Creek seep continued; red stain and precipitate observed several km below mouth of Mainstem Red Dog Creek
- North Fork Red Dog Creek silty at breakup, previously not observed - Minimal precipitate in Middle Fork Red Dog Creek below effluent outfall observed - Civil work performed in Connie Creek to isolate surface from subsurface flows and
bypass flow through disturbed areas - Effectiveness of pump back system at the Kivalina rock dump verified by presence
of juvenile Arctic grayling in creek immediately south of dump - Site-specific criteria for TDS requested by Cominco - Biomonitoring study continued - Baseline fish and aquatic biota studies in streams located in the vicinity of the
Anarraaq Prospect begun
90
Appendix 1 (continued). 2001
- Effects to Ikalukrok Creek from Cub Creek seep continued, red stain and precipitate observed in Ikalukrok Creek to Station 8 below Mainstem Red Dog Creek, affects minor near mouth of Dudd Creek
- North Fork Red Dog Creek, siltation (natural) less than in summer 2000 - Minimal precipitate in Middle Fork Red Dog Creek below effluent outfall - Water quality was monitored in Shelley, Rachel, Connie, and Middle Fork Red Dog
creeks upstream and downstream of surface disturbance, catch-box and pipeline (about 430 m) placed in Shelley Creek to move water pass disturbance
- Juvenile Arctic grayling observed in Bons Creek just south of the Kivalina rock dump, pump-back system working based on fish use
- Fish weir repairs made during 2000, no problems observed in 2001 - Stream survey of cross drainage structures made along the Delong Mountains
Transportation System, some minor work at some crossings identified - Site-specific criteria for TDS still being worked, data on Arctic grayling
spawning/water temperature collected in North Fork Red Dog and Mainstem Red Dog creeks, supplemental data gathered at the Ft. Knox mine
- Studies expanded to include the Delong Mountains Transportation System based on a National Park Service report that metals concentrations adjacent to road were elevated, water sites established upstream and downstream of road and sampled by Teck Cominco, juvenile Dolly Varden samples collected in Omikviorok River and Aufeis Creek, vegetation sampling started by Teck Cominco
- New haul trucks brought on site, hard-covered trucks to minimize loss of zinc and lead concentrates during transport
- Exploratory drilling (ore and shallow gas) continued, focus on North Fork Red Dog Creek and Wulik River basins near Anarraaq and Lik, including west of the Wulik River, another ore prospect found northwest of Anarraaq, shallow gas results promising
- State and Teck Cominco agree to start the state’s large mine team to work on issues, key issue identified was development of a solid waste permit with bonding for the tailing dam, other issues include site-specific criterion for total dissolved solids, clean-water bypass system, waste rock dumps (acid-rock drainage, and truck wash to minimize metal transport)
- Biomonitoring study continued, baseline fish and aquatic biota studies in streams located in the vicinity of the Anarraaq Prospect continued for the second field season, four new sites added to study tributaries on west side of Wulik in the area of the Lik Deposit and potential shallow gas development
91
Appendix 1 (continued). 2002
- Effects to Ikalukrok Creek from Cub Creek seep continued, red stain and precipitate observed in Ikalukrok Creek to Station 8 below Mainstem Red Dog Creek, affects minor near mouth of Dudd Creek
- North Fork Red Dog Creek, siltation minor during summer 2002 - Minor precipitate in Middle Fork Red Dog Creek below effluent outfall - Fish weir operating as designed - Data on Arctic grayling spawning/water temperature collected in North Fork Red
Dog Creek, supplemental data gathered at Ft. Knox - Pit expansion continues to the north of the clean-water bypass system, road crossing
added for access - A bypass was installed for Connie Creek during winter 2001/2002. The bypass
captures the upstream creek and carries the water in a pipe to the clean-water bypass system
- The bypass system for Shelly Creek was modified during summer 2002 to correct an overflow problem that occurred during breakup (the overflow water was captured in the pit and did not affect downstream waters). The modification involved adding a lined ditch to contain overflowing clean water and direct the water to the clean-water bypass system
- Juvenile Dolly Varden collected at eight sites located upstream and downstream of the Delong Mountains Regional Transportation System, whole body metals analyses for Cd, Pb, Se, and Zn
- Site-specific criteria for total dissolved solids is still being worked - State and Teck Cominco continue to work on key issues, e.g., solid waste permit
with bonding for the tailing dam, site-specific criterion for total dissolved solids, clean-water bypass system, waste rock dumps (acid-rock drainage, and truck wash to minimize metal transport)
- Biomonitoring study continued, baseline fish and aquatic biota studies in streams located in the vicinity of the Anarraaq Prospect and shallow gas exploration
- Arctic grayling adults remained in North Fork Red Dog Creek through early August, only the second time since 1992 that most of the adults stayed in the creek during summer, most years adults outmigrate shortly after spawning in spring
- Arctic grayling adults present in Buddy Creek just below the falls, about 50 adult fish in sample reach (0.3 km) in early July, all gone by early August
- About 50 to 60 adult Dolly Varden in Ikalukrok Creek at mouth of Dudd Creek from early July through late August
- Effluent discharge ceased on October 5, 2002, to allow time to winterize the water treatment plant
92
Appendix 1 (continued). 2003
- Effects to Ikalukrok Creek from Cub Creek seep continued but were much less than seen in the last two to three years
- North Fork Red Dog Creek, natural siltation throughout most of the summer was minor in summer 2003
- Minor precipitate in Middle Fork Red Dog Creek below effluent outfall - Fish weir operating as designed - Data on Arctic grayling spawning/water temperature collected in North Fork Red
Dog Creek, supplemental data gathered at Ft. Knox - Site-specific criteria for total dissolved solids was finalized - USEPA modified the NPDES effective August 22, 2003, to incorporate the ADEC
Site Specific Criteria and mixing zones for total dissolved solids in Mainstem Red Dog and Ikalukrok creeks with conditions that ensure total dissolved solids are at or below 500 mg/L during Arctic grayling spawning in Mainstem Red Dog Creek and during chum salmon and Dolly Varden spawning in Ikalukrok Creek, the modified permit was appealed by the Kivalina Relocation Planning Committee
- State and Teck Cominco continue to work on key issues, e.g., solid waste permit with financial assurance for the tailing dam, site-specific criterion for total dissolved solids, clean-water bypass system, waste rock dumps (acid-rock drainage, and truck wash to minimize metal transport)
- Arctic grayling adult returns to North Fork Red Dog Creek were low, number of adult Arctic grayling seen in the Ikalukrok Creek drainage was the lowest seen since aerial surveys were begun in the late 1990s
- Arctic grayling population estimate was completed for Bons Pond the site of a fish transplant made in 1994 and 1995, estimated population in the reservoir was 6,773
- Modification to Shelly Creek bypass ditch completed, a better designed and constructed lined ditch was built and commissioned in August, 2003
- In 2003, a permanent lined ditch was constructed parallel to the Connie Creek diversion pipeline to avoid spring freeze-up issues
- In 2003, a permanent monitoring station was established at the end of the mixing zone in Mainstem Red Dog Creek, the location designation is Station 151, and is fitted with real time total dissolved solids and flow determination equipment and telemetry to link the station directly into the mill process control system
- Station 150, at the end of the mixing zone in Ikalukrok Creek, was fitted with real time total dissolved solids and flow determination equipment and telemetry to link the station directly into the mill process control system
93
Appendix 1 (continued). 2004
- Wastewater discharge began on May 20, ended on September 26, total discharge about one billion gallons
- Effects to Ikalukrok Creek from Cub Creek seep continued but were minor - North Fork Red Dog Creek, natural siltation minor during ice-free season - Minor precipitate in Middle Fork Red Dog Creek below effluent outfall - Fish weir operating as designed - Arctic grayling spawning/water temperature data collected, Arctic grayling from
North Fork Red Dog Creek used for TDS fertilization experiment - State and Teck Cominco continued to work on key issues associated with the solid
waste permit and closure plan for the mine - Arctic grayling adult returns to North Fork Red Dog Creek were low, number of
adults seen in Ikalukrok Creek drainage remained low as in summer 2003 - Bons Pond (the site of a fish transplant made in 1994 and 1995), estimated Arctic
grayling population for summer 2003 was 6,773 and for summer 2004 was 5,739
- Chinook salmon juveniles were documented for the first time in Ikalukrok Creek, near Dudd Creek, and in Anxiety Ridge Creek
- Age-1 Arctic grayling were caught in minnow traps fished in Ikalukrok, Mainstem, and Buddy creeks, since age-1 fish are seldom captured in minnow traps this may indicate good survival of fry spawned in spring 2003
- Red Dog Creek diversion (clean water ditch) was realigned to the west side of the pit. Realigned configuration is a combination of large diameter culvert and open lined ditch
2005
- Wastewater discharge began on May 10, 2005, ended on October 6, 2005, total discharge about 1.501 billion gallons
- Major precipitate observed on streambed in Middle Fork Red Dog Creek below effluent outfall in July and August, precipitates (gray colored) evident for at least 1 km downstream of effluent outfall
- Fish weir operating as designed - Effects to Ikalukrok Creek from Cub Creek seep substantially greater than seen for
past several years, water opaque and streambed coated with red precipitate at confluence with Mainstem Red Dog Creek, TCAK water sample from Cub Creek seep with a pH of 3.3
- Arctic grayling spawning/water temperature data collected, Arctic grayling from North Fork Red Dog Creek used for TDS fertilization experiment
- Attended and participated in a NPDES permit renewal meeting in Seattle with EPA, TCAK, and Nana, identified and discussed key issues
94
Appendix 1 (continued). 2005
- Red Dog Creek diversion (clean water ditch) mine engineering drawings (r4) were provided by TCAK showing the culverts and lined ditch that carry water from tributaries and Middle Fork Red Dog Creek through the pit area
- Recommendations for changes to the Red Dog biomonitoring program based on field data collection and analyses since 1999 were made for possible incorporation into the renewed NPDES permit or ADEC’s solid waste permit for the tailing impoundment
- TCAK distributed the 2005 draft report on Arctic grayling fertilization studies that concluded TDS concentrations at or below 1,500 mg/L at Station 10 in Mainstem Red Dog Creek would provide for proper protection of Arctic grayling in the Red Dog Creek drainage, OHMP supported these findings in a letter to Pete McGee (ADEC) dated August 17, 2005
- Dr. Weber Scannell prepared comments on fish tissue data (Dolly Varden from Wulik and Kivalina rivers) collected by Maniilaq Association and compared these data with existing information from other sources in both Alaska and nationwide
- OHMP prepared a summary report (letter to Jim Kulas dated August 23, 2005) on temperature/spawning data collected for Arctic grayling in Mainstem Red Dog and North Fork Red Dog creeks from 2001 through 2005, a recommendation for determining start and completion of spawning based on temperature was developed for Mainstem Red Dog Creek
- State and TCAK continued to work on key issues associated with the solid waste permit and closure plan for the mine ADEC
- Wastewater Treatment Plant (WTP) #3 began operations in late summer 2005 to treat mine sump water and drainage from waste rock dumps prior to placement of these waters into the tailing impoundment, purpose is to improve water quality in tailing impoundment over time
- Exploratory drilling and flow testing for gas in North Fork Red Dog Creek basin was conducted, access road and pads inspected, corrugated pipes installed to provide cross drainage, no evidence of erosion noted along road to and connecting the drill pads
- A road was constructed to Station 151 (end of mixing zone in Mainstem Red Dog Creek
- Work to expand and relocate the water treatment plant sand filters was initiated
95
Appendix 1 (concluded). 2006
- ADEC amended the site-specific criteria (SSC) for TDS in Mainstem Red Dog Creek, the 500 mg/L limit during Arctic grayling spawning was removed and replaced with a 1,500 mg/L limit on February 15, 2006, and EPA approved the new SSC in April 2006
- North Fork Red Dog Creek, extensive areas of aufeis existed, turbidity and organic debris high due to erosion and thermal degradation, in several reaches flow was not in stream channel due to aufeis
- Arctic grayling spawning/water temperature data collected, early spring warming followed by cold weather, adult Arctic grayling entered North Fork Red Dog Creek in late May and due to cold water temperatures abandoned spawning and outmigrated from the creek in mid-June
- Four Arctic grayling captured in North Fork Red Dog Creek in spring 2006 were fish that had been marked in Bons Pond
- Review of ADEC’s draft 401 certification to the renewal of the NPDES was completed and we provided a letter of support (March 10, 2006) to ADEC, including our concurrence with ADEC’s decision to not require Whole Effluent Toxicity (WET) limits
- Effects to Ikalukrok Creek from Cub Creek seep continued, but were minor - Major precipitate observed on streambed in Middle Fork Red Dog Creek below
effluent outfall in August, precipitates (orange colored) evident for at least 1 km downstream of effluent outfall and precipitates continued upstream through the clean water bypass to Connie and Rachel creeks
- Fish weir operating as designed - Work continued on the design for the Red Dog tailing backdam, the dam will be
located on the south side of the tailing pond and will be constructed of earth fill with a concrete/soil aggregate/bentonite cutoff wall, the dam will be constructed to a final height of 986 ft., construction anticipated during 2006 and 2007
- In July 2006, windrows of dead capelin were documented at the Port Site, die off after spawning is normal, only a small percentage survive spawning
- Total count of chum salmon in Ikalukrok Creek on August 16 was 4,185, the highest number reported since 1990
- In 2006, slightly elevated Zn concentrations persisted and TCAK initiated a field investigation comprised of sampling along the clean water bypass, although not definitive, results indicated that the Mine Sump might have been the source of increased Zn concentrations, modifications were made in operational procedures to ensure containment of contaminated waters in the Mine Sump
96
Appendix 2. Dolly Varden Aerial Surveys
Estimated number of overwintering Dolly Varden in the Wulik River before freezeup. Surveys conducted by ADF&G (DeCicco 1989, 1991-1999, 2001-2002, and 2004-2006.
Wulik River Wulik River Percent of Fishupstream of downstream of Total downstream of
Year Ikalukrok Creek Ikalukrok Creek Fish Ikalukrok Creek
The population estimate (mark/recapture) for winter 1988/1989 for fish >400 mm was 76,892 (DeCicco 1990b)The population estimate (mark/recapture) for winter 1994/1995 for fish >400 mm was 361,599 (DeCicco 1996c)Fall 2000 aerial survey was not made due to weather. Fall 2003 aerial survey was not made due to weather.
97
Appendix 3. Dolly Varden and Chum Salmon Survey Areas
98
Appendix 4. Juvenile Dolly Varden Sampling Sites
99
Appendix 5. Juvenile Dolly Varden Catches
Number of Dolly Varden Caught in Late-July/Early August with ten minnow traps per sample site