RP357 \QUEOUS SOLUTIONS OF ETHYLENE GLYCOL, GLYCER- IN AND SODIUM SILICATE AS QUENCHING MEDIA FOR STEELS By Thomas E. Hamill ABSTRACT The Quenching characteristics of aqueous solutions of ethylene glycol, glycerin, and sodium silicate were studied by means of temperature-time cooling curves on small cylinders of a 0.96 per cent carbon steel quenched m solutions of various Concentrations and temperatures. Center cooling curves are given for cylinders one-half inch in diameter by 2 inches long, quenched in aqueous solutions of ethylen glycol and glycerin at atmospheric temperature Surface and center foonng curves are |£n for aqueous solutions of two lots of sodmm sihcate having different soda-to-silica ratios, namely, 1 : 4 and 1 : 2.5. These two silicates are designated in this report by these ratios. The effect of increasing the tempera- toe of solutions of the 1:4 soldium silicate from 20° to 80° C was also studied The cLracCistics of these cooling curves and a study of the hardnesses and structures produced suggest that these sodium silicate solutions would be useful for obtlinin^pooling rites from slightly less than that obtained with water to Four concentrations of the 1:4 sodium silicate having specific gravities cor- responding to 4.6°, 9.5°, 13.2°, and 16.7° B. and two of the 1:2.5 sodium silicate, 124° and 28 18° B were found which gave intermediate cooling rates between those obtained with water and with oil at atmospheric temperature. Some trouble was experienced with the instability of certain of the aqueous solutions of the 1 : 4 sodium silicate. The stability of these solutions was greatiy increased by the addition of 2 per cent by volume of a solution of sodium hydrox- ^^IS^i^oling P-duced by check tests on aqueous solutions of ethylene glycol and of glycerin indicate that these solutions may not be par- ticularly useful as media for the quenching of steels. < Quencnlng experiments with "stepped" bars of a 1.06 per cent carbon steel indicate that sodium silicate solutions can be used at ^^Zi^To^ provide coolants with graded cooling speeds between those of water and oil. CONTENTS Page I. Introduction - - kka II. Experimental methods and materials -__- .— ---- ^ a III. Quenching experiments with glycol and with glycerin solutions 558 IV. Quenching experiments with soldium silicate solutions, ooi 1 Effect of varying concentrations of sodium silicates 5bl (a) Cooling times and cooling rates oo i (6) Hardness and microstructure ----- -- - ----. ££* 2 Effect of varying the temperature of sodium silicate solutions 5b5 3. Structure and hardness of "Stepped" specimens quenched in sodium silicate solutions *>~° V. Stability of sodium silicate quenching solutions J> /u VI . Summary 571 VII. Acknowledgments - 555
Transcript
RP357
\QUEOUS SOLUTIONS OF ETHYLENE GLYCOL, GLYCER-
IN AND SODIUM SILICATE AS QUENCHING MEDIAFOR STEELS
By Thomas E. Hamill
ABSTRACT
The Quenching characteristics of aqueous solutions of ethylene glycol, glycerin,
and sodium silicate were studied by means of temperature-time cooling curves
on small cylinders of a 0.96 per cent carbon steel quenched m solutions of various
Concentrations and temperatures. Center cooling curves are given for cylinders
one-half inch in diameter by 2 inches long, quenched in aqueous solutions of
ethylen glycol and glycerin at atmospheric temperature Surface and center
foonng curves are |£n for aqueous solutions of two lots of.
sodmm sihcate
; having different soda-to-silica ratios, namely, 1 : 4 and 1 : 2.5. These two silicates
are designated in this report by these ratios. The effect of increasing the tempera-
toe of solutions of the 1:4 soldium silicate from 20° to 80° C was also studied
The cLracCistics of these cooling curves and a study of the hardnesses and
structures produced suggest that these sodium silicate solutions would be useful
for obtlinin^pooling rites from slightly less than that obtained with water to
Four concentrations of the 1:4 sodium silicate having specific gravities cor-
responding to 4.6°, 9.5°, 13.2°, and 16.7° B. and two of the 1:2.5 sodium silicate,
12;
4° and 2818° B were found which gave intermediate cooling rates between
those obtained with water and with oil at atmospheric temperature.
Some trouble was experienced with the instability of certain of the aqueous
solutions of the 1 : 4 sodium silicate. The stability of these solutions was greatiy
increased by the addition of 2 per cent by volume of a solution of sodium hydrox-
^^IS^i^oling P-duced by check tests on aqueous solutions of
ethylene glycol and of glycerin indicate that these solutions may not be par-
ticularly useful as media for the quenching of steels. <
Quencnlng experiments with "stepped" bars of a 1.06 per cent carbon steel
indicate that sodium silicate solutions can be used at^^Zi^To^provide coolants with graded cooling speeds between those of water and oil.
CONTENTSPage
I. Introduction - - kkaII. Experimental methods and materials -__- .— ---- ^a
III. Quenching experiments with glycol and with glycerin solutions 558
IV. Quenching experiments with soldium silicate solutions, ooi
1 Effect of varying concentrations of sodium silicates 5bl
(a) Cooling times and cooling rates oo i
(6) Hardness and microstructure----- - - -----. ££*2 Effect of varying the temperature of sodium silicate solutions 5b5
3. Structure and hardness of "Stepped" specimens quenched
in sodium silicate solutions *>~°
V. Stability of sodium silicate quenching solutionsJ>
/u
VI . Summary 571VII. Acknowledgments -
555
556 Bureau of Standards Journal of Research [Vol. 7
I. INTRODUCTION
The structure and properties of a quenched steel depend uponboth the critical cooling rate of the particular steel in question andthe cooling characteristics of the media in which the steel is quenched.In recent years plain carbon steels have been supplemented by alloy
steels in which the alloying additions have changed the critical cooling
rates. The simplest and most widely used quenching media are
water and oil. The cooling characteristics of these two media havebeen modified by adding salts, alkalis, acids, or other chemical com-pounds to water, by using water or aqueous solutions at temperaturesbelow or above room temperatures, and by employing emulsions of oil
and water.With quenching solutions available giving a complete graded series
of cooling rates, the control of the results to be obtained from quench-ing both plain carbon and alloy steels is obviously made much moresimple. Oil-water emulsions, concentrated sulphuric acid, and hotaqueous solutions have been used in the attempt to supply this need.
Experiments previously made at the National Bureau of Standardson emulsions of water and machine oil showed that the addition to
water of only 0.1 per cent of oil, by volume, decreased the cooling
rate of the water almost to that of the oil alone. The extreme accur-
acy that apparently is required in preparing and maintaining emul-sions of this type in order to secure quenching solutions of knowncooling rates appears seriously to limit the usefulness of such emul-sions.
Concentrated sulphuric acid has been used successfully to give cool-
ing rates between those obtained with oil and water. 1 Its disadvan-tages are its hydroscopic nature, making maintenance of its concen-tration difficult, and the very great danger to workmen from splashing.
Hot water and hot aqueous solutions are sometimes used to givecooling rates intermediate between those of oil and water. 2 Suchsolutions require good circulation and accurate control of tempera-ture and concentration.
Solutions of glycerin also have been used as quenching media.Scott 3 reported that glycerin-water solutions " effectively bridge thegap between oil and water."The present investigation was directed chiefly toward a study of
solutions of sodium silicate as quenching media which it was expectedmight give cooling rates intermediate between those of oil and of
water. Some attention was also given to the behavior of solutions
of ethylene glycol and of glycerin when used as quenching media.
II. EXPERIMENTAL METHODS AND MATERIALS
The experimental method employed in the present investigationwas based on the classical work of LeChatelier, 4 who first succeededin devising means for recording photographically the temperaturechanges taking place over the period of a few seconds in small speci-
1 H. J. French and O. Z. Klopsch, Quenching Diagrams for Carbon Steels in Relation to Some Quench-ing Media for Heat Treatment, Trans. Am. Soc. Steel Treating, 3, p. 284; 1924.
2 H. J. French and T. E. Hamill, Hot Aqueous Solutions for the Quenching of Steels, B. S. Jour. Re-search, 3 (RP103), p. 399; 1929; Trans. Am. Soc. Steel Treating, 16, p. 711; 1929.
" H. Scott, Quenching Properties of Glycerin and its Water Solutions, Trans. Am. Soc. Steel Treating,6, p. 31; 1924.
* H. LeChatelier, "Etudes sur la trempe de l'acier," Revue de M6tallurgie, 1, p. 473; 1904.
Hamill] Solutions jor Quenching of Steels 557
mens of steel quenched in various coolants. LeChatelier's methodwas further developed by Benedicks 5 and employed in studying theinfluence on quenching rates of the surface of the steel, the rate ofmotion of the steel, the dimensions, mass, and chemical compositionof the specimen, the temperature of the quenching bath, and otherfactors.
In the present work determinations were made of surface and centercooling curves of steel cylinders one-half inch diameter by 2 incheslong, quenched from 875° C. in several coolants at various tempera-tures from 20° to 80° C. The quenching media were moving with avelocity of 3 feet per second. The time-temperature curves were ob-tained on a moving photographic film by a method previously de-scribed in detail 6 in which thermocouples suitably mounted at thecenter or on the surface of the steel specimen were connected to anEinthoven " string galvanometer."
In addition to the determination of cooling curves on the plaincylindrical specimens, hardness determinations was made on the steel
at the surface and at the center of the specimens. A study was also
made of the hardness and microstructure developed in cylindrical
" stepped" bars (fig. 13) which were machined to have abrupt changesin diameter from one-fourth to one-half inch to 1 inch.
The surface hardness of the quenched cylinders was taken as theaverage of six determinations made along the length of the cylinderon the side meeting the direct flow of the liquid during quenching.These tests were made after removing about 0.01 inch of metal fromthe surface by wet grinding to form a narrow flat strip along thelength of the cylinder. The center hardness was determined from tests
made after cutting the cylinders in half (transversely) under a waterspray.
Two steels were used in the preparation of specimens, one for theplain cylindrical specimens for cooling curves and second for the" stepped" bars. They differed but slightly in composition bothbeing practically a 1 per cent plain carbon steel.
Table 1.
—
Chemical composition of steel specimens
Carbon Manga-nese
SiliconPhos-phorus
Sulphur
Plain cylinders.."Stepped" bars.
0.961.06
0.28.24
0.18.18
0.016.014
0.028.016
Commercial sodium silicate from two sources was used in thepreparation of the silicate quenching solutions. The two lots differed
in soda-to-silica ratios. One contained approximately 6 per centNa20, 25 per cent Si02 by weight, and the other approximately 11
per cent Na20, 27 per cent Si02 , the balance being water in eachcase. The ratios of soda to silica were thus nearly 1:4 and 1:2.5.
The two solutions are referred to in this report by these ratios. Whilethe 1:4 silicate was cloudy the 1:2.5 silicate was quite clear, appar-ently due to its higher proportion of Na20.The diluted solutions of sodium silicate, ethylene glycol, and glyc-
erin were prepared in the concentrations shown in Table 2. The
4 C. Benedicks, The Cooling Power of Liquids, Quenching Velocities, J. Iron and Steel Inst., 2, p. 153;
1908.6 See footnote 1, p. 556.
558 Bureau of Standards Journal of Research [Vol.7
thoroughly stirred solutions were allowed to stand for several hoursand again stirred in order to cause complete solution before they wereused in the quenching experiments.The prepared quenching oil was the same commercial quenching
oil that has been used in previous studies on quenching at the Na-tional Bureau of Standards and designated there as No. 2 oil. Its
physical properties have been given in a previous publication. 7
Table 2.
—
Concentrations and specific gravities of the sodium silicate, glycol, andglycerin quenching solutions
III. QUENCHING EXPERIMENTS WITH GLYCOL AND WITHGLYCERIN SOLUTIONS
The center cooling curves of the one-half by 2 inch cylinders of the0.96 per cent carbon steel quenched in ethylene glycol and aqueoussolutions of 20 and 60 per cent glycol and of 60 per cent glycerin areshown in Figure 1. The velocity of the quenching medium was 3
560 Bureau of Standards Journal of Research [Vol. 7
feet per second in the tests with glycol and the glycol solutions and 1
foot per second in the tests with the glycerin solution.
The curves of Figure 1 show clearly very considerable variationsin the cooling rates and the characteristics of the cooling curves be-tween duplicate quenching tests. The greatest variations occur in themiddle portions of the cooling curves, between 300° and 700° C.Most of the curves, however, coincide rather well at 200° C. It is
thus evident that the total time of cooling from 875° C, the quench-ing temperature in all cases, to 200° C. can not be taken as a character-istic of the coolant which will indicate the constitution and properties
of a steel quenched in that solution. The structure of a quenchedsteel is controlled by the cooling rates at the Ar' and Ar" transfor-
mation points. For this particular steel these points lie in the neigh-borhood of 675° and 375° C, respectively. They are thus in the veryregion of the greatest variations in the cooling curves of check tests.
Consequently, large variations are to be expected in the structures
and hardness of duplicate specimens of a given steel quenched in anyof these solutions.
It is to be kept in mind, however, that the variations in the tem-perature-time curves representing duplicate quenching tests are notsolely the result of variations in the cooling rate of the solution.
When the cooling rate is so slow as to permit the Ar1 transformationthe heat effect of this transformation acts to decrease still further thecooling rate of the specimen and magnifies the decreased cooling rate
of the solution as represented in the curves of Figure 1.
The center and surface hardness values of these same quenchedspecimens, Table 3, give evidence of this expected variation in prop-erties of steel quenched in these solutions under identical conditions.
In specimens quenched in glycol solutions observed variations in
hardness (Rockwell "C" scale) were 10 to 20 points on both surfaceand center. In specimens quenched in the 60 per cent glycerinsolution, the variations in hardness were somewhat less.
Table 3.
—
Center and surface hardness of 0.96 per cent carbon steel quenched inaqueous solutions of glycol and glycerin
TestNo. Quenching medium
Rockwell hardness,"C" scale
Center 1 Surface i
2483 100 per cent glycol . 44.146.643.052.842.6
66.245.446.063.1
57.144.164.465.0
58.856.962.258.363.2
45.22484 do 65.12487 do .--- 50.72493 do. 63.62496 do 46.4
2497 60 per cent glycol . . 66.42499 do 66.02501 do 47.82503 do.... 63.9
2498 20 per cent glycol - 55.02500 do 48.62502 do.. 64.42504 do 66.2
1097 60 per cent glycerin. 63.81106 do 63.41107 do 64.31114 do... 61.51121 do 63.6
1 Average of 3 tests. * Average of 6 tests.
Hamill] Solutions for Quenching oj Steels 561
IV QUENCHING EXPERIMENTS WITH SODIUM SILICATESOLUTIONS
1. EFFECT OF VARYING CONCENTRATIONS OF SODIUM SILICATES
(a) COOLING TIMES AND COOLING RATES
The surface and center cooling curves obtained on the 0.96 per
cent carbon steel cylinders quenched into various concentrations of
the 1 : 4 and the 1 : 2.5 sodium silicates at 20° C. are shown in Figures
2 and 3. Cooling curves obtained on quenching in water and in oil
at 20° C. are also given for comparison.
1000
8 12 16 20 24TIME- SECONDS
28 32 33 40 44
Figure 2.—Surface and center cooling curves of 0.96 per cent carbon steel cylinders
quenched into solutions of the 1:4 sodium silicate, water, and oil at 20 C.
Each curve is the average of two or three tests.
Increasing the concentration of solutions of both the 1 : 4 and 1:2.5
sodium silicates lowered the cooling rates. The cooling times in-
creased from slightly less than that of water to greater than that oi
oil. The comparison between the cooling times and cooling rates of
oil and one of the more concentrated sodium-silicate solutions is more
readily seen in Figure 4 which shows the surface and center cooling
curves of the oil and the 23.2° B. solution of the 1:4 sodium silicate.
68723—31- -10
562 Bureau of Standards Journal oj Research [Vol.
lOOOf
800
eoo
400
puj 200
5ccUJ
UJH 800
600
400
200
SURFACE
1*
V .-.«- ^*^
l\\ \
'S>s
\>
"««»
**•*•,
\WATE1
12V 26.6*'**•«*—- . OH. "-».4 lS*8C
CENTER
\^>^O.Xs^
N\\ N
».
\\ ^<„
WATtJ*\ "^
**-»,.^
~««^,"*--•-„
12/^ *2&fl OIL 4|.6*BE.
8 12 16 20 24 28 32 36 40TIME - SECONDS
Figure 3.
—
Surface and center cooling curves of 0.96 per cent carbon steel cylinders
quenched into solutions of the 1 : 2.5 sodium silicate, water, and oil at 20° C.
Each curve is the average of two or three tests.
1000
8 12 16 20TIME - SECONDS
24 28
Figure 4.
—
Replot of surface and center cooling curves of Figure 2, comparing the
cooling curves of the oil and2 3.2° B. solution of the 1:4 sodium silicate at 20° C.
Hamill] Solutions for Quenching of Steels 563
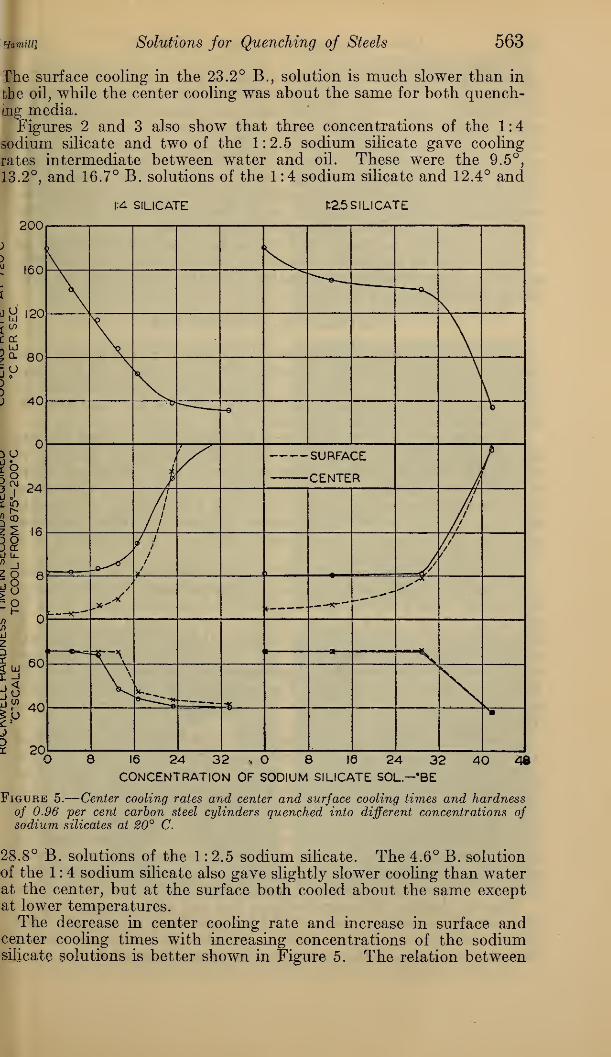
The surface cooling in the 23.2° B., solution is much slower than in
the oil, while the center cooling was about the same for both quench-ing media.Figures 2 and 3 also show that three concentrations of the 1:4
sodium silicate and two of the 1:2.5 sodium silicate gave cooling
rates intermediate between water and oil. These were the 9.5°,
13.2°, and 16.7° B. solutions of the 1:4 sodium silicate and 12.4° and
1:4 SILICATE 1:25 SILICATE
200
O 8 16 24 32 * 8 16 24 32 40 48CONCENTRATION OF SODIUM SILICATE SOL—"BE
Figure 5.
—
Center cooling rates and center and surface cooling times and hardnessof 0.96 per cent carbon steel cylinders quenched into different concentrations ofsodium silicates at 20° C.
28.8° B. solutions of the 1 : 2.5 sodium silicate. The 4.6° B. solutionof the 1 : 4 sodium silicate also gave slightly slower cooling than waterat the center, but at the surface both cooled about the same exceptat lower temperatures.The decrease in center cooling rate and increase in surface and
center cooling times with increasing concentrations of the sodiumsilicate solutions is better shown in Figure 5. The relation between
564 Bureau of Standards Journal of Research [Vol. 7
the center cooling rate and the concentration of the 1:4 sodiumsilicate is almost linear up to concentrations of approximately 20° B.At higher concentrations the cooling rate changes relatively little
with increasing concentration. On the other hand, the 1: 2.5 sodiumsilicate containing the higher soda to silica ratio shows quite different
results. With solutions of the 1:2.5 silicate the center cooling rate
and surface and center cooling times are very little affected byincreasing concentrations up to approximately 28° B. Higher con-centrations, however, produced rapid changes in both the centercooling rates and surface and center cooling times.
Surface cooling rates were not calculated from any of the surface
cooling curves in as much as these curves are so steep and containso many fluctuations in temperature that the cooling rate at 720°
could not be measured accurately.
(b) HARDNESS AND MICROSTRUCTURE
The center and surface hardness of the 0.96 per cent carbon steel
quenched in the several concentrations of the 1:4 and 1:2.5 sodiumsilicates are shown in Figure 5. The steel was fully hardened at
the center (Rockwell C65) on quenching in the 4.6° and 9.5° B.solutions of the 1 : 4 sodium silicate.
The steel quenched in these two solutions (fig. 6, A and B) wasalmost completely martensitic in structure with small amounts of
troostite. With increasing concentrations of the 1 : 4 silicate there
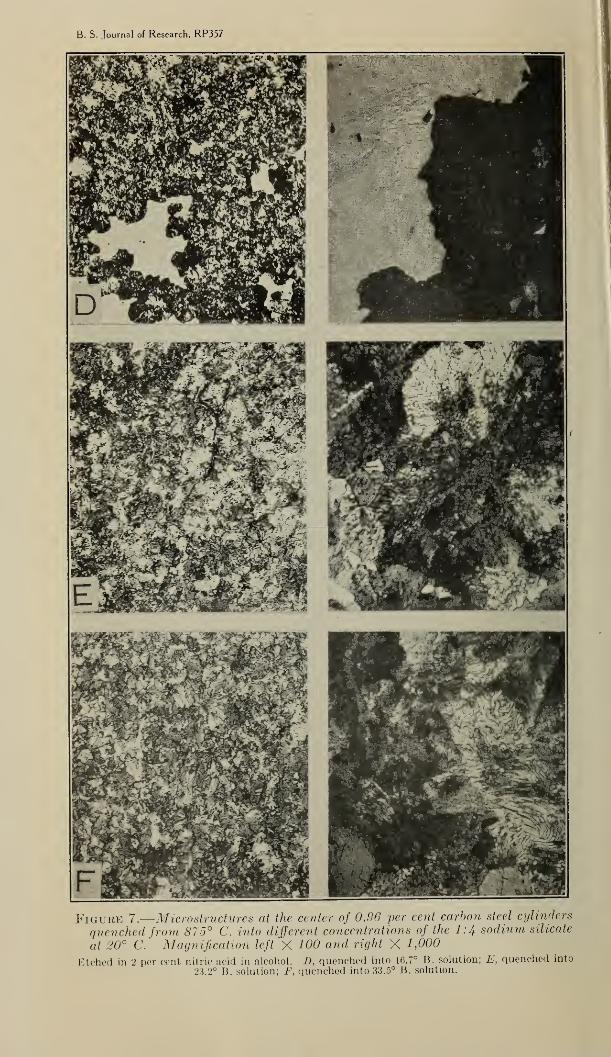
was an abrupt decrease in center hardness and in surface hardnessat concentrations of 9.5° and 13.2° B., respectively. Increasingamounts of troostite and finally sorbite and pearlite, in the structures
shown in Figure 6, C, and in Figure 7, D, E, and F, correspond withthese changes in hardness.The center cooling rate at 720° C, corresponding to the highest
concentration of the 1 : 4 silicate giving practically complete centerhardening, was 115° C. per second. The center cooling rates in
solutions of the 1:2.5 sodium silicate, as indicated in Figure 5,
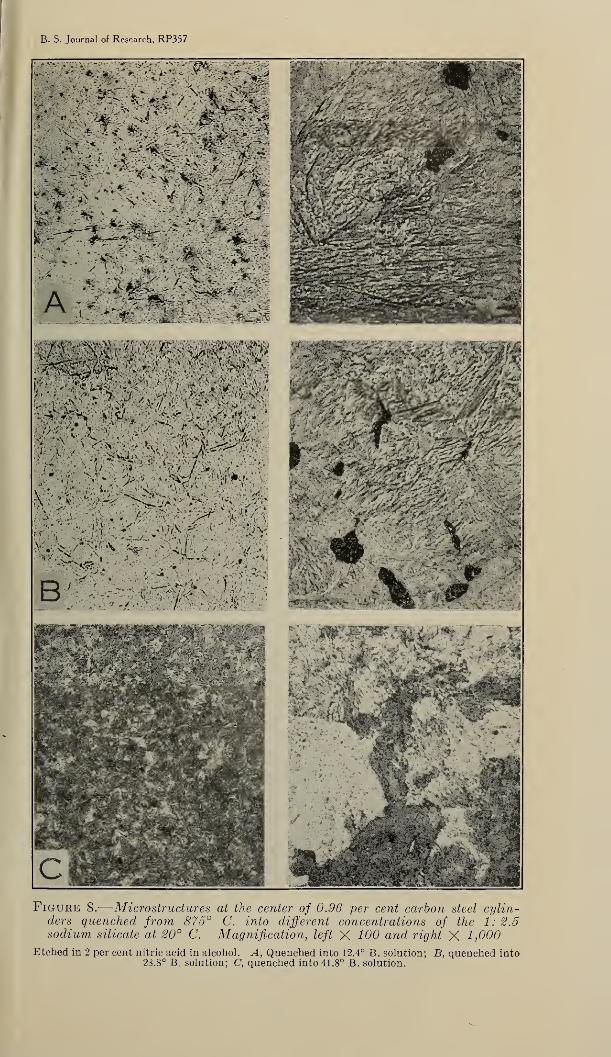
exceeded this critical rate in all concentrations up to approximatelya 34° B. solution. Consistent with this are the center hardnessvalues which show complete hardening on quenching in 28.8° B.solution of the 1:2.5 silicate. The structures at the center of thespecimens quenched in solutions of the 1:2.5 silicate are shown in
Figure 8.
It appears possible that the relatively slow cooling rates obtainedwith sodium silicate solutions may be explained by the deposits
of silica which formed on steel quenched in such solutions. Thedecrease in cooling rate with increase in concentration of sodiumsilicate may be due to the increase in thickness of the layer of silica
that deposits on the steel during quenching. While no definite
measurements were taken, it was observed that cylinders quenchedin low concentrations of sodium silicate had a much thinner layer of
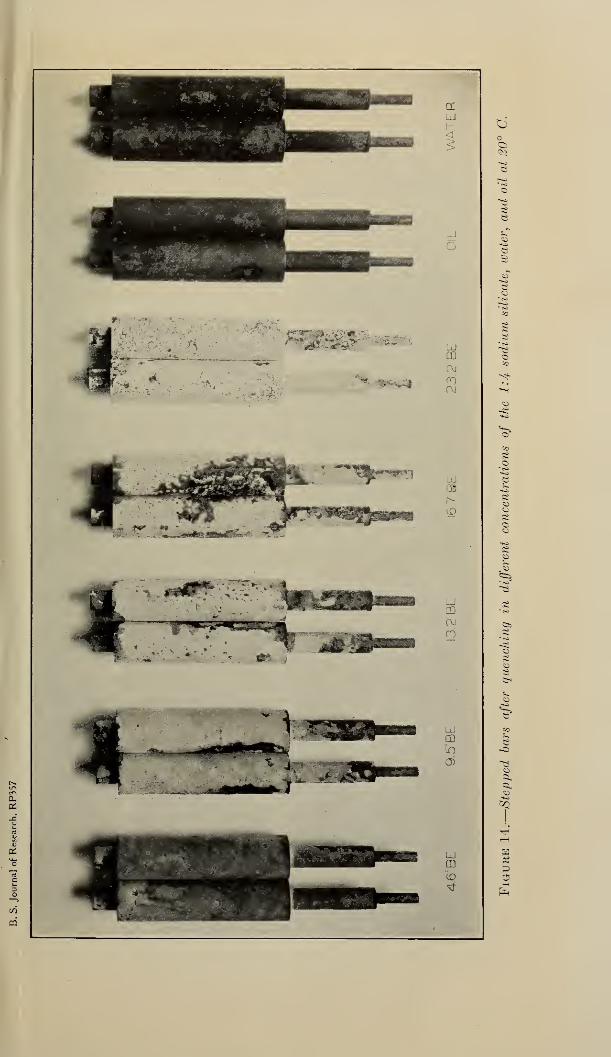
silica than those quenched into highly concentrated solutions. Pho-tographs of quenched "stepped" bars (fig. 14) verify this observation.The only known difference between the two sodium silicates used
in these experiments is that of the soda-to-silica ratios, the 1:2.5
silicate having the higher ratio—a greater proportion of alkali.
This may account for the greater cooling rates observed in the lower
B. S. Journal of Research, RP357
Figure 6.
—
Microstructures at the center of 0.96 per cent carbon steel cylindersquenched from 875° C. into different concentrations of the 1:4 sodium silicate
at 20° C.
Etched in 2 per cent nitric acid in alcohol. Magnification, left X 100 and right X 1,000. A, quenchedinto 4.6° B. solution; B, quenched into 9.5° B. solution; C, quenched into 13.2° B. solution.
B. S. Journal of Research, RP357
Figure 7.
—
Microstructures at the center of 0.96 per cent carbon steel cylinders
quenched from 875° C. into different concentrations of the 1:4 sodium silicate
at 20° C. Magnification left X 100 and right X 1,000
Etched in 2 per cent nitric acid in alcohol. D, quenched into 16.
23.2° B. solution; F, quenched into 33.5° B'° B. solution; E, quenched into
solution.
B. S. Journal of Research, RP357
*. 1' ^
i.
.-• v TJ-'«fc •** ^% *"*>
y&'eVWSSS*?-*' turfs'* '£*:
A%M?£,
*t~ - K *'» •."*-. :
S§$ L. >/.
*~;?JJBI'
*'$) ,; i
',*
Figure 8.
—
Microstructures at the center of 0.96 per cent carbon steel cylin-ders quenched from 875° C. into different concentrations of the 1: 2.5sodium silicate at 20° C. Magnification, left X 100 and right X 1,000
Etched in 2 per cent nitric acid in alcohol. A, Quenched into 12.4° B. solution; B, quenched into23.8° B. solution; C, quenched into 41.8° B. solution.
Hamill] Solutions for Quenching of Steels 565
concentrations of the 1 :2.5 silicate in that such solutions may exhibit
to a greater degree than solutions of the 1:4 silicate, the rapid
cooling of which is characteristic of aqueous caustic alkali solutions.
It may also be assumed that solutions of the 1:2.5 silicate made upto specific gravities of between 30° and 42° B. will give cooling
curves intermediate between those of water and of oil corresponding
to the intermediate rates obtained with solutions of the 1 : 4 silicate
of specific gravities between 10° and 24° B.
2 EFFECT OF VARYING THE TEMPERATURE OF SODIUM SILICATESOLUTIONS
The effect of temperature on the cooling characteristics of the
various concentrations of the 1 : 4 sodium silicate was studied, chiefly
in order to determine what variation in temperature of the quenching
media could be allowed without producing excessive variations in the
properties of the quenched steel.
800
600
700
600
500
400
300
200
i 100
4.6*BE 9.5* BE. a2°BE.
VVV y
\s \^
\
\
\\
\ V-2o^ 50*^ 20* 50- 2cN\ 0" \e 3C
2900a
I6.7*BE. 23.2* BE. 335° BE.
700
Wtr.
300
200SM" 20C
20^ ^50' •eot 2V-
c) A I> 1 2 tS 2 24 2B 32 C) A e
1
i 1
•IME2 l
- S
5 2ECO
2\]DS
4 28 32 <) <!i i) 1 2 ii 2 24 2a 3 2. 3e
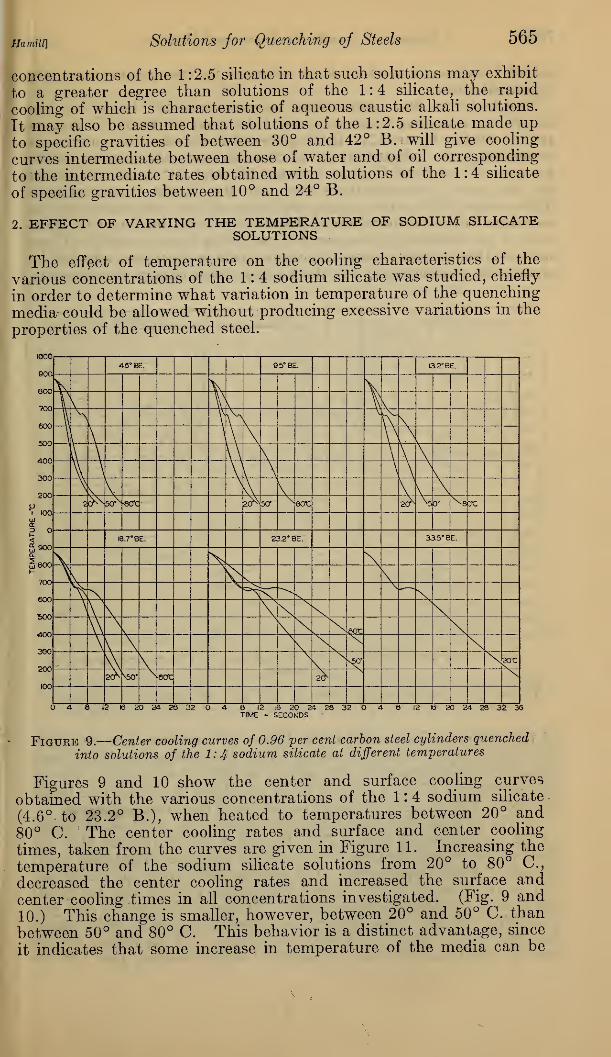
Figure 9.
—
Center cooling curves of 0.96 per cent carbon steel cylinders quenched
into solutions of the 1 : 4 sodium silicate at different temperatures
Figures 9 and 10 show the center and surface cooling curves
obtained with the various concentrations of the 1 : 4 sodium silicate
(4.6° to 23.2° B.), when heated to temperatures between 20° and80° C. The center cooling rates and surface and center cooling
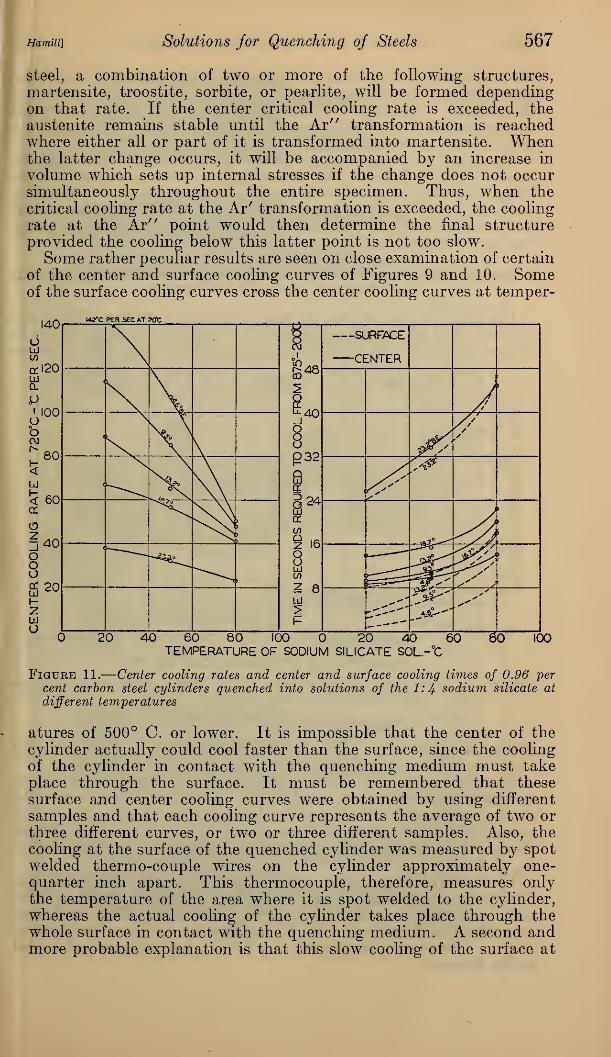
times, taken from the curves are given in Figure 11. Increasing the
temperature of the sodium silicate solutions from 20° to 80° C,decreased the center cooling rates and increased the surface and
center cooling times in all concentrations investigated. (Fig. 9 and
10.) This change is smaller, however, between 20° and 50° C. than
between 50° and 80° C. This behavior is a distinct advantage, since
it indicates that some increase in temperature of the media can be
566 Bureau of Standards Journal of Research [Vol. 7
allowed without expecting large changes in the properties of the
quenched steel.
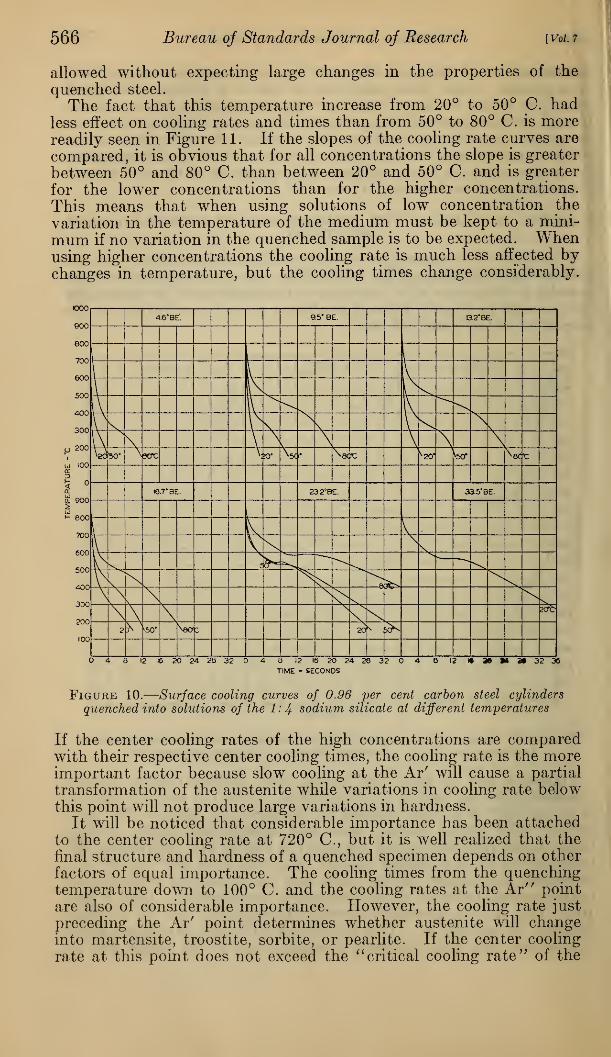
The fact that this temperature increase from 20° to 50° C. hadless effect on cooling rates and times than from 50° to 80° C. is morereadily seen in Figure 11. If the slopes of the cooling rate curves are
compared, it is obvious that for all concentrations the slope is greater
between 50° and 80° C. than between 20° and 50° C. and is greater
for the lower concentrations than for the higher concentrations.
This means that when using solutions of low concentration the
variation in the temperature of the medium must be kept to a mini-
mum if no variation in the quenched sample is to be expected. Whenusing higher concentrations the cooling rate is much less affected by-
changes in temperature, but the cooling times change considerably.
900
600
700
600
500
400
300
P 2°°
ui 100a.
p
a.Ula 9005Ulh 800
700
600
4.6° BE'. 9.5* BE. Q2*BE.
\
v>X
\ I KX
\S
V^J\ \ \ \y %0° \>o° \s< * ^ec re w W ^ect
16.7* BE. 23.2'BE. 33.5'BE.
\
1
I s,,500
400
300
200
100
2Cft
2 r^ 50° ^<> <I fi 12 I6 2 24 28 32 C) '
1
} 1
IME
2 I
- SE
5 2
CON24 29 32 C c i> 1 2 «» a» > a• 32 36
Figure 10.
—
Surface cooling curves of 0.96 per cent carbon steel cylinders
quenched into solutions of the 1:4 sodium silicate at different temperatures
If the center cooling rates of the high concentrations are comparedwith their respective center cooling times, the cooling rate is the moreimportant factor because slow cooling at the Ar r
will cause a partial
transformation of the austenite while variations in cooling rate belowthis point will not produce large variations in hardness.
It will be noticed that considerable importance has been attachedto the center cooling rate at 720° C, but it is well realized that the
final structure and hardness of a quenched specimen depends on other
factors of equal importance. The cooling times from the quenchingtemperature down to 100° C. and the cooling rates at the Ar" point
are also of considerable importance. However, the cooling rate just
preceding the Ar r
point determines whether austenite will changeinto martensite, troostite, sorbite, or pearlite. If the center cooling
rate at this point does not exceed the " critical cooling rate" of the
Hamill] Solutions for Quenching oj Steels 567
steel, a combination of two or more of the following structures,
martensite, troostite, sorbite, or pearlite, will be formed dependingon that rate. If the center critical cooling rate is exceeded, theaustenite remains stable until the Ar" transformation is reachedwhere either all or part of it is transformed into martensite. Whenthe latter change occurs, it will be accompanied by an increase in
volume which sets up internal stresses if the change does not occursimultaneously throughout the entire specimen. Thus, when thecritical cooling rate at the Ar' transformation is exceeded, the cooling
rate at the Ar" point would then determine the final structure
provided the cooling below this latter point is not too slow.
Some rather peculiar results are seen on close examination of certain
of the center and surface cooling curves of Figures 9 and 10. Someof the surface cooling curves cross the center cooling curves at temper-
Center cooling rates and center and surface cooling times of 0.96 percent carbon steel cylinders quenched into solutions of the 1:4 sodium silicate at
different temperatures
atures of 500° C. or lower. It is impossible that the center of thecylinder actually could cool faster than the surface, since the coolingof the cylinder in contact with the quenching medium must takeplace through the surface. It must be remembered that thesesurface and center cooling curves were obtained by using different
samples and that each cooling curve represents the average of two orthree different curves, or two or three different samples. Also, thecooling at the surface of the quenched cylinder was measured by spotwelded thermo-couple wires on the cylinder approximately one-quarter inch apart. This thermocouple, therefore, measures onlythe temperature of the area where it is spot welded to the cylinder,
whereas the actual cooling of the cylinder takes place through thewhole surface in contact with the quenching medium. A second andmore probable explanation is that this slow cooling of the surface at
568 Bvreau of Standards Journal of Research [Vol.7
the lower temperatures may be due to the formation of silica aroundthe thermocouple wires at the point where they were spot welded to
the cylinder. This layer of silica appears to be thicker at this pointof contact of the thermocouple wires than the layer left on the smoothsample after quenching.The effect of temperature on the concentrated .sodium silicate
solution (33.5° B.) was not investigated. The undiluted sodiumsilicate showed no promise of practical application as a quenchingmedium. Its very high viscosity hinders circulation of the coolantand movement of the quenched piece and also leaves a rather heavycoating of silica on the quenched steel.
3. STRUCTURE AND HARDNESS OF "STEPPED " SPECIMENS QUENCHED. IN SODIUM SILICATE SOLUTIONS
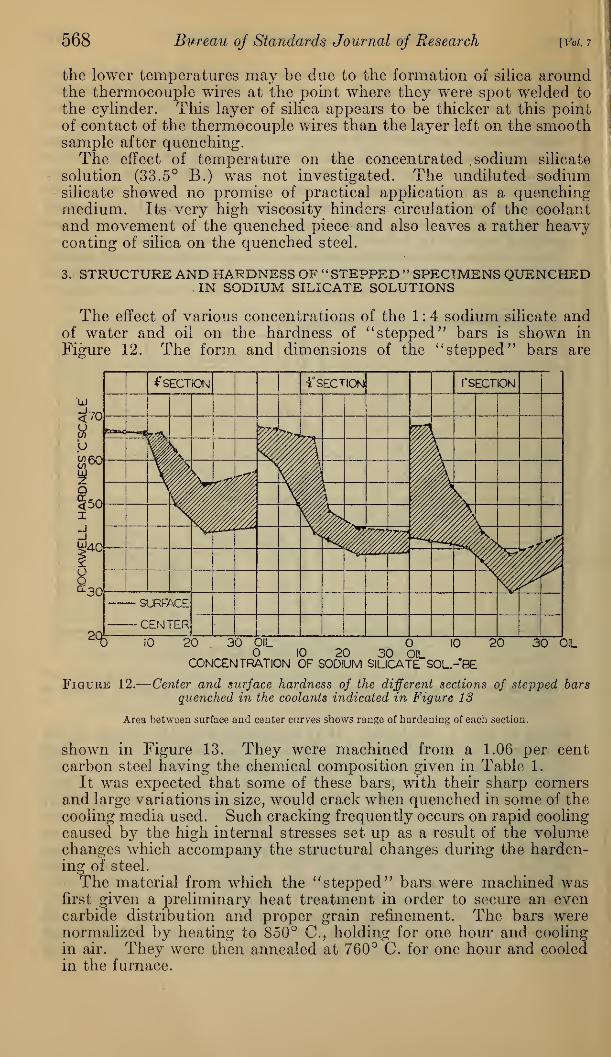
The effect of various concentrations of the 1 : 4 sodium silicate andof water and oil on the hardness of " stepped'' bars is shown in
Figure 12. The form and dimensions of the "stepped" bars are
30 OIL10 20
CONCENTRATION OF SODIUM SILICATE SOL.- BE
30OIL
Figure 12. -Center and surface hardness of the different sections of stepped barsquenched in the coolants indicated in Figure 13
Area between surface and center curves shows range of hardening of each section.
shown in Figure 13. They were machined from a 1.06 per centcarbon steel having the chemical composition given in Table 1.
It was expected that some of these bars, with their sharp cornersand large variations in size, would crack when quenched in some of thecooling media used. Such cracking frequently occurs on rapid cooling
caused by the high internal stresses set up as a result of the volumechanges which accompany the structural changes during the harden-ing of steel.
The material from which the "stepped" bars were machined wasfirst given a preliminary heat treatment in order to secure an evencarbide distribution and proper grain refinement. The bars werenormalized by heating to 850° C, holding for one hour and coolingin air. They were then annealed at 760° C. for one hour and cooledin the furnace.
IP
^M»M«HiMiitnH^:H-:*
UJ
o
IdCD
•CM
se
o•<s>
UJ C3
m s«.
K 1»
<D o
LdCD
en
UJCD
to
CD
O
«3$
^3
^*-
-e
S•^
5r-
a.a,
$2
PO
Hamiit\ Solutions for Quenching of Steels 569
The " stepped" bars so prepared for quenching were placed in anelectric muffle furnace at a temperature of 800° C., held at this tem-perature for one hour, and then quenched (two bars each) into thevarious media. The quenching was carried out by gripping the endof the bar at A (fig. 13) in tongs and rapidly lowering it vertically
into the desired medium. All quenching media were at a temper-ature of 20° C. and moving at a velocity of 3 feet per second. Thefloor of the furnace was covered with a layer of granular carbon aboutiy2 inches deep to reduce oxidation. The bars were laid on bricks in
the furnace and did not touch the carbon. Figure 14 shows the bars
after quenching.It was rather surprising that none of the bars cracked immediately
on quenching. However, specimens for hardness tests and micro-scopic examination cut from the bars that were quenched into the twofastest quenching media; that is, water and the 4.6° B. solution did
crack later.
The tendency of these bars to distort and crack could no doubthave been somewhat reduced if the bars had been moved rapidly upand down in a vertical position during the quenching instead of keep-ing the bar still while the quenching medium was flowing past the bar.
The latter method was used, however, because it had been used in the
previous experiments and it was desired to keep the conditions approx-imately the same.
«-*-• 2'*)*- I"
j
mm--T«r
Figure 13.
—
Design of the stepped bar used in quenching experiments
The rapid movement of the specimen vertically during quenchingwould also doubtless have reduced the thickness of the layer of silica
which formed on the sample, especially when quenching in the higherconcentrations of sodium silicate. These layers appear to be ratherthick (see fig. 14), but were never found to be over 0.005 to 0.01 inch,
and then only when quenching in solutions of the highest concen-trations.
Hardness tests were made on specimens, one-fourth inch thick, cutfrom the middle of each section, as indicated by the dotted lines inFigure 13. Figure 12 shows the results of the hardness tests taken at
the center and surface of these samples.A surface hardness of over 65 Rockwell was obtained on the one-
fourth and one-half inch diameter samples, that had been quenchedin water, and in 4.6°, 9.5°, and 13.2° B. sodium silicate solutions.
Approximately the same surface hardness was also obtained on the1-inch samples quenched in water and in the 4.6° B. sodium silicate
solution. On the other hand, a center hardness of over 65 wasobtained only on the one-fourth inch diameter samples that had beenquenched in water, and in 4.6° and 9.5° B. sodium silicate solutions.
Increase in concentration of the sodium silicate solutions or changein size to one-half or 1 inch produced a rapid decrease in hardness atthe center. This rapid decrease was accompanied by changes instructure from martensite with a small amount of primary troostite,
570 Bureau of Standards Journal of Research [Vol. 7
to martensite with a large amount of troostite, then to troosto-sorbite
with some lamellar pearlite, and finally to sorbite with large amountsof lamellar pearlite. Free carbides were also evident in all of thesemicrostruetures.The one-fourth inch sections of the bars that had been quenched in
water and in the 4.6° B. sodium silicate solution were the only sec-
tions that hardened completely throughout; that is, whose structurewas martensite free from troostite. These samples had a centerhardness of about 66.
It is evident from the hardness tests and their corresponding micro-structures that samples having a martensitic structure with someprimary troostite had practically the same hardness as those sampleshaving a martensitic structure free from primary troostite. It maybe concluded, therefore, that hardness tests alone can not be used as ameans of determining whether the steel is completely martensitic ornot. Microscopic or other tests are also necessary.
V. STABILITY OF SODIUM SILICATE QUENCHINGSOLUTIONS
Sodium silicate solutions like nearly all quenching solutions haveadvantages and disadvantages. Among their advantages are their
low cost and the fact that they do not readily corrode the steel.
The chief disadvantages of sodium silicate solutions as quenchingmedia are the formation of a thin coating of silica on the surface of the
quenched piece and the instability of some of the solutions. The thin
coating of silica that forms when using high concentrations of sodiumsilicate can be removed slowly by dissolving it in water or by boiling
in a dilute sodium hydroxide solution. In most cases it should notbe necessary to remove this coating.
Some trouble was experienced with the instability of certain of thesolutions of the 1 : 4 sodium silicate. A flocculent precipitate formedin the 9.5°, 13.2°, and 16.7° B. solutions on standing from six weeksto two months. However, solutions of these same concentrationsmade up with the addition of 2 per cent of sodium hydroxide of specific
gravity 1.065 at 20° C. showed no evidence of instability and breakingdown after three months. The addition of sodium hydroxide waswithout effect on the cooling rates of these solutions. Sodium silicate
solutions of 4.6° and 23.2° B. remained stable for more than three
months, even without additions of sodium hydroxide. The stability
of solutions of the 1: 2.5 sodium silicate was not investigated. Pre-sumably these solutions are more stable than solutions of the 1 :
4
sodium silicate on account of the higher soda content.
A test was also made to determine the stability of solutions of the1:4 sodium silicate at temperatures of from 20° to 60° C. This test
consisted of adding 2 per cent of a solution of sodium hydroxide of theconcentration given above to the sodium silicate solutions. Thesolution was then allowed to stand in a closed container for aboutthree weeks. No precipitate had formed at the end of this time. Adefinite amount of red-hot steel was quenched in these solutions so that
their temperature was raised from 20° to 60° C. This test was repeatedeight times on each solution. The solutions were then allowed to standfor three more weeks. No precipitate had formed in any of them.
Hamiii\ Solutions for Quenching of Steels 571
The cooling rates of the solutions were then tested and found to beunchanged thus showing that no breakdown had occurred. Thistest indicates that these solutions are fairly stable up to 60° C.
VI. SUMMARY1. Center cooling curves were obtained and hardness tests made on
cylinders of 0.96 per cent carbon steel, one-half inch in diameter and2 inches long, when quenched from 875° C. in 20, 60, and 100 per centglycol-water and 60 per cent glycerin-water solutions at 20° C. Theresults obtained are believed to justify the conclusion that these
solutions can not be used successfully as quenching media for inter-
mediate cooling between the rates obtained with water and with oil.
2. Similar cooling curves were determined for solutions of two sodi-
um silicates having ratios of Na2 to Si02 of 1:4 and 1:2.5, respec-
tively. Concentrations ranging from 4.6° to 23.2° B. for the 1:4silicate and 12.4° to 41.8° B. for the 1:2.5 silicate were used. In-creasing the concentration and the temperature of the 1:4 sodiumsilicate and the concentration of the 1 :2.5 sodium silicate lowered thecooling rates and increased the cooling times. The changes in cooling
rates and times of the 1 :4 sodium silicate were smaller at temperaturesbetween 20° and 50° C. than between 50° and 80° C.
3. Sodium silicate solutions can be used successfully to obtain inter-
mediate cooling rates between those obtained with water and withoil at 20° C. Three concentrations of the 1 :4 sodium silicate and twoof the 1:2.5 sodium silicate were found which gave intermediatecooling. These were the 9.5°, 13.2°, and 16.7° B. solutions of the 1 :4
sodium silicate and the 12.4° and 28.8° B. solutions of the 1:2.5
sodium silicate. However, there is very little difference in cooling
between the latter two solutions.
4. No correlation was found between the results obtained with thevarious concentrations of the 1 :4 and the 1 :2.5 soldium silicates.
5. The stability of solutions of the 1:4 sodium silicate was consider-
ably increased by the addition of 2 per cent of a solution of sodiumhydroxide (specific gravity of 1.065 at 20° C.) without changing thecooling speeds of the silicate solutions.
6. Quenching experiments on "stepped" bars of a 1.06 per centcarbon steel were made to determine the relation between the hard-ness and microstructures produced by the various concentrations of
the 1 :4 sodium silicate, water and oil at 20° C.7. It is possible that the aqueous solutions of other sodium silicates
having different soda-to-silica ratios may be more stable and give
better results than the ones used in the present investigation.
VII. ACKNOWLEDGMENTS
Acknowledgments are made to the Philadelphia Quartz Co., whodonated the two lots of sodium silicate, and the Carbide & CarbonChemical Corporation, who donated the ethylene glycol for these tests.
Grateful acknowledgment is also made to Dr. R. L. Dowdell,formerly of this bureau for his helpful suggestions and criticisms
throughout the progress of the work reported in this paper.