Page 1
Seghosime et al., 2018 118
Nigerian Journal of Environmental Sciences and Technology (NIJEST)
www.nijest.com
ISSN (Print): 2616-051X | ISSN (electronic): 2616-0501
Vol 2, No. 1 March 2018, pp 118 - 129
Aquifer Mapping in the Niger Delta Region: A Case Study of Edo
State, Nigeria
Seghosime, A.1,*, Ehiorobo, J.O.
1, Izinyon, O.C.
1 and Oriakhi, O.
1
1Department of Civil Engineering, Faculty of Engineering, University of Benin, Benin City, Nigeria
Corresponding Author: *[email protected]
ABSTRACT
In Nigeria, potable water is in short supply to the greater population and where available,
groundwater accounts for over 90% of the supply. Oil exploration and exploitation activities are
carried out in the Niger Delta region of Nigeria and this has affected the environment in this
region. However, naturally occurring traces of petroleum products in strata or petroleum losses
through spillages can contaminate groundwater, thus aquifer mapping in the Niger Delta Region
becomes crucial. The study involves collection, collation and analysis of relevant information and
data required for successful development of groundwater in Edo state. Groundwater in Edo State
occurs under different conditions in the various aquifers defined by the following geological units,
namely: Coastal Plain Sands of the Benin Formation, Ogwashi- Asaba, Bende- Ameki and Imo
Shale Group of the Tertiary Deposits, False-bedded Sandstones and the Nkporo Shale Group of the
Cretaceous deposits and the Basement Complex Rocks which only contain groundwater in the
overburden, faults and joints. From the information collated, groundwater levels are deepest in the
Ishan Plateau where it is about 171 metres above mean sea level at Ekpoma. Away from the
pleateau, groundwater rises southwards and northwards. At Aduwawa/Ikpoba Hill (Benin City),
the groundwater level is 40 metres, at Iguiye (Lagos Road, Benin City) to the west, the
groundwater level is 55 metres and at Fugar to the north, the groundwater level is 95 metres. The
groundwater flow direction is from the Plateau to all other areas with higher groundwater levels.
Therefore, aquifer mapping in the Niger Delta region is necessary, as it will help in assessing the
availability and development methods to be adopted.
Keywords: Groundwater, Aquifer, Borehole, Formation, Sediment, Niger Delta, Mapping
1.0. Introduction
As a result of rapid population growth and local development, potable water is in short supply and this
has led to the resurgence of groundwater potentials for steady and reliable water (Alabi et al., 2010;
Anomohanran, 2011a & 2011b). Water in the zone of saturation is normally referred to as ground
water and geology is therefore a controlling factor. Groundwater is very vital as it is a viable source of
portable water for domestic use (Peter, 2013). An aquifer is a water saturated geologic unit that will
yield water to well or spring at sufficient rate that can serve as practical source of water supply. It is
therefore a water-bearing formation or ground water reservoir. In countries like Denmark,
groundwater mapping is a high priority; the Danish government initiated the National Groundwater
Mapping Programme to achieve a detailed description of Danish aquifers with respect to localization,
extension, distribution and interconnection as well as vulnerability against contaminants (Stockmarr
and Thomsen, 2012). Naturally occurring traces of petroleum products in strata (from which water is
obtained) or petroleum losses through spillages can contaminate groundwater. This makes the aquifer
mapping in the Niger Delta more significant as it is a region where oil exploration and exploitation
activities are carried out.
A study on aquifer mapping and characterization in Anambra State indicated that Nanka formation in
Anambra basin has a high level of groundwater potential (Emenike, 2001). Also, aquifer mapping in
Onibode area, near Abeokuta South-West of Nigeria shows groundwater potentials (Oyedele, 2001).
Page 2
Nigerian Journal of Environmental Sciences and Technology (NIJEST) Vol 2, No. 1 March 2018, pp 118 - 129
Seghosime et al., 2018 119
Therefore, the occurrence of groundwater is controlled by geology and hydrogeology; hence
groundwater does not occur in desired quantities and qualities anywhere and everywhere (Kogbe,
1989). To successfully locate and drill a water borehole, the favourable conditions must be identified
(Egbai, 2012; Peter, 2013; Egbai et al., 2015). This is achieved by the water explorer or
hydrogeologist, employing a number of investigative tools. One of the direct tools includes
procurement and analysis of existing geological and hydrogeological information and maps. In
addition, subsurface information from existing borehole logs and pumping test data are required. The
indirect tool involves the use of geophysical surveys, most often the electrical resistivity survey to
identify subsurface features. Hence, it is necessary to continue to improve the data base for
groundwater development in a country in order to be able to identify a stable and steady ground water
sources for water supply. Therefore, this study will focus on aquifer mapping in the Niger Delta
Region of Nigeria using Edo State as a case study.
2.0. Materials and Methods
2.1. Study area
Edo State lies between latitude 05°44' to 07°34'N and longitude 05°04' and 06°45'E and covers a land
area of about 19,635 square kilometres (see Figure 1). The State is bounded to the East and South by
Delta State, to the North by Kogi State and to the West by Ondo and Ekiti States. It is located within
the rainforest zone of Nigeria with mean annual rainfall in the range of 1500 mm to 2500 mm and the
mean monthly temperature varying from 25 °C to 28 °C (Benin Kingdom/Edo State Weather, 2018).
Edo State is situated in a zone with relatively high rainfall. The State has two distinct seasons. These
are the wet (rainy) season and the dry season. The rainy season occurs between the months of April
and October with a short break in August. The dry season on the other hand lasts from October to
April with dry harmattan winds between December and February, but with the effect of global
warming and climate change, rains have been observed to fall irregularly almost in every month of the
year. The terrain consists of hilly or dissected country in the north and dry flat country, around Benin
City towards the South. There are also abundant fresh swamp waters flanking the main rivers,
particularly the Niger. The highest elevations are at the dissected and hilly terrains in the north with
heights of about 300 m and above such as the Igarra and Ososo hills in Edo North. Further south of
this zone lies the dissected areas around Auchi and Okpella with elevations decreasing southwards to
about 200-100 m down south to about 15 m above mean sea level. In the central region there is also
the Ishan Plateau with elevation reaching about 350 m above sea level.
2.2. Test methods
The method used for the study included the following;
a) Field work which includes:
i. Geophysical survey using (Vertical Electrical Soundings, VES)
ii. Water borehole drilling.
b) Data Processing and Plotting of Groundwater contours.
2.2.1. Electrical Resistivity Sounding (By Vertical Electrical Soundings)
Groundwater exploration was carried out in four geological regions (Quaternary Sediments, Tertiary
Sediments, Cretaceous Sediments and Basement Complex) and this was done using vertical electrical
soundings (VES) method with the aid of ABEM SAS 300 Tetrameters and other field accessories.
Geographical coordinates were obtained from Garmin Handheld GPS 72 receiver. The quantitative
interpretations of the VES data acquired at the regions were done initially with the aid of the
conventional partial curve matching technique subsequently fine-tuned with the aid of computer
assisted iteration techniques.
Page 3
Nigerian Journal of Environmental Sciences and Technology (NIJEST) Vol 2, No. 1 March 2018, pp 118 - 129
120 Seghosime et al., 2018
Figure 1: Map of Edo State (Source: https://www.nigeriagalleria.com/Nigeria/States_Nigeria/Edo/Edo_State.html)
2.2.2. Water borehole drilling
Water boreholes were drilled in some selected area of Edo State to obtain boreholes data. The water
borehole drilling involved drilling to a diameter of 8 inches using a water bore hole drilling rig
(KW30). The drill’s rotary machine (rotates at 30 rpm to ensure straight borings) was powered with a
hydraulic pump and then, compressed air drives to down-the-hole-hammer to pulverise the rock. Dust
and cuttings were flushed out of the borehole by compressed air.
2.2.3. Plotting of Groundwater Contours for Edo State
Contours were plotted using the groundwater levels obtained from the water borehole data in some
selected areas of Edo State. The water level at each location was determined and established with
reference to the ground elevation.
3.0. Results and Discussion
Table 1 show the classification of groundwater regimes.
Table 1: Classification of groundwater regimes S/N Region Group Nature of Aquifer
1 Recent deposits Niger Alluvium, River
Alluvium
Isolated minor sand lenses. Unimportant as
aquifer in Edo state
2 Quaternary deposits Benin formation Thick, unconsolidated sands with minor clays.
Highly permeable and productive aquifer
3 Tertiary deposits (a) Ogwashi- Asaba
formation (lignite series)
Thick fine to coarse grained sand with clays and
lignite.
(b) Bende- Ameki
formation
Thick, fine to medium and coarse sand with
sandy clays and shalely limestone
(c) Imo shale Very thick shale with lenticular sands. This is
essentially an aquiclude
4 Cretaceous
Deposits
False- bedded sandstone.
Fugar sandstone
Thick moderately permeable aquifers
5 Basement complex Meta sediments,
migmatites, gneisses, and
granites
Isolated aquifers in weathered zones, joints and
faults. Aquifer has low to moderate yields.
Page 4
Nigerian Journal of Environmental Sciences and Technology (NIJEST) Vol 2, No. 1 March 2018, pp 118 - 129
Seghosime et al., 2018 121
From Table 1, the results indicated that the alluvium deposits does not present important aquifers in
Edo State due to the isolated minor sand lenses it contains and that of the basement complex has low
to moderate yield.
Table 2 show the location where Electrical Resistivity tests were conducted.
Table 2: Electrical resistivity data in the quaternary sediments S/N Location Depth to top of Saturated Zone
(inferred) (m)
1 Oghada 65
2 Uhie 71.20
3 Umelu 75.0
4 Iguododo 96
5 Oghede 83
6 Evboesi 73
7 Evbuekabua 93
8 Evbuekoi 102
9 Ugbineh 20
Electrical resistivity carried out at Ugbineh was used as a case study for Quaternary sediments. The
resistivity data are presented in Table 3a and 3b while the curve is in Figure 2.
Table 3a: Resistivity data for Ugbineh
Synthetic Difference Spacing (m) Array
Geometric
Factor (K)
Apparent
Resistivity
(Roa) (Ohm-m) AB/2 MN
1 0.5 5.8905 301.76
1.5 0.5 13.744 204.7
2 0.5 24.74 202.1
3 0.5 56.156 248.93
4.5 0.5 126.84 317.58
7 0.5 307.48 338.75
10 0.5 627.93 327.26
14.5 1 659.73 373.12
21.5 1 1451 453.8
32 2 1607 797.59
47 5 1384 1750
100 10 3134 1400
150 20 3519 1739
220 20 7587 1400
320 50 6395 2493
Table 3b: Geoelectric parameters and inferred lithology for Ugbineh Layer Thickness (m) Depth(m) Resistivity(ohm-m) Lithology
1 0.5897 0.5897 335.4 Lateritic Topsoil
2 0.6154 1.205 109.2 Sandy Sub- soil
3 1.203 2.408 580.2 Sandy Clay
4 2.521 4.93 183.2 Clayey Formation
5 4.794 9.723 634.75842 Clay stone (Dry)
6 10.4 20.12 1456 Sandy Clay
7 61.29 81.41 3188 Sandy Clay
8 57.36 138.77 1453 Sand (Aquifer)
9 Undefined Undefined 537.1 Sandstone (Aquifer)
Results in Table 3a and 3b were interpreted, using sounding curves as shown in Figure 2. Note that
AB is the outer (current) electrode spacing and MN is the inner (potential) electrode spacing.
Page 5
Nigerian Journal of Environmental Sciences and Technology (NIJEST) Vol 2, No. 1 March 2018, pp 118 - 129
122 Seghosime et al., 2018
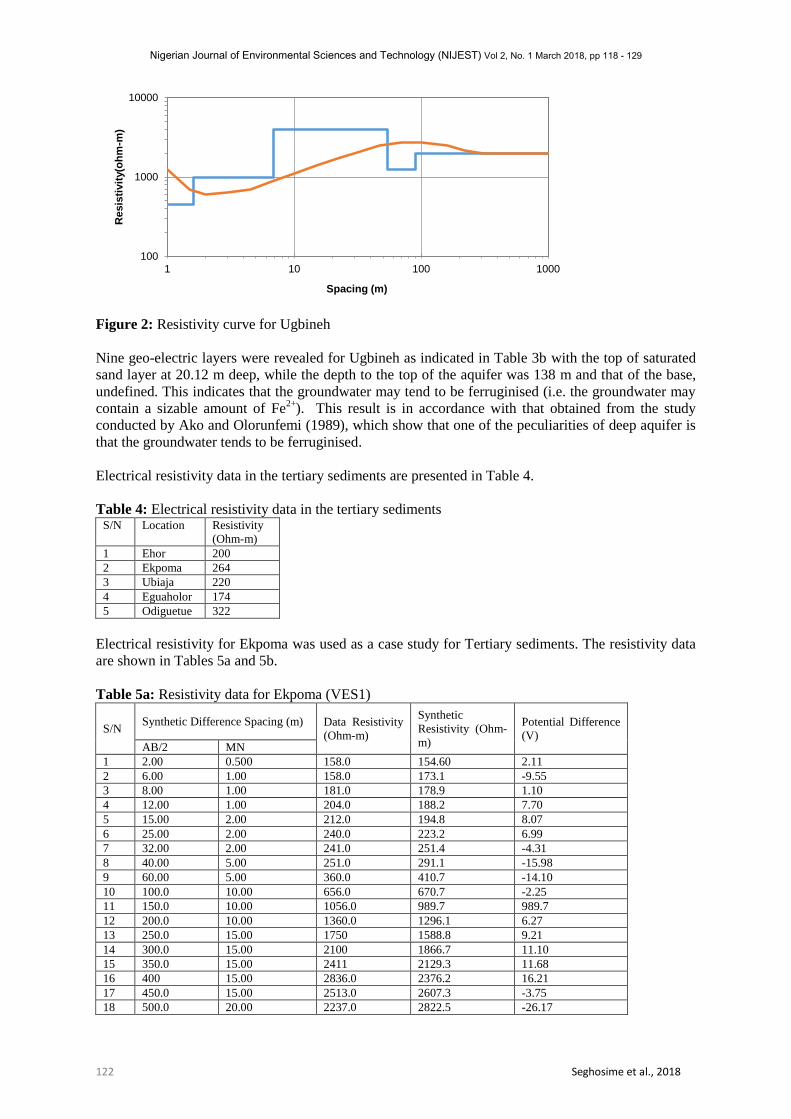
Figure 2: Resistivity curve for Ugbineh
Nine geo-electric layers were revealed for Ugbineh as indicated in Table 3b with the top of saturated
sand layer at 20.12 m deep, while the depth to the top of the aquifer was 138 m and that of the base,
undefined. This indicates that the groundwater may tend to be ferruginised (i.e. the groundwater may
contain a sizable amount of Fe2+
). This result is in accordance with that obtained from the study
conducted by Ako and Olorunfemi (1989), which show that one of the peculiarities of deep aquifer is
that the groundwater tends to be ferruginised.
Electrical resistivity data in the tertiary sediments are presented in Table 4.
Table 4: Electrical resistivity data in the tertiary sediments S/N Location Resistivity
(Ohm-m)
1 Ehor 200
2 Ekpoma 264
3 Ubiaja 220
4 Eguaholor 174
5 Odiguetue 322
Electrical resistivity for Ekpoma was used as a case study for Tertiary sediments. The resistivity data
are shown in Tables 5a and 5b.
Table 5a: Resistivity data for Ekpoma (VES1)
S/N Synthetic Difference Spacing (m) Data Resistivity
(Ohm-m)
Synthetic
Resistivity (Ohm-
m)
Potential Difference
(V) AB/2 MN
1 2.00 0.500 158.0 154.60 2.11
2 6.00 1.00 158.0 173.1 -9.55
3 8.00 1.00 181.0 178.9 1.10
4 12.00 1.00 204.0 188.2 7.70
5 15.00 2.00 212.0 194.8 8.07
6 25.00 2.00 240.0 223.2 6.99
7 32.00 2.00 241.0 251.4 -4.31
8 40.00 5.00 251.0 291.1 -15.98
9 60.00 5.00 360.0 410.7 -14.10
10 100.0 10.00 656.0 670.7 -2.25
11 150.0 10.00 1056.0 989.7 989.7
12 200.0 10.00 1360.0 1296.1 6.27
13 250.0 15.00 1750 1588.8 9.21
14 300.0 15.00 2100 1866.7 11.10
15 350.0 15.00 2411 2129.3 11.68
16 400 15.00 2836.0 2376.2 16.21
17 450.0 15.00 2513.0 2607.3 -3.75
18 500.0 20.00 2237.0 2822.5 -26.17
100
1000
10000
1 10 100 1000
Resis
tivit
y(o
hm
-m)
Spacing (m)
Page 6
Nigerian Journal of Environmental Sciences and Technology (NIJEST) Vol 2, No. 1 March 2018, pp 118 - 129
Seghosime et al., 2018 123
Table 5b: Geoelectric parameters and inferred lithology at Ekopma [VES1]
Layer No Apparent Resistivity
(Ohm-m) Thickness (m) Lithology
1 150 1.56 Topsoil
2 181 2.83 Sub topsoil
3 195 23.23 Clayey layer
4 29305 236.1 Dry/resistive sandy layer
5 492 - Saturated sand layer
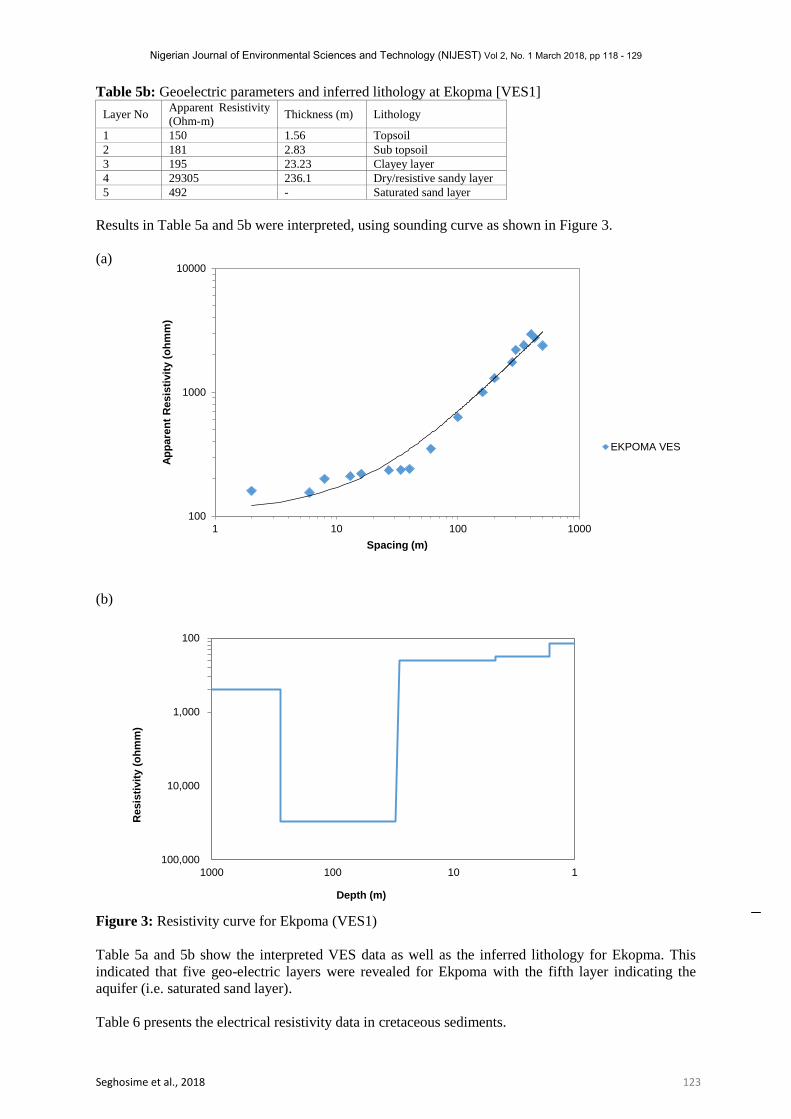
Results in Table 5a and 5b were interpreted, using sounding curve as shown in Figure 3.
(a)
(b)
Figure 3: Resistivity curve for Ekpoma (VES1)
Table 5a and 5b show the interpreted VES data as well as the inferred lithology for Ekopma. This
indicated that five geo-electric layers were revealed for Ekpoma with the fifth layer indicating the
aquifer (i.e. saturated sand layer).
Table 6 presents the electrical resistivity data in cretaceous sediments.
100
1000
10000
1 10 100 1000
Ap
pa
ren
t R
esis
tivit
y (
oh
mm
)
Spacing (m)
EKPOMA VES
100
1,000
10,000
100,000
1101001000
Resis
tivit
y (
oh
mm
)
Depth (m)
Page 7
Nigerian Journal of Environmental Sciences and Technology (NIJEST) Vol 2, No. 1 March 2018, pp 118 - 129
124 Seghosime et al., 2018
Table 6: Electrical resistivity data in cretaceous sediments S/N Location Data Resistivity
(Ohm-m)
1 Afuze 129
2 Usen 102
3 Ugbogui 65
4 Uzebba 163
5 Agennobode 98
6 Auchi 150
7 Ovbiomu 150
8 Iyakpi 195
9 Egori 254
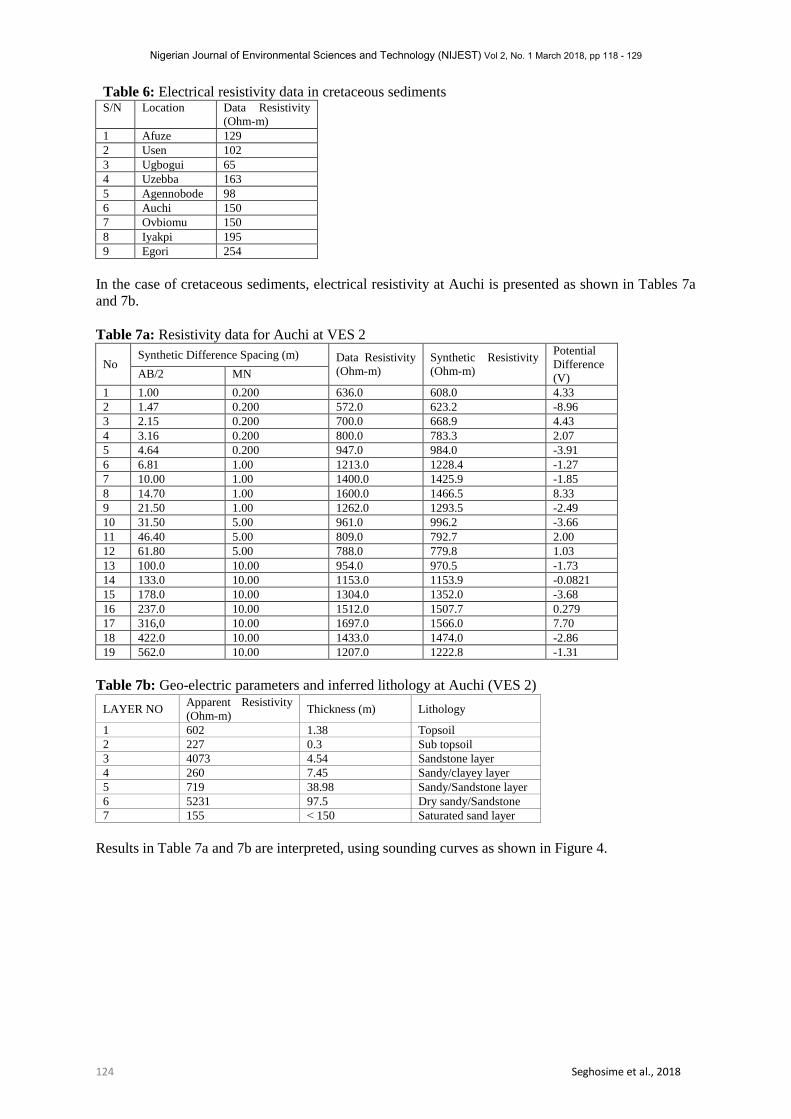
In the case of cretaceous sediments, electrical resistivity at Auchi is presented as shown in Tables 7a
and 7b.
Table 7a: Resistivity data for Auchi at VES 2
No Synthetic Difference Spacing (m) Data Resistivity
(Ohm-m)
Synthetic Resistivity
(Ohm-m)
Potential
Difference
(V) AB/2 MN
1 1.00 0.200 636.0 608.0 4.33
2 1.47 0.200 572.0 623.2 -8.96
3 2.15 0.200 700.0 668.9 4.43
4 3.16 0.200 800.0 783.3 2.07
5 4.64 0.200 947.0 984.0 -3.91
6 6.81 1.00 1213.0 1228.4 -1.27
7 10.00 1.00 1400.0 1425.9 -1.85
8 14.70 1.00 1600.0 1466.5 8.33
9 21.50 1.00 1262.0 1293.5 -2.49
10 31.50 5.00 961.0 996.2 -3.66
11 46.40 5.00 809.0 792.7 2.00
12 61.80 5.00 788.0 779.8 1.03
13 100.0 10.00 954.0 970.5 -1.73
14 133.0 10.00 1153.0 1153.9 -0.0821
15 178.0 10.00 1304.0 1352.0 -3.68
16 237.0 10.00 1512.0 1507.7 0.279
17 316,0 10.00 1697.0 1566.0 7.70
18 422.0 10.00 1433.0 1474.0 -2.86
19 562.0 10.00 1207.0 1222.8 -1.31
Table 7b: Geo-electric parameters and inferred lithology at Auchi (VES 2)
LAYER NO Apparent Resistivity
(Ohm-m) Thickness (m) Lithology
1 602 1.38 Topsoil
2 227 0.3 Sub topsoil
3 4073 4.54 Sandstone layer
4 260 7.45 Sandy/clayey layer
5 719 38.98 Sandy/Sandstone layer
6 5231 97.5 Dry sandy/Sandstone
7 155 ˂ 150 Saturated sand layer
Results in Table 7a and 7b are interpreted, using sounding curves as shown in Figure 4.
Page 8
Nigerian Journal of Environmental Sciences and Technology (NIJEST) Vol 2, No. 1 March 2018, pp 118 - 129
Seghosime et al., 2018 125
Figure 4: Resistivity curve for Auchi
Interpretation of the resistivity data revealed six geo-electric layers with the top of saturated sandy
layer below 150 m deep as indicated in Table 7b.
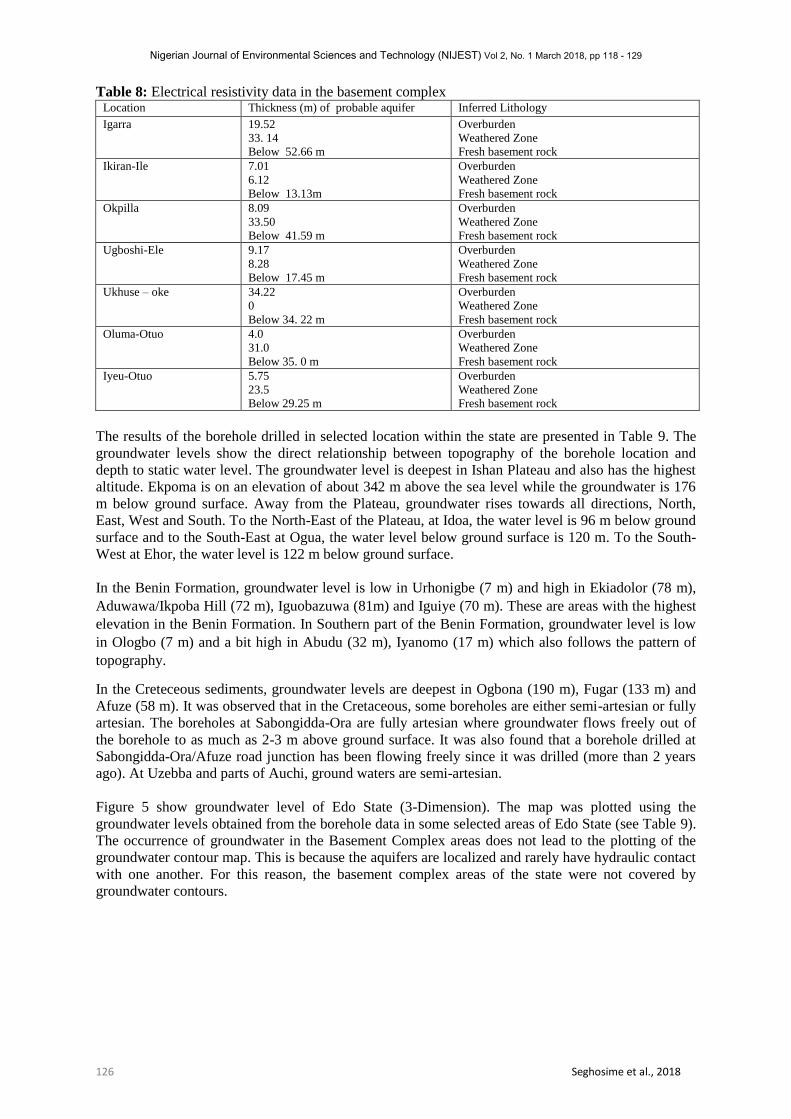
Electrical resistivity data in some selected basement complex locations are summarized in Table 8.
The data presented in Table 8 show the erratic nature of aquifers in the basement complex rocks.
Thicknesses of overburden and weathered rocks vary widely from location to location. Data obtained
from Oluma-Otuo and Iyeu-Otuo which is barely 2 km apart revealed a great deal of variation. At
Ukhuse-Oke, weathered rocks are absent and the overburden provides the only aquifer in the location.
100
1000
10000
1 10 100 1000
Ap
pa
ren
t R
esis
tivit
y (
oh
mm
)
Spacing (m)
Series1
2 per. Mov. Avg.(Series1)
AUCHI VES
100
1000
10000
1101001000
Resis
tivit
y (
oh
mm
)
Depth (m)
Page 9
Nigerian Journal of Environmental Sciences and Technology (NIJEST) Vol 2, No. 1 March 2018, pp 118 - 129
126 Seghosime et al., 2018
Table 8: Electrical resistivity data in the basement complex Location Thickness (m) of probable aquifer Inferred Lithology
Igarra 19.52
33. 14
Below 52.66 m
Overburden
Weathered Zone
Fresh basement rock
Ikiran-Ile 7.01
6.12
Below 13.13m
Overburden
Weathered Zone
Fresh basement rock
Okpilla 8.09
33.50
Below 41.59 m
Overburden
Weathered Zone
Fresh basement rock
Ugboshi-Ele 9.17
8.28
Below 17.45 m
Overburden
Weathered Zone
Fresh basement rock
Ukhuse – oke 34.22
0
Below 34. 22 m
Overburden
Weathered Zone
Fresh basement rock
Oluma-Otuo 4.0
31.0
Below 35. 0 m
Overburden
Weathered Zone
Fresh basement rock
Iyeu-Otuo 5.75
23.5
Below 29.25 m
Overburden
Weathered Zone
Fresh basement rock
The results of the borehole drilled in selected location within the state are presented in Table 9. The
groundwater levels show the direct relationship between topography of the borehole location and
depth to static water level. The groundwater level is deepest in Ishan Plateau and also has the highest
altitude. Ekpoma is on an elevation of about 342 m above the sea level while the groundwater is 176
m below ground surface. Away from the Plateau, groundwater rises towards all directions, North,
East, West and South. To the North-East of the Plateau, at Idoa, the water level is 96 m below ground
surface and to the South-East at Ogua, the water level below ground surface is 120 m. To the South-
West at Ehor, the water level is 122 m below ground surface.
In the Benin Formation, groundwater level is low in Urhonigbe (7 m) and high in Ekiadolor (78 m),
Aduwawa/Ikpoba Hill (72 m), Iguobazuwa (81m) and Iguiye (70 m). These are areas with the highest
elevation in the Benin Formation. In Southern part of the Benin Formation, groundwater level is low
in Ologbo (7 m) and a bit high in Abudu (32 m), Iyanomo (17 m) which also follows the pattern of
topography.
In the Creteceous sediments, groundwater levels are deepest in Ogbona (190 m), Fugar (133 m) and
Afuze (58 m). It was observed that in the Cretaceous, some boreholes are either semi-artesian or fully
artesian. The boreholes at Sabongidda-Ora are fully artesian where groundwater flows freely out of
the borehole to as much as 2-3 m above ground surface. It was also found that a borehole drilled at
Sabongidda-Ora/Afuze road junction has been flowing freely since it was drilled (more than 2 years
ago). At Uzebba and parts of Auchi, ground waters are semi-artesian.
Figure 5 show groundwater level of Edo State (3-Dimension). The map was plotted using the
groundwater levels obtained from the borehole data in some selected areas of Edo State (see Table 9).
The occurrence of groundwater in the Basement Complex areas does not lead to the plotting of the
groundwater contour map. This is because the aquifers are localized and rarely have hydraulic contact
with one another. For this reason, the basement complex areas of the state were not covered by
groundwater contours.
Page 10
Nigerian Journal of Environmental Sciences and Technology (NIJEST) Vol 2, No. 1 March 2018, pp 118 - 129
Seghosime et al., 2018 127
Table 9: Summary of borehole data at selected area in Edo State S/N Borehole
Locality
Elevation
(ASL)
(m)
Total
Depth
(m)
Final
Water
Level (m)
Water
Level
(ASL)
(m)
Yeild
(m3/h)
Draw
Down (m)
Specific
Capacity
(m3/h/m)
1 Aduwawa/
Ikpoba Hill
102 148.3 72 40 136 4.05 33.6
2 Esigie
St. Emmanuel
90 111.5 56.07 33.9 109.8 3.1 35.4
3 Iyaro 93 114.3 52.6 40.4 71.0 1.87 37.9
4 New Benin 92 143.3 54.5 37.5 - - -
5 Guiness 78 87 43.6 34.4 108.3 3.1 34.9
6 Edo Textile Mill 62 102 55.5 6.5 67.0 7.5 8.9
7 Obayantor 59 85.7 34.3 24.7 45.8 2.8 16.4
8 Iyanomo 31 106.5 17.00 14.00 23.8 4.7 5.01
9 Abudu 59 75.4 31.5 27.5 76.6 3.1 24.7
10 Ologbo 10 98 6.5 3.5 43.1 4.0 10.8
11 Urhonigbe 41 57 7.00 3.4 41.6 4.0 10.3
12 Okada Dry 87 114.0 51.7 35.3 79.5 3.1 25.6
13 Ugoneki 95 95.3 56.7 38.3 17.2 1.6 10.8
14 Iguobazuwa 138 117.8 81.0 57 40.1 3.7 10.8
15 Iguiye 125 110.6 69.8 55.2 41.4 5.0 8.3
16 Ogan 155.7 160.1 101 54.7 30.1 2.5 12
17 Ugo 98 155.7 63.6 34.4 55.1 1.2 46
18 Okhuo - 141.7 18.7 - 45.4 3.1 14.6
19 Ogba 64 81 3.1 60.9 76.7 4.4 17.4
20 Iguovbiobo 109 79 64 45 52.2 1.6 32.6
21 Ehor 260 204.7 122 138 45.8 2.5 18.3
22 Ugieghudu 247 208.7 119 128 - - -
23 Iruekpen 337 - 171 166 - - -
24 Igieduma 259 - 122 137 - - -
25 Ekpoma 342 350 171 171 - - -
26 Evboerhen 214 - 91 123 - - -
27 Idoa 238 138 96 142 - - -
28 Ogua 250 200 120 130 - - -
29 Igbanke 224 220 119.6 104.4 37.2 7.2 5.2
30 Ugboha 146 168.5 86 60 37.9 20 1.9
31 Eguaholor 187 213 112 77 13.2 14.6 0.9
32 Afuze 88 140.8 57.6 30.4 55.1 3.7 14.9
33 Ihievbe - 124.6 43.6 - 9.6 21.8 0.44
34 Auchi 224 203 96.6 126 41.3 31.1 1.3
35 Agenebode 79 169 114 -35 40 7.2 5.5
36 Fugar 218 175 133 95 26.5 1.6 16.6
37 Uzebba - 127 Artesian 76.6 11.8 6.5
38 Sabongidda-Ora 94 141 Artesian 76.6 8.7 8.8
39 Ogbona 249 221 190 59 56.8 12.5 4.5
40 Oben - 94 31 - 20 6.2 3.2
41 Sobe - 148 43 - 15.5 31.7 0.5
42 Ekenwan Army
Barracks
58 140 40 18 - - -
43 Amedokhian
(Uromi)
- 296 199 - - - -
44 Udo 120 1.31 72 48 26.5 6.2 4.3
45 Ekiadolor - 162 78 - - - -
Page 11
Nigerian Journal of Environmental Sciences and Technology (NIJEST) Vol 2, No. 1 March 2018, pp 118 - 129
128 Seghosime et al., 2018
Figure 5: Groundwater level map of Edo State in 3-Dimension
4.0. Conclusion
The mapping of aquifers in Edo State has led to the collection, collation and analysis of relevant
information and data required in the successful development of groundwater in the state. The study
has revealed that drilling should not be done on a trial and error basis, but has to be guided by
available geological and hydrogeological data. Therefore, it is necessary to continue to improve on the
data base for groundwater development in the state. To achieve this, it is recommended that the State
Government should compel all groundwater developers to lodge their data with the State Urban Water
Page 12
Nigerian Journal of Environmental Sciences and Technology (NIJEST) Vol 2, No. 1 March 2018, pp 118 - 129
Seghosime et al., 2018 129
Board. The Benin Owina River Basin Development Authority should also be encouraged to maintain
a data bank for groundwater resources.
References
Ako B. D. and Olorunfemi, M. O. (1989). Geoelectrical Survey for Groundwater in the Newer Basals
of Vom, Plateau State. Journal of Mining and Geol., 10, pp. 23-30.
Alabi, A. A., Bello, R., Ogungbe, A. S. and Oyerinde, H. O. (2010). Determination of Groundwater
Potential in Lagos State University, Ojo; using geoelectric methods (Vertical electrical sounding and
horizontal profiling). Report Opinion, 24, pp. 68-75.
Anomohanran, O. (2011a). Underground Water Exploration of Oleh, Nigeria Using the Electrical
Resistivity Method. Scientific Res. Essays, 6, pp. 4295-4300.
Anomohanran, O. (2011b). Determination of Groundwater Potential in Asaba, Nigeria Using Surface
Geoelectric Sounding. Int. J. Physical Sci., 6, pp. 7651-7656.
Benin Kingdom/ Edo State Weather, (2018), [Online], Available:
http://www.edoworld.net/Edotourismweather.html [Accessed: 14th September, 2018].
Egbai, J. C. (2012). Geoelectric Evaluation of Groundwater Potential in the Sedimentary Region of
Abavo, Delta State and Urhonigbe, Edo State, Nigeria. International Journal of Research and Review
in Sciences, 10(3), pp. 491.
Egbai, J. C., Efeya, P. and Iserhien-Emekeme, R. E. (2015). Geoelectric Evaluation of Aquifer
Vulnerability in Igbanke, Orhionmwon Local Government Area of Edo State, Nigeria. International
Journal of Science, Environment and Technology, 4(3), pp. 701-715.
Emenike, E. A. (2000). Geophysical Exploration for Groundwater in a Sedimentary Envrionment: A
case study from Nanka over Nanka Formation in Anambra Basin, Southeastern, Nigeria. Global Jour.
of Pure and Applied Sciences. 7(1), pp. 97-110.
Kogbe, C.A. (1989). Geology of Nigeria, 1st Edition, Rock View (Nig.) Ltd., Plot 1234, Zaramaganda,
Km.8, Yakubu Gowon Way, Jos, Nigeria.
Map of Edo State (2016), [Online], Available:
https://www.nigeriagalleria.com/Nigeria/States_Nigeria/Edo/Edo_State.html [Accessed: 26th
September, 2016].
Oyedele, K. F. (2001). Geo-Electric Investigation of Groundwater Resources at Onibode Area, Near
Abeokuta South-West Nigeria, pp. 501-504.
Peter, O. O. (2013). Groundwater Potential Evaluation and Aquifer Characterization Using Resistivity
Method in Southern Obubra, Southeastern Nigeria. International Journal of Environmental Sciences,
4, pp. 96-105.
Stockmarr, J. and Thomsen, R. (2012). Water Supple in Denmark. The Danish Action Plan for
Promotion of Eco-efficient Technologies – Danish Lessons. Danish Ministry of the Environment.


![Benin and Western Nigeria Offshore Basins: A Stratigraphic ...offshore basin is correlated with the Nkporo Shale in the Anambra Basin by [13]. Therefore, the Npkoro shale, as it named](https://static.documents.pub/doc/80x56/5e6f81aaec5eee485975692f/benin-and-western-nigeria-offshore-basins-a-stratigraphic-offshore-basin-is.jpg)


