40
AR Using our financial expertise to do good Annual Results ′16 for the year ended 31 December 2016

AR
Using our financial expertise to do good
Annual Results ′16
for the year ended 31 December 2016

2 NEDBANK GROUP LIMITED – Annual Results '16 AR
Macroeconomic environment – slow growth with improving outlook
-1
0
1
2
3
4
5
6
7
00 02 04 06 08 10 12 14 16 18 20
GDP growth (%)
SA SSA
Note: Sub Sahara Africa forecasts from IMF | SA forecasts from Nedbank Economic Unit
SSA forecast
2017: 2.9%
2018: 3.6%
2019: 4.2%
2020: 4.3%
SA forecast
2017: 1.1%
2018: 1.5%
2019: 2.1%
2020: 2.8%
Long-term bond yield & CDS spread (%)
0
100
200
300
400
500
5
6
7
8
9
10
11
12
08 09 10 11 12 13 14 15 16
R186 bond (LHS) CDS 5-year (RHS)

3 NEDBANK GROUP LIMITED – Annual Results '16 AR
Macroeconomic environment – peak in interest rates & inflation
bodes well for future credit growth
0
2
4
6
8
10
12
14
16
00 02 04 06 08 10 12 14 16 18 20
CPI Repo rate Repo rate (forecast)
SA interest rates & inflation (%)
-15
-5
5
15
25
35
45
00 02 04 06 08 10 12 14 16
Households (yoy%) Companies (yoy%)
Average Prime
2017: 10.4%
2018: 9.8%
2019: 10.0%
2020: 11.0%
Average CPI
2017: 5.8%
2018: 5.6%
2019: 6.0%
2020: 5.6%
Credit growth (%)
Companies
2017: 9.4%
2018: 8.7%
2019: 10.4%
2020: 12.3%
Households
2017: 6.7%
2018: 8.3%
2019: 9.4%
2020: 9.2%
2012 2013 2014 2015 2016 2017 2018 2019 2020
SA GDP growth 2.2 2.3 1.6 1.3 0.4 1.1 1.5 2.1 2.8
Sub Sahara Africa GDP growth (IMF) 4.3 5.2 5.1 3.4 1.4 2.9 3.6 4.2 4.347
Ave SA prime 8.8 8.5 9.1 9.4 10.5 10.4 9.8 10 11
Ave SA CPI 5.7 5.8 6.1 4.6 6.3 5.8 5.6 6 5.6
Private sector credit extens ion growth (excl investments and bi l l s ) 10 6.3 7.9 8.8 5.6 6.1 8.3 9.6 9.9
Corporate loans advances growth 19 11.4 14 14.6 7.3 9.4 8.7 10.4 12.3
Household advances growth 9.6 5.3 3.7 4.3 1.8 6.7 8.3 9.4 9.2
non reta i l 10.5 7.7 13.1 14.2 9.5 5.8 8.5 10.1 10.7
1. Slow household credit growth in 2016 includes impact from Abil, which will normalise post April 2017
1

4 NEDBANK GROUP LIMITED – Annual Results '16 AR
-40
-30
-20
-10
0
10
20
30
3.0
3.4
3.7
4.1
4.4
4.8
5.1
5.5
95 97 99 01 03 05 07 09 11 13 15 17
Deviation from neutral Effective rand
PPP calculation
% from adjusted
"fair" value
Log of index
0
50
100
150
200
250
300
350
0
5
10
15
20
25
Ma
r 12
Ju
l 12
Nov 1
2
Ma
r 13
Ju
l 13
Nov 1
3
Ma
r 14
Ju
l 14
Nov 1
4
Ma
r 15
Ju
l 15
Nov 1
5
Ma
r 16
Ju
l 16
Nov 1
6
Ma
r 17
Rand/USD (LHS) Rand/GBP (LHS)
Naira/USD (RHS)
Macroeconomic environment – currency volatility, rand
appreciation vs. naira depreciation
Rand to US $, GBP £ | Naira to US $ Rand on PPP basis (%)
5 NEDBANK GROUP LIMITED – Annual Results '16 AR
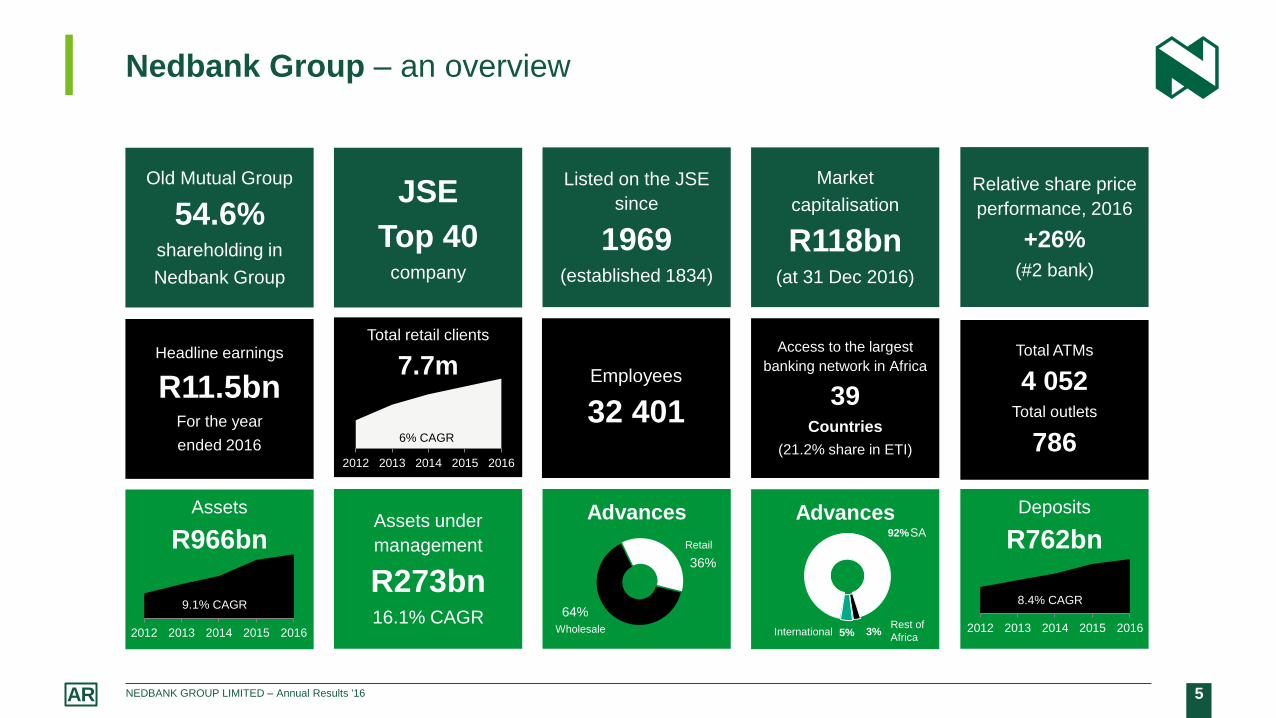
Nedbank Group – an overview
Relative share price
performance, 2016
+26%
(#2 bank)
Assets under
management
R273bn 16.1% CAGR
Assets
R966bn
2012 2013 2014 2015 2016
Old Mutual Group
54.6% shareholding in
Nedbank Group
Deposits
R762bn
Listed on the JSE
since
1969 (established 1834)
Access to the largest
banking network in Africa
39 Countries
(21.2% share in ETI)
2012 2013 2014 2015 2016
JSE
Top 40 company
Market
capitalisation
R118bn (at 31 Dec 2016)
Total retail clients
7.7m
Employees
32 401
2012 2013 2014 2015 2016
Advances
64%
36%
Retail
Wholesale
Total ATMs
4 052 Total outlets
786
Advances
92%
3% 5% Rest of
Africa International
SA
Headline earnings
R11.5bn For the year
ended 2016 6% CAGR
9.1% CAGR 8.4% CAGR
6 NEDBANK GROUP LIMITED – Annual Results '16 AR
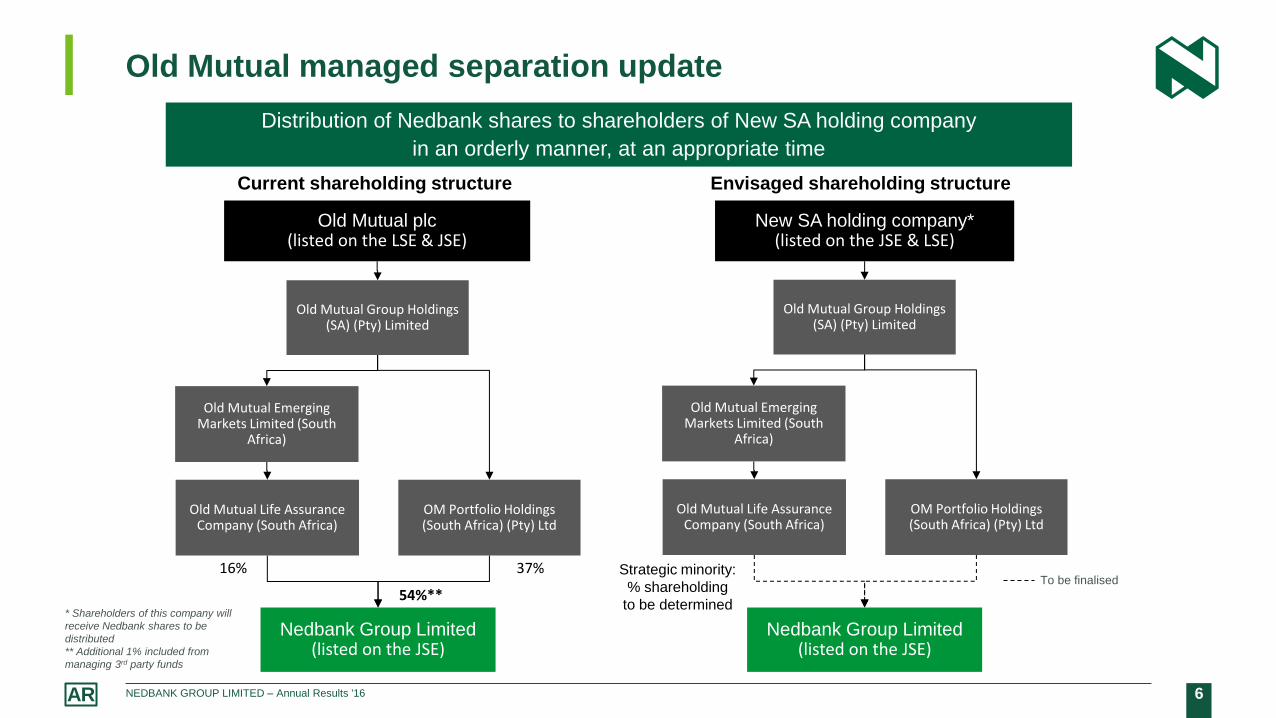
Old Mutual managed separation update
Old Mutual plc (listed on the LSE & JSE)
Old Mutual Life Assurance Company (South Africa)
Nedbank Group Limited (listed on the JSE)
16%
Old Mutual Group Holdings (SA) (Pty) Limited
OM Portfolio Holdings (South Africa) (Pty) Ltd
37%
Old Mutual Emerging Markets Limited (South
Africa)
Strategic minority:
% shareholding
to be determined
New SA holding company* (listed on the JSE & LSE)
Nedbank Group Limited (listed on the JSE)
Current shareholding structure Envisaged shareholding structure
To be finalised
54%**
Old Mutual Life Assurance Company (South Africa)
Old Mutual Group Holdings (SA) (Pty) Limited
OM Portfolio Holdings (South Africa) (Pty) Ltd
Old Mutual Emerging Markets Limited (South
Africa)
Distribution of Nedbank shares to shareholders of New SA holding company
in an orderly manner, at an appropriate time
* Shareholders of this company will
receive Nedbank shares to be
distributed
** Additional 1% included from
managing 3rd party funds

7 NEDBANK GROUP LIMITED – Annual Results '16 AR
Our purpose, vision & strategy
TO USE OUR FINANCIAL EXPERTISE TO DO GOOD FOR INDIVIDUALS, FAMILIES, BUSINESSES & SOCIETY
TO BE THE MOST ADMIRED FINANCIAL SERVICES PROVIDER IN AFRICA BY OUR STAFF, CLIENTS, SHAREHOLDERS, REGULATORS & COMMUNITIES
PEOPLE 2020 – Transforming our leadership, culture & talent capability
BRAND 2020 – Developing a distinctive brand
MANAGED EVOLUTION & DIGITAL FAST LANE – An innovative technology transformation creating an agile digital platform
GOVERNANCE & REGULATORY CHANGE – Leveraging risk management to be a strategic & competitive differentiator
FAIR SHARE 2030 – Guiding the creation of financial solutions that deliver on Nedbank’s purpose
LEADING TRANSFORMATION – Actively promoting a globally competitive financial sector while creating a more equitable society
OPTIMISING THE WAY WE OPERATE
Delivering innovative market-leading
client experiences
Growing our transactional
banking franchise faster than the
market
Being operationally excellent in all we do
Managing scarce resources to
optimise economic outcomes
Providing our clients with access to the
best financial services network in
Africa
Pu
rpo
se
Vis
ion
S
tra
teg
ic
focu
s a
rea
s
Str
ate
gic
en
ab
lers
8 NEDBANK GROUP LIMITED – Annual Results '16 AR
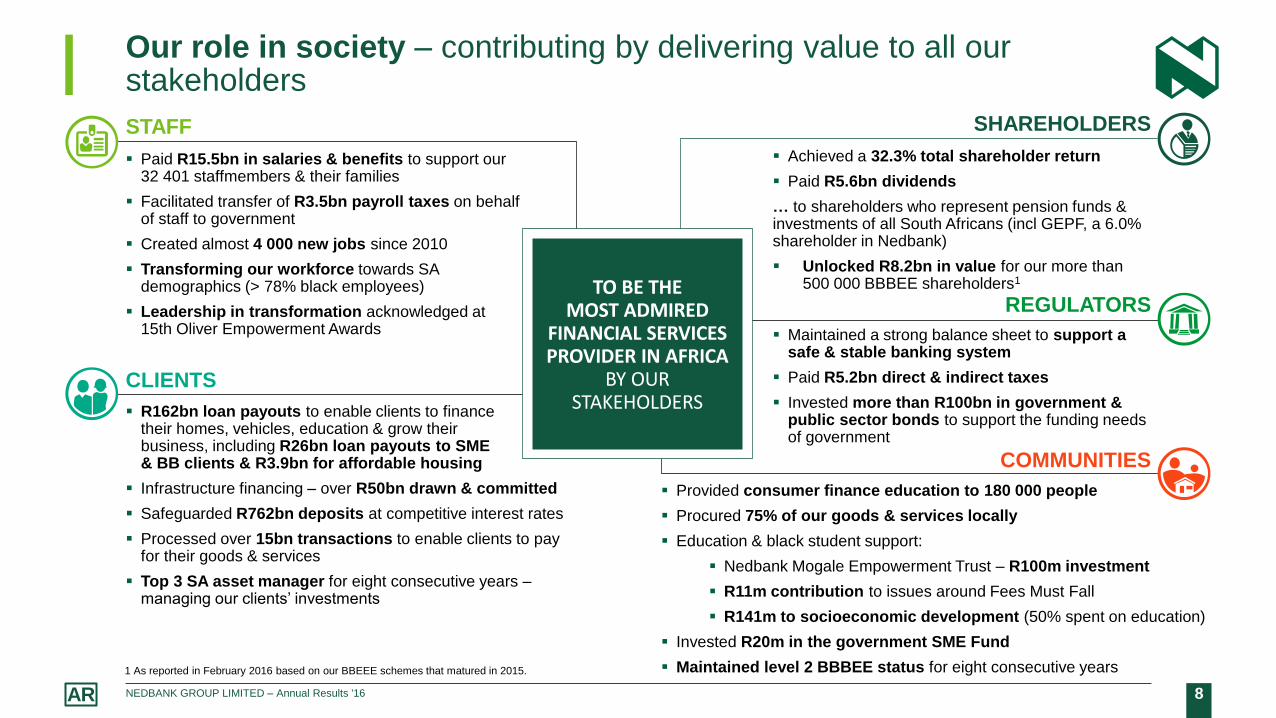
Our role in society – contributing by delivering value to all our stakeholders
STAFF
CLIENTS
SHAREHOLDERS
REGULATORS
COMMUNITIES
Paid R15.5bn in salaries & benefits to support our 32 401 staffmembers & their families
Facilitated transfer of R3.5bn payroll taxes on behalf of staff to government
Created almost 4 000 new jobs since 2010
Transforming our workforce towards SA demographics (> 78% black employees)
Leadership in transformation acknowledged at 15th Oliver Empowerment Awards
R162bn loan payouts to enable clients to finance their homes, vehicles, education & grow their business, including R26bn loan payouts to SME & BB clients & R3.9bn for affordable housing
Infrastructure financing – over R50bn drawn & committed
Safeguarded R762bn deposits at competitive interest rates
Processed over 15bn transactions to enable clients to pay for their goods & services
Top 3 SA asset manager for eight consecutive years – managing our clients’ investments
Achieved a 32.3% total shareholder return
Paid R5.6bn dividends
… to shareholders who represent pension funds & investments of all South Africans (incl GEPF, a 6.0% shareholder in Nedbank)
Unlocked R8.2bn in value for our more than 500 000 BBBEE shareholders1
Maintained a strong balance sheet to support a safe & stable banking system
Paid R5.2bn direct & indirect taxes
Invested more than R100bn in government & public sector bonds to support the funding needs of government
Provided consumer finance education to 180 000 people
Procured 75% of our goods & services locally
Education & black student support:
Nedbank Mogale Empowerment Trust – R100m investment
R11m contribution to issues around Fees Must Fall
R141m to socioeconomic development (50% spent on education)
Invested R20m in the government SME Fund
Maintained level 2 BBBEE status for eight consecutive years
TO BE THE MOST ADMIRED
FINANCIAL SERVICES PROVIDER IN AFRICA
BY OUR STAKEHOLDERS
1 As reported in February 2016 based on our BBEEE schemes that matured in 2015.

9 NEDBANK GROUP LIMITED – Annual Results '16 AR
Delivering value to shareholders
NAV per share (cents)
11 7
21
13 1
43
14
39
5
15
68
5
15
83
0
12 13 14 15 16
75
2
89
5
1 0
28
1 1
07
1 2
00
12 13 14 15 16
16.4 17.2 17.2 17.0
16.5
13.1 13.0 13.5
13.0
14.2
16.8
18.1
12 13 14 15 16
ROE (excl GW)
COE
ROE (excl GW & ETI)
ROE & cost of equity (%) Dividend per share (cents)
NAV ROE > COE Dividends
+0.9% +8.4%
CAGR: 7.8% CAGR: 12.4%

10 NEDBANK GROUP LIMITED – Annual Results '16 AR
Earnings contribution (Rm)
53%
43%
10%
(3%) (3%)
CIB RBB Wealth Rest of Africa Centre
Excellent performance from our managed operations – headline
earnings up 16.2%
Headline earnings (Rm) 5
20
8
4 4
60
1 1
34
69
1
(662)
6 0
14
4 9
60
1 1
92
(287)
(41
4)
CIB RBB Wealth Rest ofAfrica
Centre
2015 2016
+15.5%
+11.2%
+5.1%

11 NEDBANK GROUP LIMITED – Annual Results '16 AR
Key performance indicators
2016 2015 2016¹ 2015¹
Headline earnings (Rm) 5.9% 11 465 10 831 16.2% 11 839 10 187
ROE (excl goodwill) 16.5% 17.0% 18.1% 16.8%
Diluted HEPS growth 4.8% 8.5% 15.1% 2.8%
Preprovisioning operating profit growth 4.4% 7.3% 10.0% 4.1%
Net interest margin 3.41% 3.30%
Credit loss ratio 0.68% 0.77%
NIR-to-expenses ratio 82.9% 83.3%
Tier 1 CAR 13.0% 12.0%
Assets under management (Rbn) 6.2% 273 257
Dividend per share (cents) 8.4% 1 200 1 107
1 Excluding associate income/losses, as well as funding costs.
Managed operations

12 NEDBANK GROUP LIMITED – Annual Results '16 AR
Solid headline earnings growth supported by strong revenue growth
Headline earnings (Rm)
10 831 10 831
13 372
15 127
13 106 12 130
11 465 11 465
2 541
1 755 235 (2 256)
(976)
(665)
2015 NII NIR Impairments Expenses Associateincome
Direct tax& other
2016
+10.6%
(4.9%)
+8.1% +8.6%
(> 100.0%)
5.9
16.2
Group Managedoperations
HE growth (%)
16.5 18.1
Group Managedoperations
ROE excl GW (%)
13 NEDBANK GROUP LIMITED – Annual Results '16 AR
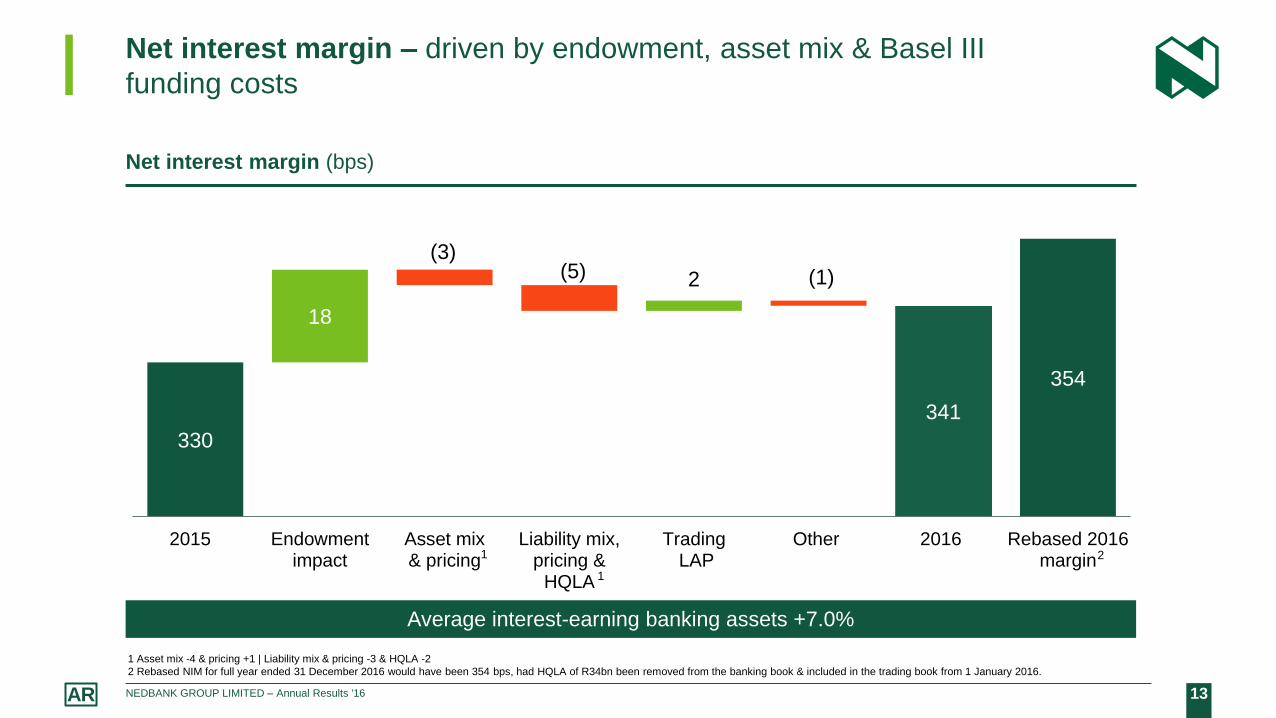
Net interest margin – driven by endowment, asset mix & Basel III
funding costs
330
341
354
18
(3) (5) 2 (1)
2015 Endowmentimpact
Asset mix& pricing
Liability mix,pricing &
HQLA
Trading LAP
Other 2016 Rebased 2016margin
Net interest margin (bps)
1 Asset mix -4 & pricing +1 | Liability mix & pricing -3 & HQLA -2
2 Rebased NIM for full year ended 31 December 2016 would have been 354 bps, had HQLA of R34bn been removed from the banking book & included in the trading book from 1 January 2016.
Average interest-earning banking assets +7.0%
1
1 2

14 NEDBANK GROUP LIMITED – Annual Results '16 AR
13
7
15
5
12
7
14
3
10
0 18
14
15
2
16
2
12
1
14
5
10
6 19
15
Commercialproperty
Termloans
Otherloans
Homeloans
Vehiclefinance
Personalloans
Card
2015 2016
2 1
Share3 Trend
Commercial
property 40.8
Core corporate4 22.3
Home loans 14.4
Vehicle finance 27.7
Personal loans 10.9
Card 13.7
Selective origination
& unique positioning
Gross advances (Rbn)
Mostly
ST &
volatile
Wholesale
Advances – solid growth & market share gains across key categories
(AIEBA +7.0%)
BA900 market share
+10.9% +1.8% +4.5%
(4.7%)
+5.6%
+7.9% +5.7%
Leveraging
leadership & pipeline
Retail
1 Terms loans & other longer dated loans in CIB
2 Other loans include overdrafts, overnight loans, preference shares, deposits placed under reverse repurchase agreements & other smaller corporate loans.
3 BA900 – December 2016.
4 Core corporate loans comprise commercial mortgages, corporate overdrafts, corporate credit cards, corporate instalment credit, foreign sector loans, public sector loans, preference shares, factoring accounts &
other corporate loans (other loans and advances excluding household personal loans).

15 NEDBANK GROUP LIMITED – Annual Results '16 AR
BA900 market share
Share3 Trend
Wholesale 22.3
Commercial 17.4
Household 18.7
Foreign
currency 12.6
Deposits (Rbn)
Deposits – good transactional & Basel III deposit growth
101
62
82
45
49
276
156
107
68
90
52
52
293
152
Current &savings acc
CashMgmt
NCDs L/Tdebt
Fixeddeposits
Call &term
Other
2015 2016
Driven by client
behaviour in the
cycle
Increasing
contractual
tenure
(+ for Basel III)
Transactional
franchise
+5.9%
+15.8% +9.7%
+9.4%
7.0%
6.0%
(2.6%)
Increasing
behavioural tenure
(+ for Basel III)
Lengthen funding
profile
Linked to
trading
activities
1 Nedbank’s market share of medium & long term wholesale funding is 31% and 26% respectively. The favourable Basel III treatment of longer-term funding reduces the need to hold HQLA thereby reducing the
all-in marginal cost of longer-term wholesale funding vs short-term wholesale funds. Including NCDs with tenure of > 30 days.
2 Includes foreign client liabilities, deposits received under repurchase agreements & other.
3 BA900 – December 2016
2
1
16 NEDBANK GROUP LIMITED – Annual Results '16 AR
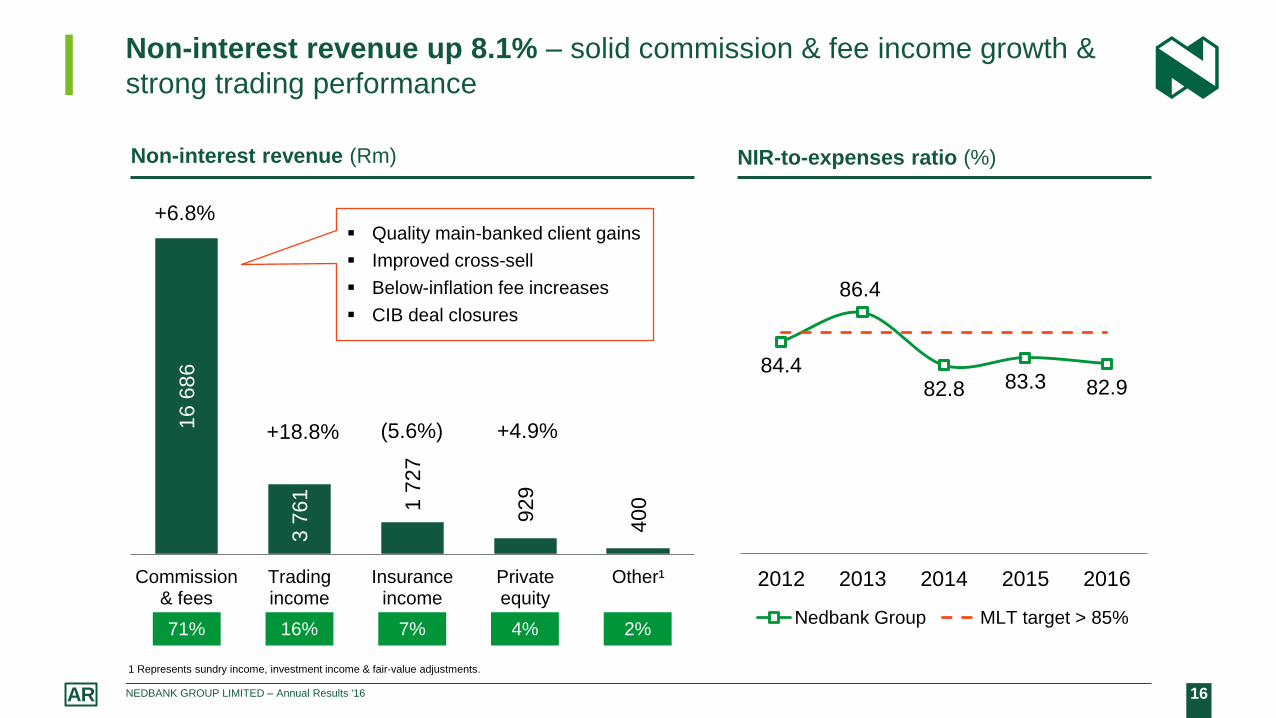
16
68
6
3 7
61
1 7
27
92
9
40
0
Commission& fees
Tradingincome
Insuranceincome
Privateequity
Other¹
Non-interest revenue up 8.1% – solid commission & fee income growth &
strong trading performance
84.4
86.4
82.8 83.3 82.9
2012 2013 2014 2015 2016
Nedbank Group MLT target > 85%
NIR-to-expenses ratio (%) Non-interest revenue (Rm)
+6.8%
+18.8% (5.6%) +4.9%
Quality main-banked client gains
Improved cross-sell
Below-inflation fee increases
CIB deal closures
1 Represents sundry income, investment income & fair-value adjustments.
71% 16% 7% 4% 2%
17 NEDBANK GROUP LIMITED – Annual Results '16 AR
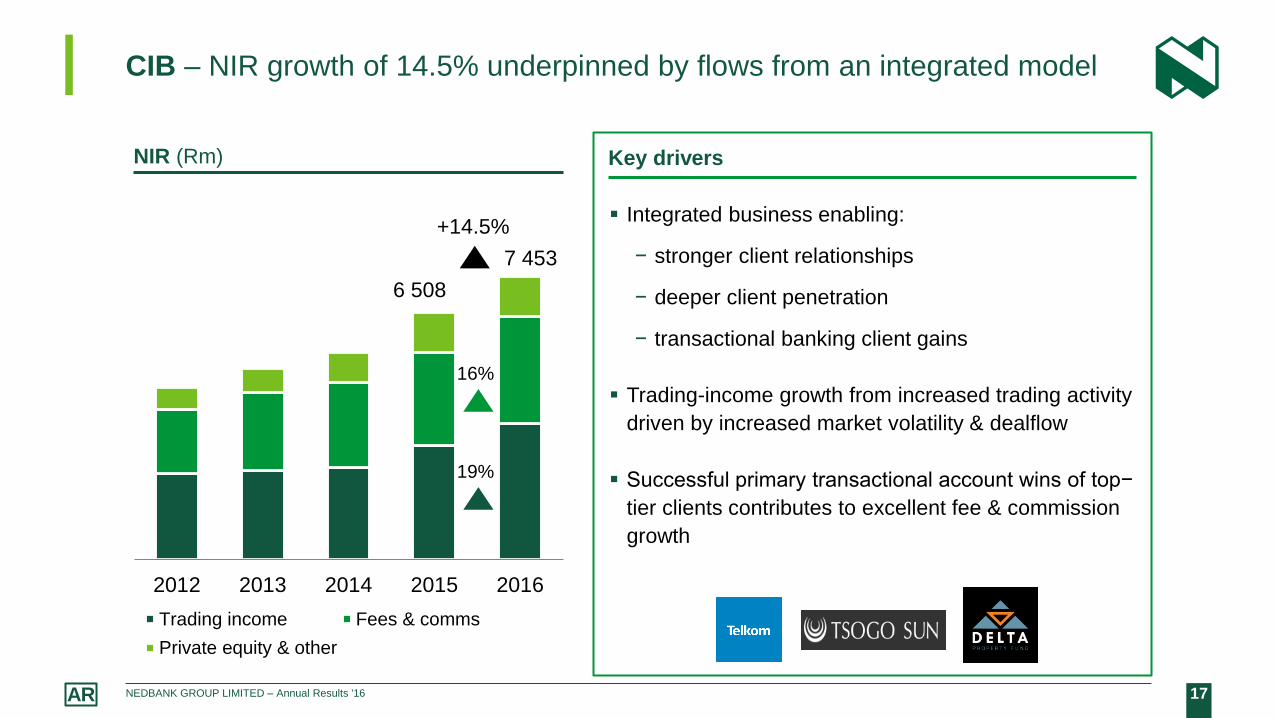
CIB – NIR growth of 14.5% underpinned by flows from an integrated model
Key drivers
Integrated business enabling:
− stronger client relationships
− deeper client penetration
− transactional banking client gains
Trading-income growth from increased trading activity
driven by increased market volatility & dealflow
Successful primary transactional account wins of top−
tier clients contributes to excellent fee & commission
growth
NIR (Rm)
16%
19%
+14.5%
6 508
7 453
2012 2013 2014 2015 2016
Trading income Fees & comms
Private equity & other
18 NEDBANK GROUP LIMITED – Annual Results '16 AR
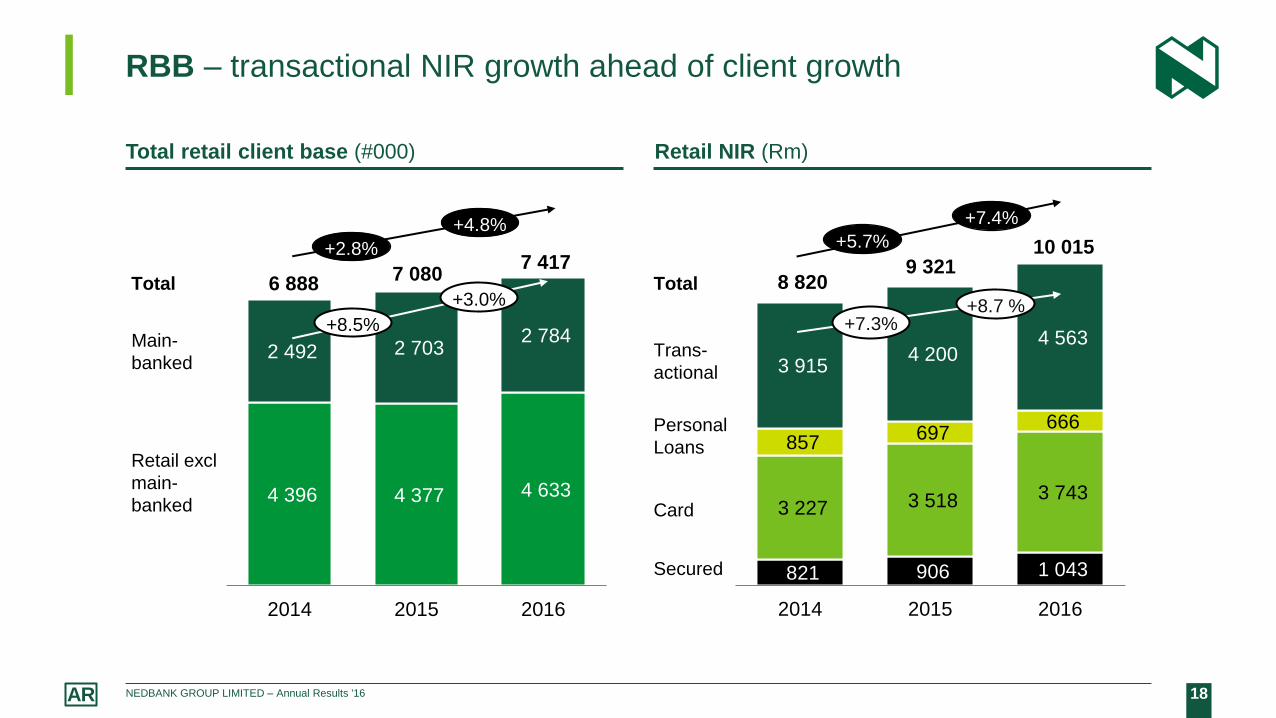
RBB – transactional NIR growth ahead of client growth
Total retail client base (#000) Retail NIR (Rm)
4 396 4 377 4 633
2 492 2 703 2 784
2014 2015 2016
Retail excl
main-
banked
Total 7 417
7 080 6 888
+2.8%
+8.5%
+3.0%
Main-
banked
+4.8%
Card
Trans-
actional
Secured
Personal
Loans
Total
821 906 1 043
3 227 3 518 3 743
857 697
666
3 915 4 200
4 563
2014 2015 2016
9 321 8 820
+7.4%
+5.7%
+8.7 %
+7.3%
10 015
19 NEDBANK GROUP LIMITED – Annual Results '16 AR
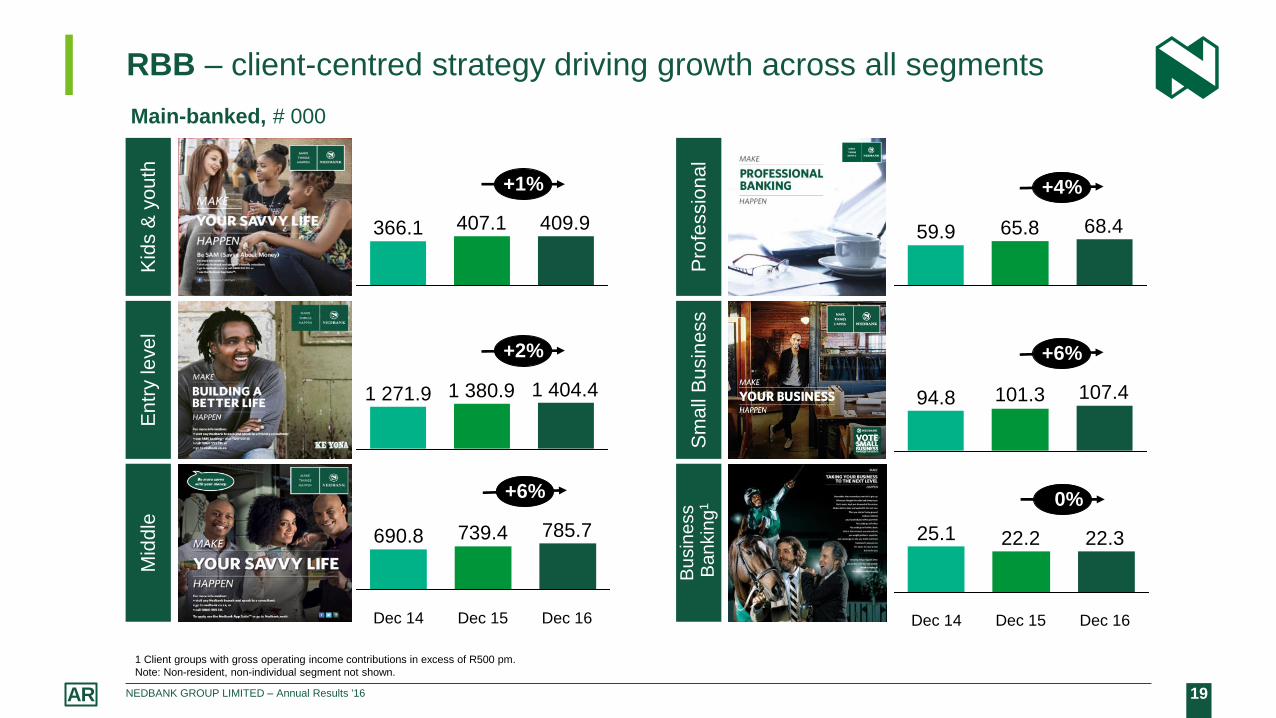
RBB – client-centred strategy driving growth across all segments
Main-banked, # 000
Kid
s &
yo
uth
E
ntr
y le
ve
l M
idd
le
Pro
fessio
na
l S
ma
ll B
usin
ess
Bu
sin
ess
Ba
nkin
g1
1 Client groups with gross operating income contributions in excess of R500 pm.
Note: Non-resident, non-individual segment not shown.
Dec 16
+6%
785.7
Dec 15
739.4
Dec 14
690.8
1 380.9 1 271.9
+2%
1 404.4
+6%
107.4 101.3 94.8
+4%
59.9 65.8 68.4 366.1 409.9 407.1
+1%
22.3 22.2
Dec 14
25.1
Dec 16 Dec 15
+0%

20 NEDBANK GROUP LIMITED – Annual Results '16 AR
RBB – building more enduring client relationships through transactional product cross-sell
(1.4)
Card1
Personal Loans
MFC
Home Loans
Total Retail clients
Investments
TP
2.1
9.3
3.2
(3.3)
(3.2)
7.5
% CAGR growth Dec 15 – Dec 16
# 000
Transactional clients with product line
74% 74%
55% 57%
51% 48%
23% 24%
38% 38%
27% 27%
Number of product line clients
with transactional products
1 Prior–year card client numbers restated to align with a definition change implemented in 2016.
939
910
306
1 311
316
560
549
478
495
1 432
5 514
5 925
% CAGR growth Dec 15 – Dec 16 Dec 15 Dec 16
Dec 15 Dec 16
4.6
8.8
1.8
1.9
5.8

21 NEDBANK GROUP LIMITED – Annual Results '16 AR
Credit loss ratio – improvement underpinned by quality portfolio
Credit loss ratio (CLR) (bps) Cluster credit loss ratio (CLR) (bps)
48.9% 43.9% 4.4% 2.7% Banking
advances
105 106
79 77
68
2012 2013 2014 2015 2016
1 Nedbank through-the-cycle target range: 60 – 100 bps
0.40
1.14
0.15
1.25
0.34
1.12
0.08
0.98
CIB RBB Wealth RoA
2015 2016
1
22 NEDBANK GROUP LIMITED – Annual Results '16 AR
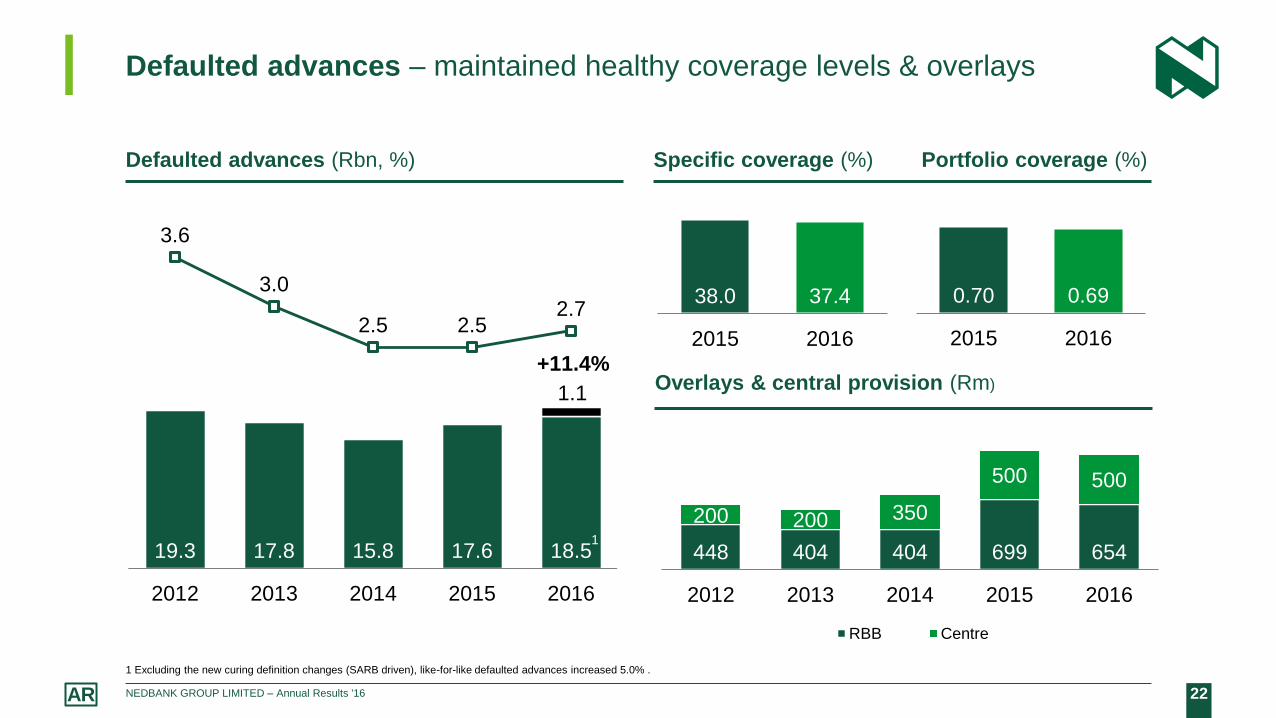
448 404 404 699 654
200 200 350
500 500
2012 2013 2014 2015 2016
RBB Centre
Overlays & central provision (Rm)
19.3 17.8 15.8 17.6 18.5
1.1
3.6
3.0
2.5 2.5 2.7
-0.2
0.8
1.8
2.8
3.8
0
10
20
30
40
2012 2013 2014 2015 2016
Defaulted advances – maintained healthy coverage levels & overlays
Defaulted advances (Rbn, %)
+11.4%
1 Excluding the new curing definition changes (SARB driven), like-for-like defaulted advances increased 5.0% .
1
Specific coverage (%) Portfolio coverage (%)
38.0 37.4
2015 2016
0.70 0.69
2015 2016

23 NEDBANK GROUP LIMITED – Annual Results '16 AR
40%
50%
60%
70%
80%
08 09 10 11 12 13 14 15 16
40%
50%
60%
70%
80%
08 09 10 11 12 13 14 15 16
Low risk properties ² (%) Market share of big 4 SA banks³ (%)
Home loans – improved asset quality from low‒risk client & property contribution, MFC – benchmarking through the cycle
Homeloans MFC new & used
Delphi Score – low risk¹ (%) vehicle distribution(%) SA prime rate (%)
Source: 1. Experian Delphi Score | 2. Lightstone Risk Quality Grade | 3. BA 900 Market share
Nedbank – greater percentage of low‒risk
customers
Nedbank – greater percentage of low‒risk
properties
Nedbank Competitors
0%
5%
10%
15%
20%
0%
25%
50%
75%
100%
New Used Prime rate
0%
10%
20%
30%
40%
02 04 06 08 10 12 14 16
Nedbank Competitors
24 NEDBANK GROUP LIMITED – Annual Results '16 AR
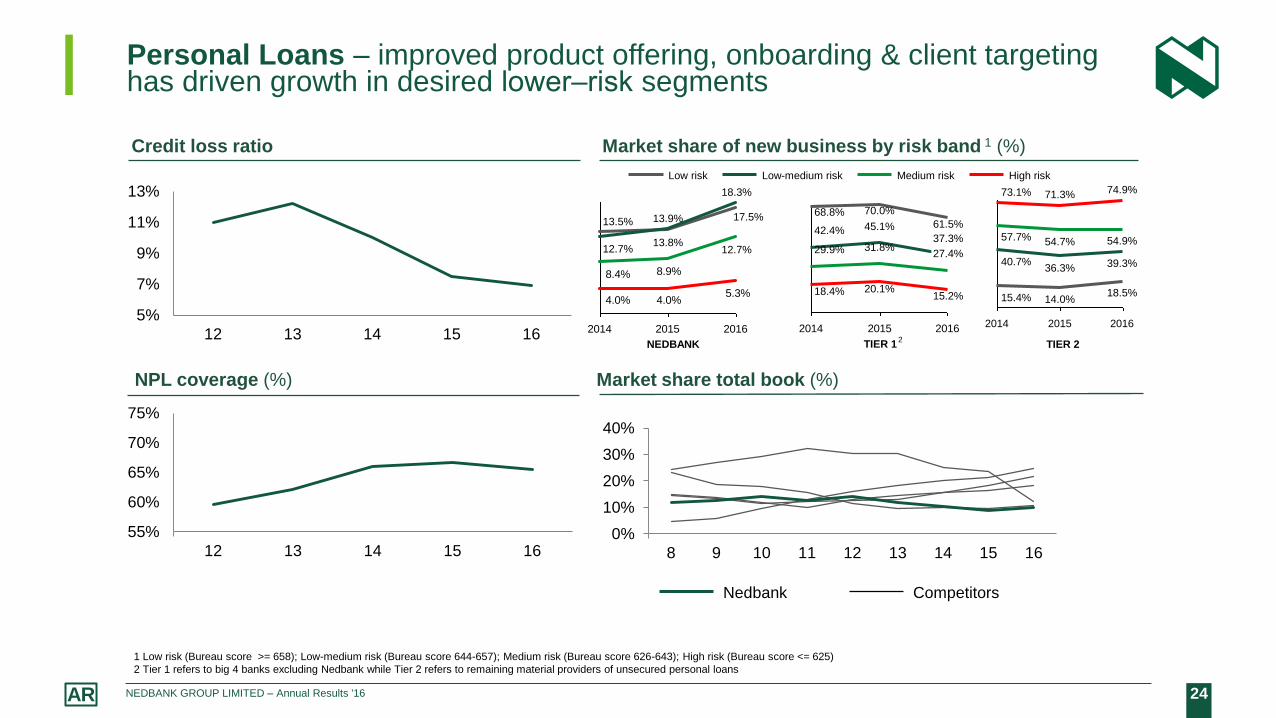
Personal Loans – improved product offering, onboarding & client targeting has driven growth in desired lower‒risk segments
Credit loss ratio Market share of new business by risk band 1 (%)
NPL coverage (%) Market share total book (%)
NEDBANK TIER 1 TIER 2
0%
10%
20%
30%
40%
8 9 10 11 12 13 14 15 16
8.9%8.4%
5.3%4.0%4.0%
2014 2015 2016
12.7%
18.3%
17.5% 13.9%
13.8% 12.7%
13.5%
High risk Medium risk Low-medium risk Low risk
2014 2015 2016
27.4%
37.3%
61.5%
20.1%
31.8%
45.1%
15.2%
70.0%
18.4%
29.9%
42.4%
68.8%
2016 2015 2014
54.9%
39.3%
18.5%
40.7%
15.4%
71.3%
54.7%
36.3%
14.0%
73.1%
57.7%
74.9%
1 Low risk (Bureau score >= 658); Low-medium risk (Bureau score 644-657); Medium risk (Bureau score 626-643); High risk (Bureau score <= 625)
2 Tier 1 refers to big 4 banks excluding Nedbank while Tier 2 refers to remaining material providers of unsecured personal loans
12 13 14 15 16
5%
7%
9%
11%
13%
55%
60%
65%
70%
75%
12 13 14 15 16
Nedbank Competitors
2
25 NEDBANK GROUP LIMITED – Annual Results '16 AR
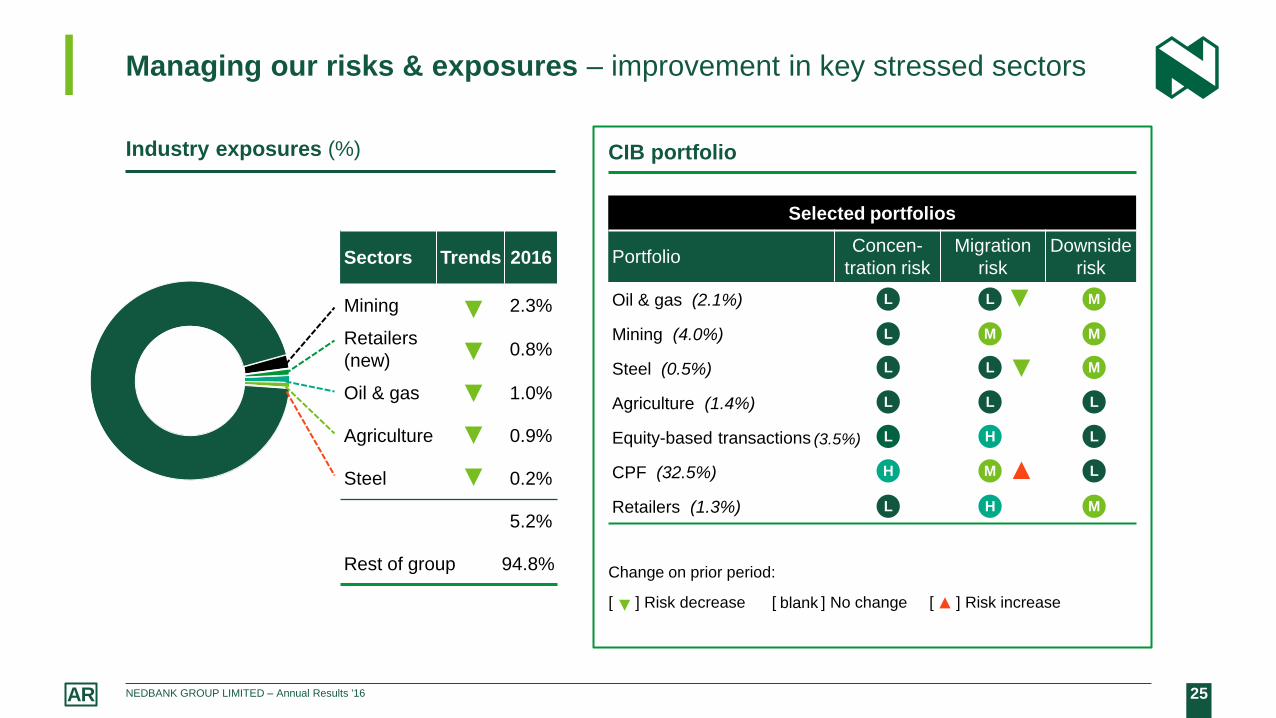
Managing our risks & exposures – improvement in key stressed sectors
Industry exposures (%)
Sectors Trends 2016
Mining 2.3%
Retailers
(new) 0.8%
Oil & gas 1.0%
Agriculture 0.9%
Steel 0.2%
5.2%
Rest of group 94.8%
▼
▼
▼
▼
▼
CIB portfolio
▼
Change on prior period:
[ ] Risk decrease [ ] No change [ ] Risk increase
blank ▲
Selected portfolios
Portfolio Concen-
tration risk
Migration
risk
Downside
risk
Oil & gas (2.1%)
Mining (4.0%)
Steel (0.5%)
Agriculture (1.4%)
Equity-based transactions
CPF (32.5%)
Retailers (1.3%)
L L M
L M M
L L M
L L L
L H L
H M L
L H M
▼
▼
▲
(3.5%)

26 NEDBANK GROUP LIMITED – Annual Results '16 AR
0.48
0.30
0.19
0.40 0.34
0.37
0.27 0.21 0.08
0.04
2012 2013 2014 2015 2016
CIB CPF
Provisioning & Loan-to-Value (LTV) (%)
22.1% 13.8%
2006 - 2008 2013 - 2016
Commercial property finance – strong asset quality & risk management
Advances growth (CAGR %)
31.2% 40,4% Market
share
45.1 45.4
2008 2016
Property type LTV
21.3
22.4
10.9 13.8
5.1
8.8
2.7 2.5
4.5 8.0
Retail Offices
Warehouse Multiple portfolios
Manuf. Residential
Vacant Hotel & BB
Other mortgages Other loans
40.8%
Key drivers
Strong client base supported by an experienced team
Lending access to existing collateral pools
LTVs consistently < 50%
Vacant land < 3% & Residential < 10% of portfolio
Defaulted advances 1.0% & arrears 0.13% of advances
TTC CLR: 0.15 – 0.45
19
CLR (%)

27 NEDBANK GROUP LIMITED – Annual Results '16 AR
Expenses – ongoing investment for growth supported by efficiency gains
Expenses (Rm)
26 1
10 2
7 7
43
28
36
6
2 232 599 510 48 66
2015 BAUgrowth
Efficiencies BAUgrowth
Investments Regulatory BancoÚnico
2016
56.9 56.4
Group Excl ETI
Cost to income (%)
1 Investments, including IT projects, branch reformatting costs, etc.
MLT 50–53%
+6.3% +2.3%

28 NEDBANK GROUP LIMITED – Annual Results '16 AR
Operating model review – supports ability to meet targeted cost-to-
income ratio
Benefits of approximately R1,0bn pre-tax by 2019
− Implementing from 2017
− Target included in performance scorecards & LTI corporate performance targets
What we expect to achieve
− Quick & agile innovation in partnership with fintechs
− Enterprise-wide capability with client at the centre
− Effective response to regulatory change
− Improve ability to execute on our strategic focus areas
Key initiatives
− Digital Fast Lane to fast-track innovation
− Reduce back-office costs in RBB & improve efficiency in response to digitisation investments
− Revisit Rest of Africa operating model to reduce central costs

29 NEDBANK GROUP LIMITED – Annual Results '16 AR
644
(374)
2015 2016
870
(125)
148
278 292
152
(676)
230 171 150
Q115
Q215
Q315
Q415
Q116
Q216
Q316
Q416
Associate income – ETI performance reflective of tough environment,
particularly in Nigeria
Associate income from ETI (Rm) ETI-related headline earnings (Rm)
Associate income (Rm)
870 (125)
Headline earnings (Rm)
Funding cost (Rm)
(226) (249)

30 NEDBANK GROUP LIMITED – Annual Results '16 AR
ETI carrying value – reflects importance as a long-term investment
Carrying value & market value (Rm)
6 265
3 978
2 438
5 327
527
(125)
(2 529)
(176) (1 000)
1 016
Carrying valueDec 2015
Associateloss
FCTR &OCI
Dividends& other
Impairmentprovision
Carrying valueDec 2016
Market valueDec 2016
Share of ETINAV
Sep 2016
3
Cost of
investment
Associate
income
FCTR & OCI1
7 808
1 Cumulative FCTR & OCI made up of FCTR: R2 042m & OCI R1 515m loss
2 Value-in-use calculation is performed in terms of IFRS & based on a number of scenarios by taking into account publically available information. Management determined that an impairment provision of R1bn was
appropriate. Headline earnings, regulatory capital & dividend not impacted
3 The ETI share trades in low volumes, given its low free float, while also being listed in an illiquid market
4 Calculated as Nedbank’s 21.2% share of ETI’s NAV at 30 September 2016 & exchange rate of Rand / US$: 13.77 at 31 December 2016
2 4
May reverse in the future (based on
macroeconomic developments & forecast
5-year ETI discounted cash-flows)
31 NEDBANK GROUP LIMITED – Annual Results '16 AR
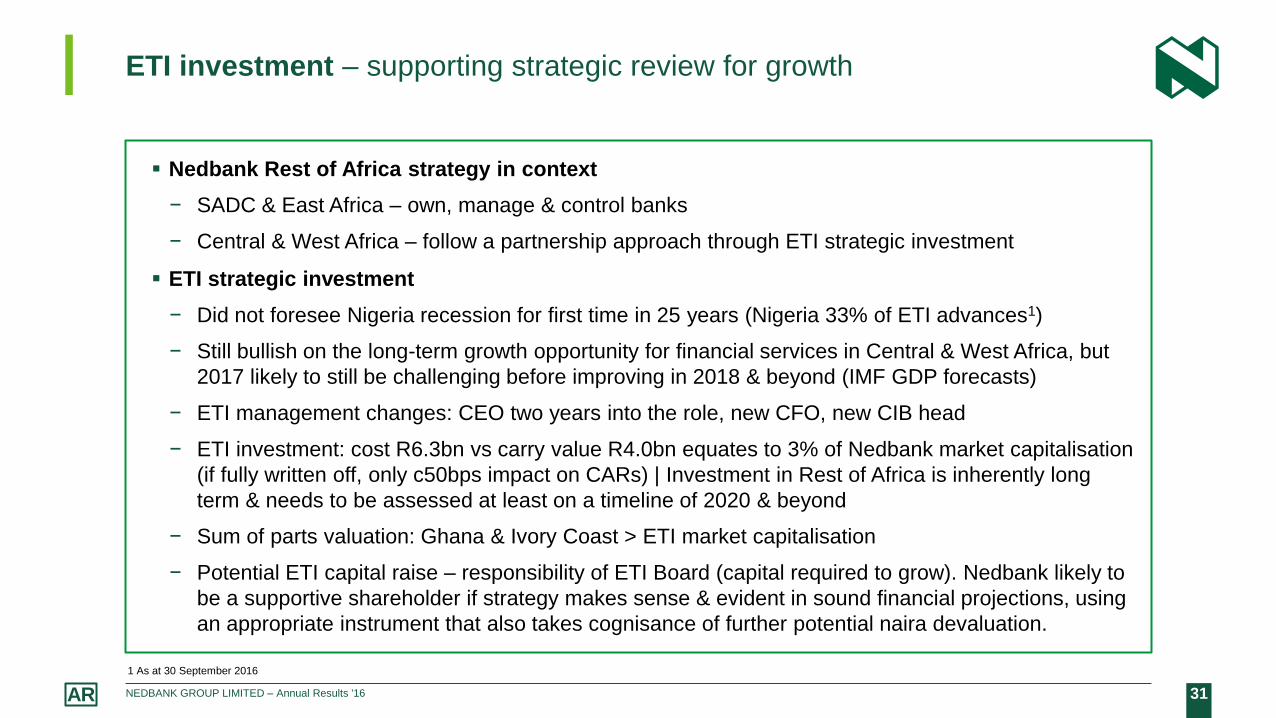
ETI investment – supporting strategic review for growth
Nedbank Rest of Africa strategy in context
− SADC & East Africa – own, manage & control banks
− Central & West Africa – follow a partnership approach through ETI strategic investment
ETI strategic investment
− Did not foresee Nigeria recession for first time in 25 years (Nigeria 33% of ETI advances1)
− Still bullish on the long-term growth opportunity for financial services in Central & West Africa, but
2017 likely to still be challenging before improving in 2018 & beyond (IMF GDP forecasts)
− ETI management changes: CEO two years into the role, new CFO, new CIB head
− ETI investment: cost R6.3bn vs carry value R4.0bn equates to 3% of Nedbank market capitalisation
(if fully written off, only c50bps impact on CARs) | Investment in Rest of Africa is inherently long
term & needs to be assessed at least on a timeline of 2020 & beyond
− Sum of parts valuation: Ghana & Ivory Coast > ETI market capitalisation
− Potential ETI capital raise – responsibility of ETI Board (capital required to grow). Nedbank likely to
be a supportive shareholder if strategy makes sense & evident in sound financial projections, using
an appropriate instrument that also takes cognisance of further potential naira devaluation.
1 As at 30 September 2016
32 NEDBANK GROUP LIMITED – Annual Results '16 AR
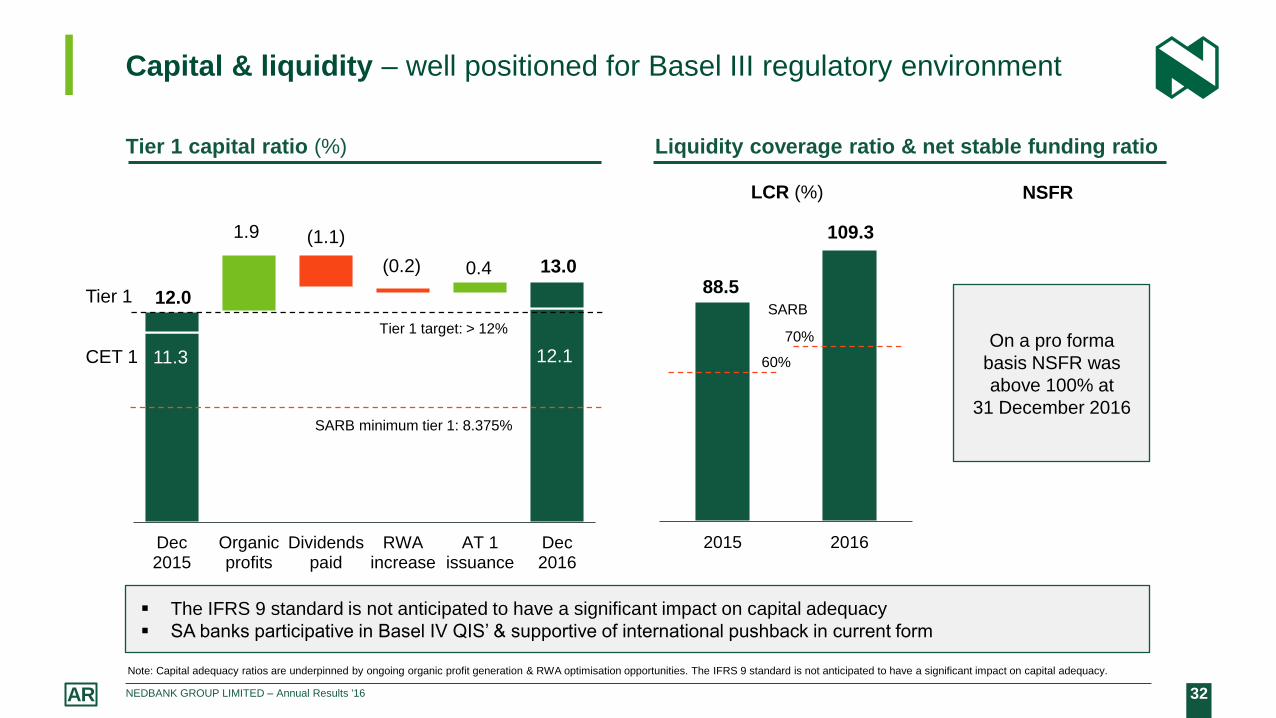
12.0
12.1 11.3
1.9 (1.1)
(0.2) 0.4 13.0
Dec2015
Organicprofits
Dividendspaid
RWAincrease
AT 1issuance
Dec2016
Liquidity coverage ratio & net stable funding ratio
2015 2016
Capital & liquidity – well positioned for Basel III regulatory environment
Tier 1 target: > 12%
SARB minimum tier 1: 8.375%
Tier 1 capital ratio (%)
CET 1
Tier 1
LCR (%) NSFR
88.5
109.3
SARB
70%
60%
On a pro forma
basis NSFR was
above 100% at
31 December 2016
Note: Capital adequacy ratios are underpinned by ongoing organic profit generation & RWA optimisation opportunities. The IFRS 9 standard is not anticipated to have a significant impact on capital adequacy.
The IFRS 9 standard is not anticipated to have a significant impact on capital adequacy
SA banks participative in Basel IV QIS’ & supportive of international pushback in current form

33 NEDBANK GROUP LIMITED – Annual Results '16 AR
Dividend cover at mid-point of our target range –
supporting an attractive dividend yield
Full-year dividend cover (x times) Dividend yield (%)
1.90
2.02
2.18
2.11 2.07 2.06
2.00
2012 2013 2014 2015 2016
Dividend cover excluding ETI associate income
Dividend cover
Board-approved target range:
1.75 – 2.25x
4.8
2.9
1
2
3
4
5
6
7
2012 2013 2014 2015 2016
Nedbank JSE all-share index
Note: The cash dividend will be subject to a dividend withholding tax rate of 20%, which recently increased from 15%

34 NEDBANK GROUP LIMITED – Annual Results '16 AR
2017 guidance
Growth in DHEPS for full-year 2017 greater than growth in nominal GDP
Average interest-earning banking asset1 growth to increase slightly ahead of nominal
GDP growth
NIM to be slightly above the rebased 2016 level of 3.54%
NII
To increase, but remaining below the mid-point of our target range of 60–100 bps
Upper-single-digit growth (excluding fair-value adjustments)
Mid- to upper-single-digit growth
CLR
NIR
Expenses
ETI earnings likely to remain volatile & uncertain (reported a quarter in arrear) Associate
income
1 To align with industry practice from November 2016 average balances of R6bn in the CIB liquid-asset portfolio were included in our trading book and removed from average interest-earning banking assets used as
the denominator in the NIM calculation. The 2016 AIEBA base needs to be adjusted for the remaining R28bn.

35 NEDBANK GROUP LIMITED – Annual Results '16 AR
Medium-to-long-term targets
Metric 2016 vs MLT
Medium-to-long-term
target
2017 outlook1
ROE (excl goodwill) 16.5% ▼ 5% above COE Below target
Diluted HEPS growth 4.8% ▼ ≥ CPI + GDP growth + 5% Below target
Credit loss ratio 68 bps ► 60–100 bps
Increase, but below
the mid-point
of target range
NIR-to-expenses ratio 82.9% ▼ > 85% Below target
Efficiency ratio2 56.9% ▲ 50–53% Above target
CET 1 CAR
Tier 1 CAR
Total CAR
12.1%
13.0%
15.3%
►
▲
▲
Basel III basis3:
10.5–12.5%
> 12%
> 14%
Within
target
Dividend cover 2.00 x ► 1.75 to 2.25 times Within
target range
1 2017 outlook based on current economic forecasts. 2 Efficiency ratio includes associate income
3 Tier 1 & total CAR targets were revised in 2016 from 11.5–13.0% & 14.0–15.0% respectively
36 NEDBANK GROUP LIMITED – Annual Results '16 AR
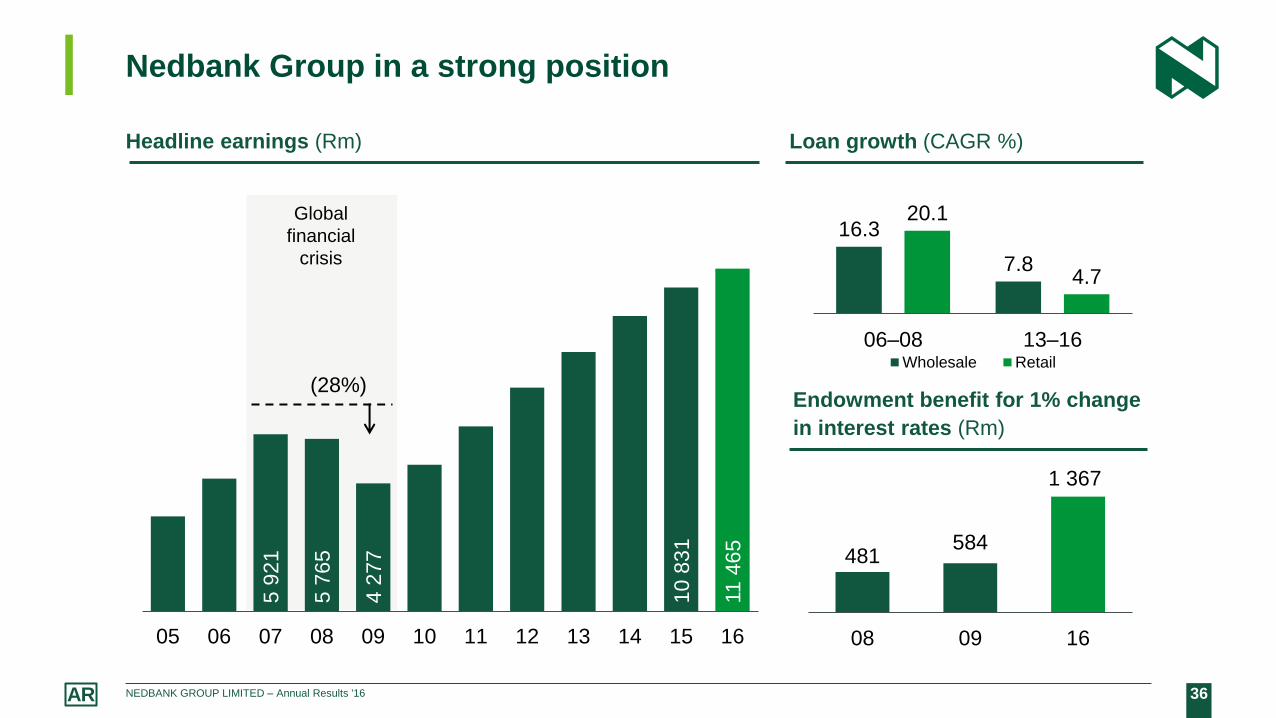
5 9
21
5 7
65
4 2
77
10
83
1
11 4
65
05 06 07 08 09 10 11 12 13 14 15 16
Nedbank Group in a strong position
16.3
7.8
20.1
4.7
06–08 13–16 Wholesale Retail
481 584
1 367
08 09 16
(28%)
Global
financial
crisis
Headline earnings (Rm) Loan growth (CAGR %)
Endowment benefit for 1% change
in interest rates (Rm)
37 NEDBANK GROUP LIMITED – Annual Results '16 AR
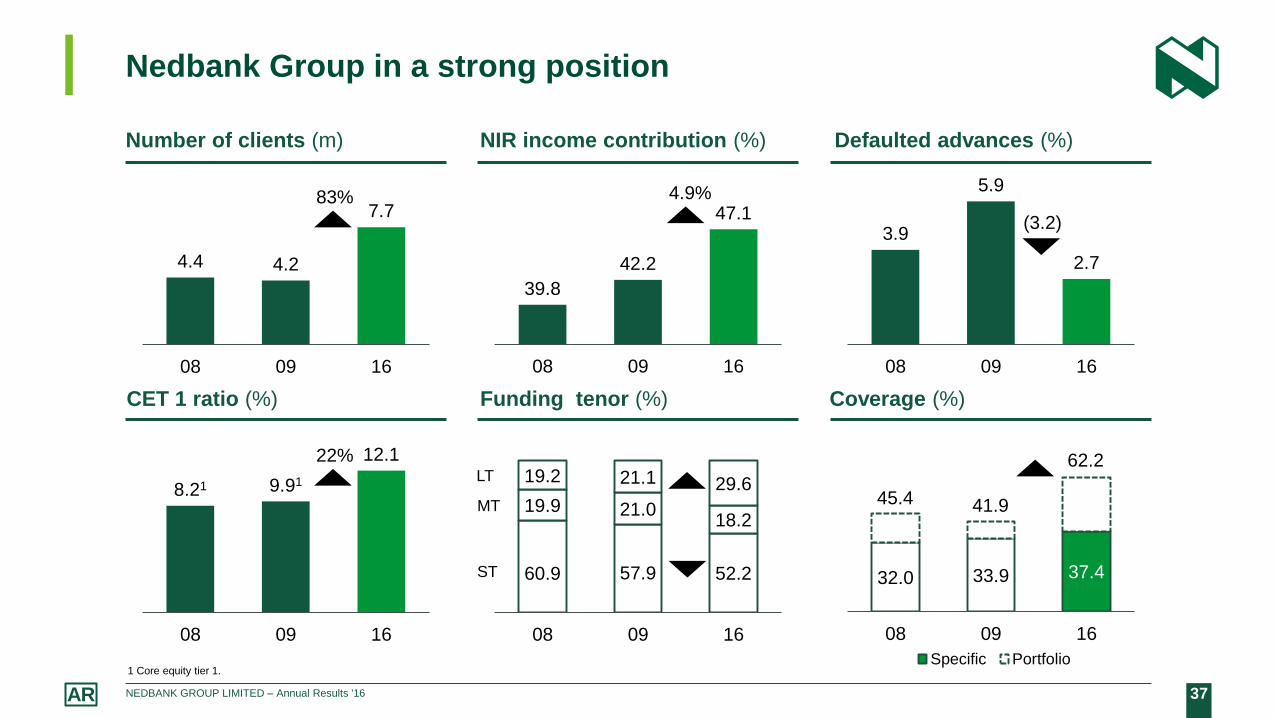
1 Core equity tier 1.
Nedbank Group in a strong position
Number of clients (m) NIR income contribution (%) Defaulted advances (%)
CET 1 ratio (%) Funding tenor (%) Coverage (%)
4.4 4.2
7.7
08 09 16
39.8
42.2
47.1
08 09 16
3.9
5.9
2.7
08 09 16
8.21 9.91
12.1
08 09 16
60.9 57.9 52.2
19.9 21.0 18.2
19.2 21.1 29.6
08 09 16
32.0 33.9 37.4
08 09 16
Specific Portfolio
62.2
45.4
83%
ST
MT
LT
41.9
4.9%
(3.2)
22%

38 NEDBANK GROUP LIMITED – Annual Results '16 AR
Improved funding profile in a competitive market
Funding
sources
Funding
base mix
Households 19%
Commercial 27%
Wholesale 39%
Capital markets 7%
Foreign – asset
matched 7%
Foreign – general
funding pool 1%
Volume–
weighted total 100%
Limited impact - closed domestic market
Reprice marginally
Reprice on new issuances
Matched to US$ lending – no material
impact
Reprice on contractual repricing date
Total funding (deposits + long-term debt) at 31 December 2016: R813.6bn.
FCTR: Foreign currency translation reserves. QC& R: Qualifying capital & reserves
1 Funding profile: Nedbank & peer fourth quarter 2016 average funding ratio. Peers at 31 December 2016.
Funding duration longer than industry average
(%)
Funding mix & impact of possible
sovereign downgrade
23
14 63
30
18
52
Long term (> 181 days)
Medium term (32−180 days)
Short term (0−31 days)
Funding
profile¹
(%)
Nedbank Peer average
39 NEDBANK GROUP LIMITED – Annual Results '16 AR
Well-regulated & stable banking system
Nedbank Group bias to wholesale, and growth opportunities in retail & rest of Africa
Nedbank Group has a strong balance sheet – conservatively provided, liquid & well capitalised
Positioned for sustainable growth & ROE increase over the medium to long-term:
‒ CIB: Deliver benefits of an integrated CIB model
‒ RBB: Grow the transactional franchise faster than the market
‒ Wealth: New product innovation & further penetration into the Nedbank client base
‒ Rest of Africa: Get to scale in our own SADC operations | Key markets in which ETI operates are
currently expected to remain difficult in 2017, before improving in 2018 & beyond
Extract efficiencies across all our businesses to fund future investment – enable improvements in
efficiency ratios & ROEs
In summary

40 NEDBANK GROUP LIMITED – Annual Results '16 AR
Contact us
Disclaimer
Nedbank Group has acted in good faith and has made every reasonable effort to ensure the accuracy and completeness of the information contained in this
document, including all information that may be defined as 'forward-looking statements' within the meaning of United States securities legislation.
Forward-looking statements may be identified by words such as ‘believe’, 'anticipate', 'expect', 'plan', 'estimate', 'intend', 'project', 'target', 'predict' and 'hope'.
Forward-looking statements are not statements of fact, but statements by the management of Nedbank Group based on its current estimates, projections,
expectations, beliefs and assumptions regarding the group's future performance.
No assurance can be given that forward-looking statements will prove to be correct and undue reliance should not be placed on such statements.
The risks and uncertainties inherent in the forward-looking statements contained in this document include, but are not limited to: changes to IFRS and the
interpretations, applications and practices subject thereto as they apply to past, present and future periods; domestic and international business and market
conditions such as exchange rate and interest rate movements; changes in the domestic and international regulatory and legislative environments; changes to
domestic and international operational, social, economic and political risks; and the effects of both current and future litigation.
Nedbank Group does not undertake to update any forward-looking statements contained in this document and does not assume responsibility for any loss or
damage whatsoever and howsoever arising as a result of the reliance by any party thereon, including, but not limited to, loss of earnings, profits, or consequential
loss or damage.
Nedbank Group
nedbankgroup.co.za
Nedbank Group Limited
Tel: +27 (0) 11 294 4444
Physical address
135 Rivonia Road
Sandown
2196
South Africa
Nedbank Investor Relations
Head of Investor Relations
Alfred Visagie
Direct tel: +27 (0) 11 295 6249
Cell: +27 (0) 82 855 4692
Email: [email protected]
Investor Relations Consultant
Penny Him Lok
Direct tel: +27 (0)11 295 6549
Email: [email protected]


