333
^TMOSTSe^L ^[?[?giii^ Ti Digitized for FRASER http://fraser.stlouisfed.org/ Federal Reserve Bank of St. Louis
| Date post: | 15-May-2017 |
| Category: |
Documents |
| Upload: | fraser-federal-reserve-archive |
| View: | 265 times |
| Download: | 7 times |

^TMOSTSe^L ^[?[?giii^ Ti
Digitized for FRASER http://fraser.stlouisfed.org/ Federal Reserve Bank of St. Louis

Digitized for FRASER http://fraser.stlouisfed.org/ Federal Reserve Bank of St. Louis

^ ...
^% X '
4 " ^ of the Secretajy oMiie f rBasiiFv :'^ •^^ '? ^ ' ' -'-j* '^1 ~ ^ ^ ' ^ l<^" ^ ^ d ' ' « ' » • - ; r ' ' i ' l ' - m m , ' ' ¥ • ..'. " / • - \ % i Jan/tlie^ $tati i6| the firvarfces ' ^ ^ '
' i -r .f
FOR THE FISCAL YEAR ENDED JUNE 30, 1970
C i . ^ , I J t l a j d . j j J \ . ^ ^I jL^.^X^'yyy. jy icf- r
Digitized for FRASER http://fraser.stlouisfed.org/ Federal Reserve Bank of St. Louis

DEPARTMENT OF THE TREASURY
DOCUMENT NO. 3251A
Secretary
U.S. Government Printing Office, Washington : 1971
For sale by the Superintendent of Documents, U.S. Government Printing Office Washington, D.C. 20402 - Price 31.50 (paper cover)
Digitized for FRASER http://fraser.stlouisfed.org/ Federal Reserve Bank of St. Louis
/ a
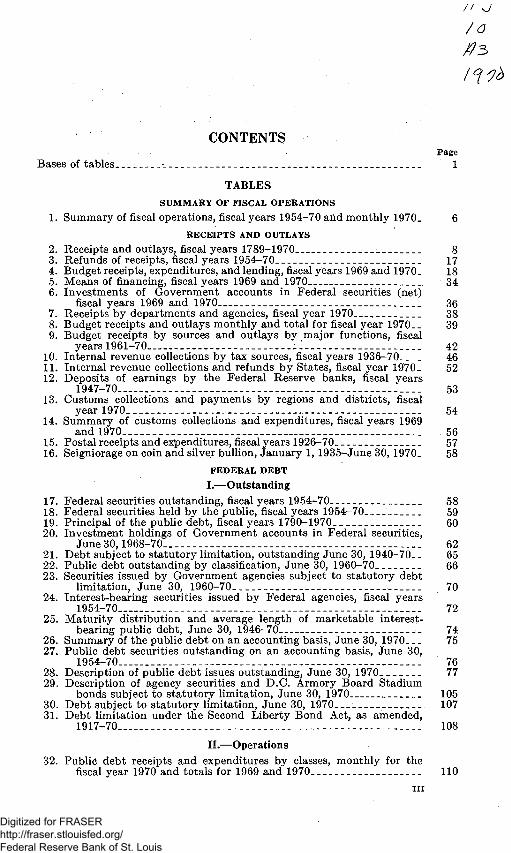
CONTENTS . Page
Bases of tables.-.-_-_.._ 1
TABLES
SUMMARY OF FISCAL OPERATIONS
1. Summary of fiscal operations, fiscal years 1954-70 arid monthly 1970_ 6
RECEIPTS AND OUTLAYS
2. Receipts and outlays, fiscal years 1789-1970 8 3. Refunds of receipts, fiscal years 1954-70 17 4. Budget receipts, expenditures, and lending, fiscal years 1969 and 1970. 18 5. Means of financing, fiscal years 1969 and 1970 34 6. Investments of Government accounts in Federal securities (net)
fiscal years 1969 and 1970_>__ 36 7. Receipts by departments and agencies, fiscal year 1970 38 8. Budget receipts and outlays monthly and total for fiscal year 1970-_ 39 9. Budget receipts by sources and outlays by major functions, fiscal
years 1961-70 - i 42 10. Internal revenue collections by tax sources, fiscal years 1936-70 46 11. Internal revenue collections and refunds by States, fiscal year 1970_ 52 12. Deposits of earnings by the Federal Reserve banks, fiscal years
1947-70-— 53 13. Customs collections and payments by regions and districts, fiscal
year 1970 54 14. Summary of customs collections and expenditures, fiscal years 1969
and 1970 , 56 15. Postal receipts and expenditures, fiscal years 1926-70 57 16. Seigniorage on coin and silver bullion, January 1, 1935-June 30, 1970_ 58
FEDERAL DEBT
I.—Outstanding 17. Federal securities outstanding, fiscal years 1954-70 58 18. Federal securities held by the public, fiscal years 1954-70 59 19. Principal of the public debt, fiscal years 1790-1970 60 20. Investment holdings of Govemment accounts in Federal securities,
June 30,1968-70 62 21. Debt subject to statutory limitation, outstanding June 30, 1940-70-- 65 22. Public debt outstanding by classification, June 30, 1960-70 66 23. Securities issued by Government agencies subject to statutory debt
limitation, June 30, 1960-70 70 24. Interest-bearing securities issued by Federal agencies, fiscal years
1954-70 - 72 25. Maturity distribution and average length of marketable interest-
bearing public debt, June 30, 1946-70 -- 74 26. Summary of the public debt on an accounting basis, June 30, 1970 75 27. Public debt securities outstanding on an accounting basis, June 30,
1954-70 -- 76 28. Description of public debt issues outstanding, June 30, 1970 77 29. Description of agency securities and D.C. Armory Board Stadium
bonds subject to statutory limitation, June 30, 1970-- 105 30. Debt subject to statutory limitation, June 30, 1970 107 31. Debt limitation under the Second Liberty Bond Act, as amended,
1917-70 108
II.—Operations 32. Public debt receipts and expenditures by classes, monthl}^ for the
fiscal year 1970 and totals for 1969 and 1970 110 III
Digitized for FRASER http://fraser.stlouisfed.org/ Federal Reserve Bank of St. Louis

IV CONTENTS
Page 33. Changes in public debt issues, fiscalyear 1970 124 34. Issues, maturities, and redemptions of interest-bearing public debt
securities, excluding special issues, July 1969-June 1970 158 35. Allotments by investor classes on subscriptions for public marketable
securities, fiscal year 1970 203 36. Allotments of Treasury notes issued during the fiscal year 1970, by
Federal Reserve districts 205 37. Statutory debt retirements, fiscal years 1918-70 208 38. Cumulative sinking fund, fiscal years 1921-70 209
III.—U.S. savings bonds and notes 39. Sales and redemptions of Series E through K savings bonds by
series, fiscal years 1941-70 and monthly 1970 210 40. Sales and redemptions of Series E and H savings bonds by denomina
tions, fiscal years 1941-70 and monthly 1970 215 41. Sales and redemptions of U.S. savings notes, fiscal years 1967-70 and
monthly 1970 217 42. Sales of Series E and H savings bonds by States, fiscal j^ears 1969,
1970, and cumulative 218 43. Savings bonds outstanding, by series and denomination, as of June 30,
1970 219
IV.—Interest 44. Amount of interest-bearing public debt outstanding, the computed
annual interest charge, and the computed rate of interest, June 30, 1939-70, and at the end of each month during 1970 220
45. Computed annual interest rate and computed annual interest charge on the public debt by classes, June 30, 1950-70 222
46. Interest on the public debt by classes, fiscal years 1966-70 224
V.—Prices and yields of securities 47. Average yields of taxable long term Treasury bonds by months,
October 1941-June 1970 225 48. Prices and yields of marketable public debt issues, June 30, 1969, and
June 30, 1970, and price range since first traded 226
VI.—Ownership of Federal securities 49. Estimated ownership of Federal securities outstanding June 30,
1960-70 228 50. Summary of Treasury survey of ownership of Federal securities,
June 30, 1969 and 1970 230 ACCOUNT OF THE TREASURER OF THE UNITED STATES
51. Assets and liabilities in the account of the Treasurer of the United States, June 30, 1969 and 1970 232
52. Accountability of the Treasurer of the United States on an accounting basis, June 30, 1954-70 233
53. Analysis of changes in tax and loan account balances, fiscal years 1960-70 234
STOCK AND CIRCULATION OF MONEY IN THE UNITED STATES
54. Currency and coin outstanding, in the Treasury, in the Federal Reserve banks, and in circulation, by kinds, June 30, 1970 236
55. Stock of money by kinds, selected years, June 30, 1935-70 238 56. Money in circulation by kinds, selected years, June 30, 1935-70 240 57. Location of gold, coin, and coinage metals held by the Treasury,
June 30, 1970 241 58. Paper currency issued and redeemed during the fiscal year 1970 and
outstanding June 30, 1970, by classes and denominations 242
TRUST AND OTHER FUNDS
59. Civil service retirement and disability fund, June 30, 1970 243 60. Employees health benefits fund, Civil Service Commission, June 30,
1970 - 246
Digitized for FRASER http://fraser.stlouisfed.org/ Federal Reserve Bank of St. Louis
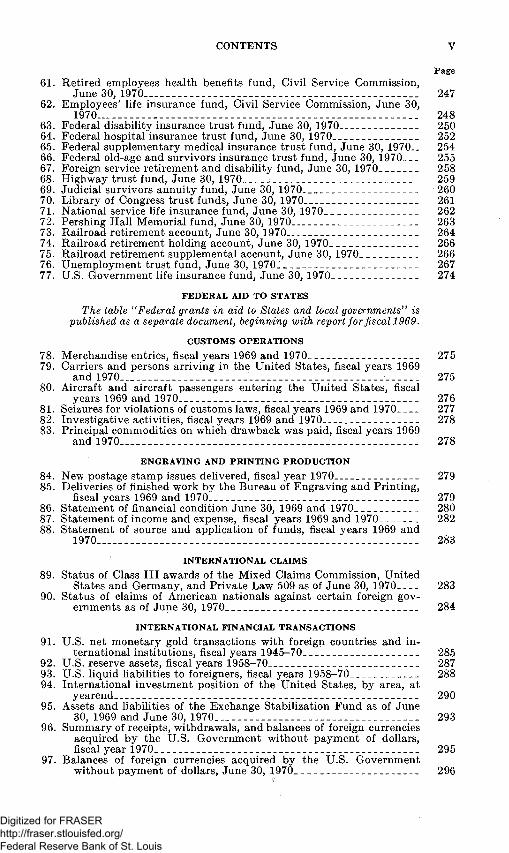
CONTENTS V
Page 61. Retired employees health benefits fund, Civil Service Commission,
June 30, 1970 247 62. Employees' life insurance fund, Civil Service Commission, June 30,
1970 248 63. Federal disability insurance trust fund, June 30, 1970 250 64. Federal hospital insurance trust fund, June 30, 1970 252 65. Federal supplementary medical insurance trust fund, June 30, 1970— 254 66. Federal old-age and survivors insurance trust fund, June 30, 1970 255 67. Foreign service retirement and disability fund, June 30, 1970 258 68. Highway trust fund, June 30, 1970 - 259 69. Judicial survivors annuity fund, June 30, 1970 260 70. Library of Congress trust funds, June 30, 1970 261 71. National service life insurance fund, June 30, 1970 262 72. Pershing Hall Memorial fund, June 30, 1970 263 73. Railroad retirement account, June 30, 1970 264 74. Railroad retirement holding account, June 30, 1970 266 75. Railroad retirement supplemental account, June 30, 1970 266 76. Unemployment trust fund, June 30, 1970. 267 77. U.S. Government life insurance fund, June 30, 1970 274
FEDERAL AID TO STATES
The table ^^Federal grants in aid to States and local governments' is published as a separate document, heginning with report for fiscal 1969.
CUSTOMS OPERATIONS
78. Merchandise entries, fiscal years 1969 and 1970 275 79. Carriers and persons arriving in the United States, fiscal j'-ears 1969
and 1970 275 80. Aircraft and aircraft passengers entering the United States, fiscal
years 1969 and 1970 276 81. Seizures for violations of customs laws, fiscal years 1969 and 1970 277 82. Investigative activities, fiscal years 1969 and 1970 278 83. Principal commodities on which drawback was paid, fiscal years 1969
and 1970 278
ENGRAVING AND PRINTING PRODUCTION
84. New postage stamp issues delivered, fiscal year 1970 279 85. Deliveries of finished work by the Bureau of Engraving and Printing,
fiscal years 1969 and 1970 279 86. Statement of financial condition June 30, 1969 and 1970 280 87. Statement of income and expense, fiscal years 1969 and 1970 282 88. Statement of source and application of funds, fiscal years 1969 and
1970 283
INTERNATIONAL CLAIMS
89. Status of Class III awards of the Mixed Claims Commission, United States and Germany, and Private Law 509 as of June 30, 1970 283
90. Status of claims of American nationals against certain foreign governments as of June 30, 1970 284
INTERNATIONAL FINANCIAL TRANSACTIONS
91. U.S. net monetary gold transactions with foreign countries and international institutions, fiscal years 1945-70 285
92. U.S. reserve assets, fiscal years 1958-70 287 93. U.S. liquid liabilities to foreigners, fiscal years 1958-70 288 94. International investment position of the United States, by area, at
yearend 290 95. Assets and liabilities of the Exchange Stabilization Fund as of June
30, 1969 and June 30, 1970 293 96. Summary of receipts, withdrawals, and balances of foreign currencies
acquired by the U.S. Government without payment of dollars, fiscalyear 1970 295
97. Balances of foreign currencies acquired by the U.S. Government without payment of dollars, June 30, 1970 296
Digitized for FRASER http://fraser.stlouisfed.org/ Federal Reserve Bank of St. Louis

VI CONTENTS
INDEBTEDNESS OF FOREIGN GOVERNMENTS Page
98. Indebtedness of foreign governments to the United States arising from World War I as of June 30, 1970 298
99. Status of German World War I indebtedness as of June 30, 1970--- 299 100. Outstanding indebtedness of foreign countries on U.S. Government
credits (exclusive of indebtedness arising from World War I) as of June 30, 1970, by area, country, and major program 300
101. Status of accounts under lend-lease and surplus property agreements (World War II) as of June 30, 1970 304
CORPORATIONS AND OTHER BUSINESS-TYPE ACTIVITIES OF THE FEDERAL GOVERNMENT
102. Comparative statement of securities of Government corporations and other business-type activities held by the Treasury, June 30, 1960-70 - 306
103. Capital stock of Government agencies held by the Treasury or other Government agencies June 30, 1969 and 1970, and changes during 1970. _--_ 308
104. Borrowing authority and outstanding issues of Government corporations and other business-type activities whose securities are issued to the Secretary of the Treasury, June 30, 1970 309
105. Description of securities of Government corporations and other business-type activities held by the Treasury, June 30, 1970 310
106. Summary statements of financial condition of Government corporations and other business-type activities, June 30, 1970 315
107. Statement of loans outstanding of Government corporations and other business-type activities, June 30, 1970 317
108. Dividends, interest, and similar earnings received by the Treasury from Government corporations and other business-type activities, fiscal years 1969 and 1970 321
109. Direct sales and repurchases of loans, fiscal years 1963-70 and monthly 1970 - - 323
GOVERNMENT LOSSES IN SHIPMENT
110. Government losses in shipment fund, June 30, 1970 324
PERSONNEL
111. Number of employees in the departmental and field services of the Department of the Treasury quarterly from June 30, 1969, to June 30, 1970 325
Digitized for FRASER http://fraser.stlouisfed.org/ Federal Reserve Bank of St. Louis

Bases of Tables
Statistical sources The figures in this report are shown on the basis of: (a) The Daily Statement
of the United States Treasury; (b) the Monthly Statement of Receipts and Expenditures of the United States Government; (c) warrants issued; (d) public debt accounts; and (e) administrative accounts and reports. Where no basis is indicated, the figures are derived from administrative reports prepared according to various specifications. Where more than one basis is used in a single table covering a period of years, the date of the change in basis is stated. The term "security," wherever used in the various tables, means any obligation issued pursuant to law for valuable consideration and includes bonds, notes, certificates of indebtedness, debentures, and other evidences of indebtedness.
Following are general explanations of the various bases. For background on the first two bases (the daily and monthly statements) see exhibits 69, 70, and 71 in the 1954 annual report; and for the third (warrants issued) see 1962 annual report, page 502.
Daily Statement of the United States Treasury The daily Treasury statement was the basis for receipts, expenditures, and the
resulting surplus or deficit shown in this report for the fiscal years 1916-52, and from 1916 to present it has been the basis for much of the public debt data and all of the figures on the account of the Treasurer of the United States. Since 1916 the daily statement has been based on bank transcripts (summarizing charges for checks paid and credits for deposits on the books of the banks) cleared and processed through the accounts of the Treasurer's office in Washington. Telegraphic reports are used to provide more timely data for certain major types of information pending receipt of the bank transcripts. For the fiscal years 1946-52, expenditures for agencies using the facilities of the Treasury Department's Division of Disbursement were shown on the basis of reports of checks issued. Total expenditures, however, as well as expenditures for the military departments and other agencies using their own disbursing facilities, were on the basis of bank transcripts cleared.
During the time it served as the basis for the budget results, the daily statement covered certain transactions processed through commercial bank account^ held in the name of Government officers other than the Treasurer of the United States, and included intragovemmental and other noncash transactions. The present daily Treasury statement reports the status of the Treasurer's account and summarizes the various transactions representing deposits and withdrawals in that account, excluding noncash transactions (with minor exceptions) and transactions involving cash held outside the Treasurer's account. Only a limited number of deposit and withdrawal classifications are shown. These data do not purport to represent budget results.
Monthly Statement of Receipts and Expenditures of the United States Government
Beginning with the figures for the fiscal year 1953, this monthly statement replaced the daily statement as the primary source of budget results (surplus or deficit) and other, receipt and expenditure data classified by type of account. This statement shows all receipts and expenditures of the Government including those made from cash accounts held outside the Treasurer's account. The information in the monthly statement is based on the central accounts relating to cash operations (see "Description of Accounts Relating to Cash Operations," below).
Warrants issued Receipt and expenditure data shown for fiscal years before 1916 were taken
from reports based on warrants issued. For receipts, covering warrants were prepared from certificates of deposit
mailed to the Treasury, principally by Government depositaries, showing de-1 .:..
Digitized for FRASER http://fraser.stlouisfed.org/ Federal Reserve Bank of St. Louis

2 197 0 REPORT OF THE SECRETARY OF THE TREASURY
posits received. The figures thus compiled were on a ''warrants-issued" basis. Since these certificates did not reach the Treasury simultaneously, all receipts for a fiscal year could not be covered into the Treasury by warrant of the Secretary immediately upon the close of the fiscal year. Therefore, certain certificates of deposit representing aniounts deposited during one fiscal year were reported as the next year's receipts.
Reports of expenditures were based on the aniount of accountable and settlement warrants issued and charged to appropriation accounts. Since accountable warrants covered advances to disbursing officers, rather than actual payments, reported expenditures necessarily included the changes in balances of funds remaining unexpended to the credit of disbursing officers at the close of the fiscal year.
Public debt accounts The figures reported on this basis represent transactions which have been
audited by the Bureau of the Public Debt. It is sometimes several months after a financing operation before all the transactions have been reported and audited. Therefore, the public debt figures on this basis differ from those reported in the daily Treasury statement since the latter consist of transactions cleared through the Treasurer's account during the reporting period. A reconciliation of figures on the two bases is given in table 26.
Administrative accounts and reports Certain tables in this report are developed from the accounts, records, and
reports of the administrative agencies concerned, which may be on various bases. These tables include intemal revenue and customs statistics, foreign currency transactions in the accounts of the Secretary of the Treasury, and financial statements of Government corporations and other business-type activities.
Description of Accounts Relating to Cash Operations The classes of accounts maintained in connection with the cash operations of
the Federal Government, exclusive of public debt operations, include: (1) The accounts of fiscal officers or agents, collectively, who receive money for deposit in the U.S. Treasury or for other authorized disposition or who make disbursements by drawing checks on the Treasurer of the United States or by effecting payments in some other manner ; (2) the accounts of administrative agencies which classify receipt and expenditure (disbursement) transactions according to the individual receipt, appropriation, or fund account; and (3) the accounts of the Treasurer of the United States whose office, generally speaking, is responsible for the receipt and custody of money deposited by fiscal officers or agents, for the payment of checks drawn on the Treasurer, and the payment of public debt securities redeemed. A set of central accounts is maintained in the Treasury Department for the purpose of consolidating financial data reported periodically from these three sources in order to present the results of cash operations in central financial reports on a unified basis for the Government as a whole, and as a means of intemal control.
The central accounts relating to cash operations disclose monthly and fiscal year inforniation on: (1) The Government's receipts by principal sources, and its expenditures according to the different appropriations and other funds involved; and (2) the cash transactions, classified by types, together with certain directly related assets and liabilities which underlie such receipts and expenditures. The accounting for receipts is substantially on the basis of collections (i.e. as of the time cash receipts are placed under accounting control), and that for expenditures is substantially on the basis of checks issued (and cash payments made) except that since June 1955 interest on the public debt has been on an accrual basis. The structure of the accounts provides for a reconciliation, on a firm accounting basis, between the published reports of receipts and expenditures for the Government as a whole and changes in the Treasurer's cash balance by means of such factors as checks outstanding, deposits in transit, and cash held outside the Treasury. Within the central accounts, receipt and expenditure accounts are classified as described in the following paragraphs.
Budget accounts General fund receipt accounts.—General fund receipt accounts are credited
with all receipts whicii are not earmarked by law for a specific purpose. General fund receipts consist principally of internal revenue collections, which include income taxes, excise taxes, estate, gift, and employment taxes. The
Digitized for FRASER http://fraser.stlouisfed.org/ Federal Reserve Bank of St. Louis

STATISTICAL APPENDIX 3
remainder consist of customs duties and a large number of miscellaneous receipts, including fees for permits and licenses, fines, penalties, and forfeitures; interest and dividends; rentals; royalties; and sale of Government property.
Special fund receipt accounts.—Special fund receipt accounts are credited with receipts from specific sources which are earmarked by law for a specific purpose, but which are not generated from a cycle of operations. The Congress may appropriate these receipts on an annual basis or for an indefinite period of time. Examples of special fund receipts are those arising from rents and royalties under the Mineral Leasing Act, the revenue from visitors to Yellowstone National Park, the proceeds of the sale of certain timber and reserve lands, and other receipts authorized to be credited to the reclamation fund.
General fund expenditure accounts.—General fund expenditure accounts are established to record amounts appropriated by the Congress to be expended for the general support of the Government. Such accounts are classified according to the limitations that are established by the Congress with respect to the period of availability for obligation of the appropriation, as 1-year, multiple-year, or "no-year" (without a time limit), and with respect to the agency authorized to enter into obligations and approve expenditures.
Special fund expenditure accounts.—Special fund expenditure accounts are established to record appropriated amounts of special fund receipts to be expended for special programs in accordance with specific provisions of law. These accounts are generally available without time limit, but may also be subject to time limitations as in the case of general fund accounts.
Revolving fund accounts.—These are funds authorized by specific provisions of law to finance a continuing cycle of operations in which expenditures generate receipts, and the receipts are available for expenditure without further action by Congress. They are classified as (a) Public enterprise funds where receipts come primarily from sources outside the Government and (b) intragovernmental funds where receipts come primarily from other appropriations or funds. Treasury reports generally show the net effect of operations (excess of disbursements or collections and reimbursements for the period) on the budget surplus or deficit. These accounts are usually designated as "no-year" accounts; i.e., they are without limitation as to period of availability for expenditures. Examples of public enterprise revolving funds are the Export-Import Bank of the United States and the Commodity Credit Corporation. Examples of intragovernmental revolving funds are the general supply fund, administered by the General Services Administration, and the Government Printing Office revolving fund.
ConsoUdated working fund accounts.—These are accounts established to receive (and subsequently disburse) advance payments from other agencies or bureaus pursuant to section 601 of the Economy Act (31 U.S.C. 686) or other provisions of law. Consolidated working funds may be credited with advances from more than one appropriation for the procurement of goods or services to be furnished by the performing agency with the use of its own facilities within the same fiscal year. Expenditures recorded in these accounts are stated net of advances credited and are classified under the agencies administering the accounts. The accounts are subject to the fiscal year limitations of the appropriations or funds from which advanced.
Management fund accounts.—These are working fund accounts authorized by law to facilitate accounting for and administration of intragovernmental activities (other than a continuing cycle of operations) which are financed by two or more appropriations. This classification is also often applied to the consolidated working funds for interagency activities described above.
Trust fund accounts.—These are accounts maintained to record the receipt and expenditure of moneys held in trust by the Government for use in carrying out specific purposes or programs in accordance with the terms of a trust agreement or statute. The receipts of many trust funds, especially the major ones, not needed for current payments are invested in public debt and Government agency securities. Generally, trust fund accounts consist of separate receipt and expenditure accounts, but when the trust corpus is established to perform a business-type operation, the fund entity is called a "trust revolving fund" and a combined receipt and expenditure account is used. Some of the major trust accounts are the Federal old-age and survivors insurance trust fund, unemployment trust fund, civil service retirement and disability fund, the national service life insurance fund, and the highway trust fund.
Transfer appropriation accounts.—These accounts are established to receive (and subsequently disburse) allocations which are treated as nonexpenditure
Digitized for FRASER http://fraser.stlouisfed.org/ Federal Reserve Bank of St. Louis

4 19 70 REPORT OF THE SECRETARY OF THE TREASURY
transactions at the time the allocation is made including certain transfers under section 601 of the Economy Act (31 U.S.C. 686), and similar provisions of law.
Other accounts Deposit fund accounts.—Deposit funds are combined receipt and expenditure
accounts established to account for receipts that are either: (a) Held in suspense temporarily and later refunded or paid into some other fund of the Government upon administrative or legal determinaton as to the proper disposition thereof, or (b) held by the Government as banker or agent for others and paid out at the direction of the depositor. Such funds are not available for paying salaries, expenses, grants, or other expenditures of the Government.
Historical Data
Historical data consistent with the unified budget have been compiled for the applicable tables back through fiscal 1954.
Digitized for FRASER http://fraser.stlouisfed.org/ Federal Reserve Bank of St. Louis

T A B L E S
NOTE.—Details of figures may not add to totals because of rounding.
Digitized for FRASER http://fraser.stlouisfed.org/ Federal Reserve Bank of St. Louis

1970 REPORT OF THE SECRETARY OF THE TREASURY
Summary of TABLE 1.—Summary of fiscal operations,
[On basis of "Monthly Statement oiReceipts and Expenditures
Fiscal year or month
1954 1955 1956 1957 1958-1959 1960 1961 1962 1963 1964 1965 1966 1967 1968 1969 1970 1969-July..
Aug.. . Sept . . Oc t . . . N o v . . Dec . . .
1970-Jan... Feb . . . Mar.. . Apr . . . May . . June . .
Budget receipts, expenditures, and lendkig
The expenditure account
Net receipts
$69,719,267,604 66,468,612,716 74,647,008,760 79,989,824,460 79,635,842,936 79,249,126,696 92,492,109,550 94,388,726,938 99,675,605,041
106,560,254,738 112,661,852,497 116,833,423,592 130,856,967,456 149,662,405,078 153,671,422,120 '•187,784,462,748 193, 743,250, 789 12,541, 688,994 14, 999,421,492 20,406, 963,159 11,832,178,033 14,331, 562, 939 16,701,061,781 16,302, 808,436 14, 929, 276, 867 13,109,893,448 22,042, 867,435 13, 986, 626, 624 22,660, 923, 691
Net expenditures
n.a. n.a. n.a. n.a.
$81,031,302,611 89,445,950,997 90,341,104,626 96,596,688,116
104,461,830,606 111,466,073,478 118,039,187,824 117,180,773,187 130,819,900,519 153,200,978,496 172,802,491.141 '•183,071,967,248 194,459, 543,206 15,642,327,069 16, 790,037,001 17,167,312, 276 17, 601,528, 875 15, 225,350,609 15, 228, 828,419 16,563, 652,047 14, 990,425, 667 16,301, 382,086 17, 867,179,186 16,320, 786, 846 14,870,733,237
Surplus, or deficit ( - )
n.a. n.a. n.a. n.a.
-$1,396,459,676 -10,196,824,401
2,151,004,925 -2,207,961,178 -4,786,226,566 -4,896,818,740 -5,377,335,327
-347,349,596 36,066,937
-3,648,573,418 -19,131,069,022
4,712,495,500 -716,292,416
-3,000, 638,065 - 1 , 790, 615, 609
3, 238, 660, 884 - 5 , 769, 350, 842
-893, 797,571 1,472, 223,362 -260, 843, 611 -61,149,809
-3,191,488,638 4,186, 688, 249
-2,336,161, 222 7, 690,190,354
The loan account i
Loan disburse
ments
n.a. n.a. n.a. n.a.
$6,519,941,000 7,869,473,000 8,309, 688,000 7,868,998,000 9,621,496,000 9,646,230,000
10,237,106,000 10,911,140,000 14,628,467,000 17,675,884,718 20.327.068,463 13,167,394,765 8, 343, 707, 335
470,050, 944 684, 775, 652 775,404, 889 819,479, 365 613, 295,604 686, 825,144 633,494,380 581,191,927 749, 744,118 663, 764,365 608, 586, 749
1,357,094,196
Loan repayments
n.a. n.a. n.a. n.a.
$4,976,161,000 5,200,965,000 6,427,339,000 6,671,107,000 7,270,733,000 9,791,169,000 9,692,585,000 9,662,168,000
10,796,441,000 12,622,606,574 14,296,904,552 11,691,193,471 6, 215,464,908
317, 674, 368 268, 813,438 327,009,369 477,217, 841 377,168,894 826,888, 618 697, 749,980 685, 666,499 511,851,341 364,040,162 484,647, 767 876,947, 742
Net lending
n.a. n.a. n.a.
-$1,543,790, doo -2,658,508,000 -1,882,249,000 -1,197,891,000 -2,350,763,000
144,929,000 -544.520,000
-1,248,972,000 -3,832,026,000 -5,053,278,144 -6,030,163,901 -1,476,201,294 -2,128,242,426
-152,476,586 -316,962,213 -448,395,620 -342,261,524 -236,136, 711
140,063,373 164, 265,600 104,473,571
-237,892, 778 -199, 724, 203 -124,038,982 -480,146,464
' Revised. n.a. Not available. » Data for fiscal years 1958-66 from 1969 budget document, released Jan. 29,1968. « For content, see table 17. ' For content, see table 18.
Digitized for FRASER http://fraser.stlouisfed.org/ Federal Reserve Bank of St. Louis

STATISTICAL APPENDIX
Fiscal Operations fiscal years 1964-70 and monthly 1970
ofthe United States Government," see "Bases of Tables"]
Budget receipts, expenditures, and lending—Continued
Outlays (expenditures
and net lending)
$70,889,744,341 68,609,184,178 70,460,329.329 76,740, 682. 604 82,575,092. 611 92,104.468.997 92,223.353,625 97,794, 579,116
106,812. 593,606 111, 311,144,478 118, 583, 707,824 118.429, 745.187 134, 651,926, 519 158, 254. 256. 640 178.832. 656. 042
r 184, 548.168, 542 196, 687,785, 632 15, 694,803, 645 17,105.999,214 17,615, 707,795 17,943.790,399 15,461,487.220 15,088, 765,046 16.399.396,447 14.885.952.096 16.539, 274,863 18.066,903,389 16,444,825,828 15,350,879,691
Budget surplus, or
deficit ( - )
-$1,170,476,837 -3,040,571,462
4,086,679,431 3,249,241,956
-2,939, 249, 676 -12,855,332.401
268, 755,926 -3,405, 862,178 -7,136,988. 565 - 4 , 760,889, 740 -5,921. 855.327 - 1 . 596.321, 595 - 3 . 795,959. 063 - 8 , 701.851. 661
-25.161,232,923 3,236, 294,206
-2.844, 534.843 -3.153,114, 661 -2.106,577, 722
2, 790, 255,364 - 6 , 111, 612,365 -1.129,934.281
1.612,286, 735 -96, 688, Oil
43,323, 762 -3,429,381,415
3,985,964.046 -2,459,200.204
7,210.043.900
Selected balances, end of period
Federal securities
$272,223.065,108 275,933.494,339 274, 604,664.349 273.420, 743,258 280,310. 750,260 289, 745.991,938 293,100, 313, 785 295,448,189.882 306.128.179. 640 313.982.733.188 320,344.400. 566 326. 609, 052, 266 333.283,859,338 344. 676.264.466 371, 977,865,716 367,969.306. 637 383,428,409, 505 372, 584,461,627 372,930,193,117 374, 785,170, 676 378,446, 527,155 382,017, 054,923 382,045, 396,865 381.327.196,170 381,812,862,938 384,994, 283,247 380,141.723.264 383,757.391.159 383,428.409,506
Federal securities held by
the public ^
$224.499,347,683 226, 616, 602,364 222.226.806.401 219.421,416,472 226.363.338. 768 235, 002, 786.899 237,176,808,656 238, 603,936,167 248.373.176. 502 264.461,302,259 257, 663, 066, 891 261, 613, 962,465 264, 690.415. 677 267, 528,868, 721 290.629, 298.865 279.483,009,885 284,880, 256.929 283,929, 791,333 284.608,308,336 284,232,824,363 288,620,833, 749 291.306, 236, 738 289.293,774,286 289,099, 726, 643 288,960,813.053 291,275,117,304 286,584.394.776 288,036,156,118 284,880. 255,929
General account of the
Treasurer of the UnitedStates*
$6,738,565,437 6,266,781,422 6, 799, 668.033 5.648,470,259 9, 797,462,839 5.391,691,923 8.156.018,136 6, 770, 617, 586
10,604,210, 952 12.380,408.389 11,116.139.804 12, 709,996. 684 12.449, 615,322 7,878. 619,874 6, 784. 692, 839 7,644,408.390 9.290.801,616 6,650,431,546 4,897. 641,431 7,656. 797,669 6,428,902,589 7.436,495,068 6,241.246,870 7.593.067,393 7,648.673.066 7.874,779.927 8,494.548,285 6,834.198, 207 9,290,801,616
Other cash and monetary
assets
$2,820,303,610 2,303,984,346 1,943,614,996 2,662,035,201 3,198,868,818 3,174,407,652 2,936,385,245 2,568,141,641 2.534,788,362 2,221,776,329 1,896. 055,937 2,648,116,850 2,459,663,848 2,112,501,319 4,609.826,676 6,962,635,684 5,786,048,482 5, 720.961.125 6, 760.454,910 6,186.376,437 6. 267.724.091 6.207,404.637 6,672. 710,749 7,095,837, 624 6, 795,260.679 6,117,418.184 6.109.071 603 6,603.274, 779 6.786,048.482
4 Includes transactions in transit as of June 30. For content, see table 52. NOTE.—Some of the fiscal 1954-68 data have been revised due to reclassifications in the unified budget
durmg fiscal year 1969.
Digitized for FRASER http://fraser.stlouisfed.org/ Federal Reserve Bank of St. Louis
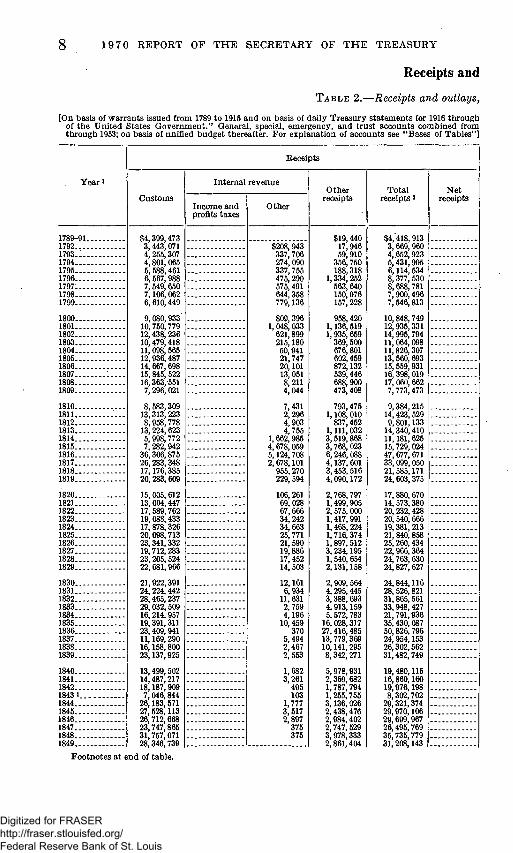
8 1970 REPORT OF THE SECRETARY OF THE TREASURY
Receipts and
TABLE 2.—Receipts and outlays,
[On basis of warrants issued from 1789 to 1915 and on basis of daily Treasury statements for 1916 through of the United States Government." General, special, emergency, and trust accounts combined from through 1953; on basis of unified budget thereafter. For explanation of accounts see "Bases of Tables"]
Year >
1789-91 1792 1793.. 1794 1795 1796 1797. 1798 1799
1800 1801 1802 1803 1804 1805 1806 1807 1808 1809-
1810 1811 1812 1813 1814 1815 1816 1817 1818 1819 -
1820. 1821 1822 1823 1824 1825 1826 1827 1828 1829
1830 1831 1832 1833 1834 1835 1836 1837 1838-. 1839
1840 1841 1842 18431 1844 1845 1846 -1847 1848 1849
Receipts
Cus toms
$4,399,473 3,443.071 4, 255.307 4.801.066 5,588.461 6.567,988 7. 649, 650 7,106, 062 6, 610,449
9,080,933' 10,750,779 12.438,236 10.479.418 11. 098,665 12.936,487 14. 667.698 15.845, 522 16,363,-651 7,296, 021
8.583,309 13,313,223 8,958.778
13.224.623 5.998,772 7,282,942
36.306.875 26.283,348 17,176.385 20,283, 609
15,005,612 13,004,447 17,589,762 19,088,433 17.878.326 20.098,713 23,341.332 19.712.283 23.205.624 22, 681,966
21,922,391 24,224,442 28,465,237 29,032,609 16,214,967 19,391,311 23.409,941 11,169.290 16.168.800 23.137,925
13.499.502 14.487.217 18.187.909 7, 046,844
26.183,571 27, 528.113 26.712,668 23,747,866 31.767,071 28.346,739
I n t e m a l revenue
Income and profits taxes
.
Other
$208,943 337.706 274,090 337.766 475.290 575,491 644,368 779.136
809.396 1, 048.033
621.899 215,180 50,941 21.747 20,101 13,051 8.211 4,044
7,431 2,296 4.903 4.755
1,662,985 4.678.059 5.124.708 2. 678,101
956,270 229,694
106,261 69,028 67,666 34.242 34, 663 26,771 21,590 19,886 17,452 14,603
12,161 6,934
11,631 2,759 4,196
10,459 370
5.494 2.467 2,663
1.682 3.261
496 103
1,777 3,517 2,897
375 375
Other receipts
$19,440 17,946 59.910
356,750 188,318
1,334,262 563, 640 150,076 167, 228
958,420 1.136, 519 1.935.659
369,500 676.801 602,459 872,132 539,446 688,900 473,408
793,475 1,108, 010
837,462 1, 111, 032 3, 619,868 3,768,023 6,246,088 4,137,601 3,463,616 4,090,172
2,768,797 1,499.905 2.675, 000 1,417,991 1,468,224 1,716,374 1,897,512 3,234,195 1,540,654 2.131,168
2,909, 564 4.295.446 3,388,693 4,913.159 5.672,783
16.028,317 27,416.486 13.779.369 10.141.295 8,342,271
5,978,931 2.369.682 1,787,794 1,256,755 3,136,026 2,438.476 2,984,402 2.747.529 3,978,333 2,861,404
To ta l receipts 2
$4.418,913 3.669.960 4.652.923 5,431,906 6.114.534 8.377.530 8.688.781 7.900.496 7,646,813
10.848.749 12,936,331 14,995,794 11.064, 098 11.826,307 13,560, 693 15,559,931 16,398, 019 17,060, 662 7,773,473
9,384,215 14,423, 529 9,801,133"
14,340,410 11,181,625 16.729, 024 47, 677, 671 33,099,050 21.585.171 24,603,375
17.880,670 14,573,380 20,232.428 20.540.666 19.381.213 21,840,858 25,260,434 22,966,364 24,763,630 24,827,627
24,844,116 28, 526,821 31,865,561 33,948.427 21,791,936 35.430,087 50,826,796 24,954,153 26,302,562 31,482,749
19,480,115 16,860,160 19,976.198 8.302,702
29.321,374 29.970.106 29,699,967 26,495.769 35,736,779 31,208,143
N e t receipts
"• '_ [
Footnotes at end of table.
Digitized for FRASER http://fraser.stlouisfed.org/ Federal Reserve Bank of St. Louis
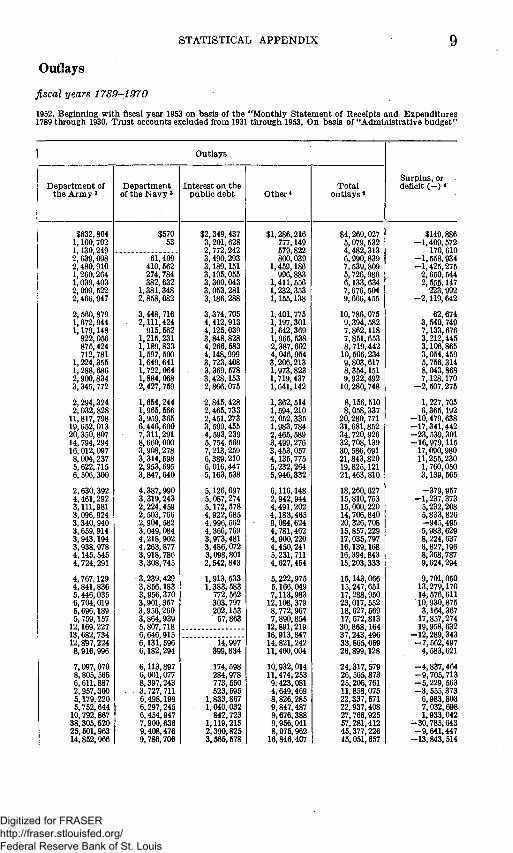
STATISTICAL APPENDIX 9
Outlays
fiscal years 1789-1970
1952. Beginning with fiscal year 1963 on basis of the "Monthly Statement of Receipts and Expenditures 1789 through 1930. Trust accounts excluded from 1931 through 1953. On basis of "Administrative budget"
Outlays
Department of the Army 3
$632,804 1,100,702 1,130,249 2.639,098 2,480.910 1.260.264 1,039,403 2,009. 522 2,466,947
2,560,879 1,672.944 1.179,148
822,056 875.424 712,781
1,224,355 1,288,686 2,900,834 3.345.772
2.294,324 2,032,828
11,817,798 19,652.013 20,350,807 14,794,294 16,012,097 8.004.237 5. 622.715 6,506,300
2.630,392 4,461.292 3.111,981 3,096,924 3,340,940 3,659,914 3.943,194 3,938,978 4,145, 545 4.724,291
4.767,129 4.841.836 6.446,035 6.704,019 5,696,189 5,759,157
12,169,227 13,682,734 12,8^7,224 8,916,996
7,097,070 8,805,565 6,611,887 2,957,300 5,179,220 5,752.644
10,792,867 38,305,520 25,501,963 14,852,966
Department of the Navy ^
$570 53
6i,'469' 410.562 274.784 382,632
1,381,348 2,858,082
3,448,716 2,111,424
915,562 1,215.231 1,189,833 1, 697, 600 1.649,641 1.722,064 1,884.068 2,427,769
1,664.244 1.966,666 3,959,365 6,446,600 7,311,291 8,660,000 3.908.278 3,314.598 2.953.695 3.847,640
4,387,990 3,319,243 2,224,459 2,603.766 2,904.682 3,049,084 4,218,902 4,263,877 3,918,786 3.308,746
3,239,429 3,856.183 3,956.370 3.901,367 3,956,260 3,864,939 5,807,718 6,646,915 6,131.696 6,182,294
6,113,897 6,001,077 8,397,243
- 3,727,711 6.498,199 6,297,245 6,454,947 7,900,636 9,408,476 9.786,706
Interest on the public debt
$2,349,437 3,201,628 2,772,242 3,490,293 3,189,151 3,195.055 3,300,043 3,053,281 3.186,288
3,374.705 4,412.913 4,125,039 3.848,828 4,266,683 4,148,999 3,723,408 3,369.578 3,428,153 2,866,075
2,845,428 2,465,733 2,451,273 3,599,455 4,593,239 5,754,569 7,213,259 6,389,210 6,016,447 5,163,638
6,126,097 5,087,274 5,172,578 4,922.685 4,996,562 4,366,769 3,973,481 3,486,072 3,098.801 2,542,843
1,913,533 1,383,683
772,562 303,797 202,153
57,863
i4,"997" 399,834
174,598 284,978 773,650 523,595
1,833,867 1,040,032
842,723 1,119,215 2,390,825 3,565.678
Other*
$1,286,216 777,149 579,822 800,039
1,459,186 996.883
1,411.656 1,232,353 1,155,138
1,401,775 1,197,301 1,642,369 1,966.638 2.387,602 4,046,954 3,206,213 1,973,823 1,719.437 1,641.142
1,362.514 1,594,210 2,052,335 1,983,784 2,465.589 3.499.276 3.453,067 4.135,775 5,232.264 5,946,332
6,116,148 2,942,944 4,491,202 4,183,465 9.084.624 4,781.462 4.900,220 4,450,241 5,231,711 4,627,454
5.222,976 5,166,049 7,113,983
12,108.379 8,772,967 7,890,854
12,891,219 16,913,847 14,821,242 11,400,004
10,932,014 11,474,253 9,423,081 4,649,469 8,826,285 9,847,487 9,676,388 9,956,041 8,075,962
16,846,407
Total outlays'
$4,269,027 5.079.532 4.482,313 6,990,839 7,539.809 6.726.986 6.133,634 7,676,504 9.666.455
10,786,075 9,394,682 7,862.118 7,851,653 8,719.442
10.606,234 9,803.617 8,364.151 9,932.492
10.280,748
8,156,510 8,058,337
20,280.771 31.681.852 34.720,926 32.708,139 30,586.691 21,843.820 19,826.121 21,463.810
18,260.627 15.810,763 15,000.220 14.706,840 20,326,708 15,857,229 17,035,797 16,139,168 16,394.843 16.203.333
15.143,066 15,247,651 17,288,950 23,017,552 18,627,669 17,572,813 30,868,164 37,243,496 33,865,059 26,899.128
24.317,579 26,565,873 25,205,761 11,858,076 22,337,571 22,937,408 27,766,925 67,281,412 45,377,226 45,051,657
Surplus, or deficit ( - ) «
$149,886 -1,409,672
170,610 -1,658.934 -1,425,275
2,660.544 2,5^,147
223,992 -2.119,642
62,674 3,540,749 7,133,676 3,212,445 3.106.865 3,054,459 5.766.314 8,043,868 7,128,170
-2,607,275
1,227.705 6,365.192
-10,479,638 -17,341,442 -23.539.301 -16,979,116
17,090,980 11,255,230 1,760,050 3,139,566
-379,957 -1,237,373
5,232,208 6,833,826 -945,495 5.983,629 8,224.637 6.827,196 8,368,787 9,624,294
9,701,060 13,279,170 14.676,611 10.930.875 3,164.367
17,857,274 19.958,632
-12,289,343 -7,562,497
4,583,621
-4,837,464 -9,705.713 -5.229,563 -3,555,373
6.983.803 7,032,698 1,933,042
-30,785,643 -9,641,447
-13,843,614
Digitized for FRASER http://fraser.stlouisfed.org/ Federal Reserve Bank of St. Louis

10 1 9 7 0 REPORT OF THE SECRETARY OP THE TREASTJRY
Yeari
1850 1861 1862 1853 1864 1855 1856 1867 1868 1859
I860 1861 1862.. 1863 1864 1865 1866 . . 1867 1868 1869
1870 1871 1872 1873 1874 1875 1876 1877 1878 1879
1880 1881 1882 1883 1884 1885. 1886 1887 1888 1889
1890 1891 1892 1893 1894 1895 1896 1897 1898 1899
1900 1901 1902.... 1903 1904 1905 1906 1907 1«08 1909 1910 1911 1912
TABLE 2.-—Receipts and outlays.
Receipts
Customs
$39,668,686 49.017,568 47,339,327 58.931,866 64.224,190 53,025.794 64,022,863 63,876.905 41,789.621 49,565,824
53,187,512 39,582,126 49,056.398 69.059,642
102,316.153 84.928,261
179.046,652 176,417,811 164,464, 600 180,048, 427
194.638.374 206. 270.408 216.370, 287 188.089.523 163.103,834 157,167.722 148,071.985 130,956,493 130.170,680 137, 250.048
186, 522.064 198,159.676 220,410, 730 214, 706,497 195.067.490 181.471.939 192.905,023 217,286.893 219.091.174 223.832.742
229,668.585 219, 522,205 177,452,964 203,356,017 131,818, 631 162.168,617 160,021, 752 176, 564.127 149, 675, 062 206.128.482
233.164.871 238.585.456 264,444, 708 284,479.582 261.274, 665 261. 798.857 300, 251,878 332.233.363 286.113.130 300.711.934 333,683.445 314.497.071 311.321,672
Internal
Income and profits taxes
$2,741,858 20,294.732 60.979.329 72,982,159 66,014.429 41,465,698 34, 791,856
37,775,874 19,162.651 14.436,862 6. 062,312
139,472 233 588 98
3,022
66,628
77,131
20,951, 781 33, 516,977 28,683.304
revenue
Other
$34,898,930 89.446,402
148,484,886 236, 244,664 200,013,108 149.631.991 123, 664,605
147,123,882 123.935,603 116,205,316 108,667,002 102, 270.313 110,007. 261 116, 700,144 118,630,310 110. 681.625 113.561,611
124,009,374 135,261,364 146,497, 696 144, 720,369 121,530,446 112,498,726 116,805.936 118.823,391 124, 296,872 130,881,514
142,606,706 146.686, 250 153.971.072 161.027.624 147. 111. 233 143.344. 641 146. 762,866 146.688, 674 170,900, 642 273,437,162
295,327,927 307,180,664 271,880.122 230,810,124 232,904,119 234.095. 741 249,150, 213 269, 666, 773 251, 711,127 246. 212,644 268,981, 738 289,012, 224 293.028.896
Other receipts
$3,934,753 3,541,736 2, 507,489 2,655.188 9,676.151
12,324, 781 10,033,836 6,089,408 4,865,745 3,920, 641
2,877.096 1,927,805 2,931,058 6,996,861
52.569,484 39.322.129 69. 759,155 48,188,662 60,085,894 32,538,859
31,817,347 33,955,383 27,094, 403 31.919,368 39,465,137 20,824,835 29,323,148 31,819,518 17, Oil, 574 23,015,526
22,995,173 27.358,231 36,616,924 38.860,716 31,866,307 29. 720,041 26, 728, 767 35, 292.993 36,878,029 32.335,803
30,805,693 27,403,992 23, 513,748 21,436,988 27, 425, 552 29.149.130 31.357,830 24,479.004 84,845,631 36,394.977
38,748,054 41.919,218 36,153.403 46, 591,016 46.908.401 48.380.087 45. 682.355 63,960, 250 64.037, 650 57.395,920 51.894. 751 64,806.639 59.675,332
Total receipts 3
$43,603,439 52,559,304 49,846.816 61.687,054 73,800,341 65,350, 576 74,056,699 68,965,313 46,655,366 63,486.465
56. 064.608 41.609,931 51,987,456
112,697. 291 264. 626. 771 333. 714,605 668.032.620 490. 634.010
. 405.638,083 370,943, 747
411,255,477 383,323.945 374.106.868 333. 738,205 304,978. 756 288.000.051 294,096,865 281.406.419 257. 763,879 273.827.185
333, 526,611 360,782,293 403.525, 250 398.287,582 348.519,870 323,690,706 336,439, 726 371,403, 277 379,266,075 387,050.059
403,080.984 392.612.447 354.937, 784 386,819.629 306,355,316 324, 729,419 338.142.447 347,721, 705 405,321,335 516.960.621
567, 240,852 687,685,338 562,478,233 561,880, 722 641.087,085 544.274,685 594,984.446 665,860,386 601,861,907 604,320,498 675.611.715 701.832,911 692,609. 204 1
Net receipts
Footnotes at end of table.
Digitized for FRASER http://fraser.stlouisfed.org/ Federal Reserve Bank of St. Louis

STATISTICAL APPENDIX
fiscalyears 1789-1970—Contmued
11
D e p a r t m e n t of t h e A r m y 3
$9,400,239 11,811,793 8,225,247 9,947,291
11,733,629 14,773,826 16,948,197 19,261,774 25,485,383 23.243,823
16,409,767 22,981,150
394,368,407 599,298,601 690, 791,843
1.031,323,361 284,449,702 95,224,415
123,246, 648 78, 501,991
57,656,676 35.799,992 35,372,157 46,323,138 42.313,927 41,120,646 38,070,889 37,082, 736 32,154,148 40.425,661
38.116,916 40,466.461 43, 670,494 48,911,383 39.429, 603 42,670, 578 34,324,153 38, 661, 026 38,522,436 44.435. 271
44,582,838 48. 720,065 46,895, 456 49, 641, 773 64.567,930 51,804, 759 50,830,921 48,950, 268 91,992,000
229.841, 254
134, 774, 768 144.615,697. 112, 272, 216 118, 629, 505 165,199,911 126,093,894 137.326,066 149, 775,084 176.840,453 192,486, 904 189,823,379 197.199.491 184.122, 793
D e p a r t m e n t of t he N a v y 3
$7.904,709 9,005,931 8,952,801
10,918,781 10.798,586 13,312.024 14,091,781 12,747,977 13,984, 551 14.642,990
11.514,965 12,420,888 42,668.277 63,221,964 85, 725,995
122,612,945 43,324,118 31.034, Oil 25,775, 503 20,000,758
21,780, 230 19,431,027 21, 249,810 23,526, 257 30,932.587 21,497,626 18,963.310 14,959,935 17,365,301 15,125.127
13, 536,985 15,686,672 15,032, 046 15, 283,437 17.292,601 16,021,080 13,907,888 15.141,127 16,926,438 21,378,809
22,006, 206 26,113,896 29,174,139 30,136, 084 31, 701, 294 28, 797,796 27,147, 732 34, 561, 546 58,823,985 63.942,104
65,953,078 60, 506,978 67,803,128 82,618,034
102,956,102 117, 650,308 110,474, 264 97,128, 469
118,037,097 115, 546, Oil 123,173,717 119.937, 644 135. 591,956
Out lays
Interes t on t he pub l ic deb t
$3,782,331 3,696,721 4,000,298 3,665,833 3, 071, 017 2,314,375 1,953,822 1, 678, 265 1, 567, 056 2, 638,464
3,177,315 4,000,174
13,190,325 24,729,847 53,685,422 77,397, 712
133,067, 742 143, 781, 592 140,424,046 130,694, 243
129,235,498 125, 576, 566 117,357,840 104, 750,688 107.119,815 103,093, 545 100,243, 271 97,124, 512
102,600,875 106,327,949
95. 757. 675 82. 508. 741 71, 077, 207 59,160,131 54, 578,379 51,386,256 50, 580,146 47, 741, 677 44. 715. 007 41,001,484
36,099,284 37,547,135 23,378,116 27, 264,392 27,841,406 30,978,030 35,385,029 37,791,110 37, 685.056 39.896, 925
40,160,333 32,342.979 29.108.045 28, 556,349 24, 646.490 24. 590,944 24,308, 576 24, 481,158 21.426,138 21.803,836 21,342,979 21.311,334 22. 616,300
Othe r*
$18,456,213 23.194, 672 23,016, 573 23,652,206 32,441,630 29,342,443 36, 577, 226 34,107, 692 33,148, 280 28. 545.700
32.028, 551 27,144,433 24, 534,810 27,490.313 35,119.382 66, 221, 206 59, 967,855 87. 602, 657 87,894,088 93, 668. 286
100,982.157 111, 369,603 103.638,156 116, 745,162 122.267. 544 108,911, 576 107,823,615 92,167, 292 84,944,003
106,069,147
120,231.482 122, 051.014 128,301, 693 142,053,187
. 132,825,661 150,149,021 143,670,952 166, 488, 451 167, 760,920 192,473,414
215,352.383 253,392,808 245, 575, 620 276,435, 704 253,414,651 244,614, 713 238.815,764 244,471, 235 254,967, 542 271,391,896
289,972,668 287.151, 271 276,050,860 287, 202, 239 290,857,397 299,043, 768 298,093,372 307, 744,131 343,892,632 363,907,134 359.276,990 352,753, 043 347. 550,285
To ta l o u t l a y s 2
$39, 643,492 47, 709, 017 44,194,919 48,184, 111 68,044,862 59, 742,668 69, 571,026 67,795.708 74,185,270 69,070,977
63,130, 598 66, 546, 645
474,761,819 714, 740, 725 865,322,642
1,297, 555,224 620,809,417 357, 642,675 377,340, 285 322,865, 278
309,653, 561 292,177,188 277, 517,963 290,345, 245 302,633,873 274,623,393 265.101,085 241.334,475 236,964,327 266,947,884
267.642,958 260,712,888 257.981, 440 265,408,138 244,126, 244 260,226,935 242,483,139 267,932,181 267.924,801 299.288,978
318,040.711 365, 773,904 345,023,331 383,477,963 367,525,281 356,195,298 352,179,446 365, 774,159 443,368, 583 606.072.179
520,860,847 524,616,925 485,234, 249 517,006.127 583,659,900 667, 278,914 670,202,278 579.128,842 659,196,320 693,743,885 693,617,065 691, 201. 512 689,881.334
Surp lus , or deficit ( - ) *
$4.059,947 4.850,287 6,661,897
13,402,943 16,756,479
5, 607,907 4.485,673 1.169.605
-27.529,904 -15,584,512
-7 ,065,990 -25,036,714
-422,774,363 -602.043,434 -600,695.871 -963,840,619
37,223, 203 133,091,335 28.297.798 48,078,469
101.601,916 91.146, 757 96, 688,905 43,392,960
2.344,883 13.376, 658 28.994. 780 40.071.944 20, 799,552 6,879.301
65,883.653 100.069.405 145, 543,810 132,879,444 104,393,626 63.463, 771 93.956,587
103,471,096 111, 341,274
87, 761,081
85,040,273 26.838.643 9,914.453 2.341.676
-61,169,966 -31,465.879 -14,036.999 -18,052,4.54 - 3 8 , 047.248 -89,111,558
46.380,005 63.068,413 77.243.984 44,874,595
-42,572.815 -23.004.229
24,782.168 86.731, 644
-67,334,413 -89.423.387 -18,105,350
10,631.399 2, 727,870
409-714—71-
Digitized for FRASER http://fraser.stlouisfed.org/ Federal Reserve Bank of St. Louis
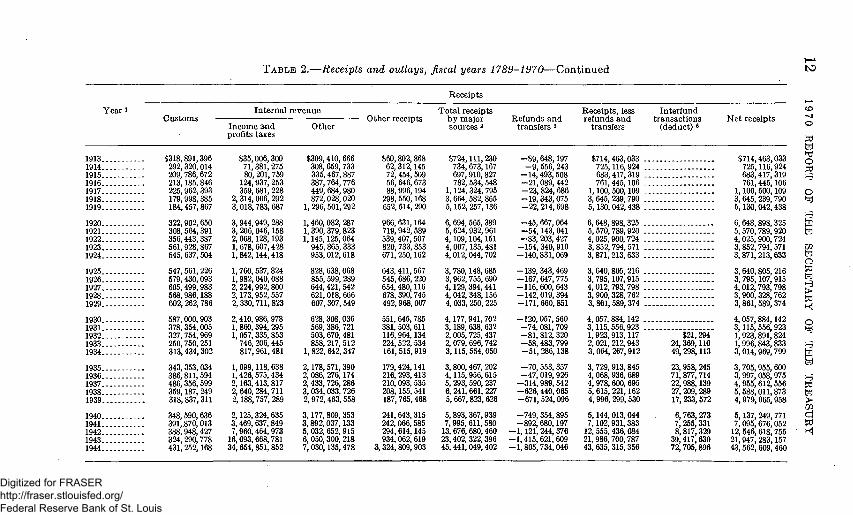
T A B L E 2.—Receipts and outlays, fiscal years 1789-1970—Continued tsD
Y e a n
1913 ---1914 1915 . -1916 1917 1918 --- -1919 - ---
1920 1921 1922 1923 1924
1925 1926 - -. 1927 1928 1929
1930 1931 1932 1933 1934..
1935 1936 1937 1938 ---. 1939
1940 1941 1942 1943 1944
Cus toms
$318, 891,396 292.320.014 209, 786, 672 213,185,846 225, 962.393 179.998, 385 184,457.867
322, 902, 660 308,564,391 356,443,387 561,928,867 545, 637,504
547,561, 226 579,430,093 605,499,983 568,986,188 602, 262,786
587.000,903 378,354,005 327.754.969 250, 750. 251 313,434,302
343,363, 034 386,811.594 486.356.599 359,187, 249 318.837.311
348, 590, 636 391,870,013 388, 948.427 324, 290,778 431, 252.168
I n t e r n a l :
Income and profits taxes
$35.006,300 71.381, 275 80, 201,759
124.937, 253 359,681, 228
2, 314,006, 292 3, 018,783. 687
3,944.949. 288 3, 206,046,158 2.068.128,193 1, 678, 607,428 1,842,144,418
1.760.637.824 1, 982.040.088 2, 224,992.800 2,173,952,657 2,330.711,823
2.410, 986.978 1, 860, 394, 295 1,057, 335.853
746, 206,445 817,961,481
1.099.118, 638 1,426,575, 434 2,163,413,817 2. 640. 284. 711 2.188, 757. 289
2.125.324, 635 3,469,637,849 7.960,464, 973
16.093, 668, 781 34, 654, 851,852
revenue
Other
$309,410,666 308, 659,733 335.467,887 387,764,776 449. 684.980 872, 028.020
1, 296, 501. 292
1,460, 082, 287 1,390, 379,823 1.145,125, 064
945,865,333 953, 012. 618
828, 638, 068 855.599, 289 644,421. 542 621, 018, 666 607,307. 549
628, 308,036 569, 386. 721 503, 670,481 858, 217, 512
1,822, 642, 347
2.178.571, 390 2, 086, 276,174 2,433.726, 286 3, 034.033, 726 2,972,463,558
3.177.809,353 3,892.037,133 5,032,652, 915 6, 050,300, 218 7, 030,135,478
Other receipts
$60,802,868 62, 312,145 72,454,509 56, 646, 673 88.996,194
298, 550,168 652,514, 290
966, 631,164 719.942,589 539,407, 507 820.733.853 671, 250,162
643,411,567 545, 686, 220 654,480,116 678,390,745 492,968. 067
651. 645.785 381, 503, 611 116.964,134 224, 522,534 161, 515,919
179.424,141 216, 293.413 210, 093, 535 208,155,541 187,765.468
241, 643.315 242.066.585 294.614,145 934.062, 619
3. 324.809.903
Receipts
To ta l receipts b y major sources 2
$724, 111, 230 734, 673.167 697, 910,827 782. 634.548
1,124, 324,795 3, 664, 582. 865 5.152, 257,136
6, 694,565,389 5, 624, 932.961 4,109.104,151 4.007.135,481 4, 012,044.702
3, 780.148, 685 3,962.755. 690 4.129.394,441 4.042, 348.156 4, 033, 250, 225
4,177.941, 702 3,189, 638, 632 2, 005, 725,437 2, 079, 696, 742 3,115,654,050
3,800,467. 202 4.115,956, 615 5, 293.590. 237 6, 241,661, 227 5, 667,823,626
5,893,367,939 7,995.611,580
13,676,680,460 23,402. 322,396 45,441, 049,402
Refunds and transfers *
-$9,648,197 - 9 , 5 5 6 , 243
-14,493,508 -21,089,442 -23,824,686 -19.343,075 - 2 2 . 214, 698
- 4 5 . 667, 064 -54.143,041 - 8 3 , 203,427
-154,340,910 -140,831,069
-139,343,469 - 1 6 7 . 647, 775 - 1 1 6 . 600. 643 -142.019,394 -171,660,851
-120.057.560 - 7 4 . 081, 709 -81,812.320 -58,483,799 - 5 1 . 286.138
-70 .553 , 357 - 4 7 , 019,926
-314,989,542 -626,440,065 -671,524,096
-749.354.895 -892,680,197
- 1 . 1 2 1 , 244,376 -1.415,621,609 -1,805,734.046
Receipts , less refunds a n d
transfers
$714,463,033 . 725,116,924 . 683,417,319 . 761,446.106 .
1.100, 500,109 . 3,645,239,790 . 5,130,042,438 .
6.648,898,325 . 6,570,789,920 . 4,025.900.724 . 3,852.794,571 . 3,871,213,633 .
3. 640,805. 216 . 3, 795,107.915 . 4,012,793.798 . 3,900.328, 762 . 3,861,689,374 .
4,057.884.142 . 3,115, 556,923 . 1, 923,913,117 2, 021, 212.943 3, 064, 267,912
3, 729. 913,845 4, 068, 936, 689 4, 978, 600, 695 6, 615, 221,162 4,996, 299.530
5.144,013.044 7,102,931.383
12, 555.436,084 21, 986,700.787 43. 635, 315.366
In ter fund t ransact ions
(deduct) 6
$21.294 24,369,110 49,298,113
23.958, 246 71,877,714 22,988,139 27, 209,289 17,233,672
6, 763, 273 7,256,331 8,817,329
39,417,630 72,705.896
N e t receipts
$714,463,033 725.116.924 683.417,319 761,446,106
1,100,500,109 3,645. 239. 790 5.130.042,438
6.648,898.325 6.570.789.920 4.025.900.724 3.852, 794, 571 3,871, 213,633
3, 640,805, 216 3.795,107,915 4,012.793, 798 3,900,328,762 3,861,589.374
4, 057.884.142 3.115,556,923 1, 923,891,824 1, 996,843,833 3.014,969,799
3. 705,955, 600 3, 997, 058, 975 4.955,612,556 6, 688, Oil, 873 4.979,065,958
5.137,249,771 7,095, 676,052
12.546,618,766 21,947, 283,157 43.562. 609,460
h - l
CO
0
0
Q
^
tei
w tei 0 SI tei H
>
0
w tei
tei >
Digitized for FRASER http://fraser.stlouisfed.org/ Federal Reserve Bank of St. Louis
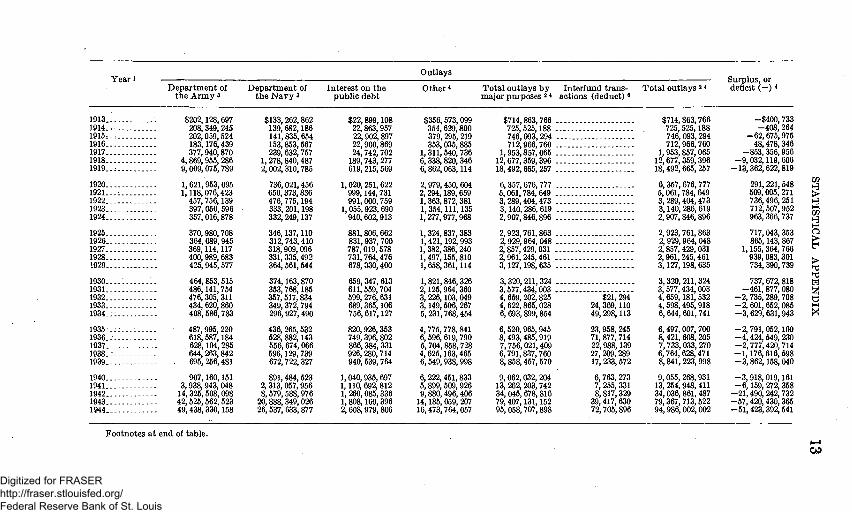
Y e a r i D e p a r t m e n t of
t h e A r m y 3
Out lays
D e p a r t m e n t of t h e N a v y 3
In te res t on t he pub l ic d e b t
O the r 4 T o t a l out lays b y major p m p o s e s 2 4
In ter fund t ransactions (deduc t )«
T o t a l out lays a * Surplus , or deficit ( - ) *
1913 . $202,128,697 $133,262,862 $22,899,108 $356,673,099 $714,863.766 $714,863,766 -$400,733 1914. . . 208,349,245 139,682,186 22,863,957 354.629,800 725.525,188 725,525,188 -408,264 1915. . . 202,059,524 141,835,654 22,902,897 379,295,219 746,093,294 746,093,294 -62,676,975 1916.. 183.176,439 163,853,567 22,900,869 363,035.885 712.966,760 712,966,760 48,478,346 1917 377,940,870 239,632,757 24,742,702 1,311,540,736 1,953,857,065 1,963,857,065 -853.356,956 1918.- . - 4,869,955,286 1,278,840,487 189,743,277 6,338,820,346 12,677,359,396 12,677,359,396 -9,032,119.606 1919. . . 9,009,075,789 2.002,310,785 619,216,569 6,862,063,114 18,492,665,257 18,492,665,257 -13,362,622,819
1920 - . - 1,621,953,095 736,021,456 1,020,251.622 2,979,450,604 6,357,676.777 6,357.676,777 291,221,548 1921.. .- . 1,118,076,423 650.373,836 999,144.731 2.294,189,669 6,061,784.649 6,061,784.649 509,005,271 1922 457,756.139 476,775,194 991,000,769 1,363,872,381 3,289,404,473 3,289.404,473 736,496.261 1923 397.060,596 333.201,198 1,056,923,690 1,354,111.135 3,140,286,619 3,140,286,619 712,607,952 1924 357,016,878 332,249,137 940,602,913 1,277,977,968 2,907,846,896 2,907,846,896 963,366,737
1925 370.980.708 346.137,110 881,806,662 1,324,837.383 2,923,761.863 2.923.761,863 717,043.363 1926 364,089,945 312,743,410 831,937,700 1,421,192,993 2,929.964,048 2,929,964,048 865,143,867 1927 369.114,117 318,909,096 787,019,578 1,382,386,240 2,857,429,031 - 2,857,429,031 1,155,364,766 1928 400,989.683 331.335.492 731,764,476 1,497,155.810 2,961,245,461 2,961,245,461 939,083,301 1929 425,945,677 364,661,544 678,330.400 1,658,361,114 3,127,198,636 3,127,198,635 734,390,739
1 9 3 0 . . . . : . . 464,853,615 374,163,870 659,347,613 1.821,846.326 3,320,211,324 3,320.211,324 737,672.818 1931 . - - . . - . - 486,141,754 353,768,186 611,659,704 2,125.964,360 3.677,434,003 3,577,434,003 -461,877,080 1932 476,305,311 357,617,834 599,276,631 3.226,103.049 4,659.202.825 $21,294 4,659,181,632 -2,735,289,708 1933 434,620,860 349,372,794 689,366,106 3,149,606,267 4,622.865,028 24,369,110 4,698.495,918 -2.601,652,085 1934 . : : . - 408,686,783 296,927,490 756,617,127 6,231,768,454 6,693,899,854 49,298,113 6.644,601,741 -3,629,631,943
1 9 3 5 - - : : - . - . 487,996,220 436,266,532 820,926,353 4,775,778.841 6,520,965,945 23,958,246 6,497,007.700 -2,791,052,100 1936.: 618,687,184 628,882.143 749,396,802 6,696.619,790 8,493.485.919 71,877,714 8,421,608,206 -4.424,549,230 1937 628.104.285 556.674.066 866,384,331 6,704.858,728 7,766,021,409 22,988,139 7,733,033,270 -2.777,420,714 1938.: 644.263,842 596,129,739 926,280,714 4,625.163.465 6.791,837,760 27,209,289 6,764,628,471 -1,176,616,698 1939 695,256,481 672,722,327 940.539.764 6,549,938,998 8,868,457,570 17,233,672 8,841,223,998 -3.862.158,040
1940 907,160.151 891,484,523 1,040,935,697 6,222,451,833 9,062,032,204 6,763.273 9.056,268.931 -3,918,019.161 1941 3,938,943,048 2.313,057.956 1,110,692.812 6,899,509,926 13,262,203,742 7,265,331 13,254.948,411 -6,159,272.358 1942 14.325.508,098 8,679,688.976 1,260,085.336 9,880,496.406 34,045.678,816 8,817,329 34,036.861,487 -21,490,242.732 1943 42,525,662.523 20.888,349,026 1.808,160,396 14.185,069,207 79,407,131,162 39,417,630 79,367,713,522 -57,420,430,365 1944 49,438,330.158 26,637,633,877 2,608,979,806 16,473,764,057 95.058.707,898 72,706,896 94,986,002.002 -61,423.392.541
GO
> H-l W t-3
a > >
tei !
Footno tes a t end of tab le .
CO
Digitized for FRASER http://fraser.stlouisfed.org/ Federal Reserve Bank of St. Louis

TABLE 2.—Receipts and outlays, fiscal years 1789-1970—Continued
Year
1945 1946 1947 1948 7 1949 7
1950 1951 1952 1953
Year i
1954 1955 1956 1957 1958 1959
1960 1961 1962 1963 1964
1965 1966 1967 1968 1969 1970
C u s t o m s
$354.77 435.47 494,07 421.72 384.48
422,65 624,00 550,69 613,41
5.642 5,072 8,260 3.028 4,796
0.329 8,052 6,379 9,582
Income taxes
Ind iv idua l
$32,392,146, 700 31,654.170.061 36,340,349,927 39,066, 646, 244 38,681,942,041 40,791.874,129
44,971,310, 266 46,153,000, 792 50,649, 593, 506 52, 987.580.595 54,590.354,384
63,660,682,653 61,297,651, 520 69,370,595,136 78,252,045,190 97.440,405.013
103, 661,585, 605
In te rna l
Income and profits taxes
$35,173,051,373 30,884,796,016 29.305, 568,454 31,170, 968,403 29,482,283,759
28,262,671,097 37,752, 553, 688 51,346, 525,736 54.362,967,793
Corpora t ion
$21.522.853.908 18,264.720,362 21,298,521, 621 21,530,653,013 20.533,315.590 18,091,609,456
22,179,414,267 21, 764.940.001 21. 295.711.399 22.336,133.758 24,300,863,236
26,131.333.625 30,834.242,696 34.917.825,260 29,896. 519, 677 38.337. 645.690 35,036. 982.990
revenue
Other
$8, 728,950,555 9,425, 537,282
10,073,840,241 10,682,516,849 10,825,001,116
11,185,936,012 13,353, 541,306 14, 288,368, 522 15,808,006,083
Excise taxes
$10,014,443,842 9,210,581,897
10,004.194,869 10, 637,543,788 10,814.267.626 10,759, 549,109
11.864.740.881 12,064,302,042 12,752,175,848 13,409, 737,348 13, 950.231,780
14.792,778,809 13,398,112,012 14.113.747.719 14,320,396.487 15, 542,046,719 15, 904, 263, 668
Receip ts
T o t a l receipts Other receipts b y major
sources 2
$3,493,523,901 $47,750,306,371 -3,492,326, 920 44,.238,135, 290 -4,634, 701,652 44, 508,188,607 -3,823, 599, 033 46,098,807,314 -2,081,735,850 42,773, 605, 520 -
1,439,370,414 41,310, 627..852 -1, 638, 568,845 53,368, 671,892 -1,813,778, 921 67,999,369, 558 -1,864, 741,185 72, 649,134, 647 -
E s t a t e and gift taxes
$945,049,092 936,267,446
1,171,237,192 1,377,998,889 1,410,925,018 1,352,982,426
1. 626,347. 638 1, 916.392,302 2,035.187,128 2,187,457,229 2,416,303.318
2,746,532,499 3,093,921,882 3,014,405,754 3,081,978, 790 3,530.064.861 3. 680, 076. 379
Refunds and transfers «
$3,275.002,708 -4,466,731.580 -4.722,007,571 -4,610,628,472 -5.077,956,071
-4,815,727,015 -5,801,058,408 -6.603,425.006 -7,824,090,621
Social insurance taxes a n d contr ibut ions
Cus toms dut ies E m p l o y m e n t Cont r ibu t ions taxes a n d for other
contr ibut ions ^ insurance and re t i rement 10
$562,020, 619 606,396, 634 704,897,516 754.461,446 799,504,808 948,412,215
1.123,037, 679 1,007,755,214 1.171.205,974 1.240.537,884 1,284.176,380
1.477, 648,821 1,811.170.211 1, 971,799,791 2.113.474.950 2,387.190,473 2,494, 294.171
$5,266, 575,249 6,031,045,395 7,124, 632,038 7,463,157,974 8, 699,152,717 8,904,630,798
11,337,418, 282 12, 775,130, 588 12, 976,540,446 14,885,842, 299 17,125,163,991
17, 550.191.742 20,889, 528.322 28,105,097,413 29,487,010,470 34,841.043,355 39, 519, 764. 951
$1, 984,346, 542 1,886,467,854 2, 263,981,844 2,594, 588, 920 2, 618, 584,155 2, 904,787,240
3,437,824, 557 3,762,792,880 4,216, 589, 270 5,061,090,240 5,056. 537.393
4,907,261, 587 4,911,369,694 5,532,756,875 6,403,864,807 5,688, 676,958 6,171, 434, 438
Receipts , less refunds and
transfers
$44,475,303, 665 39,771,403,710 39.786,181,036 41.488,178,842 37,695,549.449
36,494, 900,837 47, 567,613,484 61,390, 944,552 64,825,044,026
- Miscellaneous taxes a n d receipts
$449, 568, 926 355, 950,702 389, 223,885 540,306,673 776,161, 635 609,133.892
1,189,529,887 920,422,350 844, 270, 781
1,023,262,348 1,086,307, 634
1, 597,638,325 1,875,651.069 2,107,863,544 2,491,496, 357 2,916,385, 098 3,424.174, 505
In te r fund t ransact ions
(deduct) 8
$113.282,721 121, 532,724 109,014,012 113,476.853
32, 576, 510
72, 966,260 87. 546,409
104.383,636 154,459, 602
Refunds of receipts "
-$3,417,737,374 - 3 , 4 7 6 , 987, 625 - 3 , 750,030.132 - 3 , 975,532,487 - 4 , 598,010, 555 -5,113,762,669
-5,237,513,807 -6,976,009.231 -6,265,669,311 —6, 571,386,963 -7,148,085.619
-6,029,544,469 -7.255.579,949 -9.581,686.414
-11.375.364.608 -12,891.120,278 -16,139,325,917
Ne t receipts
$44.362,020,944 39.649,870,986 39,677,167,024 41,374,701,989 37,662.972,939
36,421.934,577 47,480,067,075 61,286,560, 916 64, 670. 584.424
N e t budge t receipts
$69,719.267, 504 65,468,612,716 74, 547,008,760 79,989,824,460 79,635,842.935 79,249.126.596
92,492,109, 550 94,388,726,938 99, 675, 605,041
106,560, 254,738 112,661,852,497
116,833,423,592 130,855,967,456 149, 552,405,078 153,671.422.120 187,792,336,889 193, 743. 250, 789
0
tei
0
0 tei
tei
Ui tei 0
>
0
tei
tei
tei > cl
Digitized for FRASER http://fraser.stlouisfed.org/ Federal Reserve Bank of St. Louis

Y e a r i
1945 1946. . . 1947 1948 7 1949 7 1950 19518 1952 1953
Y e a r i
1964 1955 1956 1967 1958 1969
1960 1961 1962 1963 1964
1965 1966 1967 1968 1969 1970
D e p a r t m e n t of t h e A r m y »
. . . $50,490,101,935
. . . 27,986,769,041 9.172,138,869 7.698,556.403 7.862,397,097 6,789,467,599 8.635,938.754
. . . 17,462,710.349
. . . 17.054.333.370
D e p a r t m e n t of t he N a v y 3
$30.047,152.136 15.164.412,379
5,597, 203,036 4,284,619.125 4,434,705.920 4.129.545,653 5,862,648,845
10,231,264,765 11,874,830.152
D e p a r t m e n t of t he Ahr Force«
$1,690,460,724 3, 520, 632,580 6,358,603,828
12,851,619,343 16,086.227, 952
D e p a r t m e n t D e p a r t m e n t D e p a r t m e n t of of Hea l th , E d u - -
of Agr icul ture Defense cation, a n d Welfare 12
. $2,613,484,207
. 4.275,010,967
. 4.760.671.305
. 4, 660.471,890
. 4.368,422,114
. 6,529,382,614
_ 4,842,598,671 " . 5,383.802.476 " . 6, 294,073.812 " . 7,332,799.230 . 7,468,177,889
. 6,795,400,161
. 5,613.411,042
. 5,841,161,394
. 7,306,960,660
. 8,330.318,006
. 8.306,663,325
$40,625,674,430 35,629,778,598 35.692,897.354 38.719,034,957 39,916.688.798 44.602.920,493
43.968.847,762 45.688.376.272 49.283,444,729 49.242.662.050 60,702,892,890
47,179,328.954 55.445,393,783 68.762.932.164 78,672.893.689 79.144.788,852 78,360,167, 659
$1,977,283, 991 1,989, 947,310 2,067,374,737 2.292.685.544 2,636,400,426 3,089.040,327
3,400, 074,752 3.680.977,437 4,210,376,106
20.248.873,628 21,696,149,316
22,732,260,917 27,959.129.367 34,607,693.058 40.576.498,177 46.599,029,486 52,337, 602, 274
Ou t l ays
In te res t on t h e pub l ic deb t
$3.616.686,048 4.721,957,683 4, 957,922,484 5,211.101,865 5.339,396,336 5,749,913,064 5,612,654,812 5.859,263,437 6.503, 580,030
Other
$14,262,279,670 12,574,435.216 19,305,128,987 15,874,431, 605 20,180,029,420 20,427,444, 299 17, 588,084, 620 19,012,727,036 23,756,285,980
D e p a r t m e n t of t he Treasu ry
In teres t on t h e p u b h c deb t
$6,382.485, 640 6,370,361,774 6,786, 698,863 7.244,193,486 7,606.774,062 7, 592,769,102
9,179. 588,857 8,967, 241, 616 9,119,759.808 9,895,303,949
10.665,858.127
11,346,454,680 12,013,862,667 13,391,068,052 14,573,008,397 16.588,236.606 19, 303,669, 614
Other 1213
$5,022,986,962 6.025,333,595 6.804.477.133 8,255,275, 789
11,262,262.998 13.934.236,415
13,572, 618,347 15,826,494,756 17, 518, 660,038
-150,424.943 -114.183,494
86.677.461 413.161, 535
-327 ,021 , 534 81, 521,582
335, 558, 631 205, 575,956
T o t a l ou t lays b y major purposes 2*
$98,416,219,790 60,447,574,319 39,032,393,376 33,068,708, 998 39, 506,989,497 39, 617,003,195 44,057,830,859 65,407,584, 930 74, 274, 257,484
Other
$15, 504,712, 613 15.437,425.728 15,801,617.195 17.525.373, 669 18.734,205,883 18,593, 799,491
19,555.888.511 20.706.655, 578 22,899,608,057 27.385,929, 284 31,052,420.542
33,398, 637.223 36,671,466, 641 39.913,935.072 42.120.742,184 38,674,972,072 44, 454, 083, 531
In te r fund t ransactions (deduct) 8
$113,282,721 121, 532,724 109,014,012 113,476,853 32, 576, 510 72,966, 260 87, 546,409
104,383, 636 154,459, 602
U n d i s t r i b u t e d i n t r a b u d g e t a r y
t ransact ions
-$1,236,883,402 -1,218,673.794 -1,453,307,258 -1 ,856,452,831 -1.939,661.669 -2 ,237,689,445
- 2 , 2 9 6 , 263,275 -2,448,969,016 - 2 , 613,328,944 - 2 , 643,898, 620 -2 ,876,607,445
-3 ,109,004,109 -3,364,488.616 - 3 , 936, 601.566 -4 ,498 ,969 , 647 -5,116,860,970 -6,379,876,627
Total ou t lays 2 4
$98,302, 937,069 60,326,041, 595 38,923,379,364 32.956,232.145 39,474,412. 987 39, 544,036.935 43,970,284.450 65,303,201.294 74,119, 797,882
N e t out lays
$70. 889.744.341 68,509,184,178 70,460.329.329 76,740, 582,504 82, 575,092,611 92,104,458,997
92,223.353,625 97,794, 579.116
106,812.593.606 111,311,144.478 118,683,707,824
118,429,745,187 134.661.926.519 158.254.256,640 178.832,655,042 184,556,042.683 196, 587. 785, 632
Surp lus , or deficit ( - ) «
-$53,940.916.126 -20.676.170,609
753.787.660 8,419,469,844
-1.811.440,048 -3.122,102,357
3,509,782,624 -4,016,640,378 -9.449.213,457
Surp lus , or deficit ( - )
-$1.170,476,837 -3,040,571,462
4,086,679,431 3,249,241,956
-2,939,249,676 -12,855,332,401
•• 268.755,925 -3,406,852.178 -7,136.988.565 -4.750,889.740 -6,921,855,327
-1,696,321,595 -3,795.959.063 -8,701,851,661
-25,161,232.923 3,236,294,206
- 2 , 844, 534,843
1 1 — <
> tei
Footnotes on following page.
CJl
Digitized for FRASER http://fraser.stlouisfed.org/ Federal Reserve Bank of St. Louis

16 19 70 REPORT OF THE SECRETARY OF THE TREASURY
Footnotes to table 2
I From 1789 to 1842 the fiscal year ended Dec. 31; from 1844 to date, on June 30. Figures for 1843 are for a half year, Jan. 1 to June 30.
3 Effective Jan. 3, 1949, amounts refunded by the Government, principally for overpayment of taxes, are reported as deductions from total receipts rather than as outlays. Also, eflective July 1,1948, payments to the Treasury, prmcipally by •whoUy owned Govenmient corporations for retirement of capital stock and for disposition of earnings, are excluded in reporting both budget receipts and outlays. Neither change affects the budget surplus or deficit. Figures beginning with fiscal 1913 have been adjusted accordingly for comparability. For adjustments for refunds of receipts for fiscal years 1931-53 see 1967 annual report, pp. 448-449. For capital transfers for fiscal 1931 through 1948, see 1958 annual report, p . 396, footnote 3.
3 Includes all mihtary and civil outlays of the Departments of the Army (including the Panama Canal), the Navy, and beginning with fiscal 1949 the Air Force, except civil outlays of War and Navy at Washington through fiscal 1915. Department of the Army outlays include those of the Department of the Air Force (established Sept. 18,1947) from funds made available before fiscal 1949. Begirming with fiscal 1952 outlays of the Department of Defense not classified among its three departments are included under "Other." Military assistance outlays for foreign aid programs are included under "Other" except as noted. See footnote 14.
* The practice of including statutory debt retirements in budget outlays was discontinued effective with fiscal 1948. Such outlays are not included in this table, nor does the "Surplus or deficit" take into account such outlays. Table 37 shows details oi statutory debt retirements.
« Refunds of receipts and transfers to trust funds. For content for fiscal years 1931-53 see 1967 annualreport, pp. 448-449.
» For content see 1961 annual report, pp. 450-467. ' Sec. 114(f) of the Economic Cooperation Act of 1948, approved Apr. 3,1948, required that $3,000,000,000
be transferred to the "Foreign Economic Cooperation Trust Fund" and "considered as expended during the fiscal year 1948, for the purpose of reporting goverrmiental expenditures." The effect of this was to charge the budget in fiscal 1948 for outlays made in fiscal 1949, with consequent effect on the budget surplus or deficit of those years. This bookkeeping transaction had no effect on the actual timing of either receipts or outlays. In order to simplify comparison of figures between years, the transactions shown in this talDle do not take into account the transfer of $3,000,000,000 in fiscal 1948 to the Foreign Economic Cooperation trust fund; outlays of $3,000,000,000 during fiscal 1949 from the Foreign Economic Cooperation trust fund are treated as budget outlays in this table. If effect is given to sec. 114(f) of the Economic Cooperation Act of 1948, the budget results for the fiscal years 1948 and 1949 would be as follows:
Fiscal year 1948 Fiscal year 1949 Budgetreceipts $41,374,701,989 $37,662,972,939 Budget outlays 35,955,232,146 36,474,412,987
Budget surplus 5,419.469,844 1,188,559,952
8 Beginning with fiscal 1951, investments of wholly owned Government corporations in public debt securities are excluded from budget outlays. See table 6.
9 Includes Federal old-age and survivor's. Federal disability, Federal hospital, and railroad rethrement tax act receipts.
10 Includes unemployment insurance. Federal supplementary medical, civil service returement, and other employees' retirement receipts.
II For content see table 3. 12 Social security trust fund outlays are reflected under the Department of the Treasury through fiscal
year 1962, and under the Department of Health, Education, and Welfare, thereafter. 13 Includes interest pajrments by Government corporations and other business-type activities on securi
ties issued to the Treasury. i« Includes military assistance.
Digitized for FRASER http://fraser.stlouisfed.org/ Federal Reserve Bank of St. Louis
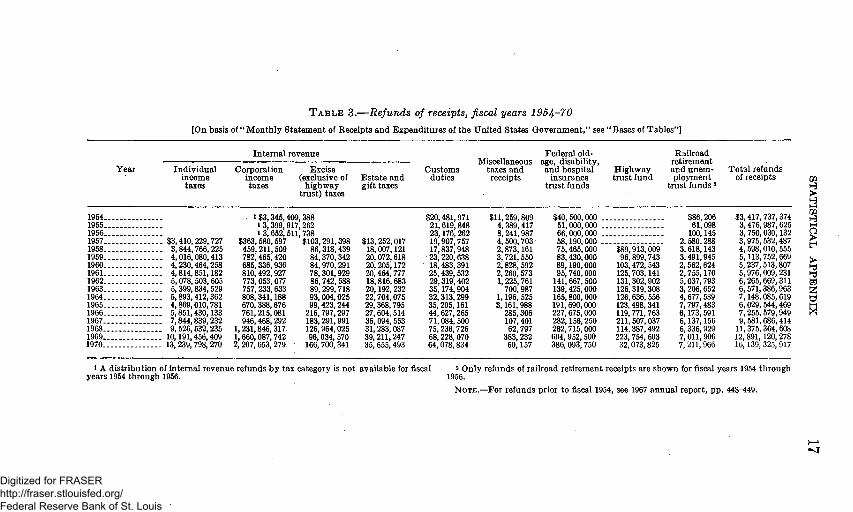
TABLE 3.—Refunds of receipts, fiscal years 1954-70 [On basis of "Monthly Statement of Receipts and Expenditures of the United States Government," see "Bases of Tables"]
Internal revenue
Year Individual income taxes
Corporation income taxes
Excise (exclusive of
highway trust) taxes
Estate and gift taxes
Customs duties
Miscellaneous taxes and receipts
Federal old-age, disability, and hospital
insurance trust funds
Highway trust fund
Railroad retirement and unemployment
trust funds 2
Total refunds of receipts
t—i
O
tei
o
1964 1955 1966 1967 $3,410,229,727 1958 3,844,766,226 1959 4,016.080.413 1960. 4.230,464,258 1961 4,814,851,182 1962 5,078,503.605 1963 6.399,834.529 1964 5,893.412,362 1965 4,869,010.781 1966. 5,851,430,133 1967 7,844,839,232 1968 9.626.532.236 1969 10,191,466,409 1970 13,239,798,270
1 $3,345,409,388 $20,481,971 $11,259,809 $40,500,000 $86,206 $3,417,737,374 13,399,917,262 21,619,848 4,389,417 51,000,000 61,098 3,476,987,625 13,652,611,738 23.176,262 8,241,987 66,000,000 100,145 3,750,030,132
$363,680,697 $103,291,398 $13,252,017 19,907,757 4,500.703 58.190,000 2,580,288 3,975,532,487 459,211,509 86,318.439 18,007,121 17,837.948 2.873,161 76,465,000 $89,913,009 3,618,143 4,598,010,555 782.465.420 84.370.342 20,072.618 23.220.638 3,721,650 83,430,000 96,899,743 3,491,945 6,113,752,669 685,336,936 84,970,291 20,205,172 18,483,391 2,828,592 89,190,000 103,472,543 2.562.624 5,237,513.807 810,492.927 78.301,929 20,464,777 25,439,532 2,260,573 95.740,000 125,703,141 2.755,170 5,976,009,231 773.053,077 86,742,588 18,816,683 29,319,402 1,226,761 141,667,600 131,302,902 5,037,793 6,265.669,311 757,233.633 89,299.718 20,192,232 35,174,904 700,987 139,425,000 126,319,308 3,206,652 6,571,386,963 808,341,188 93,004,025 22.704.075 32.313,299 1,196,525 165,800,000 126,636,556 4,677,589 7.148,086,619 670,388,676 99,423,244 29,368,795 35,205,161 3,161,988 191.690,000 123,498,341 7,797,483 6,029,544,469 761,216,081 216.797,297 27,604,514 44,627,265 285,306 227,676,000 119,771,763 6,173,591 7,255,579,949 946,468,292 183,291,991 36,094,553 71,084,500 107,401 282,156,250 211,507,037 6,137,156 9,681,686,414
1.231,846,317. 126,964,025 31,283,087 75,236,726 62,797 262,715,000 114,387,492 6,336,929 11,375,364,608 1,660,087,742 96.034,670 39,211,247 68,228,070 383,232 604,952,500 223,764,603 7,011,906 12.891,120,278 2,207,653,279: 166,700,341 35,655,493 64,078,834 60,157 386,093,750 32,073,825 7,211,966 16,139,325,917
1 A distribution of intemal revenue refunds by tax category is not available for fiscal 2 Only refunds of raihoad retirement receipts are shown for fiscal years 1954 through years 1954 through 1966. 1966.
NOTE.—For refunds prior to fiscal 1954, see 1967 annual report, pp. 448-449.
Digitized for FRASER http://fraser.stlouisfed.org/ Federal Reserve Bank of St. Louis

18 1970 REPORT OF THE SECRETARY OF THE TREASURY
TABLE 4.—Budget receipts, expenditures, and lending, fiscal years 1969 and 1970
In thousands of dollars. On basis of "Monthly Statement of Receipts and Expenditures of the United States Government," see "Bases of Tables"]
The expenditure account 1969 1970
N E T RECEIPTS Individual income taxes 87,248,949 90,411,787
Corporation income taxes 36,677,558 32.829,330
Social insurance taxes and contributions: Employment taxes and contributions:
Federal old-age and survivors insurance trust fund: Federal Insurance Contributions Act taxes 21,853,270 26,072,419 Self-Employment Contributions Act taxes. 1,370,350 1,664,817 Depositsby States 2,260,117 2,758,436
Total Federal old-age and survivors insurance trustfund... 25,483,737 29,395,673
Federal disability insurance trust fund: Federal Insurance Contributions Act taxes 2,945,307 3,483,796 Self-Employment Contributions Act taxes 186,730 208,146 Deposits by States 337,398 371,416
Total Federal disability insurance trust fund 3,469,434 4,063,358
Federal hospital insurance trust fund: Federal Insurance Contributions Act taxes 3,760,863 4,079,695 Self-Employment Contributions Act taxes 157,471 169,230 Receipts from railroad retirement accounts 53,776 61,307 Deposits by States.... 425,902 444.864
Total Federal hospital insurance trust fund 4,398,012 4,755,096
Railroad retirement accounts: Raihoad Retirement Tax Act taxes 884,748 918,832
Total employment taxes and contributions 34,235,931 39,132.959
Unemployment insurance: Unemployment trust fund:
State taxes depositedin Treasury. 2,560,913 2,563,745 Federal Unemployment Tax Act taxes 633,178 769,639 Railroad Unemployment Insurance Act contributions 134,400 130,898
Total unemployment trust fund 3,328,491 3,464.281
Contributions for other insurance and retirement: Federal supplementary medical insurance trust fund:
Premiums deducted from benefit payments 750,755 763.516 Premiums collected by Social Security Administration 76,214 76,276 Premiums deposited by States 75.852 97.209
Total Federal supplementary medical insurance trust fund 902,821 936.000
Federal employees retirement contributions: Civil service retirement and disabihty fund 1,417,974 1,725,518 Foreign service retirement and disability fund 5,669 7,222 Other 2,579 2.625
Total Federal employees retirement contributions 1,426.221 1.735,364
Other retirement contributions:
Civil service retirement and disabihty fund 24,291 29.289
Total contributions for other insurance and retirement 2,353,333 2,700,663
Total social insurance taxes and contributions 39,917.756 45,297,894
Digitized for FRASER http://fraser.stlouisfed.org/ Federal Reserve Bank of St. Louis
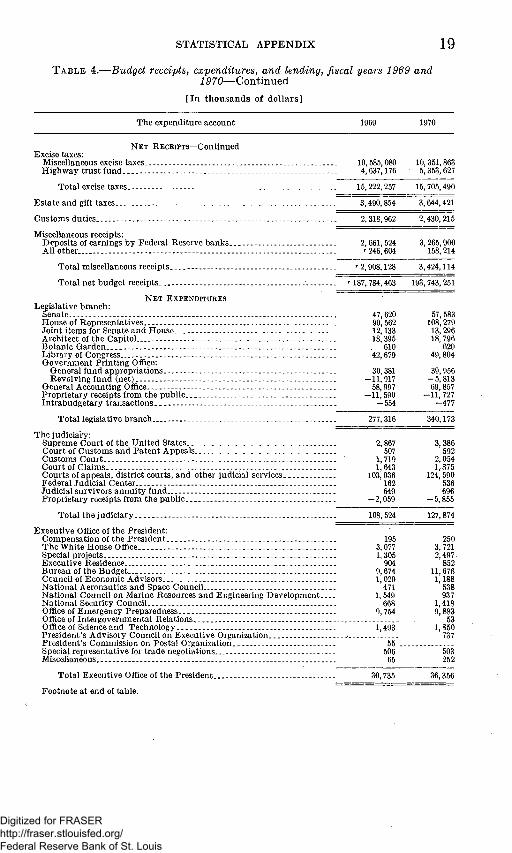
STATISTICAL APPENDIX 19 T A B L E 4.—Budget receipts, expenditures, and lending, fiscal years 1969 and
i5'70—Continued
[In thousands of dollars]
The expenditure account 1969
N E T RECEIPTS—Continued Excise taxes:
Miscellaneous excise taxes 10,585,080 10,351,863 Highway trust fund - 4,637,176 5,353,627
Total excise taxes 15,222,257 15,705,490
Estate and gift taxes - 3,490,854 3,644,421
Customs duties..-. . - . 2,318,962 2,430.215
Miscellaneous receipts: Deposits of earnings by Federal Reserve banks 2,661,524 3,265,900
Allother '•246,604 158,214
Total miscellaneous receipts '•2,908,128 3,424,114
Total net budget receipts '•187,784,463 193,743,251 N E T EXPENDITURES
Legislative branch: Senate 47,620 57,583 House of Representatives 90,562 108,279 Joint itemsfor Senate and House.. 12,133 13,296 Architect ofthe Capitol .- 18,395 18,796 Botanic Garden.. . 610 620 Library of Congress 42,679 49,804 Government Printing Office:
General fund appropriations 30,381 39,956 Revolving fund (net) -11,917 -5,813
General Accounting 0ffice 58,997 69,857 Proprietary receipts from the public - —11,590 —11,727 Intrabudgetary transactions. _ — 554 —477
Tota l legislative branch 277,316 340,173
Tlie judiciary: Supreme Cour t of the Uni ted States 2,867 3,386 Cour t of Cus toms a n d P a t e n t Appeals . 507 592 Customs Cour t 1,71,9 2,054 Cour t of Claims 1,643 1,875 Courts of appeals, district courts, and other judicial services 103,036 124,590 Federal Judicial Center 162 536 Judicial survivors annuity fund 649 696 Proprietary receipts from the public —2,059 —5,855
Total the judiciary 108,524 127,874
Executive Office of the President: Compensation of the President . 195 250 The White House Office 3,077 3,721 Special projects 1,305 2,497 Executive Residence... 904 852 Bureau of the Budget 9,674 11,676 Council of Economic Advisors 1,020 1,188 National A eronautics and Space Council 471 538 National Council on Marine Resources and Engineering Development 1,549 937 National Security Council 668 1,418 Office of Emergency Preparedness 9,754 9,883 Office of Intergovernmental Relations 53 Officeof Science and Technology 1,493 1,850 President's Advisory Councilon Executive Organization. ..• 737 President's Commission on Postal Organization 55 Special representative for trade negotiations 506 503 Miscellaneous... 65 252
Total Executive Officeof the President 30,735 36,356
Footnote at end of table.
Digitized for FRASER http://fraser.stlouisfed.org/ Federal Reserve Bank of St. Louis

20 19 70 REPORT OF THE SECRETARY OF THE TREASURY
TABLE 4.—Budget receipts, expenditures, and lending, fiscal years 1969 and Jf^rO—Continued
[In thousands of dollars]
The expenditure account 1969 1970
N E T EXPENDITURES-Continued
Funds appropriated to the President: Appalachian regional development programs:
Public enterprise funds. 379 622 Other... 163,643 193.142
Disaster relief... 18,968 144.909 Emergency fund for the President 152 851 Expansion of defense production 168,226 —13,959 Expenses of management improvement 575 119 International financial institutions:
Asian Development Bank 10,000 10,000 Investment in Inter-American Development Bank 74,300 159,293 Subscription to the International Development Association . 36,300 54,599
Office of Economic Opportunity: Economic opportunity program 1,812,073 1,801,705 Public enterprise funds 3,294 3,850
Peace Corps. . . 104,701 90.016 Philippine education programs 6.531 951 Pubhc works acceleration : 2.048 831 Special foreign currency activities • (*) Southeast hurricane disaster 654 377
Foreign assistance: Military assistance:
Defense Department 613,809 548,964 All other agencies —3,180 —604 Foreign military credit sales 17,500 92,516 Foreign military sales fund 57,632 -31,975 Mihtary assistance advances . . . : . 1,061,857 950.275 Proprietary receipts from the public:
Military assistance advances -958,538 —812,694 Other -346 -15.686
Total mihtary assistance 788,733 730,796
Economic assistance: Grants and other programs:
Technical cooperation and development grants 196.276 176.815 Alliance for Progress... »• 73,257 75,936 Social progress fund, Inter-American Development Bank 71,930 56,510 Supporting assistance 473,768 466,123 International organizations and programs 181,461 99,724 Contingencies 28,195 32,976 Other ••75,214 28,546
Public enterprise funds: Alliance for Progress, development loans 300,258 285,228 .Development loan funds.. 539,825 476,963 Foreign investment guarantee fund —9,411 —16,343
Proprietary receipts from the pubhc »• -150,036 -73,800
Total economic assistance '•1,780,738 1,607.677
Overseas Private Investment Corporation —782
Total foreign assistance 2,569,471 2.337,691
Proprietary receipts from the pubhc —372 —345
Total funds appropriated to the President. _ '•4,970,942 4,784,652
Agriculture Department: • ~~ Agricultural Research Service _ 251,996 267,265 Cooperative State Research Service. 59,811 61,870 Extension Service 97,215 124,526 Farmer Cooperative Service 1,412 1,667 Soil Conservation Service:
Conservation operations 125,777 138,939 Flood prevention, watershed protection, and other 101,113 115,365 Great Plains conservation program . 15,952 16,414
Economic Research Service 13,053 15,788 Statistical Reporting Service 14,016 17^253 "
Consumer and Marketing Service: Consumer protective, marketing, and regulatory programs 112,343 136,880 Payments to States and possessions }. 1.600 1,600 Removal of surplus agricultural commodities. 414,901 449,540 Milk market orders assessment fund.. —769 —943 Other.. 33,182 36,970
Total Consumer and Marketing Service r 561,258 624,046
Footnote at end of table. ""
Digitized for FRASER http://fraser.stlouisfed.org/ Federal Reserve Bank of St. Louis

STATISTICAL APPENDIX 21
TABLE 4.—Budget receipts, expenditures, and lending, fiscal years 1969 and i ^70—Continued
[In thousands of dollars]
The expenditure account 1969 1970
N E T EXPENDITURES—Continued
Agriculture Department—Continued Food and Nutrition Service:
Special milk program. Child nutrition programs Food stamp program
Total Food and Nutrition Service
Foreign Agricultural Seryice Foreign Economic Developm|ent Service Commodity Exchange Authority
Agricultural Stabilization and Conservation Service: Expenses Sugar act program ^ ' Agricultural conservation program Cropland conversion program Cropland adjustment program Emergency conservatioii measures. Conservation reserve program (soil bank) Indemnity payments to dairy farmers
Total Agricultural Stabilization and Conservation Service
Commodity Credit Corporation: Pubhc enterprise funds:
Price support and related programs Special activities ^
Fo'reign assistance and special export programs
Total Commodity Credit Corporation and foreign assistance and special export program
Federal Crop Insurance Corporation: Administrative expenses.. Federal Crop Insurance Corporation fund
Rural Electrification Administration..
Farmers Home Administration: Community development programs Salaries and expenses.. — Public enterprise funds:
Direct loan account Rural housing insm'ance fund Emergency credit revolving fund Agricultural credit insurance fund
Other . . .
Total Farmers Home Administration.
Rural Community Development Service Office ofthe Inspector General Packers and Stockyards Administration. . Officeof General Counsel . . 1 .
• Office of Information 1 National Agricultm-al Library. . . ^ Office of Management Services General administration:
Intragovjemmental funds (net) Salaries iand expenses
Forest Service: Intragovernmental funds (net) Other :
Proprietary receipts from the public .
Total Agriculture Department.
(iJommerce Department: General administration Business economics and statistics:
Office oi Business Economics... . Bureau of the Census -
Economic development assistance: Economic Development Administration:
Public enterprise funds Other - . .-Regional action planning commissions
Footnote at end of table.
101,925 237,007 247,766
299,131 576,810
586,698
23, 687 -209 .. 1, 732
147,175 87.139 199, 406 2, 952 79,529 7,144
106, 733 137
630, 216
r 4,032,376 r 212, 295 >• 830,000
5,074, 671
11, 768 7.143
84. 773
32, 213 60.423
-749 ••-50,764
4, 804 -7.812 -546
37.569
426 12,957 2,744 4,788 2,056 4.429 2,939
551 4,509
797 472,293
-515,659
7, 693,381
5,679
2, 697 48,162
-9,492 r 172.162
5,168
959, 740
24, 862
""2,"i67
152,604 92,976 182,618 2,276 77,372 8,304 38,620
126
654,895
3, 719, 800 85,204 921,250
4,726,254
11,932 9,300 20,835
32,307 70, 534
-12,588 33, 754 9,694 31,032 11,880
176,612
391 14,769 3,346 5,590 2,455 3,903 3,252
-63 5,206
2,092 553,497
-489,707
7.974.463
5,899
3,625 140.092
104 184,424 7,142
Digitized for FRASER http://fraser.stlouisfed.org/ Federal Reserve Bank of St. Louis
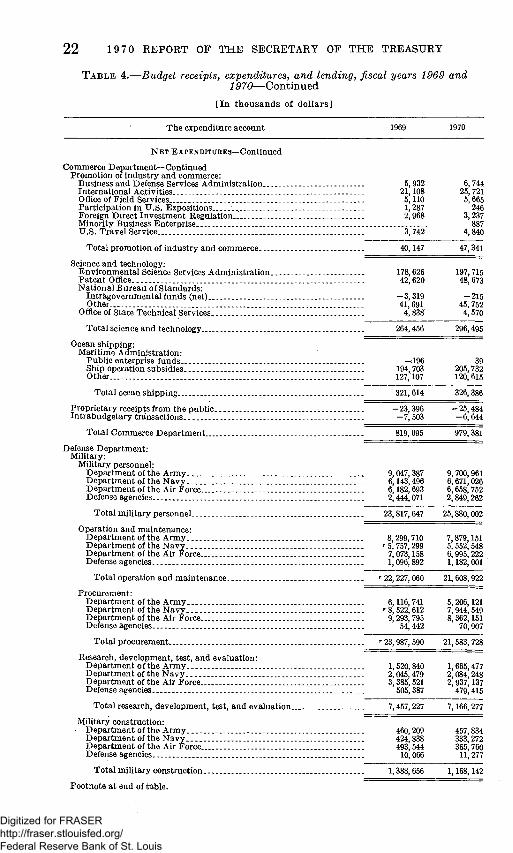
22 1970 REPORT OF THE SECRETARY OF THE TREASURY
TABLE 4.—Budget receipts, expenditures, and lending, fiscal years 1969 and ./570—Continued
[ I n t h o u s a n d s of d o l l a r s ]
T h e expendi ture account 1969 1970
321, 614
-23 , 396 -7,503
819, 695
326,386
-25,484 -6,644
979,381
N E T E X P E N D I T U R E S — C o n t i n u e d
Commerce Depa r tmen t—Cont inued P romot ion of i ndus t ry and commerce:
Business and Defense Services Admin is t ra t ion 5,932 In te rna t iona l Act ivi t ies 21,108 Officeof Field Services 5,110 Par t i c ipa t ion i n U .S . Exposit ions ... 1,287 Foreign Direct I n v e s t m e n t Regulat ion 2,968 Minor i ty Business Ente rpr i se U . S . T rave l Service 3,742
T o t a l p romot ion of i ndus t ry and commerce 40.147
Science and technology: E n v i r o n m e n t a l Science Services Admin i s t r a t ion 178.626 P a t e n t Office 42,620 N a t i o n a l B u r e a u of S t a n d a r d s :
I n t r a g o v e r n m e n t a l f u n d s (ne t ) . —3,319 Other . 41,691
Office of Sta te Technica l Services 4,838
To ta l science and technology. 264,456
Ocean shipping: Mar i t ime Adin in is t ra t ion :
Pub l i c enterprise funds -^196 Ship operat ion subsidies 194,703
O t h e r . . . . 127,107
T o t a l ocean sh ipp ing
Propr ie t a ry receipts from t h e publ ic I n t r a b u d g e t a r y tra'nsactions
T o t a l Commerce D e p a r t m e n t
Defense D e p a r t m e n t : Mili tary:
Mil i tary personnel : D e p a r t m e n t o f t he A r m y 9,047,387 D e p a r t m e n t of the N a v y . . 6.143,496 D e p a r t m e n t o f t h e Air F o r c e . . - . 6,182,693 Defense agencies 2,444.071
To ta l m i h t a r y personnel 23.817,647
Operat ion and ma in tenance : D e p a r t m e n t of the A r m y 8,299,710 D e p a r t m e n t of the N a v y ••5,757,299 D e p a r t m e n t of the Air Force 7,073,158 Defense agencies 1,096,892
To ta l operat ion and ma in t enance ••22,227.060
Procurement : D e p a r t m e n t of the A r m y 6,116,741 D e p a r t m e n t o f t h e N a v y . ••8,622,612 D e p a r t m e n t of the Air Force 9,293,795 Defense agencies. 54,442
To ta l p rocurement '•23,987,590
Research, development , test , and evaluat ion: D e p a r t m e n t o f t h e A r m y : 1,520,840 D e p a r t m e n t o f t h e N a v y 2,045,479 D e p a r t m e n t of t h e Air Force 3,385,521 Defense agencies 505.387
T o t a l research, development , test , and evaluat ion 7.457,227
Mil i tary construct ion: D e p a r t m e n t o f t h e A r m y . . 460,209 D e p a r t m e n t o f t he N a v y 424,838 D e p a r t m e n t of the Air Force 493,644 Defense agencies 10,066
T o t a l m i h t a r y construct ion 1.388.666
Footno te a t end of t ab le .
6,744 25, 721
5,665 246
3,237 887
4.840
47,341
197,715 48,673
- 2 1 5 45, 752
4,570
296,495
39 205.732 120,615
9,700.961 6.671,026 6,658, 752 2.849,262
25.880,002
7.879,151 5, 552,548 6,995,222 1.182,001
21,608, 922
6, 206,121 7,944, 549 8,362,151
70,907
21.583, 728
1,665,477 2, 084, 248 2,937,137
479,415
7,166.277
457,834 333,272 365, 760
11, 277
1,168,142
Digitized for FRASER http://fraser.stlouisfed.org/ Federal Reserve Bank of St. Louis

STATISTICAL APPENDIX 23
TABLE 4.—Budget receipts, expenditures, and lending, fiscal years 1969 and i57()—Continued
[In thousands of dollars]
The expenditure account 1969 1970
14, 750 557,216
571,966
86,887 1,289
4,412 609, 780
614,192
80, 084 884
-1,532,999
2, 853 7, 621
••-136,064 -8,037
'77,871,694
—806,403
-4,647 6,934
-140,974 -6, 806
77,150,334
N E T EXPENDITURES-Continued
Defense Department—Continued Military—Continued
Family housing: Homeowners assistance fund Other
Total family housmg
Civil Defense Special foreign currency program ,
Revolvhig and management funds: Public enterprise funds:
Department of the Army .._ —20 Department of the Navy. 948 Department of the Air Force —37
Intragovernment funds (net): Department of the Army _ —347,879 Department of the Navy. -348,931 Depai'tmentof the Air Force _ —507,853 Defense agencies. -329,227
Total revolvhig and management funds
Trust revolving funds Other Proprietary receipts from the public Intrabudgetary transactions _
Total military
Civil: Department of the Army:
Corps of Engineers: Water resources development. 1,250,238 Intragovernmentalfunds (net) —5,791 Proprietary receipts from the public —27,013
Other - 36,344 Navy, wildlife conservation, etc 8 Air Force, wildhfe conservation, etc 44 Soldiers' Home:
U.S. Soldiers'Home revolvhig fund 7 Other 10,297
The Panama Canal: Canal Zone Government . 43, 386 Panama Canal Company —7,770
Proprietary receipts from the public —17,559 Intrabudgetary transactions —14,589
Total civil 1,267,604
Total Defense Department •• 79,139,298
Health, Education, and Welfare Department: Consumer Protection and Environmental Health Service:
Public enterprise funds ._ —233 Food and drug control.. .- 61,173 Air pollution and other ••56,922 Environmental control 36,193 Other 19,883
Total Consumer Protection and Envhonmental Health Service.. 173,939
Health Services and Mental Health Administration: Public enterprise funds —5 Mental health . ._. 285,481 Health planning and regional programs 249,986 Maternal and child welfare 250,467 Hospital construction _. 264.168 Du-ect care programs 173,749 Other.. . . 118,094
Total Health Services and Mental Health Administration ' 1,341,940
Footnote at end of table.
-16 -268
376
-113,292 -44,886 -422,262 -226,056
1,189,076 -4,944
-20.189 36,479
34 68
- 4 10,022
43.768 -6,100
-19,187 -18,270
1,210,740
78, 361,074
-628 68,623 78,478 53,036 12.066
211,675
342,247 321, 721 272,826 272,791 199.863 95,844
1, 505,289
Digitized for FRASER http://fraser.stlouisfed.org/ Federal Reserve Bank of St. Louis

24 19 70 REPORT OF THE SECRETARY OF THE TREASURY
TABLE 4.—Budget receipts, expenditures, and lending, fiscal years 1969 and i5>70—Continued
[In thousands of dollars]
The expenditure account 1969 1970
N E T EXPENDITURES-Continued
Health, Education, and Welfare Department—Continued National Institutes of Health:
Public enterprise funds . 19,124 Institute research and training activities 948,954 Health manpower and dental health 120,816 Construction grants.. 133,432 Other 101.947
Total National Institutes of Health 1.324,273
Office of Education: Public enterprise funds:
Student loan insurance fund-. —799 Higher education facilities loan fund 3,042
Assistance for vocational education 260.052 School assistance in federaUy aflected areas 397, 581 Elementary and secondary educational activities 1,433,070 Higher education. . 918,217 Defense educational activities 19,725 Other 348,899
Total Office of Education 3,379,786
Social and Rehabilitation Service: Grantsto States for public assistance. 6,280,335 Grants for rehabilitation services and facilities 350.910 Work incentives 32,563 Other - - '•175.560
Total Social and Rehabilitation Service... •• 6,839,368
Social Security Administration: Operating fund. Bureau of Federal Credit Unions 246 Payment to trust funds for health insurance for the aged 1,733,255 Payment for military service credits. 210,000 Payment for special benefits for the aged.. 226.545
Federal old-age and survivors insurance trust fund: Administrative expenses and construction 465,087 Benefit payments 23,732,119 Vocational rehabilitation services 1,806 Payment to Raihroad Rethement Board 491,482
Total Federal old-age and survivors Insurance trust fund. . . . 24,690,495
Federal disability insurance trust fund: Administrative expenses and construction. 133,514 Benefit payments 2,443,437 Vocational rehabilitation services 14.891 Pa3mient to Railroad Retirement Board.. 21,328
Total Federal disability insurance trust fund
Federal hospital insurance trust fund: Administrative expenses and construction Benefit payments.. . .
Total Federal hospital insurance trust fund.
Federal supplementary medical insurance trust fund: Administrative expenses and construction Benefit payments
Total Federal supplementary medical insurance trust fund
Other .-
Total Social Security Administration
Footnote at end of table.
12.256 971,259 173,375 139.075 132.170
1,428.135
-852 20,164
285,686 656,372
1,461,723 1.021.430
4,603 559, 801
4,008,928
7,444,851 428,337 86,667
218,370
8,178,225
-265 1,545.413
105.000 364,161
474. 006 26,266,282
1,239 578. 818
27, 320,345
149, 030 2,777,988
16.487 10,439
2.613.170
104,196 4,653,976
4,758.172
194,687 1,644,842
1,839. 630
1
36,070,413
2,953,943
148,669 4,804 242
4,952,911
217,009 1,979 287
2,196,296
10,384
39.448.180
Digitized for FRASER http://fraser.stlouisfed.org/ Federal Reserve Bank of St. Louis
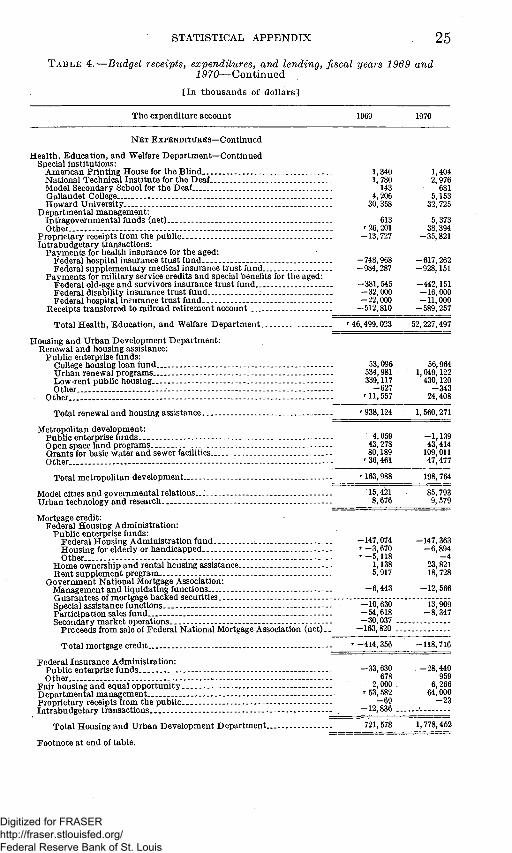
STATISTICAL APPENDIX 25
T A B L E 4.—Budget receipts, expenditures, and lending, fiscal years 1969 and i ^70—Continued
[In thousands of dollars]
The expenditure account 1969
N E T EXPENDITURES-Continued
Health, Education, and Welfare Department—Continued Special institutions:
American Printing House for the Bhnd National Technical Institute for the D eaf Model Secondary School for the Deaf GaUaudet College... Howard University
Departmental management: Intragovernmentalfunds (net) Other
Proprietaiy receipts from the public. . . Intrabudgetary transactions:
Payments for health insurance for the aged: Federal hospital insurance trust fund Federal supplementary medical insurance trust fund...
Payments for mihtary service credits and special benefits for the aged: Federal old-age and survivors insurance trust fund Federal disability insurance trust fund : Federal hospital insurance trust fund _
Receipts transferred to railroad retirement account..
Total Health, Education, and Welfare Departnient.
Housing and Urban Development Department: Renewal and housing assistance:
Pubhc enterprise funds: College housing loan fund Urban renewal programs Low-rent pubhc housing Other
Other -.
Total renewal and housing assistance.
Metropohtan development: Pubhc enterprise funds — Open space land programs Grants for basic water and sewer facilities.. Other
Total metropohtan development..
Model cities and governmental relations.. Urban technology and research
Mortgage credit: Federal Housing Administration:
Public enterprise funds: Federal Housing Administration fund .-. Housing for elderly or handicapped Other
Home ownership and rental housing assistance Rent supplement program .-
Government National Mortgage Association: Management and liquidating functions Guarantees of mortgage backed securities Special assistance functions. -Participation sales fund Secondary niarket operations
Proceeds from sale of Federal National Mortgage Association (net).
1,340 1,780 143
4,206 30,358
613 r 26,201 -13,727
-748,968 -984.287
-381, 545 -32,000 -22,000 -512,810
1,404 2,976 681
5,153 32,725
5,373 38,394
-35,821
-617,262 -928,161
-442,151 -16,000 -11,000 -589,257
M6,499,023 52,227,497
53,096 534,981 339,117
-627 r 11,557
' 938,124
4,059 43.278 80.189
r 36,461
•• 163,988
15,421 8.676
-147,074 •• -3,670 ••-5,118
1,138 5,917
-6,443
-10,630 -54,618 -30,037 .
-163,820 .
Total mortgage credit.. -414,356
Federal Insurance Administration: Public enterprise funds Other
Fair housing and equal opportunity. D epartmental management Proprietary receipts from the public. Intrabudgetary transactions
-33,630 678
2,000 . r 53.582
-69 -12,836 .
Total Housing and Urban Development Department..
Footnote at end of table.
721.578
56,964 1,049.122
430,120 -343
24,408
1,560,271
-1,139 43,414
109,011 47,477
198.764
85.793 9.579
-147,363 -6.894
- 4 23,821 18,728
-12,566
13,909 -8.347
-118,716
-28,440 959
6,266 64,000
- 2 3
1,778,452
Digitized for FRASER http://fraser.stlouisfed.org/ Federal Reserve Bank of St. Louis

26 19 70 REPORT OF TI-IE SECRETARJ OF THE TREASURY
T A B L E 4.—Budget receipts, expenditures, and lending, fiscal years 1969 and iP70—Continued
[ In thousands of dollars]
The expenditure account 1969 1970
N E T EXPENDITURES-Continued Interior Department:
Public land management: Bureau of Land Management 167,554 197,122 Bureau of Indian Affairs:
Public enterprise funds. _ Indian tribal funds Other
Bureau of Outdoor Recreation 0 ffice of Territories
Total public land management
Mineral resources: Geological Survey Bureau of Mines:
Public enterprise funds Other -.
Office of Coal Research Officeof OU and Gas
Total mineral resources
Fish and wildlife, parks, and marine resources: Bureau of Commercial Fisheries:
Public enterprise funds Other
Bureau of Sport Fisheries and WUdlife National Park Service
Total fish and wildlife, parks, and marine resources
Water and power development: Bm'eau of Reclamation:
Public enterprise funds: Upper Colorado River Basin fund Other. - -
Construction and rehabiUtation Other
Alaska Power Administration BonneviUe Power Administration Southeastern Power Administration Southwestern Power Administration
Total water and power development .
Water quaUty and research: Officeof Saline Water Federal Water Pollution Control Administration
Secretarial offices: Office of the Solicitor Office of the Secretary •. Office of Water Resources Research
Virgin Islands Corporation Proprietary receipts from the pubUc Intrabudgetary transactions
Total Interior D epartment
Justice Department: Legal activities and general administration. Federal Bureau of Investigation Immigration and Naturalization Service Federal Prison Systems:
Federal Prison Industries, Inc. (net) Federal Prisons commissary funds. Other
Law Enforcement Assistance Administration. ^ Bureau of Narcotics and Dangerous Drugs Proprietary receipts from the public
Total Justice D epartment
Footnote at end of table.
-129 108,783 268.369 129.482 60,683
734, 743
91.773
16,133 56,326 8,429 874
173,535
242 51, 735
109, 284 133,141
294,401
•• 29, 508 -3.514
•• 166,611 90, 871
916 130.512
874 7.648
423,426
37,450 214.940
5, 533 8,052
10,810 -505 ...
-1,043,373 -40,268
818,743
86,925 217, 560 90,013
- 8 , 111 -64
79,413 33,535 17,351 -1,655
514,968
-6-21 56 080
307, 394 116, 550 65,132
741, 664
102. 692
30,229 61.982 17, 292 1,042
213,236
-289 54, 496
114, 618 138,818
307, 642
22, 523 -2,344 142,128 97, 599 1,003
130, 368 818
6.853
398,949
30,204 262,334
6.412 10,262 11,804
—815, 563 -31, 235
1.135,709
104,957 252.902 103,997
-1,493 -139
89,683 65,418 25, 936
-1.286
639, 974
Digitized for FRASER http://fraser.stlouisfed.org/ Federal Reserve Bank of St. Louis

STATISTICAL APPENDIX 27
T A B L E 4.—Budget receipts, expenditures, and lending, fiscal years 1969 and 1970—Continued
[In thousands of dollars]
The expenditure account 1969 1970
N E T EXPENDITURES—Continued Labor Department:
Manpower Administration: Manpower development and training activities 377,353 408,388 Salaries, expenses, and other.. ••31,815 36,924 Bureau of Apprenticeship and Training 9,188 7,084 Unemployment compensation for Federal employees and ex-servicemen
and trade adjustment.. '"126,605 183,554 Advances to employment security administration account, unemploy
ment trust fund -3,832 -4.379
Unemployment trust fund: Employment security administration account:
Salaries and expenses. 20,805 18,442 Grants to States for unemployment compensation and employment
service administration.. 588,062 624,197 Payments to general fund:
Reimbursements and recoveries 9,555 10,766 Interest on refunds of taxes 248 242 Interest on advances from general (revolving) fund 3,832 4,379
Railroad unemployment insurance account: Benefit payments 96,588 92,955 Interest on advances from railroad retirement account 5, 730 4,87 6
Railroad unemployment insurance administration fund 6,089 6,475 State accounts: Withdrawals by States ^- 2,061,135 2,792,794 Federal extended compensation account (*)
Total unemployment trust fund 2,792,043 3,555,127
Other. ^ -100 - 1
Total Manpower Administration 3,333,072 4,186,696
Labor-management relations 8,971 11,506
Wage and labor standards: Wage and Labor Standards Administration •• 37,103 41,998 Bureau of Employees' Compensation:
Employees' compensation claims and expenses 67,203 81,481 Other 404 448
Total wage and labor standards 104.771 123,927
Bureau of Labor Statistics 22,032 23.235 Bureau of International Labor Affairs. 1,716 1,730 Office of the Solicitor 6,122 6,663 Office of the Secretary ••5,688 6,022 Proprietary receipts from the public • —7,384 —3,893
Total Labor Department ^ 3,474,939 4,355,886
Post Office Department: Postal Fund 920,334 1,510,023
State Department: Administration of foreign affairs:
Salaries and expenses 208,365 225,549 Acquisition, operation and maintenance of buildings abroad 18.717 16.116 Intragovernmentalfunds (net)._ . 180 —116 Foreign service retirement and disability fund 14,144 17,213 Other 3,164 3,012
Total administration of foreign affaii-s 244,569 261.773
International organizations and conferences: Contributions to international organizations 118,526 128,841 Other 5,695 7.114
International commissions 14.804 7.643 Educational exchange 46,956 36,435 Other 11,515 11,678 Proprietary receipts from the public . . . —4.731 —5.066
Footnotes at end of table.
409 -714—71-
Digitized for FRASER http://fraser.stlouisfed.org/ Federal Reserve Bank of St. Louis

28 19 70 REPORT OF THE SECRETARY OF TPIE TREASURY
TABLE 4.—Budget receipts, expenditures, and lending, fiscal years 1969 and 1970—-Continued .
[ In thousands of dollars]
The expenditure account 1969 1970
NET EXPENDITURES—Continued
State Department—Continued Intrabudgetary transactions:
Foreign service retirement and disability fund: Receipts transferred to civU service rethement and disabUity fund —184 —135
Other -430 -430
Total State Department . - . . 436,719 447,754
Transportation Department: Officeof the Secretary 15,837 20.597 Coast Guard:
Trust revolving funds 90 —57 Intragovernmentalfunds (net) : —4,284 2.966 Other 652.200 585,318
Federal Aviation Administration: Public enterprise funds — 1 10 FacUities and equipment 74,532 . 106,854 Grants-in-aid for anports. 103,671 83,155 CivU supersonic ancraft development 80,603 111, 348 Other '•739.171 885.084
Federal Highway Administration: Highway beautification 21.329 13.853 State and commmiity highway safety programs 40.169 74,820 Highway trust fund:
Federal-aid highways 4,160,575 4,376,174 Other r 50, 506 50,180
Federal Railroad Administration: Alaska raUroad . . . . —501 —254 Other . 16,679 16,846
Urban Mass Transportation Administration: Urbanmass transportation fund 139,358 104,603 Other : 715 1,517
Saint Lawrence Seaway Development Corporation 4,885 8 National Transportation Safety Board 4.725 5,425 Proprietary receipts hom the pubUc —20.386 —19,910
Total Transportation Department 5,969,873 6.417.536
Treasury Department: Office of the Secretary:
Salaries and expenses. 7,588 9,218 Federal Farm Mortgage Corporation liquidation fund 1 2 Other 33 46
Bureau of Accounts: Salaries and expenses 45,243 45,240 Claims, judgments and relief acts 62,275 52,677 Interest on uninvested funds 7,254 6.226 Government losses in shipment 330 167 Reconstruction Finance Corp. liquidation fund —180 Other 393 1.925
Bureau of Customs: Salaries and expenses 99,072 121,360 Other 44,882 54,038
Bureau of Engraving and Printing: Intragovernmentalfunds (net) —7 —236 Other 403 94
Bm-eau of the Mint: Salaries and expenses 14,216 16, 111 Other 7.006 5,900
Bureau of the Public Debt 67,408 64,215 Internal Revenue Service:
Salaries and expenses. 21.247 25,302 Revenue accounting and processing 187,325 212,893 Compliance 537.252 631.808 Interest onrefunds oftaxes.. . . 119,841 112.671 Payments to Puerto Rico for taxes coUected 80,238 85.167 Federal tax lien revolving fund —1 16
Officeof the Comptroller of the Currency -1,899 -5,051 Office of the Treasurer:
Salaries and expenses 7,065 7,911 Check forgery insurance fund —3 105
U.S. Secret Service 23,704 30.271
Footnote at end of table.
Digitized for FRASER http://fraser.stlouisfed.org/ Federal Reserve Bank of St. Louis

STATISTICAL APPENDIX 29 TABLE 4.—Budget receipts, expenditures, and lending, fiscal years 1969 and
1970—Continued [ In thousands of dollars]
The expenditure account 1970
13, 961.219 2, 627,018
16, 588.237
-268,340 -716.923
16,923,841
2,450,377
15,844,149 3,469, 521
19.303,670
-404. 626 -867. 625
19, 509. 513
2.453,102
N E T EXPENDITURES-Continued
Treasury D e p a r t m e n t — C o n t i n u e d In teres t on t he publ ic deb t (accrual basis) :
Pub l i c i s sues Special issues :
T o t a l interest on the pub l i c d e b t . . .
P ropr ie ta ry receipts from t h e p u b l i c . .
I n t r a b u d g e t a r y t ransact ions
T o t a l T reasu ry D e p a r t m e n t
A tomic Energy Commission
General Services Adni in is t ra t ion: Rea l p roper ty activit ies:
(Construction, pub l i c buUdings projects 68,158 • Operat ing expenses, p u b h c bui lding service 290,550 Repa i r and improvemen t of p u b h c buildings 73,947 I n t r a g o v e r n m e n t a l f u n d s (net) —12,663 Other '•24,865
Personal p roper ty activit ies: I n t r a g o v e r n m e n t a l f u n d s (net) 33,218 Other 75,584
Records activit ies: Na t iona l Archives t r u s t f u n d . . : —179 O t h e r . . 20,868
Transpo r t a t i on a n d communica t ions activities 5,217 P r o p e r t y m a n a g e m e n t and disposal activit ies:
Pub l i c enterprise funds —15 In t r agove rnmen ta l funds (net) 308 O t h e r . . . . 27,155
General activit ies: Surplus real p roper ty credit sales —27,869 PubUc enterprise f u n d s . . —12 I n t r a g o v e m m e n t a l funds (net) — 663 Other 2,763
Propr i e t a ry receipts from t h e publ ic . . —161,569 T o t a l General Services Admi ius t ra t ion 419,752
Na t iona l Aeronaut ics and Space Adminis t ra t ion 4,246,514
Veterans ' Adin in is t ra t ion: Compensa t ion , pensions, a n d benefit p rograms 6,593,809 Medical care 1,450,038 Pub l i c enterprise funds:
Direct loan revolving fund —7,267 L o a n gua ran ty revolving fund —17,151 Other -73 ,786
Benefits, refunds, and d iv idends : G o v e r n m e n t life insurance fund 77.847 Na t iona l service Ufe insurance fund 567,906
Othe r . 321.618 Propr ie ta ry receipts from the publ ic :
G o v e m m e n t life insurance fund . —10,967 Na t iona l service life insurance fund —477,984 Other - 1 . 8 6 5
I n t r a b u d g e t a r y t ransact ions: P a y m e n t to veterans life insurance funds:
(Govemment life insurance fund —50 Na t iona l service life insurance fund —6.840
T o t a l V e t e r a n s ' A d m i n i s t r a t i o n . . • 7,416,309
O ther independen t agencies: Admin i s t r a t ive Conference of t he Uni ted S ta t e s . . . . . 238 Amer ican B a t t l e M o n u m e n t s Commission 2,348 A r m s Control and D i s a r m a m e n t Agency 9,600 Cabine t Commi t t e e on Oppor tuni t ies for Spanish Speaking People —67 Cen t ra l InteUigence Agency, cons tmct ion 68 Civil Aeronaut ics Board :
P a y m e n t s to air carriers — 43,924 Salaries and expenses 9,839 Propr ie ta ry receipts from t h e publ ic —131
Footnotes at end of table .
69.667 329.929
78,456 - 3 , 636 19,884
18,037 82,398
23 24,234 7,623
- 8 3 8 325
25, 668
- 4 3 . 964 - 8 , 1 2 9
- 6 5 9 1,665
-164,666
425,928
3,748,926
6,338,179 1,652,627
-13 ,151 -23 .981 - 8 0 , 8 9 1
81,392 693,069 379,868
-10 ,123 -463,091
- 2 . 1 2 4
- 6 8 -3,324
8,448,391
254 2,432
10, 641 476
36,646 11,184
- 1 2 5
Digitized for FRASER http://fraser.stlouisfed.org/ Federal Reserve Bank of St. Louis
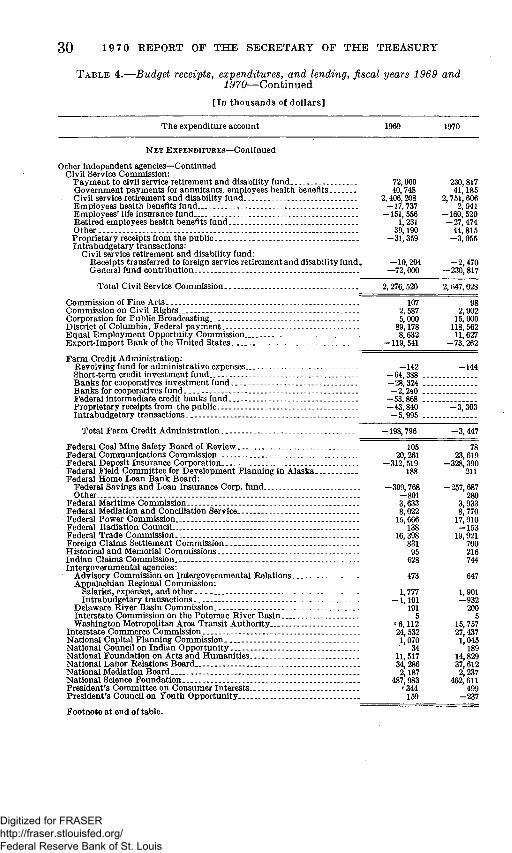
30 1970 REPORT OF THE SECRETARY OF THE TREASURY
TABLE 4.—Budget receipts, expenditures, and lending, fiscal years 1969 and 1970—Continued
[ In thousands of dollars]
The expenditure account 1969 1970
N E T EXPENDITURES-Continued Other independent agencies—Continued
Civil Service Commission: Payment to civU service retirement and disabUity fund Government payments for annuitants, employees health benefits Civil service retirement and disability fund Employees health benefits fund.. Employees' life insurance fund... Retired employees health benefits fund -. Other Proprietary receipts from the public Intrabudgetary transactions:
Civil service retirement and disabiUty fund: Receipts transferred to foreign service retirement and disability fund. —10.204 —2,470 General fund contribution —72,000 —230,817
72, 000 40, 748
2,406, 208 -17,737 -151, 556
1,231 39.190
-31.359
230,817 41.185
2, 751, 606 2,941
-160,520 -27.474 44, 815 -3,055
Total CivU Sei-vice Commission. 2.276,520 2,647.028
Commission of Fine Arts Commission on CivU Rights.. Corporation for Public Broadcasting District of Columbia, Federal payment Equal Employment Opportuity Commission Export-Import Bank ofthe United States.
Farm Credit Administration: Revolving fund for administrative expenses Short-term credit investment fund Banks for cooperatives investment fund Banksfor cooperatives fund Federal intermediate credit banks fund Proprietary receipts from the pubhc Intrabudgetary transactions...
Total Farm Credit Administration.
Federal Coal Mine Safety Board of Review Federal Communications Commission. Federal Deposit Insurance Corporation Federal Field Committee for Development Planning in Alaska
. Federal Home Loan Bank Board: Federal Savhigs and Loan Insurance Corp. fund Other.
Federal Maritime Commission Federal Mediation and ConcUiation Service Federal Power Commission Federal Radiation Council... Federal Trade Commission.. Foreign Claims Settlement Commission. Historical and Memorial Commissions Indian Clainis Commission.. Intergovernmental agencies:
Advisory Commission on Intergovernmental Relations Appalachian Regional Commission:
Salaries, expenses, andother Intrabudgetary transactions
Delaware River Basin Commission Interstate Commission on the Potomac River Basin Washington Metropolitan Area Transit Authority
Interstate Commerce Commission... National Capital Plarming Coinmission. National Council on Indian Opportunity National Foundation on Arts and Humanities National Labor Relations Board National Mediation Board. , National Science Foundation President's Committee on Consumer Interests President's Council on Youth Opportunity
Footnote at end of table.
107 2, 587 5,000 89.178 8, 632
-119.641
-142 -64,388 ...
98 2.902 15.000
118. 562 11,627
-73, 262
-144
-28.324 -2.240 -53,868 -43, 840 -5.995 ...
-3,303
-198,796
105 20.261
-312.519 188
-309, 768 -801 3,633 8,022 15,666
138 16,398
831 95 628
473
1,777 -1,101
191 5
^6,112 24, 532 1,07O
34 11, 517 34, 286 2,187
487,983 r344 159
-3,447
78 23,619
-328,390 211
-257,687 280
3,933 8,770 17,910 -153
19,921 700 216 744
647
1,901 -932 200 5
15,757 27,437 1,045 189
14,829 37,612 2.237
462,611 499
—237
Digitized for FRASER http://fraser.stlouisfed.org/ Federal Reserve Bank of St. Louis

STATISTICAL APPENDIX 3 1
TABLE 4.—Budget receipts, expenditures, and lending, fiscal years 1969 and .ZP70—Continued
[In thousands of dollars]
The expenditure account 1969 1970
N E T EXPENDITURES-Continued Other independent agencies—Continued
Railroad Retirement Board: Payments for military service credits.. 18,446 19,206 Railroad retirement accounts:
Administrative expenses 14,798 16,261 Benefit payments, etc. 1,532,790 1,586,403 Interest on refunds of taxes 6 9 Payment to railroad unemployment insurance account 1 5,228
Proprietary receipts from the pubhc . . . —6,791 —2,396 Intrabudgetary transactions:
RaUroad retirement account: Payments for military service credits —18,446 —19,206
Receipts transferred to railroad unemployment insurance account —1 —5,228
Total Railroad Retirement Board 1,540,802 1,600,277
Renegotiation Board. 2,983 3,900 Securities and Exchange Coinmission ..'. 18,546 21,509 Selective Service System.. 64,791 75.378
Small Business Administration: Public enterprise funds. . . 116,184 115,082 Salaries and expenses 11,373 10,809 Other .- 21 Proprietary receipts from the public
Total Small Business Administration
Smithsonian Institution Subversive Activities Control Board Tarifl Commission.. Temporary Study Commissions
Tennessee Valley Authority: TennesseeValley Authority fund Proprietary receipts from the public
Total Tennessee Valley Authority
U.S. Information Agency: Informational media guarantee fund 4 —2 Salaries and expenses 171,232 180,153 Construction of radio facilities 7,776 8,311 Other. 4,628 9,915 Proprietary receipts from the pulDlic —685 —964
. Total U.S. Information Agency 182,955 197,413
-la
127, 545
51, 481 270
3. 847 7, 982
187,150 -85
187, 064
-8
125,904
49, 390 374
4.088 7,017
211. 006 -93
210, 913
U.S. section,of the United States-Mexico Commission for Border Develop-m.ent and Friendship. —51 223
U.S. Tax Court 2,509 2,972 Water Resources Council:
Planning expenses and other . 3,738 4,199 Intrabudgetary transactions. —484 —671
. Total other independent agencies ''4,335,919 5,136, 755
Undistributed intrabudgetary transactions: Federal employer contributions to retirement and social insurance funds:
The judiciary: Judicial survivors annuity fund —502 —620
Health. Education, and Welfare Departraent: Federal old-age and sm'vivors insurance trust fund —469,000 — 559,000 Federal disability insurance trust fund —63, 000 —78,000 Federal hospital insm'ance trust fund —79,000 —91,000
State Department: Foreign service retirement and disabUity fund — 5,399 — 6,886
Other independent agencies: Civil Service Commission:
Civil service retirement and disability fund -1,4.00,851 - 1 , 708,826 U.S. Tax Court:
Tax court judges survivors annuity fund.. —20 —20
Subtotal -- -2,017,773 -2,444,352
Footnote at end of table.
Digitized for FRASER http://fraser.stlouisfed.org/ Federal Reserve Bank of St. Louis
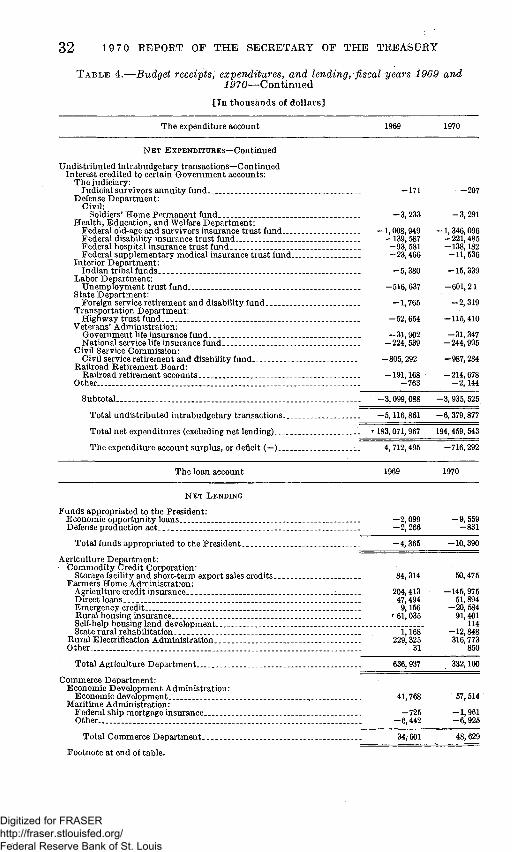
32 19 70 REPORT OF THE SECRETARY OF THE TREASURY
TABLE 4.—Budget receipts, expenditures, and lending, fiscal years 1969 and 1970—Continued
[In thousands of dollars]
The expenditure account 1969 1970
N E T EXPENDITURES-Continued Undistributed hitrabudgetary transactions—Conthiued
Interest credited to certain Government accomits: The judiciary:
Judicial survivors annuity fund —171 —207 Defense Department:
CivU: Soldiers'Home Permanent fund _ -3,233 -3,291
Health, Education, and Welfare Department: Federal old-age and sm-vivors insurance trust fund —1,008,949 — 1, 346,096 Federal disabUity insurance trust fund —139,587 —221,485 Federal hospital insurance trust fund. . —93, 581 —138,182 Federal supplementary medical insurance trust fmid —23,466 —11,536
Interior Department: Indian tribal funds -6,380 -15,339
Labor Depai'tment: Uneraployment trust fund -516,637 -601,21
State Depai'tment: Foreign service retirement an d disability fund — 1,765 — 2,319
Transportation Department: Highway trust fund -52,654 -115,410
Veterans' Adrainistration: Government life insm'ance fmid —31,902 —31.347 National service life insurance fund —224.539 —244,995
CivU Service Commission: CivU service retirement and disabUity fund —805,292 —987,284
Railroad Retirement Board: Railroad retirement accounts. —191,168 —214,678
Other -763 -2,144
Subtotal... -3,099,088 -3,936,525
Total undistributed intrabudgetary transactions. —6,116,861 —6,379,877
Total net expenditures (excluding net lending) . ••183,071,967 194,459,543
The expenditure account surplus, or deficit (—) ._ 4, 712,495 —716,292
The loan account 1969 1970
NET LENDING
Funds appropriated to the President: Economic opportunity loans. _ Defense production ac t . . .
Total funds appropriated to the President
Agriculture Departraent: • Comraodity Credit Corporation:
Storage facUity and short-terra export sales credits _ 84,314 50,476 Farraers Horae Adrainistration:
Agriculture credit hismance : 204,413 —145,975 Direct loans. 47,494 51.894 Emergency credit 9.156 -20,584 Ruralhousing insurance •• 61,035 91,401 Self-help housing land development.. _ __ 114 State rm-al rehabilitation 1,168 —12,848
Rural Electrffication Admmistration 229,325 316,773 Other 31 850
-2,099 -2.266
-4,365
-9, 569 -831
-10,390
Total Agriculture Department 636,937 332,100
Coramerce Department: Economic Development Administration:
Economic development.. 41,768 67,514 Marithne Adrainistration:
Federal ship mortgage insurance Other
Total Commerce Department _
Footnote at end of table.
-725 -6,442
34,601
-1,961 -6,925
48,629
Digitized for FRASER http://fraser.stlouisfed.org/ Federal Reserve Bank of St. Louis

STATISTICAL APPENDIX 3 3
TABLE 4.—Budget receipts, expenditures, and lending, fiscal years 1969 and 1970—Continued
[ In thousands of dollars]
The loan account 1969 1970
N E T LENDING—Continued Defense Department:
MUitary: Defense production guarantees —2,161 —670
CivU: Construction of power systems, Ryukyu Islands ._ —236
Total Defense Department -2,161 -906
Health. Education, and Welfare Department: Office of Education:
Higher education activities Studentloans Other
Health Services and Mental Health Administration. Other.
91,191 85 478 -93 3,344
97,547 3,176 670
5,535 3,278
Total Health, Education, and Welfare Department 95,007 110,105
Housing and Urban Development Department: Renewal and housing assistance:
College housing loans 148,584 139,012 Low-rent public housing 12,752 —1,208 Urban renewal programs 37,205 —5.935 Other - '25.339 35.378
Metropolitan development: Public facility loans 43,978 38,977 Liquidating programs —418 1,169
Federal Housing Administration: Modernization, improvement, and mortgage insurance 19,467 —55.214 Community disposal operations 888 —863 Housing for the elderiy 79,355 81,837
Government National Mortgage Association: Management and liquidating functions... 113,622 -^79,359 Special assistance functions - 442,299 670,813
• Participation sales fund -292,960 Secondary market functions 176,856
Total Housing and Urban Development Department 806,968 824,597
Interior Department: Bureau of Reclamation 4,398 2,959 Other 13,433 -2,289
Total Interior Department --.- 17,832 670
Transportation Department.. —200 —225 Treasury Department —46 —267 General Services Administration. 4.961 20,212
Veterans' Adininistration: Direct loan program : Loan guaranty program Government Ufe insurance fund National service life insurance fund Other
46,927 142,391 -1,822 58,642 6,949
26,427 72,805 2,786 92,016 10,337
Total Veterans'Admimstration 253,088 204,370
Other independent agencies: CivU Service Commission.. —594,600 Loans to District of Columbia . - . . 64,756 90,350 Export-Import Bank of the United States. . . •'365,844 292,321
Farm Credit Administration: Banks for cooperatives - 122,871 Federalinterraediate credit banks —278,040
Total Fai-m Credit Administration.
Federal Home Loan Bank Board: Federal Savings and Loan Insurance Coi*poration 21,513 90,210
Interstate Commerce Coinmission... —1,001 —834 National Capital Planning Commission. —23 —3 Railroad Retirement Board. . . - —60,000 SmaU Business Administration:
Business loan and investment fund —11,271 73,178 Disaster loan fund -6,469 54,126
Totalloan account 1,476,201 2,128,242
Footnote at end of table.
Digitized for FRASER http://fraser.stlouisfed.org/ Federal Reserve Bank of St. Louis

34 19 70 REPORT OF THE SECRETARY OF THE TREASURY
T A B L E 4.—Budget receipts, expenditures, and lending, fiscal years 1969 and i 570—Continued
[In thousands of dollars]
1969 1970
TOTAL BUDGET
Receipts (-I-) (The expenditure account) r+i87,784,463 193,743,251
Expenditures ( - ) (Thc expenditure account) ^-183,071,967 -194,459,543
Netlending (+),or ( - ) (The loan account) -1,476,201 -2,128,242
Totaloutlays -184,548,169 -196,587.786
Budget surplus, (-1-), or deficit ( - ) . -}-3,236,294 -2,844,535
* Less than $500. >• Revised.
T A B L E 5.—Means of financing, fiscal years 1969 and 1970
[In thousands of dollars. On basis of "Monthly Statement of Receipts and Expenditures of the United State Governraent," see "Bases of Tables"]
1969 1970 Classification
(Assets and liabilities dkectly Net Closing Net Closing related to the budget) transactions balances transactions balances
LIABILITY ACCOUNTS
Borrowing from the public: Federal securities:
Public debt securities: As published in daily Treasury state
ments 6,141,847 353,720,254 17,198,453 370,918,707
Agency securities: Defense Department:
Family housing raortgages -93,486 1,857,955 -86,185 1,771,770 Homeowners assistance raortgages 5,271 5,283 —1,811 3,472
Housing and Urban Development Department:
Federal Housing Adrainistration 28,469 576,806 -60,044 516,853 Government National Mortgage Associ
ation: Participation sales fund:
Participation certificates 700,000 8,600,000 -1,280,000 7,320,000 Secondary market operations — 5,887,062
Transportation Department: Coast Guard:
Family housing raortgages -126 2,961 -131 2,829 Treasury Departraent:
Federal Farm Mortgage Corp. liquidation fund.. - 2 107 - 2 105
Other independent agencies: Export-Import Bank of the United
States: Agency securities 270,680 658,145 -258,145 400,000 Participation certificates -369,115 1,813,953 -321,154 1,492,799
Farm Credit Administration: Banks for cooperatives fund —1, 229, 515 Federal intermediate credit banks
fund.. . -3,778,580 Federal Home Loan Bank Board:
Federal Home Loan Bank Board revolving fund 418 5,851 -217 5,634
Home Owners' Loan Corporation fund -13 247 - 5 242
Tennessee Valley Authority 202,655 727,655 268,345 996,000
Total agency securities -10,150,407 14,249,053 -1,739,350 12,509,703
Total Federal secmities - 4 , 008, 559 367, 969, 307 15, 459,103 383,4'28,410
Digitized for FRASER http://fraser.stlouisfed.org/ Federal Reserve Bank of St. Louis

STATISTICAL APPENDIX 3 5
TABLE 5.—Means of financing, fiscal years 1969 and 1970—Continued
Classification 1969
(Assets and liabUities directly Net Closing Net Closing related to the budget) transactions balances transactions balances
LIABILITY ACCOUNTS—Continued
Borrowing from the public—Continued Deduct:
Federal securities held as investments of Government accounts 1 8,521,730 87,661,297 10,061,857 97,723,154
Noninterest-bearing public debt securities heldby IMF -1.384,000 825,000 825,000
Total borrowing from the public -11,146,289 279,483, 010 5,397,246 284,880,256
Accrued interest payable on public debt securities 32,805 1.767,852 305.557 2.073.410
Deposit funds: Allocations of special drawing rights. 866,880 866,880 Other 158,956 4,531,065 -710,038 3,821,017
MisceUaneous liability accounts (includes checks outstanding, etc.) ••-112,859 ••5,049.409 -200,245 4,849.164
Total liability accounts... . . . .-11,067,387 290,831,327 5,659,400 296,490,727
ASSET ACCOUNTS (Deduct)
Cash and montary assets: Within general accomit of the Treasm'er of the
United States: As published in the daUy Treasury state-
raent... N e t t ransact ions in t rans i t as of J u n e 30
T o t a l as of J u n e 30
With other Governmen t officers: Special d rawing r igh t s :
To ta l holdings Certificates issued to Federa l Reserve
b a n k s
Balance Other
With In te rna t iona l Monetary F u n d
T o t a l cash and mone ta ry assets
Miscellaneous asset accounts
To ta l asset accomits .
Excess of l iabili t ies (-f) or assets ( - ) . . A d d : Transac t ions no t apphed to current year ' s
surplus or deficit
To ta l budge t financing (Financing of deficit (-F), or disposition of s m p l u s
» See tables 6 and 20. •• Revised.
409, 476 350,240
759, 716
808, 459 644,250
2, 212,424
363,002
2, 575,427
— 13,642,814
10,406,520 .
- 3 , 236, 294
7,103, 538 440,870
7, 544,408
4,352, 536 1,610,000
13.506,944
1, 512,362
15,019,306
-1-275,812.021
4-275, 812,021
1,912, 358 -165,965
1, 746, 393
957.188
-400,000
557,188 -1 ,535,676
802,000
1, 569,906
284,192
1,854,098
-f 3,805,303
-960,768
4-2,844, 535
9, 015, 896 274, 906
9, 290,802
957,188
-400,000
557,188 2,816,860 2, 412,000
15,076, 850
1, 796,553
16, 873,403
-1-279. 617,324
- 9 6 0 , 768
-f 278, 656, 556
Digitized for FRASER http://fraser.stlouisfed.org/ Federal Reserve Bank of St. Louis

36 197 0 REPORT OF THE SECRETARY OF THE TREASURY
TABLE 6.—Investments of Government accounts in Federal securities (net) fiscal years 1969 and 1970
[Amounts represent public debt securities unless stated otherwise. Par value. In thousands of dollars. On basis of "Monthly Statement of Receipts and Expenditures of the United States Government," see "Bases of Tables"]
Agency 1969 1970
Legislative branch: Library of Congress... —9 —2
The judiciary: Judicial survivors annuity fund 593 786
Agriculture Department: Publicdebt securities 617 1,741 Agency securities —5,809 —5,291
Coinmerce Department -- 2,395 7,574 Defense Department 143 62 Health, Education, and Welfare Departraent:
Federal old-age and survivors insmance trust fund: Public debt securities 2,764,853 3,953,285 Agency securities —96.500 Participation certificates 230.000
Federal disabUity hisurance trust fund: Public debt securities 1,150,956 1,392,466 Agency securities —30,000 Participation certfficates —50,000
Federal hospital insurance trust fund: Public debt secmities 631,176 693,382 Agency securities —41,500
Federal supplementary medical insurance trust fund. 76,558 — 344,564 Other... 403 488
Housing and Urban Development Department: Renewal and housing assistance:
Low-rent public housing program - —3,000 Federal Housing Administration:
Federal Housing Administration fund: Public debt securities - -- 167,439 133,932 Agency securities —3,049 —3,431 Participation certfficates 115 70
Community disposal operations fund: Public debt securities 8 34
Government National Mortgage Association: i Participation sales fund:
Public debt securities . . - . . 600.691 -335,503 Agency securities -- -35.880 -33,795
Management and liquidating functions fund: Agency securities —2,151 —2,135
Special assistance functions fund: Agencyisecurities -5,789 -6,008
Federal Insmance Administration: National insurance development fund 32,024 27,976
Interior Department: Public debt securities -5.637 180,847 Participation certfficates. 1,000
Labor Department: Unemployment trust fund:
Public debt securities 1,174,194 552.635 Agency securities —146.500 Participation certfficates . : . . . . -90.000 -65,000
Other - 6 -12 State Department:
Foreign service retirement and disability fund 5,460 3,704 Other 35 -20
Transportation Department: Highway trust fund . - - . 534,411 1,089,002 Other 24
Treasury Department: Public debt securities -722,167 -3,400 Agency securities —25.000 Participation certificates —2,000
General Services Administration 636 —277 Veterans* Admiaistration:
Veterans' reopened insurance fund 34,609 34,714 Veterans' special term insm-ance fund 28,471 24,315 Government life insm-ance fund:
Public debt securities.... -34,569 -45,088 National service life insmance fund:
Public debt securities -102.096 161,492 Agency securities —67,600 Participation certfficates 176,000 -76,000
Other 686 -326
Footnote at end of table.
Digitized for FRASER http://fraser.stlouisfed.org/ Federal Reserve Bank of St. Louis
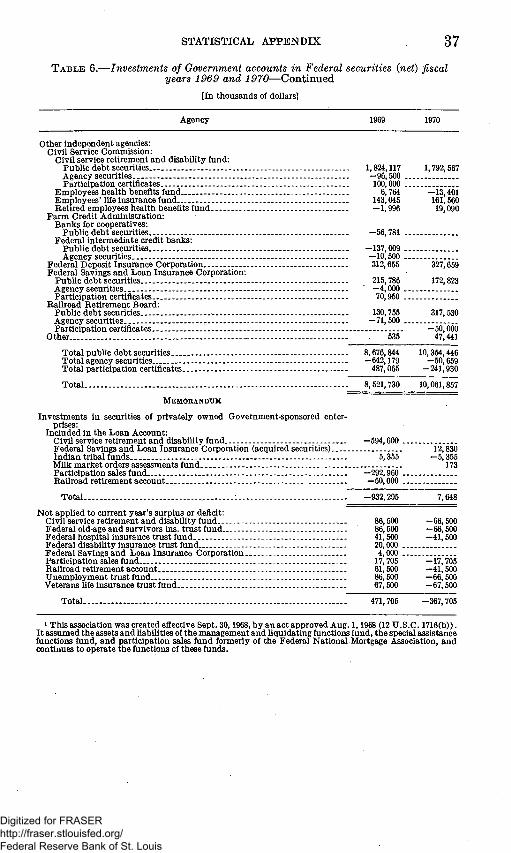
STATISTICAL APPENDIX 37
TABLE 6.—Investments of Government accounts in Federal securities (net) fiscal years 1969 and 1970—Continued
[In thousands of dollars]
Agency 1970
Other independent agencies: Civil Service Cominission:
Civil service retirement and disabffity fund: Public debt securities Agency securities Participation certfficates
Employees health benefits fund Employees'lUe insurance fund... Retired employees health benefits fund
Farm Credit Administration: Banks for cooperatives:
Pubhc debt securities , Federal intermediate credit banks:
Pubhc debt securities Agency securities.
Federal Deposit Insurance Corporation Federal Savings and Loan Insurance Corporation:
PubUc debt securities Agency securities Participation certificates
Railroad Retirement Board: Public debt securities -.-Agency securities.. -Participation certificates
Other
Total pubhc debt securities Total agency securities Total participation certfficates..
Total
MEMORANDUM
1,824,117 -96,600 . 100,000 .
6,764 143,045 -1,996
-56,781 .
-137,009 . -10,500 . 312.655
215,786 " -4,000 .
70,950 .
130,755 -71,500 .
535
8,676,844 -642,179
487,065
Investments in securities of privately owned Government-sponsored enterprises:
Included in the Loan Account: CivU service retirement and disabiUty fund , . . —694,600 . Federal Savings and Loan Insurance Corporation (acquired securities) Indian tribal funds 6,355 MUk market orders assessments fund Participation sales fund -292,960 . Railroad retirement account —50,000 .
Total , - -932,205
Not applied to current year's surplus or deficit: Civil service retirement and disabUity fund 86,500 Federal old-age and survivors ins. tmstfund 86,500 Federal hospital insurance tmst fund 41,500 Federal disability insurance tmst fund 20,000 . Federal Savings and Loan Insurance Corporation 4.000 . Participation sales fund 17,705 Railroad retirement account 61,500 Unemployment tmst fund 86,500 Veterans Ufe insurance tmst fund 67,500
Total 471,705
1,792,667
-13.401 161,560 19,090
327,669
172,823
317,530
"-50,"000 47,441
10,354.446 -50,659
-241.930
8,621,730 10,061.867
12,830 -6,356
173
7,648
-66,500 -66.500 -41,500
-17,705 -41,500 -66.500 -67,600
-367,705
1 This association was created eflective Sept. 30,1968, by an act approved Aug. 1,1968 (12 U.S.C. 1716(b)). I t assumed the assets and habffities of the management and liquidating functions fund, the special assistance functions fund, and participation sales fund formerly of the Federal National Mortgage Association, and continues to operate the functions cf these funds.
Digitized for FRASER http://fraser.stlouisfed.org/ Federal Reserve Bank of St. Louis
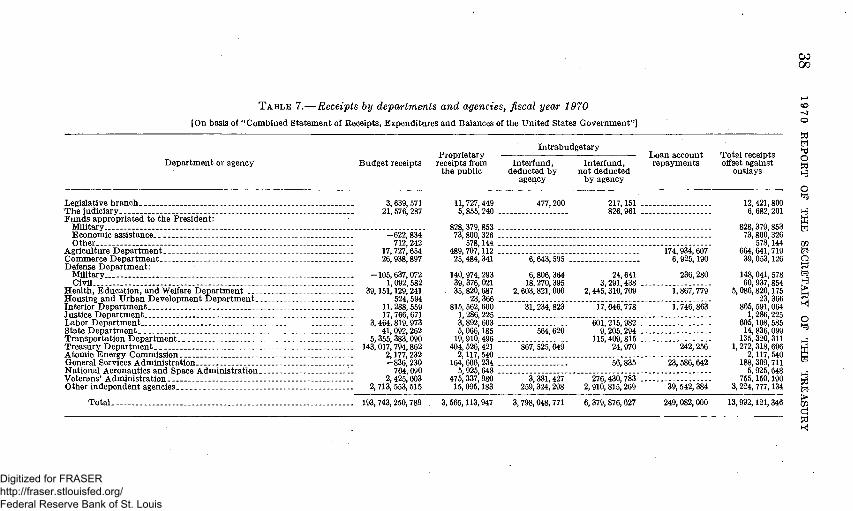
CO (X)
TABLE 7.—Receipts by departments and agencies, fiscal year 1970 [On basis of " C o m b i n e d S ta t emen t of Receipts , Expend i tu re s and Balances of the Un i t ed States G o v e r n m e n t "
t=j
o
O
Ui
O
O
SI
> w d
D e p a r t m e n t or agency B u d g e t receipts Propr ie ta ry
receipts from the publ ic
I n t r a b u d g e t a r y
In ter fund, deducted b y
agency
In ter fund, no t deduc ted
b y agency
Loan account r e p a y m e n t s
To ta l receipts oflset against
out lays
Legislative b ranch _ 3,639,571 T h e judiciary 21,576,287 F u n d s appropr ia ted to t he Pres iden t :
M U i t a r y . . . . Economic assistance —622,834 Other 712,242
Agricultm'e D e p a r t m e n t 17.727,654 Commerce D e p a r t m e n t . . . . 26,938,897 Defense D e p a r t m e n t :
M U i t a r y . . . . -. -105,637,072 CivU 1,092,582
H e a l t h , E d u c a t i o n , and Welfare D e p a r t m e n t 39,151,129.241 Hous ing and U r b a n D e v e l o p m e n t D e p a r t m e n t . . . . . . 524.594 Inter ior D e p a r t m e n t 11,288,559 Just ice D e p a r t m e n t 17,766,671 Labor D e p a r t m e n t 3,464,819,973 Sta te D e p a r t m e n t 41.092,262 Transpo r t a t i on D e p a r t m e n t 5,365,383,090 T r e a s u r y D e p a r t m e n t 143,017,794,862 Atomic Ene rgy Commiss ion 2,177,232 General Services Adin in is t ra t ion —836,230 Na t iona l Aeronaut ics a n d Space Admin i s t r a t ion '.. 704,090 Veterans ' Admin i s t r a t ion 2,425,603 O t h e r i n d e p e n d e n t agencies 2,713,553,515
To ta l 193.743,250,789
11. 727,449 5,855,240 .
828,379,853 . 73,800,326 .
578,144 . 489,707.112 .
25, 484.341
477,200 217,151 826,961 .
140. 39,
. 35,
815, 1, 3, 5, 19,
404, 2,
164, 5,
475, 15.
974,293 376,021 820, 687 23,366
562, 600 286,225 892, 603 066,185 910,496 526, 421 117, 540 666, 234 925.648 337.980 095,183
6,643,595 .
6,806, 364 18,270.395
2, 603,821,000
24,641 3,291,438 ,
2, 445,310,709
174, 934,607 6, 925,190
236,280
"'i,'867,'779'
31, 234,823 17,046, 778 1,746, 863
fiOl.215.982 _ 564,620
867, 525, 049
9,205,294 ... 115.409, 815
24.970
56.835
242,256
23, 586, 642
3,381,427 259, 324,298
276,430,783 2, 910, 816,269 39,542,384
3. 565.113.947 3, 798, 048, 771 6, 379, 876, 627
12, 421, 800 6, 682, 201
828,379, 853 73,800, 326
578,144 664,641,719 39,053,126
148, 60.
5.086.
865. 1.
605, 14,
135, 1,272,
2, 188, 5,
755, 3,224,
041, 578 937, 854 820,175 23, 366 591, 064 286,225 108, 585 836, 099 320.311 318, 696 117, 540 309, 711 925,648 150.190 777,134
249, 082,000 13,992,121,346
Digitized for FRASER http://fraser.stlouisfed.org/ Federal Reserve Bank of St. Louis

TABLE 8.—Budget receipts and outlays monthly and total for fiscal year 1970
[In millions of doUars. On basis of "Monthly Statement of Receipts and Expenditures of the United States Govemment," see "Bases of Tables"]
Receipts and outlays July August Septem- October Novem- Decem- January ber ber ber
February
March April May June Total 1970
278 367 328 207 207
2,701 15, 705 3,644 2,430 3,424
14,999 20,406 11,832 14,332 16,701 16,303 14,929 13,110 22,043 13,986 22,561 193,743
N E T R E C E I P T S
Ind iv idua l income taxes 6,404 7,230 9,776 6,636 7,236 6,774 10,660 6,965 3,419 10,701 5,258 9,353 90,412 Corpora t ion income taxes 1,070 571 5,561 843 634 5,627 1,127 646 4,239 4,578 714 7,329 32,829 Social insurance taxes and contr ibut ions :
E m p l o y r a e n t taxes and c o n t r i b u t i o n s . . 2,510 4,392 2,766 2,055 3,547 1,917 2,290 4,363 3,151 3,927 4,792 3,421 39,133 U n e m p l o y m e n t insurance 124 601 51 93 343 58 130 ' 842 63 233 857 70 3,464 Cont r ibu t ions for other insurance and retire
m e n t 244 217 205 216 187 214 254 203 221 259 202 Exc ise taxes 1,419 1,263 1,295 1,259 1,606 1,400 1,154 1,206 1,192 1,226 1,319 E s t a t e and gift taxes 221 257 254 264 2'22 277 286 265 322 699 348 Cus toms . 222 213 215 231 185 197 195 165 202 207 192 Miscellaneous 328 256 292 234 370 337 208 275 300 313 303
To ta l 12,542
N E T O U T L A Y S
Legis la t ive b ranch 30 29 29 31 18 31 27 40 29 24 28 24 340 T h e j u d i c i a r y 9 13 10 10 10 14 8 10 10 11 11 12 128 Execu t ive Office of t he Pres ident 2 4 3 3 3 3 3 3 4 4 3 3 36 F u n d s appropr ia ted to t he Pres ident :
MUitary assistance - 1 6 65 77 71 72 32 56 76 42 72 138 55 731 Economic assistance 124 123 134 160 111 152 135 110 142 148 121 148 1,608 Other 186 280 192 209 ISO 158 191 207 169 194 175 297 2,436
Agr icul ture D e p a r t m e n t : Co inmodi ty Credi t Corporat ion and
foreign assistance and special export programs 560 851 1,502 853 412 407 450 46 38 - 6 3 - 1 4 4 - 1 3 6 4,777
Other 265 487 355 423 228 191 281 - 1 2 3 258 383 464 318 3,530 Commerce D e p a r t r a e n t 73 54 55 145 55 68 95 76 69 120 106 123 1,028 Defense D e p a r t m e n t :
Mil i tary: D e p a r t m e n t of t he A r m y 2,022 2,071 2,076 2,133 2,002 2,139 1,972 1,941 1,979 2,169 1,901 2,321 24,725 D e p a r t m e n t of the N a v y 1,865 1,911 1,915 2,069 1,645 1,894 1,908 1,696 1,930 1,886 1,817 1,967 2-2,505 D e p a r t m e n t of the Air Force 2,060 2,227 2,050 2,318 2,008 2,106 2,048 1,927 2,001 2,059 2,054 2,008 24,868 Defense agencies 393 394 431 -457 391 436 482 384 459 411 406 330 4,972 O t h e r 6 9 7 6 5 7 6 6 8 6 7 7 80
T o t a l mi l i t a ry 6,346 6,612 6,479 6,982 6,051 6,584 6,419
Civil . - 86 102 117 116 98 121 96 51 70 93 95 167
5,953 6,377 6,531 6,185 6,634 77,150
W
> I—l
Ui H-l O > •
f
>
fel
h-l
0 0 CO
Digitized for FRASER http://fraser.stlouisfed.org/ Federal Reserve Bank of St. Louis

o
TABLE 8.—Budget receipts and outlays monthly and total for fiscal year 1970—Continued [In miUions of doUars.]
CO
o
O
o
O S3
> Kl
O
M
> ^ td fel > Ui d td Kl
Receipts and outlays July August Septem- October Novem- Decem- January Febru- March ber ber ber ary
April May June Total 1970
N E T OUTLAYS—Continued
Health, Education, and Welfare Department: Social and rehabihtation service 635 627 619 682 571 673 742 705 702 794 809 619 8,178 Federal old-age and survivors insurance
tmstfund. 2,062 2,062 2,086 2,085 2,071 2,063 2,054 2,110 2.137 3,080 2,460 Federal disability insurance tmst fund 227 225 233 225 228 233 237 238 233 328 270 Federal hospital insurance tmst fund 420 408 370 337 356 438 411 388 492 449 440 Federal supplementary medical insurance
tmstfund 163 162 168 283 167 169 180 172 202 186 175 Other : . . 443 516 606 700 463 561 637 508 620 647 655
Housing and Urban Development Department 241 245 175 618 193 198 164 189 170 229 63
Interior Department 97 121 130 108 106 67 16 86 118 103 101 Justice Department 39 68 47 56 46 47 62 47 52 52 73 Labor Department:
Unemployment tmst fund 187 205 208 199 179 276 383 375 425 384 340 Other 48 59 65 61 51 69 60 52 77 85 77
Post Office Department 26 247 136 84 67 -15 109 162 87 315 156 State Department 65 40 23 66 37 50 46 17 20 42 12 Transportation Department:
Highway tmst fund 376 360 362 634 432 391 376 273 269. 273 274 Other 127 175 187 156 172 161 163 155 194 167 182
Treasury Department: Interest on the public debt.- 1,487 1,487 1,629 1,663 1,585 1,653 1,671 1,620 1,699 1.656 1.601 1.764 19,304 Interest on refunds, etc 11 12 10 20 9 9 8 8 7 7 9 9 119 Other - 6 3 68 48 -266 87 -114 - 2 3 73 96 82 76 3 87
},060 277 445
179 380
228 92 61
395 106 137 31
456 202
27,320 2,954 4,953
2,196 6,736
2,603 1,136 640
3.555 801
1.510 448
4,376 2,042
Digitized for FRASER http://fraser.stlouisfed.org/ Federal Reserve Bank of St. Louis
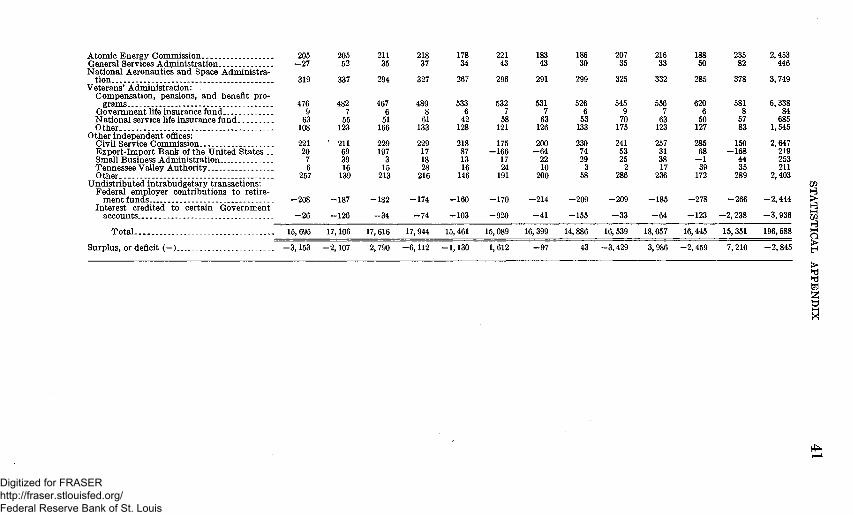
Atomic Energy Commission 205 205 211 218 178 221 183 186 207 216 188 235 2,453 General Services Administration -27 62 36 37 34 43 43 30 35 33 50 82 446 National Aeronautics and Space Administra
tion 319 337 294 327 267 296 291 299 325 332 285 378 3,749 Veterans' Adininistration:
Compensation, pensions, and benefit programs 476 482 467 489 533 532 531 526 545 656 620 581 6,338
Govemment Ufe insurance fund 9 7 6 8 6 7 7 6 9 7 6 8 84 National service Ufe insurance fund 63 55 51 61 42 58 63 53 70 63 60 67 685 Other 108 123 166 133 128 121 126 133 175 123 127 83 1,546
Other independent offices: CivU Service Conimission 221 ' 211 229 229 218 175 200 230 241 257 285 150 2.647 Export-Import Bank of the United States... 20 69 197 17 87 -166 -64 74 53 31 68 -168 219 Small Business Administration 7 39 3 18 13 17 22 29 26 38 - 1 44 253 Tennessee Valley Authority 6 16 15 28 16 24 10 3 2 17 39 35 211 Other. - 257 139 213 216 146 191 200 58 286 236 172 289 2,403
Undistributed intrabudgetary transactions: Ui Federal eraployer contributions to retire- H
ment funds -208 -187 -182 -174 -160 -170 -214 -209 -209 -185 -278 -266 -2.444 > Interest credited to certain Government 2
accounts -26 -126 -34 -74 -103 -920 - 4 1 -155 - 3 3 -64 -123 -2,238 -3.936 go
O Surplus, or deficit ( - ) -3,153 -2.107 2.790 -6,112 -1.130 1,612 -97 43 -3,429 3,986 -2,459 7,210 -2,846 ^
> hj fej
Total 15,695
-26
15,695
-126
17,106
-34
17, 616
-74
17,944
-103
15,461
-920
16,089
-41
16.399
-155
14, 886
-33
16, 639
-64
18,057
-123
16,445
-2, 238
16,351
-3. 936
196. 588
rf^
Digitized for FRASER http://fraser.stlouisfed.org/ Federal Reserve Bank of St. Louis
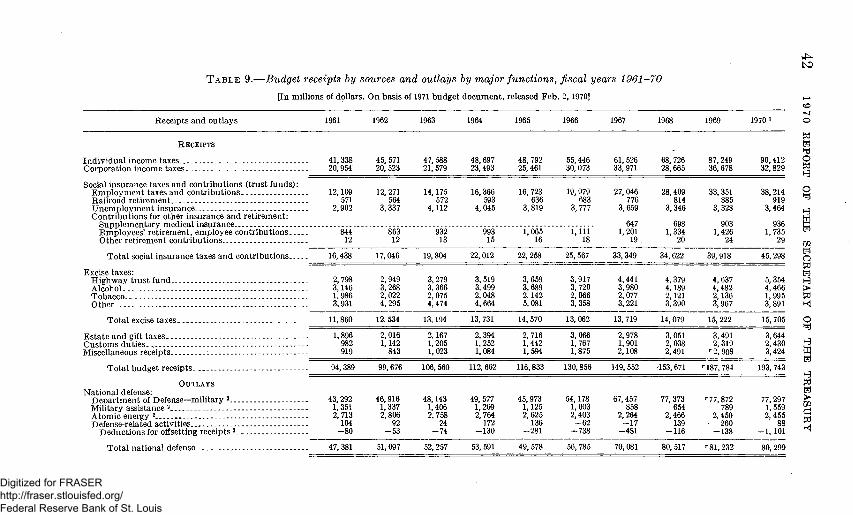
T A B L E 9.—Budget receipts by sources and outlays hy major functions, fiscal years 1961-70
[In mi lhons of dollars. On basis of 1971 budge t document , released F e b . 2, 197.0]
to
CO
td fej ^ O td
o
W fel
Ui fej O td fej
> td K|
o fej
W fej
td fej > Ui
td Kl
Receipts and out lays 1961 1962 1963 1965 1966
87,249 36. 678
33,351 885
3,328
903 1,426
24
39.918
4.637 4,482 2,136 3,967
1970 1
90,412 32.829
38,214 919
3,464
936 1,735
29
45,298
R E C E I P T S
Ind iv idua l income taxes 41,338 45,571 47,588 48.697 48,792 55,446 61,526 68,726 Corporat ion inconie taxes 20.954 20.523 21,579 23,493 25,461 30,073 33,971 28,665
Social insurance taxes and contr ibut ions ( t m s t funds): E m p l o y m e n t taxes and contr ibut ions 12.109 12,271 14,175 16.366 16,723 19,979 27.046 28.409 RaUroad re t i rement 571 564 572 593 636 683 776 814 U n e m p l o y m e n t insurance 2,902 3.337 4,112 4,045 3.819 3,777 3,659 3.346 Cont r ibu t ions for other insurance and re t i rement :
Suppleraentary raedical insurance 647 698 Employees ' r e t i r e r aen t , employee contr ibut ions 844 863 932 993 1.065 1,111 1,201 1,334 Other ret i reraent contr ibut ions 12 12 13 15 16 18 1 9 . 20
T o t a l social insurance taxes and contr ibut ions 16,438 17,046 19,804 22,012 22,258 25,567 33,349 • 34,622
Excise taxes: H i g h w a y t rus t fund 2,798 2,949 3,279 3,519 3,659 3,917 4,441 4.379 Alcohol 3.146 3,268 3.366 3,499 3,689 3,720 3,980 4,189 Tobacco 1,986 2,022 2,075 2,048 2,142 2.066 2.077 2.121 Other 3.931 4,295 4,474 4,664 5,081 3,358 3,221 3,390
T o t a l excise taxes
E s t a t e and gift taxes 1 Custoras d u t i e s . . Miscellaneous receipts .
To ta l budget receipts
O U T L A Y S Nat iona l defense:
D e p a r t r a e n t of De fense -mi l i t a ry 3 43.292 46.916 48.143 49,577 45.973 54.178 67,457 77,373 Military assistance 2 1.351 1.337 1,406 1,209 1,125 1.003 858 654 Atoraic energy 2 2,713 2.806 2.758 2,764 2,625 2,403 2,264 2,466 Defense-related activities 104 92 24 172 136 - 6 2 - 1 7 139
Deduc t ions for oflsetting receipts 3 - 8 0 - 5 3 - 7 4 - 1 3 0 - 2 8 1 - 7 3 8 - 4 8 1 - 1 1 6
T o t a l nat ional defense
5,354 4,466 1,995 3,891
11,860
1,896 982 919
94,389
12, 534
2,016 1,142 843
99,676
13.194
2,167 1,205 1,023
106, 560
13, 731
2,394 1,252 1,084
112, 662
14. 570
2,716 1,442 1,594
116,833
13, 062
3,066 1,767 1,875
130,856
13, 719
2,978 1,901 2,108
149, 552
14,079
3,051 2,038 2,491
453,671
15. 222
3,491 2,319
'•2.908
»• 187. 784
15, 705
3,644 2,430 3,424
193, 743
77,872 789
2,450 260
-138
77,297 1,559 2,456
88 - 1 . 101
47,381 51,097 52.257 53, 591 49, 578 56, 785 70, 081 80, 517 ^81,232 80, 299
Digitized for FRASER http://fraser.stlouisfed.org/ Federal Reserve Bank of St. Louis

In te rna t iona l aflairs and finance: Conduc t of foreign aflairs -- 216 Economic and financial assistance 1,877 Foreign inforraation a n d exchange activit ies 158 Food for Peace : . . 1.823
Deduc t ions for oflsetting receipts —716
T o t a l in ternat ional affairs a n d finance.
Space research a n d technology: Manned spacefl ight Space science a n d apphca t ion Space technology Aircraft technology Suppor t ing space activit ies
Deduct ions for oflsetting receipts
T o t a l space research a n d technology
Agricul ture a n d rura l developraent : F a r m incorae stabUization R u r a l housing a n d pub l ic facilities Agricul tural l and a n d water resources Research a n d other agricul tural services
Deduct ions for oflsetting receipts
T o t a l agr icul ture and rura l development
N a t u r a l resources: Water resources and power L a n d m a n a g e m e n t Mineral resources Recreat ional resources Other na tu ra l resources prograras
D e d u c t i o n s for oflsetting receipts
T o t a l na tu ra l resources
Commerce a n d t ranspor ta t ion : Air t ranspor ta t ion Water t ranspor ta t ion Ground t ranspor ta t ion Posta l service A d v a n c e m e n t of busmess Area and regional deve lopment Regula t ion of business
Deduct ions for oflsettmg receipts
T o t a l commerce a n d t ranspor ta t ion
Footnotes a t end of table .
248 2,325
197 1,947 - 2 2 6
346 1.968
201 2,040 - 4 4 1
296 1,756
207 2,049 - 1 9 1
347 2,041
223 1,852 - 1 2 3
315 2,329
227 1,784 - 1 6 5
336 3,057
245 1,452 - 5 4 2
354 3,053
253 1,204 - 2 4 5
371 2,420
237 975
- 2 1 7
398 2,231
235 937
- 2 3 4
3,367
279 249 87 51 79
(**) 744
2,343 335 347 344 -30
3,340
1, 395 428 28 146 71
-501
1, 568
716 569
2.656 914 127 188 67
-189
5,048
4,492
565 420 159 31 82
(**) 1,257
3,143 291 368 363 -42
4,123
1.578 382 30 151 84
-539
1.686
781 654
2,817 797 278 132 72
-123
5,408
4,115
1,516 576 303 36 122
(**) 2,552
4,060 375 324 415 -36
5.139
1,718 422 25 180 94
-934
1,505
808 672
3,057 770 212 242 82
• -99
5,743
4,117
2.768 754 432 40 178 - 1
4,170
4,134 326 325 441 -42
5,185
1.798 459 46 202 104
-637
1,972
835 658
3,686 578 218 538 91
-123
6,482
4.340
3,538 751 484 58 262 - 2
5,091
3,667 354 342 485 -42
4,807
1,867 609 59
215 119
-706
2,063
875 728
4,092 805 365 657 98
-156
7,364
4,490
4,210 778 435 75
435 - 1
6,933
2,636 309 347 531 -44
3,679
2.061 666 62
241 131
-1,016
2,035
879 708
4,043 888 310 315 99
-107
7,135
4.547
3,649 796 440 89 .
452 - 2
5,423
3,167 330 363 570 -44
4,376
2,158 618 73
285 136
-1,412
1,860
945 765
4.093 1,141 289 318 118
-115
7,564
4,619
3,096 700 410 128 390 - 3
4,721
4,542 474 351 618 -42
5,943
2,251 639 85 331 154
-1,758
1,702
961 844
4,367 1,080 395 472 98
-159
8,047
3,785
2,781 669 344 168 390 - 6
4,247
5,000 318 343 645 -85
6,221
2, 256 . 643
71 372 160
-1.373
2,129
1,042 864
4.413 920 99 584 107
-157
7,873
3,568
2.271 612 325 174 373 - 6
3,749
4,587 565 346 730 -41
6,187
2,245 754 94
370 177
-1,109
2,532
1.223 902
4,632 1,610 436 590 120
-152
9,261
Ui
H
Ui H O
> f >
fej ! O X
Digitized for FRASER http://fraser.stlouisfed.org/ Federal Reserve Bank of St. Louis
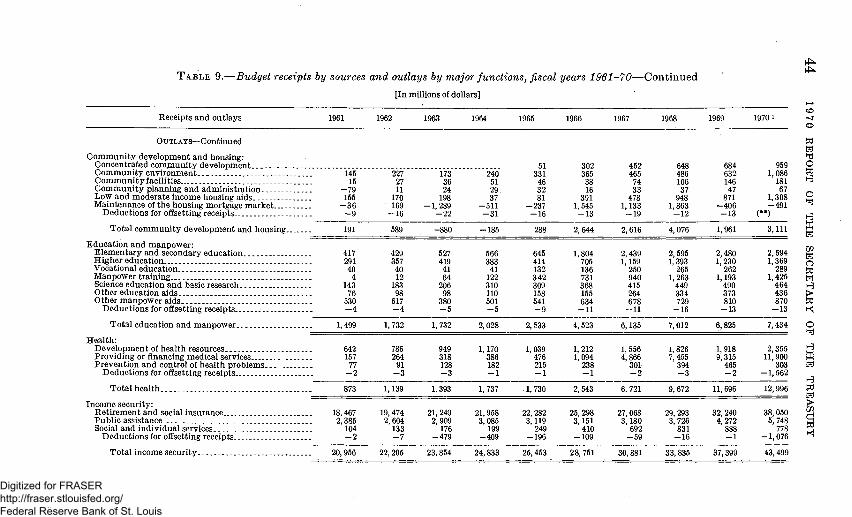
TABLE 9.—Budget receipts hy sources and outlays by major functions, fiscal years 1961-70—Continued
[In mffiions of doUars]
Receipts a n d out lays 1962 1963 1964 1965 1966 1967 1968 1969 19701
h4^
CO
o td' fej hj O td 1 ^
o fej
M fej
Ui fej o td fej
> td Kl
o fej
W fej
td fej > Ui d td Kl
0 UTL AYS—Continued
C o m m u n i t y deve lopment and housing: Concent ra ted c o m m u n i t y development C o m m u n i t y env i ronment 145 227 1 7 3 ' 240 C o m m u n i t y facilities 16 27 36 51 C o m m u n i t y p lanning and adin in is t ra t ion — 79 11 24 29 Low and mode ra t e income housing aids 155 170 198 37 Main tenance of t he housing mortgage m a r k e t —36 ' 169 —1,289 —511
Deduc t ions for oflsetting receipts —9 —16 —22 —31
T o t a l c o m m u m t y development and housing 191 589 -880 —185
E d u c a t i o n and m a n p o w e r : E l e m e n t a r y a n d secondary educat ion 417 429 527 566 H i g h e r educat ion 291 357 419 383 Vocational educat ion 40 40 41 41 Manpower t ra in ing 4 12 64 122 Science educat ion and basic research 143 183 206 310 Other educa t ion aids 76 98 98 110 Other m a n p o w e r aids 530 617 380 501
Deduc t ions for oflsetting receipts —4 —4 —5 —5
T o t a l educat ion and m a n p o w e r 1,499 1,732 1,732 2,028
H e a l t h : Deve lopraen t of hea l th resources 642 786 949 1,170 P rov id ing or financirig medical services 157 264 318 386 P reven t ion and control of hea l th problems 77 91 128 182
Deduc t ions for offsetting receipts —2 —3 —3 —1
T o t a l heal th 873 1,139 1,393 1,737
Income secur i ty : R e t i r e m e n t and social i n s m a n c e . 18,467 19,474 21,249 21,958 Pub l i c assistance 2,385 2,604 2,909 3,085 Social and ind iv idua l services 104 133 176 199
Deduc t ions for offsetting receipts
To ta l income secur i ty .
51 331 46 32 81
- 2 3 7 - 1 6
302 365 38 16
391 1,545
- 1 3
452 465
74 33
478 1,133
- 1 9
648 486 106 37
948 1,863
- 1 2
2,644 2,616 4,076
645 414 132 342 309 158 541 - 9
1,804 705 136 731 368 155 634 - 1 1
2,439 1,159
250 940 415 264 678 - 1 1
2,695 1,393
265 1,263 449 334 729 - 1 6
2, 533 4,523 6,135 7,012
1,039 476 215
1,212 1,094
238 - 1
1,556 4,866
301 - 2
1,826 7,455
394 - 3
. 1, 730 2,543 6,721 9,672
22, 282 3,119
249
25, 298 3,161
410
27,068 3,180
692
29, 293 3,726 831
684 632 146 47 871
-406 -13
1,961
2,480 1,230 262
1,193 490 373 810 -13
6.825
1,918 9,315 465 -2
11, 696
32.240 4,272
969 1,086 181 67
1,308 -491
(**) 3,111
2,594 1,369
289 1,425 464 436 870 - 1 3
7,434
2,366 11.900
-1,662
12,996
38,060 5.748
778 -2
20,956
-7
22, 205
-479
23,854
-409
24,833
-196
25,453
-109
28, 751
-69
30,881
-16
33,835
-1
37,399
-1,076
43,499
Digitized for FRASER http://fraser.stlouisfed.org/ Federal Reserve Bank of St. Louis
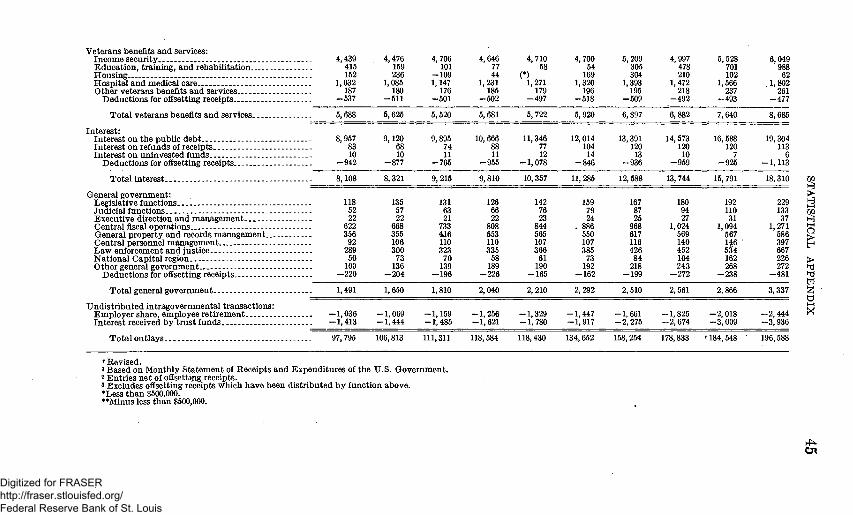
Veterans benefits a n d services: I ncome secur i ty 4,439 Educa t i on , t ra in ing, a n d rehabffitation 416 Hous ing 152 Hosp i t a l and medical care . 1.032 O ther veterans benefits and services 187
Deduc t ions for offsetting receipts —537
T o t a l ve terans benefits and services 5,688
In te res t : In te res t on t h e p u b h c deb t 8,967 In te res t on refunds of receipts 83 In te res t on un inves ted funds 10
Deduc t ions for oflsetting rece ip t s . . —942
T o t a l mteres t 8,108
Genera l g o v e m m e n t : Legislative functions 118 Judic ia l functions 62 Execu t ive dhec t ion a n d m a n a g e m e n t 22 Cent ra l fiscal opera t ions . . 622 General p roper ty a n d records m a n a g e m e n t 356 Cen t ra l personnel m a n a g e m e n t 92 L a w enforcement a n d jus t ice 289 N a t i o n a l Cap i t a l region 60 O t h e r general g o v e r n m e n t 109
Deduc t ions for oflsetting receipts —220
T o t a l general gove rnmen t
U n d i s t r i b u t e d in t ragovernmenta l t ransac t ions : E m p l o y e r share, employee r e t i r e m e n t In t e r e s t received b y t m s t funds
T o t a l o u t l a y s . 97,796
4,476 159 236
1,085 180
- 5 1 1
4,706 101
- 1 0 9 1,147
176 - 5 0 1
4,646 77 44
1,231 185
-602
4.710 58
(*) 1,271 179
- 4 9 7
4,700 64
169 1,320
196 - 5 1 8
5,209 305 304
1,393 195
- 5 0 9
4,997 478 210
1,472 218
- 4 9 2
6,625 6,520 5,681 6,722 5,920 6,897
9,120 68 10
- 8 7 7
74 11
-765
10, 666
11 - 9 6 6
11,346 77 12
- 1 , 0 7 8
12,014 104
14
13,391 120
13 - 9 3 6
14,573 120
10 - 9 5 9
8,321 9,216 9,810 10,357 12,588 13,744
136 67 22
668 355 106 300
73 136
-204
131 63 21
733 416 110 323
70 139
- 1 9 6
126 66 22
808 653 110 335
58 189
- 2 2 6
142 76 23
844 665 107 366
61 190
-165
169 79 24
. 886 550 107 385
73 192
- 1 6 2
167 87 25
968 617 116 426
84 218
- 1 9 9
180 94 27
1,024 569 140 452 104 243
- 2 7 2
5,528 701 102
1,666 237
- 4 9 3
7,640
16,688 120
7 - 9 2 5
15, 791
192 110 31
1,094 567 1^6 534 162 268
- 2 3 8
6,049 988
62 1,802
261 - 4 7 7
8,686
19,304 113
6 - 1 , 1 1 3
18,310
229 133 37
1,271 686 397 667 226 272
- 4 8 1
1,491
-1,036 -1,413
1,650
-1,069 -1,444
1,810
-1,169 -1,486
2,040
-1,256 -1,621
2,210
-1,329 -1,780
2,292
-1,447 -1,917
2,610
-1,661 -2,275
2,561
-1,825 -2,674
2,866
-2,018 -3,099
3,337
-2,444 -3,936
Ui
> M Ui > ^ I — l
O
> > hj hj fej 1^
106,813 111,311 118,584 118,430 134,652 158,254 178,833 '•184,648 196,588
••Revised. » Based on Month ly S t a t e m e n t of Rece ip ts a n d Expend i tu re s of t he U . S . G o v e r n m e n t . 2 En t r i e s n e t of oflsetting receipts . 3 Excludes oflsetting receipts wh ich h a v e been d i s t r ibu ted b y function above . *Less t h a n $500,000. **Minus less t h a n $500,000.
O l
Digitized for FRASER http://fraser.stlouisfed.org/ Federal Reserve Bank of St. Louis

TABLE 10.—Internal revenue collections hy tax sources, fiscal years 1936-70 ^ [In thousands of doUars. As reported by Internal Revenue Service, see "Bases of Tables" and Note]
Fiscal year
1936 1937 1938 1939..-. 1940 1941 1942.: 1943 . . 1944 1945. . . -1946 1947 1948 1949 1950 1951 1952 1953 1954 . . 1956 1956 1957 1958 1959 1960 „ 1961 1962 1963 1964 1965 - . 1966 1967 1968 . -1969 1970.
Income and profits taxes
Ind iv idua l income taxes 2
Wi thhe ld by
employers
686,015 7,823,435
10, 264, 219 9,857. 589 9,842, 282
11,533,577 10,055, 502 9, 888.976
13,089, 770 17, 929,047 21.132, 275 22,077,113 21. 253,625 24,015. 676 26. 727. 643 27.040.911 29.001.375 31.674, 588 32.977,654 36.246.109 38, 718, 702 39,258.881 36.840.394 42.811.381 50.620,874 67,300,546
^70,182,175 77,416, 070
Other
674.416 1,091.741 1.286.312 1.028,834
982,017 1.417,655 3,262,800 6,943,917
10,437, 570 8, 770,094 8,846,947 9, 601,015 9, 464, 204 7,996,320 7, 264,332 9,907, 639
11,345,060 11,403,942 10. 736, 678 10,396,480 11,321,966 12,302, 229 11, 627, 648 11. 733.369 13. 271.124 13,175, 346 14. 403,485 14, 268, 878 15,331.473 16.820.288 18.486,170 18.849,721 20.951,499 27,258.231 26, 235.615
To ta l indiv idual in
come taxes
674.416 1.091, 741 1. 286,312 1.028,834
982,017 1,417, 655 3.262,800 6, 629, 932
18. 261,005 19,034,313 18.704, 536 19,343, 297 20,997, 781 18.051,822 17,153,308 22,997,308 29. 274,107 32.536, 217 32,813,691 31, 650,106 35,337,642 39, 029, 772 38, 568, 559 40, 734, 744 44,945,711 46.153.001 60,649.694 52, 987, 581 64,590,354 63.660,683 61, 297.552 69.370,595 78,252.045
' 97, 440, 406 103, 651,685
Corporat ion income and profits
taxes 3
753,032 1.088.101 1,342,718 1,156, 281 1.147,592 2,053.469 4.744,083 9. 668,956
14, 766, 796 16,027, 213 12, 553, 602 9.676,459
10.174, 410 11. 553,669 10, 854, 351 14,387, 569 21. 466. 910 21. 694.515 21, 646,322 18,264, 720 21. 298, 522 21. 530, 653 20,533,316 18,091, 509 22,179, 414 21, 764,940 21,295,711 22,336,134 24,300.863 26.131,334 30,834.243 34,917,825 29.896. 520 38.337,646 35, 036, 983
To ta l income
and profits taxes 2
1,427,448 2.179.842 2. 629.030 2.186,114 2,129, 609 3.471,124 8,006,884
16,298,888 33, 027, 802 35,061, 626 31, 258,138 29,019, 756 31,172,191 29, 605,491 28,007, 659 37,384,878-50, 741, 017 54.130, 732 54,360, 014 49,914,826 66,636,164 60, 660, 425 59,101, 874 58,826, 254 67,125,126 67, 917, 941 71.945.305 75,323, 714 78,891,218 79,792.016 92.131, 795
104,288,420 108.148, 565
'135,778,052 138, 688, 568
E m p l o y m e n t taxes
Old-age and disabi l i ty insurance
taxes 3
207,339 602,918 529,836 605,350 687,328 895,336
1,131, 546 1, 290,025 1,307,931 1, 237,825 1, 458, 934 1, 612,721 1,687,151 1,873, 401 2,810, 749 3,584.025 3,816, 252 4, 218, 520 5, 339, 673 6,336,805 6, 634, 467 7, 733, 223 8,004. 356
10, 210, 550 11, 586, 283 11,686,231 13, 484, 379 15,667, 783 15.846, 073 19, 005,488 25,562,638 26,620,648 31,489,943 35,692,198
Unemploym e n t
insurance taxes
68,119 90,267
101,167 106,123 100, 658 119, 617 156,008 183,337 186,489 178, 745 185,876 208, 508 226, 228 223,135 236, 952 259,616 273,182 283,882 279, 986 324, 656 330,034 335,880 324,020 341.108 345, 356 457, 629 948, 464 860,858 622.499 567.014 602,745 606,802 640,030 776,139
RaUroad retiremen t
tax
48 287
149.476 109, 427 122.048 137.871 170,409 211,151 265, Oil 284, 758 284. 258 379, 655 560.113 562,734 548,038 679, 778 620, 622 628, 969 605, 221 600,106 634,323 616,020 575, 282 525,369 606, 931 570, 812 564,311 571, 644 693,864 635,734 683,631 792.858 858,448 938,684 980, 851
Tota l employ
m e n t taxes 2
48 266,745 742,660 740,429 833, 521 925,856
1,185,362 1.498, 705 1, 738,372 1, 779.177 1, 700,828 2,024,365 2,381, 342 2,476.113 2, 644, 575 3, 627, 480 4,464,264 4, 718,403 5,107,623 6, 219, 665 7, 295, 784 7, 580,522 8, 644,386 8,853, 744
11,158, 589 12, 502,451 12, 708.171 15, 004, 486 17.002, 604 17,104,306 20, 256.133 26,958,241 28,085,898 33,068,657 37,449,188
Capi ta l stock t a x *
94.943 137.499 139.349 127. 203 132. 739 166,653 281.900 328, 795 380, 702 371.999 352,121
1.597 1,723 6,138
266 (•)
(*) (*) (*) (*) (*) (S) (*)
[? (*) (*) (4) (<) (*) (^)
E s t a t e tax
218,781 281.636 382,175 332. 280 330,886 355.194 340,323 414,531 473.466 596,137 629. 601 708, 794 822, 380 735, 781 657, 441 638, 523 750, 591 784, 590 863,344 848,492
1,053,867 1, 253,071 1, 277,052 1, 235, 823 1, 439, 259 1, 745,480 1, 796.227 1, 971, 614 2.110,992 2,464.332 2.646.968 2,728,580 2, 710,254 3,136,691 3, 241, 321
Gift tax
160,059 23,912 34.699 28.436 29.185 51,864 92, 217 32,965 37. 745 46, 918 47, 232 70, 497 76, 966 60, 757 48. 785 91, 207 82, 556
106, 694 71, 778 87. 775
117.370 124.928 133,873 117.160 187. 089 170,912 238.960 215. 843 305.312 291,201 446,964 285,826 371, 725 393,373 438,755
Digitized for FRASER http://fraser.stlouisfed.org/ Federal Reserve Bank of St. Louis

Fiscal year
1936 -1937 1938 1939 ._ . . -1940 -1941 1942 . . 1943 1944 1945. 1946 -1947 1948 . -1949 1950 1951 1952 1953 '... 1964 1955 1956 1957 1958 1959 I960 1961 -1962 1963 1964 . 1965 1966 1967 1968 1969 1970
Excise taxes
Alcohol taxes»
DistiUed spir i ts«
222,431 274,049 260,066 283, 675 317,732 428, 642 674, 598 781,873 899, 437
1,484,306 1, 746, 580 1,686.369 1,436. 233 1,397.964 1,421.900 1, 746.834 1. 589, 730 1.846. 727 1,873, 630 1.870, 599 2,023,334 2,080.104 2,064,184 2,098,496 2,256. 761 2,276, 643 2,386.487 2, 467, 621 2.535,696 2,710,603 2,767,400 2,966,967 3,085,313
' 3,345, 601 3,446, 001
Beero
244,681 277.465 269.348 259. 704 264, 579 316, 741 366,161 456, 634 659,152 638,682 660, 824 661, 418 697, 097 686,368 667, 411 665,009 727. 604 762.983 769, 774 737, 233 765, 441 760, 620 757. 597 767.205 796, 233 795,427 813,482 825,412 887,560 905,730 887,319 940,622 969.670
' 1,003,354 1,076,148
Wines
8,968 6.991 5.892 6,395 8,060
11, 423 23,986 33,663 34,095 47.391 60.844 67,196 60,962 65, 782 72,601 67, 254 72,374 80. 536 78, 678 81.824 86, 680 87.428 90,303 90,918 98,850 96, 073 98,033
101.871 107, 779 110,163 110.284 121,489 125.340
'164.766 180.353
Other , including occupat ional taxes
29,484 36. 760 32.673 38,126 33,882 63.250 83. 772
152.476 126,091 139, 487 67. 917 70. 779 61,035 60. 504 57, 291 67, 711
159,412 90,681 60, 928 53.183 46, 219 45,143 44,377 45, 477 42, 870 44,757 43.281 46,853 46, 564 46,147 49.376 46, 646
117.014 ' 51.849
44,879
To ta l alcohol
taxes
505,464 594, 245 567, 979 587,800 624. 253 820.056
1,048, 517 1.423,646 1,618, 775 2,309. 866 2. 526.165 2,474, 762 2, 255,327 2, 210, 607 2, 219, 202 2, 546, 808 2, 649.120 2, 780, 925 2, 783,012 2, 742, 840 2, 920, 574 2,973,195 2,946, 461 3.002.096 3,193, 714 3,212,801 3,341,282 3,441, 656 3,677,499 3,772,634 3.814,378 4,075, 723 4.287,237
' 4.655.560 4,746, 382
Tobacco taxes«
Cigaret tes
425, 505 476,046 493.464 504.056 533,059 616. 757 704. 949 835.260 904,046 836, 753
1,072.971 1.145, 268 1. 208, 204 1, 232.736 1, 242,851 1. 293.973 1.474,072 1. 586, 782 1, 513, 740 1,504,197 1, 549,045 1.610.908 1,668, 208 1, 738,050 1,863. 562 1,923, 540 1,966.627 2, 010, 624 1,976.676 2,069,695 2,006,499 2, 023. 090 2,066,169 2,082.106 2.036.101
Cigars
12,361 13,392 12,882 12,913 12,995 13, 514 14, 482 23,172 30, 259 36,678 41, 454 48,354 46. 762 46.590 42.170 44,275 44,810 46,326 46, 618 46. 246 45,040 44,858 47,247 51,101 60,117 49,604 49,726 50,232 66.309 60.923 57.662 55, 736 64.937
r54,220 66,834
Other
63,299 62,816 61, 846 63,190 62,464 67. 805 61, 551 65, 425 54.178 58,714 51,094 44.146 45,325 43.650 43.443 42.148 46,281 21,803 20, 871 20,770 19, 412 18, 283 18,566 17, 666 17, 826 17,974 19.483 18,481 19,561 17,976 9.796 1,043 1.181
f 1,259 1,277
To ta l tobacco
taxes, etc.
501,166 562, 254 668,182 580,159 608, 518 698,077 780,982 923,857 988,483 932,145
1,165, 619 1, 237, 768 1, 300, 280 1,321, 875 1, 328,464 1,380,396 1, 565,162 1, 654,911 1, 580, 229 1. 671, 213 1, 613,497 1,674,050 1, 734,021 1, 806,816 1, 931, 504 1,991,117 2,026,736 2, 079,237 2, 052, 546 2,148,694 2, 073,956 2,079,869 2,122,277
' 2,137,585 2, 094, 212
Documen t s , other ins t rum e n t s , and
playing cards^
68,990 69,919 46,233 41,083 38,681 39, 057 41 702 45.156 50 800 65,528 87,676 79,978 79, 466 72,828 84, 648 93,107 84, 995 90 319 90, 000
112 049 114,927 107, 546 109 452 133.817 139 231 149, 350 169.319 149,069 171,614 186.289 146.457
68,260 48,721
1.455 220
Ui
> H-l Ui
>
fej
Footnotes at end of tables t4^
Digitized for FRASER http://fraser.stlouisfed.org/ Federal Reserve Bank of St. Louis

TABLE 10.—Internal revenue collections hy tax sources, fiscal years 1936-70 '—Continued [In thousands of dollars]
Fiscal year
1936 1937 1938. .— J939 1940 1941 1942 _ 1943 1944 1946 *.. 1946 1947 1948 1949 1950 1951 1952 1953 1954 1965 1966 1957 _ 1958 1959 1960 1981 1962 1963.. 1964 1965 1966 1967- . . 1968 1969 1970
Excise taxes—Cont inued
Manufac tu re r s excise taxes
Gasolhie
177,340 196,633 203,648 207,019 226,187 343,021 369,587 288,786 271,217 405,563 405,695 433,676 478.638 603,647 634,270 588,647 734,715 890,679 836,893 954, 678
1,030,397 1,458, 217 1,636,629 1,700,253 2,015.863 2,370, 303 2,412,714 2,497,316 2,618,370 2,687,135 2,824,189 2,932,894 3.030,792 3,186.239 3.430, 076
Lubr ica t ing oUs.
27,103 31,463 31,666 30,497 31,233 38,221 46,432 43,318 52,473 92,865 74,602 82,015 80,887 81,760 70,072 77,639 73,746 73,321 68,029 69,818 74,584 73,601 69,996 73,685 81,679 74,296 73,012 74,410 76,316 76,095 90.776 92, 573 92.311 97.476 87,510
Passenger au tomobiles a n d
motorcycles '
48,201 66,265 43,365 42,723 59,351 81,403 77,172
1,424 1,222 2,558
25,893 204,680 270,958 332,812 452,066 653,363 678,149 785,716 867,482
1,047,813 1,376,372 1,144,233 1,170,003 1,039,272 1,331.292 1. 228,629 1,300,440 1, 659, 510 1,745,969 1, 887,691 1,492,225 1,413,833 1,530,777 1,863.966 1,753,327
Au tomobUe
t m c k s a n d
busses
7,000 9,031 6,697 6,008 7,866
10,747 18,361 4,230 3,247
20,847 37,144 62,099 91,963
136,797 123,630 121, 285 147,446 210,032 149,914 134,805 189, 434 199,298 206,104 215, 279 271,938 236,659 257, 200 303,144 350,946 426,361 460,069 468,910 447,743 589,304 669,986
P a r t s a n d acces
sories for au to
mobUes*
7,110 10,086 7,989 7,935
10,630 13,084 28,088 20,478 31,551 49,440 68,871 99,932
122,951 120,138 88,733
119,475 164,136 177,924 134,769 136,709 145,797 157,291 166,720 166,234 189,476 188,819 198.077 224, 507 228,762 262,874 196,546
34, 640 76.226 81,387 84,069
T h e s , t ubes ,
a n d t read m b b e r
32,208 40,819 31,567 34,819 41,556 51,054 64,811 18,345 40,334 75,257
118,092 174,927 159,284 160,899 151,795 198,383 161,328 180,047 152. 567 164,316 177,872 261, 454 259,820 278,911 304,466 279,572 361, 562 398,860. 411,483 440,467 481,803 503, 753 489,139 631,627 614,795
Bushiess a n d store
machines "
6,972 6,461 3,760
10,120 15,792 25,183 32,707 33,344 30,012 44,491 48,515 50,259 48,992 57,281 70,146 83,175 90,658 93,894 99,370 98,305 81,719 74,845 71,867 74,426 6,745 - 4 6 1
10 - 2 5
- 1
Refrigerators ,
freezers, air-con
dit ioners, etc . 11
7,939 9,913 8,829 6,958 9,954
13,279 • 16,246
5,966 2.406 1.637 9,229
37, 352 58,473 77,833 64,316 96, 319 67,970 87,424 75,059 38,004 49,078 46,894 39,379 40,593 60,034 55,920 64,638 61, 498 62,799 75,987
137 - 2 , 650
436 31
- 3 0
Rad io a n d television re-celvhig sets a n d phonographs , pa r t s 10
6,075 6,754 5.849 4,834 6,080 6,935
19,144 6,661 3,402 4,753
13,386 63,866 67,267 49,160 42,086
128,187 118, 244 159, 383 135, 535 136,849 161,098 149,192 146,422 152,566 169,461 148.989 173,024 184, 220 197,695 221,769
I* - 3 , 7 6 1 1* - 1 , 3 2 9
697 - 1 2 9
- 5
Electr ic , gas, a n d
oU appliances i "
17,702 6,913 6,027
12,060 25,492 65,608 87,858 80,935 80,406
121,996 89,544
113,390 97,415 50,859 71,064 75,196 61,400 62,373 69,276 64,483 66.436 68,171 77,576 80,983 6,367 - 7 5 8
236 12
- 9 4
Elec t r ica l energy
33,576 35,975 38,455 39,859 42,339 47,021 49,978 48,705 61,239 67,004 69,112 63,014 69,701 79,347 86,704 93,184 53.094 (13) (13) (13) (13) (13) (13) (13) (13) (13) (18) (13) (13) (13) (13) (13)
l (13)
All o ther 12
37,165 44,744 39,188 16,323 11,957 12,609 57,406 54,659 37,584 50,406 69,365
113,062 128, 648 124,860 112,966 140, 706 122,069 134,613 122,488 93,883
110,171 123,374 127,004 135,728 152, 285 160.828 154,129 163,827 178.861 195,358 69,773 36,941 45,706
'51 ,367 53.427
T o t a l manufacturers
excise taxes
382,716 450,581 417,152 396,975 447,162 617,373 771,898 604,746 503,462 782,611 922,671
1,425,395 1,649,234 1.771, 533 1,836,053 2,383, 677 2,348,943 2,862,788 2,689.133 2,886,016 3,456,013 3,761,925 3,974,135 3.958, 789 4,736,129 4.896,802 6,132,949 6, 610,309 6,020,643 6,418,145 6,613,869 6,478,347 5,713.973
' 6,601,146 6,683.061
QC
fej
O SJ
o fel
fej
i fej
> Hi
o fej
fej
fel • >
Digitized for FRASER http://fraser.stlouisfed.org/ Federal Reserve Bank of St. Louis
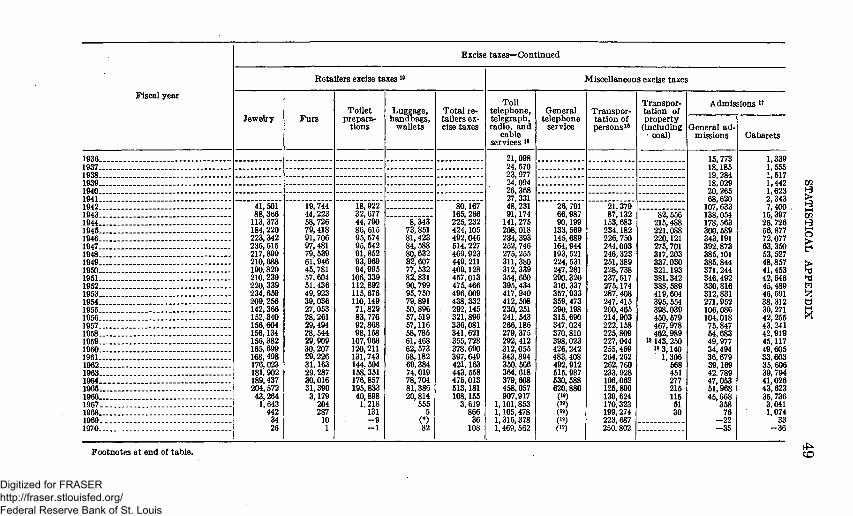
Fiscal year
1936 1937 1938 1939 1940 1941 1942 1943 1944 1945. . . -1946 1947 1948 1949 . . 1960 1951 1952 1963 1954 1955 1966 1957 1958 1959 1960 1961 1962 . -1963 1964 1965 1966 1967 1968 1969 1970
Footnotes a t end of table .
Excise taxes—Cont inued
RetaUers excise taxes i°
J e w e k y
41,501 88,366
113,373 184,220 223,342 236,615 217,899 210,688 190,820 210,239 220.339 234,659 209,256 142,366 152.340 156,604 156,134 156,382 165,699 168,498 176,023 181, 902 189,437 204,572
43,264 1,643
442 34 26
F u r s
19,744 44, 223 58,726 79,418 91,706 97,481 79, 539 61,946 45,781 57,604 51,436 49,923 39,036 27,053 28, 261 29,494 28,544 29,909 30,207 29,226 31,163 29,287 30,016 31,390
3,179 204 287
10 1
ToUet prepara
t ions
18,922 32,677 44,790 86,616 95,574 96,542 91,862 93,969 94,995
106,339 112,892 115,676 110,149 71,829 83,776 92,868 98,168
107,968 120,211 131,743 144. 594 158,361 176,857 196.833 40.898
1,218 131 - 9 - 1
Luggage, handbags ,
wallets
8,343 73,851 81,423 84,588 80,632 82,607 77,632 82,831 90,799 95,750 79,891 50,896 57,619 67,116 58,785 61,468 62, 573 68,182 69,384 74,019 78,704 81,386 20,814
555 5
(*) 82
To ta l retaUers excise taxes
80,167 165,266 225.232 424.105 492,046 614,227 469.923 449, 211 409,128 457,013 475,466 496,009 438,332 292,145 321.896 336,081 341,621 366,728 378,690 397,649 421,163 443, 558 476,013 513,181 108.155
3,619 866
36 108
Toll te lephone, te legraph, radio , and
cable services "
21,098 24, 570 23,977 24,094 26,368 27,331 48, 231 91,174
141,276 208,018 234,393 252, 746 275,265 311,380 312,339 364,660 395,434 417,940 412,508 230,251 241, 543 266.186 279,375 292,412 312.056 343,894 350, 666 364. 618 379,608 458.057 907.917
1,101,853 1,106.478 1.316,378 1.469,562
Miscel laneous excise taxes
General te lephone
service
26,791 66,987 90,199
133,669 145, 689 164,944 193, 521 224, 531 247, 281 290,320 310,337 357,933 359,473 290,198 316,690 347,024 370,810 398,023 426,242 483, 408 492, 912 616, 987 630,688 620,880
(19) (19) (19) (19) (19)
Transpor ta t ion of p e r s o n s "
21,379 87,132
153,683 234,182 226,750 244,003 246,323 251,389 228,738 237, 617 276,174 287,408 247,416 200,465 214,903 222,158 225,809 227,044 255, 469 264, 262 262, 760 233, 928 106,062 125,890 139,624 170,323 199,274 223,687 250, 802
Transpor ta t ion of p rope r ty
( inc ludmg • coal)
82,556 215,488 221,088 220,121 275,701 317,203 337,030 321,193 381,342 388,589 419,604 395, 554 398,039 450,679 467, 978 462,989
" 143,250 " 3 , 1 4 0
1,306 668 451 277 216 115 61 30
Admissions "
General admissions
16,773 18,185 19,284 18,029 20,266 68,620
107,633 138,054 178,563 300,689 343,191 392,873 386,101 386,844 371,244 346,492 330,816 312,831 271, 952 106,086 104,018 75,847 64,683 49,977 34, 494 36,679 39,169 42, 789 47,063 51,968 45,668
358 76
- 2 2 - 3 6
Cabare t s
1,339 1,556 1,617 1,442 1,623 2,343 7,400 .
16,397 26,726 66,877 72,077 63,350 53,527 48,857 41,453 42,646 46,489 46,691 38,312 39,271 42,256 43,241 42,919 45,117 49,606 33.603 36,606 39, 794 41,026 43,623 36.736 3.041 1,074
33 - 3 6
Ui H > H Til H H-l
fe hi fej V, o t\
CO
Digitized for FRASER http://fraser.stlouisfed.org/ Federal Reserve Bank of St. Louis

TABLE 10.—Internal revenue collections hy tax sources, fiscal years 1936-70 ^—Continued [IQ thousands of dollars]
Fiscal year
1936 1937 1938. - -1939 1940 1941 . . 1942 1943 . - -1944 1945- - . 1946 1947 . . -1948 1949 1950- . . 1951 . 1 9 5 2 . . . 1953 1 9 5 4 . . . 1955 1 9 5 6 . . . 1957 1958 1959 1960 1 9 6 1 . . . 1962—-1963 . . . 1964 1965 1966.— 1967 1968 1969 . . . . . 1970. . .
Excise taxes—Cont inued
MisceUaneous excise taxes—Continued
C l u b dues a n d initia
t ion fees
6,091 6,288 6,551 6,217 6,335 6,583 6,792 6,520 9,182
14,160 18,899 23.299 25,499 27.790 28,740 30,120 33,692 36,829 31,978 41,963 47,171 64,236 60,338 64,813 67,187 64,357 69, 452 71, 097 75,120 79,671 52. 571
1,825 1,536 1,040
206
Sugar
30,569 65,414 68,145 74,835 68,230 53,552 68,789 73, 294 66,732 59,152 71, 247 76,174 71,188 80,192 78,473 78,130 74,477 78,512 82.894 86,091 85,911 86,378 89,856 91, 818 96,636 99,903 95,411 97,109
102,932 104,203 102,270 108,191 113, 309
Diesel and special motor fuels 20
7.138 16,091 17,969 22,692 24,464 39,454 46,061 62,528 71.869 88,856
105,178 113.012 128,079 152,188 159,326 182,147 201,918 224,657 257,712
Use tax on h ighway motor ve
hicles weighing
over 26,000 lbs . 20
27,163 33,117 32,532 38,333 45,675 79, 761 99, 481
100,199 102,038 104,240 108,178 108,918 124,273 136,086
AU other 21
44,656 46,964 49,410 46,900 43,171 45,143
131,461 192,460 193,017 188,700 172,249 75,176 88,035 89,799 98,732 79,210 82,430 88.708 86,889 85.156 84,981 89,132 79,316 43,879 38,588 43,767 37,651 38, 596 43.206 54,447 55. 236 60.083
138.269 149, 309 115,615
Total misceUaneous
excise taxes
88,957 97.561
131,307 162,096 166,907 224.855 417,916 734,831
1.076,921 1,430.476 1.490.101 1,561. 245 1.655.711 1,752,792 1.720.908 1.842.598 1,947.472 2,061,164 1,936,527 1,492,633 1, 608,497 1,718,509 1,741,327 1,435,953 1,386,829 1,497,526 1, 670,258 1, 619, 656 1,646,631 1,786, 056 1,603,364 1,732.062 1,858,843 2,147,547 2, 342, 222
Unclassified excise taxes 22
114,687 -31 ,209
66,237 -32 ,749
66,351 99,644
- 8 0 , 9 4 3 101, 468 66,251
106,387 - 3 2 , 1 1 9
37.933 675,867 288,480
'199,458 38,059
Total excise taxes
1,547.293 1,764,661 1,730,853 1,768,113 1,884,512 2,399,417 3,141,183 3,797,503 4,463,674 5,944,630 6,684,178 7,283.376 7,409,941 7,578,846 7,598,405 8,703,599 8,971,158 9,946,116 9, 517, 233 9, 210,582
10,004,195 10,637,544 10,814,268 10,759,549 11,864,741 12,064,302 12,762,176 13, 409, 737 13,950, 232 14,792,779 13,398,112 14.113, 748 14.320,396 15, 542,787 15,904, 264
Taxes not otherwise classified
23 71,637
2*7,362 2* 5,269
2* 15,482 2*7,024 2* 5,444
Grand total
3.520.208 4,653,195 6,658,765 6,181,574 6,340,452 7,370,108
13,047,869 22,371,386 40,121,760 43,800,388 40,672,097 39,108,386 41,864,542 40,463,125 38,957,132 50,445, 686 65,009,688 69,688,536 69.919,991 68,288,692 75.112,649 80.171,971 79,978,476 79,797,973 91,774,803 94,401,086 99, 440, 839
106, 925,396 112.260,257 114.434,634 128,879,961 148,374,816 153.636,838 187, 919,560 195, 722,096
o
fej
o
o fej
fej
Ui fej O ^ fej
>
o fej
fej
1 ^
fej > Ui
Digitized for FRASER http://fraser.stlouisfed.org/ Federal Reserve Bank of St. Louis

*Less than $500. ' Revised 1 For figures for 1863-1915, see 1929 annual report, p. 419: for 1916-28, see 1947 annua
report, p. 310; and for 1929-35, see 1963 report, p. 486. 2 Withheld income taxes and old-age insurance taxes on employees and employers
have been deposited in Treasury without separation as to type of tax since December 1950; since December 1956. disabiUty insurance taxes, and since June 1965, hospital insurance taxes have been deposited in the same way. For the same periods, the old-age insurance and disability insurance taxes on the self-employed have been combined with "Income taxes other." The distribution of amounts of these taxes by type is based on estimates made by the Secretary of the Treasury in accordance with provisions of sec. 201(a) of the Social Security Act, as amended (42 U.S.C. 401(a)). "Individual incorae taxes withheld" by employers, 1951-56, include amounts subsequently transferred to the Government of Guam, under the provisions of the act approved Aug. 1, 1950 (48 U.S.C. 1421h); since 1956 these amounts are excluded.
3 Beginning with 1952, includes the tax on business income of exempt organizations. Income tax on the Alaska Railroad was included untU repealed, eflective with taxable years ending after June 30, 1952.
* Repealed for years ending after June 30, 1945. 6 Beginning with 1954, includes taxes coUected in Puerto Rico upon products of
Puerto Rican manufacture coming into the United States. Tobacco taxes "other" repealed eflective Jan. 1,1966 (Public Law 89-44).
6 Through 1956, "DistUled spirits" included amounts collected by Customs on imports of both distiUed spirits and beer. Beginning with 1957, imported beer is included with "Beer."
^ Includes stamp taxes on issues, transfers, and sales of bonds, capital stock, and similar interest sales untU repealed eflective June 22, 1965 (Public Law 89-44) and taxes on silver bullion sales or transfers until repealed eflective June 5, 1963 (Public Law 88-36). Tax on foreign insurance policies (1 cent or 4 cents per $1 of premium) payable by return on and after Jan. 1, 1966 (Public Law 89-44 and Treasury Decision 6868). Deeds of conveyance, $100 to $500 55 cents; each additional $500 or fraction thereof, 55 cents, repealed eflective Jan. 1,1968 (Public Law 89-44).
8 Passenger automobiles, rate 10 percent through May 14, 1965; 7 percent for May 16, 1965-Dec. 31, 1965; 6 percent Jan. 1, 196fr-Mar. 15, 1966 (Public Law 89-44). Under the Tax Adjustment Act of 1966, rate restored to 7 percent eflective Mar. 16,1966 (Public Law 89-368). The rate was scheduled to drop to 2 percent on Apr. 1, 1968, but was continued at 7 percent to Apr. 30, 1968, by Joint Resolution (Public Law 90-285). Under the Revenue and Expenditure Control Act of June 28, 1968 (Public Law 90-364) the rate was restored, retroactively, to 7 percent. Motorcycles, repealed eflective Sept. 1, 1955 (Public Law 379).
• Parts and accessories for automobUes (except truck parts), repealed eflective Jan. 1, 1966 (Public Law 89-44).
10 Repealed, eflective June 22,1965 (Public Law 89-44). 11 Air conditioners, repealed, eflective May 15,1965; refrigerators and freezers, repealed
eflective June 22,1965 (Public Law 80-44). 12 Includes manufacturers excise taxes on jewelry (1932, repealed by the Revenue Act
of 1936), furs (1932. repealed effective June 30, 1938), and toUet preparations (1939, repealed eflective Oct. 1, 1941); beginning 1942 includes manufacturers excise taxes on phonograph records, musical instruments, and luggage, repealed effective June 22,1966 (Public Law 80-44). The tax on phonograph records through 1941 was included in "Radio and television receiving sets and phonograph parts." See also footnote 21.
13 Repealed by Revenue Act of 1951. Collections for the years subsequent to 1952 are Included under "MisceUaneous excise taxes, AU other."
1* Negative figure stems primarUy from fioor stock credits taken on certain taxes repealed by the Excise Tax Reduction Act of 1965.
13 General and toU telephone and teletypewriter service reduced to 3 percent, effective Jan. 1, 1966. Private communications service, telegraph service, and wire equipment service, repealed, effective Jan. 1,1966 (Public Law 89-44). For general and toU telephone service and for teletypewriter exchange service, the rate of tax on amounts paid on bills first rendered on or after Apr. 1,1968, for services rendered after Jan. 31,1966, is increased from 3 percent to 10 percent ofthe amount paid (Public Law 89-368). For general and toU telephone service and for teletypewriter exchange service, the rate of tax was scheduled to be reduced from 10 percent to 1 percent on amounts paid on biUs first rendered on or after Apr. 1,1968. Public Law 90-285 continued the 10-percent rate to Apr. 30,1968; the Revenue and Expenditure Control Act of June 28, 1968 (Public Law 90-364) retroactively restored the 10-percent rate.
19 Rate of 10 percent repealed effective Nov. 16, 1962, except on air transportation which was reduced to 5 percent.
17 Repealed eflective noon Dec. 31, 1965. 18 Repealed effective Aug. 1, 1958 (26 U.S.C. 4292 note). 19 After fiscal 1965, included in "Toll telephone, telegraph, radio, and cable services." 20 Beginning with fiscal 1957, collections are applied in accordance with provisions
of the Highway Revenue Act of 1956, as amended (23 U.S.C. 120 note). 21 Includes certain delinquent taxes collected under repealed laws and various other
taxes not shown separately. 22 Includes undistributed depositary receipts and unapplied collections of excise
taxes. 23 Consists of agricultural adjustment taxes. 2* Beginnhig with 1955, includes unidentified and excess collections, and profits from
sale of acquhed property. UntU 1955, such amounts were included in "MisceUaneous excise taxes, AU other." For 1955-57, includes depositary receipts outstanding 6 months or more for which no tax accounts were identified.
NOTE.—These figures are from Internal Revenue Service reports of coUections. For years prior to 1955, they are not directly comparable to gross budget receipts from internal revenue; the differences in amounts occur because of differences in the time when payments are included in the respective reports. Through 1954, the payments were included in Internal Revenue Service collection reports after the returns to which they applied had been received in internal revenue offices. Beginnhig with 1955, tax payments are included in budget receipts when reported in the Account of the Treasurer of the United States.
Under arrangements begun in 1950, for withheld income tax and old-age insurance taxes and later extended to raUroad retirement taxes and many excises, these taxes are paid currently into Treasury depositaries and the depositary receipts, as evidence of such payments, are attached to quarterly returns to the Internal Revenue Service. Under this procedure, the payments are included in budget receipts in the month in >vhich the depositary receipts are issued to taxpayers.
Revised accounting procedures, effective July 1, 1954, extended this practice to Internal Revenue Service coUection reports, so that these reports include depositary receipts in the inonth in which they are issued instead of the month in which tax returns supported by the receipts are received in the directors' offices. It is not possible to make a complete classification of excise taxes paid into depositaries until the returns are received. Accordingly, the item "Unclassified excise taxes" includes the amount of "undistributed depositary receipts," i.e., the amount of depositary receipts issued, less the amount of depositary receipts received with returns and distributed by classes of tax, and beginning Jan. 1, 1968, amounts of Federal tax deposit forms purchased and not yet applied to taxpayers' liabilities;
Ui
GO
HH
o
>
>
fej
O l
Digitized for FRASER http://fraser.stlouisfed.org/ Federal Reserve Bank of St. Louis

52 19 70 REPORT OF THE SECRETARY OF THE TREASURY
TABLE 1.1.—Internal revenue collections and refunds hy States, fiscal year 1970 [In thousands of dollars]
Individual Corpora-States, etc. income and tion
employment income taxes taxes
Excise taxes
Estate and gift
taxes Total
collections Refunds of taxes
Alabama Alaska.. Arizona.. Arkansas. CaUfornia ^.. Colorado C onnecticut. Delaware ' . . Florida.. . Georgia • Hawaii . . . Idaho ^. -Illinois -. Indiana _ . Iowa... Kansas . . Kentucky . . . Louisiana . '... Maine Maryland i . . Massachusetts Michigan Minnesota . . : Mississippi...!... Missouri Montana. Nebraska Nevada New Hampshire... New Jersey New Mexico : . New York North CaroUna North Dakota Ohio Oklahoma. Oregon Pennsylvania Rhode Island South Carolina South Dakota. . . Tennessee Texas U t a h . . . . Vermont Virgi nia. Washington West Virginia Wisconsin : Wyoming. International 2 Undistributed:
Federal tax deposits 3. Transferred to Govern
ment of Guara.. . Withheld taxes of Federal
employees * Gasoline, lubricating oil,
and excess FICA credits ^
Unclassified.. • Clearing account for
Excise taxes—aviation fuel and oil—Air Force..
1,140,268 159,224 761,698 538,216
14,472,687 2,052, 891 2,670, 910
690.287 3,333,447 2,209,175
493.050 390, 262
10, 542. 928 3.601,856 1,283, 605 1,033,348 1,121,108 1,354,113
394,679 4,260,196 4.201,680 7,874.816 2,657, 691
516,058 3, 796,971
241,632 880.410 348,798 376,814
6,101,640 356,818
21,852,937 2,197,959
210,089 8,526,716 1,160,634 1,164,207 8, 991, 408
688,837 867, 070 208,609
1,585,723 6,096, 961
414,802 187,279
1,970,809 2,132,046
562,008 2,531,437
128, 590 695,759
-362,975
-11.140 .
16,965 .
174,958 14,651
100.134 89,888
2,441,238 205.215
. 600,288 522, 557 598,448 529,263 84, 519 59, Oil
2,957,159 630.780 264,438 174,037 315,212 246, 273 72,268 489.561 963,256
2, 906.496 712.009 90.670 876,748 35,297 153,167 58,532 55,281
1,473.501 32,651
8, 917,633 717,840 19,958
2,161.108 233.127 239, 544
1, 637,720 146,290 164,741 24, 583 329,379
1,184,342 • 71,948
26, 275 338,472 322,958 88,410 708,514 10,988 66,706
-319,482
102,017 2,743 6,275 30,746
1,198,719 176,601 123, 508 1,729
140,244 158,518 13,107 5,311
1,038,717 416,031 30, 322 34,082
1,193,913 68,904 7,989
361,880 284,972
2,407,959 128,186 40.038 376,596 3,623 77,250 13.031 2,796
494,654 7,937
1,466,258 1,196,819
6,230 962.276 309, 769 35.153 997,494 14,818 20, 736 6,470 47,451 843,724 15, 540 2,041
534,084 147,308 19, 581
227,644 16,463 85, 541
561 .
19,279 543
29,778 12,821 483,691 40,474 105,849 32,445 144,204 51, 568 12,322 4,493
271,129 52,659 34,322 32,603 42, 074 35,427 13,481 92,095 136.131 113,731 55,177 11,701 74,881 6,844 22,164 16,858 10,078 135,285 11, 557 627,603 52,037 4,753
179,055 29,476 24,434 214,271 22,020 17,314 4,395 34.196 156,361 4,637 11,078 48,431 48,221 12,183 64,733 3,172 16,044
426, 972 18,425
1,436,521 177,160 897,886 671,670
18.596,235 2,475,180 3,500,554 1,247.018 4,216,344 2,948, 525 602, 998 459,076
14,809,933 4,701,325 1,612,687 1,274,071 2, 672,306 1,704,717 488.416
5,203,730 5, 586,039 13,303,001 3,552,964 658,467
5,125,196 287,396
1,132,991 437,219 444,970
7,205,080 408,963
32,864,432 4,164,654 241,029
11,829,153 1. 733,006 1.463.337 11,840,894
871,965 1,069,860 244,057
1,996,748 8,281,389 506,926 226,674
2,891,796 2,650, 533 682,183
3,532,328 159,214 864,049
-11,140 .
16,965 .
445,397
161,905 30,704
. 116,864 76,686
2, 502,380 159,750 265,614 44,676 397,735 255,534 70, 577 42,755 932,185 339,610 145,141 122,879
• 155,786 201,367 55,117 396,870 453,348 767,597 263,609 89,193 337,106 36,947 80,964 54,223 50,072 569,066 55,686
1,868,772 229,152 23,495 868,998 139,828 144,574 895,217 70,182 112,833 24,917 182,523 676,058 72,828 24, 588 276,132 290,298 82,719 291,337 18,855 88,330
445,397 2,920
-91 -91
Total 6 141,100,773 35,036,! 7 15, 904,264 3,680, 076 195,722,096 8 16,075,187
Reversals by Service Center due to Individual Master FUe cancelled checks and undehverable refund checks:
North Atlantic Md-Atlantic Southeast Central Midwest.. . . Southwest Western
3,662 1,948
494 520
5,501 411 855
1 Includes the District of Columbia.
Footnotes continued on following page. Digitized for FRASER http://fraser.stlouisfed.org/ Federal Reserve Bank of St. Louis

STATISTICAL APPENDIX 5 3
2 CoUections from and refunds to U.S. taxpayers in Puerto Rico, Canal Zone, and in foreign countries. 3 Consists of amounts of Federal tax deposit forms purchased and not yet applied to taxpayers' liabilities
and the amounts of depositary receipts issued, less the amounts of depositary receipts received with returns and distributed by State.
* Net transactions in the clearing account on the central books of the Treasury for withheld income taxes from salaries of Federal employees.
6 Represents credits allowable on income tax retums for certain gasoline and lubricating oU tax payments and for excess social security payments under the Federal Insurance Contributions Act (FICA).
0 Includes $35.9 biUion transferred to the Federal old-age and survivors insurance trust fund, the Federal disability insurance trust fund, the railroad rethement accounts, the Federal hospital insurance trust fund, and the unemployment trust fund for benefit payments within the States.
7 Includes $5.8 bUlion gasoline and certain other highway user levies transferred to the high way trust fund for highway construction in States, in accordance with the Highway Revenue Act of 1956, as amended (23 U.S.C. 120 note). Also includes internal revenue collections made by Customs.
8 Includes reversals due to Individual Master FUe cancelled checks and undeUvered refund checks not obtainable by districts. Also, inclusive of the reimbursement of $425 mUhon to the general fund from the Federal old-age and survivors insurance trust fund, the Federal disabiUty insurance trust fund, the highway trust fund, and the Federal Unemployment Tax Act (42 U.S.C. 1101(b)(3) which is the estimated aggregate of refunds due on taxes coUected and transferred.
NOTE.—Receipts in the various States do not indicate the Federal tax burden of each since, in many Instances, taxes are collected in one State from residents of another State. For example, withholding taxes reported by employers located near State.Unes may include substantial amounts withheld from salaries of employees who reside in neighboring States. Likewise, payments of refunds within a State may not be applicable to the collections within that State since refunds are payable in the State of residence or principal place of business of the taxpayer which may not be the point at which coUections are made.
CoUections in fuU detaU by tax source and region are shown in the "Annual Report of the Commissioner of Internal Revenue" and in lesser detaU in the "Combined Statement of Receipts, Expenditures and Balances of the United States Government."
TABLE 12.—Deposits of earnings hy the Federal Reserve banks, fiscal years 1947-1970^
1947-67 1968 1969 1970 Cumulative through 1970
Boston.. $685,172,730.10 $105,990,752.07 $137,265,696.37 $162,919,883.84 $1,091,348,961.38 NewYork 3,360,752,590.52 546,576,692.12 79,318,676.37 826,779,619.71 6,413,427,678.72 Philadelphia... 749,043,955.33 107,445,523.86 137,452,015.24 170,361,653.04 1,164,303,147.47 Cleveland 1,098,345,432.81 158,885,949.73 204,006,197.16 256,565,959.16 1,717,803,538.85 Richmond 838,760,886.76 151,102,231.69 193,230,279.54 237,639,058.05 1,420,732,456.04 Atlanta 662,316,590.26 106,587,464.74 135,808,935.41 168,028,374.20 1,072,741,364.61 Chicago . 2,239,893,643.08 346,878,977.15 444,416,901.67 544,165,891.49 3.576,355,413.29 St. Louis 498,910,055.36 68,309,904.41 88,062,856.34 109,310,732.16 764,593,548.27 Minneapolis.... 267,998,857.94 38,818,624.66 48,513,473.72 59,401,493.66 414,732,449.98 KansasCity. . . 520,622.951.73 77,630,778.79 98,647,787.90 118,790,416.77 815,691,935.19 Dallas 488,119.460.61 84,302,647.89 109,898,436.62 138,154,190.56 820,474.735.68 SanFrancisco.. 1.580,802,013.31 298,417.990.46 384,902,922.87 473,783,004.08 2.737,905,930.72
Tota l . . . . 12,990,739,167.81 2.090,947,637. 67 2,661,524,078.10 3,265,900,276. 72 21,009, 111, 060.20
1 Through 1959, consists of approximately 90 percent of earnings of the Federal Reserve banks after payment of necessary expenses and statutory dividends, and after provisions for restoring the surplus of each bank to 100 percent ofsubscribed capital where it feU below that amount. Beginning in I960, pursuant to a decision by the Board of Governors of the Federal Reserve System, consists of all net earnings after dividends and after provisions for building up surplus to 100 percent of subscribed capital at those banks where surplus is below that amount and also of the araounts by which surplus at the other banks exceeds subscribed capital. Beginning in 1965, the surplus is maintained at the level of the paid-in capital instead of subscribed capital.
Digitized for FRASER http://fraser.stlouisfed.org/ Federal Reserve Bank of St. Louis
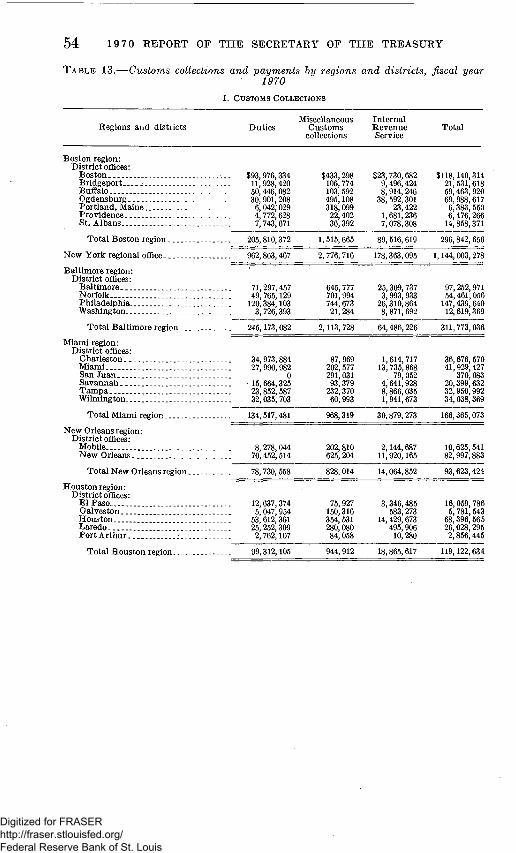
54 19 70 REPORT OF THE SECRETARY OF THE TREASURY
T A B L E 13.—Customs collections and payments by regions and districts, fiscal year 1970
1. CUSTOMS COLLECTIONS
Regions and districts Duties Miscellaneous
Custoras collections
Internal Revenue Service
Total
Boston region: District offices:
Boston . . . $93,976,334 Bridgeport ^ 11,928,420 Buffalo 50,446,082 Ogdensburg 30,901,208 Portland, Maine 6,042;029 Providence 4,772,628 St.Albans 7,743,671
Total Boston region 205,810,372
New York regional office 962,863,467
B altimore region: District offices:
Balt imore. . . . 71,297,457 Norfolk 49,765,129 Philadelphia 120,384,103 Washington . . . 3,726,393
Total Baltimore region 245,173,082
Miami region: District offices:
Charleston 34,973,884 Miami.. . 27,990,982 S an Juan 0 Savannah.. 15,664,325 Tampa 23,852,587 Wilmington. 32,035,703
Total Miami region
New Orleans region: District offices:
Mobile New Orleans
Total New Orleans region
Houston region: District offices:
El Paso 12,637,374 Galveston 5,047,954 Houston 53,612,361 Laredo.. 25,252,309 PortArthur . . : 2,762,107
Total Houston region 99,312,105
5433,298 106,774 103, 592 495,108 318,099 22,402 36,392
$23,730, 682 9,496,424 8, 914, 246
38, 592,301 23,422
1,681,236 7,078,308
$118,140,314 21,531,618 59,463,920 69,988,617 6,383, 550 6,476,266 14,858,371
1, 515,665 89,516, 619
2, 776,716
2,113, 728 64,486,226
296,842,656
178,363,095 1,144,003,278
645,777 701,994 744,673 21, 284
25,309,737 3,993,933 26,310,864 8,871,692
97.252,971 54,461,056 147,439,640 12,619,369
87,969 202, 577 291,031 93,379 232,370 60.993
1,614, 717 13,735,868
79, 052 4,641,928 8,866,035 1,941,673
36,676, 570 41,929,427
370,083 20,399,632 32,950.992 34,038,369
134, 517,481
8,278,044 70,452,514
78,730,558
968,319
202,810 625.204
828,014
30,879,273
2,144,687 11,920,166
14,064,852
166,365,073
10,625,541 82,997,883
93,623,424
75,927 150,316 354,631 280,080 84,058
3,346,485 583,273
14,429,673 495,906 10,280
16,059, 786 5,781, 543 68,396,565 26,028,295 2,856,445
944,912 18,865,617 119,122,634
Digitized for FRASER http://fraser.stlouisfed.org/ Federal Reserve Bank of St. Louis

STATISTICAL APPENDIX 55 TABLE 13.—Customs collections and payments hy regions and districts, fiscal year
1970—Continued I. CUSTOMS COLLECTIONS—Continued
Regions and districts Duties Miscellaneous
Custoras collections
Internal Revenue Service
Total
Los Angeles region: District offices:
LosAngeles . - . $241,334,913 Nogales.... 19,604,361 San Diego. 17.245,132
Total Los Angeles region 278,184,406
San Francisco region: District offices:
Anchorage 2,749,233 GreatFaUs 5,815,150 Honolulu 13,115,538 Portland, Oregon 31,852,053 SanFrancisco 104,955,496 Seattle 57,354,731
Total San Francisco region.. . 215,-842,201
Chicago region: District offices:
Chicago 108,104,472 Cleveland 43,467,643 Detroit 78,532,950 Duluth 8,430,686 Milwaukee. 9,079,534 Minneapolis 6,616,905 Pembina. 6,048,878 St. Louis. - 13,601,534
Total C hicago region 273,882,602
TotalaU regions. 2.494,316,274
$951, 592 62,242 318,212
$41,462,978 39,954 205,986
$283, 749,483 . 19, 706.557 17,769,330
1,332,046 41, 708, 918
1, 926,188 63,962, 758
264,260 276,671 228, 704 26,278 76.040 42,540 22, 224 40,869
43,944, 704 77,358,728 154,017,467
40,964 3,600,028 3,431,308
48,448 8,218,296
977,586 290,659,943
321.225,370
94,104 14,137 415,502 309,073 482,065 611,307
133,688 2,739
2,372,888 1,890,969 39,228,417 20,334,057.
2, 977,025 5,832.026 15.903,928 34,052.095 144,665,978 78,300.095
281.731.147
152,313,436 121.103.042 232.779,121 8.497.928 12, 755,602 10,090. 753 6,119.550 21.860,699
565,520,131
13,383,174 792,507,301 3,300,206,749
II . EXPENDITURES BY CUSTOMS
Region CoUections
total Excess duty
Payments
and similar Drawback refunds
Total
CoUections net
Expenses Cost to (net obli- collect gations) $100
Boston... $296,842,657 $2,660,822 N ew York 1,144,003,273 10,305,702 Baltimore 311,773,036 1,586,073 Miami 166,365,073 1,034,590 New Orieans.... 93,623,425 619,155 Houston 119,122,634 2,074,704 LosAngeles 321,225,370 2,611,180 San Francisco.. 281,731,150 2,502,285 Chicago.... 565,520,131 3,869,268 Unassigned. -3,273,832
Grand total---- 3,300,206,749 23,989,947 40,
$666,432 8,865,845 5,105.780 2,507,935
514,462 5,668,640 2,768,300 4,140,320 6,577,341 3,273,832
$3,327,254 $293,515,403 $13,245,467 19,171,547 1,124,831,726 34.271,350 6.691,853 305,081,183 7,263,922 3,542,525 162,822,548 7,968,698 1,133,617 92,489,808 3,617,089 7.743,344 111, 379,290 12,765,143 5,379,480 315,845,890 12,761,953 6.642,605 275.088.545 11,921,073
10,446,609 555,073,522 12,840,299 , 11,862,322 .
$4.51 3.05 2.38 4.89 3.91 n.46 4.04 4.33 2.31
64,078,834 3,236,127.915 128,517,316 3.97
Digitized for FRASER http://fraser.stlouisfed.org/ Federal Reserve Bank of St. Louis
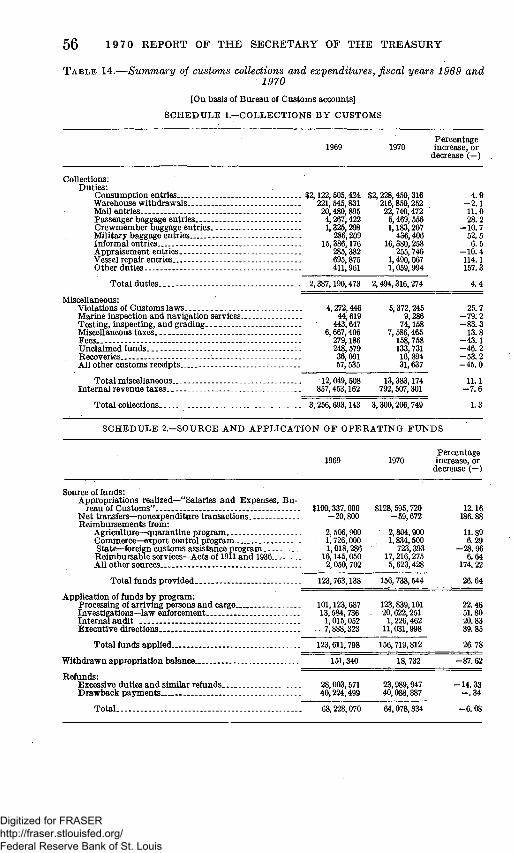
56 1970 REPORT OF THE SECRETARY OF THE TREASURY
T A B L E 14.—Summary of customs collections and expenditures, fiscal years 1969 and 1970
[On basis of Bureau of Customs accounts]
SCHEDULE l . -COLLECTIONS BY CUSTOMS
1969 Percentage increase, or
decrease (—)
$2, 228,450,316 216,850,252 22,740.472 5,469, 656 1,183,207
436,406 16,380,258
255,746 1,490,067 1,059,994
Collections: Duties:
Consumption entries $2,122,505,424 Warehouse withdrawals 221,545,831 MaU entries 20,480,895 Passenger baggage entries 4,267,422 Crewmember baggage entries 1,325.298 Military baggage entries 286,209 Informal entries 15,386,176 Appraisement entries 285.382 Vessel repair entries 695.876 Otherduties 411,961
Total duties 2,387.190,473
Miscellaneous: Violations of Customs laws 4,272,446 Maruie inspection and navigation services 44,619 Testing, inspecting, and grading 443,647 MisceUaneous taxes. 6,667,405 Fees -- - 279,186 Undahned funds : . 248,579 Recoveries . 36,091 All other custoins receipts.. 57,535
Total miscellaneous... 12,049,508 Internal revenue taxes. 857,453,162
Total coUections 3.256,693,143
2,494,316, 274
6,372,245 9,286
74.158 7, 586,465
158, 758 133,731 16, 894 31,637
13,383,174 792, 507,301
4.9 - 2 . 1 11.0 28.2
-10.7 52.5 6.5
-10.4 114.1 157.3
4.4
3,300,206,749
25.7 -79.2 -83.3
13.8 -43.1 -46.2 -53.2 -45.0
n.i - 7 . 6
L3
SCHEDULE 2 . - S 0 U R C E AND APPLICATION OF OPERATING FUNDS
1969 1970 Percentage increase, or
decrease (—)
Source of funds: Appropriations reahzed—"Salaries and Expenses, Bu
reau of Customs" $100,337,000 Net transf ers—nonexpenditure transactions — 20,800 Reimbursements from:
Agriculture—quarantine program 2,506,900 Commerce—export control program 1,726,000 State—foreign customs assistance program 1,018,286 Reimbursable services—Acts of 1911 and 1936.. 16,145,050 AU other sources 2,050,702
Total funds provided 123,763,138
Application of funds by program: Processing of arriving persons and cargo 101,123,687 Investigations—law enforcement 13,584,736 Intemal audit 1,015,052 Executive directions 7,888,323
Total funds applied 123,611,798
Withdrawn appropriation balance 151,340
Refunds: Excessive duties and similar refunds 28.003,571 Drawback payments 40,224,499
Total 68.228,070
$128, 595.720 -59,672
2,804.900 1,834.500
723,393 17,216,275 5,623.428
156, 738, 544
123,839.101 20,622.251 1,226.462
11,031.998
12.16 186.88
11. 89 6.29
-28.96 6.64
174. 22
26.64
22.46 51.80 20.83 39.85
156,719,812
18, 732
23,989,947 40,088.887
26.78
-87.62
64,078,834
-14.33 -.34
-6.08
Digitized for FRASER http://fraser.stlouisfed.org/ Federal Reserve Bank of St. Louis

STATISTICAL APPENDIX 57
TABLE 15.—Postal receipts and expenditures, fiscal years 1926-70
Year
Postal revolving fund as reported to the Treasury by the Post Office Department
Postal revenues
Postal expenditures i
Extraordinary expenditures as reported under act of June 9,1930
Other Surplus, or deficit (—)
Surplus revenue
paid into the Treasury 2
Advances from the
Treasury to cover postal deficiencies 3
1926 $659,819,801 1927 683,121,989 1928..- 693,633,921 1929 696,947,578 1930 705,484,098
1931 656,463,383 1932 588,171,923 1933 687,631,364 1934 686,733.166 1935 630,795,302
1936 665,343,356 1937 726,201,110 1938 728,634,051 1939........ 745,956,075 1940 766,948,627
1941 812,827,736 1942 859,817,491 1943 966,227,289 1944 1,112,877,174 1945 1,314,240,132
1946 1,224.572,173 1947. 1.299,141.041 1948 1.410,971,284 1949 1,671,851,202 1950 1,677,486,967
1951 1,776,816,354 1952 1,947,316.280 1953 2,091,714,112 1954 6 2,263,389.229 1955 6 2,336,667,658
1956 6 2,419.211,749 1957 6 2.547,589.618 1958 6. 2,583,459,773 1959 6 3,061,110.753 19608 3.334,343,038
19616. 3.482,961.182 1962 6 3.609,260,097 1963 6. 3,869,713,783 1964 6 4,393,516,717 1965 6 4.662,663,155
1966" 5,038.666.873 1967 6 5,326.427,981 1968 8 5,714.395.043 1969 8 7,273,101,703 1970 "1 8.080,151,078
•$679,792,180. 714,628,189 725,755,017 782,408,764
$39,669,718 764,030,368
48,047,308 754,482,265 53,304,423 740,418,111 61,691,287 638,314,969 66,623,130 564,143,871 69,537,252 627,066,001
68,585,283 685,074,398 51,587.336 721,228,506 42,799, 687 729,645,920 48.540,273 736,106. 665 53,331,172 754,401,694
68,837,470 73,916,128 122,343,916 126,639,650 116,198,782
100,246,983 92,198,225 96,222,339 120,118,663 119,960,324
104,895,553 107,209.837 103,445,741
(0 Q)
{->) (0 (8) (8) (8)
(8) (8) (8) (8) (8)
(8) (8) (8) (8) (8)
778,108,078 800,040,400 830,191,463 942,345,968
1,028,902.402
1,253,406,696 1,412,600,631 1. 591,683.096 2,029,203.466 2,102,988,758
2,236,603,513 2, 659,650.534 2.638.680.670 2,676,386,760 2,692.966,698
2,882,291,063 3,065,126,065 3,267,452,203 3.834.997.671 3,821,959,408
4,347,945,979 4,343,436.402 4,640.048. 550 4,971,215,682 6,467,205,453
5,926,862,604 6,467,613,482 6,793,911,210 6,362,768,003 6,670,127,625
-$19,972.379 * $39.506,490 -31,506,201 27,263,191 -32,121,096 32,080,202 -86,461,176 94,699,744 -98,215,987 91,714,451
-146,066,190 145,643,613 -206,650,611 202,876,341 -112,374,892 117,380,192 -44,033.835 62,003,296 -65,807,951 63,970,405
-88.316.324 86,038,862 -46,614,732 41,896,945 -43,811,556 44,258,861 -38,691,863 41,237,263 -40,784,239 40,870,336
-24,117,812 30,064,048 -14,139,037 18,308,869
13.691,909 14,620,875 43,891,556 $1,000,000 8—28,999,995
169,138,948 188,102,679 649,769
-129,081,506 160,572,098 -205,657, 715 12,000,000 241,787,174 -276,834,152 310,213,461 -577,470,926 524.297,262 -545,462,114 692,514,046
-564,582,711 624,169,406 -719.544,090 740,000,000 -660,412,299 660.121,483 -311.997,631 521,999,804 -356,299,040 285,261,181
-463,079,314 382,311,040 -517,536,447 516,602,460 -673,992.431 921,750,883 -773,886,918 605,184,335 -487,616,370 569,229,167
-864,984,797 824,989,797 -734,176,305 773,739,374 -770.334,767 817,693,516 -577,698,965 698,626.276 -804,642,298 764,090,520
-888,196,731 941.698,236 -1,141,185,501 1,174,402,607 -1.079,616,167 1,140.204,035
-920,333,700 1,133,664,184 -1,510,023,453 1,735,039,917
1 From 1927 to date includes salary deductions paid to and deposited for credit to the retirement.fund. 2. On basis of warrants-issued adjusted to basis of daily Treasury statements through 1947. 3 Advances tb the Postmaster General to meet estimated deficiencies in postal revenues, reduced by repay
ments from prior year advances. Excludes aUowances for offsets of extraordinary expenditures or the cost of free maUings. Figures are on basis of warrants-issued adjusted to basis of daily Treasury statements through 1953, and thereafter on basis of the central accounts of the U.S. Government maintained by the Treasury Department.
* Excludes $10,472,289 transferred to the civU service rethement and disabUity fund on account of salary deductions.
6 Repayment of unexpended portion of prior years* advances. 6 Transactions for 1954-70 are on the basis of cash receipts and expenditures as reported by the Post Offlce
Department. Reports of the Postmaster General are on a modffied accrual basis. 7 See letter of the Postmaster General in exhibits in annual reports prior to 1958. 8 Under the act of May 27,1958 (72 Stat. 143), the Postmaster General is no longer required to certify the
estimated amounts of postage that would have been coUected on certain free or reduced-rate mailings.
NOTE.—For figures from 1789-1925 see annual report for 1946, p. 419.
Digitized for FRASER http://fraser.stlouisfed.org/ Federal Reserve Bank of St. Louis

5 8 19 70 REPORT OF THE SECRETARY OF THE TREASURY
T A B L E 16.—Seigniorage on coin and silver bullion, J anua ry 1, 1935-June 30, 1970
Total seigmorage Potential seigniorage on coin (silver, on sUver bullion,
Fiscal year clad, and minor) and other raetals and on sUver at cost in Treasur-
buUion revalued er's account, end of fiscal year i
Jan. 1. 1935-June 30, 1964, cumulative • $2,408,931,105.43 2 $7, 520.617.15 1965 -.-- 116,996,658.41 6.560.393.72 1966 -- 648.804,126.79 950,051,328.32 1967 ---- 836,734,039.35 980,037,560.91 1968 .- - 383,141,339.00 759,844,047.56 1969 250,170,276.34 700,000,000.00 1970 274,217,884.01 N.A.
Jan. 1,1935-June 30, 1970, cumulative 4,918,995,429.33
1 Not cumulative, as coinage metals held by the Treasurer of the United States changes, the potential seigniorage changes. Potential seigniorage also changes depending on the denoraination of the coins manufactured.
2 Represents potential seigniorage as of June 30, 1964. N.A. Not available.
Federal Debt
I .—Outstanding
T A B L E 17.—Federal securities outstanding, fiscal years 1954-70
[Public debt securities on basis of daily Treasury statements; agency securities on basis of administrative accounts and reports]
Fiscal year PubUc debt Agency Total Federal securities i securities 2 securities
1954 $271,259,599,108 $963,466,000 $272,223,065,108 1955 274.374.222.803 1.559.271,536 275,933,494,339 1956 272,750,813,649 1,753,860,700 274,504,664,349 1957 270,527,171,896 2,893,571,362 273,420,743,258 1958 276,343,217,746 3,967,532,514 280,310,750,260 1959 284,705,907,078 5,040,084,860 289,745,991.938 1960 286.330,760,848 6,769.552,937 293.100.313.785 1961 288,970.938,610 6,477,251,272 295,448,189,882 1962 298,200.822,721 7,927,356,819 306,128,179,540 1963 305,859,632,996 8,123,100,192 313,982,733,188 1964 - 311,712,899,257 8,631,287,094 320,344,186,351 1965 - 317,273,898,984 9,335,416,039 326,609,315,023 1966 - -- 319,907,087,795 13,376,757,266 333,283,845,061 1967 326,220,937,795 18.455.326.671 344,676,264,466 1968 347,578,406.426 24,399,459,289 371,977,865,715 1969 353,720,253,841 14.249,052,696 367.969,306.637 1970. 370,918,706.950 12,509.702.555 383,428,409,505
1 Includes certain securities not subject to statutory limitation. For amounts subject to limitation, see table 21.
2 For content see table 24.
Digitized for FRASER http://fraser.stlouisfed.org/ Federal Reserve Bank of St. Louis

STATISTICAL APPENDIX 59 T A B L E 18.—Federal securities held by the public, fiscal years 1954-70
[On basis of "Monthly Statenient of Receipts and Expenditures of the United States Government"]
Fiscal year Federal
securities i
Deduct
Investments of Government
accounts Special notes ^
Held by the public
Total Per capita 3
1954. _ $272,223,065,108 $46,312,717,525 $1,411,000,000 $224,499,347,583 $1,382.46 1955.. 275.933,494,339 47,750,891,975 1.567,000,000 226,615,602,364 1,371.14 1956 274,504,664,349 50,536,857,948 1,742,000,000 222.225,806,401 1,321.03 1957.. 273.420.743,258 52,931,326,786 1,068.000,000 219.421,416,472 1,281.11 1958 280,310.750.260 53,329,411.492 618,000,000 226,363,338,768 1,299.89 1959. 289,745,991,938 52,763,955,039 1,979,250.000 235,002,786,899 1,325.72 1960.. 293,100,313,785 53,685,505,130 2.238,000.000 237.176,808.655 1,312.66 1961.. 295.448,189,882 54.290,602.525 2,553,652,200 238,603,935,157 1,298.48 1962.. 306,128,179,540 54,917,698,638 2,837,304,400 248,373,176,502 1,330.65 1963. 313,982,733,188 56,345,474,329 3,175,956,600 254,461,302,259 1,343.39 1964 320,344,186,351 59,209,859,460 3.581,261,000 257,553,065,891 1,340.58 1965. 326,609,315,023 61,540,352,558 3,455,000,000 261,613,962,465 1,344.42 1966. 333,283,845,061 64,783,929,484 3,809,500,000 264,690,415,577 1,344.24 1967 344,676,264,466 * 73,819,395,745 3,328,000,000 267,528,868,721 1,343.60 1968 371,977,865,715 * 79,139,566,850 2.209,000,000 290,629,298,865 1,444.82 1969 367.969,306.537 * 87,661.296,652 825,000,000 279,483,009,885 1,375.30 1970 383,428,409,605 97,723,153,576 825,000,000 284,880.255.929 ^ 1,386.91
p Preliminary. 1 For content see table 17. 2 Represents noninterest-bearing public debt secmities issued to the International Monetary Fund and
international lending organizations. 3 Based on the Bmeau of the Census estimated population. Through 1958 the estimated population is for
the conterminous United States, exclusive of Alaska, Hawaii, and the outlying areas, such as Puerto Rico, Guam, and the Virgin Islands. Beginning with 1959 the estimates include Alaska and, with 1960, HawaU.
* For content see table 20.
40)9-714—71-
Digitized for FRASER http://fraser.stlouisfed.org/ Federal Reserve Bank of St. Louis

60 19 70 REPORT OF THE SECRETARY OF THE TREASURY
TABLE 19.—Principal of the public, debt, fiscal years 1790-1970
[On basis of Pubhc Debt accounts from 1790 through 1915, and on basis of daily Treasmy statements frora 1916 to date, see "Bases of Tables" and Note]
D a t e
Deceraber 31— 1790. . . 1791 1792 1793 1794 1795 1796 1797 1798 1799 1800 1801 1802 1803 1804 1805 . . . 1 8 0 6 . . . . 1807 1 8 0 8 . . . . 1809 . . . 1810 1811-.
J u n e 30
1853 1854 1855 1856 1857 1858 1859 1860 . . . 1861 1862.. . 1863 1864. . . . 1865.. 1866 1867... 1868 1869 1870.. 1871 , 1872. 1873 , 1874... 1875 1876. 1877 , 1878 , 1879.. . 1880... 1881. . . 1882... 1883 1884.. 1885 1886.. 1887 1888 1889 1890.. , 1891. . . 1892 1893 1894 1895 1896 1897 1898 . 1899 1900 1901
To ta l gross D a t e T o t a l gross p u b h c debt publ ic deb t
Deceraber 31— . . . $75,463,477 1812. . . . 77,227,925 1813. . . . 80,368,634 1814. . . . 78,427,405 1815. . . . 80,747,587 1816. . . . 83,762,172 1817. . . . 82,064,479 1818. . . . 79,228,529 1819. . . . 78,408,670 1820. . . . 82,976,294 1821. . . . 83,038,051 1822. . . . 80,712,632 1823. . . . 77,054,686 1824.. . . . 86,427,121 1825-. . . 82,312,151 1826.. . . . 75,723,271 1827.. . . . 69,218,399 1828., . . . 65,196,318 . 1829.. . . . 57,023,192 1830.. . . . 53,173,218 1831.. . . . 48,005,688 1832.. . . . 45,209,738
Matu red deb t In te res t - ( Dn which bear ing i interest has
ceased
$59,642,412 . . . . 42,044,517
35,418,001 31,805,180 28,503,377 44,743,256 58,333,156 64,683,256 90,423,292
365,356,045 707,834,255
1,360,026.914 2,217,709,407 2,322,116,330 2,238,954,794 2,191,326,130 2.151,495,065 2,035,881,095 1,920,696,750 1,800,794,100 1,696.483,950 1,724,930.750 1.708.676,300 1,696,685,450 1,697,888,500 1,780,735,650 1,887,716,110 1,709,993,100 1.625,567,750 1,449,810,400 1.324,229,150 1,212.563,850 1,182,150,950 1,132,014,100 1,007,692,350
936,522,500 815,853,990 711,313,110 610,529,120 685,029,330 585,037,100 635,041,890 716,202,060 847,363,890 847,365,130 847,367,470
1,046,048,750 1,023,478,860
987,141,040
Footnotes a t end of tab le ;
$162,249 199,248 . 170,498 168.901 . 197,998 170,168 . 165,225 160,575 . 159,125 , 230,520 171,970 366, 629
2,129,425 4,435,865 1, 739,108 1,246,334 5,112,034 3, 569, 664 1,948,902 7. 926, 547
51,929,460 3,216,340
11,425,570 3,902,170
16, 648,610 5, 594, 070
37,015.380 7, 621,205 6,723. 615
16.260, 555 7,831,165
19, 655,955 4,100, 745 9, 704,195 6,114, 915 2.495,845 1, 911,235 1,815.555 1, 614, 705 2,785,875 2, 094, 060 1,851,240 1,721. 590 1, 636,890 1,346,880 1,262. 680 1.218,300 1,176,320 1,415,620
D a t e
Deceraber 31— $55.962,828
81,487,846 99,833,660
127, 334,934 123,491, 965 103,466, 634 . 95,529, 648 91, 015,566 89, 987,428 93,646, 677
1833 1834.. 1835 1836.. 1837 1838. . 1839 1840 1841 1842
90,875,877 J u n e 30— 90, 269, 778 83, 788,433 81,054,060 73,987,357 67,476, 044 58,421,414 48,665,407 39,123,192 24,322,235
7, o n , 699
D e b t bearing no interest
$i58,59i, 390 411.767.456 455,437,271 458, 090,180 429,211,734 409,474,321 390,873,992 388,503,491 397,002, 510 399,406,489 401,270,191 402,796,935 431,785.640 436,174, 779 430,258,168 393,222,793 373,088. 595 374,181,153 373,294, 567 386,994,363 390,844.689 389,898,603 393, 087,639 392,299,474 413, 941,255 451, 678.029 445, 613,311 431, 705,286 409,267, 919 393,662,736 380,403, 636 374,300,606 380,004,687 378, 989, 470 373,728, 570 378,081,703 384,112,913 389,433, 654 238,761,733 233,015,585
1 8 4 3 . . . . 1844 1845 1846 1847.. 1848 1849 1850 1851 1852
T o t a l gross p u b h c deb t 3
$59,804,661 42,243,765 35,588,499 31,974,081 28,701,375 44,913,424 58,498,381 64,843,831 90, 582,417
524,177,955 1,119,773,681 1,815,830,814 2.677,929,012 2,755,763,929 2.650,168,223 2. 583,446,456 2. 545. n o , 590 2,436,453,269 2,322,052,141 2,209,990,838 2,151,210,345 2,159,932,730 2,156,276, 649 2,130,845,778 2,107,759,903 2,159,418,315 2,298,912,643 2,090,908,872 2,019,285,728 1,856,915,644 1.721,958,918 1,625,307,444 1, 578, 551,169 1,555,659, 550 1,465,485,294 1,384,631,656 1,249,470 511 1,122,396, 584 1.005,806,561
968,218,841 961, 431,766
1,016,897,817 1,096,913,120 1.222.729,350 1,226,793,713 1,232,743,063 1,436,700, 704 1,263,416,913 1,221,572,245
T o t a l gross p u b h c debt
$4, 760,082 37, 733 37,613
336,958 3.308,124
10,434. 221 3,573,344 5, 250,876
13,594,481 20, 201, 226
. 32, 742, 922 23.461. 653
. 15,925,303 15,550, 203
. 38,826,535
. 47,044,862 63,061,859 63,452. 774
. 68,304, 796
. 66,199,342
Gross deb t per capi ta 2
$2.'32 1.59 1.30 1.10
.93 1.59 1.91 2.06 2.80
15. 79 32.91 52.08 75.01 75.42 70.91 67.61 65.17 61.06 56.72 52.65 50.02 49.05 47.84 46.22 44.71 44.82 46.72 41.60 39.18 35.16 31.83 29.35 27.86 26.85 24.75 22.89 20. 23 17.80 15.63 14.74 14.36 14.89 15.76 17.25 16.99 16.77 19.21 16.60 15.74
Digitized for FRASER http://fraser.stlouisfed.org/ Federal Reserve Bank of St. Louis

STATISTICAL APPENDIX 6 1
TABLE 19.—Principal of the public debt, fiscal years 1790-1970—Continued
June 30 Matured debt
Interest- onwhich Debt bearing Total gross Grossdebt bearing 1 interest has no interest public debt 3 per capita 2
ceased
1902 $931,070,340 $1,280,860 $245,680,157 1903 _ 914,641,410 1,205,090 243,659,413 1904 895,157.440 1,970,920 239,130,656 1906. 895,158,340 1,370,245 235,828,510 1906 895.159,140 1,128,135 246,235,695 1907 894,834,280 1,086,815 251,257,098 1908 897,503,990 4,130,015 276,056,398 1909 913.317,490 2,883,855 232,114,027 1910... 913,317,490 2,124,895 231,497,584 1911 915,353,190 1,879,830 236,751,917 1912 963,776,770 1,760,450 228,301,285 1913 965,706,610 1,659,550 225,681,585 1914 967,953,310 1,552,560 218,729,530 1915 _ 969,759,090 1,507,260 219,997,718 1916 971,562,590 1,473,100 252,109,877 1917... 2,712,549,477 14,232,230 248,836,878 1918 12,197,507,642 . 20,242,550 237,475,173 1919... 25,236,947,172 11,176,250 236,382,738 1920.. 24,062,500,285 6,745,237 . 230,075,945 1921 23,738,900,085 10,688,160 227,862,308 1922 22,710,338,105 25,250,880 227,792,723 1923 22,007,043,612 98,738,910 243,924,844 1924.. 20,981,242,042 30,278,200 239,292,747 1925... 20,210,906,915 30,258,980 275,027,993 1926 19,383,770,860 13,359,900 246,085,555 1927 18,252,664,666 14,718,585 244,523,681 1928 17,317.694,182 45,335,060 241,263,959 1929 16.638,941,379 50,749,199 241,397,905 1930 15,921,892,350 31,716,870 231,700,611 1931 16,519,588,640 51,819,095 229,873,756 1932 19,161,273,640 60,079,385 265,649,519 1933 22,157,643,120 65,911,170 315,118,270 1934 26,480,487,870 54,266,830 518,386,714 1935 _. 27,645,241,089 230,662,155 824,989,381 1936 32,988,790,135 169,363,395 620,389,964 1937 35,800,109,418 118.529,815 505,974,499 1938 36,575,925,880 141,362,460 447,451,975 1939 39,885,969,732 142,283,140 411,279,539 1940 42,376,495,928 204,591,190 386,443,919 1941 48,387,399,539 204,999,860 369,044,137 1942 71,968,418,098 98,299.730 355,727,288 1943 135,380,305,795 140,500,090 1,175,284,445 1944 199,543,355,301 200,851,160 1,259,180,760 1945 256,356,615,818 268,667,135 2,056,904,457 1946 268,110,872,218 376,406,860 934,820,095 1947.... 255,113,412,039 230,913,536 2,942,057,534 1948.... 250,063,348,379 279,751,730 1,949,146,403 1949 250,761,636,723 244,757,458 1,763,965,680 1950 255,209,353,372 264,770,705 1,883,228,274 1951 252,851,765,497 512,046,600 1,858,164,718 1952 256,862,861,128 418,692,165 1,823,625,492 1953 263,946,017,740 298,420,570 1,826,623,328 1954 268,909,766,654 437,184,655 1,912.647,799 1955.-.. 271,741,267,507 588,601,480 2,044,353,816 1956.... 269,883,068.041 666,051,697 2,201,693,911 1957 268,485,562,677 529,241.585 1,512,367,635 1958 274,697.560,009 597,324,889 1,048,332,847 1959 281,833,362,429 476,465,003 2,396,089,647 I960.... 283,241,182,755 444,608,630 2,644,969,463 1961 285,671,608,619 349,355,209 2,949,974,782 1962.... 294,442,000,790 437,627,514 3,321,194,417 1963 301.953,730.701 310,415,540 3,595,486,755 1964.... 307,356,561,535 295,293,165 4,061,044,557 1966 313,112,816,994 292,259,861 3,868,822,129 1966 315,431,054,919 307,673,987 4,168,358,890 1967 322,285,952,388 284,262,674 3,650,722,733 1968 344,400,507,282 253,982,180 2,923,916,963 1969 351,729,445,327 460,746,130 1,530,062,384 1970 369,025,522,033 365,990,460 1,527,194,456
$1,178, 159, 136, 132, 142, 147, 177,
i; 148, 1,146, 1,153, 1,193, 1,193, 1,188, 1,191, 1,225, 2,975, 12,455, 25,484, 24,299, 23,977, 22,963, 22,349, 21,250, 20,516, 19,643, 18,511, 17, 604, 16,931, 16,185, 16,801, 19,487, 22,538, 27,053, 28,700, 33,778, 36,424, 37,164, 40,439, 42,967, 48,961, 72,422,
136,696, 201,003, 258, 682, 269,422, 258,286, 252,292, 252,770, 257,357, 255,221, 259,105, 266,071, 271,259, 274, 374, 272,750, 270,527, 276,343, 284,705, 286,330, 288,970, 298,200, 305,859, 311,712, 317,273, 319,907, 326,220, 347,578, 353,720, 370,918,
031,357 405,913 259,016 357,095 622,970 178,193 690,403 315,372 939,969 984,937 838,605 047.745 235,400 264,068 145,568 618,686 225,365 506,160 321,467 450,553 381,708 707,365 812,989 193,888 216,315 906,932 293,201 088,484 309,831 281,492 002,444 672,560 141,414 892,625 543,494 613,732 740, 316 532,411 531,038 443,536 445,116 090,330 387,221 187,410 099,173 383,109 246,513 359,860 352,361 976,815 178, 785 061, 639 599,108 222,803 813,649 171,896
217.746 907,078 760,848 938,610 822,721 632,996 899,257 898,984 087,795 937,795 406,426 253,841 706,960
$14.88 14.38 13.83 13.61 13.37 13.19 13.28 12.69 12.41 12.29 12.52 12.27 1L99 n.85 12.02 28.77
119.13 242. 56 228. 23 220. 91 208. 65 199. 64 186. 23 177.12 167.32 155.51 146.09 139.04 131.51 135.45 156.10 179.48 214.07 225. 55 263.79 282.76 286. 27 308.98 325.23 367.09 537.13 999.83
1,452.44 1,848.60 1,905.42 1,792.05 1,720.71 1,694.75 1,696.67 1,654.20 1,650.84 1,667.48 1, 670.41 1,660.11 1,621. 38 1,579.50 1,586.89 1,606.11 1,584.70 1,572.58 1,597.60 1,614.74 1, 622. 49 1,630.46 1, 624.66 1,638.36 1,727.94 1,740.64
V 1.805.89
V Prelirainary. 1 Exclusive of bonds issued to the Pacific raUroads (acts of 1862,1864, and 1878), since statutory provision
was made to secure the Treasury against both principal and interest, and the Navy pension fund, wbich was not a debt as principal and interest were the property of the United States. The Stateraent ofthe Public Debt included the raUroad bonds frora issuance and the Navy fund frora Sept. 1, 1866, through June 30, 1890.
2 Based on the Bureau of the Census estimated population. Through 1958 the estimated population is for the conterminous United States. Beginning with 1959 the estimates include Alaska, and with 1960, HawaU.
3 Includes certain securities not subject to statutory limitation. Public debt includes debt incurred to finance expenditures of wholly owned Government corporations and other business-type activities in exchange for which securities of the corporations and activities were issued to the Treasury (see Table 105).
NOTE.—From 1790-1842, the fiscal year ended Dec. 31. Detailed figures for 1790-1852 are not available on a basis comparable with those of later years. For bases prior to 1916, see the 1963 annual report p. 497, Note.
Digitized for FRASER http://fraser.stlouisfed.org/ Federal Reserve Bank of St. Louis
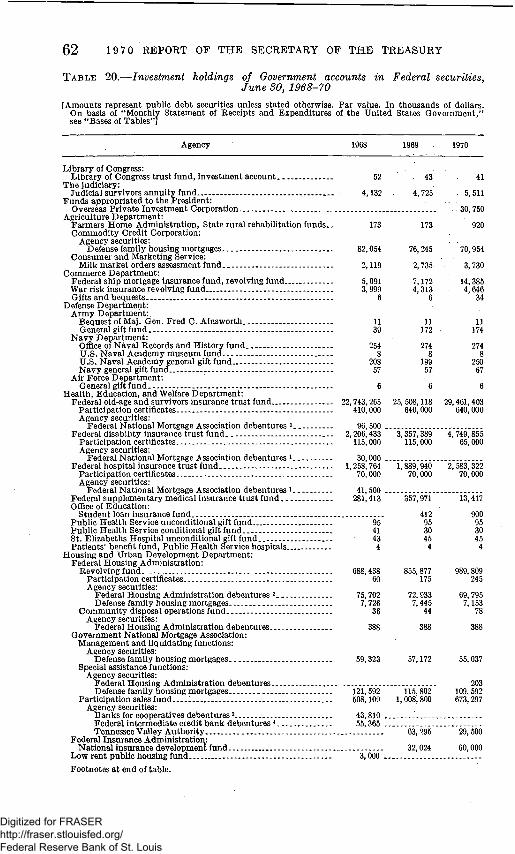
62 197 0 REPORT OF THE SECRETARY OF THE TREASURY
TABLE 20.—Investment holdings of Government accounts in Federal securities, June 30, 1968-70
[Amounts represent pubhc debt securities unless stated otherwise. Par value. In thousands of dollars. On basis of "Monthly Statement of Receipts and Expenditures of the United States Government." see "Bases of Tables"]
Agency 1968 1969 1970
Library of Congress: Library of Congress trust fund, investment account 52 43 41
The judiciary: Judicial survivors annuity fund 4,132 4,725 5,511
Funds appropriated to the President: Overseas Private Investment Corporation 30,750
Agriculture Department: Farmers Horae Adrainistration, State rural rehabilitation funds.. 173 173 920 Commodity Credit Corporation:
Agency securities: Defense faraily housing mortgages 82,054 76,245 70,954
Consumer and Marketing Service: Milk market orders assessment fund 2,119 2,735 3,730
Comraerce Department: Federal ship mortgage insurance fund, revolving fund 5,091 7,172 14,385 War risk insurance revolving fund 3,999 4,313 4,646 Gifts and bequests 6 6 34
Defense Department: Army D epartment:.
Bequest of Maj. (Jen. Fred C. Ainsworth.. 11 11 11 General gift fund 39 172 174
Navy Department: Office of Naval Records and History fund 254 274 274 U.S. Naval Academy museum fund.. . 8 8 8 U.S.Naval Acaderay general glftfund 208 199 250 Navy general gift fund 57 57 67
Air Force Department: General gift fund 6 6 6
Health. Education, and Welfare Department: Federal old-age and survivors insurance trust fund 22,743,265 25,508,118 29,461,403
Participation certificates 410,000 640,000 640,000 Agency securities:
Federal National Mortgage Association debentures i 96,500 Federal disability insurance trust fund 2,206,433 3,357,389 4,749,855
Participation certificates 11.5,000 115,000 65,000 Agency securities:
FcderalNational Mortgage Association debentures i 30,000 Federal hospital insurance trust fund 1,258,764 1,889,940 2,583,322
Participation certificates 70,000 70,000 70,000 Agency securities:
Federal National Mortgage Association debentures i . . 41,500 Federal suppleraentar3'^ medical insurance trust fund 281,413 357,971 13,417 Office of Education:
Student loan insurance fund 412 900 Public Health Service unconditional gift fund 95 95 95 PublicHealth Service conditional gift fund.. 41 30 30 St. Ehzabeths Hospital unconditional gift fund 43 45 45 Patients'benefit fund. Public Health Service hospitals 4 4 4
Housing and Urban Developraent Departnient: Federal Housing Adrainistration:
Revolving fund 688,438 855,877 989,809 Participation certificates 60 175 245 Agency securities:
Federal Housing Adrainistration debentures 2 75,702 72,933 69,795 Defense family housing raortgages 7,726 7,445 7,153
Community disposal operations fund 36 44 78 Agency securities:
Federal Housing Administration debentures 388 388 388 Government National Mortgage Association:
Management and liquidating functions: Agency securities:
Defense family housing mortgages 59,323 57,172 55,037 Special assistance functions:
Agency securities: Federal Housing Administration debentures 203 Defense faraily housing mortgages 121,592 115,802 109,592
Participation sales fund 508,109 1,008,800 673,297 Agency secmities:
Banks for cooperatives debentures 3 43,810 Federal intermediate credit bank debentmes* 55,365 Tennessee Valley Authority 63,295 29,500
Federal Insmance Administration: National insmance development fund 32,024 60,000
Lowrent pubhc housing fund 3,000
Footnotes at end of table.
Digitized for FRASER http://fraser.stlouisfed.org/ Federal Reserve Bank of St. Louis
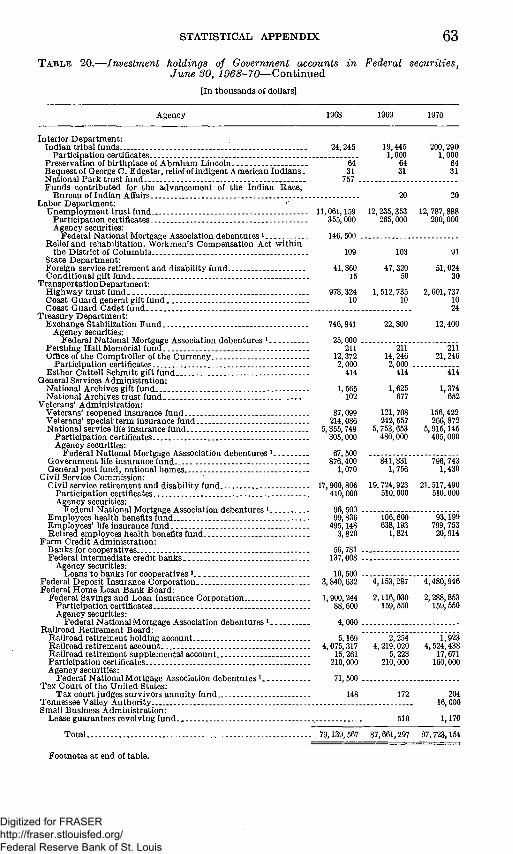
STATISTICAL APPENDIX 6 3
T A B L E 20.—Investment holdings of Government accounts in Federal securities, June 30, 1968-70—Continued
[In thousands of dollars]
Agency 1968 1969 1970
Interior Department: Indian tribal funds 24,245 19,445 200,290
Participation certificates 1,000 1,000 Preservation of birthplace of Abrahara Lincoln 64 64 64 Bequest of George C. Edgeter. relief of indigent American Indians. 31 31 31 National Park trust fund 757 Funds contributed for the advancement of the Indian Race,
Bureau of Indian Affairs 20 20 Labor Department:
Unemployment trust fund 11,061,159 12.235,353 12,787,888 Participation certificates 355,000 265,000 200,000 Agency securities:
Federal National Mortgage Association debentures i 146,500 Relief and rehabihtation, Workmen's Compensation Act within
the District of Columbia... 109 103 91 State Department: Foreign service retirement and disability fund 41,860 47,320 51.024 Conditional gift fund 15 50 30
Transpor tationD epartment: Highway trust fund 978,324 1,512,735 2,601.737 Coast Guard general gift fund 10 10 10 Coast Guard Cadet fund 24
Treasury Departraent: Exchange StabUization Fund 746.841 22.800 12,400
Agency securities: Federal National Mortgage Association debentures i 25,000
Pershing HaU Meraorial fund 211 211 211 Office of the Coraptroller of the Currency 12,372 14.246 21,246
Participation certfficates.. 2,000 2,000 Esther CatteU Schraitt gift fund... -. 414 414 414
General Services Administration: National Archives gift fund 1,565 1,625 1,374 National Archives trust fund 102 677 652
Veterans' Administration: Veterans'reopened hisurance fund 87.099 121.708 156,422 Veterans' special term insurance fund 214,086 242,557 266,872 National service life insmance fund - 5,855,749 5,753,653 5,915,145
Participation certfficates 305.000 480,000 405,000 Agency securities:
Federal National Mortgage Asssociation debentures i . . . 67,500 Government life insurance fund.. 876,400 841,831 796,743 General post fund, national homes 1,070 1,756 1,430
Civil Service Commission: CivU service retheraent and disability fund 17,900,806 19,724,923 21,517,490
Participation certificates 410.000 510,000 510,000 Agency secmities:
Federal National Mortgage Association debentures i 96,500 Eraployees health benefits fund 99,836 106,600 93,199 Eraployees'life insurance fund. . 495,148 638,193 799,753 Retired eraployees health benefits fund 3,820 1,824 20.914
Farm Credit Administration: Banks for cooperatives 56,781 Federal intermediate credit banks 137,008
Agency securities: Loans to banks for cooperatives 3 10, 500
Federal Deposit Insurance Corporation. 3.840,632 4,153,287 4,480,946 Federal Home Loan Bank Board:
Federal Savings and Loan Insurance Corporation 1,900,244 2,116,030 2,288,853 Participation certfficates 88,600 159,550 159,550 Agency securities:
Federal NationalMortgage Association debentures i_ 4,000 Railroad Retireraent Board:
Railroad retireraent holding account 5,169 2,254 1,923 Railroad retirement account 4,075,317 4,219,020 4,524,438 Railroad retirement supplemental account 15,261 5,228 17,671 Participation certificates 210,000 210,000 160,000 Agency securities:
Federal NationalMortgage Association debentures i 71,500 Tax Court of the United States:
Tax court judges survivors annuity fund 148 172 204 Tennessee Valley Authority 16,000 Small Business Administration:
Lease guarantees revolving fund 510 1,170
Total 79,139,567 87,661.297 97,723,154
Footnotes at end of table.
Digitized for FRASER http://fraser.stlouisfed.org/ Federal Reserve Bank of St. Louis

64 19 70 REPORT OF THE SECRETARY OF THE TREASURY
TABLE 20.—Investment holdings of Government accounts in Federal securities, June 30, 1968-70—Continued
[In thousands of dollars]
Agency 1968 1969 1970
MEMORANDUM
Investments hi securities of privately owned Governraent-sponsored enterprises:
Included in the loan account: Civil Service retireraent and disability fund 594,600 Indian tribal funds._ 5,355 Federal Savings and Loan Insurance Corporation (acquired
securities) 12,830 Milk market orders assessraent fund 173 Participation sales fund Raihoad retheraent account
Total
292,960 50 000
937, 560 5,355 13,003
Not applied to current j'^ear's surplus or deficit: Civil service retireraent and disability fund 86,500 20,000 Federalold-age and survivors insurance trustfund 86,500 20,000 Federal hospital insurance trust fund 41,500 Federal disabUity msurance trust fund 20,000 20,000 Federal Savhigs and Loan Insurance Corporation 4,000 4,000 Participation sales fund 17,705 Raihoad rethement account 61, 500 20,000 Unemployment trust fund 86,500 20,000 Veterans'life insurance trustfunds 67,500
Total 471,705 104,000
1 Effective Sept. 30, 1968, Federal National Mortgage Association was converted to private ownership (12 U.S.C. 1716b), and is included in the "Memorandura" on this table.
2 Held by rautual mortgage insurance fund. sThese banks were converted to private ownership effective Dec. 31, 1968, by an act approved Oct. 17,
1968 (12 U.S.C. 1134e). * These banks were converted to private ownership eflective Dec. 31, 1968, by an act approved Oct. 17,
1968 (12 U.S.C. 1061(a)(1)).
Digitized for FRASER http://fraser.stlouisfed.org/ Federal Reserve Bank of St. Louis

STATISTICAL APPENDIX 65
TABLE 21.—Debt subject to statutory limitation, outstanding June 30, 1940-70
[On basis of dai ly T reasu ry s ta tements]
J u n e 30 P u b l i c deb t
subject to Ihni ta t ion i
D e b t of U . S . Gove rnmen t agencies a n d Dis t r ic t of Colurabia subject to l imi ta t ion 2 D e b t subject
to l imitat ion 3 In teres t -bear ing
Matured To ta l
1940 $37,690,052,720 1941 43,123,336,151 1942 69,586.197.977 1943 136,369,140,696 1944.- 206,454,185,750 1945 268,237.605.076 1946 268.455.970.443 1947 257,401,896,875 1948 251,468,110,567 1949 252,000,437,177 1950 256,632,630,395 1951 254,537,402,501 1952 268,461,032,792 1953 266,469,663,620 1954 270.708,863,230 1955 273,870,706,735 1956 272,287,327,974 1957 270,081,184,136 1958 275,912.219,021 1959 284,287,454,940 1960 _ 285,925,122,549 1961 288,621,647,080 1962 297,767,548,338 1963 305,491,889,669 1964 311,351,181,709 1965 -- 316,990,533,998 1966 319,640,673,677 1967 325.958.925.138 1968 346.924,571,182 1969 353,084,483,788 1970 370,287,837,088
$5,497, 6,359, 4, 548, 4,091, 1, 515,
409, 466,
83, 68, 23, 17, 27, 44, 50, 80, 43, 73,
106, 100, no, 139, 239, 443, 605, 812, 588, 460, 611,
3,818, 3,847, 3,136,
556,555 619,105 529,255 686,621 638,626 091,867 671,984 212,285 768,043 862,383 077,809 364,069 092,646 881,686 415,386 257,786 100,900 434,150 565,250 429,100 305,000 694,000 688,600 489,600 272,200 900,500 474,100 788,700 220,100 040,000 645,950
$31, 514,100 10,633,475 19,730,375 8,256,425
107,430, 675 24,066,525 9, 712,875 6,307,900 4,692,775 3,413,025 2,425,225 1,863,100 1,472,700 1,191,075 1,026,000
885,175 787, 575 703,800 655,350 590,050 536,775 521,450 530,425
1,120,775 719,725
1,425,550 1,073,175
407,375 365,800 352,150 343,625
$5, 529,070,655 6,370,252, 580 4,568,259,630 4,099,943, 046 1,623,069,301
433,158,392 476,384,859
89, 520,185 73,460,818 27,275,408 19,503,034 29,227,169 45,565,346 52,072,761 81,441,386 44,142,961 73,888,475
107,137,950 101,220,600 111,019,150 139,841,775 240,215,450 444,218,925 606,610,375 812,991,925 590.326,050 461,547,275 612,196,075
3,818, 586,900 3,847,392,150 3,136,989, 575
$43,219, 49,493, 74,154,
140,469, 208,077, 268, 670, 268,932, 257,491, 251, 541, 252,027, 256,652, 254,566, 258,506, 265,521, 270, 790, 273,914, 272,361, 270,188, 276,013, 284,398, 286.064, 288,861, 298,211. 306.098. 312.164, 317.580, 320,102, 326,471, 350,743. 356, 931, 373.424,
123,375 588,731 457,607 083,742 255,051 763,468 355,302 416,060 571,385 712,585 133,429 629,670 598,138 736,381 304,616 849,696 216,449 322, 086 439,621 474,090 964,324 862, 530 767,263 500,044 173,634 860,048 220,952 121,213 157,082 623, 789 826, 663
1 Inc ludes deb t incurred to finance expendi tures of G o v e m m e n t corporations and other agencies in exchange for which securities of t h e corporations a n d activities were issued to t h e Treasury (see table 105).
2 He ld outs ide t he T reasu ry . 3 A s u p i m a r y of legislation on deb t l imi ta t ion u n d e r t h e Second L ibe r ty B o n d Act , as amended , from
Sept . 24,1917, t h rough J u n e 30,1967, is shown in tab le 31. Securities held outs ide t he Treasury are included in t he l imi ta t ion beginning A p r . 3, 1945. I n comput ing s t a tu to ry deb t l imi ta t ion , savhigs bonds are carried a t m a t u r i t y va lue from thei r origin in 1935 u n t i l J u n e 26, 1946; from t h a t da te t hey are carried a t cu r r en t r edempt ion v a l u e .
Digitized for FRASER http://fraser.stlouisfed.org/ Federal Reserve Bank of St. Louis

TABLE 22.—Public debt outstanding by classification, June 30, 1960-70
[In mi lhons of dollars. On basis of dai ly Treasu ry s ta te raents , see " B a s e s of Tab les" ]
O O
Class 1960 1963 1964 1969 1970
Interest-bearing: P u b h c issues:
Marketable : T rea su ry bills:
Regular weekly 25,903 Tax ant ic ipat ion O t h e r . . . 7,512
Certfficates of indebtedness (regular) 17,650 Treasu ry notes 51,483 Treasu ry bonds 81,247 P a n a r a a Cana l bonds 50 .
26,914 1,503 8,307
13,338 56,257
32, 225 1,802 . 8,009
13,547 65,464 75, 025
37,729 39,730 43,659 42,922 45,827
9,501 22,169 52,145 81, 964
11, 010
67,284 88,461
10, 005 12,008 1,652
52, 549 50,649 102,481 101.897
49,432
'is.'oos'
68,356
12,708 5,610
49,108 71,073 97,418 91,079
78,946 78.805
170
Nonraarke tab le : Certfficates of indebtedness:
Foreign currency series Foreign series
Treasu ry cert if icates. , Deposi ta ry bonds . T reasury bonds :
Foreign currency series Foreign series I n v e s t m e n t series R E A series 4% Treasu ry bonds
Treasu ry bonds T rea su ry notes :
Foreign currency series Foreign series.
U . S . savings notes , U . S . re t i rement p l an bonds U . S . savings bonds 47,544
138
2 25 465
2 103
8 604
6,783 5.830 19
4,727 25
3,921 27
150 338
47, 514 47,607 (*)
48,314 5
49,299 11
50,043 16
50, 537
186 1,892 7,289
170 1,608 8,604
210 1,236 9,899
80 1.056
11,263
73 986
12.432
70 1,002
13,465
41 2,626
12,480 4,101
11,426 5,457
10,169 8,192 9,115
50
74,396 1.758
93,489 62,956
T o t a l marke t ab l e issues 183,845 187,148 196,072 203,508 206.489 208,695 209,127 210.672 226,692 226,107 232,599
3 30 . 240
18 103
10 802
3.546 25 20
778 95 59
11 1.137 204
3.256 26 9
*368 305
93 44
12 589 . . 174
2.692 23 4 . .
6 431 275 48 45
144 2.589
26
8 217 893
30 30
114 2,516
23
7 390 287
6 28
84 2,459
21
8150 961 785 25
54 2.387
15
75
13 460 14 1, 523 131.978 i61, 216 205 994 1,332 2,374
1 203 505 742 21 27 33 39
51,213 51,712 51,711 51,281
To ta l nonmarke tab le issues 54,497 53,481 63,431 53,645 54,240 55,768 55,183 55.459 58,282 58,833 60,103
T o t a l publ ic i s s u e s . . . 238,342 240,629 249,503 257,153 260,729 264,463 264,311 266,131 284,874 284,940 292,702
Special issues: Civil service re t i rement fund:
Certfficates Notes Bonds
Employees ' hfe insurance fund Exchange Stabil ization F u n d certfficates Expor t - Impor t B a n k of Washington certfficates
11,033 7.847
60
O ?d
o
Ui \^ Q ^
>
O
ffl
> Ui
d
82 . Digitized for FRASER http://fraser.stlouisfed.org/ Federal Reserve Bank of St. Louis

Federal Deposit Insmance Corporation notes 694 556 500 260 270 312 57 86 174 120 74 Federal disability insurance trust fund:
Certificates.- 56 34 1 6 Notes 487 464 336 84 1 158 384 900 2,051 3,443 Bonds... . 1,474 1,801 1,967 2,076 1,901 1,563 992 992 992 992 992
Federal home loan banks: Certfficates : 59 60 74 372 82 100 924 52 152 52 199
Federal hospital insurance trust fund: Certfficates 52 16 Notes 733 1,176 1,259 1,890 2,583
Federal Housing Administration notes: Apartment unit insmance fund 1 1 (*) (*) Armed services housing mortgage insurance fund. (*) 26 10 14 14 3 Experimental housing insurance fund 1 1 . 1 ,1
. Housing insurance fund 4 4 4 1 2 4 Housing investment insurance fund (*) (*) (*) (*) (*) (*) . -. Mutual mortgage insm'ance fund 15 15 16 10 10 96 National defense housing insurance fund. 1 (*) (*) (*) (*) (*) Section 203 home improvement account I l l 1 Ui Section 220 home improvement account I l l 1 . . H^ Section 220 housing insurance fund 1 1 1 2 2 1 > Section 221 housing insm'ance fund.. . 1 ....• f Servicemen's mortgage insurance fund 1 2 2 2 2 10 j/j Title I housing insurance fund. l l l l l 1 f-3 Title I insm-ance fund 23 23 23 14 9 1 1 . . . . . . Jz< War housing insurance fund 6 15 10 8 8 6 ^
Federal old-age and survivors insm'ance trust fund: {H Certfficates 270 441 1.080 141 940 ^ Notes 2,428 1,387 257 598 1,032 2,820 5,316 7,638 10,402 15,139 •> Bonds.. . . 13,716 14,372 13,737 14,221 14,201 14,088 11,584 11,584 11,584 11,584 10,800 hJ
Federal Savings and Loan Insurance Corporation: ^ Certfficates. - - - 36 73 80 H Notes 104 138 182 98 332 287 223 3 ^
Federal supplementary medical insurance trust fund: . O Certfficates.... 32 \-\ Notes 447 281 358 13 y
Foreign service retirement fund certfficates 29 32 37 38 39 40 42 42 42 47 51 Government life.insurance fund: .. .
Certfficates 1 7 Notes.. 295 222 142 74 1 78 78 142 175 205 Bonds... 811. . 849. . 879 929 955 933 860 .736 734 667 592
Highway trust fund certfficates 1 234 436 678 609 265 238 722 978 1,513 2,602 National service life insurance fund:
Certfficates 8 1 8 14 Notes . . . . 1,547 1,168 782 395 8 28 613 606 918 1,203 1,752 Bonds.... -. 4,248 4,591 5,021 5,319 6,775 6,873 5,486 5,138 4,937 4,551 4,164
Postal Savings System notes.. 26 RaUroad retirement account:
Certfficates 119 208 218 67 Notes 3,586 3.504 3,316 2,786 686 450 593 976 1,220 1,553 2,387 Bonds.. .- 2,164 2,465 2,465 2,280 2,063 1,874 1,344
Railroad retirement holding account certificates 4 5 2 2 ' ^
Footnotes at end of table; ^
Digitized for FRASER http://fraser.stlouisfed.org/ Federal Reserve Bank of St. Louis
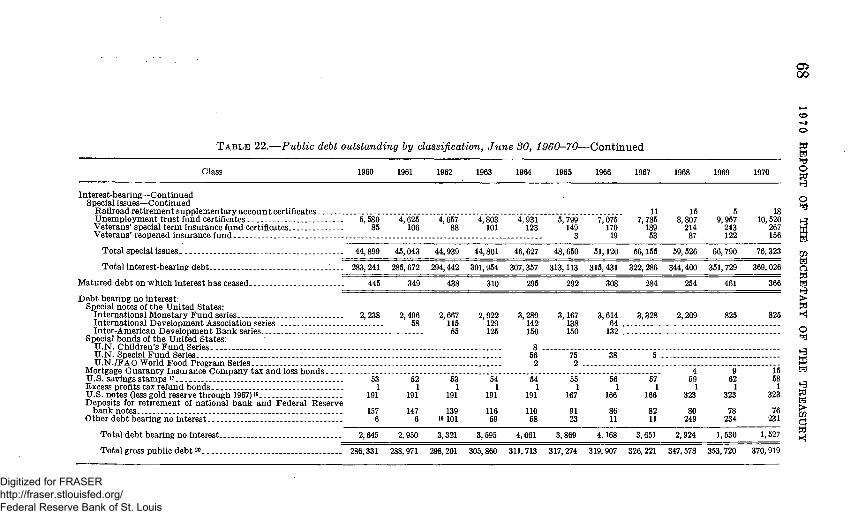
GO
TABLE 22.—Public debt outstanding hy classification, June 30, 1960-70—Continued ^
Class
In te res t -bear ing—Contmued Special i ssues—Cont inued
Ra i l road r e t h e m e n t s u p p l e m e n t a r y a c c o u n t certificates Unemplo j rment t rus t fund certificates - . . . . . . . . Ve te rans ' special t e rm insurance fund certiflcates Ve t e r ans ' r eopened insm-ance fund
T o t a l special i s s u e s - .
T o t a l mterest -bear ing deb t .
Ma tu red deb t on wh ich in te res t has ceased . .
D e b t bear ing no in teres t : Special notes of t h e U n i t e d Sta tes :
In t e rna t iona l Mone ta ry F u n d series In t e rna t iona l Deve lopmen t Association series In te r -Amer ican Deve lopmen t B a n k series
Special bonds of t h e U n i t e d Sta tes : U . N . Chi ldren ' s F n n d Series . , U . N . Special F u n d Series U . N . / F A O World Food Program Series . .
Mortgage G u a r a n t y Insurance C o m p a n y tax and loss b o n d s . _ . U . S . savings s ta raps i Excess profits tax refund b o n d s . U .S . notes (less gold reserve th rough 1967) is Deposi t s for re t i rement of nat ional b a n k and Federa i Reserve
b a n k n o t e s Other deb t bearing no interest
T o t a l deb t bearing no interest
T o t a l gross publ ic deb t 20
1960
6,580 85
44,899
283, 241
445
2,238
53 1
191
157 6
2,646
286,331
1961
4,625 106
45,043
285,672
349
2.496 68
52 1
191
147 6
2,950
288,971
1962
4,657 88
44,939
294,442
438
2,667 115 55
63 1
191
139 19 101
3,321
298,201
1963
4,803 101
44,801
301,954
310
2,922 129 125
54 1
191
116 69
3,696
305,860
1964
4,931 123
46, 627
307,357
296
3,289 142 160
8 . 56
2
64 1
191
no 58
4,061
311,713
1966
6,799 149
3
48,650
313,113
292
3,167 138 150
75 2 .
55 1
167
91 23
3,869
317, 274
1966
7,075 170
19
51,120
316,431
308
3,614 64 .
132 .
38
56 1
166
86 11
4,168
319, 907
1967
11 7,785
189 53
66,155
322, 286
284
3,328
6 .
67 1
166
82 11
3,651
326, 221
1968
15 8,807
214 87
59,526
344,400
254
2,209
4 " 59
1 323
80 249
2,924
347,678
1969
5 9,957
243 122
66,790
351,729
461
825
9 " 62
1 323
78 234
1,530
353,720
1970
18 10, 520
267 156
76,323
369,026
366
825
is 68
1 323
76 231
1,627
370,919
0
f-3
0
t ^
^ w
0
\fl W H
HB W
^ a ^ ^
Digitized for FRASER http://fraser.stlouisfed.org/ Federal Reserve Bank of St. Louis

* Less than $500,000. 1 DoUar equivalent of certfficates issued and payable in the amount of 46,500,000,000
Italian lire. 2 Dollar equivalent of certfficates issued and payable in the amount of 110,000,000
Swiss francs. 3 DoUar equivalent of certfficates issued and payable in the amount of 130,000,000
Swiss francs. * DoUar equivalent of certfficates issued and payable in the amount of 800,000,000
Deutsche marks and 727,000,000 Swiss francs. 6 DoUar equivalent of certificates issued and payable in the amount of 800,000,000
Deutsche marks, 885,000,000 Swiss francs, and 650,000,000 Austrian schiUings. 8 DoUar equivalent of certfficates issued and payable in the amount of 440,000,000
Swiss francs. I DoUar equivalent of certfficates issued and payable in the amount of 1,685,000,000
Swiss francs. 8 Dollar equivalent of certfficates issued and payable in the amount of 645,000,000
Swiss francs. 8 DoUar equivalent of Treasury bonds issued and payable in the amount of
124,050,000,000 Italian Ihe, 647,000,000 Swiss francs, 800,000,000 Deutsche marks, 650,000,-000 Austrian schiUings, and 1,500,000,000 Belgian francs.
10 DoUar equivalent of Treasury bonds issued and payable in the amount of 1,057,000,-000 Swiss francs, 1,900,000,000.Deutsche marks, 1,300,000,000 Austrian schillings, and 1,500,000,000 Belgian francs.
II Dollar equivalent of Treasury bonds issued and payable in the amount of 1,412,000,-000 Swiss francs,2, 700,000,000 Deutsche marks, 2,600,000,000 Austrian schiUings, and 1,500,000,000 Belgian francs.
12 DoUar equivalent of Treasury bonds issued and payable in the amouut of 685,000,000
Swiss francs, 800,000,000 Deutsche marks, 1,960,000,000 Austrian schilUngs, 1,600,000,000 Belgian francs, and 78,000,000,000 Italian lire.
13 DoUar equivalent of Treasury notes issued and payable in the amount of 687,000,000 Swiss francs, 600,000,000 Deutsche marks, 650,000,000 Austrian schUlings, and 78,000,000,-000 Italian lire.
1* DoUar equivalent of Treasury notes issued and payable in the amount of 1,217,-000,000 Swiss francs, 700,000,000 Deutsche marks, 650,000,000 Austrian schiUings, 3,000,-000,000 Belgian francs, and 78,000,000,000 Itahan Ihre.
16 DoUar equivalent of Treasury notes issued and payable in the amount of 1,627,-000,000 Swiss francs, 5,300,000,000 Deutsche marks, 1,300,000,000 Austrian schillings, and 140,500,000,000 Italian Ihre.
16 DoUar equivalent of Treasury notes issued and payable in the amount of 2,331,000,-000 Swiss francs, and 2,500,000.000 Deutsche marks.
17 On Oct. 1,1942. they replaced postal savings stamps which had been Postal Savings System's obligations.
18 Gold reserves requhements eliminated pursuant to Public Law 90-269, approved Mar. 18,1968.
19 Includes $95,656,198 of old series cmrency which by authority of the Old Series Currency Adjustment Act, approved June 30,1961 (31 U.S.C. 912-916), was transferred to debt bearing no interest.
20 Includes certain securities not subject to statutory limitation. Includes public debt incurred to finance expenditures of whoUy owned Govermnent corporations and other business-type activities in exchange for which secm-ities of the corporations and activities were issued to the Treasury; see table 105.
NOTE.—For comparable data for 1931-43, see the 1943 annual report, page 664; for 1944-54, see 1954 annual report, page 472; and for 1955-58, see 1965 annual report, page 557. Composition of the public debt 1916-45, is shown in the 1947 annual report, p. 361. For reconcUiation with public debt accounts for 1970, see table 26.
Ui
Ui y ^
h-i O >
CO
Digitized for FRASER http://fraser.stlouisfed.org/ Federal Reserve Bank of St. Louis

o
o
o
fel
T A B L E 23.—Securities issued hy Government agencies subject to statutory debt limitation, J u n e 30, 1960-70 g
[Face amount, in thousands of dollars. On basis of daUy Treasury statements, see " Bases of Tables"] Q fel
Issuing agency 1960 1961 1962 1963 1964 1965 1966 1967 1968 1969 1970 ^ _ : fd
UNMATURED DEBT O
Districtof Columbia Armory Board stadium bonds 476 19,800 19,800 19,800 19,800 19,800 19,800 19,800 19,800 19,800 19,800 hrj Federal Housing Administration debentures:
Mutual mortgage insurance fund 11,411 25,389 194,716 328,062 499,018 333,523 133,402 73,658 43,643 26,154 14,753 i^ Cooperative management housing insurance fund - _ 1,636 7,524 15,496 15,523 15,641 jn General insurance fund: H
General insurance 142,426 279,009 369,715 424,615 388,770 Armed services housing mortgage insurance fund 19,368 62,420 47,277 16,001 5,691 2,576 1,714 1,695 291 288 286 i^ Housing insurance fund. 9,232 23,406 35,299 63,445 89,942 76,723 57,583 49,173 43,552 40,570 34,165 ^ National defense housing insurance fund 71,737 75,393 92,551 98,124 79,354 71,965 46,400 29,090 27,272 24,228 21,048 fej Section 203 horae iraproveraent account 2 6 (*) > Section 220 housing insurance fund 10 66 9,360 27,647 23,514 19,672 19,672 19,672 19,672 19,672 CQ Section 221 housing insurance fund 217 4,780 23,353 36,558 55,836 31,566 12.284 12,191 12,118 11,635 11,568 d Servicemen's mortgage hisurance fund 680 1,673 12,609 22,746 31,111 22,886 19,858 15,416 12,709 11,110 9,884 W Title I housing insurance fund 411 186 633 523 254 373 319 223 163 155 152 H War housing insurance fund 25,762 26,647 17,385 10,869 3,720 6,970 5,381 4,339 3,788 2,938 908
Total unmatured debt 139,305 239,694 443,688 605,490 812,272 588,900 460,474 511,789 568,220 596,688 536,646
Digitized for FRASER http://fraser.stlouisfed.org/ Federal Reserve Bank of St. Louis

MATURED DEBTI
Federal Farm Mortgage Corporation _ 193 174 Federal Housing Administration- 12 25 Home Owners' Loan Coi-poration 331 323
Total matured debt 2 537 521
Total 2. _ 139,842 240,215
* Less than $500. 1 Funds are on deposit with the Treasurer of the United States for payment of these
securities.
170 67
303
530
444,219
161 669 291
1,121
606,610
144 299 276
720
812,992
133 1,025 268
1,426
590,326
124 682 266
1,073
461,547
120 35 252
407
512,196
109 7
249
366
568.586
107 8
237
352
597,040
105 7
232
344
536,990
2 Consists of prhiclpal only.
NOTE.—For figmes for 1946-58 see 1958 annual report, p. 474; and for 1959, see 1969 annual report, pp. 70 and 71. For secmities held by the Treasury, see table 105.
CO
i Ui
%
% fej
Digitized for FRASER http://fraser.stlouisfed.org/ Federal Reserve Bank of St. Louis
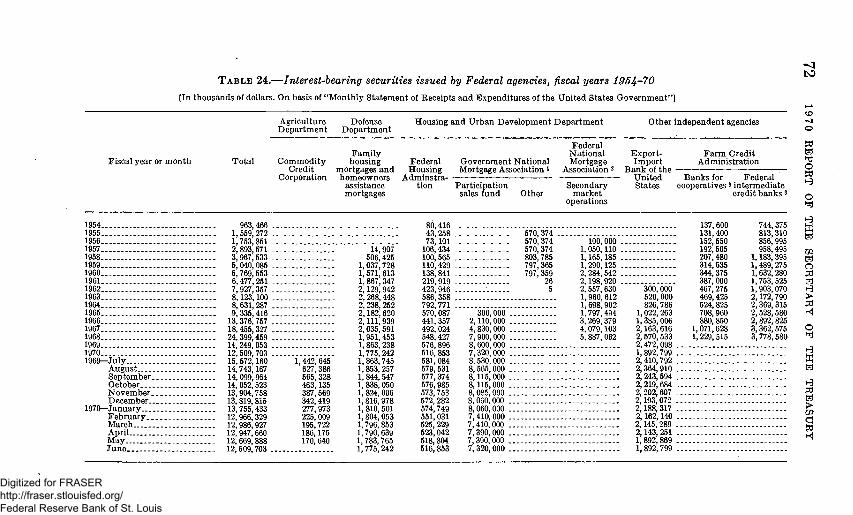
TABLE 24.—Interest-hearing securities issued hy Federal agencies, fiscal years 1954-70 [In thousands of dollars. On basis of " M o n t h l y S t a t e m e n t of Receipts a n d Expend i tu re s of the U n i t e d Sta tes G o v e r n m e n t " ]
Agr icul ture D e p a r t m e n t
Defense D e p a r t m e n t
Hous ing and U r b a n Deve lopmen t D e p a r t m e n t Other i ndependen t agencies
Fiscal year or m o n t h T o t a l C o m m o d i t y Credi t
Corpora t ion
F a m i l y hous ing
mortgages a n d homeowners
assistance mortgages
Fede ra l Hous ing
A d m i n s t r a t ion
G o v e r n m e n t Na t iona l Mortgage Association i
Pa r t i c ipa t ion sales fund Other
Fede ra l N a t i o n a l Mortgage
Associat ion 2
Secondary m a r k e t
opera t ions
Expor t -I m p o r t
B a n k of t h e Un i t ed Sta tes
F a r m Cred i t Admin is t ra t ion
B a n k s for Federa l cooperatives 3 in te rmedia te
credi t b a n k s 3
O
fel hj o
o fej
137,600 744,375 M 131,400 813,310 S 152,550 856,996 ^ 192,506 958,495 r^ 207,480 1,183.395 fej 314,535 1,489,276 Q 344,375 1,632.280 ^ 387,000 1,753,525 fel 467,275 1,903,070 i^ 469,425 2,172,790 > 524,825 2,369,315 ?d 708,960 2,528,680 «! 880,850 2,892.825
1,071.628 3.362,575 O 1,229,515 3,778,680 ^
H^
: : : : : : : : : : : : : : : : : : : : ffl fej
H W
" fel • >
Ui
d
1954 963, 1955 1,659, 1956 1.753, 1967 2,893, 1968 3,967, 1959 5,040, 1960 6,769, 1961 6,477. 1962 7,927. 1963 8,123. 1964 8.631. 1965 9,335, 1966 13,376, 1967 18,455, 1968 24,399, 1969 14,249, 1970 12,509, 1969—July 15,572,
Augus t 14,743, Sep tember 14,099, Oc tober . 14,052, Noverabe r 13,904, December 13,819,
1970—January 13,755, F e b r u a r y 12,966. M a r c h . . . . 12,986, Apr i l 12,947, May 12,669, J u n e 12,509,
466 80,416 . 272 43,258 . 861 73,101 . 571 14,907 106,434 . 633 - 606,425 100,565 . 085 1,037.728 110,429 . 553 1,571,613 138,841 . 251 1,867.347 219,919. 357 2,129,942 423,946 . 100 2,268,448 586,358. 287 2,238,252 792,771 . 416 2,182,620 570,087 757 2,111,939 441,357 327 2,035,591 492,024 459 1,951,453 548,427 053 1,863,238 576,896 703 1,775,242 616,853 160 1,442,645 1,863,745 581,084 167 627,386 1,853,257 579,531 964 565,328 1,844,547 577,374 523 463,135 1,838,050 676,985 758 387,569 1,824.096 57.3,7.53 815 342.419 1.816,978 672,282 433 277,973 1,810,501 574,749 329 226,009 1,804,053 551,031 927 196,722 1,796,853 625,229 660 186,176 1,790,639 623,042 888 170,640 1,783,765 518,804 703 1,775,242 616,853
670, 374 . 570, 374 570,374 803,785 797,365 797, 359
26 5
300,000 . 2,110,000 . 4,830,000 . 7,900,000 . 8,600,000 . 7,320,000 . 8,530,000 . 8,565,000 . 8,115,000 . 8,115,000 . 8,085,000 . 8,060,000 . 8,060,000 . 7,410,000 . 7,410,000 . 7,390,000 . 7, 390, 000 . 7, 320, 000 .
100,000 . 1,050,110 . 1,165,185 . 1,290,125 . 2,284,542 . 2,198,920 . 2,557, 630 1, 960, 612 1, 698,902 1,797,494 3, 269, 379 4, 079,103 5,887,062
Digitized for FRASER http://fraser.stlouisfed.org/ Federal Reserve Bank of St. Louis
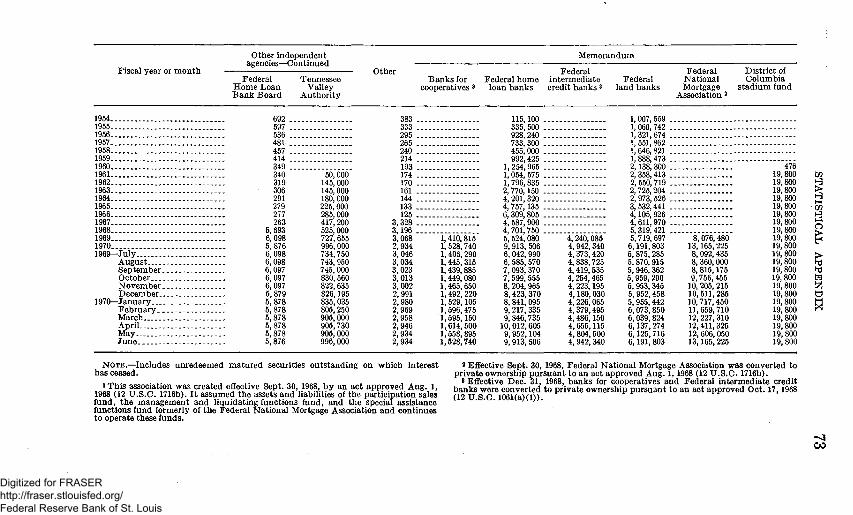
Fiscal year or m o n t h
Other independen t agencies—C ont inued
Federa l Tennessee H o m e L o a n Valley B a n k B o a r d A u t h o r i t y
Other
Meraorandum
B a n k s for cooperatives 3
Federa l h o m e loan b a n k s
Federal in te rmedia te credit banks 3
Federal l a n d banks
Federa l Nat iona l Mortgage
Association 2
Dis t r ic t of Co lumbia
s t a d i u m fund
1954 1955 1956 1957 1958 1959 1960 1961 1962 1963 1964 1965 1966 1967 1968 1969.. 1970 1969—July
Augus t Sep te rabe r . October N o v e m b e r . D e c e m b e r . .
1970—January F e b r u a r y . . March Apr i l May J u n e
692 597 536 481 457 414 349 340 50,000 319 145,000 306 145,000 291 180,000 279 225,000 277 285,000 263 417,200
5, 693 525,000 6, 098 727, 655 5, 876 996, 000 6, 098 734,750 6, 098 743, 950 6, 097 745,000 6, 097 830,560 6, 097 822,635 5, 879 826,195 5, 878 835,035 5,878 805,250 5, 878 905,000 5, 878 905,730 6, 878 905.000 5, 876 996. 000
383 333 295 265 240 214 193 174 170 161 144 133 125
3,328 3,196 3.068 1, 410. 815 2, 934 1. 528,740 3, 046 1, 406. 290 3, 034 1,445,316 3,023 1,439.885 3.013 1,449,080 3,002 1.466,650 2,991 1,492,220 2,980 1,529,105 2,969 1,596,476 2.958 1,595.150 2, 946 1,614,500 2,934 1,558,896 2.934 1,528,740
115,100 335,500 928,240 733,300 455,000 992,425 254.965 054,575 796,835 770,150 201.320 757.135 309,805 587,900 701,750 524,080 4,240.085 913, 506 4,942,340 042, 990 4, 373,420 585,570 4,838,725 093.370 4.419,535 699,655 4, 254,465 204.965 4, 223.195 423, 370 4,180, 030 841,095 4,226,065 217,335 4,379,495 846,735 4,486,150 012.605 4.656,115 952,104 4,804,500 913, 506 4. 942,340
1,007,559 1,060,742 1,321,674 1,551,862 1,646,821 1,888,473 2,138,300 476 2,358,413 19,800 Ui 2,550,719 19.800 H 2,725,204 19,800 > 2.973,526 19,800 g 3,532,441 19,800 5Q 4,105,926 19,800 1^ 4,611,970 19,800 J: 5,319,421 19.800 g 5,719,697 8,076,480 19,800 w
6,191,803 13,165,225 19,800 5,875,285 8,092,435 19,800 > 5.870,915 8,360,000 19,800 i j 5,946,362 8.815,175 19,800 hj 5,959,290 9,756,455 19,800 fel 6,953,345 10,205,215 19.800 Izj 5,952,458 10,511,286 19,800 O 5,955,442 10,717,450 19,800 M 6,073,850 11,659,710 19,800 1^ 6,039,824 12,227,310 19,800 6,137,274 12,411,326 19,800 6,125,716 12,606,050 19,800 6,191,803 13,166,225 19,800
N O T E . — I n c l u d e s u m e d e e m e d m a t u r e d securities ou t s t andh lg on wh ich in teres t has ceased.
1 T h i s association w a s created eflective Sept . 30, 1968, b y an act approved A u g . 1, 1968 (12 U . S . C . 1716b). I t assumed the assets and liabilities of t h e par t ic ipa t ion sales fund, t he m a n a g e m e n t and l iqu ida t ing functions fund, a n d t h e special assistance functions fund formerly of t h e Federa l Na t iona l Mortgage Association a n d cont inues to operate these funds .
2 Eflective Sept . 30, 1968, Federa l Na t iona l Mortgage Association w a s conver ted to p r iva t e ownership p m s u a n t to an act approved Aug . 1, 1968 (12 U . S . C . 1716b).
8 Effective Dec . 31, 1968, b a n k s for cooperatives and Federa l i n t e rmed ia t e credi t b a n k s were conver ted to p r iva te ownership p u r s u a n t to an act approved Oc t . 17,1968 (12 U . S . C . 1061(a)(1)).
CO
Digitized for FRASER http://fraser.stlouisfed.org/ Federal Reserve Bank of St. Louis

74 19 70 REPORT OF THE SECRETARY OF THE TREASURY
TABLE 25.-—Maturity distrihution and average length of marketable interest-bearing puhlic debt, June 30, 1946-70
[Dollar amoun t s in miUions. O n basis of daUy Treasu ry s ta tements]
Fiscal year Within lyear
I t o 6 years
6 to 10 years
10 to 15 years
15 to 20 years
20 years and over
Total Average length Years Months
B y call classes (due or first becoming callable)
1946 $62,091 $35,057 $32,847 $16,012 $21,227 $22,372 $189,606 7 4 1947 62,442 42,622 18,932 13,326 27,076 14,405 168,702 7 5 1948 49,870 46,124 10,464 12,407 41,481 160,346 7 1 1949 62,302 39,175 15,067 13,715 34,888 155,147 6 7 1950 42,448 61,802 15.926 19,281 25,853 155,310 6 2 1951 60,860 31,022 16,012 21,226 8,797 137,917 4 10 1952 70,944 29,434 13,321 20,114 6,594 140,407 4 1 1953 76,017 30,162 13,018 26,546 1,592 147,335 3 11 1954 63,291 38,407 27,113 19,937 1,606 150,354 4 : 3 1955 51,152 46,399 42,755 11,371 3,530 155,206 4 7 1956 64,910 36,942 40,363 8,387 4,351 154,953 4 2 1957 76,697 41,497 26,673 6,488 4,349 155,705 3 7 1958 73,050 39,401 45,705 657 2,258 6,604 166,675 4 2 1959 81,678 68,256 28,075 1,276 2,256 6,485 178,027 3 8 1960 79,182 81,296 14,173 1,123 2,484 5,588 183,845 3 5 1961 84,855 70,760 18,391 1,123 3,125 8,893 187,148 3 9 1962 89,905. 67,759 18,655 1,641 4,956 13,157 196,072 4 4 1963 91,202 68,580 20,522 4,304 4,525 13,975 203,508 4 7 1964 92,272 66,954 22.580 5,048 4,524 15,111 206,489 4 6 1965 99,792 51,377 33,053 4,192 3,040 17,241 208,695 4 9 1966 100,951 55,010 28,922 6,097 1,125 17,023 209,127 4 5 1967 105,837 69,824 21,006 6,087 1,121 16,797 210,672 4 1 1968 118,220 52,657 33,538 4.509 5,180 12,487 226,592 3 9 1969 110,921 55,759 37,610 4,505 6,720 10,594 226,107 3 9 1970 111,293 85,065 17,428 2.985 10,395 5,433 232,599 3 5
B y m a t u r i t y classes 2
1946 $61,974 $24,763 $41,807 $8,707 $8,754 $43,599 $189,606 9 1 1947 51,211: 21.851 36.662 13,009 5,588 41,481 168,702 9 5 1948 48,742 21,630 32,264 14,111 2,118 41,481 160,346 9 2 1949 48,130 32,562 16,746 14,111 8,710 34,888 155.147 8 9 1950 42,338 61,292 7,792 10,289 17,746 25,853 155,310 8 2 1951 43,908 46,526 8,707 8,754 21,226 8,797 137,917 6 7 1952 46,367 47,814 13,933 5,586 20,114 6,594 140,407 5 8 1953 65,270 36,161 15,651 2,117 26,546 1,592 147,335 5 4 1954 62.734 29,866 27,615 8,696 19,937 1,606 150,354 5 6 1955 49,703 39,107 34,253 17,242 11,371 3,530 155,206 5 10 1956 68,714 34,401 28,908 20,192 8,387 4,351 154,953 5 4 1957 71,952 40,669 12.328 19,919 6,488 4,349 155,705 4 9 1958 67,782 42,557 21,476 26,999 654 7,208 166,675 5 3 1959 72,958 58,304 17,052 20,971 654 8,088 178,027 4 7 1960 70,467 72,844 20,246 11,746 884 7,658 183,845 4 4 1961 81,120 58,400 26,435 8,706 1,527 10,960 187,148 4 6 1962 88,442 57,041 26,049 6,957 3,362 15,221 196,072 4 11 1963 85,294 58,026 37,385 2,244 6,115 14,444 203,508 5 1 1964 81,424 65,453 34,929 2,244 6,110 16,328 206,489 5 0 1965 87,637 56,198 39,169 2,609 5,841 17,241 208,695 5 4 1966 89,136 60,933 33,596 4,518 3,922 17,023 209,127 4 11 1967 89,648 71,424 24,378 4,514 3,912 16,797 210,672 4 7 1968 106,407 64,470 30,754 6,078 2,330 16,553 226,592 4 2 1969. 103,910 62,770 34,837 6,063 2,311 16,217 226,107 4 0 1970 105,530 89,015 15,882 5,745 4,780 11,048 232,599 3 8
1 Includes publ ic deb t Incurred to finance expendi tures of whol ly owned Gove rnmen t corporations and other business-type activities in exchange for which securities of the corporations and activities were issued to the Treasury .
2 All issues are classified to final m a t u r i t y except part ial ly tax-exempt bonds which have been classified to earliest call da te . T h e last of these bonds were caUed on Aug. 14, 1962, for redempt ion on Dec . 15,1962.
Digitized for FRASER http://fraser.stlouisfed.org/ Federal Reserve Bank of St. Louis
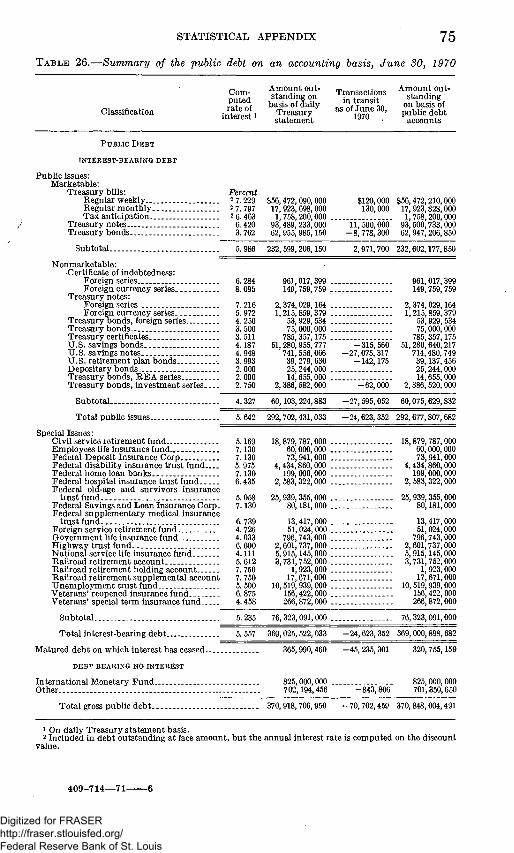
STATISTICAL APPENDIX 7 5
TABLE 26.—Summary of the public debt on an accounting basis, June 30, 1970
Classification
Computed rate of
interest i
Amount outstanding on
basis of daUy Treasury statement
Transactions in transit
as of June 30, 1970 .
Amount outstanding
on basis of pubhc debt
accounts
PUBLIC D E B T
INTEREST-BEARING DEBT
Pubhc issues: Marketable:
Treasury bills: Percent Regular weekly 27.229 $56,472,090,000 Regular monthly 27.797 17.923,698,000 Tax anticipation. 2 g. 463 1,755,200,000 .
Treasury notes 6.420 93,489,233,000 Treasury bonds 3.762 62,955,985,150
$120,000 $56,472,210,000 130,000 17, 923,828,000
1,758,200,000 11, 500,000 93, 600,733,000
-8,778,300 62,947,206,850
Subtotal. 6. 986 232,599,206,150
Nonmarketable: Certificate of indebtedness:
Foreign series Foreign currency series
Treasury notes: Foreign series Foreign currency series
Treasury bonds, foreign series Treasury bonds Treasury certificates. U.S. savingsbonds.. U.S. savings notes U.S. retirement plan bonds Depositary bonds Treasury bonds, REA series Treasury bonds, investment series.
Subtotal
Total pubhc issues..
Special Issues: CivU service retirement fund Employees life insurance fund Federal Deposit Insm-ance Corp Federal disabUity insurance trust fund Federal home loan banks Federal hospital insurance trust fund Federal old-age and survivors insurance
trustfund Federal Savings and Loan Insurance Corp. Federal supplementary medical insurance
trustfund Foreign service retirement fund Government life insurance fund Highway trust fund. National service life insurance fund Railroad retirement account. Raihoad retheraent holding account Raihoad retirement suppleraental account Unemployraent trust fund.. Veterans' reopened insurance fund Veterans' special tei-ra insurance fund
Subtotal
5.058 7.130
6.739 4.726 4.033 6.000 4.111 5.612 7.750 7.750 5.500 6.875 4.458
Total interest-bearing debt
Matured debt on which interest has ceased.
DEBT BEARING NO INTEREST
International Monetary Fund.. Other
2,971,700 232,602,177,850
6.284 8.095
7.216 5.972 4.250 3.500 3.511 4.187 4.948 3.993 2.000 2.000 2.750
961,017,399 149,759, 759
2,374,029,164 1,215,859,379
53, 929, 534 75,000,000 785,357,175
51,280, 955, 777 741, 556, 066 39,279,630 25,244,000 14,655,000
2,386, 582,000
-315 , 560 -27,075,317
-142.176
961,017,399 149,759,759
2,374,029,164 1,215,859,379
53,929,534 75,000,000
785, 357,175 51,280,640,217
714,480,749 39,137,456 25,244,000 14,655,000
2. 750
4. 327
5. 642
2,386, 582,000
60,103,224,883
292,702,431,033
-62,000
-27,595,052
-24,623,352
2,386,520,000
60,075,629,832
292, 677,807,682
5.169 7.130 7.130 5.975 7.130 6.435
18,879,787,000 60,000,000 73,941,000
4,434,860,000 199,000,000
2, 583,322,000
25,939,355,000 . 80,181,000 .
13,417,000 . 51,024,000 .
796,743,000 . 2,601,737,000 . 5,915,145,000 . 3,731, 752,000 .
1,923,000 . 17,671,000 .
10,519,939,000 . 156,422,000 . 266,872,000 .
18,879,787,000 60,000,000 73,941,000
4,434,860,000 199,000,000
2, 583,322,000
25,939,355,000 80,181,000
13,417,000 51,024,000
796,743,000 2,601,737,000 5, 915,145,000 3,731,752,000
1, 923,000 17,671,000
10, 519,939,000 156,422,000 266,872,000
5. 235
5. 557
76,323,091,000 ..
369,025,522,033
76,323,091,000
-24,623, 352 369, 000,898, 682
365,990,460 - 4 5 , 235,301
825,000,000 . 702,194,456 -843,806
320,755,159
825,000,000 701,350,650
Total gross p u b l i c d e b t . 370.918,706,950 - 70,702,459 370,848,004,491
1 On daUy Treasury stateraent basis. 2 Included in debt outstanding at face araount, but the annual interest rate is computed on the discount
value.
409 -714—71-
Digitized for FRASER http://fraser.stlouisfed.org/ Federal Reserve Bank of St. Louis
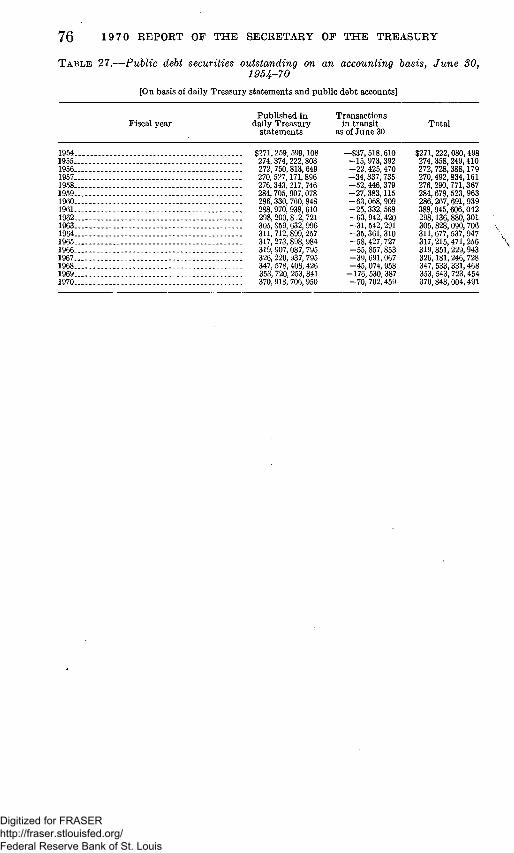
76 1970 REPORT OF THE SECRETARY OF THE TREASURY
TABLE 27.—Public debt securities outstanding on an accounting basis, June 30, 1954-70
[On basis of daUy Treasu ry s t a t emen t s and p u b h c deb t accounts]
PubUshed in Transac t ions Fiscal year daily T reasu ry in t ransi t T o t a l
s t a t ement s as of J u n e 30
1954 $271,259,599,108 —$37,518,610 $271,222,080,498 1955 -- 274,374,222,803 -15,973,392 274,358,249,410 1956 272.750,813,649 -22,425,470 272.728,388,179 1957 270,527,171,896 -34,337,735 270,492,834,161 1958 276,343,217,746 -52,446,379 276,290,771,367 1959 284,705,907,078 -27,383,115 284,678,523,963 1960 286,330,760,848 -63,068,909 286,267,691,939 1961 . . . . 288,970,938,610 -25,332,568 388,945,606,042 1962 298,200,8.2,721 -63,942,420 298,136,880,301 1963 305,859,632,996 -31,542,291 305,828,090,706 1964 311,712,899,257 -35,361,310 311,677,537,947 1965 317,273,898,984 -58,427,727 317,215,471,256 1966 319,907,087,795 -55,857,853 319,851,229,943 1967 326,220,937,795 -39,691,067 326,181,246,728 1968 347,578,406,426 -45,074,958 347,533,331,468 1969 353,720,253,841 -176,530,387 353,543,723,454 1970 370,918,706,950 -70,702,459 370,848,004,491
Digitized for FRASER http://fraser.stlouisfed.org/ Federal Reserve Bank of St. Louis

Ti BLE 28.—Description of public debt issues outstanding June 30, 1970 [On basis of Public Debt accounts, see "Bases of Tables"]
Description Date When redeemable or payable i
Interest payment date
Average price received (per $100)
Amount issued Amount rethed Amount outstanding 2
INTEREST-BEARING DEBT « Public Issues
Marketable: Treasury biUs: Series maturing
and approximate yield to maturity (%): 3 e
Regular weekly: [8.101..
July 2, 1970 \ 16.329.. [7.991-.
July 9. 1970 L (.6.408.. [7.783..
July 16. 1970 \ [6.310.. [7.663..
July 23, 1970 \ 16.476.-7.776-.
July 30.1970 \ 16.876..
Regular monthly: f7.313..
July 31, 1970 I 17.244..
Regular weekly: [7.719-.
Aug. 6, 1970 \ [7.184.. [7.387..
Aug. 13,1970....-^ [6.994.. [6.917..
Aug. 20, 1970..:."^... . . . . 16.827.. [6.974..
Aug. 27, 1970....-^ [7.133..
Footnotes a t end of table.
Jan. 2, 1970..
Apr. 2, 1970. Jan. 8, 1970..
Apr. 9, 1970. Jan. 16, 1970.
Apr. 16. 1970. Jan. 22. 1970.
Apr. 23,1970. Jan. 29, 1970.
Apr. 30,1970
July 31, 1969.
Oct. 31,1969.
Feb. 5, 1970.
May 7, 1970.. Feb. 13. 1970.
May 14, 1970. Feb. 19, 1970.
May 21, 1970. Feb. 26, 1970.
May 28, 1970.
July 2, 1970..
July 9, 1970..
July 16.1970.
July 23, 1970.
July 30.1970.
•July 31, 1970.
-Aug. 6, 1970.
•Aug. 13, 1970.
Aug. 20, 1970.
Aug. 27, 1970.
Sold at a discount; payable at par on maturity.
$95,927 {ifehange.-98.400 Cash
95-960 {grehange.-98.380 Cash
96-065 {g^Sange.-98.405 Cash
96.125 {g^Sa^,ge: 98.363 Cash
96-069 {grcSange.-98.262 Cash
92.585 {Exchang'e.' 94 507 I Cash y4.ou/ {Exchange.
96-098 {gfehange.-98.184 Cash
96-286 {g^Sange.-98.232 Cash
8«-5«^ {Efchange--98.274 Cash
5««* {gfcSali-o: 98.197 Cash
203. 1,800, 900, 306,
1,801, 1,000, 204,
1,802, 949, 254,
1,802, 897, 302,
1.801,
426,000. 00 245,000. 00 270,000. 00 666,000. 00 694,000. 00 980,000.00 976.000. 00 348,000. 00 350.000. 00 544,000. 00 653,000. 00 700,000. 00 938,000. 00 457,000. 00 200,000. 00
851,023,000. 00 ] 351,040,000. 00 374.632,000. 00 125,622,000. 00
823,987, 378,632.
1,800,730, 897,950, 302,714,
1,802,030. 894.985. 302,600,
1,789,770, 949, 547, 351,228,
1,801,980.
000. 00 1 ; 000.00 , 000. 00 J 000. 00 000.00 000. 00 J 000. 00 ] 000.00 } 000. 00 J 000. 00 ] 000.00 > 000. 00 J
$3. 001.941.000. 00
3. 009,340.000. 00
3, 007, 674.000. 00
3.006, 897,000. 00
3. 001, 595, 000. 00
1,702,317.000. 00
3, 003.349, 000. 00
3. 002,694,000. 00
2,987,355, 000. 00
3,102.755, 000. 00
Ui
H-t
Ui J — I
O >
% fel "
Digitized for FRASER http://fraser.stlouisfed.org/ Federal Reserve Bank of St. Louis

T A B L E 28.—Description of public debt issues outstanding J u n e 30, 1970—Continued GO
Descript ion D a t e When redeemable or payable i
In teres t p a y m e n t da te
Average price received (per $100)
A m o u n t issued A m o u n t ret ired A r a o u n t ou t s tand ing 2
I N T E R E S T - B E A R I N G D E B T a—Continued
P u b l i c I ssues—Cont inued
Marketable—Cont inued Treasu ry bills: Series ma tu r ing
a n d approximate yield to m a t m i t y (%):3 e _ C o n .
Regular m o n t h l y : [7.340.
Aug . 31, 1970. . . .^ 17.777.
Regular weekly : [6.773.
Sept . 3, 1970 { [6.824.
Sept. 10, 1970....|^-5|^-Sept. 17, 1970.. . . |6-707.
T a x ant ic ipat ion: Sept. 22, 1970 6.177.
Regular weekly: Sept. 24, 1970... .(6.184.
16.626. Regular m o n t h l y :
[7.350.
Sept . 30,1970.. . . |7g-Qj; '
Regula r weekly : Oct. 1, 1970 6.392. Oct.8, 1970 6.456. Oct. 16, 1970 6.247. Oct. 22, 1970 6.494. Oct.29, 1970 7.253.
Regular m o n t h l y : [7.127.
Oct. 31, 1970 Wjii'
Aug . 31,1969.
Dec . 1 ,1969. .
Mar. 5, 1970. .
Aug . 31, 1970.
ySept. 3, 1970... . J u n e 4, 1970 ] . Mar. 12, 1970 \ o ^ . .Q .Q-Q . J u n e 11, 1970 }^®P^- • "' ^^^0" . Mar. 19, 1970 ) g , ,7 IQ^Q . J u n e 18, 1970 ] ^ ^ ^ ^ - • ' •^^^"--
. Mar. 26, 1970. Sept . 22, 1970..
. Mar. 26, 1970 \ o ^ . 04 1970
. J u n e 25, 1970 S^^"^^- ^ ' "^970..
. Sept . 30, 1969 l
. " D e c . 31, 1969 Sept. 30,1970..
Apr . 2, 1970. Oct. 1, 1970 . . Apr . 9, 1970 Oct. 8, 1970 . . Apr . 16, 1970- Oct . 15, 1970. Apr . 23, 1970. Oct. 22,1970. Apr . 30, 1970- Oct. 29,1970.
Oct. 31, 1969.
F e b . 2 ,1970 . . Oct. 31, 1970.
old at a discount; payable at par on matmity.
$92,558
94.102
96.576
98.275 96.598 98.285 96.609 98.298
96.911
96.874 98.325
92.548
94.084
96.769 96.737 96.842 96.717 96.333
92.774
94.185
(Cash (Exchange. Cash
(Cash (Exchange. Cash Cash Cash Cash Cash
Cash
Cash. Cash
(Cash (Exchange. (Cash 1 Exchange. Cash Cash Cash Cash Cash
(Cash (Exchange. (Cash (Exchange.
$864,451,000.00 ] 336,075.000.00 \ $1,701,192,000.00 500, 666.000. 00 j
326;928;Z§§ 1 - - 3,102,590,000.00 1,800,910,000. 00 ) 1,301,270,000.00) 3,104,310,000.00 1,803, 040,000. 00 j 1,303,370,000.00 ) 3,105,940,000.00 1,802,570,000.00 }
1,758,200,000.00 . 1,758,200,000.00
};I2?;??2;Z:S} - MOM^.OOO.OO 685,412, 000. 00 ] 319,852,000.00 I 1,605,392,000.00 383,396,000.00 ( 116,732,000. 00 J
1.301.180.000.00 1.301.180.000.00 1,304,990,000.00 1,304,990,000.00 1,300,850,000.00 1,300,850,000.00 1,302,550,000.00 1,302,550,000.00 1,301,230,000.00 1,301,230,000.00
692,170,000. 00 I 310,367,000.00 I . 1,504,368,000.00 301,015.000.00 f . ' . 200,816.000. 00 J
fel O
o fel
W fel
Ui fel o fti fel > K|
o fel
W fel
> Ui
d
Digitized for FRASER http://fraser.stlouisfed.org/ Federal Reserve Bank of St. Louis

Regular weekly : N o v . 5, 1970. . . N o v . 12, 1970.. N o \ . 19, 1970.. N o v . 27, 1970..
Regular m o n t h l y :
N o v . 30, 1970..
Regula r weekly: . Dec . 3, 1 9 7 0 . . . Dec . 10, 1970-. Dec . 17, 1970. . Dec . 24, 1970. .
Regular m o n t h l y :
Dec . 31, 1970. .
J a n . 31 .1971 . . .
F e b . 28 .1971 . .
Mar. 31 ,1971 . .
A p r . 30. 1971 . . May 31, 1971. . . J u n e 30. 1971 . .
T o t a l T r e
m y notes:^
. . . 7 . 4 9 3 . .
. . . 7 . 2 0 1 . .
. . . 6 . 9 9 6 . .
. . . 7 . 3 5 6 . .
[7 .591. .
•-|6.9'9"5V.'
. . . 6 . 8 5 8 . .
. . . 6 . 8 9 5 . .
. . . 6 .946 . -
. . . 6 . 9 2 9 . .
( 7.561.
[ 6. ioi. j 7.533.
1 6.843. J 6.932.
I 7. 353. . . ( 6.132-
1 7.068. . . 6.814. . . 7.277. . . 7.079.
asury biU
5% Series A-1970 (effective ra te 4.9412%).
May 7, 1970 May 14,1970. . . . May 21, 1970.. . . May 28, 1970.. . .
N o v . 3 0 , 1970.. .
Mar. 2, 1 9 7 0 . . . .
J u n e 4 , 1 9 7 0 . . . . J u n e 11, 1970 . . . J u n e 18, 1970 . . . J u n e 25, 1970 . . .
Dec . 31, 1969 . . .
Mar. 31, 1970 . . . J an . 31, 1970. . . .
Apr . 30, 1970 . . . F e b . 28, 1970 . . .
J u n e l , 1970 Mar. 31, 1970 . . . J u n e 30, 1970 . . . Apr . 30, 1970 . . . May 31, 1970.. . . J u n e 30, 1970 . . .
3
F e b . 15, 1966 . . .
. . . N o v . 5, 1970
. . . N o v . 12,1970
. . . N o v . 19,1970.
. . . N o v . 27,1970
INOV.30, 1970
. . . Dec . 3, 1970.
. . . Dec . 10, 1970
. . . Dec . 17, 1970
. . . Dec . 24,1970
1 p e c . 31, 1970
[ j a n . 31,1971
[Feb . 28, 1971
--JMar. 31, 1971 . . . Ap r . 30, 1971 . . . May 31, 1971 . . . J u n e 30,1971
. . . N o v . 16, 1970
Sold a t a discount ;
f a t par payab le on \
m a t u r i t y .
May 15-Nov. 1 5 . .
96.212 96.359 96.463 96.261
92.303
94.696
96.533 96.614 96.488 96.497
92. 334
93. 783
92. 362
94. 753
92. 971
94.445 93. 783 94. 620 93. 091 92. 622 92. 823
Cash Cash Cash C a s h .
(Cash (Exchange . (Cash (Exchange .
C a s h . Cash Cash Cash
(Cash (Exchange . Cash
(Cash (Exchange . Cash
(Cash (Exchange . Cash Cash Cash Cash C a s h . . . : . . Cash
. Exchange a t p a r . . . Exchange a t 100.25 Exchange a t 100.30 Exchange a t 100.45 Exchange a t 100.90
S u b t o t a l .
6M% Series D-1970 (effective May 15, 1969 Aug . 16,1970 F e b . 15-Aug. 1 5 . . . Exchange a t 99.95 ra te 6.4171%).
5 k % Series A-1971 (effective Aug . 15, 1966 May 15,1971. May 15-Nov. 15. ra te 5.2189%).
Exchange a t p a r . . Exchange a t 100.10 Exchange a t 100.35 Exchange a t 100.55
S u b t o t a l .
1,301,030,000.00 1,301,030,000.00 1,301,680,000.00 1,301,680,000.00 1,303,530,000.00 1,303,530,000.00 1,300,780,000.00 1,300,780,000.00
725, 732,000. 00 ] 275,467,000.00 1 1.601,273,000.00 349,717,000.00 [ 150,357, 000. 00 J
1,306,400,000.00 1,306,400,000.00 1,302,860,000.00 1,302,860,000.00 1,302,670,000.00 1,302,670,000.00 1,302,570,000.00 1,302,570,000.00
750, 037,000. 00 ] 252,026.000.00 } 1,502,463,000.00 500,400,000.00 J 2 669,865,000.00] g 333.181,000.00 } 1,503,356,000.00 | j 500,310, 000. 00 j M 941, 591,000. 00 ] 2 258,556,000.00 \ 1,700,107,000.00 H 499,960,000.00 | O
1,201,060,000.00) 1,701,620,000.00 > 500, 560,000. 00 j tT"
1,200,150,000.00 1,200,150.000.00 1,200,170,000.00 1,200,170,000.00 > 1,201,430,000.00 1,201,430,000.00 2
^ 76.154,238,000.00 76,154,238,000.00 S
2,839,566,000.00 5 1,230,048,000.00
657,054,500.00 2,624,688,000.00
324.230,500.00
7,675,487,000. 00 $1, 000. 00 7,675.486, 000. 00
2,329,388.000.00 2.329,388,000.00
2,577.696,500.00 517,352,000.00 583.842,000.00 586,140,500.00
4,265.031,000.00 4,265,031,000.00
Footnotes a t end of tab le . CO
Digitized for FRASER http://fraser.stlouisfed.org/ Federal Reserve Bank of St. Louis
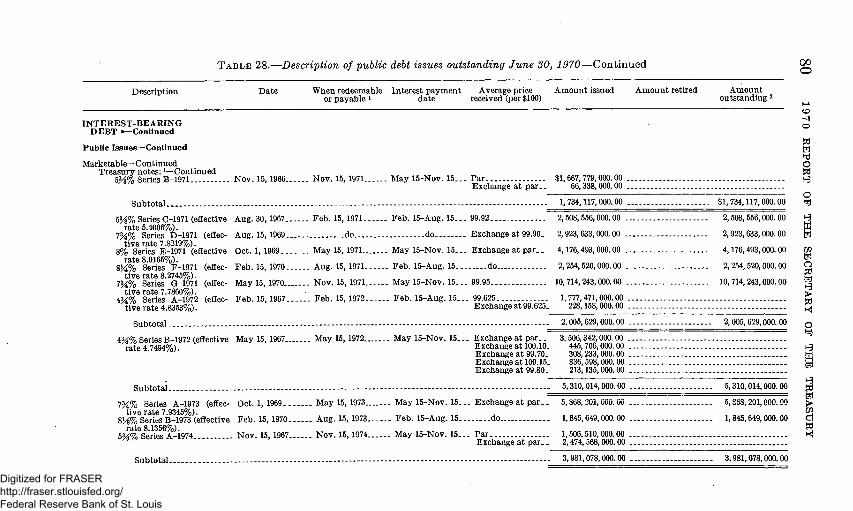
TABLE 28.—Description of puhlic debt issues outstanding June 30, 1970—Continued ^
Description Date When redeeraable Interest payraent Average price Amount issued Amount retired Amount or payable i date received (per $100) outstanding 2
— — — ^ — • C D
INTEREST-BEARING o DEBT a—Continued
PubUc Issues—Continued frj
Marketable—Continued O Treasury notes: f—Continued ^
5 ^ % Series B-1971 Nov. 15, 1966 Nov. 15, 1971 May 15-Nov. 15 . . . Par $1,667,779,000.00 UJ Exchange at par . . 66,338,000.00
O Subtotal ---- 1,734,117,000.00 $1,734,117,000.00 fel
5H% Series C-1971 (effective Aug. 30,1967 Feb. 15, 1971 Feb. 15-Aug. 15. . . 99.92 2,508,556,000.00 2,508,556,000.00 ^ rate 5 4006%) W
7M% Series D-1971 (effec- Aug. 15,1969.... ..do do Exchange at 99.90. 2,923,633,000.00 2,923,633,000.00 fel tive rate 7.8219%).
8% Series E-1971 (effective Oct. 1, 1969. May 15, 1971.. May 15-Nov. 15. . . Exchange at par . . 4,176,493,000.00 4,176,493,000.00 Ui rate 8.0165%). S
8K% Series F-1971 (effec- Feb. 15, 1970 Aug. 15, 1971 Feb. 15-Aug. 15 do 2,254,620,000.00 2,254,520,000.00 Q tive rate 8.2745%). 2
7M% Series G-1971 (effec- May 15,1970 Nov. 15,1971 May 15-Nov. 15 . . . 99.95... 10,714,243,000.00 10,714,243,000.00 g tive rate 7.7860%). S
4M% Series A-1972 (effec- Feb. 15, 1967. Feb. 15, 1972 Feb. 15-Aug. 15. . . 99.625 1,777,471,000.00 g tive rate 4.8353%). Exchange at 99.625. 228,158,000.00 ^
Subtotal- - - 2,005,629,000.00 2,005,629,000.00 Q 43^% Series B-1972 (effective May 15, 1967 May 15,1972 May 16-Nov. 15 . . . Exchange at par . . 3,506,342,000.00
^^47494%^) Exchange at 100.10. 445.706,000.00 J ' ' Exchange at 99.70. 308,233,000.00 hj
Exchange at 100.15. 836,698,000.00 H Exchange at 99.80. 213,135,000.00
Subtotal - 5,310,014,000.00 5,310,014,000.00 ^ 7M% Series A-1973 (effec- Oct. 1,1969.. May 15,1973 May 15-Nov. 16. . . Exchange at pa r . . 5,868,201,000.00 6,858,201,000.00 >
tive rate 7.9345%). CO 8>g% Series B-1973 (effective Feb. 15, 1970. Aug. 16, 1973 Feb. 15-Aug. 15 do 1,845,649.000.00 1,846,649,000.00 CJ
rate 8.1356%). ^ 5%% Series A-1974 . . . Nov. 15, 1967 Nov. 15,1974 May 15-Nov. 15 . . . Par 1.506,510,000.00.. >< u/4/o^« ea . Exchange at par . . 2,474,668,000.00
Subtotal - - - 3,981,078,000.00 3,981,078,000.00
Digitized for FRASER http://fraser.stlouisfed.org/ Federal Reserve Bank of St. Louis

65^% Series B-1974 (effective Aug. 16, 1968 Aug. 15,1974 Feb. 16-Aug. 15. . . 99.62. 5,414,039,000.00 . rate 6.7007%). Exchange at 99.62. 4,869,883,000.00
Subtotal 10,283,922,000.00 10,283,922,000.00
6^% Series A-1976 (effective Feb. 15, 1968 Feb. 15, 1976. Feb. 15-Aug. 15. . . Exchange at pa r . . 2.171,294.000.00 rate 6.7371%). Exchange at 99.40. 607,225,000.00
Exchange at 99.15. 1.107,439,000.00 Exchange at 99.85. 929,137,000.00 Exchangeat 98.85. 433,348,000.00
Subtotal _ 6,148,443,000.00 5,148,443,000.00
6% Series B-1975_. May 15, 1968 May 15,1975 May 15-Nov. 15. . . Exchange at par. _ 6,769,985,000.00 6,759,985,000.00 61^% Series A-1976 (effective Feb. 15, 1969 Feb. 15,1976. Feb. 15-Aug. 16.. . Exchange at 99.75. 3,738,758,000.00 3,738,768,000.00
rate 6.2947%) 63? % Series B-i976.. May 15, 1969 May 15, 1976....r.. May l&-Nov. 16.. . Exchange at p a r . . 2,697,016,000.00 2,697,016,000.00 Ui 7M% Series C-1976 (effective Oct. 1,1969. Aug. 15, 1976. Feb. 15-Aug. 16.. . Exchange at 99.60. 1,682,961,000.00 1,682,961,000.00 H
rate 7.6089%). > 8% Series A-1977 (effective Feb. 16, 1970 Feb. 15, 1977. do.. . Exchange at p a r . . 5,168,470,000.00 5,168,470,000.00 H
rate 8.0069%). Ui 13> % Series EO-1970. Oct. 1, 1965 Oct. 1, 1970. Apr. 1-Oct. 1. do 113,131,000.00 . . . 113,131,000.00 H 11^% Series EA-1971. Apr. 1, 1966 Apr. 1, 1971 do.. do 35,435,000.00 35,435,000.00 t | 1K%) Series EO-1971. Oct. 1, 1966. Oct. 1, 1971 do do 71,827,000.00 71,827,000.00 > li^% Series EA-1972. Apr. 1, 1967 Apr. 1, 1972 do do 33,951,000.00 33,961,000.00 f« 1K% Series EO-1972. Oct. 1, 1967. Oct. 1, 1972.. do.. do 33,217,000.00 33,217.000.00 1J^% Series EA-1973. Apr. 1.1968 Apr. 1. 1973 do do. 33,750.000.00 33,750,000.00 1M% Series EO-1973 Oct. 1,1968. Oct. 1 1973. do . . . . do 29,764,000.00.... 29,764,000.00 1>^% Series EA-1974_ Apr. 1, 1969 Apr. 1. 1974 do. . . . do 33,883.000.00 33,883,000.00 d 1J^% Series E0-1974. Oct. 1,1969 Oct. 1, 1974. do -....do 41,702,000.00 41,702,00000 g li^% Series EA-1975 Apr. 1,1970 Apr. 1, 1975 do . . .do 2,480,000.00 2,480,000.00 zJ
U
Treasury bonds: ^ 4% of 1970 (effective rate June 20, 1963 On Aug. 15, 1970.. Feb. and Aug. 15 . P a r . . . 1,905.811,000.00.
4.0773%). g Exchange at 99.05 . 972,382,000.00 . Exchange at 98.35 . 164,679,000. 00 . Exchange at 98.15". 211,391,000.00 . Exchange at 98.20 . 221,389,000.00 . Exchange at 100.25 653,688,000.00 .
Subtotal 4,129,240,000. 00 3, 500. 00 4,129,236, 500. 00
Footnotes at end of table.
O
^
Total Treasury notes. 93,500,734,000.00 $1,000.00 93,500,733.000.00 tt
00
Digitized for FRASER http://fraser.stlouisfed.org/ Federal Reserve Bank of St. Louis

T A B L E 28.—Description of puhlic debt issues outstanding J u n e 30, 1970—Continued
(X)
to
Descript ion D a t e When redeemable Interes t p a y m e n t Average price A m o u n t issued A m o u n t ret ired or payab le i da t e received (per $100)
A r a o u n t ou ts tanding 2
fel Hd O
O fel
fel
Ui fel O
fel y ^ > y<
o fej
W fel
s fel
> Ui
d
I N T E R E S T - B E A R I N G D E B T a—Continued
P u b l i c I ssues—Cont inued
Marke tab le—Cont inued T r e a s u r y bonds : f—Conthiued
2y2% of 1967-72 J u n e 1, 1945 On a n d after Dec . 15, 1970; on J u n e 15, 1972.4 5
On a n d after Dec . 15,1970; on Dec . 15, 1972.4 8
2 K % of 1966-71 D e c . l , 1944 On Mar. 16. 1971*.. Mar. and Sept . 15 . P a r . . 3,447,511,500.00 . Exchange a t p a r . . . 33,353,500.00
2 i^% of 1967-72 -. N o v . 15, 1946..
J u n e and Dec. 15 . . P a r $7,967,261,000.00
-do do 11,688,868.500.00
$6, 729, 700, 500. 00 $1, 237. 560, 500. 00
9,114, 990, 500. 00 2, 573,878, 000. 00
Subto ta l 3,480,865,000.00 2,261.283,000.00 1,219,582,000.00
2 i^% of 1967-72 Oc t .20 , 1941 O n a n d a f t e r Mar . a n d Sept . 15 . P a r . 2,527,073,950.00 . Mar. 15,1971; Exchange a t p a r . . . 188,971,200.00 . on Sept . 15, 1972.5
S u b t o t a l . . 2,716,045,150.00 764.902,300. 00 1,951,142,850. 00
4% of 1971 (effective r a t e Mar. 1.1962 On A u g . 1 5 , 1 9 7 1 . . F e b . and Aug . 16 . Exchange a t p a r . . . 1,154.257.500.00. 3.8499%). g E x c h a n g e a t 1 0 2 . . . 1,651,369,000.00
Subto ta l 2,805,626,500.00 8,000. 00 2,805,618, 500. 00
3J^% of 1971 (effective r a t e May 16, 1962 On N o v . 16 ,1971 . . May a n d N o v . 15. Exchange a t 99.50 . e 1,245.537.000. 00 . 3.9713%). 8 Exchange a t 98.90 . 693,473,000.00
Exchange a t 99.10 . 93,607,000. 00 . Exchange a t 99.30 . 727,803,000. 00
Subto ta l 2,760,420,000.00 5,000. 00 2,760,415,000. 00
Digitized for FRASER http://fraser.stlouisfed.org/ Federal Reserve Bank of St. Louis

4 % of 1972 N o v . 15,1962.. 4 % of 1972 (effective ra te Sept . 15,1962..
4.0840%). g
On F e b . 15,1972. . F e b . a n d A u g . 15 . . Exchange a t p a r . . 2,343,511,000.00 On Aug . 15,1972 do Exchange a t 98.80. 378,792,000.00 .
Exchange a t 99.30. 370.327,000.00 . Exchange a t 99.40. 1,570,407,000.00 . Exchange a t 99.70. 259,021,000.00 .
1,500. 00 2,343, 509, 500. 00
Subtotal. 2,578,547,000.00 2,578,547,000.00
4 % of 1973 (effective ra te Sept . 15,1963.. 4.1491%). g
On A u g . 15 ,1973 . . F e b . a n d Aug . 15.. Exchange a t 98.85. Exchange a t 97.90. Exchange a t 98.55. Exchange a t 98.20. Exchange a t 99.60. Exchange a t 99.30.
1,120,883,000. 00 . 213, 528,000. 00 . 782,366,000. 00 . 340,079,000.00 . 720,541,000. 00 . 716,437,000.00 .
Subto ta l 3,893,834,000.00 6, 500. 00 3,893,827,500. 00
4J^% of 1973 (effective ra te J u l y 22,1964. 4.2241%). g
On N o v . 15,1973 <_ May a n d N o v . 15.. Exchange a t 98.75. Exchange a t 98.90. Exchange a t 99.05. Exchange a t 99.10. Exchange a t 99.25. Exchange a t 99.30, Exchange a t 99.45. Exchange a t 99.85.
232,162,000. 00 . 334,055,000.00 . 769,304,000.00 . 574,915,000.00 . 343,825,000.00 . 296,850,500.00 .
1,302,758,000.00 . 603,341,000.00 .
Sub to ta l ^ . 4,357,210,500.00 11,418,500. 00 4,345,792,000. 00
4 H % Of 1974 (effective ra te J a n . 16,1966.. 4.1721%). g
On F e b . 15,1974 <_ F e b . a n d Aug . 15.. Exchange a t 99.05. Exchange a t 99.25. Exchange a t 99.35. Exchange a t 99.45. Exchange a t 99.50. Exchange a t 99.55. Exchange a t 99.90. Exchange a t 100.25.
140,326,000. 00 . 399,959,000.00 . 493,462,000.00 . 146,917,000. 00 . 415,742,000. 00 . 333,760,000. 00 . 461,289,000.00 . 738,918,500.00 .
ZP
I—I
Ui y ^ H-t O > > Hd
fel
Subto ta l 3,130,373,500.00 3,009,000. 00 3,127,364,500. 00
i } i % of 1974 (eflective ra te May 15,1964. 4.2306%).
Subtota l . -
Footnotes a t end of tab le .
O n May 15,1974 *. May a n d N o v . 15 . . Exchange a t p a r . . 1,631,898.500.00 . Exchange a t 2.061,686,000. 00 .
100.25. 3,593,583,500.00 10,943,000.00 3,682,640,500.00
00 CO
Digitized for FRASER http://fraser.stlouisfed.org/ Federal Reserve Bank of St. Louis

TABLE 28.—Description of puhlic debt issues outstanding June 30, 1970—Continued ^
Description Date When redeemable Interest payment Average price Amount issued Amount retired Amount or payable i date received (per $100) outstanding 2
—___ __ ^ INTEREST-BEARING 2
DEBT »—Continued
Public Issues—Continued ^ • • - • : • . - h d
Marketable—Contmued . . . - - . ^ Treasury bonds'—Continued . . . . . HJ
3J^% of 1974 (effective rate Dec. 2,1957 On Nov. 15,1974 «. May and Nov. 15.. Par $653,811,500.00 v 3.9517%). g Exchange at 98.50- 136,239,000.00
Exchange at 99. .- . 517,421,500.00 o Exchange at 98.30- 313,758,000.00 fel Exchange at 99.10. 373,227,000.00 Exchange at pa r - . 250,315,000.00 H
Subtotal - --. 2,244,772,000.00 $5,528,500.00 $2,239,243,500.00 fel
Ui 4M% of 1975-86 (effective Apr.5, I960.. .Onandaf ter - May and Nov. 15.. Par 469,533,000.00 . . . . g
rate 4.2631%) .g May 16,1976; on Exchange at 101.16. 52,853,500.00 9 May 15,1985.4 Exchange at 99.95. 397,057.000.00... g
Exchange at 99.25. 105.792,000.00 g Exchange at 99.10-- 75,642,000.00 I^ TPvr.ViQTitro of QQ (M l i f t 7SS 000 00 r ' . Exchange at 99.05. 116,733,000. 00
Subtotal - 1,217,610,600.00 4,096,000.00 1,213,514,500.00
Exchange at 100.25. 662,695,500.00 . Exchange at 100.50. 209,680,500. Op .
3M:% of 1978-83 . . M a y 1,1953 Onandafter June and Dec. 16.. Par 1,188,769,175.00 . . 2 Junel6,1978; Exchange at p a r . . 417,314,825.00 on June 15,1983.4 yq
Subtotal - - - 1,606,084,000.00 59,682,500.00 . 1,546,401,500.00 §
4% of 1980 (effective rate Jan. 23, 1969 On Feb. 15, 1980 4. Feb. and Aug. 15.. 99. 884,115,500.00 . . j 40454%>.g 99.50.. 71Q2,0QQ.00. S
Exchangeat99 196,465,000.00 ^ ' Exchange at 99.10. 17,346,000.00 . >
Exchange at 99.30. 2,113,000.00 ZP - - Exchange at-99.50. 7 107,341,500.00 '" d
Exchange a t 99.60.. 212,994,-500.00 . . . . " ' W Exchange a t 98.80. 420,040,000.00 .- y^
Subtotal. . . . . . . ^ . . . . . . . - . . . - . . : , . . . -...._ 2,611,693,500.00 17,184,000.00 2,594.509,600.00
Digitized for FRASER http://fraser.stlouisfed.org/ Federal Reserve Bank of St. Louis
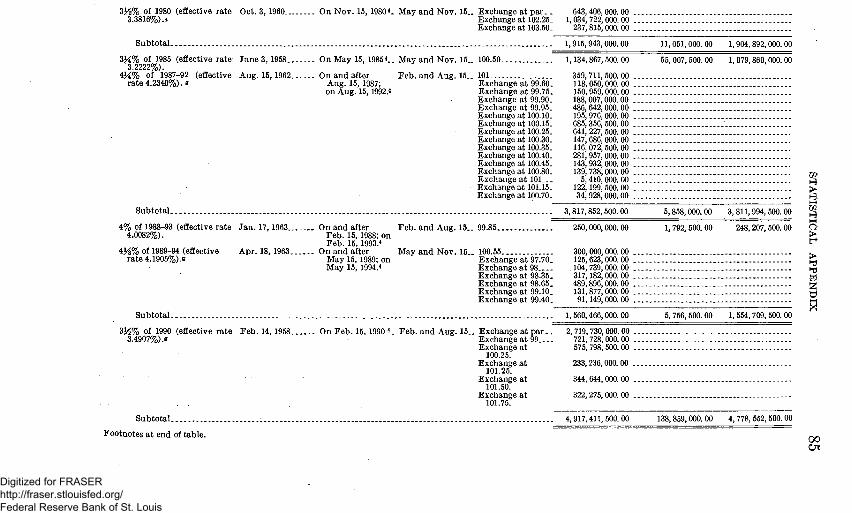
33^% of 1980 (effective ra te Oct . 3, I960.. 3.3816%) .g
On N o v . 15, 19804. May a n d N o v . 16.. Exchange a t p a r . _ Exchange a t 102.25. Exchange a t 103.50.
643,406,000.00 . 1,034,722,000.00 .
237,815,000.00 .
Sub to ta l 1,915,943,000.00 11, 051,000. 00 1, 904, 892, 000. 00
3 K % of 1985 (effective r a t e J u n e 3, 1958.. 3 2222%).
4M% of 1987-92 (effective Aug . 15, 1962. ra te 4.2340%). g
O n M a y 15, 19854.. M a y a n d N o v . 16.. 100.50.. 1,134,867,500.00 55.007,500. 00 1, 079,860,000. 00
On and after Aug . 15, 1987; on Aug. 15,1992.4
F e b . a n d Aug . 15. . 101 359,711,500.00 Exchange a t 99.60. 118,050,000. 00 Exchange at 99.76. 150,959,000.00 Exchange a t 99.90. 188,007,000.00 Exchange a t 99.95. 486,642,000. 00 Exchange a t 100.10. 195,976,000. 00 Exchange at 100.15. 685,356,500. 00 Exchange at 100.25. 641, 227,500. 00 Exchange at 100.30. 147,686,000. 00 Exchange a t 100.35. 116,072,600. 00 Exchange at 100.40. 281,957,000.00 Exchange at 100.45. 143,932,000. 00 Exchange at 100.80. 139, 738,000.00 Exchange a t 1 0 1 . . . 5,410,000. 00 Exchange at 101.15. 122,199,500. 00 Exchange a t 100.70. 34,928,000.00
S u b t o t a l . . . 3,817,852,500.00
4% of 1988-93 (effective r a t e J a n . 17,1963.. 4.0082%).
43^% of 1989-94 (effective r a t e 4.1905%) .g
A p r . 18, 1963.
On and after F e b . 16,1988; on F e b . 16, 1993.4
On and after May 15, 1989; on May 16, 1994.4
F e b . a n d A u g . 15 . . 9 9 . 8 5 . . .
May a n d N o v . 16 . . 100.66 Exchange a t 97.70. E x c h a n g e a t 98 Exchange a t 98.35. Exchange a t 98.65. Exchange a t 99.10. Exchange a t 99.40.
250,000,000.00
300,000,000.00 125,623, 000. 00 104,739,000. 00 317,182,000. 00 489,896.000. 00 131,877,000. 00 91,149,000. 00
Sub to ta l 1,560,466,000.00
ZP
1-3. h-t ZP y ^ H-l o > > yn ^
- fel
w H-* X-
5, 766, 500. 00 1, 654.709, 500. 00
6,868,000. 00 3,811,994,500. 00
1,792, 600. 00 248.207.500.00
3M% Of 1990 (effective r a t e F e b . 14,1958. 3.4907%).g
On F e b . 15,1990 4. F e b . and A u g . 16 . . Exchange a t p a r . E x c h a n g e a t 9 9 . . . Exchange a t
100.25. Exchange a t
101.25. Exchange a t
101.50. Exchange a t
101.75.
2,719, 730,000. 00 . 721,728,000.00 . 575,798,500.00 .
233,236.000.00 .
344. 644, 000. 00 .
322,275,000.00 .
Sub to ta l
Foo tno tes a t end of t ab le .
4,917,411,500.00 138,859. 000. 00 4,778, 552, 500. 00
0 0 CTl
Digitized for FRASER http://fraser.stlouisfed.org/ Federal Reserve Bank of St. Louis
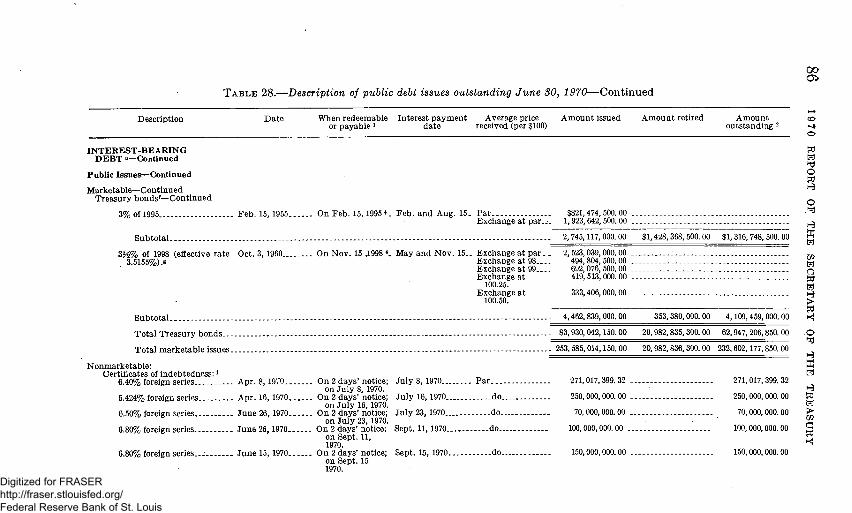
oo
T A B L E 28.—Description of public debt issues outstanding J u n e 30, 1970—Continued
Description Date When redeeraable Interest payraent Average price Araount issued Amount retired Amount ca or payable i date received (per $100) outstanding 2 <j
_ _ _ ^ ^ o
INTEREST-BEARING W
DEBT a—Continued g
Public Issues—Continued 2
Marketable—Continued ^ Treasury bondsf—Continued ^
3%ofl995 Feb. 15, 1955 On Feb. 15. 1995 4. Feb. and Aug. 15. Par $821,474,500.00 ^ Exchange at par..-. 1,923,642,500.00 ^
Subtotal - ---- 2,745,117,000.00 $1,428,368,500.00 $1,316,748,500.00 W
3i^% of 1998 (effective rate Oct. 3,1960 On Nov. 15 ,1998 4. May and Nov. 15.. Exchange at p a r . . 2,523,039,000.00 . . : __ 3.5155%).g Exchange at 98. . . . 494,804,500.00 )£
Exchange at 99. . . . 692,076,500.00 ^ Exchangeat 419,513,000.00 KH
100.25. g Exchangeat 333,406.000.00 H3
100.50. > H ^
Subtotal - - --- 4.462.839,000.00 353,380,000.00 4,109,459,000.00 Kl
Total Treasury bonds.. . - --- 83,930,042,150.00 20.982,835,300.00 62,947,206,850.00 O • fel
Total raarketable issues 253,585,014,150.00 20.982.836,300.00 232,602,177,850.00 — T
Nonmarketable: ffi Certificates of indebtedness:' feJ
6.40% foreign series.... Apr. 8, 1970 On 2 days'notice; July 8, 1970 Par 271,017.399.32 271,017,399.32 on July 8, 1970. tJ
6.424% foreign series Apr. 16, 1970 On 2 days'notice; July 16, 1970 .do. . . 250,000,000.00 250.000,000.00 g on July 16, 1970. H
6.50% foreign series June 26, 1970 On 2 days'notice; July 23,1970.. do 70,000,000.00 70,000,000.00 >; on July 23, 1970. %
6.80% foreign series June 26,1970 On 2 days'notice; Sept. 11, 1970 ..do 100,000,000.00 100,000,000.00 g onSept. 11, 3 1970. ^
6.80% foreign series... June 15,1970 On 2 days'notice; Sept. 15, 1970. do.. 150,000,000.00 150,000,000.00 on Sept. 15 1970.
Digitized for FRASER http://fraser.stlouisfed.org/ Federal Reserve Bank of St. Louis

..do.,
.do..
6.65% foreign series.. . . . J u n e 24, 1970 On 2 days' notice; Sept. 24. 1970 on Sept. 24, 1970.
6.45% foreign series... June 30, 1970 On 2 days' notice; Sept. 30, 1970 on Sept. 30, 1970.
Total certificates, for-eign series.
8.08% foreign currency series. Jan. 23, 1970 On 2 days' notice; July 23, 1970 430. 9000 Swiss on July 23,1970. francs.
8.125% foreign currency series. Feb. 6, 1970. On 2 days' notice; Aug. 6, 1970 430.2700 Swiss on Aug. 6, 1970. francs.
Total certificates, for-eign cm-rency series.
Treasury notes:' 6.25%, foreign series. May 1, 1969.. On Aug. 3, 1970... Feb. and Aug. 3 . . . Par . : . . . . 6.40% foreign series Dec. 31,1968 On Nov. 2,1970 s.. May and Nov. 2 do 7.85% foreign series Sept. 23,1969 On Dec. 21, 1970 s. June and Dec. 21 do 7.80% foreign series Sept. 24, 1969 OnJan. 18, 19718. Jan. and July 18 do 8.00%, foreign series... Oct. 1, 1969 On Feb. 18, 1971«. Feb. and Aug. 18 do 7.35% foreign series Oct. 31, 1969 On Mar. 25, 1971 s. Mar. and Sept. 25 do 7.95% foreign series Jan. 15, 1970 On Apr. 22, 19718. Apr. and Oct. 22 do 8.10% foreign series Jan. 30, 1970. On May 20, 1971 s. May and Nov. 20 do 7.60% foreign series May 15, 1970 On May 27, 19718_ May and Nov. 27 do 7.125% foreign series Mar. 2, 1970 On June 17, 19718. JuneandDec. 17 do 7.60% foreign series May 15, 1970.. On June 24, 19718. JuneandDec. 24 do 6.70% foreign series Mar.26, 1970 On July 22, 19718. Jan. and July 22.. do 6.79% foreign series Mar. 31,1970. On July 29, 19718. Jan. and July 29 do 6.84%, foreign series Apr. 9, 1970 On Aug. 26,19718_ Feb. and Aug. 26 do 7.55% foreign series June4,1970.. do. . _. d o . do . - . . 7.46% foreign series Apr. 30, 1970 On Sept. 23, 19718. Mar. and Sept. 23 do 7.65% foreign series June 11, 1970 On Oct. 28,19718.. Apr. and Oct. 28 do 7.65% foreign series June 18,1970. do do do . . 7.63% foreign series June 25,1970 On Nov. 18, 19718. May and Nov. 18 do 5.70% foreign series June 27,1968 OnDec. 27, 1972 8. June and Dec. 27 do 6.00% foreign series July 1, 1968 OnJan. 2, 19738.. Jan.andJuly2 do 6.00%, foreign series July 2, 1968. do do do 5.35% foreign series Sept. 9, 1968 On Mar. 9, 1973 8.. Mar. and Sept. 9 do . . 5.50% foreign series Oct. 9, 1968 On Apr. 9, 1973 s.. Apr. and Oct. 9 do . . 5.50% foreign series Nov. 22, 1968 OnMay 22,1973 s.. May and Nov. 22 do . . 6.00% foreign series Dec. 24, 1968 On June 25, 1973 8. June and Dec. 25 do . . 5.97% foreign series Dec. 27,1968 On June 27, 1973 s. JuneandDec. 27 .do 6.00% foreign series Dec. 31,1968 On July 2, 1973 s.. Jan. and July 2 do
Total notes, foreign series.
Footnotes a t end of table.
100,000,000.00 .
20,000,000.00 .
961,017,399.32 .
99, 791,134. 83
49,968,624.35
149, 759, 759.18
300,000,000.00 . 40, 000,000. 00 100,000,000.00 50,000, 000. 00 50,000,000.00
125,000,000.00 . 150,000,000.00 . 100,000,000.00 . 100,000,000.00 . 100,000,000.00 . •100,000,000.00 . 100,000,000.00 . 100,000,000.00 . 100,000.000.00 . 100,000,000.00 200,000,000.00 . 100,000,000.00 . 100,000,000.00 . 200,000.000.00 . 12,000,000.00 . 10,000,000.00 . 5.000,000.00 . 10,000,000.00 . 5,000.000.00 . 3,000,000.00 . 2,000,000.00 . 20,000,000.00 . 100.000,000.00
7,970,836.39
2,382, 000. 000. 00
100,000.000.00
20.000,000. 00
961,017,399.32
99, 791,134. 83
49, 968,624.35
149, 759,759.18
300,000, 000. 00 32,029,163. 61 100,000,000. 00 50, 000,000. 00 50,000,000. 00
125,000,000. 00 150, 000,000. 00 100,000,000.00 100,000, 000. 00 100, 000,000. 00 100,000, 000. 00 100, 000,000. 00 100.000,000. 00 100, 000, 000. 00 100,000, 000. 00 200, 000,000. 00 100, 000,000. 00 100,000,000. 00 200, 000, 000. 00 12,000,000. 00 10,000,000. 00 5, 000,000. 00 10,000, 000. 00 5, 000, 000. 00 3, 000, 000. 00 2,000.000. 00 20, 000, 000. 00 100.000.000. 00
7,970,836. 39 2,374,029,163. 61
ZP
> y ^ H-l Zfi
>
> Hd fel I ^ H-t
00
Digitized for FRASER http://fraser.stlouisfed.org/ Federal Reserve Bank of St. Louis

T A B L E 28.—Description of public debt issues outstanding J u n e 30, 1970—Continued GO GO
Description Date When redeemable Interest payraent Average price Amount issued Amount retired or payable i date received (per $100)
Amount outstanding 2
INTEREST-BEARING DEBT a—Continued
Public Issues—Continued
Nonmarketable—Continued Treasmy notes '—Continued
6.20% foreign cmrency series. Apr. 9, 1969 On July 9, 1970 Jan. and July 9... . 432.7500 Swiss $30,040,439.05 francs.
6.20% foreign currency series. Apr. 29, 1969 On July 29, 1970 s. Jan. and July 29... 430.6500 Swiss 39,475,211.89
6.89% foreign currency series. June 9, 1969 On Sept. 9, 1960 8.. Mar. and Sept. 9 . . 431.3000 Swiss 100,857,871. 55 francs.
7.70% foreign currency series. July 3, 1969 On Oct. 5, 1970 8... Apr. and Oct. 5 . . . 432.7500 Swiss 22,414,789.14
7.55% foreign cmrency series. July 16,1969.. On Oct. 16, 1970 s.. Apr. and Oct. 16.. 430.5500 Smss 133,550,110. 32
7.85% foreign currency series. Sept. 29. 1969 On Jan. 29. 1971... Jan. and July 29... 429.8500 Swiss ' 30,243,108.06 frjitics
7.60% foreign currency series. Nov. 18, 1969. On Feb. 18,19718. Feb. and Aug. 18.. 432.9000 Swiss 29,799,029.80 francs.
8.10% foreign cmrency series. Jan. 30,1970. On June 1, 19718.. June and Dec. 1... 430.8000 Swiss 25,533,890.44 francs.
6.75% foreign cmrency series. Apr. 6, 1970.. On July 6, 19718.. Jan. and July 6... . 430.6100 Swiss 52,251,457. 24 fT*9)TlCS
7.70% foreign currency series. May 6,1970 On Aug. 6, 1971 s.. Feb. and Aug. 6... 468.8400 Swiss 25, 595,085. 74
7.73% foreign cmrency series. May 19,1970 On Aug. 19, 1971.. Feb. and Aug. 19.. 431.8000 Swiss 27,790,643.82 irancs.
7.60% foreign cmrency series. June 11,1970 On Sept. 13,1971.. Mar. and Sept. 13. 431.1500 Swiss 23,193, 784.07
5.28% foreign currency July 3, 1967 On Jan. 3, 1972.... Jan. and July 3 . . . . 369.0000 Deutsche 135,501,355.00 series.8 raarks.
5.73% foreign currency Apr. 1, 1968 On Oct. 2, 1972-.. Apr. and Oct. 2 . . . 369.0000 Deutsche 135,501,355.00 series.e raarks.
6.25% foreign cmrency June 24, 1968 On Dec. 22, 1972.. June and Dec. 22.. 369.0000 Deutsche 135,501.355.00 series.o marks.
3.05% foreign currency Aug. 19, 1969 On Feb. 19, 1973.. Feb. and Aug. 19.. 371.4985 Deutsche 134,590,058. 25 series. 10 . marks.
4.43% foreign currency Oct. 2, 1969.. On Oct. 2, 1973.... Apr. and Oct. 2 . . . 373.0791 Deutsche 134,019,834. 92 series 10. marks.
Totalnotes, foreign cur- 1.215.859,379.29 rency series.
$30,040,439. 05
39,475,211. 89
100,857,871. 55
22,414,789.14
133,550,110. 32
30, 243,108. 06
29, 799,029.80
25, 533,890. 44
52,251,457. 24
25, 595.085. 74
27, 790, 643.82
23,193, 784. 07
135, 501, 355. 00
135, 501, 355. 00
135, 501, 355. 00
134, 590.058. 25
134,019,834. 92
1, 215,859,379. 29
o y ^
o fel
y ^
ffi fel
ZP fel o
fel
> y<
o fel
H9
ffi fel
H^
fel > ZP
d y<
Digitized for FRASER http://fraser.stlouisfed.org/ Federal Reserve Bank of St. Louis

30,000,000.00 23,929,534.25
30,000.000.00 23.999.534.25
53,929,534.25 53.929.534.25
75,000,000.00 _ y.'l nno non. 00
Treasury bonds: ' 4.25% foreign series Sept. 16,1964 On Nov. 1,1970 " May and Nov. 1... Par 4.25% foreign series do On Nov. 1,1971" do do..
Total bonds, foreign series.
3)^% Treasmy bonds Dec. 23,1969 On Dec. 23,1979 H June and Dec. 23.. P a r . . .
U.S. retirement plan bonds First day of each (compounded semiannually):"' month.
3.75%.. Jan. 1963 to May Not redeemable Indeterminate Par 18,666,898.97 $3,270,176.19 15.396,722.78 1966. until owner
attains age 59^ except in case of death or disabihty.
4.15% : . June 1966 to Dec. do do do 24,058,335.65 1,396,875.28 22,661,460.37 1969.
6.00% Jan. 1, 1970 do do do 1,001,750.00 3,650.00 998,100.00 Unclassified.-.. -- 69.800.00 -21,372.48 81,172.48 ZD
Total U.S. retirement 43,786,784.62 4,649,328.99 39,137,455.63 > plan bonds. H
— ZP Depositary bonds: ' H3
2%FirstSeries Variousdates At option of U.S. June and Dec. 1... Par 354,247.000.00 329.003,000.00 25,244,000.00 ^ from July 1958. or owner upon s^
30 to 60 days' tT* notice; 12 years from issue date. > •
Hd Treasury bonds: ' 2
2% REA Series.. . . . . .Variousdates do Jan. and July 1 do 53,174,000.00 38,519,000.00 14,655,000.00 g from July 1, 2; 1960. . . p
Treasury bonds, investment . . . .
2M% Series B-1975-80 Apr. 1,1951 Apr. 1, 1975 ex- Apr. and Oct. 1 do. 451,397,500.00 . changable at Exchange at par. . 14,879,956,500.00. anytime at option of owner for marketable Treasury notes; payable on Apr. 1,1980 413.
Subtotal - •- -- - 15,331,354,000.00 .
Total Treasury bonds,. . . - . - . . ^,.... . . . .-,... .^..... . . . . . .^,.... . . . . .-... .--------. .15,331,354,000.00 ^ 12,944,834,000.00 2,386,520,000.00 investraent series. =
Footnotes at end of table. " . • •
M
(X> CO
Digitized for FRASER http://fraser.stlouisfed.org/ Federal Reserve Bank of St. Louis

TABLE 28.—Description of public debt issues outstanding June 30, 1970—Continued CO O
Descript ion D a t e When redeemable In te res t p a y m e n t Average price A m o u n t issued A m o u n t ret ired or payable i da t e received (per $100)
A m o u n t ou ts tanding 2
I N T E R E S T - B E A R I N G D E B T a—Continued
P u b l i c I s sues—Cont inued
Nonmarke tab le :—Cont inued Treasury certificates:
6.330% certificates Apr . 1, 1970.
6.330% certificates Apr . 3, 1970
6.876% certificates A p r . 30, 1970
1% certificates- Various dates frora Jmie 15, 1970.
3.50% certificates J u n e 30, 1970
To ta l T reasu ry certificates.
U . S . savings notes, series a n d yield to m a t u r i t y :i5 f
S-1967, 4.74%, S-1968, 4.74% (Jan. to M a y ) . . S-1968, 5.00% (June to D e c ) . S-1969, 5.00% S-1970, 5.00% Unclassified- : . . . . . . . .
On demand ; on Ju ly 1,1970.
On demand ; on Ju ly 3, 1970.
On demand ; on J u l y 31, 1970.
On demand ; on Dec . 15, 1970.
On deraand; on J u n e 30, 1971.
J u l y l , 1970. P a r
Ju ly 3, 1970 do . .
Ju ly 31, 1970- . . . . d o . .
Dec . 15, 1970 do . .
J u n e 30, 1971 do . .
F i rs t d a y of each m o n t h .
May to Dec . 1967.. J a n . to May 1968.. J u n e to Dec . 1968.. J a n . to D e c . 1969.. J a n . to J u n e 1970..
After lyr.16 After 4M years $ 8 1 . . . d o . d o . do do . d o — . . d o do- d o — do do d o . . . d o
To ta l U . S . savings notes . .
U . S . savings bonds , series a n d approx ima te yield to m a t u r i t y (%).15f
F i r s t day of each m o n t h .
E-1941, 3.340% 19 May to Dec . 1941 E-1942, 3.397% i9 J a n . to Dec . 1942 E-1943, 3.460% i9 J a n . to Dec . 1943 E-1944, 3.521% 19 J a n . to Dec . 1944
On d e m a n d a t option of owner; 10 years from issue da te b u t m a y be held for addi t ional period.18
d o . . . d o .
. . . . . d o : . -d o . . . .
Sold a t a discount; payab le a t pa r on matm' i ty . -
$2,071.43 .
1,618,938.50 .
1,289,030.03 .
5, 315, 864.79
120, 728,286. 57 106, 554, 578. 32 195,108, 575.25 368,215,490.29
95, 527,876. 50 3,286,246. 75
889,421,053. 68
$5,047, 523.09
48,011,789.45 38,352,275.83 57, 574,624.27 30,960,852.18
40,763. 25 (")
174, 940,304. c
. . . d o . - . . d o . - . . d o . . . d o
$2,071.43
1,618,938. 50
1,289,030.03
268,341.70
782,178,792.97 . . . .
790,404,697. 72 5, 047, 523.09
782,178,792. 97
785, 357,174. 63
72, 716, 68,202,
137, 533, 337,254,
95,487, 3,286,
497.12 302. 49 950. 98 638.11 113.25 246. 75
714,480, 748. 70
$75 1,891,992,061.10 1,689,012,277.02 202,979,784.08 $75 8,346,634,002.69 7,458,971,308.03 887,662,694.66 $ 7 5 - . . . . 13,427,066,059.57 12,031,459,493.86 1,395,606,565.71 $75. 15, 667,312,23L 13 13,955,469,789.81 1,711,842.441.32
td fel Hd o H^
o fel
ZP fel o fel H^ > Kl
o fel y ^
ffi fel
H^
fel > ZP
d Pi K|
Digitized for FRASER http://fraser.stlouisfed.org/ Federal Reserve Bank of St. Louis

E-1945, 3.575% i» J a n . to Dec . 1945 E-1946, 3.661% 19 J a n . to Dec . 1946 E-1947, 3.719% 19 J a n . to Dec . 1947 E-1948, 3.780% 19 J a n . to Dec . 1948 E-1949, 3.883% 19 J a n . to Dec . 1949 E-1950, 3.963% 19 J a n . to Dec . 1950 E-1951, 3.735% 19 J a n . to Dec . 1951 E-1952,3.570% (Jan. to A p r . ) . J a n . to Apr . 1952 E-1952, 3.633% i9 (May to May to Dec . 1952
Dec.)
E-1953, 3.696% 19 J a n . to Dec . 1953 E-1954, 3.782% 19. J a n . to Dec . 1954 E-1955, 3.866% 19 J a n . to Dec . 1955 E-1956, 4.001% 19... J a n . to Dec . 1956 E-1957, 4.080% (Jan.) J a n . 1957 E-1957, 4.217% i9 (Feb . to F e b . to Dec . 1957.
D e c ) .
E-1958, 4.308%, i9 J a n . to Dec . 1958. E-1959,4.370% (Jan. to M a y ) . J a n . to May 1959. E-1959, 4.380% 19. . . J u n e to D e c 1959.
E-1960, 4.433% i9. J a n . to Dec . 1960. E-1961, 4.506% 19. . . J a n . to D e c 1961-E-1962, 4.558% i 9 . . . J a n . to Dec . 1962. E-1963, 4.315% i 9 . . . J a n . to D e c 1983. E-1964, 4.173% i9 J a n . to D e c 1964. E-1965. 4.266% " (Jan to J a n . to N o v . 1965.
Nov . )
do do do do do , do do do
On d e m a n d a t opt ion of owner; 9 years, 8 m o n t h s from issue da te b u t m a y be held for addi t iona l period.18
do do do do d o .
. On d e m a n d a t opt ion of owner; 8 years, 11 m o n t h s from issue da te b u t m a y be held for addi t ional period.18
^ - - " " d o " - " " - " - ^ " . O n d e m a n d a t
opt ion of owner; 7 years , 9 m o n t h s from issue da t e b u t m a y be held for addi t iona l period.18
do do d o . . do do do
. . d o . .
. . d o . .
. . d o . . - . d o . , - . d o . . . . d o . . . . d o - . . . . d o . . . . d o . .
. . d o . .
. . d o -
. . d o . .
. . d o . .
. . d o . , . d o . . .
. . d o -
. - d o -. d o . .
. d o . . .
. d o . . .
. d o . . .
. d o . . .
. d o . . . . . do . . .
. $75 12,322,884,910.61 10,813,311,436.09 1,509,573,474.52
. $ 7 5 . . . . 5,595,753,977.33 4,743,761,059.36 851,992,917.97 $75 5,315,167,896.44 4,361,287,518.92 953,880,377.52 $75 5,501,234,664.33 4,432,277,731.56 1,068,956,932.77
. $75 5,440,040,416.58 4,309,473,464.16 1,130,566,952.42 $76 4,758,466,137.73 3,716,060,596.69 1,042,405,541.04
,$75 4,114,446,260.12 3,211,820,716.65 902,6-25,543.47 . $75 1,412,342,280.23 1,101,009,150.63 311,333,129.60
$75 2,895,717,538.47 2,241,684,018.95 654,033,519.52
. $75 4,926,040,455.87
. $75. 5,021,949,628.77
. $75 5,232,774,704.13
. $75 5,056,472,053.45
. $75 421,663,589.13 $75 4. 341,493, 326. 92
. $75 4,648,758,840.58
. $75 1,868,430,040.02 $75 2,488,701,495.33
, $75 4,370,795,948.71 $75 4,431,820,785.86 $75 4.287,574,061.86 $ 7 5 - . . 4, 778, 005, 505. 96 $75 4.656,786,583.12 $75 4,127,461,995.27
3, 739, 943,298. 85 3, 749, 331, 696.02 3, 856, 387, 695. 64 3, 687, 519, 414. 99
299, 512,409.13 3,117, 025, 325.02
1,186,097,157. 02 1,272, 617,932. 75 1, 376, 387, OOS. 49 1, 368, 952,638. 46
122,151,180. 00 1,224, 468,001. 90
3, 223, 871, 547. 65 1,424, 887, 292. 93 1, 276,139, 818. 74 592, 290, 221. 28 1, 694, 951, 392. 46 793, 750,102. 87
2, 864, 982, 026. 67 2, 767, 307, 335. 47 2, 578, 897, 677. 44 2, 668, 640,198. 10 2, 630, 606, 618. 61 2, 317, 301, .363. 88
1, 505, 813, 922. 04 1,664,513,450.39 1, 70S, 676, 384. 42 2,109, 365, 307. 86 2, 026,179, 934. 51 1, 810,160, 631. 39
ZP y ^ > y ^ >-{ ZP H9 HH O > > Hd fel ! O
CO
Digitized for FRASER http://fraser.stlouisfed.org/ Federal Reserve Bank of St. Louis

T A B L E 28.—Description of public debt issues outstanding J u n e 30, 1970—Continued
CO
to
H - l
CD <P O
^ j_ j .
Description Date When redeeraable Interest payment Average price Amount issued Amount retired Araount fel or payable i date received (per $100) outstanding 2 y^
, O INTEREST-BEARING ^
DEBT a—Continued ^ fei Public Issues—Continued |_3.
Nonmarketable—Continued H' U.S. savings bonds, series and rj,
approximate yield to matmity ^ (%).i5^—Continued
E-1965, 4.420% (Dec.) Dec. 1965.. On deraand at Sold at a discount; $75... $426,250, 94L 14 $231,997,696.87 $194,253,244.27
issue date.20 H-1953, 3.598% 19 Jan. to Dec. 1953 .do do .do 470,500,500.00 342,201.000.00 128,299,500.00 H-1954, 3.673% 19 Jan. to Dec 1954. do do do. . . . 877,689,500.00 634,410,500.00 243,279,000.00 H-1955, 3.743% 19 Jan. to Dec. 1955 do - - - d o do- - .- 1,173,084,000.00 829,309,000.00 343,775.000.00
option of owner; payable at par Q , 7 years from on maturity. H^ issue date but t=l may be held for i^. additional J> period.18 ^
E-1966, 4.449%---. Jan. to Dec. 1966 do do. $75 4,905,040,440.20 2,606,591,207.98 2,298,449,232.22 H* E-1967, 4.555% Jan. to Dec 1967 do do $75 4,855, 028, 2n. 08 2,492,612,163.88 2,362,416,047.20 E-1968,4.640%(Jan.toMay). Jan. to May 1968 do do $75 1,957,651,006.53 950,191,224.60 1,007,459,781.93 O E-1968,5.035% (Juneto Dec) . June to Dec 1968 do do . . . . . $75 2,648,197,643.79 1,276.421,427.92 1,371,776,215.87 fet E-1969, 4.800% (Jan. to May) Jan. to May 1969 do .do $75 1,841,838,689.81 803,139.496.76 1,038,699,193.05 E-1969, 5.000% (June to June to Dec. 1969 do do $75.. . . 2,466,754,859.30 920,909,020.15 1,545,845,839.15 ^
Dec) HH E-1976, 5.000% Jan. to June 1970 . .do . . do $76. 1,800,972,225.00 288,519,112.50 1,512,453,112.60 fel Unclassified sales and re- - - 26,843,384.86 17 1.289,374.75 25,554,010.11
demptions. ^ Total Ser iesE- - --- 168,276,364,853.02 124,109,687,135.81 44,166,677,717.21 g
— — fel H-1952, 3.539% 19 June to Dec. 1952.. On demand at Semiannually Par 191,480,500.00 145,752,500.00 45,728,000.00 ^
d option of owner; 9 years, 8 Q months frora ' ^
y <
Digitized for FRASER http://fraser.stlouisfed.org/ Federal Reserve Bank of St. Louis

H-1956, 3.854% 19. Jan. to Dec. 1956 do do . do 893,176,000.00 585,220,500.00 307,955,500.00 H-1957, 3.920% (Jan.) Jan. 1957 do . . . . do ..do 64,506,000.00 38,780,000.00 25,726,000.00 H-1957, 4.120% 19 (Feb. to Feb. to Dec 1957.. On deraand at do do 567,682.000.00 334,924,000.00 232,758.000.00
Dec). option of owner 10 years hora issue date.20
H-1958, 4.202% 19 Jan. to Dec 1958 do.. do do 890,252,500.00 546,274,000.00 343,978,500.00 H-1959. 4.270% (Jan. to Jan. to May 1959. .do do do 356,319,500.00 196,171,500.00 160,148,000.00
May). H-1959, 4.322%, 19 ( J u n e t o June to Dec. 1959 do do . . - .do 362,413,000.00 183,908,000.00 178,505,000.00
Dec) H-1960, 4.336% 19 Jan. to Dec 1960 dO- do do 1,006,767,500.00 436,063,500.00 570,704,000.00 H-1961, 4.165% 19 Jan. to Dec 1961 do do do 1,041,579,000.00 405,241,500.00 636,337,500.00 H-1962, 4.064% 19. Jan. to Dec 1962 do do do 856,759,000.00 301,119,500.00 555,639,500.00 H-1963, 4.145% 19. Jan. to Dec. 1963 do . . . . . . do do 772,968,000.00 245,283,500.00 527,684,500.00 H-1964, 4.235% 19 Jan. to Dec 1964 do do do 671,579,500.00 187,012,000.00 484,567,500.00 H-1965, 4.326% 19 ( J a n . t o Jan. to Nov. 1965 do do do 540,210,000.00 129,997,000.00 410,213,000.00 ZP Nov.)
Dec).
Total SeriesH.. . . 12,929,021,500.00 5,815,059,000.00 7,113,962,500.00
Total U.S.savings 181,205,386,353.02 129,924,746,135.81 51,280,640,217.21 bonds. — — = =— -tz=
Total nonmarketable 203,505,339,96L 08 143,429,710,129.26 60,075,629,83L 82 i s s u e s . z = z = = r = = : = = : = = = z r = = = z ^ = = = = = = = z = z = = = ^ = z = = = i = = z = = = = = = =
Total public issues... 457,090, 354, IIL 08 164,412,546,429.26 292,677,807.681.28
Footnotes at end of table.
H H-1965, 4.570% (Dec.) Dec. 1965 do do do 45,682.000.00 9,320,000.00 36,362,000.00 • > H-1966, 4.594% Jan. to Dec 1966 do do do 635,272,000.00 122,761,000.00 512,511,000.00 2 H-1967, 4.664% Jan. to Dec 1967 do do do 525,961,500.00 79,424,500.00 446,537,000.00 B H-1968, 4.720% (Jan. to Jan. to May 1968 . . .do do . . .do 198,965,500.00 21,494,500.00 177,471,000.00 H
May). ^ H-1968, 4.769% (June to June to Dec. 1968 do .do do 231,902,000.00 20,277,500.00 211,624,500.00 ^ Dec.) H-1969, 4.830%, (Jan. to Jan. to May 1969 do. do do 164,594,000.00 10,3.33,000.00 154,261,000.00
May). H-1969, 5.000% (June to June to Dec 1969 do do do 192,455,500.00 5,558,000.00 186,897,500.00 Hrf
> hd
H-1970, 5.000% Jan. to June 1970 do - do do 186,649,000.00 300,500.00 186,348,500.00 fel Unclassified sales and re- 10,573,500.00 3,922,000.00 6,651,500.00 IzJ
demptions. O
CO 00
Digitized for FRASER http://fraser.stlouisfed.org/ Federal Reserve Bank of St. Louis

T A B L E 28.—Description of public debt issues outstanding J u n e 30, 1970—Continued CO
Descr ip t ion When redeemable In teres t pay raen t Average price Araoun t issued Araoun t ret ired or payable i da te received (per $100)
Araoun t ou ts tanding 2
I N T E R E S T - B E A R I N G D E B T a—Continued
Special I s s u e s ^
Civil service re t i rement fund:
No tes : 7 ^ % Series 1977.. 6 ^ % Series 1976.. 5 ^ % Series 1975.. 47^% Series 1971.. 4M% Series 1974..
Redeeraable after 1 year frora issue date and payable on June 30:
. J u n e 30,1970 1977 J u n e 30-Dec. 3 1 .
. June30,1969 1976 do
. J u n e 30,1968 1975 do
. June30,1966 1971 do June30,1967 1974 do
B o n d s :
43/8% Series 1971.. 41/8% Series 1972.. 4 H % Series 1973.. 4 1 ^ % Series 1974.. 4>g% Series 1975.-4 H % Series 1976.. 43/8% Series 1977.. 43/8% Series 1978--4 H % Series 1979.. 43^% Series 1980.. 37^% Series 1971.. ^%% Series 1972.. 33^% Series 1973.. 3J^% Series 1974.. 33^% Series 1975.-33^% Series 1976--3 ^ % Series 1977.. 3 ^ % Series 1978.. 3 ^ % Series 1971.-3M% Series 1972.. 3 ^ % Series 1973.. 3M% Series 1974.. 3 ^ % Series 1975.. ^ y % Series 1976..
Var ious dates frora J u n e 30:
. do . ,
. do . ,
. do . ,
. d o . ,
. d o . . -do-. . do . , . do . , . d o . .
1973-1974. 1975. 1976-1977., 1978., 1979.. 1980-.
. J u n e 30,1963 1971.. do 1972.. do 1973. do 1974.. do 1975-do 1976.. do 1977.. do 1978..
J u n e 30,1962 1971.. do 1972-. do 1973-. do 1974-.
. . . . . d o 1975.. do 1976..
On dem and ; on J u n e 30:
1971 1972
do . . d o -
. . d o . . .
. - d o . . .
. . d o . . . .
. . d o . . . . . d o . . . . - d o . . . . . d o . . . . . d o . . . . . d o . . . . . d o . . - , . d o . . . . . d o . . . . . d o . . . . - d o — , - d o - . , . d o . . . . . d o . . . . . d o . . . . . d o . . . . . d o . . . . . d o . . . . . d o . . . .
P a r $2,951,729,000.00 . do 2,909,257,000.00 . do 1,628,319,000.00 . do 1,785,656,000.00 . do 1,758,171,000.00 .
. . d o . , - . d o -. . d o . . . . d o -. . d o -. . d o . . . . d o . . . . d o . . . . d o . . . . d o . . . . d o . . . . d o . . . . d o . . . . d o . . . . d o . . . . d o . . . . d o . . . . d o . , . - d o . . . . d o . . . . d o . . . . d o . . . . d o . -. . d o . .
$2, 951, 729, 000. 00 2, 909, 257, 000. 00 1, 628, 319, 000. 00 1, 785, 656, 000. 00 ] , 758,171, 000. 00
552, 212, 167, 142, 142, 142,
532, 103, 80, 80,
826, 60, 60, 60, 60, 60, 60,
474, 000. 00 . 160, 000. 00 . 988, 000. 00 . 387, 000. 00 . 167,000.00 . 474, 000. 00 . 474,000.00 . 474, 000. 00 . 117,000.00 . 117, 000. 00 . 227,000.00 . 981,000.00 . 448, 000. 00 . 227, 000. 00 . 227, 000. 00 . 227, 000. 00 . 227, 000. 00 . 643, 000. 00 . 976,000. 00 . 976,000. 00 . 976, 000. 00 . 976,000. 00 . 976, 000. 00 . 976.000.00 -
142, 474, 375,160, 552, 988, 212, 387, 167,167, 142,474, 142, 474, 142, 474, 969,117, 969,117, 80, 227, 532, 981, 103,448, 80, 227, 80, 227, 80, 227, 80, 227, 826, 643, 60, 976, 60, 976, 60, 976, 60, 976, 60, 976, 60, 976.
000. 00 000. 00 000. 00 000. 00 000. 00 000. 00 000. 00 000. 00 000. 00 000. 00 000. 00 000. 00 000. 00 000. 00 000. 00 000. 00 000. 00 000.00 000. 00 000. 00 000. 00 000. 00 000. 00 000. 00
fel Hd o " y ^
o fel
ffi fel ZP fel o S3 fel H^
> Kl
o fel y ^
ffi fel
fel > ZP
d K!
Digitized for FRASER http://fraser.stlouisfed.org/ Federal Reserve Bank of St. Louis
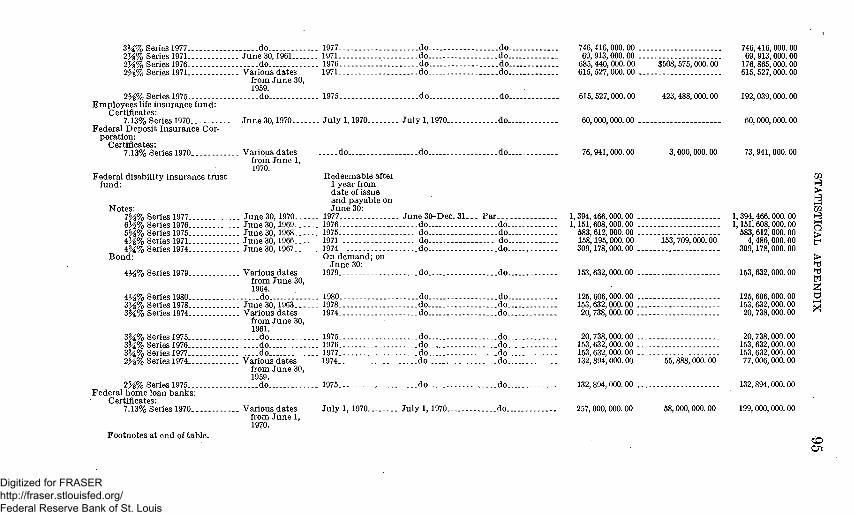
3 ^ % Series 1977 do 1977 . . . . d o . do 746,416,000.00 746,416,000.00 2 ^ % Series 1971 J u n e 30,1961 1 9 7 1 . . . . do do 69,913,000.00 69,913,000.00 27^% Series 1976.. do 1976 . do do 685,440,000.00 $508,575,000.00 176,865,000.00 2 ^ % Series 1971 V a r i o u s d a t e s 1971 do . d o 615,527,000.00 615,527,000.00
frora J u n e 30, 1959.
2 ^ % Series 1975 do 1975 .do . . . . d o 616,527,000.00 423,488,000.00 192,039,000.00 Erap loyees life insurance fund:
7.13% Series 1970 J u n e 30.1970 J u l y l , 1970.. J u l y 1,1970 d o . . . 60,000,000.00 60,000,000.00 Fede ra l Depos i t In su rance Cor
porat ion: Certificates:
7.13% Series 1970 . . . V a r i o u s d a t e s do do do 76,941,000.00 3,000,000.00 73,941,000.00 from J u n e 1, 1970.
Federa l d isabi l i ty insurance t rus t Redeeraable after ZP fund: 1 year from H
da te of issue ^ and payab le on {l
No tes : J u n e 30: ZP 7 ^ % Series 1977 J u n e 30, 1970 1977. J u n e 30-Dec. 3 1 . . . P a r . . 1 ,394,466,000.00. . . 1.394,466.000.00 >^ 63^% Series 1976 J u n e 30, 1969 1976 . . d o do 1,151,608,000.00 1,151,608,000.00 ^ 5 ^ % Series 1975 J u n e 30, 1968 1975 d o . . . do 583,612,000.00 583,612,000.00 > 4J^% Series 1971 J u n e 30, 1966 1971 d o . do 158,195,000.00 153,709,000.00 4,486,000.00 tr* 4M% Series 1974 J u n e 3 0 , 1967 1974 do do 309,178,000.00 309,178,000.00
B o n d : O n deraand ; on > J u n e 30: Hd
43^% Series 1979 V a r i o u s d a t e s 1979 do . d o 153,632,000.00 153,632,000.00 ^ frora J u n e 30, g 1964. 2 ;
43/g% Series 1980 do 1980 do . . d o 125,606,000.00 125,606,000.00 O 3 K % Series 1978 June30 ,1963 1978 do d o . 153,632,000.00 153,632,000.00 Q 3M% Series 1974 V a r i o u s d a t e s 1974 do . do 20,738,000.00 20,738,000.00 ^
from J u n e 30, 1961.
3 ^ % Series 1975 do 1975 do . do 20,738,000.00 20,738,000.00 3 ^ % Series 1976 d o . . . 1976.. . . . d o . . . d o - 153,632,000.00 153,632,000.00 3 ^ % Series 1977 - - - - - - d o . . 1977 . . . . d o . . d o 153,632,000.00 153,632,000.00 2 ^ % Series 1974 V a r i o u s d a t e s 1974 . d o . . . . d o 132,894,000.00 55,888,000.00 77,006,000.00
from J u n e 30, 1959.
2 ^ % Series 1975 do 1 9 7 5 . . . . do . . d o . . . 132,894,000.00 132,894,000.00 F e d e r a l h o m e loan b a n k s :
7.13% Series 1970 V a r i o u s d a t e s J u l y 1, 1970 J u l y 1, 1970.. . . d o 257,000,000.00 58,000,000.00 199,000,000.00 from J u n e 1, 1970.
Foo tno tes at end of t ab le . - ^
Digitized for FRASER http://fraser.stlouisfed.org/ Federal Reserve Bank of St. Louis

TABLE 28.—Description of public debt issues outstanding June 30, 1970—Continued CO
Description Date When redeeraable Interest payment Average price Amount issued Amount rethed Araount or payable i date received (per $100) outstanding 2 ^
• CO
INTEREST-BEARING o DEBT a—Continued
Special Issues^—Continued ^ Redeemable after H^
Federal hospital insurance trust 1 year frora O fund: issue date; pay- W
Notes: able on June 30: H 7^% Series 1977 June 30, 1970 1977 June 30-Dec. 31 Par . . . . $919,358,000.00 $919,358,000.00 63^% Series 1976 June30,1969 1976. do.. . .do 729,200,000.00 729,200,000.00 O 5M% Series 1975 June30,1968 1975 do.. do. . . 495,529,000.00 . . . . 495,529,000.00 ^ 4 ^ % Series 1973.... June30,1967 1973. do. . . . do 46,131,000.00 $22,075,000.00 24,056,000.00 -, 4M% Series 1974 . . . . d o . . 1974... do . . . .do 415,179,000.00 415,179,000.00 2
Federal old-age and survivors' hi- ffi surance ti-ust fund: fej
Notes: — 7^% Series 1977 June 30, 1970 1977 do do.. 5,033,296,000.00 5,033,296,000.00 2 63^% Series 1976 June 30, 1969 1976 . . .do do 3,844,864,000.00 --..-... 3,844,864,000.00 S 5^% Series 1975 June 30, 1968 1975 do do 2,460,795,000.00 2,460,795,000.00 HK 47^% Series 1971. June 30, 1966 1971 . . .do do 1,080,011,000.00 . . 1,080,011,000.00 w 4M% Series 1974... June 30,1967 1974 . . .do do.. . 2,720,279,000.00 - 2,720,279,000.00 ^
Bonds: On demand; on - . . . > June 30: w
41^% Series 1978.... Variousdates 1978 d o . . . do 421,567,000.00 421.567,000.00 K* from June 30, 1964. O
43/ % Series 1979 do. 1979 do. do 1,080,011,000.00 1,080,011,000.00 fel 4H% Series 1980 do 1980 d o . . . do 1,080,011,000.00 1,080,011,000.00 3J %o Series 1977.. June 30, 1963 1977 do . . . d o . . 1,080,011,000.00 1,080,011,000.00 y 2>y&% Series 1978.. do 1978 do. do 658,444,000.00 658,444,000.00 ffi 3M% Series 1975.. June 30, 1961 1975 d o . . . do 160,077,000.00 160,077,000.00 H 33^% Series 1976. . . . .do 1976 do. do. 1,080,011,000.00 1,080,011,000.00 2 ^ % Series 1971 Variousdates 1971 do d o . . 1,133,000,000.00 52,989,000.00 1,080,011,000.00 H^
frora June 30, Sl 1959. fel
2H% Series 1972. .do 1972 . . .do do 1,133,000,000.00 52,989,000.00 1,080,011,000.00 > 25^% Series 1973. do 1973 do do . . . . 1,133,000,000.00 52,989,000.00 1,080,011,000.00 ^ 2^%) Series 1974 d o . . 1974 do do 1,133,000,000.00 52,989,000.00 1,080,011,000.00 d 2 ^ % Series 1975. do 1975 do do 919,934,000.00 919,934,000.00 g
Federal Savings and Loan Insurance ^ Corporation:
Certificates: 7.13%, Series 1970 Variousdates July 1,1970 July 1,1970... do 104,381,000.00 24,200,000.00 80,181,000.00
from June 1, 1970. Digitized for FRASER
http://fraser.stlouisfed.org/ Federal Reserve Bank of St. Louis
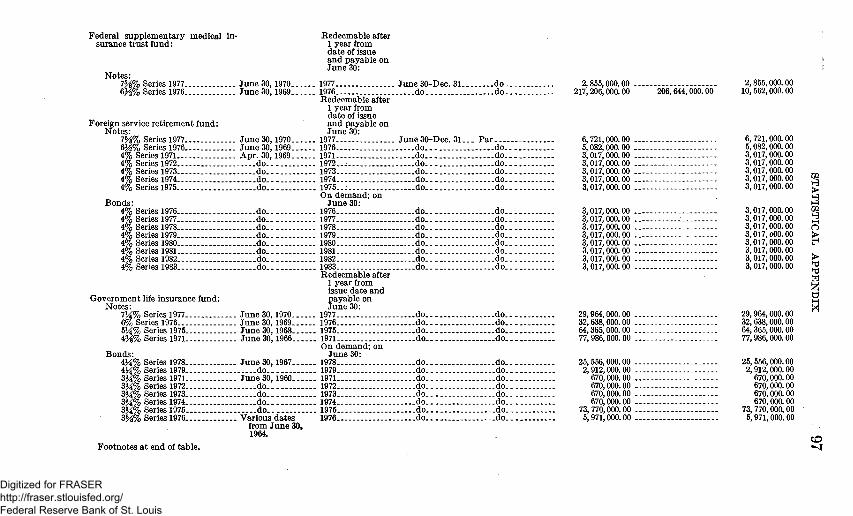
Federal supplementary medical insurance trust fund:
Notes: 7^% Series 1977 June 30,1970. 6M% Series 1976... June 30,1969.
Redeemable after 1 year from date of issue and payable on June 30:
1977 1976. Redeemable after
1 year from date of issue and payable on June 30:
June 30-Dec. 31. d o . .
.do .
.do .
Foreign service retirement fund: Notes:
7^% Series 1977 June 30,1970 1977 63^% Series 1976 June 30,1969 1976 4%, Series 1971 Apr. 30,1969 1971 4% Series 1972 do . . 1972... 4% Series 1973 d o . . . 1973. 4% Series 1974 . . . d o . . . 1974 4% Series 1975 d o . . . 1976..:
On demand; on Bonds: June 30:
4% Series 1976 do 1976 4% Series 1977 do 1977 4% Series 1978 do . . 1978 4% Series 1979.. do . . 1979 4% Series 1980 d o . . . 1980
. June 30-Dec. 31. do do d o . . . do . . do-do
Par do. do. do-do. do. do.
4% Series 1981 do.. 1981-.-. 4% Series 1982. do . . 1982 4% Series 1983 do..
Government life insurance fund: Notes:
73^%, Series 1977 June 30,1970.. 6% Series 1976 June 30,1969., 5M% Series 1975 June 30,1968. 4H% Series 1971 June 30,1966.
1983. Redeemable after
1 year from issue date and payable on June 30:
1977 1976 1976 1971 On demand; on
June 30: 1978 1979 1971
. . . .do
. . . .do
. - . -do . .
. . . .do
. . . -do
. . - d o - .
. . . -do . -
. . - d o . -
do.. do-. do-. do-. do-. do-. do.. do.
.do., -do., .do.. ..do..
-do. -do. .do. ..do.
Bonds: 43^% Series 1978 June 30,1967. 43^% Series 1979... do 3 ^ % Series 1971 June 30,1960. 3 ^ % Series 1972... dO 1972 3 ^ % Series 1973 do 1973.. 3M% Series 1974 do . . 1974 ZH% Series 1975 do 1976 3^^% Series 1976 Variousdates 1976
from June 30, 1964.
Footnotes at end of table.
.do.,
.do.,
.do.,
.do.,
.do.,
.do.,
.do-
.do..
do.. do.. do.. do-. do.. do.. do. do.
2,855,000.00 . 217,206,000.00 206, 644,000.00
6,721,000.00 . 5,082,000.00 . 3,017,000.00 . 3,017,000.00 . 3,017,000.00 . 3,017,000.00 . 3,017,000.00 .
3,017,000.00 . 3,017,000.00 . 3,017,000.00 . 3,017,000.00 . 3,017,000.00 . 3,017,000.00 . 3,017,000.00 . 3,017,000.00 .
29,964,000.00 . 32.638,000.00 . 64,365.000.00 . 77,986,000.00 .
26,556,000.00 . 2,912,000.00 .
670,000.00 . 670,000.00 . 670,000.00 . 670,000.00 .
73,770,000.00 . 5,971,000.00 .
2,855,000.00 10. 562,000.00
6, 721,000.00 6.082,000.00 3.017,000.00 3,017,000.00 3,017,000. 00 3,017,000.00 3,017,000.00
3,017, 3,017, 3,017, 3,017, 3,017, 3,017, 3,017, 3,017,
000.00 000.00 000.00 oOO. 00 000.00 000. 00 000.00 000.00
29,964,000.00 32,638,000.00 64,365,000.00 77,986,000.00
25, 556,000.00 2,912,000.00
670,000.00 670,000.00 670,000.00 670,000.00
73,770,000.00 5,971,000.00
ZP
H^ H-l ZP H^ HH O
> Hd
fel
CO
Digitized for FRASER http://fraser.stlouisfed.org/ Federal Reserve Bank of St. Louis

T A B L E 28.—Description of puhlic debt issues outstanding J u n e 30, 1970—Continued CO 00
Description Date When redeemable Interest payment Average price Amount issued Amount rethed or payable » date m-i^,-s^. received (per $100)
Amount outstanding 2
INTEREST-BEARING DEBT a—Continued
Special Issues ^—Continued
Govemment life insurance fund—Continued Bonds—Continued
Various dates from June 30 1964.
35^% Series 1977 . . .do 35^% Series 1978 d o . . . . . . . . . 33^% Series 1971 Various dates
from Feb. 1, 1960.
33> % Series 1972 do 33^% Series 1973 do 3 ^ % Series 1974 do 33^% Series 1976 do 33^% Series 1977 do
Highway trust fund: Certificates:
6% Series 1971 June 30,1970..
1977.. 1978., 1971.
.June 30-Dec. 31 Par . . . . do do.. do .do..
1972.. 1973.. 1974.. 1976.. 1977..
National service hfe insurance fund: Notes:
73^% Series 1977 June 30, 1970. 6H% Series 1976 June 30,1969. 63^% Series 1975 June 30, 1968. 4 ^ % Series 1971 June 30,1966.
Bonds: 43^% Series 1981 June 30, 1967... SH% Series 1971 June 30, I960.-. 3 ^ % Series 1972 do 3 ^ % Series 1973 do. . . 3 ^ % Series 1974 do 3 ^ % Series 1975.... . do . . . . 3 ^ % Series 1971 Various dates
from June 30, 1966.
1971 Redeemable after
1 year from date of issue and payable on June 30:
1977 1976 1976 1971 On demand; on
June 30:
1981 1971 1972 1973 1974 1976. 1971
..do., -do., -do.. ..do.. .do..
.do..
-do., .do., .do., -do..
-do., .do., .do., .do., .do..
..do..
..do., -do., .do..
do do do do do do do
$23,807,000.00 48,214,000.00 73,100, 000,00
73,100.000.00 73,100,000.00 73,100,000.00 . 67,799,000.00 49,963,000.00
$1, 282, 000. 00
.do 2,601,737,000.00
$23,807,000.00 48, 214,000. 00 71,818, 000. 00
73,100,000. 00 73,100, 000. 00 73,100,000. 00 67, 799, 000. 00 49,963,000. 00
2,601, 737,000.00
do do do. . . do do do do
669,007,000. 00 306,419.000. 00 332,697,000. 00 644,480,000. 00
226,462,000.00 7,873,000. 00 7,873,000.00 7,873,000.00 7,873,000.00
386,873,000.00 6, 946,000.00
669,007,000.00 305,419,000.00 332,697,000.00 644,480,000. 00
226,452,000.00 7,873,000. 00 7,873,000. 00 7, 873,000.00 7,873,000.00
386,873,000. 00 6, 946, 000. 00
fel Hd O
y ^
o fel
fel
ZP fel a fel
> Kj
o fel y ^
ffi fel
1^ td fel > ZP
d y<
Digitized for FRASER http://fraser.stlouisfed.org/ Federal Reserve Bank of St. Louis

3^%, Series 1972. do 1972 do do 6,946.000.00 6,946,000.00 3 ^ % Series 1973. do. 1973.. ..do do 6,946,000.00 6,946,000.00 3 ^ % Series 1974 do 1974 '. . .do . . . ! do 6,946,000.00 6,946,000.00 Z%% Series 1975 do. 1975. do do 6,946,000.00 6,946,000.00 3 ^ % Series 1976 do. 1976 do do 6,946,000.00 6,946,000.00 3 ^ % Series 1977 do 1977 do. . . do 7,612,000.00 7,512,000.00 3 ^ % Series 1978 do. . . 1978 do. . . . do 95,560,000.00 95,560,000.00 3 ^ % Series 1979 do 1979 .do do 393,819.000.00 393.819,000.00 3 ^ % Series 1980 do 1980 do do 393,819,000.00 393,819,000.00
On demand; on June 30:
3^%o Series 1978 June 30, 1963 1978 June 30-Dec. 31 do 298,259.000.00 298,259,000.00 3 ^ % Series 1976 June 30, 1962 1976 do do.. 43,724,000.00 43,724.000.00 3 ^ % Series 1977 do 1977. do do 386,307,000.00 386,307,000.00 33/g% Series 1976. June 30, 1961 1976 do do.. 343,149,000.00 . . . 343,149,000.00 3% Series 1971 Feb. 1,1960 1971. do do. . . 379,000,000.00 379,000,000.00 3% Series 1972 do 1972 do do 379,000,000.00 379,000,000.00 3% Series 1973 do.. . 1973 do do 379,000,000.00 379,000,000.00 3% Series 1974 . . . do . . 1974 .do do. . 379,000.000.00 379,000,000.00 g
Redeemable after
\-i payable on ZP J u n e 30: g
RaUroad retirement account: Q
1 year from date 2 of issue and
Notes
Bonds:
> 7M% Series 1977 June 30,1970 1977 do. do.. 847,447,000.00 847,447,000.00 tr" 63^% Series 1976 June 30,1969 1976 do do. 647,948,000.00 647,948,000.00 63^% Series 1975. June30,1968 1975 do do. 482,623,000.00 482,623,000.00 > 4 ^ % Series 1974 June 30,1967 1974 . . .do do 416,402,000.00 7,113,000.00 409,289,000.00 ^
On demand; on J3 June 30: "^ fel
,Seriesl974. Variousdates 1974 do do 23,110,000.00 23,110,000.00 g from June 30, KA 1964. "^
41^% Series 1975. do.. 1975 do do 23,110,000.00 23,110,000.00 43^% Series 1976 do. 1976 do .do 23,110,000.00 23,110,000.00 41^% Series 1977 do 1977 do do 23,110,000.00 23,110,000.00 41^% Series 1978. do 1978 do. do. 23,110,000.00 23,110,000.00 4H% Series 1979 do. . . 1979 do do 208,201,000.00 208,201,000.00 41^% Series 1980. do.. 1980 do do 208,201,000.00 208,201,000.00 4% Series 1974. Oct. 5,1963. 1974 do do 185,091,000.00 112,962,000.00 72,129,000.00 4% Series 1975 do. 1975. do do 185,091,000.00 185,091,000.00 4% Series 1976.... do. . . . 1976. do do 185,091,000.00 185,091,000.00 4% Series 1977 .do. 1977 do. do 185,091,000.00 185,091,000.00 4% Series 1978... . . .do 1978 do do 185,091,000.00 185,091,000.00
Railroad rethement holding account:
7^% Series 1971 June30,1970 1971 do do 1,923,000.00 1,923.000.00
Footnotes at end of table. QQ CO
Digitized for FRASER http://fraser.stlouisfed.org/ Federal Reserve Bank of St. Louis

TABLE 28.—Description of public debt issues outstanding June 30, 1970—Continued O O
Description Date When redeemable Interest payment Average price or payable i date received (per $100)
Amount issued Amount retired Amount outstanding 2
INTEREST-BEARING DEBT '—Continued
Special Issues ^—Continued
Railroad retirement supplemental account:
Certificates: 7h% Series 1971 June 30, 1970-
Uneraployment ti-ust fund: Certificates:
5M% Series 1971- -.-.do Veterans' reopened insurance fund:
Certificates: 7M% Series 1971 do
Niotes* 7^% Series 1972-- do 7^% Series 1973 do 75^% Series 1974-- do 7^% Series 1975 do 75^% Series 1976 do 7^% Series 1977 do 6M% Series 1971 June 30, 1969. 6i^% Series 1972-- do 6^% Series 1973 do 6i^% Series 1974 do - . 6^% Series 1975 do 6j^% Series 1976 do
Veterans' special term insurance fund:
Certificates: 4k% Series 1971 June 30.1970.
1971 June 30-Dec 31 Par $17,671,000.00 - $17,671,000.00
do. do do 10,519,939.000.00 - 10.519,939,000.00
do do do 4,960,000.00 '. 4,960,000.00 Redeemable after
1 year from issue date and payable on June 30:
000. 00 000.00 000. 00 000.00 000. 00 000. 00 000. 00 000. 00 000. 00 000. 00 000. 00 000. 00
1972 . . 1973 1974 1975 1976 1977 1971 1972 1973 . . 1974 1976 1976
O n d e m a n d ; on J u n e 30:
1971 Redeemable after
1 year from issue d a t e a n d payab le on J u n e 30:
. . d o
. . d o
. . d o
. . d o
. . d o
. . d o - d o . . d o . . d o . . d o . . d o - d o
- d o -
. . d o .
. . d o - d o - . d o - - d o . - d o - d o - d o . . . d o -. . d o -- d o - d o
- -do
4,960,000.00 . 4,960,000.00 4,960.000.00 4,960,000.00 4,960,000.00 .
22,346,000.00 17,386,000.00 . 17,386,000.00 17,386,000.00 . 17,386,000.00 17,386,000.00 . 17,386,000.00
3,477,000.00
4,960, 4,960, 4,960, 4,960, 4,960,
22,346, . . . . 17,386,
17,386, 17.386, 17,386, 17,386, 17,386,
3,477.
fel Hd O
y ^
O fel
ffi fel
i o S3 fel
Ki
o fel
ffi fel
H3 td fel > ZP d td K|
Digitized for FRASER http://fraser.stlouisfed.org/ Federal Reserve Bank of St. Louis

Notes: 4M%) Series 1972.... do 1972 .do do. 3,473.000.00 3,473.000.00 4k% Series 1973 ..do 1973 .do .do 3.473.000.00 3,473.000.00 43/%, Series 1974 . . . . . . . . d o 1974 .do do. 3,473,000.00 3,473,000.00 4M% Series 1975 ..do 1975 do do. 3,473.000.00 3,473,000.00 4M% Series 1976 do 1976 d o . . do 3,473.000.00 3,473.000.00 4M% Series 1977 ..do 1977.... -do do. 38,124,000.00 38,124,000.00
Redeemable after 1 year from issue date and payable on June 30:
4M% Series 1971 June 30, 1969- 1971 June 30-Dec 31 do 34,651.000.00 34.651,000.00 4M% Series 1972 do 1972... do do 34,651,000.00 34,651,000.00 4 ^ % Series 1973 do. 1973.. do do 34,651,000.00 34,651,000.00 4>g% Series 1974 do 1974 do do 34,651,000.00 34,651,000.00 jji 45^% Series 1975 ..do 1975 do do 34,651,000.00 34,651,000.00 H^ 4 ^ % Series 1976 ..do 1976 do do 34,651,000.00 34,651.000.00 >
^ H Total special issues.... 78,111,983,000.00 $1,788,892,000.00 76,323,091,000.00 ^
= = = = = = = = = ^ = = = = = = = = = = = = = = = = = = ^ = = = y ^
Total interest-bearing. 535.202,337,111.08 166,201,438,429.26 369,000,898,681.82 {z debt outstanding. ^
. f Footnotes at end of table. ;>
Hd Hd fel i^
Digitized for FRASER http://fraser.stlouisfed.org/ Federal Reserve Bank of St. Louis

TABLE 28.—Description of puhlic debt issues outstanding June 30, 1970—Continued O
Title Amount outstandhlg
MATURED DEBT ON WHICH INTEREST HAS CEASED
Old debt matured (issued'prior to Apr. 1, 1917) 21 b 22 $1 23^% postal savings bonds «... 22 First Liberty bonds, at various interest rates d 22 Other Liberty bonds and Victory notes, at various interest rates » 4, Treasury bonds, at various interest rates » 85, Adjusted service bonds of 1945 Treasury notes, at various interest rates » 18, Treasury savings notes a
378,360.26 139,100. 00 493,050. 00 214,800. 00 776,850. 00 879,200. 00 913, 700. 00 272,800.00
Title Amount outstanding
MATURED DEBT ON WHICH INTEREST HAS CEASED—Con.
Treasmy notes, tax series * $72,650.00 Certificates of indebtedness, at various interest rates » 255,300.00 Treasury biUs a 148,981,000.00 Treasmy savings certificates ^ 22 66,675.00 U.S. savings bonds * 54,599,974.05 Arraed Forces leave bonds » 4,711,700.00
Total raatured debt on which interest has ceased 320,755,159.31
CO <r o
td fel Hd o td H^
o fel
fel
ZP fel o td fel H9 > td Kl
o fel ng ffi fel
H9 td fel > ZP
d td Hi
Title Amount outstanding
DEBT BEARING NO INTEREST
Special notes of the United States (the notes are nonnegotiable, bear no interest, and are payable on demand): International Monetary Fund series (issued pursuant to the provisions of the Bretton Woods Agreements Act, approved July 31, 1945 (22 U.S.C. 286e),
and under the authority of and subject to the provisions ofthe Second Liberty Bond Act, as amended) 1 $825,000,000.00 Mortgage Guaranty Insurance Corapany Tax and Loss Bonds (issued pm'Suant to Sec. 832(e), Internal Revenue Code of 1954). These securities are exempt
from all taxation now or hereafter iraposed on the principal by any State or any possession of the United States or of any local taxing authority 14, 715,958.09 U.S. savings staraps (Public Debt Act of 1942 (31 U.S.C. 757c)).. 57,242,137.41 Excess profits tax refund bonds were issued under authority of and subject to the provisions of the Second Liberty Bond Act, as araended, and sections
780 to 783, inclusive, of the Internal Revenue C!ode of 1939, as araended. These bonds did not bear interest and were payable at the option of the owner after Jan. 1, 1946. The first series matmed on Dec. 31, 1948, and the second series on Dec. 31, 1949:
Firstseries. . . .--- -. - 346,039.87 Second Series - - 253,838.43
Total excess profits tax refund bonds. - - - 599,878.30
Old demand notes (acts of July 17,1861 (12 Stat. 259); Aug. 5,1861 (12 Stat. 313); Feb. 12,1862 (12 Stat. 338)). (The $60,030,000 issued includes $60,000,000 authorized to be outstanding and amounts issued on deposits including reissues.) - 22 52,917.50
Fractional currency (acts of July 17, 1862 (12 Stat. 592); Mar. 3, 1863 (12 Stat. 711); June 30, 1864 (13 Stat. 220)). (The $368,724,080 issued includes $50,000,000 authorized to be outstanding and araounts issued on deposits including reissues.) - - - - 22231,965,114. 70
Legal tender notes (acts of Feb. 25, 1862 (12 Stat. 345); July 11, 1862 (12 Stat. 532); Mar. 3, 1863 (12 Stat. 719); May 31, 1878 (31 U.S.C. 404); Mar. 14,1900 (31 U.S.C. 408); Mar. 4, 1907 (31 U.S.C. 403)). (Greatest amount ever authorized to be outstanding $450,000,000.) . - . 22322,539,016.00
Old series currency (31 U.S.C. 912-916). 22 23 4,844,741.00 Silver certificates (act of June 24, 1967) 22 23 219,965,549.00 National bank notes, redemption account (act of July 14, 1890 (31 U.S.C. 408)) - - 22 23 20,291,071.50
Digitized for FRASER http://fraser.stlouisfed.org/ Federal Reserve Bank of St. Louis

Federal Reserve bank notes, redemption account (act of Dec 23, 1913 (12 U.S.C. 467)).... 222355,436,488.60
Thrift and Treasury savings stamps. -- 22 3,697,778.26
Total debt bearing no interest - 1,526,350,650.25
SUMMARY
Gross debt (including $30,650,914,301.27 to finance expenditures of Government corporations for which securities of such corporations are held by the Treasury)- 370,848,004,491. 38 Debt of U.S. Government agencies .- 536,989,575.00
Total gross public debt and debt of U.S. Government agencies 371,384,994,066.38 Deduct debt not subject to statutory limitation 24 630,869,861.71 Add participation certificates (12 U.S.C. 1717(c)) . . - - - 2.600,000,000.00 Tota.l debt subject to limitation 24 373,354,124,204.67
1 Payable on date indicated except where otherwise noted. Where two dates are shown for Treasury bonds, first date is earliest caU date and second date is maturity date.
2 Reconciliation by classification to the basis of daily Treasury statement is shown In table 26.
3 Treasury bills are shown at maturity value and are sold on a discount basis with competitive bids for each issue. The average sale price on these series gives an approximate yield on a bank discount basis (360 days a year) as indicated opposite each issue of bills. This yield differs slightly from the yield on a true discount basis (365 or 366 days a year) which is showii in the sumraary table 26.
4 Redeeraable at par and accrued interest to date of payraent, at any tirae upon the death of the owner at the option of the duly constituted representative of the deceased owner's estate, provided entire proceeds of rederaption are applied to payinent of Federal estate taxes on such estate.
5 Not called for redemption on first call date. CaUable on succeeding interest payment dates.
0 Of this araount $41,313,500 face amount was issued in exchange for Series F and G savings bonds maturing in the calendar years 1963 and 1964, and $93,000 face amount was issued for cash.
7 Of this amount $33,834,500 face amount was issued in exchange for Series F and G savings bonds maturing in the calendar years 1963 and 1964, and $102,000 face amount was issued for cash.
8 Redeeraable prior to maturity in whole or in part as per agreement. 9 The principal dollar equivalent of this security increased as a result of the revalua
tion of the Deutsche mark on Oct. 26, 1969. The increase in the principal araount wiU be absorbed by the Exchange Stabilization Fund upon redemption.
10 The principal dollar equivalent of this security increased as a result of the revaluation of the Deutsche mark on Oct. 26,1969. The increase in principal dollar equivalent is offset by a corresponding decrease of interest cost over the reraaining term of the security pursuant to revaluation clause as agreed upon with the Deutsche Bundesbank.
11 These bonds are subject to call by the United States for redemption prior to . maturity.
12 Issued at par. Semiannual interest is added to principal. 13 May be exchanged at option of owner for marketable 13^ percent 5-year Treasury
notes, dated Apr. 1 and Oct. 1 immediately preceding the date of exchange. 14 Includes $316,389,000 of securities received by Federal National Mortgage Associa
tion in exchange for mortgages. -15 Amounts issued and retired for Series E savings bonds and for savings notes in
clude accrued discount; amounts outstanding are stated at current rederaption values. Araounts issued, retired, and outstanding for Series H are stated at par value.
18 Redeeraable after 1 year frora issue date at option of owner. 17 Unclassified rederaptions of savings notes are included in unclassified rederaptions
of Series E savings bonds beginning May 1,1968. 18 At option of owner, bonds dated May 1, 1941, through Apr. 1, 1952, may be held
and will accrue interest for additional 20 years; bonds dated on and after May 1, 1952, may be held and will accrue interest for additional 10 years.
19 Represents a weighted average of the approximate yields of bonds of various issue dates within the yearly series if held to maturity or if held from issue date to end of applicable extension period, coraputed on the basis of bonds outstanding June 30,1969. (For details of yields by issue dates, see Treasury Circulars No. 663 (Eighth Revision) for Series E and No. 905 (Fifth Revision) for Series H dated Dec. 12, 1969.)
20 At option of owner, bonds dated June 1, 1952, through Nov. 1, 1965, may be held and wiU accrue interest for additional 10 years.
21 For detailed inforraation see 1956 annual report, page 435. 22 Not subject to the statutory debt limitation. 23 After deducting amounts officially estunated to have been lost or irrevocably
destroyed. 24 For statutory limit on the public debt, see tables 30 and 31.
NOTE: Reports of issues and retirements of Treasury bill broken down as to exchange and cash were discontinued effective with the bUls issued on Mar. 12,1970.
Footnotes continued on following page.
ZP
> H^ H-l ZP y ^
o >
> Hd hd fel 1 ^
H-l
o 00
Digitized for FRASER http://fraser.stlouisfed.org/ Federal Reserve Bank of St. Louis

AUTHORIZING ACTS: (a) Sept. 24,1917, as a m e n d e d . (b) Various. (c) June 25, 1910. (d) Apr . 24,1917.
TAX STATUS: (e) T r e a s u r y bUls are no t considered capital assets under t h e In t e rna l R e v e n u e
Code of 1954. T h e difierence be tween the price paid for t he bUls and the a m o u n t actuaUy received u p o n t h e n sale or r edempt ion a t m a t u r i t y for Federal incorae tax pu r poses is to be t rea ted as an ord inary gain or loss for the taxable year in wh ich the t ransact ion occurs.
(f) Income derived from these securities is subject to aU taxes now or hereafter h n posed unde r t h e In t e rna l R e v e n u e Code of 1954.
(g) A n y gain or loss derived from the exchange of the following securities wUl be t aken into account for Federa l income tax purposes u p o n the disposition or redempt ion of t he new securities.
Effective date New security of exchange
3M% Bonds 1980- - Oct . 3,1960
3 ^ % Bonds 1990. Oct. 3,1960
33^% Bonds 1998 . . O c t . 3,1960]
33^% Bonds 1980. _ ] .^^ .o/ -R^^H.^ iQR^vn
F o o t n o t e s c o n t i n u e d f r o m p r e v i o u s p a g e .
New security Effective date
of exchange
Security exchanged j % Bonds 1962-67.
23^% Bonds 1963-68. (23^% Bonds J u n e 15, 1964-69. (23^% Bonds Dec . 15, 1964-69.
33^% Bonds 1998-
4% Bonds 1971 . - - Mar .
4% Bonds 1980- Mar .
33^% Bonds 1990- ) y r . . dV2% Bonds 1998- } ^ - ^ •
1 1QR9 }3% Bonds 1964. 1, lyb^ | 2 ^ % Bonds 1965.
1,1962
4% Bonds 1972 (9-15-62) Sept . 15.1962
3 ^ % Bonds 1971 Mar. 15,1963
3 ^ % Bonds 1974 Mar. 15,1963
2 ^ % Bonds 1965. 23^% Bonds Sept. 15, 1967-72. 23^% Bonds J u n e 15. 1967-72. 23*^% Bonds Dec . 15.1967-72. 33^% Certmcates A-1963. 2 ^ % Notes A-1963. 334% Notes E-1963. 334% Certificates B-1963. 3 K % Notes D-1963. 4% Notes B-1963. 33^% certificates C-1963. 3 H % Certificates D-1963. 2M% Bonds 1963.
l 3 % Bonds 1964. '33^% Notes B-1965. 3 ^ % Notes B-1966. 3 % Bonds 1966. .3H% Bonds 1966.
4% Bonds 1980 Mar. 15.1963*
4% Bonds 1973- - - — I gp„^ .o ,QRO 43^% Bonds 1989-94 ) ^^^^' ^ ^ ' ^ ^ ^
4% Bonds 1970 - ) ^^^ 41^% Bonds 1975-85 ( '^^^• 4M% Bonds 1976-85 29,1964
Security exchanged l^}4% Notes B-1966. 3 ^ % Notes B-1966. 33^% Certificates C-1963.
133^% Certificates D-1963. \ 23^% Bonds 1963.
3 % Bonds 1964. 3 % Bonds 1966.
l 3 H % Bonds 1966. ISH% Certificates B-1964. 0 i % Notes A-1964. 3 ^ % Notes D-1964. 3M% Bonds 1966. 4% Notes A-1966. 3 ^ % Notes B-1967.
l 3 ^ % , Notes A-1967. (^J4% Notes C-1964. 5% Notes B-1964. 3M% Notes E-1964.
' 3 ^ % Notes F-1964. 4 ^ % Notes A-1965. 25^% Bonds 1965. 3 K % Notes C-1965. 3 ^ % Notes B-1966.
• 4% Notes A-1966. 3 ^ % Notes B-1967. 3 ^ % Bonds 1966.
/3M% Notes B-1965. 4% Notes E-1965. 35^% Notes B-1966.
( 3 ^ % Notes C-1966. 3M% Notes A-1967. 3 ^ % Bonds 1966. 3 ^ % Bonds 1967.
(h) These issues, being inves tments of various G o v e r n m e n t funds and payable only for the account of such funds, have no present tax l iabi l i ty .
MEMORANDUM RELATING TO OTHER SECURITIES: Securities of t he Uni ted States payab le on presenta t ion:
U .S . registered interest checks payab le $17,759,775.79 U .S . interest coupons due and ou t s t and ing 155,381,879.53 In te res t payable w i t h and accrued discount added to pr incipal
of U.S . s ecu r i t i e s . . 3,974,669.35
To ta l 177,116,324.67
4>^% Bonds 1973 ) j . ^ 04 iORA 4 1 ^ % Bonds 1987-92. J ^^^^ 24,1964
4 1 ^ % Bonds 1974. . . . ) j ^ ^ 434% Bonds 1987-92 . . . { '^^^•
19,1965
O
CD
O
td fel Hd O td
O fel
ffi fel
ZP fel o td fel H9 > td Kj
o fel H^ ffi fel
td fel > ZP
d td Ki
Digitized for FRASER http://fraser.stlouisfed.org/ Federal Reserve Bank of St. Louis

STATISTICAL APPENDIX 105
TABLE 29.—Description of agency securities and D.C. Armory Board Stadium bonds subject to statutory limitation, June 30, 1970
[On basis of daUy Treasmy statements, see "Bases of Tables"]
Secmities Rate of
interest Amount
UNMATURED DEBT Percent
District of Columbia Armory Board Stadium bonds of 1970-79 issued under the act of Sept. 7,1957, as amended (2 D.C. Code 1722-1727)12
Federal Housing Administration debentmes issued under the act of June 27, 1934, as amended (12 U.S.C. 1701-1750g)3«
Mutual mortgage insmance fund: Series AA . . . . . . . . . - . Series AA Series AA Series AA Series AA -Series A A . Series AA Series A A Series A A Series AA Series A A Series AA --. Series AA
Cooperative management housing insurance fund: Series NN Series N N . -. . Series N N . Series N N . Series N N . . Series N N .
General msurance fund: General insurance:
SeriesMM.-SeriesMM-. SeriesMM.-SeriesMM . SeriesMM SeriesMM -SeriesMM.. SeriesMM SeriesMM.. SeriesMM SeriesMM . SeriesMM SeriesMM SeriesMM SeriesMM
Armed services housing mortgage hismance fund: Series F F Series FF Series FF Series F F Series F F . Series F F Series FF
Houshig insurance fund: Series BB Series BB . Series BB Series BB SeriesBB SeriesBB SeriesBB. . . . Series BB SeriesBB . SeriesBB SeriesBB .
National defense housing insurance fund: Series GG -Series GG ._ . Series GG Series GG Series GG Series GG Series GG .
Footnotes at end of table.
4.20
zy4. w%
fi 4 43^ 3 334
m
m 2K
v/2 m 4 43^ m
3M 4
43^
23^
iS 33^ 3 ^ 3 8
4 43^
23^
23|
m 3J4
$19,800,000. 00
174,200. 00 106,400. 00 79,150. 00
258,200. 00 387,300. 00 927,050. 00 204,400. 00 799,250. 00
2,219,250.00 3,863,900. 00 2,060,800. 00 2,766, 550. 00
906,300.00
2,033,950. 00 1,292,200 00
893,700. 00 635,250. 00
10,582,150. 00 203,400.00
18,965,000. 00 655,900.00 12,850.00 28,900. 00 94,900.00 12,050. 00 47,050. 00
2,027,900. 00 6,021,900.00
92,562,200. 00 76,534,800. 00
162,946,850.00 15,247,400.00 4,384,450.00 9,227,350.00
174,050. 00 19,750.00 10,500.00 47,700. 00 10,000. 00 12,600.00 11,200.00
3,124,100. 00 1, 519,800. 00
294,050.00 1,038,700. 00
211,050. 00 816,550. 00
3,579,450. 00 6,976,600.00 3,724,250. 00 5,187,350. 00 7,692,700.00
8,560,500. 00 1,976,400. 00 5,668,900. 00 4,479,300. 00
50,000. 00 303,750. 00
9,050. 00
Digitized for FRASER http://fraser.stlouisfed.org/ Federal Reserve Bank of St. Louis
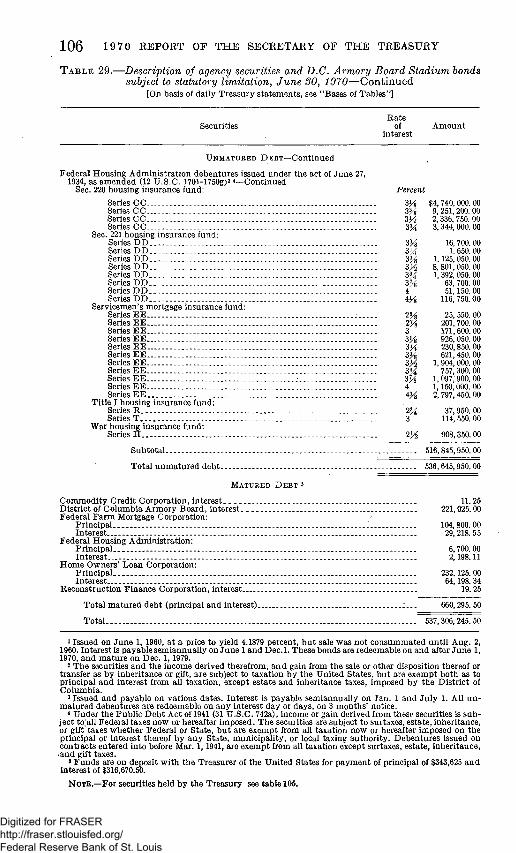
106 19 70 REPORT OF THE SECRETARY OF THE TREASURY
T A B L E 29.—Description of agency securities and D.C. Armory Board Stadium bonds subject to statutory limitation, J u n e 30, 1970—Continued
[On basis of daily Treasury stateraents, see "Bases of Tables"]
Rate Securities of Araount
interest
UNMATURED DEBT—Continued
Federal Housing Adrainistration debentures issued under the act of June 27, 1934, as amended (12 U.S.C. 1701-1750g)3 4—Continued
Sec 220 housing insurance fund: Percent
Series CC 33^ $4,740,000.00 Series CC 3H 9,251,200.00 Series CC 33/^ 2,336,750.00 Series C C 3M 3,344,000.00
S e c 221 housing insurance fund: Series D D 33^^ 16,700.00 Series DD VA 1,650.00 Series D D ?>% 1,125,050.00 Series D D . 33^^ 8,801,050.00 Series DD 3 ^ 1,392,050.00 Series DD 3> 63,700.00 Series DD 4 51,150.00 Series DD 43^ 116,750.00
Serviceraen's raortgage insurance fund: SeriesEE... . • 2% 25,550.00 Series EE 2/^ 201,700.00 Series E E . . . . . . 3 171,600.00 SeriesEE 33^ 926,050.00 SeriesEE 3K 230,850.00 Series EE 3 ^ 621,450.00 SeriesEE 33^ 1,904,000.00 SeriesEE 3 ^ 757,300.00 Series E E . . . .- Z% 1,097,900.00 Series E E 4 1,150,000.00 Series E E 43/g 2,797,450.00
Ti t le I housing insurance fund: Series R 2% 37,950. 00 Ser iesT. . . 3 114,550.00
War housing insurance fund: Series H 23^ 908,350.00
Subtotal 516,845,950.00
Total unraatured debt 536,645,950.00
MATURED DEBT S
Commodity Credit Corporation, interest 11.25 District of Columbia Armory Board, interest.. 221,025.00 Federal Farm Mortgage Corporation:
Principal i 104,800.00 Interest 29,218.55
Federal Housing Administration: Principal 6,700.00 Interest 2,198.11
Home Owners' Loan Corporation: Principal 232,125.00 Interest 64.198.34
Reconstruction Finance Corporation, interest 19. 25
Total matured debt (principal and interest) : . . . 660,295. 50
Total 537,306,245.50
1 Issued on June 1, 1960, at a price to yield 4.1879 percent, but sale was not consuraraated until Aug. 2, 1960. Interest is payable seraiannually on June 1 and Dec.l. These bonds are redeemable on and after June 1, 1970, and mature on Dec. 1,1979.
2 The securities and the incorae derived therefrora, and gain frora the sale or other disposition thereof or transfer as by inheritance or gift, are subject to taxation by the United States, but are exempt both as to principal and interest from aU taxation, except estate and inheritance taxes, iraposed by the District of Columbia.
3 Issued and payable on various dates. Interest is payable semiannuaUy on Jan. 1 and July 1. All unmatured debentures are redeemable on any interest day or days, on 3 months' notice.
4 Under the Public Debt Act of 1941 (31 U.S.C. 7'12a), income or gain derived frora these securities is subject tolall Federal taxes now or hereafter iniposed. The securities are subject to surtaxes, estate, inheritance, or gift'taxes whether Federal or State, but are exerapt from aU taxation now or hereafter imposed on the principal or interest thereof by any State, raunicipality, or local taxing authority. Debentures issued on contracts entered into before Mar. 1,1941, are exerapt from all taxation except surtaxes, estate, inheritance, •and gift taxes.
« Funds are on deposit with the Treasurer of the United States for payment of principal of $343,625 and Interest of $316,670.50.
NOTE.—For securities held by the Treasury see table 105.
Digitized for FRASER http://fraser.stlouisfed.org/ Federal Reserve Bank of St. Louis

STATISTICAL APPENDIX 1 0 7
TABLE 30.—Debt subject to statutory limitation, June 30, 1970 [In miUions of dollars]
PART 1.—STATUS UNDER LIMITATION, JUNE 30, 1970
The statutory debt lirait established by the Second Liberty Bond Act, as araended (31 U.S.C. 757b) 1. 377,000
Araounts outstanding subject to statutory debt liraitation: U.S. Governraent securities issued under the Second Liberty Bond Act, as amended.. 370,288 Debt of U.S. Governraent agencies 537 Participation certificates (12 U.S.C. 1717(c)) 2,600
Total amount outstanding subject to statutory debt limitation 373,426
Balance issuable under limitation 3,675
PART I I . -APPLICATION OF STATUTORY LIMITATION, JUNE 30, 1970
Total Classification out
standing
Public debt: Interest-bearing debt:
Public issues—marketable: Treasury bills 76,154 Treasury notes 93,489 Treasm-y bonds 62,956
Totalmarketable public issues 232,599
Public issues—nonmarketable: Certificates of indebtedness:
Foreign series. 961 Foreign currency series 150
Treasury notes: Foreign series 2,374 Foreign currency series 1,216
Treasury bonds: Foreign series .- 54
Treasury bonds 75 Treasury certificates . 785 U.S. savingsbonds 51,281 U.S. savings notes 742 U.S. retirement planbonds 39 Depositary bonds 25 Treasury bonds, REA series 15 Treasury bonds, investment series 2,387
Total nonraarketable public issues . 60,103
Special issues to Government agencies and trust funds 76,323
Total interest-bearing debt - 369,026
Matured debt on which interest has ceased • 366
Debt bearing no interest: Special notes of the United States:
International Monetary Fund series 826 Mortgage Guaranty Insurance Company tax and loss bonds 15 U.S. savings staraps 68 Excess proflts tax refund bonds 1 1 U.S. notes 323 Deposits for retireraent of national bank and Federal Reserve bank notes 76 Silver certiflcates 220 Other debt bearing no interest '. '. 11
Total debt bearing no interest 1,527
Total public debt 2.... 370,919
Debt of U.S. Government agencies: Interest-bearing debt 537 Matured debt onwhich interest has ceased... (*)
Total debt of U.S. Government agencies 537
Total public debt and debt of U.S. Government agencies 371,456
Deduct deb t not subj ect to limitation 631 Add participation certificates 2,600
Total subject to liraitation 373,425
*Less than $500,000. 1 The following table details amendments to the act. 2 Includes public debt incurred to finance expenditures of wholly-owned Government corporations and
other activities in exchange for which securities of the corporations and activities were issued to the Treasmy. See table 105.
409-714—71 8 Digitized for FRASER http://fraser.stlouisfed.org/ Federal Reserve Bank of St. Louis

1 0 8 1970 REPORT OF THE SECRETARY OF THE TREASURY
TABLE 31.—Debt limitation under the Second Liberty Bond Act, as amended, 1917-70
Date and act History of legislation Amount of limitation
Sept. U, 1917 40 Stat. 288 Sec. 1 authorized issuance of bonds in the amount of $7,638,946,460 40 Stat. 290 Sec. 5 authorized certificates of indebtedness outstanding 4,000,000,000
Apr. 4,1918 40 Stat. 502 Amended sec. 1, increasing bond issuance authority to 12,000,000,000 40 Stat. 504 Amended sec. 6, increasing authority for certificates outstanding t o . . . 8,000,000,000
July 9,1918 40 Stat. 844 Amended sec. 1, increasing bond issuance authority to 20,000,000,000
Mar. 5,1919 40 Stat. 1311 Amended sec. 5, increasmg authority for certificates outstanding to 10,000,000,000 40 Stat. 1309 Added sec. 18, authorizing issuance of notes in the amount of 7,000,000,000
Nov. 23,1921 42 Stat. 321 Amended sec. 18, providing limit on notes outstanding . . 7,500,000,000
June 17,1929 46 Stat. 19 Amended sec. 5, authorizing bills in addition to certificates of indebted
ness outstanding 10,000,000,000 Mar. S, 1931
46 Stat. 1506 Amended sec. 1, increasing bond issuance authority to 28,000,000,000
Jan. SO, 1934 48 Stat. 343 Amended sec. 18, increasing authority for notes outstanding to — 10,000,000,000
Feb. 4,1936 49 Stat. 20 Amended sec. 1, providing limit on bonds outstanding 25,000,000,000 49 Stat. 21 Added sec. 21, consolidating authority for certificates and bills (sec. 5)
and authority for notes (sec. 18) outstandhlg 20,000,000,000 May 26,1938
52 Stat. 447 Amended sec. 21, consolidating authority for bonds, notes, certificates of hidebtedness, and biUs outstanding (bonds limited to $30 biUion).. 45,000,000,000
July 20,1939 53 Stat. 1071 Amended sec. 21, removing limitation on bonds without changing
authorized total of bonds, notes, certtficates of indebtedness, and bUls outstanding 45,000,000,000
June 26,1940 54 Stat. 626 Amended sec. 21, adding new authority for issuance of $4 biUIon
National Defense Series obligations outstanding 49,000,000,000 Feb. 19,1941
66 Stat. 7 Amended sec. 21, elhninating authority for $4 bUlion of National Defense Series obligations and increasing limitation to 65,000,000,000
Mar. 28,1942 56 Stat. 189 Amended sec. 21, increasing limitation to „ 125,000,000,000
Apr. 11,1943 67 Stat. 63 Amended sec. 21, increasing limitation to. . 210,000,000,000
June 9,1944 68 Stat. 272. . .^ . . Amended sec 21, increasing limitation to . . . — 260,000,000,000
Apr. 3,1946 69 Stat. 47 Amended sec. 21, including obligations guaranteed as to principal
and interest by the United States and increasing limitation to 300,000,000,000 June 26,1946
60 Stat. 316 Amended sec. 21, defining face amount of savmgs bonds to be cmrent redemption value and decreasing limitatioii to 275,000,000,000
Aug. 28,1964 68 Stat. 895 Increased sec. 21 limitation by $6 biUion dmhig period beginning
Aug. 28, 1954, and ending June 30,1955 281,000,000,000 June SO, 1966
69 Stat. 241 Amended act of Aug. 28, 1954, extending increase in limitation untU June 30, 1956 281,000,000,000
July 9,1966 70 Stat. 619 Increased sec. 21 limitation by $3 biUion dmmg period beginning
Ju ly l , 1956, and ending June 30, 1957 278,000,000,000 Temporary hicrease terminated July 1,1957, and limitation reverted to. 275,000,000,000
Feb. 26,1968 72 Stat. 27 Increased sec; 21 limitation by $5 biUion during period beginnhig
Feb. 26, 1958, and endhig June 30, 1959.. 280,000,000.000 Sept. 2,1968
72 Stat. 1768 Amended sec. 21, increasing liraitation to $283 biUion, which, with temporary increase of Feb. 26, 1958, made limitatioii 288,000,000,000
June 30,1969 73 Stat. 156 Amended sec. 21, increasing limitation to $285 billion, and increased
sec. 21 limitation by $10 biUion dming period beghining July 1,1959, and endhig June 30,1960 296,000,000,000
Digitized for FRASER http://fraser.stlouisfed.org/ Federal Reserve Bank of St. Louis
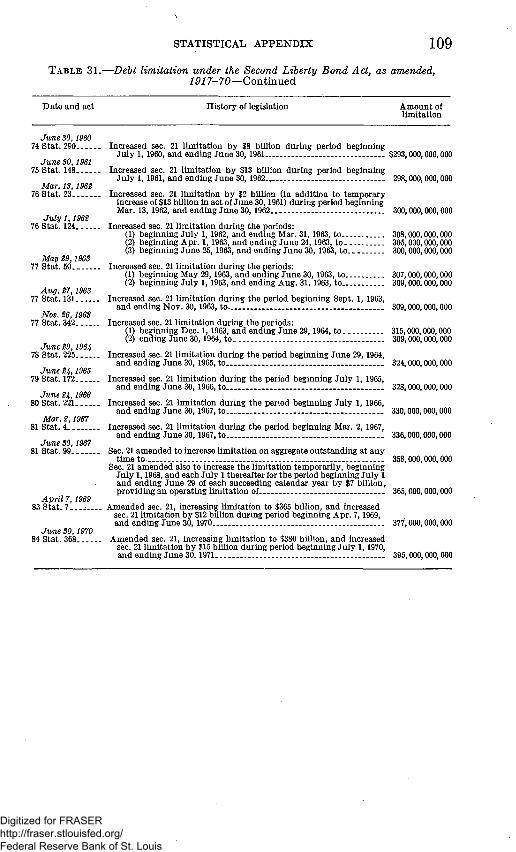
STATISTICAL APPENDIX 1 0 9
TABLE 31. —Debt limitation under the Second Liherty Bond Act, as amended, 1917-70—Continued
Date and act History of legislation Amount of Ihnitation
June 30,1960 74 Stat. 290 Increased sec. 21 limitation by $8 biUion dmmg period beginning
Ju ly l , 1960, and ending June 30,1961 $293,000,000,000 June 30,1961
76 Stat. 148 Increased sec. 21 limitation by $13 bUlion during period beginning July 1, 1961, and ending June 30, 1962 298,000.000,000
Mar. IS, 1962 76 Stat. 2 3 . . . Increased sec. 21 limitation by $2 biUion (in addition to temporary
increase of $13 bUlion m act of June 30,1961) dming period beginnhig Mar. 13,1962, and endhig June 30,1962 300.000,000,000
July 1,1962 76 Stat. 124 Increased sec. 21 liraitation during the periods:
(1) beginning July 1, 1962, and ending Mar. 31,1963, to 308,000,000,000 (2) beginning Apr. 1,1963, and ending June 24,1963, to . 305,000,000,000 (3) beginnhig June 25, 1963, and ending June 30, 1963, to 300,000.000,000
May 29,1963 77 Stat. 50 Increased sec. 21 limitation during the periods:
(1) beginning May 29, 1963, and ending June 30,1963, to. 307,000,000,000 (2) beghmmg July 1,1963, and ending Aug. 31, 1963, to 309,000,000,000
Aug. 27,1963 77 Stat. 131 Increased sec. 21 limitation during the period begirming Sept. 1, 1963,
and ending Nov. 30, 1963, to 309,000,000,000 Nov. 26,1963
77 Stat. 342 Increased sec. 21 limitation during the periods: (1) beginning Dec. 1,1963, and ending June 29,1964, to 315,000,000,000 (2) ending June 30,1964, to 309,000,000,000
June 29,1964 78 Stat. 225 Increased sec. 21 limitation durhig the period beginning June 29,1964,
and ending June 30, 1965, to 324.000.000.000 June 24,1966
79 Stat. 172 Increased sec. 21 limitation during the period beginning July 1, 1965, and ending June 30, 1966, to 328,000.000.000
June 24,1966 80 Stat. 221 Increased sec. 21 limitation during the period beginning July 1, 1966,
and ending June 30,1967, to - . . 330.000,000,000 Mar. 2,1967
81 Stat. 4 Increased sec. 21 limitation during the period beginning Mar. 2, 1967, and endhig June 30,1967, to 336,000,000,000
June SO, 1967 81 Stat. 99. _ Sec. 21 amended to increase limitation on aggregate outstanding at any
thne t o - . - 368,000,000,000 Sec. 21 amended also to increase the limitation temporarily, beginning
July 1,1968, and each July 1 thereafter for the period beginning July 1 and ending June 29 of each succeeding calendar year by $7 billion, providing an operating liraitation of 365,000,000,000
April 7,1969 83 Stat. 7 . . . . . . . . Amended sec. 21, increasing limitation to $365 billion, and hicreased
sec. 21 limitation by $12 bUlion dming period beginning Apr. 7,1969, and endmg June 30, 1970 377,000,000,000
June 30,1970 84 Stat. 368- Amended sec. 21, increasing limitation to $380 billion, and increased
sec. 21 limitation by $15 biUion dm-ing period beghining July 1,1970, and endmg June 30,1971 ---- -- - 395.000,000,000
Digitized for FRASER http://fraser.stlouisfed.org/ Federal Reserve Bank of St. Louis

II. Operations
T A B L E 32.—Public debt receipts and expenditures by classes, monthly for the fiscal year 1970 and totals for 1969 and 1970
[On basis of daily Treasury statements, see "Bases of Tables"]
Receipts (issues) July 1969 August 1969 September 1969 October 1969 November 1969 December 1969 January 1970
regular.
Total marketable issues... . 18, 726,838, 000. 00 16,252,469, 000. 00 14,819, 608, 000. 00 28, 597, 596,000. 00 14, 519,101, 000. 00 15, 027,866, 000. 00 15, 024, 591, 000. 00
Pubhc issues: "^ Marketable: g
Treasury biUs: 2 Regular weekly $9,889,012,000.00 $10,014,537,000.00 $8,796,336,000.00 $11,100,367,000.00 $8,515,618,000.00 $9,516,802,000.00 $11,885,417,000.00 ^ Tax anticipation 3,515,076.000.00 3,000.00 5,011,084,000.00 2,507,707,000.00 3,335,000.00 - . Other 1,200,714,000.00 2,294,937,000.00 1,066,756,000.00 43,000.00 2,220,548,000.00 165,000.00 S
Treasmy notes..
Subtotal- 14,604,802,000.00 10,014,540,000.00 11,091,273,000.00 17,178,207,000.00 11,023.368,000.00 11,740,685,000.00 11,885,582,000.00 M
Exchanges: Treasury bills: rn
Regular weekly 3,618,982,000.00 3,305,892,000.00 2,812,090,000.00 3,929,088,000.00 3,495,837,000.00 2.603,578,000.00 3,144,671,000.00 N Other. 501,500,000.00 911,442,000.00 436,024,000.00 -35,000.00 783,458,000.00 -25,000.00 o
Treasury notes 1.554,000.00 2.932,037,000.00 4,803,000.00 7,054.277,000.00 -69,000.00 145,000.00 -5,637,000.00 ^ Certificates of indebtedness, K
H9 >
Subtotal . . 4,122,036,000.00 6,237,929,000.00 3,728,335,000.00 11,419,389,000.00 3,495,733,000.00 3,287,181,000.00 3,139,009.000.00 td y<
O Nonraarketable: ^
Certificates of indebtedness: . j Foreign series 437,000.000.00 488,000,000.00 645,000,000.00 1,355,000,000.00 555,000,000.00 891,000,000.00 1,258,017,399.32 ^ Foreign currency series 129,824,659.02 79,850,110.41 54,686,772.78 99,791.134.83 H
Depositary bonds 282,000.00 643,000.00 38,000.00 274,000.00 416,000.00 2,553,000.00 283.000.00 fej Treasury notes: .,
Foreign series. 150,000,000.00 175,000,000.00 250,000,000.00 H Foreign currency series 155,964,899.46 30,243.108.06 29,799.029.80 45,486.464.96 g
Treasury bonds: ^ REAseries 50,000.00 30,000.00 30,000.00 ^
U.S; savings notes 31,959,033.85 29,158,104.23 31,794,357.23 35,948,960.72 25,391,699.88 32,972,343.00 28,938,597.78 JH U.S. retireraent plan bond 204,124.14 407,223.21 509,629.43 35,617.42 144,654.56 1,845,504.67 3,123,498.42 ^ 33^% Treasmy bonds.-- - ------ 75,000,000.00 ^ 1% Treasury certificates. 2,801,855.51 ^ 3.50% Treasury certificates 107,224,162.09 77,709,241.97 99,922,916.87 308,678,667.94 66,553,826.57 ' 178,703,289.63 3,546,519.92 6.151% Treasury certificates . - -. 6.182% Treasury certificates - - --
Digitized for FRASER http://fraser.stlouisfed.org/ Federal Reserve Bank of St. Louis

Receipts (issues) February 1970 March 1970 April 1970 May 1970 June 1970 Total, fiscal year Total, fiscal year 1970 1969
PubUc issues: Marketable:
Treasury biUs: Regular weekly $8,453,581,000.00 $12,414,667,000.00 $15,519,683,000.00 $12,401,120,000.00 $12,422,380,000.00 $130,929,520,000.00 $106,968,977,000.00 Tax anticipation 3,510,668,000.00 600,000.00 14,548,473,000.00 10,789,291,000.00 Other 970,601,000.00 3,401,494,000.00 1,700,269,000.00 3,402,150,000.00 16,257,677,000.00 15,386,307.000.00
Treasury notes 3,313,724,000.00 350,332,000.00 3,664,056,000.00 5,412,973,000.00
Subtotal 9,424,182,000.00 19,326,829,000.00 17,220,552,000.00 15,714,844,000.00 16,174,862,000.00 165,399,726,000.00 138,557,548,000.00
Exchanges: Treasm-y biUs: ZP
Regular weekly 3,642,529,000.00 26,452,667,000.00 37,163,856,000.00 ^ Other.. 533,997,000.00 3.166,361.000.00 5,336,298,000.00 >
Treasury notes 5,951,548,000.00 8,066,000.00 4,396,000.00 15,456,711,000.00 -360,080,000.00 31,047,751,000.00 32,571,515,000.00 H Certificates of hidebtedness, ui
regular.
Subtotal 10,128,074,000.00 8,066,000.00 4,396,000.00 15,456,711,000.00 -360,080,000.00 60,666,779.000.00 75,071,669,000.00 ^
Total marketable issues 19,552,256,000. 00 19,334,895,000. 00 17,224,948,000. 00 31.171.555,000. 00 15,814.782,000. 00 226,066,505,000. 00 213,629,217,000. 00
Nonmarketable: hd Certificates of indebtedness: H^I
Foreign series 1,148,000,000.00 566,000,000.00 601,017,399.32 45,000,000.00 490,000,000.00 8,479,034,798.64 9,873,987,405.54 fel Foreign currency series 49,968.624.35 414,121,301.39 1,127,015,506.26 IzJ
Depositary bonds 16,000.00 90,000.00 260,000.00 112,000.00 368,000.00 5,335,000.00 3,545,000.00 O Treasury notes: H
Foreign series 300,000,000.00 300,000,000.00 200,000,000.00 500,000,000.00 1,875,000,000.00 955,000,000.00 t^ Foreign currency series 30,396,858.30 52,251,457.24 53,385,729.56 23,193,784.07 420,721,331.45 1,274,291,568.03
Treasm-y bonds: REA series . 10,000.00 120,000.00 475,000.00
U.S. savings notes 33,302,084.39 33,949,410.95 21,038,306.95 20,810,041.82 22,065,300.87 347,328,241.67 337,532,473.42 U.S. retireraent plan bonds 242,795.49 337,519.11 273,548.78 217,387.80 724,882.60 8,066,385.63 7,483,903.03 33^% Treasury bonds 75,000,000.00 1%, Treasury certificates. 5,315,864.79 8,117,720.30 10.191,634.43 3.50% Treasury certificates 8.358,102.61. 3,334.37 2,866.05 783,927,308.95 1,634,630,236.97 5.151% Treasury certmcates 8,699,38L01 6.182% Treasury certificates 1,469.340.23
Digitized for FRASER http://fraser.stlouisfed.org/ Federal Reserve Bank of St. Louis

t o T A B L E 32.—Puhlic debt receipts and expenditures hy classes, monthly for the fiscal year 1970 and totals for 1969 and 1970—Continued
———— __ Receipts (issues) July 1969 August 1969 September 1969 October 1969 November 1969 December 1969 January 1970 co
<i o
PubUc issues—Continued Nonmarketable—Continued td
6.190% Treasmy certificates . g 6.23% Treasmy certificates ^ 6.238% Treasmy certificates 2 6.400% Treasm-y certificates . G 6.471% Treasmy certificates ^ 6.053% Treasmy certificates Q 6.065% Treasm-y certificates . M 6.167% Treasury certificates 6.199% Treasmy certificates... H 6.330% Treasmy certificates hj 6.45% Treasmy certificates $ 1,858,078.35 . 6.876% Treasury certificates.
fel 7.030% Treasury certificates $1,242,269.06 rc 7.10% Treasmy certificates 328,944.32 td 7.106% Treasmy certificates 1,559,123.41 O 7.172% Treasmy certificates 1,220,387.51 td 7.888% Treasmy certificates $1,264,101.94 fel 8.096% Treasmy certificates 1,588,851.58 H U.S. savings bonds: >
Issueprice 388,684,269.84 $347,643,516.79 $321,110,295.72 403,692,067.82 $274,320,067.04 $345,656,547.47 380,581,625.49 td Accrued discount 167,788,878.87 138,387,728.27 159,257,206.44 151,825,627.99 142,697,450.48 169,172,135.02 172,370,772.13 *< Exchanges, Series H 19,063,500.00 14,193,500.00 13,685,500.00 14,924,000.00 11,134,000.00 13,498,000.00 17,185,000.00
U.S. savings stamps 1,693,594.80 144,552.70 586,546.95 3,093,091.60 1,636,979.25 O Tax and loss bonds 1,023,300.00 1,023,200.00 ^
Total nonmarketable Issues-. 1,441,073,993.13 1,177,736,019.68 1,452,758,866.45 2,503,812,598.41 1,105,456,728.33 1,717,318,966.90 2,263,813,945.62 l i
Total public issues 20,167,911,993.13 17,430,205,019.68 16,272,366,866.45 31,101,408,598.41 15,624,557,728.33 16,745,184,966.90 17,288,404,945.62 fe^
Special issues: y ^
Civil service retirement fund 375,478,000.00 291,937,000.00 262,821,000.00 269,322,000.00 260,303,000.00 365,558,000.00 332,218,000.00 ^ Employees'Ufe insurance fund.. . 46,142,000.00 35,662,000.00 330,000.00 55,000,000.00 54,652,000.00 g Export-Import Bank of the ^
United States. /H Federal Deposit Insurance Corp.. 121,016.000.00 161,653,000.00 162,500,000.00 142,576,000.00 133,155,000.00 137,813,000.00 199,783,000.00 Q Federal disabiUty insurance trust fj
fund 273,614,000.00 354,843,000.00 335,219,000.00 224,337,000.00 228,455,000.00 390,907,000.00 237,800,000.00 ^ Federal home loan banks : . 86,500,000.00 220,000,000.00 297,000,000.00 418,000,000.00 667,500,000.00 703,000,000.00 546,500.000.00 Federal hospital Insurance trust
fund. 343,245,000.00 500,965,000.00 531,350,000.00 275,397,000.00 284,788,000.00 1,043,742,000.00 298,240,000.00
Digitized for FRASER http://fraser.stlouisfed.org/ Federal Reserve Bank of St. Louis

Receipts (issues) February 1970 March 1970 April 1970 May 1970 June 1970 Total, fiscal year Total, fiscal year 1970 1969
PubUc issues—Continued Nonmarketable—Continued
6.190% Treasmy certificates - - - - $1,153,006.74 5.23% Treasury certificates - - - - - 211.77 6.238% Treasmy certificates -.- - --- - -- 2,358,034.48 5.400% Treasury certificates - - - : 1,449,768.36 5.471% Treasury certificates - - -- --- 1,167,967.00 6.053% Treasury certificates- - - 1,202,195.29 6.065% Treasmy certificates - - - ---- 1,830,326.04 6.167% Treasury certificates - - 1,183,941.87 6.199% Treasury certificates --- - 1,802,393.45 6.330% Treasury certificates --- $1,621,009.93 ---- $1,621,009.93 ZP 6.45% Treasury certificates--- - - - - - - 1,858,078.35 H 6.876% Treasury certmcates 1,289,030.03 1,289,030.03 > 7.030% Treasury certmcates - - 1,242,269.06 - g 7.10% Treasury certmcates 328.944.32 jji 7.106% Treasury certmcates - - - 1.559,123.41 -- H^ 7.172% Treasury certmcates - -- - - - ---- 1,220,387.51 ^ 7.888% Treasmy certmcates - ---- - - - ---- 1,264.101.94 s^ 8.096% Treasury certmcates - - 1,588,851.58 P U.S. savings bonds:
Issueprice ._ $382,752,881.90 $426,682,632.70 365,701,25L12 $366,742,788.38 $445,620,793.13 4,449,188,737.40 4,548,181,348.75 > Accrued discount 151,216,425.11 160,165,045.86 156,793,410.42 137,323,320.27 134,418,452.85 1,841,416,453.71 1,788,738,097.60 Hrf Exchanges, Series H . _. 20,864,500.00 24,374,500.00 20,480,000.00 18,254,000.00 21,883,500.00 209,540,000.00 185,239,500.00 ^
U.S. savirigs stamps 3,736,178.25 1,659,250.25 3,126,875.20 529,742.20 16,206,811.20 20,318,350.60 g Tax and loss bonds 985,248.70 1,480,003.93 1,158,765.00 5,670,517.63 5,016,939.60 ^
t)
Total nonmarketable issues.. 1,798,457,592.10 1,544,640,465.87 1,522,208,752.09 844,985,009.08 2,429,206,394.46 19,801,469,332.12 20,159,332,193.60 H
Total public issues 21, 350, 713, 592.10 20,879, 535, 465. 87 18, 747,156. 752. 09 32,016, 540, 009. 08 18, 243, 988, 394. 46 245,867, 974, 332.12 233, 788, 549,193. 50
Special issues: CivU service retirement fund 283,130,000.00 280,213,000.00 290,195,000.00 340,971,000.00 3,323,306,000.00 6,675,4.52,000.00 6,602,629,000.00 Employees'hfe insm-ance fund... 8,852,000.00 60,000,000.00 260,638,000.00 50,000,000.00 Export-Import Bank of the
UnitedStates - 244,405,000.00 Federal Deposit Insurance Corp. 345,715,000.00 333,431,000.00 335,359,000.00 370,056,000.00 76,941,000. 00 2,519,998,000.00 2, 2S8, 942,000. 00 Federal disability insurance
trustfund . . 440,078,000.00 490,450,000.00 419,951,000.00 512,045,000.00 1,839,268,000.00 5,746,967,000.00 4,925,371,000.00 Federal horae loan banks 438,000,000.00 305,500,000.00 203,000,000.00 304,000,000.00 257,000,000.00 4,446,000,000.00 881,200,000.00 Federal hospital insurance trust
fund 404,210,000.00 562,432,000.00 446,974,000.00 641,941,000.00 1,416,912,000.00 6,650,196,000.00 6,156,7'27,000.00 h-l 03
Digitized for FRASER http://fraser.stlouisfed.org/ Federal Reserve Bank of St. Louis
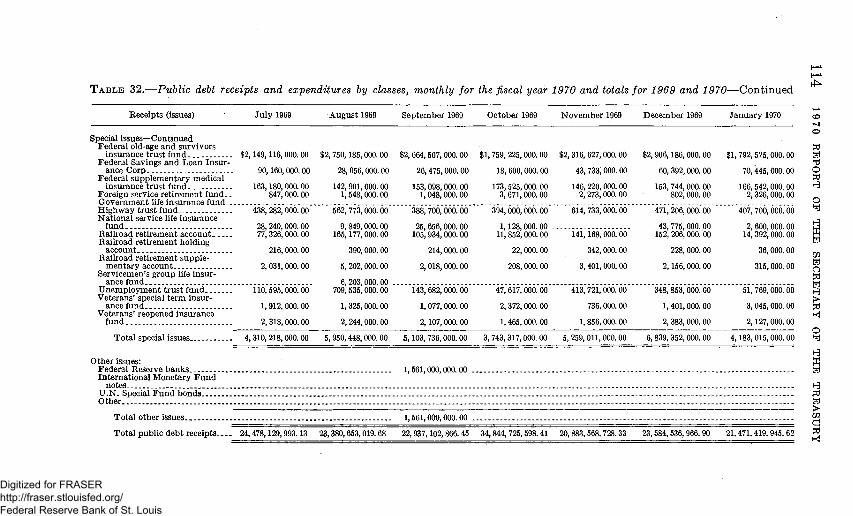
TABLE 32.—Public debt receipts and expenditures by classes, monthly for thefiscal year 1970 and totals for 1969 and 1970—Continued
Receipts (issues) Ju ly 1969 August 1969 September 1969 October 1969 November 1969 December 1969 January 1970 co : . : <i
o Special issues—Continued
Federal old-age and survivors td insmance trust fund $2,149,116,000.00 $2,750,185,000.00 $2,664,607,000.00 $1,759,225,000.00 $2,316,627,000.00 $2,906,186,000.00 $1,792,525,000.00 fel
Federal Savings and Loan Insur- Hrf ance Corp 90,160,000.00 28,066,000.00 26,475,000. 00 18,600,000.00 43,733,000.00 60,392,000. 00 70,445,000.00 O
Federal supplementary medical td insmance trust fund 163,180,000.00 142,901,000.00 153,098,000.00 173,525,000.00 146,220,000.00 153,744,000.00 166,542,000.00 ^
Foreign service retheraent fund.. 847,000.00 1,548,000.00 1,048,000.00 3,671,000.00 2,273,000.00 802,000.00 2,326,000.00 Government lUe insmance fund. 2 Highway trust fund 438,282,000.00 562,773,000.00 388,700,000.00 394,000,000.00 614,733,000.00 471,206,000.00 407,700,000.00 ^ National service hfe insurance ^
fund 28,240,000.00 9,849,000.00 25,656,000.00 1,128,000.00 43,775,000.00 2,600,000.00 \3 Raikoad rethement account 77,326,000.00 165,177,000.00 105,934,000.00 11,852,000.00 141,168,000.00 162,206,000.00 14,392,000.00 g Railroad rethement holding ^
account. 216,000.00 390,000.00 214,000.00 22,000.00 342,000.00 228,000.00 36,000.00 Raikoad retirement supple- \ii
menta ry account . . 2,031,000.00 6,202,000.00 2,018,000.00 208,000.00 3,401,000.00 2.156,000.00 315,000.00 Q Serviceraen's group lUe insur- ^
ance fmid 6,203,000.00 hd Unemployraent t rus t fund 110,595,000.00 709,535,000.00 143,682,000.00 47,617,000.00 413,721,000.00 348,853,000.00 51,769,000.00 H3 Veterans' special term insur- >.
ance fund 1,912,000.00 1,325,000.00 1,077,000.00 2,372,000.00 736,000.00 1,401,000.00 3,045,000.00 ^ Veterans ' reopened insurance KJ
fund- 2,318,000.00 2,244,000.00 2,107,000.00 1,465,000.00 1,856,000.00 2,383,000.00 2,127,000.00 O
Total special issues 4.310,218,000.00 5,960,448,000.00 6,103,736,000.00 3,743,317,000.00 5,259,011,000.00 6,839,352,000.00 4,183,015,000.00 fel
Otherissues: [3^ Federal Reserve banks 1,561,000,000.00 fel International Monetary F u n d
notes H U . N . Special F u n d bonds td Other fel
> Total other issues 1,661,000,000.00 ^ Total public debt receipts 24.478,129,993.13 23,380,653,019.68 22,937,102,866.45 34,844,725,598.41 20,883,668,728.33 23,584,636,966.90 21,471,419,945.62 ^
• H ^
Digitized for FRASER http://fraser.stlouisfed.org/ Federal Reserve Bank of St. Louis

Receipts (issues) February 1970 March 1970 AprU 1970 May 1970 June 1970 Total, fiscal year Total, fiscal year 1970 1969
Special issues—Continued Federal old-age and survivors insurance trust fund... $2,441,447,000.00 $3,362,105,000.00 $2,888,799,000.00 $3,526,335,000.00 $7,969,076,000.00 $36,526,133,000.00 $31,812,031,000.00 Federal Savings and Loan In
surance Corp 76,669,000.00 84,466,000.00 86,062,000.00 111,201,000.00 104,381,000.00 800,629,000.00 682,033,000.00 Federal supplementary medical
insmance trust fund... 165,613,000.00 146,905,000.00 171,228,000.00 149,116,000.00 149,267,000.00 1,880,339,000.00 2,108,761,000.00 Foreign service rethement fund.. 1,170,000.00 985,000.00 1,168,000.00 1,374,000.00 8,130,000.00 25,342,000.00 69,101,000.00 Government life insm-ance fund 29,964,000.00 29,964,000.00 32,638,000.00 Highway trust fund. 390,623,000.00 644,300,000.00 421,300,000.00 511,096,000.00 3,039,637,000.00 8,284,350,000.00 6,279,893,000.00 National service life insurance
fund 59,849,000.00 1,128,000.00 569,007,000.00 741,232,000.00 358,346,000.00 rn Raikoad retirement account 208,180,000.00 105,123,000.00 26,734,000.00 141,334,000.00 1,548,138,000.00 2,697,564,000.00 2,267,300,000.00 H Raikoad retirement holding >
account 356,000.00 172,000.00 66,000.00 692,000.00 2,731,000.00 6,465,000.00 11,382,000.00 ^ Railroad retirement supple- t^
mentary account 4, 297,000.00 17, 649,000.00 1,137,000.00 6,543,000. 00 25,330,000.00 70,287,000.00 32, 766,000.00 ^ Servicemen's group Ufe insurance M
fund- - -- - 6,203,000.00 9 Unemployment trust fund 930,150,000.00 93,644,000.00 112,134,000.00 1,086,325,000.00 10,676,612,000.00 14,723,537,000.00 13,925,724,000.00 £ Veterans' special terra insurance ^
fund 1,850,000.00 1,680,000.00 726,000.00 1,176,000.00 60,001,000.00 77,200,000.00 263,021,000.00 s^ Veterans' reopened insmance M
fund 1,911,000.00 2,101,000.00 2,340,000.00 2,484,000.00 54,276,000.00 77,612,000.00 161,137,000.00 y • fel
Total special issues 6,202,000,000.00 6,430,046,000.00 6,408,300,000.00 7,605,689,000.00 31,209,877,000.00 92,245,008,000.00 79,143,407,000.00 ^ - O
I—l Other issues: YA
Federal Reserve banks 1,561,000,000.00 1,905,000,000.00 Intemational Monetary Fund
notes U.N. Special Fund bonds . Other
Total other issues 1,561,000,000.00 1,905,000,000.00
Total pubUc debt receipts.... 27, 552, 713, 592.10 27, 309, 580, 465. 87 24,155, 456, 752. 09 39, 622, 229, 009. 08 49, 453, 865, 394. 46 339, 673, 982, 332.12 314, 836, 956,193. 50
Cn
Digitized for FRASER http://fraser.stlouisfed.org/ Federal Reserve Bank of St. Louis

T A B L E 32.—Public debt receipts and expenditures by classes, monthly for the fiscal year 1970 and totals for 1969 and 1970—Continued o
Expend i tu res (ret irements)
Pub l ic issues: Marketable :
T rea su ry b m s : Regular weekly T a x ant ic ipat ion O t h e r . . .
Cer tmcates of indebtedness , regular
Treasu ry notes . . T reasu ry bonds Other
S u b t o t a l . . .
Exchanges : T r e a s u r y biUs:
Regular weekly Other
Cer tmcates of indebtedness, regular
T rea su ry notes T reasu ry bonds
S u b t o t a l .
To ta l marke tab le i s s u e s . . .
Nonmarke tab le : Adjus ted service bonds A r m e d Forces leave bonds T r e a s m y notes:
Fore ign series Foreign currency series
W i % Treasu ry b o n d s . 1% 'Treasury certif icates. 3.50% Treasu ry cer tmcates . . 5.14%Treasury certificates 5.146% Treasu ry cer tmcates . . 5.151% T r e a s m y c e r t m c a t e s . . . 5.182% Treasm-y cer tmcates ._ 6.186% T r e a s m y c e r t m c a t e s . . .
J u l y 1969
- $6,745,031,000.00 11,159,000. 00
- 4,387,618,000.00
. ............. 82,375,800. 00
3,123. 25
. 11,228,562,923.25
. 3,618, 982,000.00 501,500,000.00 .
. 4,120,482,000.00
. 15,349,044,923.25
4,300.00 22,400.00
25,386,170.43 47, 548, 553.78
1,818,991. 54 .
Augus t 1969
$7,867, 251,000. 00 4,638,000. 00
76,960,000.00
15,000.00 . 406,596, 000. 00
39,311,550. 00 1,600.00
8,394, 773,150. 00
3,305, 892,000.00
2, 929,252,000. 00 2,143, 000.00 .
6,237,287,000. 00
14, 632,060,150.00
5, 750.00 23,800. 00
127, 512. 95 100,182,893. 89
September 1969
$7,867,820,000. 00 1,444,000. 00
3,177,306,000.00
26,275.000.00 36, 289,400. 00
9,539. 75
11,109,143,939. 76
2,812,090,000.00 911,442,000. 00
-75,000.00
3, 723,457,000. 00
14,832, 600,939. 75
4,000.00 24,450.00
150, 550,784. 97 30,106, 530. 80
October 1969
$10,606,429, 000. 00 2, 230,000. 00
1,502, 523,000. 00
3,000.00 97,363,000. 00
1,054,538,600. 00 3,121. 50
13, 263,089,721. 60
3, 929,088,000.00 436,024,000. 00
74,731,000.00 6,956, 813,000. 00
11, 396, 656,000. 00
24, 659, 745, 721. 50
3, 500.00 25,825.00
100,196,307.12 25,101,370. 92
15, 400,038. 70
N o v e m b e r 1969
$8,154, 780,000. 00 3,394,000.00
30,866,000. 00
61,000. 00 2,335,000.00
65,588,800. 00 2, no. 00
8, 257,016,910. 00
3,495, 837,000.00 -35,000.00
-6 ,000 .00 -1,645,000.00
3,494,151,000.00
11, 751,167, 910.00
2,750.00 15,950. 00
3,626, 620. 77 199,576,233.37 ..
7, 810, 431. 06
Deceraber 1969
$8,453, 239,000. 00 1, 758, 789,000.00 2,773,923,000.00
8,000.00 . 1,836,000.00
655, 290, 750. 00 935. 00
13,643,086, 685.00
2, 503, 578, 000. 00 783,458,000. 00
-233,000. 00 -688,000.00
3,286,115, 000. 00
16, 929,201,685. 00
6,200.00 27,475.00
56,342.30
2,700,648.01 . 4, 562,406. 79
J a n u a r y 1970
$11,351,131,000.00 2,925,000. 00
27,540,000. 00
1,341,000. 00 96,707,650. 00
7,906. 75
11,479, 652, 556. 75
3,144,671,000. 00 -25,000.00
-7 ,627,000.00 15, 000. 00
3,137, 034,000. 00
14,616,686, 556. 75
3,600. 00 22,375. 00
250,000,000.00 651.478, 376.46
5,406,964.35
1—'
CO
o
td fel Hr) O td H3
O fel
fel
ZP fel o td
> •
td Kj
o fel H
fel
H td fel > ZP
td K}
Digitized for FRASER http://fraser.stlouisfed.org/ Federal Reserve Bank of St. Louis

Expend i tu r e s ( re t i reraents) F e b r u a r y 1970 March 1970 Apri l 1970 May 1970 J u n e 1970 To ta l , fiscal year To ta l , fiscal year 1970 1969
Pub l i c issues: Marke tab le :
T r e a s u r y bills: Regular weekly $7,842,362,000.00 $12,043,175,000.00 $12,021,365,000.00 $12,007,631,000.00 $12,081,804,000.00 $117,042,018,000.00 $95,537,779,000.00 T a x an t ic ipa t ion 1,281,000.00 1,744,753,000.00 4,728,667,000.00 31,500,000.00 4,504,381,000.00 12,795,161,000.00 10,803,479,000.00 Other 1,491,283,000.00 2,957,528,000.00 4,441,943,000.00 111,026,000.00 3,146,322,000.00 24,124,838,000.00 22,761,324,000.00
Certiflcates of indebtedness , reeular 5,000.00 39,000.00 10,000.00 131,000.00 151,500.00
T r e a s u r y no t e s . 830,000.00 606,500.00 87,780,000.00 1,101,550,000.00 387,823,000.00 2,116,711,500.00 4,096,940,200.00 T r e a s u r y bonds 410,603,300.00 303,987,450.00 89,229,850.00 70,306,000.00 63,544,200.00 2,967,773,350.00 5,691,731,100.00 O t h e r . . 1,033.50 7,970.75 8,08L50 6,736.00 7,765.50 59,923.50 212,426.00
Exchanges :
N o n m a r k e t a b l e : Adjus ted service b o n d s . . 6,750.00 7,400.00 10,050.00 6,500.00 8,000.00 68,800.00 90,350.00 A r m e d Forces leave b o n d s . . . 26,600. 00 34,675.00 29,525. 00 25,900.00 31,550.00 310,626.00 344,476.00 T r e a s m y notes:
Foreign series 433,55L51 13,970,546.50 202,670,822.16 783,632.99 85,203,559.54 833,005,851.24 617,383,430.92 Foreign c m r e n c y series 52,204,176.33 53,187,750.14 23.280,176.93 1,182,666,062.62 819,441,684.42
1% T r e a s m y cer tmcates 7,849,378.60 i-10,550,026. 61 10,009,125.37 3.50% T r e a s m y cer tmcates 14,869,151.22 8,045,754.62 8,679,666.43 785,858,039.29 852,451,444.00. 5.14% T r e a s u r y cer tmcates 16,331,770.86 6.146% T r e a s u r y certificates 1,431,353.99 5.151% T r e a s m y certificates 8,699,381.01 5.182% T r e a s m y certificates L 1,469,340.23 5.186% T r e a s m y certificates . . 2,327,853.86
ZP Subto ta l 9,746,360,333.50 17,050,062,920.75 21,369,031,931.50 13,322,029,736.00 20,183,881,965.50 159,046,692,773.50 138,891,617,226.00 H^
> y ^
T r e a s u r y biUs: zp Regular w e e k l y . . . 3,642,529,000.00 26,452,667,000.00 37,163,856,000.00 t^ Other 533,997,000.00 3,166,361,000.00 5,336,298,000.00 f
Certificates of indebtedness , s^ regular . HH
T r e a s m y n o t e s . . . 2,000.00 15,420,792,000.00 -361,442,000.00 18,055,394,000.00 26,038,704,000.00 T r e a s m y b o n d s . . . 5,947,424,000.00 -6 ,000 .00 16,132,000.00 12,920,188,000.00 6,476,609,000.00 >
. : hTd
S u b t o t a l . . . 10,123,950,000.00 -4 ,000 .00 15,436,924,000.00 -361,442,000.00 60,594,610,000.00 76,015,467,000.00 ^ fel
Tota l raarketable issues 19,870,310,333.50 17,050,062,920.76 21,369,027,931.50 28,758,953,736.00 19,822,439,965.50 219,641,302,773.50 213,907,084,226.00 ^ = = = O
X
Digitized for FRASER http://fraser.stlouisfed.org/ Federal Reserve Bank of St. Louis

TABLF, 32.—Puhlic debt receipts and expenditures by classes, monthly for the fiscal year 1970 and totals for 1969 and 1970—Continued (X)
Expend i tu res ( re tkements ) J u l y 1969 Augus t 1969 Septeraber 1959 October 1969 November 1969 Deceraber 1969 J a n u a r y 1970
o
td fel Hd O td y ^
o fel
y ^
W fel
ZP fel o td fel y ^ > td Kl
O fel
y ^
fel
td fel > ZP
d td
Pub l i c issues—Continued Nonmarke tab le—Cont inued
5.190% Treasu ry cer t i f ica tes . . . 6.238% T r e a s m y cer t i f ica tes . . . 5.400% Treasu ry cer t i f ica tes . . . b.'^ivyo T r e a s m y c e r t m c a t e s . . . 5.499% Treasm-y cer t i f ica tes . . . 6.053% Treasury cer t i f ica tes . . . 6.065% T r e a s m y c e r t m c a t e s . . . 6.167% T r e a s m y cer t i f ica tes . . . 6.199% Treasm-y cer t i f ica tes . . . 6.45% Treasury certificates 7.030% Treasm-y c e r t m c a t e s . . . 7.10% Treasury cer tmcates 7.106% Treasm-y c e r t m c a t e s . . . 7.172% T r e a s m y c e r t m c a t e s . . . 7.888% Treasu ry c e r t m c a t e s . . . 8.096% T r e a s m y cer t i f ica tes . . .
Cer tmcates of indebtedness : Foreign series Foreign currency series.
Deposi tary bonds Excess profits tax refund b o n d s . . T reasu ry bonds :
Foreign series Foreign currency series I n v e s t m e n t series R E A s e r i e s . . -
Treasu ry tax and savings n o t e s . . U .S . savings n o t e s . . U .S . ret i reraent p lan bonds U .S . savings bonds :
Matured: Issue pr ice . Accrued discount Series H
U n m a t u r e d : Issue price Accrued discount
$1,202,195.29 . 1,830,326,04 .
$1,858,078.35 .
'"326," 949.'42"!
"l722'o7387r5'l".
472,000, 000. 00 285,404,983.33
2,856,000. 00 621.29
$503, 200,000. 00 79,702,618.50 .
780,000. 00
$704,000, 000. 00
566,'moo'
1,035,800,000. 00 54,372,975. 47
500,000. 00 727. 49
30,000,000. 00
$691,000, 000. 00 29,977,691.02 .
638,000. 00 76.36 .
$918,000,000. 00
6i7,'6o6.'66'
21, 000. 00 281,000. 00
2,500. 00 6,889,446. 85
122,626. 78
126, 534,636. 75 88,046.345. 78 31,957,000.00
341, 206,452.35 17,633,307.99
20, 000. 00 225,000.00
7,025. 00 6, 564, 751. 76
76,896. 07
91,122, 285. 25 63,948,086. 41 20,603,000.00
245,332,517. 93 12,442,832.16
10, 000.00 200, 000. 00
1,825.00 . 8, 724,057. 69
94,596. 05
143, 710, 698.00 100,028, 275. 38 24, 266,000. 00
365,906,385.76 20,028,900. 47
10,000. 00 855,000. 00
;, 080,851.33 134,223.90
112,392. 998. 75 77, 900,504. 52 38, 211,000. 00
309, 755,828.98 15,828,326. 62
10,000. 00 786,000. 00
150. 00 8,395, 226. 69
70,180. 92
103,128, 712. 50 72,331, 696. 92 21, 829, 500. 00
286,191,076.34 15. 084.147. 58
22,000. 00 830,000. 00
8,100. 00 10,095,424. 00
62,460. 76
125, 271,626. 75 89,037,925. 63 21, 554,000. 00
319, 221,983. 98 18, 077,557. 09
$1, 242,269.06
'"l, '56i, 'ii8."3i
738,000, 000. 00 99,856,021. 55
58,000. 00 69.52
118,000. 00 328,000. 00
550. 00 8,743,082.41
212,476.95
92,223,445. 25 66,300, 657. 72 26, 627,500. 00
270,090,694. 51 13, 464,968. 93
Digitized for FRASER http://fraser.stlouisfed.org/ Federal Reserve Bank of St. Louis

Expenditmes (retirements) February 1970 March 1970 AprU 1970 May 1970 June 1970 Total, fiscal year Total, fiscal year 1970 1969
Public issues—Continued Nonmarketable—Continued
6.190% Tieasury certmcates $1,153,006.74 5.238% Treasury certificates 8,891,352.93 5.400% Treasmy certificates 1,449,768.36 5.471% Treasury certificates 1,167,967.00 5.499% Treasury certificates . 1,137.370.74 6.063% Treasury certificates $1,202,195.29 6.065% Treasury certificates 1,830,326.04 6.167% Treasm-y certificates . 1,183,941.87 6.199% Treasury certiflcates 1,802,393.45 6.45% Treasury certiflcates 1,858,078.35 ZP 7.030% Treasury certiflcates 1,242,269.06 y 7.10% Treasury certiflcates. 326,949.42 > 7.106% Treasury certificates : 1,561,118.31 ^ 7.172% Treasm-y certificates 1,220,387.51 ^ 7.888% Treasury certificates $1,264,101.94 1,264,101.94 ^ 8.096% Treasury certificates 1,588,851.58 1,588,851.58 HH
Certificates of indebtedness: KT Foreign series $827,000,000.00 $585,000,000.00 951,017,399.32 $330,000,000.00 $50,000,000.00 7,805,017,399.32 10,479,987,405.54 t-I Foreign currency series.. 49,872,419.39 54,686,772.78 653,873,482.04 954,993,220.72
Depositary bonds 55,000.00 82,000.00 743,000.00 262,000.00 847,000.00 8,004,500.00 5,880,000.00 > Excess profits tax refund bonds.. 432.53 74.99 20.29 2,022.47 9,731.77 i j Treasury bonds: Hd
Foreign series 30,000,000.00 30,000,000.00 fel Foreign currency series ^ Investraent series.. 4,000.00 8,000.00 10,000.00 16,000.00 249,000.00 753,000.00 O REAseries 370,000.00 875,000.00 515,000.00 650,000.00 320,000.00 6,235,000.00 2,820,000.00 M
Treasury tax and savings notes... 125.00 7,075.00 2,475.00 29,825.00 ^ 15,075.00 i^ U.S. savings notes 10,005,041.42 11,864,957.42 12,430,8n. 25 8,746,598.96 11,084,301.21 110,624,550.99 35,195,908.04 U.S. retireraent plan bonds 302,244.18 202,889.34 193,391.91 122,096.82 237,523.86 1,831,507.54 990,798.26 U.S. savings bonds:
Matured: Issueprice 91,612,370.00 177,376,114.00 161,544,972.25 93,923,947.50 114,702,397.50 1,433,544,204.50 1,395,939,248.50 Accrued discount . . - - 67,443,472.89 130,571,86L 50 117,291,374.90 69,335,918.05 84,659,667.05 1,026,895,786.75 891,157,395.48 SeriesH. 24,776,000.00 35,191,500.00 40,913,000.00 18,401,000.00 27,071,500.00 331,291,000.00 273,112,000.00
Uninatured: Issueprice. . . . 281,816,024.24 354,586,155.08 371,784,088.23 222,930,243.96 280,931,622.60 3,639,752,073.95 3,394,698,293.49 Accrued discount 12,882,551.29 20,862,302.49 25,851,902.33 13,316,194.95 16,484,746.43 201,957,738.33 169,480,562.46
CO
Digitized for FRASER http://fraser.stlouisfed.org/ Federal Reserve Bank of St. Louis
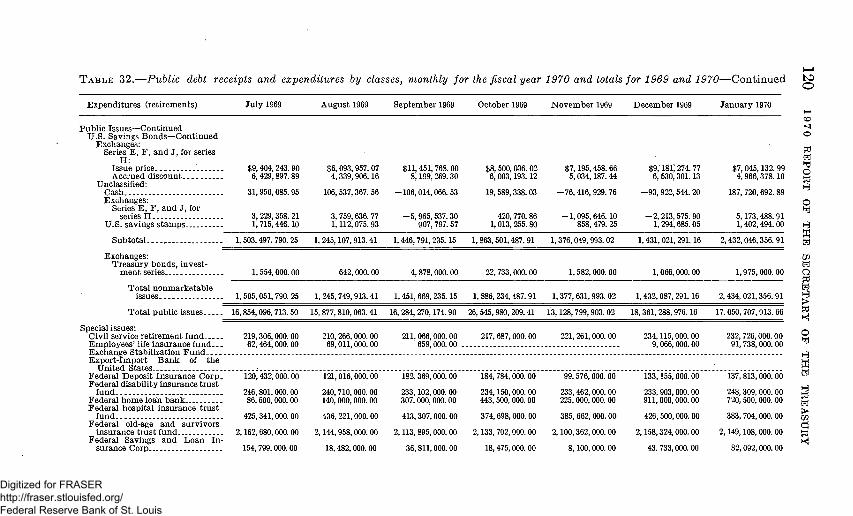
T A B L E 32.—Puhlic debt receipts and expenditures hy classes, monthly for thefiscal year 1970 and totals for 1969 and 1970—Continued tO
Expenditmes (retirements) July 1969 August 1969 September 1969 October 1969 November 1969 Deceraber 1969 January 1970 )->•
CO
Public Issues—Continued "f U.S. Savings Bonds—Continued ^
Exchanges: ^ Series E, F, and J, for series ^
H:
Exchanges:
fel Issueprice $9,404,243.90 $6,093,957.07 $11,451,768.00 $8,500,036.02 $7,195,458.66 $9,'181'; 274.77 $7,045,132.99 3 Accrued discount-- 6,429,897.89 4,339,906.16 8,199,269.30 6,003,193.12 6,034,187.44 6,530,30L13 4,966,378.10 ^
Unclassified: ^ Cash - 31,950,085.95 106,537,367.56 -106,014,066.53 19,689,338.03 -76,416,929.76 -93,922.544.20 187,720,692.89 ^
O Series E, F, and J, for M series H 3,229,358.21 3,759,636.77 -5,965,537.30 420,770.86 -1,095,646.10 -2,213,575.90 5,173,488.91
U.S. savings stamps 1,715,446.10 1,112,075.93 907,797.57 1,013,255.80 858,479.25 1,294,685.05 1,402,494.00 H
Subtotal 1,503,497.790.25 1,246,107,913.41 1,446,791,235.15 1,863,601,487.91 1,376,049,993.02 1,431,021,29L16 2,432,046,356.91 ^
Exchanges: ZP Treasurv bonds, invest- fel
ment series 1,554,000.00 642,000.00 4,878,000.00 22,733,000.00 1,682,000.00 1,066,000.00 1,975,000.00 O :—'. [ 1—'. : — : :—'. '.—: ^
issues 1,505,051,790.26 1,245,749,913.41 1,451,669,235.15 1,886,234,487.91 1,377,631,993.02 1,432,087,291.16 2,434,021,356.91 H
Total public issues. . . . . 16,854,096,713.50 15,877,810,063.41 16,284,270,174.90 26,545,980,209.41 13,128,799,903.02 18,361,288,976.16 17.050,707,913.66 ^
Special issues: ^ CivU service retirement fund 219,306,000.00 210,266,000.00 211,066,000.00 217,687,000.00 221,261,000.00 234,115,000.00 232,726,000.00 2 Employees'life insurance fund.. . 62,464,000.00 69,011,000.00 659,000.00 9,066,000.00 91,738,000.00 ^ Exchange Stabilization Fund ^J Export-Import Bank of the M
United States.. :: . Q Federal Deposit Insurance Corp. 120,432,000. 00 121,016,000.00 182,369,000.00 184,784,000.00 99,576,000. 00 133,155,000.00 137,813,000.00 ^ Federal disability insmance trust j
fund. 246,801,000.00 240,710,000.00 233,102,000.00 234,150,000.00 233,462,000.00 233,903,000.00 248,309,000.00 S Federal home loan bank.. . . 86,500,000.00 140,000,000.00 307,000,000.00 443,500,000.00 225,000,000.00 911,000,000.00 720,500,000.00 g Federal hospital insurance trust s^
fund 425,341,000.00 436,221,000.00 413,307,000.00 374,698,000.00 385,662,000.00 426,500,000.00 383,704,000.00 GQ Federal old-age and survivors CJ
insurance trust fund 2,162,680,000.00 2,144,958,000.00 2,113,895,000.00 2,133,702,000.00 2,100,362,000.00 2,158,324,000.00 2,149,108,000.00 ^ Federal Savings and Loan In- KJ
surance Corp 154,799,000.00 18,482,000.00 36,811,000.00 18,475,000.00 8,100,000.00 43.733,000.00 82,092,000.00
Digitized for FRASER http://fraser.stlouisfed.org/ Federal Reserve Bank of St. Louis
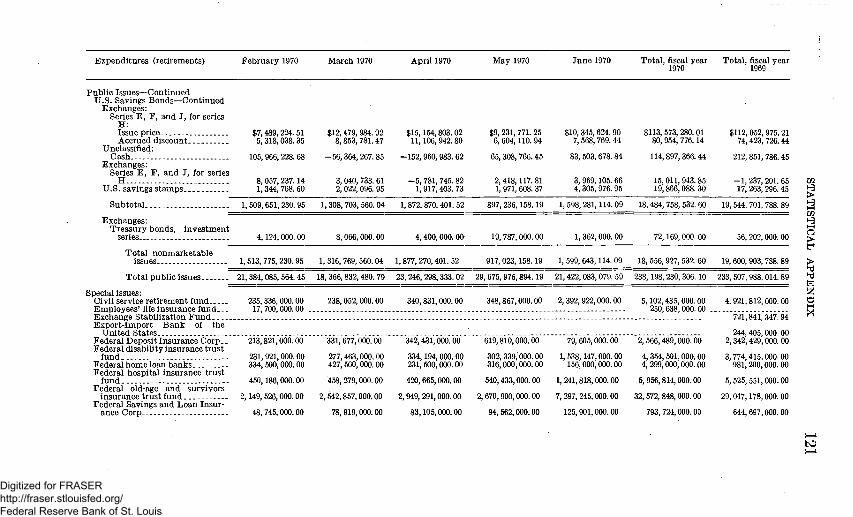
Expenditmes (retireraents) February 1970 March 1970 AprU 1970 May 1970 June 1970 Total, fiscal year Total, fiscal year 1970 1969
Public Issues—Continued U.S. Savings Bonds—Continued
Exchanges: Series E, F, and J, for series
H: Issueprice $7,489,224.51 $12,479,984.92 $15,154,803.02 $9,231,77L26 $10,345,624.90 $113,573,280.01 $112,052,975.21 Accrued discount 5,318,038.35 8,853,78L47 11,106,942.80 6,604,110.94 7,568,769.44 80,954,776.14 74,423,726.44
Unclassified: Cash 105,966,228.68 -56,364,267.85 -152,960,983.62 65,308,766.45 83,503,678.84 114,897,366.44 212,851,786.45
Exchanges: Series E, F, and J, for series
H 8,057,237.14 3,040,733.61 -6,781,745.82 2,418,117.81 3,969,105.66 15,011,943.85 -1,237,201.65 ZP U.S. savings stanips 1,344,768.60 2,022,096.95 1,917.403.73 1,971,608.37 4,305,976.95 19,866,088.30 17,263,296.45 g
Subtotal 1,509,651,230.95 1,308,703,560.04 1,872,870,40L 52 897,236,158.19 1,598,281,114.09 18,484,758,532.60 19,544,701,788.89 ^ — = ^ = ^ = = —"•- ZP
Exchanges:
Special issues:
H^
Treasury bonds, Investraent S series 4,124,000.00 8,066,000.00 4,400,000.00 19,787,000.00 1,362,000.00 72,169,000.00 56,202,000.00 >
^ Total nonmarketable
issues 1,513,775,230.95 1,316,769,560.04 1,877,270,401.52 917,023,158.19 1,599,643,114.09 18,556,927,532.60 19,600,903,788.89 > - — = = Hd
To ta l publ ic issues 21,384,085,564.45 18,366,832,480.79 23,246,298,333.02 29,675,976,894.19 21,422,083,079.59 238,198,230,306.10 233,507,988,014.89 2 fel 125
Civil service retirement fund 235,336,000.00 238,052,000.00 340,831,000.00 348,867,000.00 2,392,922,000.00 5,102,435,000.00 4,921,812,000.00 O Employees' life insurance fund.. . 17,700,000.00 .- 250,638,000.00 H Exchange Stabilization Fund - 721,841,347.94 ^ Export-Import Bank of the
United States - - - - - . - - - 244,405,000.00 Federal Deposit Insmance Corp.. 213,821,000.00 331,677,000.00 342.431,000.00 619,810,000.00 79,605,000.00 2,566,489,000.00 2,342,429,000.00 Federal disabihty insurance trust
fund 231,921,000.00 277,463,000.00 334,194,000.00 302,339,000.00 1,538,147,000.00 4,354,501,000.00 3,774,415.000.00 Federal home loan banks 334,500,000.00 427,500,000.00 231,500,000.00 316,000,000.00 156,000,000.00 4,299,000,000.00 981,200,000.00 Federal hospital insurance trust
fund 450,186,000.00 458,279,000.00 420,665,000.00 540,433,000.00 1,241,818,000.00 5,956,814,000.00 5,525,551,000.00 Federal old-age and survivors
insurance trust fund 2,149,526,000.00 2,542,857,000.00 2,949,291,000.00 2,670,900,000.00 7,297,245,000.00 32,572,848,000.00 29,047,178,000.00 Federal Savings and Loan Insur
ance Corp -. 48,745,000.00 78,919,000.00 83,105,000.00 94,562,000.00 125,901,000.00 793,724,000.00 644,697,000.00
h-A
to
Digitized for FRASER http://fraser.stlouisfed.org/ Federal Reserve Bank of St. Louis

T A B L E 32.—Puhlic debt receipts and expenditures by classes, monthly for the fiscal year 1970 and totals for
E x p e n d i t m e s ( re t i rement )
Special i ssues—Cont inued Federa l supp lemen ta ry medical
1n.«inrancft t m s t fund _. , . Fore ign service r e t h e m e n t f u n d . . G o v e r m n e n t life i n smance f u n d . . H i g h w a y t rus t fund N a t i o n a l service Ufe insurance
fund Rai l road re t i r ement account Rai l road re t i r ement holding
account Rai l road re t i r ement supple
m e n t a l account Servicemen 's g roup Ufe insur
ance f u n d . U n e m p l o y m e n t t rus t fund Ve te rans ' special life insurance
fund Ve te rans ' reopened Insurance
fund
T o t a l special Issues
O t h e r i s s u e s : Federa l Reserve b a n k s In t e rna t iona l Mone ta ry F u n d
n o t e s . . O the r
T o t a l o ther Issues
T o t a l p u b h c d e b t expendit u r e s .
Excess of receipts , or expendi tures
J u l y 1969
$169,624,000.00 1,243,000.00 6,964,000.00
373,960,000.00
16,565,000. 00 125,531, 000. 00
3, 681,000. 00
165,839, 000.00
4, 331, 630, 000. 00
355,185. 00
355,185.00
21,186, 081, 898. 50
3, 292,048,094. 63
Augus t 1969
$158,484,000.00 1,338,000.00 5,968,000. 00
369,357,000. 00
13, 965,000. 00 201, 747, 000. 00
2,006.000.00 -
1, 647,000.00
202, 658, 000. 00
4,327, 834, 000. 00
284, 686. 50
284, 686. 50
20, 205, 928, 749. 91
3,174, 724, 269. 77
September 1969
$287,482,000. 00 1,236,000.00 5,949,000.00
476,613,000. 00
21, 226,000.00 126, 673,000.00
5, 602,000.00
171,175, 000. 00
4, 593,164,000. 00
1, 561,000,000. 00 -
488,440. 00
1, 561, 488,440. 00
22,438, 922, 614. 90
498,180, 251. 55
October 1969
$160,388,000.00 1,331,000. 00 5.932.000.00
627,244,000. 00
14, 512,000.00 134,179, 000.00
3, 551,000. 00
135,357,000. 00
4.589.490, 000. 00
457,470. 00
457,470. 00
31,135, 927,679. 41
3, 708, 797, 919. 00
N o v e m b e r 1969
$167,761,000.00 1. 239.000. 00 5,920.000.00
307,434,000. 00
9, 022.000. 00 132.368, 000. 00
664,000.00 .
899,000.00
137, 348, 000. 00
4, 036, 078, 000. 00
398, 075. 00
398, 075. 00
17,165, 275, 978. 02
3, 718, 292, 750. 31
1969 and 1970 -
December 1969
$174, 824,000. 00 1, 284,000. 00 4,909,000. 00
386, 267,000. 00
18,413,000.00 126,040,000.00
3, 977,000.00
243,893,000. 00
5,109, 403, 000. 00
560, 863. 00
560, 863. 00
23, 471, 252, 839.16
113,284,127.74
-Continued
J a n u a r y 1970
$162,858,000.00 1,446,000. 00 5,889,000. 00
368,280,000. 00
20, 320, 000.00 141, 305,000.00
20,000. 00
175,000. 00
327, 972, 000. 00
5, 074,254, 000. 00
276, 018.00
276,018. 00
22,125, 237, 931. 66
- 6 5 3 , 817, 986. 04
bO
to h-l CO
o
td fel Hd O
§ §
fel
ZP fel
td fe!
^ td K{
o fel > W fel
g fel > ZP d td K|
Digitized for FRASER http://fraser.stlouisfed.org/ Federal Reserve Bank of St. Louis

r
CD
Expenditures (retkeraents)
Special issues—Continued Federal suppleraentary medical
insurance tuust fund Foreign service retirement fund- - -Government Ufe insurance fund.-Highway trust fund National service Ufe insurance
fund --Railroad retirement account Railroad retireraent holding
accoun t-RaUroad retireraent supple
mental account Servicemen's group hfe insmance
fund Unemployment trust fund Veterans' special term insurance
fund Veterans' reopened insurance
fund
Total special issues
Otherissues: Federal Reserve banks International Monetary Fund
notes _ Other
Total other issues.
Total pubUc debt expenditures
Excess of receipts, or expenditures (-) —
F e b r u a r y 1970
$200,152,000.00 1,317,000.00 5,872,000. 00
198,654,000.00
19,292,000.00 132,701,000.00
596,000.00..
4,077,000.00
649,"i28',"o"o"o'.'o'o"
4,893,524,000.00
333, 735.00
333, 735.00
26, 277, 943, 299. 45
1, 274, 770, 292. 65
March 1970
$217,843,000.00 1,395,000.00 7,783,000.00
586,924,000.00
28,155,000.00 162,739,000.00
3,991,000.00
" " ' '4'l'7','9'8'8','0'0'0".'0'0''
5, 781, 565,000.00
360,748.00
360,748.00
24,148, 758, 228. 79
3,160,822, 237.08
AprU 1970
$162, 692,000. 00 1,460,000.00 4,378,000.00
316,834,000.00
23, 643,000. 00 139,746,000. 00
604,000.00 .
4, 365,000.00
" " "3'6'5','3'l'6','o'o'o'.'o'o''
968,000.00 .
5, 722,023,000. 00
428,132.00
428,132.00
28, 968, 749,465.02
- 4 , 8 1 3 , 292, 712. 93
May 1970
$192,830,000.00 1, 732,000. 00 5,814,000.00
269,034,000.00
13, 613,000. 00 134, 557,000.00
4, 240,000.00
6,203,000.00 . 531,449,000.00
6,052,383,000.00
429, 257. 00
429,257.00
35, 728,789,151.19
3,893,439,857.89
J u n e 1970
$179, 955,000.00 6, 619,000.00 9, 674,000.00
3,025,747,000.00
381,014,000.00 834, 560,000.00
1,906,000.00
21, 739,000.00
10,812,407,000.00
51,010,000.00
43,805,000.00
28, 200,074,000.00
504,308.00
504, 308.00
49,622,661,387. 59
-168,795,993.13
To ta l , fiscal year 1970
$2, 224,893,000. 00 21, 638,000.00 75,052,000.00
7,195,348,000. 00
579, 740, 000. 00 2, 392,146,000. 00
5,796,000. 00
57,844,000. 00
6,203,000.00 . 14,160, 530,000.00
51, 978,000.00
43,805,000.00
82, 711,422, 000. 00
1, 561,000,000.00
4,876, 917. 50
1, 565,876, 917. 50
322,475, 529, 223. 60
17,198,453,108. 52
Tota l , fiscal year 1969
$2,032,203,000.00 63,641,000.00 67, 207,000. 00
6,745,482,000.00
460,442,000. 00 2,123, 597,000. 00
14, 297, 000.00
42,799,000.00
12,775,930,000.00
234, 550,000. 00
116,528,000.00
71,880,204,347.94
1, 905,000,000.00
1,384,000,000.00 17,916,415.14
3,306, 916,415.14
308, 695,108, 777. 97
6,141,847, 415. 53
ZP
ZP
'^ tr* > Hd Hd fel
HH
to 00
Digitized for FRASER http://fraser.stlouisfed.org/ Federal Reserve Bank of St. Louis

to
TABLE 33.—Changes in public debt issues, fiscal year 1970
[On bas is) Pub l i c D e b t accounts , see "Bases of T a b l e s " !
td Issues . O u t s t a n d m g Issues d m i n g year R e d e m p t i o n s Transferred to Ou t s t and ing fel
J u n e 30, 1969 du r ing year m a t u r e d deb t J u n e 30,1970 » *TJ O td
I N T E R E S T - B E A R I N G D E B T ^
P u b l i c I s s u e s 2 fel Marke tab le :
T r e a s m y bills, series -matming: 2 Regula r weekly: G
Ju ly 3, 1969. $2,704,845,000.00 $2,704,791,000.00 $54,000.00 W J u l y 10, 1969. 2,703,920,000.00 2,703,797,000.00 123,000.00 fe^ J u l y 17, 1969... 2,701,700,000.00 2,701,592,000.00 108,000.00 J u l y 24, 1969- 2 ,698 ,432 ,000 .00 . . 2,698,390,000.00 4 2 , 0 0 0 . 0 0 . . S
Regula r m o n t h l y : }i J u l y 31-Aug. 31, 1969 (Str ip issue) 3 400,730,000.00 400,730,000.00 HH J u l y 31, 1969 4 4,209,103,000.00 4,209,058,000.00 45,000.00 g
Regula r weekly : i-a Aug . 7,1969 2,800,762,000.00 2,800,689,000.00 73,000.00 S Aug . 14, 1969 2,802,095,000.00 2,802,061,000.00 34,000.00 ^ Aug . 21, 1969. 2,804,614,000.00 2,804,508,000.00 106,000.00 H* Aug . 28, 1969 . . . 2,802,134,000.00 2,801,904,000.00 230,000.00
Regula r m o n t h l y : O Aug . 31, 1969 4 1,505,643,000.00 1,505,643,000.00 fel
Regula r weekly : Sept. 4, 1969 2,802,014,000.00 2,801,522,000.00 492,000.00 H^ Sept . 11, 1969 ..-..- 2,800,296,000.00 2,800,240,000.00 56,000.00 S Sept . 18-Oct. 30, 1969 (Str ip issue) 5 . . . $2,120,538,000.00 2,120,638,000.00 fel Sept . 18, 1969 2,700,612,000.00 (6) 2,700,612,000.00 Sept .25,1969 2,701,027,000.00 («) 2,699,978,000.00 1,049,000.00 y^
Regula r m o n t h l y : td Sept . 30, 1969 1,501,007,000.00 1,500,972,000.00 35,000.00 fel
Regula r weekly : t> Oct .2 ,1969 1,100,404,000.00 6 1,600,180,000.00 2,700,535,000.00 4 9 , 0 0 0 . 0 0 . . . . 2 Oct. 9, 1969 . - : . . . 1,101,261,000.00 6 1,599,732,000.00 2,699,771,000.00 1,222,000.00 2 Oct. 16, 1969 1,100,975,000.00 6 1,601,561,000.00 2,702,500,000.00 36,000.00 td Oct. 23, 1969 1,102,578,000.00 6 1,600,718,000.00 2,703,269,000.00 2 7 , 0 0 0 . 0 0 . . . . ^ Oct . 30, 1969 1,099,921,000.00 6 1,601,313,000.00 2,701,200,000.00 34,000.00
Regula r m o n t h l y : Oct. 31, 1969 1,502,309,000.00 1,502,223,000.00 86,000.00
Digitized for FRASER http://fraser.stlouisfed.org/ Federal Reserve Bank of St. Louis

Regular weekly: Nov. 6, 1969 1,300,282,000.00 1,602,140,000.00 Nov. 13, 1969 1,300,474,000.00 1,689,729,000.00 Nov. 20, 1969 1,300,740,000.00 1,601,668,000.00 Nov. 28, 1969 1,300,016,000.00 1,600,219,000.00
Regular m o n t h l y : N o v . 3 0 , 1969 1,501,001,000.00
Regula r weekly : Dec. 4, 1969 1,301,356,000.00 1,602,411,000.00 Dec. 11, 1969 1,300,610,000.00 1,600,216,000.00 Dec. 18, 1969 1,100,761,000.00 1,801,038,000.00
T a x ant ic ipa t ion: Dec .22 , 1969 1,762,646,000.00
Regula r weekly : Dec . 26, 1969 1,100,270,000.00 1,800,570,000.00
Regu la r m o n t h l y : D e c . 3 1 , 1969 1,499,702,000.00
Regula r week ly : Jan. 2, 1970 2,911,209,000.00 Jan. 8, 1970 2,902,671,000.00 Jan. 15, 1970 2,905,533,000.00 Jan. 22, 1970 2,900.192.000.00 Jan. 29, 1970 2,900,641,000.00
Regula r m o n t h l y : J an . 31, 1970. . . . 1,500,666,000.00
Regula r weekly : Feb. 5, 1970 3,004,928,000.00 Feb. 13, 1970 2,999,807,000.00 Feb. 19, 1970 3,003,574,000.00 Feb. 26, 1970 :... 3,001,646,000.00
Regular m o n t h l y : F e b . 28, 1970 1,500,540,000.00
Regula r week ly : Mar. 5, 1970 3,000,814,000.00 Mar. 12, 1970 ....:... 3,001,333,000.00 Mar. 19, 1970 3,002,144,000.00
T a x ant ic ipa t ion: M a r . 2 3 , 1970 1,752,433,000.00
Regular weekly : Mar . 26, 1970 3,010,463,000.00
Regula r m o n t h l y : Mar . 31, 1970 1,501,357,000.00
Regular week ly : Apr. 2, 1970 3,010,715,000.00 Apr. 9, 1970 3,004,613,000.00 Apr. 16, 1970 . 3,005,119,000.00
Footnotes at en d of table .
2,902,349,000.00 2,890,149,000.00 2, 902,351,000. 00 2, 900, 111, 000. 00
1, 500,860,000. 00
2, 903, 747,000. 00 2,900,777,000. 00 2,899, 706, 000. 00
1,762,616,000. 00
2, 900,817, 000. 00
1,499,573,000. 00
2, 911,084,000. 00 2, 902,420,000. 00 2, 905, 332,000. 00 2,899, 928,000. 00 2, 900, 516,000. 00
1, 500, 472,000. 00
3, 004, 766,000.00 2, 999, 595, 000. 00 3, 003,410, 000. 00 3, 001,162,000. 00
1, 500,349,000. 00
3,000,224,000. 00 3,000,475,000. 00 3,001, 678,000. 00
1, 748,894,000. 00
3, 010,107,000.00
1, 500,838,000. 00
3,007,955,000. 00 3,000, 916,000. 00 3,004,155,000. 00
73,000.00 54,000.00 57,000.00
124,000.00
141,000.00
20,000.00 49,000.00
2,093,000.00
30,000.00
23,000.00
129,000.00 ZP H3
125,000.00 > 251,000.00 H 201,000.00 SQ 264,000.00 H 125,000.00 HH
194,000.00 ^
162,000.00 t> • 212,000.00 y^
164,000.00 y^ 484,000.00 fel
191,000.00 O
590,000.00 R 858,000.00 466,000.00
3,539,000.00
356,000.00
519,000.00
2,760,000.00 3,697,000.00 : .
964,000.00
bO
Digitized for FRASER http://fraser.stlouisfed.org/ Federal Reserve Bank of St. Louis

TABLE 33.—Changes in puhlic debt issues, fiscal year 1970—Continued <ji
Issues Outstandmg Issues durmg year Redemptions Transferred to Outstandhlg ^ June 30,1969 durmg year matured debt June 30,19701 ^Q
: ^ INTEREST-BEARING DEBT-Cont inued ^
td Publicissues—Continued fej
Hd Marketable—Continued M
Treasmy biUs' series maturing: 2—Conthiued H^ Tax anticipation:
Apr. 22, 1970.... . $4,767,244,000.00 $4,766,904,000.00 $10,340,000.00 Q Regular weekly: hcj
Apr.23, 1970 3,002,462,000.00 3,001,186,000.00 1,276,000.00 Regular monthly: H
Apr.30,1970 . $1,000,634,000.00 3,501,686,000.00 4,600,033,000.00 2,287,000.00 [l} Regular weekly: ^j
May 7, 1970 3,002,349,000.00 3,000,006,000.00 2,343,000.00 May 14, 1970. 2,993,940,000.00 2,991,363,000.00 2,587,000.00 ZP May21,1970 . 3,002,992,000.00 3,000,877,000.00 2,115,000.00 fel May28, 1970 3,002,293,000.00 3,000,213,000.00 2,080,000.00 O
Regular monthly: g May31, 1970 1,000,225,000.00 600,319,000.00 1,499,035,000.00 1,509,000.00 g
Regular weekly: HJ June4, 1970 3,001,707,000.00 2,998,545,000.00 3,162,000.00 > June 11, 1970 2,998,363,000.00 2,993,697,000.00 4,666,000.00 3 JunelS, 1970 3,003,419,000.00 2,996,519,000.00 6,900,000.00 ^
Tax anticipation: -. June22,1970 4,607,950,000.00 4,499,604,000.00 8,346,000.00 g
Regular weekly: ^ June 26, 1970 3,013,205,000.00 2,999,505,000.00 13,700,000.00 ^
Regular monthly: M June30, 1970 1,201,406,000.00 600,267,000.00 1,642,843,000.00 68,830,000.00 g
Regular weekly: ^ July 2, 1970 3,001,941,000.00 $3,001,941,000.00 , July 9, 1970 3,009,340,000.00 .....^ 3,009,340,000.00 3 July 16, 1970 3,007,674,000.00 3,007,674,000.00 S July 23, 1970 3,006,897,000.00 3,006,897,000.00 g July 30, 1970 3,001,595,000.00 3,001,596,000.00 g
Regular monthly: r j July 31, 1970 1,702,317,000.00 1,702,317,000.00 g
Regular weekly:. ^ Aug.6, 1970 3,003,349,000.00 3,003,349,000.00 ^ Aug. 13, 1970 3,002,694,000.00 3,002,694,000.00 Aug. 20, 1970 2,987,356,000.00 2,987,355,000.00 Aug.27, 1970 3,102,755,000.00 3,102,756,000.00
Digitized for FRASER http://fraser.stlouisfed.org/ Federal Reserve Bank of St. Louis

Regular m o n t h l y : A u g . 3 1 , 1970 1,701,192,000.00 1,701,192,000.00
Regular weekly : Sept 3 1970 . . - - - 3,102,690,000.00 - 3,102,590,000.00 Sept . 10, 1970 - - - - - - 3,104,310,000.00 3,104,310,000.00 Sept . 17^ 1970 3,105,940,000.00 3,105,940,000.00
T a x an t ic ipa t ion : Sept . ^ , 1970 1,758,200,000.00 1,758,200,000.00
Regular weekly : Sept . 24, 1970 3,103,440,000.00 3,103,440,000.00
Regular m o n t h l y : Sep t .30 , 1970 1,505,392,000.00 1,605,392,000.00
Regula r weekly : O c t . l , 1 9 7 0 . . . . . . 1,301,180,000.00 1,301,180,000.00 O c t . 8 , 1970 1,304,990,000.00 1,304,990,000.00 Oct . 15, 1970 1,300,850,000.00 . . . 1,300,850,000.00 Oct . 22, 1970 1,302,550,000.00 1,302,650,000.00 jji Oct . 29, 1970 1,301,230,000.00 1,301,230,000.00 H^
Regular m o n t h l y : > Oct . 31, 1970.- - - - 1,604,368,000.00 - - 1,504,368,000.00 g
Regula r weekly : ^ N o v . 5, 1970 . 1,301,030,000.00 1,301,030,000.00 ^ N o v . 12, 1970-. 1,301,680,000.00 1,301,680,000.00 w N o v . 19, 1970. 1,303,530,000.00 . 1,303,630,000.00 ^ N o v . 27, 1970 1,300,780,000.00 1,300,780,000.00 U
Regular m o n t h l y : N o v . 30, 1970 1,501,273,000.00 1,501,273,000.00 ^
Regular weekly : hd Dec . 3, 1970 1,306,400,000.00 1,306,400,000.00 ^ Dec . 10, 1970 1,302,860,000.00 1,302,860,000.00 fej Dec . 17, 1970 1,302,670,000.00 1,302,670,000.00 ^ Dec . 24, 1970 1,302,570,000.00 1,302,570,000.00 Q
Regula r m o n t h l y : h-j D e c . 3 1 , 1970 1,602,463,000.00 1,502,463,000.00 X J a n . 31, 1971 1,503,356,000.00 1,503,356,000.00 F e b . 28, 1 9 7 1 . . . - 1,700,107,000.00 - . 1,700,107,000.00 M a r . 3 1 , 1971 1,701,620,000.00 1,701,620,000.00 A p r . 3 0 , 1971 1,200,150,000.00 1,200,150,000.00 May 31, 1971. . 1,200,170,000.00 1,200,170,000.00 J u n e 30, 1971 . . . 1,201,430,000.00 1,201,430,000.00
T o t a l T rea su ry bills 68,356,422,000.00 191,354,948,000.00 183,414,175,000.00 142,967,000.00 76,154,238,000.00
Foo tno tes a t end of tab le .
to
Digitized for FRASER http://fraser.stlouisfed.org/ Federal Reserve Bank of St. Louis
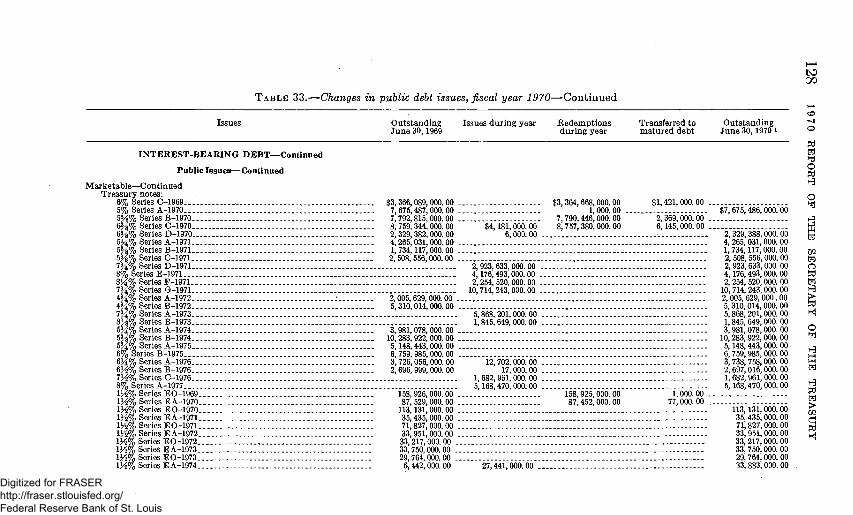
r>o 00
TABLE 33.—Changes in public debt issues, fiscal year 1970—Continued CO
Issues Outstanding Issues during year Redemptions Transferred to Outstandhlg ^ June 30,1969 durhig year matured debt June 30,19701 ^
td
INTEREST-BEARING DEBT—Continued ^
Public Issues—Continued
Marketable—Continued Treasury notes:
O td
o 6% Series c-1969 $3,366,089,000.00 $3,364,668,000.00 $1,421,000.00 w 5% Series A-1970 7 ,676 ,487 ,000 .00 . . . . 1,000.00 $7,675,486,000.00 5 ^ % Series B-1970 7,792,815,000.00 7,790,446,000.00 2,369,000.00 i^ 6 ^ % Series C-1970 8,759,344,000.00 $4,181,000.00 8,757,380,000.00 6,145,000.00 h< 6 H % Series D-1970 2,329,382,000.00 6,000.00 - - - . 2,329,388,000.00 S 534%, Series A - 1 9 7 1 . . . 4,265,031,000.00 4,265,031,000.00 5 ^ % Series B - 1 9 7 1 . . . 1,734,117,000.00 1,734,117,000.00 ^ i 5 ^ % Series C-1971 2,508,556,000.00 2,508,556,000.00 fej 7M% Series D-1971 2,923,633,000.00 . 2,923,633,000.00 O 8% Series E - 1 9 7 1 . . . 4,176,493,000.00 4,176,493,000.00 td 8 ^ % Series F-1971 2,254,520,000.00 2,254,520,000.00 fel 7M% Series G-1971 10,714,243,000.00 10,714,243,000.00 H 4M% Series A-1972 .• 2,005,629,000.00 ^ 2,005,629,000.00 > 4 ^ % Series B-1972 5,310,014,000.00 5,310,014,000.00 td 7^%, Series A-1973 5,868,201,000.00 . 5,868,201,000.00 •"< 83^% Series B-1973 1,845,649,000.00 1,845,649,000.00 ^ 53^-% Series A-1974 3,981,078,000.00 3,981,078,000.00 Q 5 H % Series B-1974 10,283,922,000.00 10,283,922,000.00 ^ 5M% Series A-1975 5,148,443,000.00 5,148,443,000.00 j 6% Series B-1975 6,759,985,000.00 6,759,985,000.00 G 6K% Series A-1976 3,726,056,000.00 12,702,000.00 3,738,758,000.00 W 6M% Series B-1976 2,696,999,000.00 17,000.00 2,697,016,000.00 ^ 1/2% Series C-1976 1,682,961,000.00 1,682,961,000.00 _ 8% Series A-1977 5,168,470,000.00 5,168,470,000.00 ^ 13^% Series EO-1969 158,926,000.00 158,925,000.00 1,000.00 S 13^% Series E A - 1 9 7 0 . . . 87,529,000.00 87,452,000.00 77,000.00 g 13^% Series EO-1970 113,131,000.00 113,131,000.00 5g 13^% Series EA-1971 35,435,000.00 35,435,000.00 Xj 13^% Series EO-1971 • 71,827,000.00 71,827,000.00 g 13^% Series EA-1972 33,951,000.00 33,951,000.00 ^ 13^% Series EO-1972 33,217,000.00 33,217,000.00 ^ 13^% Series EA-1973 33,750,000.00 33,750,000.00 13^% Series EO-1973 29,764,000.00 - . . - 29,764,000.00 13^% Series EA-1974 6,442,000.00 27,441,000.00 33,883,000.00 .
Digitized for FRASER http://fraser.stlouisfed.org/ Federal Reserve Bank of St. Louis

13^% Series E0-1974 41,702,000.00 41,702,000.00
13^% SeriesE A-1975. _, 2,480,000.00 2,480,000.00
Total Treasury notes 78,946,919,000.00 34,722,699,000.00 20,158,872,000.00 10,013,000.00 93,500,733,000.00
Treasmy bonds: 23^% of 1964-69 (dated Sept. 15, 1943) 2,484,750,500.00 2,474,411,000.00 10,339,500.00 23 %o of 1965-70 2,281,375,000.00 2,250,041,000.00 31,334,000.00 2K% of 1966-71 1,221,491,000.00 1,909,000.00 1,219,582,000.00 23^% of 1967-72 (dated June 1, 1945) 1,243,363,500.00 5,803,000.00 1,237,560,500.00 23^% of 1967-72 (dated Oct. 20, 1941) 1,951,367,750.00 224,900.00 1,951,142,850.00 23^% of 1967-72 (dated Nov. 15, 1945) 2,594,287,000.00 20,409,000.00 2,573,878,000.00 4% of 1969 (dated Oct. 1, 1957) 6,240,799,000.00 . 6,226,340,500.00 14,458,500.00 4% of 1970 (dated June 20, 1963) 4,129,236,500.00 4,129,236,500.00 4% of 1970 (dated Jan. 15, 1965) . 4,381,419,000.00 4,381,419,000.00 4%ofl971 2,805,626,500.00 8,000.00 2,805,618,500.00 3 ^ % of 1971 2,760,415,000.00 2,760,415,000.00 ZP 4% of 1972 (dated Sept. 15, 1962) 2,578,547,000.00 2,578,547,000.00 J^ 4% of 1972 (dated Nov. 15, 1962) . 2,343,509,500.00 2,343,509,500.00 > 4%ofl973 3,893,832,500.00 5,000.00 3,893,827,500.00 H 4H%ofl973 4,348,871,000.00... 3,079,000.00 4,345,792,000.00 ZP 43^% of 1974 3,128,429,500.00 1,065,000.00 3,127,364,500.00 h^ 434% of 1974 3,585,205,500.00 2,565,000.00 3,582,640,500.00 tt 33^%ofl974 2,240,215,500.00 972,000.00 2,239,243,500.00 ) l 434% of 1975-85 1,214,501,500.00 987,000.00 1,213,514,500.00 p 3)^% of 1978-83 1,557,872,500.00 11,471,000.00 1,546,401,500.00 4%ofl980 . 2,598,199,500.00 3,690,000.00 2,594,509,500.00 > 33^% of 1980 1,906,394,000.00 .-- 1,502,000.00 1,904,892,000.00 H J 334% of 1985 1,096,687,000.00 16,827,000.00 1,079,860,000.00 g 4J^% of 1987-92 3,814,895,500.00 2,901,000.00... 3,811,994,500.00 g 4% of 1988-93 249,138,500.00 931,000.00. 248,207,500.00 Zj 43/g% of 1989-94 1,658,614,000.00 3,904,500.00 1,554,709,500.00 O 33^%ofl990 - ' .- 4,848,143,500.00 69,591,000.00 4,778,552,500.00 H 3%ofl995 . 1,478,536,000.00 161,787,500.00 1,316,748,500.00 ^ 33^% of 1998 4,261,264,000.00 151,805,000.00 4,109,459,000.00
Total Treasmy bonds 78,796,987,250.00 15,793,648,400.00 66,132,000.00 62,947,206,850.00
Total marketable issues 226,100,328,250.00 226,077,647,000.00 219,366,695,400.00 209,102,000.00 232,602,177,850.00
Footnotes at end of table.
to CO
Digitized for FRASER http://fraser.stlouisfed.org/ Federal Reserve Bank of St. Louis

TABLE 33.—Changes in public debt issues, fiscal year 1970—Continued
Issues Outstanding Issues during year Rederaptions Transferred to Outstanding June 30,1969 during year matured debt June 30, 19701
INTEREST-BEARING DEBT-Cont inued
Public Issues—Continued
CO
o
td fel yji o td y ^
Nonraarketable: Q Certificates of indebtedness: w
5.424% foreign series --- $500,000,000.00 $250,000,000.00 $250,000,000.00 ^ 6.10% foreign series 1,000,000.00 1,000,000.00 yq 6.15% foreign series $7,000,000.00 7,000,000.00 H 6.20% foreign series ' " 100,000,000.00 123,000,000.00 223,000,000.00 B 6.30% foreign series - 15,000,000.00 15,000,000.00 - 6.35% foreign series .- 45,000,000.00 45,000,000.00 rn 6.40% foreign series --- 271,017,399.32 271,017,399.32 M 6.45% foreign series - - -- 141,300,000.00 121,300,000.00 20,000,000.00 Q 6.50% foreign series - 270,000,000.00 200,000,000.00 70,000,000.00 td 6.60% foreign series ' - - 180,000,000.00 382,200,000.00 562,200,000.00 fel 6.65% foreign series .- --- 100,000,000.00 - 100,000,000.00 i^ 6.80% foreign series ---. 450,000,000.00 200,000,000.00 250,000,000.00 > 6.85% foreign series 260,000,000.00 260,000,000.00 td 6.90% foreign series - 322,500,000.00 322,500,000.00 *< 7.00% foreign series - 258,000,000.00 258,000,000.00 - . . 7.05% foreign series 505,000,000.00 505,000,000.00 2 7.10% foreign series -- . - . 830,000,000.00 830,000,000.00 ^ 7.15% foreign series 251,000,000.00 251,000,000.00 ^ 7.20% foreign series. . - .- 917,500,000.00 917,500,000.00 3 7.25% foreign series ' ' 100,500,000.00 100,500,000.00 g 7.35% foreign series - 17,500,000.00 17,500,000.00 ^ 7.45% foreign series . 200,000,000.00 200,000,000.00 7.50% foreign series 40,000,000.00 40,000,000.00 \^ 7.70% foreign series - 1,116,000,000.00 1,116,000,000.00 - g 7.75% foreign series .- 212,500,000.00 212,500,000.00 ^ 7.80% foreign series - -- 210,000,000.00 210,000,000.00 - ^ 7.85% foreign series - - 30,000,000.00 30,000,000.00 - ^ 7.90% foreign series . - -.- 130,000,000.00 130,000,000.00 M 8.00% foreign series.... -. 524,017,399.32 524,017,399.32 . - - l^ 8.10% foreign series - - 256,000,000.00 256,000,000.00 ^
Total foreign series certmcates. 287,000,000.00 8,479,034,798.64 7,805,017,399.32 961,017,399.32
Digitized for FRASER http://fraser.stlouisfed.org/ Federal Reserve Bank of St. Louis

Treasury notes: 4.66% foreign series. 85,000,000.00 85,000,000.00 5.30% foreign series 200,000,000.00 200,000,000.00 5.34% foreign series • 50,000,000.00 50,000,000.00 5.35% foreign series 10,000,000.00 10,000,000.00 5.42% foreign series 25,000,000.00 25,000,000.00 5.50% foreign series : 8,000,000.00 8,000,000.00 6.70% foreign series.. . . : 12,000,000.00 12,000,000.00 5.74% foreign series 15,035,014.85 15,035,014.85 5.90% foreign series 100,000,000.00 100,000,000.00 5.93% foreign series 75,000,000.00 75,000,000.00 5.97% foreign series . 20,000,000.00 20,000,000.00 6.00% foreign series 117,000,000.00 117,000,000.00 6.02% foreign series 75,000,000.00 75,000,000.00 . 6.21% foreign series 50,000,000.00 50,000,000.00 6.25% foreign series 300,000,000.00 300,000,000.00 6.30% foreign series 50,000,000.00 50,000,000.00 . ZP 6.375% foreign series 100,000,000.00 100,000,000.00 t^ 6.40% foreign series 40 ,000 ,000 .00 . . - 7,970,836.39 . . - 32,029,163.61 £ 6.70% foreign series 100,000,000.00 100,000,000.00 3 6.79% foreign series 100,000,000.00 100,000,000.00 ZP 6.84% foreign series 100,000,000.00 100,000,000.00 ^ 7.125% foreign ser ies . . 100,000,000.00 . ' . . . . 100,000,000.00 o 7.35% foreign series 125,000,000.00 125,000,000.00 > 7.46%o foreign s e r i e s . : : 200,000,000.00 .• 200,000,000.00 tr" 7.55% foreign series 100,000,000.00 100,000,000.00 7.60% foreign series 200,000,000.00 200,000,000.00 l> 7.63% foreign series 200,000,000.00 200,000,000.00 ^ 7.65% foreign series 200,000,000.00 200,000,000.00 2 7.80% foreign series 50,000,000.00 . . . 50,000,000.00 g 7.85% foreign series. 100,000,000.00 100,000,000.00 ^ 7.95% foreign ser ies . . 150,000,000.00 150,000,000.00 O 8.00% foreign series 50,000,000.00 50,000,000.00 M 8.10% foreign series 100,000,000.00 100,000,000.00 "^
T o t a l foreign series notes 1,332,035,014.85 1,875,000,000.00 833,005,85L 24 2,374,029,163.61
Treasury bonds: 4.25% foreign series. 83,929,634.25 30,000,000.00 63,929,534.25
Certmcates of indebtedness: 6.00% foreign currency series 162,625,858.52 152,625,858.62 6.125% foreign currency series.- 49,733,98L03 49,733,98L03 6.20% foreign currency series _ 132,779,124.81 . . . . . ' . 132,779,124.81 6.25% foreign currency series. 54,372,975.47 64,372,975.47
Footnotes at end of table.
00
Digitized for FRASER http://fraser.stlouisfed.org/ Federal Reserve Bank of St. Louis

TABLE 33.—Chahges in puhlic debt issues, fiscal year 1970—Continued
•CO bO
Issues Outstanding Issues during year Redemptions Transferred to Outstanding ^ June 30,1969 dmhig year matured debt June 30,1970 i g
INTEREST-BEARING DEBT-Cont inued
Public Issues^-Continued
Nonmarketable—Continued- . . . . Certificates of indebtedness—Continued o
7.00% foreign currency series $29,968,637.47 $29,968,637.47 M 7.10% foreign currency series -. 29,977,691.02 29,977,691.02 S 7.45% foreign currency series - 49,872,419.39 49,872,419.39 - . . . 7.50% foreign cmrency series 99,856,02L55 99,856,02L65 rn 7.73% foreign cmrency series 54, 686,772.78 64,686,772.78 fej 8.08% foreign currency series 99,791,134.83 $99,791,134.83 Q 8.125% foreign currency series 49,968,624.35 49,968,624.35 td
Total foreign currency series certmcates '.'. . . . . . ' . $389,511,939.83" 414,121,301.39 6 5 3 , 8 7 3 , 4 8 2 . 0 4 . . . . 149,759,759.18 y^ .. . >
Treasury notes: td 3.05% foreign currency series . U34,590,058.25 134,590,058.25 K< 4.43% foreign currency ser ies . _ . 7134,019,834.92 134,019,834.92 ^ 5.20% foreign currency series - 124,393,58L 29 7_i24,393,58L29 O 5.25% foreign currency series 125,760,853.16 125,760,853.16 ^ 5.28% foreign currency series 125,495,708.05 8 10,005,646.96 '. 135,501,355.00 ^ 5.30% foreign currency series 25,554,652.11 25,554,652.11 2 5.38% foreign c m r e n c y series - 124,865,769.30 124,865,769.30 . . . : . g 5.40% foreign c m r e n c y series 125,425,118.79 125,425,118.79 fel 5.46% foreign currency series 124,884,48L 85 124,884,481.85 5.587o foreign currency series 22,396,675.13 22,396,675.13 ^ 5.65% foreign currency series 50,144,164.47 50,144,164.47 2 5.73% foreign cur rency series 125,505,158.26 8 9,996,196.74 135,501,355.00 ^ 5.77% foreign currency series 100,182,893.89 100,182,893.89 gt 6.90% foreign currency series 25,151,878.65 25,151,878.65 XH 6.125%o foreign c u r r e n c y ser ies 124,987,501.25 124,987,50L 25 g 6.15% foreign c m r e n c y series --- 52,204,176.33 52,204,176.33 - - - - ZA 6.16% foreign currency series 30,106,530.80 30,106,530.80 ^ 6.20% foreign currency series 69,515,650.94 .- 69,515,650.94 6.23% foreign currency series 124,263,737.36 7-124,263,737.36 6.25% foreign currency series- --.- 174,811,835.33 8 10,395,014.61 49,705,494.94 135,501,355.00
Digitized for FRASER http://fraser.stlouisfed.org/ Federal Reserve Bank of St. Louis

6.33% foreign currency series 25,101,370.92 25,101,370.92 6.35% foreign cmrency series 27,742,457.52 - - - 27,742,457.52 -. 6.37% foreign currency series '. 50,006,250.78 50,006,250.78 6.375% foreign currency series 23,280,176.93 23,280,176.93 6.40% foreign currency series 25,445,292.62 25,445,292.62 6.44% foreign currency series-- - 49,720,323.18 -- 49,720,323.18 -6.75% foreign currency series 52,251,457.24 .- 62,251,457.24 6.89% foreign currency series 100,857,871.55 - --- 100,857,87L 55 7.55% foreign currency series - 133,550,110.32 133,550,110.32 7.60% foreign currency series-_ - - . . 52,992,813.87 52,992,813.87 7.70% foreign currency series . 48,009,874.88 48,009,874.88 7.73% foreign currency series 27,790,643.82 27,790,643.82 7.85% foreign currency series . . . . : 30,243,108.06 30,243,108.06 8.10% foreign currency series •. 25,533,890.44 25,533,890.44
Total foreign currency series notes 1,977,804,110.46 420,721,331.45 1,182,666,062.62 . 1,215,859,379.29 ZP
3K% Treasury bonds 75,000,000.00 75,000,000.00 ^
6.065% Treasury certmcates, maturing July 1, 1969 318,884.41 -- 318,884.41 t^ 6.065% Treasury certificates, maturmg July 3, 1969._ 1,511,441.63 1,511,441.63 ZP 6.053% Treasu ry cer tmcates , m a t u r m g J u l y 31, 1969 1,202,195.29 1,202,196.29 g 6.456% T r e a s u r y certificates, m a t u r i n g Oct . 1, 1969. 323,719.49 323,719.49 Q 6.456% Treasu ry cer tmcates , m a t u r h i g Oct. 3, 1969_ 1,534,358.86 1,534,358.86 > 7.172% Treasu ry certificates, m a t u r m g Oct . 31, 1969. . 1,220,387.51 1,220,387.51 tr" 1% Treasury certmcates, maturmg Dec. 15, 1969 2,700,648.01 2,700,648.01 7.106%, Treasmy certificates, maturhig Jan. 1, 1970.- 328,944.32 328,944.32 > 7.106%, Treasury certmcates, maturhig Jan. 3, 1970 1,559,123.41 1,559,123.41 H 7.030%o Treasury certmcates, maturing Jan. 31, 1970 1,242,269.06 1,242,269.06 2 8.096% Treasury certificates, maturing Apr. 1,1970 2,030.34 2,030.34 g 8.096% Treasury certmcates, maturhig Apr. 3, 1970.... . 1,586,821.24 1,586,82L24 2 7.888% Treasury certmcates, maturhig Apr.30, 1970 1,264,101.94 1,264,10L94 g 1% Treasury certmcates, maturing June 15, 1970 2,801,855.51 2,801,855.51 U 3.50% Treasury certmcates, maturmg June 30, 1970.... • . . . . . - - - 852,451,444.00 852,451,444.00 ^ 6.330% Treasury certmcates, matming July 1,1970 2,071.43 2,071.43 6.330% Treasury certificates, maturing July 3,1970. _ 1 1,618,938.50 1,618,938.50 6.876%, Treasury certmcates, maturmg July 31, 1970 1,289,030.03 1,289,030.03 1%, Treasury certmcates, maturing Dec. 15, 1970.... 6,315,864.79 5,047,523.09 268,34L70 3.50%Ti-easury certmcates, maturing June 30,. 1971 782,178,792.97 782,178,792.97
Total Treasury certmcates 6,733,169.34 1,654,719,753.40 875,095,748.11 785,357,174.63
Footnotes at end of table.
CO
Digitized for FRASER http://fraser.stlouisfed.org/ Federal Reserve Bank of St. Louis

T A B L E 33.—Changes in public debt issues, fiscal year 1970—Continued CO
Issues Outstanding June 30,1969
Issues during year Redemptions during year
Transferred to matured debt
Outstanding June 30,1970 i
INTEREST-BEARING DEBT—Continued
Public Issues—Continued
Nonmarketable—C ontinued U.S. savingsbonds:'
SeriesE-1941.... $215,290,241.55 SeriesE-1942 . . . - - 935,031,649.00 Series E-1943 - . . . 1,472,691,230.31 Series E-1944... . . - - - . - : 1,806,616,758.49 Series E-1945 1,593,527,965.88 SeriesE-1946... 897,921,190.02 Series E-1947 1,003,685,490.59 Series E-1948 1,127,494,086.69 Series E-1949 1,194,874,948.49 Series E-1950 . \ : 1,096,994,339.82 Series E-1951... 946,630,416.69 Series E-1952 (January to April). : 326,888,292.06 Series E-1952 (May to December) 687,921,137.81 Series E-1953 1,248,116,565.24 Series E-1954 1,342,025,162.17 Series E-1955 1,455,653,446.28 Series E-1956 1,450,831,913.96 Series E-1957 (January). 129,304,366.90 Series E-1957 (February to December) 1,299,937,695.76 Series E-1958 - -- 1,522,493,090.94 Series E-1959 (January to May) 636,730,411.29 Series E-1969 (June to December) 859,284,137.21 SeriesE-1960.... 1,612,295,867.09 Series E-1961 1,794,977,843.74 SeriesE-1962... 1,810,321,632.87 SeriesE-1963.... 2,190,109,034.11 Series E-1964 2,127,586,068.00 Series E-1965 (January to Noveraber) 1,900,942,095.70 Series E-1965 (December).... 205,338,139.02 Series E-1966 : 2,458,548,120.60 Series E-1967..-.-.- 2,565,652,387.00 Series E-1968 (January to May) _ 1,121,086,933.68 Series E-1968 (June to December) 1,624,890,008.52 Series E-1969 (January to May) - - •• 1,401,648,450.00 Series E-1969 (June to December) '•61,703,681.25
$9, 086,803. 01 • 38,743,960. 08 59, 687, 965. 63 72,481,232. 31 63,289, 781. 27 36,461,705. 75 40,846, 953.14 45,820,461. 92 53,495, 573. 42 50, 606, 559. 47 41,352, 650.11 13,927,881. 76 29,167,858. 99 51, 821,042. 57 64,352,268. 37 67.438.190. 48 57, 961, 073. 73 5,253,036. 52
52, 690, 974. 97 61, 291, 737.13 26,661. 026. 01 34, 600,229.13 64,897, 572. 40 71,073,909. 88 90,669, 618. 25 99,108,610.43 94, 780,476. 92 84,753,173. 52 8, 679,748. 05
104, 262, 714. 05 103,285, 949. 86 48,094,249. 67 65, 067,976. 68 131,345,321.06
2,405, 033,196. 80
$21, 397, 86,112,
136, 772, 167,255, 147,244,! 82,389,' 90, 552, i 104,357, 117,803, 105,195, 85,357, 29,483, 63,055,
113,840, 123, 759, 136,704, 139,840,; 12,406,'
128,160,1 158,897, 70,101, 100,034, 171,379, 201, 538, 192,314, 179,852, 196,186, 175, 534, ( 19, 764,1
264, 361, 306, 522,; 161,721, 318,181, 494,294, 920, 891,1
,260.48 $202,979,784.08 ,914.42 887,662,694.66 630.23 -.. 1,395,606,565.71 549.48 .... 1,711,842,441.32 272.63 1,509,573,474.52 977.80 851,992,917.97 066.21 953,880,377.52 615.84 ... 1,068,956,932.77 569.49 1,130,566,952.42 358.25 1,042,405,541.04 523.33 902,625,543.47 044.22 311,333,129.60 477.28 .. 654,033,519.52 450.79 1,186,097,157.02 497.79 1,272,617,932.75 ,628.27 . 1,376,387.008.49 349.23 1,368,952,638.46 223.42 122,151.180.00 668.83 -. 1,224,468,001.90 535.14 1,424,887,292.93 216.02 592,290,221.28 263.47 793,750,102.87 517.45 1,505,813,922.04 303.23 1,664,513,450.39 866.70 1,708,676,384.42 336.68 2,109,365,307.86 610.41 2,026,179,934.51 637.83 1,810,160,631.39 642.80 194,253,244.27 602.43 2,298,449,232.22 289.66 2,362,416,047.20 401.42 1,007,459,781.93 769.33 1,371,776,215.87 578.01 1,038,699,193.05 038.90 --.. 1,546,845,839.15
td fel hj O td H^
o fel
t ^
W fel
o td fel H3 > td Kj
o fel
iH fel
h ^ td fel > ZP d td Kj
Digitized for FRASER http://fraser.stlouisfed.org/ Federal Reserve Bank of St. Louis

Series E-1970. . . Unclassmed sales and r e d e m p t i o n s . 40, 717, 589. 07
1,800, 972,225. 00 -15,368,886.63
288, 519,112. 50 . -205,307.67 .
1, 512,453,112. 50 25, 554,010.11
T o t a l Se r i e sE -- 44,165,662,387.80 6,112, 594,821. 71 6,111,579,492.30 - - . 44,166,677,717.21
SeriesH-1952 Series H-1953 SeriesH-1954 SeriesH-1955 Series H-1956 Series H-1957 (January) Series H-1957 (Feb rua ry to D e c e m b e r ) . Series H-1958 Series H-1959 ( January to May) Series H-1959 ( June to December) SeriesH-1960 SeriesH-1961 SeriesH-1962 Series H-1963. _ . SeriesH-1964 Series H-1965 ( Janua ry to N o v e m b e r ) . . Series H-1965 (December) SeriesH-1966 SeriesH-1967 Series H-1968 ( Janua ry to May) Series H-1968 ( June to Deceraber) Series H-1969 ( January to May) Series H-1969 ( June to December) Series H-1970 Unclassified sales and redempt ions
51,915,000.00 . 145,217,500.00 . 277,070,500.00 . 390,237,500.00 . 347,430,000.00 .
28,976,500.00 . 262,755,500.00 . 397,052,500.00 . 187,648,500.00 . 215,517,000.00 . 654,038,500.00 . 703,300,500.00 . 613,875,000.00 . 578,864,500.00 . 531,054,000.00 . 446,959,000.00 .
39,046,500.00 . 654,965,000.00 481, 362, 500. 00 189,275, 500. 00 225,281, 500. 00
r 162,834, 500. 00 r 13,673,000. 00
5, 033, 000. 00
8,000. 00 1,000. 00
22,000.00 38, 500.00
1, 510, 500.00 178,781,000. 00 186, 649,000. 00
2,324, 500. 00
6,187,000.00 . 16,918,000.00 . 33,791,500.00 . 46,462,500.00 . 39,474, 500. 00 .
3,250,500.00 . 29,997, 500. 00 . 53,074,000. 00 . 27,500,500.00 . 37,012,000.00 . 83,334,500.00 . 66,963,000.00 . 58,235,500.00 . 51,180,000.00 . 46,486,600.00 . 36,746,000.00 .
2, 684, 500. 00 . 42,462,000. 00 . 34,826,500.00 . 11,826,500.00 . 13,695,500.00 . 10,084,000.00 . 6, 556, 500.00 .
300,500.00 . 706, 000. 00 .
7, 503,383, 500. 00 Tota l Series H
To ta l U .S . savings bonds .' - - - - - - - 51,669,045,887.80
369,334, 500.00 758, 755, 500. 00 .
6,481, 929, 321. 71 6,870,334, 992. 30 .
U . S . savings n o t e s : ' Series S-1967.--Series S-1968 ( J anua ry to May) Series S-1968 ( June to December ) -Series S-1969 . - . . Series S-1970 Unclassified
87,253,769. 65 86,480,105. 06
183,167,789.86 139,706,715.00
2,438,314. 00
3,713, 554. 03 3,406,494. 40
10,177,383. 02 228,285,924. 04
95,527,876. 50 847, 932. 75 ,
18,250,826.56 . 20,684,296.97 55,811,221.90 . 30,738,000.93 ,
40,763.25 .
To ta l U . S . savings no t e s .
Footnotes a t end of table.-
498, 046,693. 57 341, 959,164. 74 125, 525,109. 61
45, 728, 000. 00 128,299, 500. 00 243,279, 000. 00 343,775,000. 00 307, 955, 500. 00 25,726,000. 00 232,758,000. 00 343,978, 500.00 160,148,000. 00 178, 505,000. 00 570, 704, 000. 00 636, 337, 500. 00 555, 639, 500. 00 527, 684, 500.00 484, 567, 500. 00 410,213,000. 00 36, 362, 000. 00 512, 511, 000. 00 446, 537,000. 00 177,471, 000. 00 211, 624, 500. 00 154,261,000. 00 186, 897, 500. 00 186, 348, 500. 00 6, 651, 500. 00
7,113, 962, 500. 00
51, 280, 640, 217. 21
72, 716,497.12 68,202, 302. 49 137, 533, 950. 98 337,254, 638.11 95,487,113. 25 3,286, 246. 75
714,480, 748. 70
ZP
I h-l ZP
> ^ hH o > Hd Hd
CO. On-
Digitized for FRASER http://fraser.stlouisfed.org/ Federal Reserve Bank of St. Louis
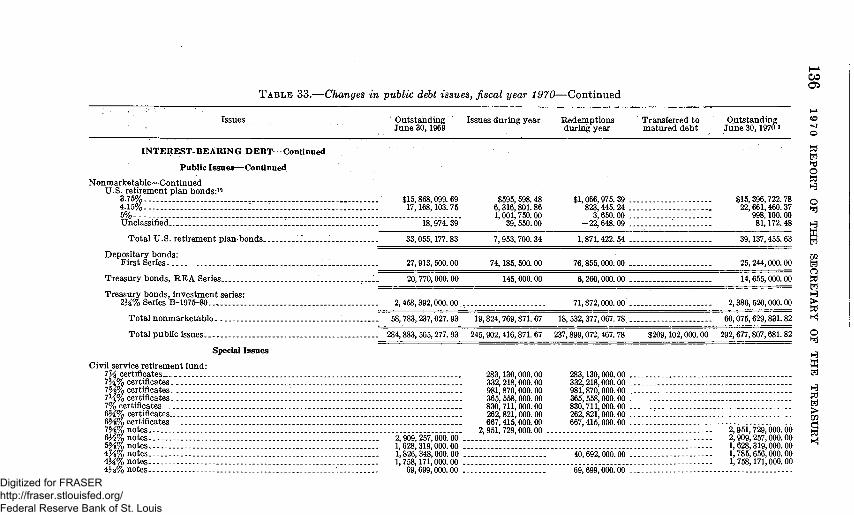
TABLE 33.—Changes in puhlic debt issues, fiscal year 1970-—Continued
CO
Issues Outstanding Issues during year Redemptions Transferred to Outstanding ^ June 30,1969 dmmg year matmed debt June 30,19701 ^
INTEREST-BEARING DEBT—Continued S . f e l
Publicissues—Continued Q Nonmarketable—Continued td
uLuaiiiBi/auit;—v^ouiiuuBU i_j U.S. retkement plan bonds:*''
3.75%. $15,868,099.69 $595,598.48 $1,066,976.39 $16,396,722.78 Q 4.15%. : . . . . : 17,168,103.75 6,316,801.86 823,445.24 . 22,661,460.37 M 6% . 1,001,750.00 3,650.00 998,100.00 Unclassmed 18,974.39 39,650.00 -22,648.09 ' 81,172.48 ^
Total U.S. retkement plan bonds . : . . - 33,055,177.83 7,953,700.34 1,871,422. 54 - - . -L - - 39,137,455.63 §
Depositary bonds: zp FkstSerles - - - 27,913,600.00 74,185,500.00 76,855,000.00 - 25,244,000.00 fej
= O Treasury bonds, REA Series 20,770,000.00 145,000.00 6,260,000.00 - 14,655,000.00 td
• • fel Treasury bonds, investment series: '^
2 ^ % Series B-1975-80--.- ----- 2,458,392,000.00 - 71,872,000.00 - - - - - 2,386,520,000.00 > - td
Total nonmarketable-- - - 58,783,237,027.93 19,824,769,871.67 18,532,377,067.78. - 60,075,629,83L 82 K| Total pubhc issues- 284,883,565,277.93 245, 902, 416,871. 67 237,899,072,467.78 $209,102,000.00 292,677,807,681. 82 O
—T fel Special Issues ^
CivU service retirement fund: hH 7Ji certmcates 283,130,000.00 283,130,000.00 ^ 73^% certmcates 332,218,000.00 332,218,000.00 , 7H% certmcates : . 981,870,000.00 981,870,000.00 3 714% certmcates. . 365,558,000.00 365,558,000.00 S 7% certmcates 830,711,000.00 830,711,000.00 e 6^% certificates 262,821,000.00 262,821,000.00 . ^ 6^% certmcates 667,415,000.00 667,415,000.00 JH 7^% notes 2,951,729,000.00 2,951,729,000.00 g 63^% notes 2,909,267,000.00 2,909,257,000.00 ^ 5 ^ % notes 1,628,319,000.00 1,628,319,000.00 ^ 4J^% notes. . . 1,826,348,000.00 40,692,000.00 1,785,656,000.00 4M% notes 1,758,171,000.00 1,758,171,000.00 43/8% notes. ----- 69,699,000.00 69,699,000.00 --.
Digitized for FRASER http://fraser.stlouisfed.org/ Federal Reserve Bank of St. Louis

43^% bonds 3,888,607,000.00 72,775,000.00 3,816,832,000.00 3J^% bonds 1,944,434,000.00 80,227,000.00 1,864,207,000.00 3 ^ % bonds 1,173,248,000.00 - 60,976,000.00 1,112,272,000.00 27^% bonds- 468,190,000.00 221,412,000.00 246,778,000.00 2 ^ % bonds 1,640,497,000.00 - 832,931,000.00 807,566,000.00
Employees life insurance fund: 8.10%, certmcates 54,652,000.00 54,652,000.00 7.90%, certmcates 8,852,000.00 8,852,000.00 7.50% certmcates 55,000,000.00 55,000,000.00 7.15% certificates- - 35,662,000.00 35,662,000.00 -7.13% certmcates - 60,000,000.00 --- 60,000,000.00 7.00% certmcates 330,000.00 330,000.00 -6.45% certmcates --- 46,142,000.00 46,142,000.00 6.10% certmcates-- - 50,000,000.00 --.- 50,000,000.00
Federal Deposit Insurance Corporation: 8.10% certmcates 199,783,000.00 199,783,000.00 --7.89% certmcates 345,715,000.00 345,715,000.00 C/j 7.48%, certmcates 137,813,000.00 137,813,000.00 H 7.13% certificates 76,941,000.00 3,000,000.00 .• . 73,941,000.00 > 6.95% certmcates 161,653,000.00 161,653,000.00 . . H3 6.88% certmcates -• 370,056,000.00 370,056,000.00 S 6.85% certmcates 142,576,000.00 142,576,000.00 Jj 6.81% certmcates 333,431,000.00 333,431,000.00 . hn 6.80% certmcates 295,655,000.00 295,655,000.00 g
U
6.33% certificates 335,359,000.00 335,359,000.00 6.20% cer tmca tes . . 121,016,000.00 121,016,000.00 5.90% certmcates 120,432,000.00 120,432,000.00 . . ^
Federal disability insurance trust fund: hH 7J^% certmcates 440,078,000.00 440,078,000.00 . - hg 7M% certmcates 237,800,000.00 237,800,000.00 fel 75^% certmcates 1,181,184,000.00 1,181,184,000.00 . . 2 734% certmcates - 390,907,000.00 390,907,000.00 M 7% certmcates 1,138,856,000.00 1,138,856,000.00 .- . . 6^% certmcates 335,219,000.00 335,219,000.00 . . . . . . 6^%) certmcates..." 628,457,000.00 628,457,000.00 .-. 7H% notes. 1,394,466,000.00 . . . . 1,394,466,000.00 63^%, notes . . - - 1,151,608,000.00 1,161,608,000.00 6^% notes ----- 683,612,000.00 583,612,000.00 4J^% notes - 6,486,000.00 2,000,000.00 4,486,000.00 434% notes -- 309,178,000.00 309,178,000.00 43^% bonds - - - - -- 279,238,000.00 279,238,000.00 3J^%, bonds - - - 153,632,000.00 163,632,000.00 3M% bonds -- -- 348,740,000.00 348,740,000.00 2 ^ % bonds - - 209,900,000.00 - 209,900,000.00 Footnotes at end of table.
0 0
Digitized for FRASER http://fraser.stlouisfed.org/ Federal Reserve Bank of St. Louis

CO (X)
TABLE 33.—Changes in public debt issues, fiscal year 1970—Continued
fel
Issues Outstandhlg Issues durhig year Redemptions Transferred to Outstanding <i June 30, 1969 during year matured debt June 30,19701 o
td INTEREST-BEARING DEBT-Continued fel
Hd
Special Issues—Continued 2 td
Federal home loan banks: ^ 8.10% certmcates . . . . . . . . $546,500,000.00 $546,500,000.00 ^ 7.89% certmcates 438,000,000.00 438,000,000.00" .- 2 7.48% certmcates 703,000,000.00 703,000,000.00 7.13% certificates 257,000,000.00 58,000,000.00 $199,000,000.00 6.95% certmcates . . . 220,000,000.00 220,000,000.00 6.88% certmcates 304,000,000.00 304,000,000.00 .- ^ 6.85% certmcates 418,000,000.00 418,000,000.00... ^ 6.81% certmcates 305,500,000.00 305,500,000.00 m 6.80% certificates . . . . -. . . . 964,500,000.00 964,500,000.00 ^ 6.33% certificates . . . . . 203,000,000.00 203,000,000.00 -- o 6.20% certificates . . . . . . . . . . . 86,500,000.00 86,500,000.00 S3 5.90% certmcates $5-2,000,000.00 52,000,000.00 - fel
Federal hospital insurance trustfund: h3 7J^% certificates . 404,210,000.00 404,210,000.00 --- > 7M% certificates 298,240,000.00 298,240,000.00 td 7 ^ % certmcates 1,314,892,000.00 1,314,892,000.00 K} 734% certificates . . 1,043,742,000.00 1,043,742,000.00 7%certmcates 1,294,194,000.00 1,294,194,000.00 - O 6M% certificates 531,350,000.00 531,350,000.00 fe^ 6^% certmcates 844,210,000.00 844,210,000.00 75^%notes . . 919,358,000.00 919,358,000.00 |3 63^%notes " 729,200,000.00 . 729,200,000.00 ffi 55^%notes 495,529,000.00 495,529,000.00 fel 4K%notes 157,770,000.00 157,770,000. 66 .-4^%notes 507,441,000.00 68,206,000.00 439,235,000.00 \^
Federal old-age and survivors' insurance trust fund: 2 73^% certificates.. 2,441,447,000.00 2,441,447,000.00 ^ 7M% certmcates 1,792,525,000.00 1,792,525,000.00 ^ 7^%, certmcates. 8,221,340,000.00 8,221,340,000.00 ^ 734% certificates 2,906,186,000.00 2,906,186,000.00 -- ^ 7% certmcates 8,567,531,000.00 8,567,531,000.00 -.-- i l 6M% certificates. 2,664,507,000.00 2,664,507,000.00 ^ 65^% certificates 4,899,301,000.00 4,899,301,000.00 7^%, notes 5,033,296,000.00 5,033,296,000.00 63^% notes 3,844,864,000.00 3,844,864,000.00 Digitized for FRASER
http://fraser.stlouisfed.org/ Federal Reserve Bank of St. Louis

5 ^ % notes 2,460,795,000.00 . 47/^% notes 1,376,537,000.00 . 4M%o notes 2,720,279,000.00 43^% notes . 2,581,589,000.00 . 33^%bonds 1,738,455,000.00 . 3 ^ % b o n d s 1,240,088,000.00 . 25^% bonds 6,023,463,000.00 .
Fede ra l Savings and L o a n Insurance Corporat ion: 8.10% certificates 7.89% certificates 7.48% certificates 7.13% certificates 6.95% certificates 6.88% certificates 6.85% certificates 6.81% certificates 6.80% certificates 6.33% certificates 6.20% certificates 5.90% certificates 73,376,000.00 .
Federa l supp lemen ta ry medical insurance ti-ust fund: 73^%, certificates 7M% certificates 7 ^ % certificates 7 K % certificates 7% certificates 6M% certmcates 6 ^ % certificates 7 ^ % notes 6 H % notes . 217,206,000.00 . 5 ^ % notes 6,527,000.00 . 4 M % n o t e s 134,238,000.00 .
Foreign service ret i reraent fund: 7>g% certificates 7M% certificates 7 ^ % certificates 734% certificates . 7% certificates 6M%) cert if icates. . . 6 ^ % certmcates 7 ^ % notes 63/^% notes 5,082,000.00 . 4% notes 18,102,000.00 . 4% bonds 24,136,000.00 .
Foo tno te s at end of table .
296, 526,000. 00 .
70,445,000. 00 76, 569,000. 00 60,392,000. 00
104, 381,000. 00 28,056,000.00
111, 201,000. 00 18, 600,000. 00 84,455,000. 00 70, 208,000. 00 86,062,000. 00 90,160, 000. 00
165,613,000. 00 166,542,000.00 469,053,000.00 153,744,000.00 463,353,000. 00 153,098,000. 00 306,081,000.00
2,855,000.00 .
1,170,000. 00 2,326,000.00 6,454,000. 00
802,000.00 4,426,000. 00 1,048,000. 00 2,395,000. 00 6,721,000.00 .
783,485,000.00
70,445,000.00 76,569,000.00 . 60,392,000.00 . 24,200,000.00 28,056,000.00 .
111,201,000.00 . 18,600,000.00 . 84,455,000. 00 70,208,000.00 . 86,062,000.00 . 90,160,000. 00 . 73,376,000.00 .
165,613,000.00 . 166,542,000.00 . 469,053,000.00 . 153,744,000.00 . 463,353,000.00 . 153,098,000.00 . 306,081,000.00 .
2,460,795,000. 00 1,080, o n , 000. 00 2,720,279,000. 00 2, 581, 589,000. 00 1,738,455,000.00 1,240,088,000. 00 5, 239,978,000. 00
80,181,000. 00
206,644,000.00 6,527,000.00 .
134,238,000.00 .
1,170,000.00 2,326,000.00 , 6,454,000.00 .
802,000.00 . 4,426,000.00 . 1,048,000.00 . 2,395,000.00
3,017,000. 00
2,855,000. 00 10,562,000. 00
6,721,000.00 5,082,000. 00
15,085,000. 00 24,136,000. 00
1 1-H ZP
> Hd Hd
CO CO
Digitized for FRASER http://fraser.stlouisfed.org/ Federal Reserve Bank of St. Louis

TABLE 33.—Changes in public debt issues, fiscal year 1970—Continued
O
CO
o Issues Outstandmg Issues durhig year Rederaptions Transferred to Outstanding ^
June 30,1969 durmg year matured debt June 30. 19701 H '. . Hi
o INTEREST-BEARING DEBT-Cont inued td
Special Issues—Continued O
Government life insurance fund: fel 734% notes -- ---- --- $29.964,000.00 $29,964,000.00 , 6% notes $32,638,000.00 32,638,000.00 2 534% notes 64,365,000.00 64,365,000.00 ffi 4^%) notes.. 77,986,000.00 77,986,000.00 ^ 434% bonds 28,468,000.00 28,468,000.00 3^%bonds 77,120,000.00 $670,000.00 76,450,000.00 p 3 ^ % bonds 77,992,000.00 77,992,000.00 S 33^%bonds 483,262,000.00 74,382,000.00 408,880,000.00 HH
Highway trust fund: w 6% certmcates 3,683,937,000.00 1,082,200,000.00 2,601,737,000.00 \4 5>g% certificates 1,323,019,000.00 1,323,019,000.00 S 5M% certmcates 878,906,000.00 878,906,000.00 - ^ 5 ^ % certificates-. 614,733,000.00 614,733,000.00... h< 5H% certificates 782,700,000.00 782,700,000.00 534% certificates 562,773,000.00 562,773,000.00.. O 53^% certificates 1,512,735,000.00 438,282,000.00 1,951,017,000.00 fel
National service lUe insurance fund: 75^% certificates 62,449,000.00 62,449,000.00 H 7H% certmcates 1,128,000.00 1,128,000.00 S 7% certificates 43,775,000.00 43,775,000.00 . fel 6M% certificates 1,128,000.00 1,128,000.00 6^% certmcates 25,656,000.00 25,656,000.00 . H 63^% certificates 28,240,000.00 28,240,000.00 td 6H% certificates 9,849,000.00 9,849,000.00.. fel 73^%notes 569,007,000.00 569,007,666.66 > 6M%notes 305,419,000.00 305,419,000.00 22 53^%notes 332,597,000.00 . 332,597,000.00 S 4H%notes 558,176,000.00 . 13,696,000.00 544,480,000.00 ^ 35^%notes 6,946,000.00 6,946,000.00 ^ 4 ^ % bonds . . . . 225,452,000.00 225,452,666.66 3 ^ % b o n d s . . . . 426,238,000.00 7,873,000.00 418,366,000.00 3 ^ % bonds 932,386,000.00 932,386,000.00
Digitized for FRASER http://fraser.stlouisfed.org/ Federal Reserve Bank of St. Louis

3 ^ % b o n d s 298,259,000.00 . 334% b o n d s 430,031,000.00 . 33^% b o n d s 343,149,000.00 . 3 % b o n d s . 1,895,000,000.00 .
Ra i l road re t i rement account : 73^% c e r t m c a t e s . - -7 ^ % cer tmcates 7y%% cer tmcates --734% cer tmcates 7% cer tmcates 6J^% certmcates 6 ^ % certificates 6 ^ % certificates 7 ^ % notes 63^% notes 647,948,000.00 . 5 ^ % notes 482,623,000.00 . 4>^% notes 5,552,000.00 . 4 ^ % notes 416,402,000.00 . 43^%, b o n d s 578,172,000.00 . 4 % bonds 1,295,637,000.00 .
Rai l road re t i r ement holding account : 73^% certificates 7 ^ % certificates 7^/^% certificates 734% certificates 7% certificates 63^% certificates 6 ^ % certificates 6 ^ % cer tmcates 63^% certificates 2,254,000.00 .
Rai l road re t i re inent supp lemen ta l account : 73^% cer t i f ica tes . - -73^% certificates 7 ^ % certificates 734% certificates 7% certificates-6J^% cer tmcates . . 6 ^ % certificates 6 ^ % cer tmcates 63^% certificates 5,228,000.00 .
Footnotes a t end of t ab le .
222,572,000. 00 842,025,000.00
11,852,000.00 152,206,000. 00 273,025,000. 00 105,934,000. 00
77,326,000. 00 165,177,000. 00 847,447,000.00 .
392,000. 00 3,423,000.00
22,000. 00 228,000. 00 680,000.00 214,000. 00 216,000. 00 390,000. 00
4,612,000. 00 31,873,000. 00
208,000. 00 2,166,000. 00
22,187,000. 00 2,018,000. 00 2,031,000.00 5,202,000. 00
379,000,000.00 .
222,572,000.00 . 842,025,000.00 .
11,852,000.00 . 152,206,000.00 . 273,025,000.00 . 105,934,000.00 .
77,326,000.00 . 165,177,000.00 .
5,552,000.00 . 7,113,000.00 .
46,220,000.00 . 483,144,000.00 .
392,000.00 . 1,500,000.00 .
22,000.00 . 228,000.00 . 580,000.00 . 214,000.00 . 216,000.00 . 390,000.00 .
2,254,000.00 .
4,612,000.00 . 14,202,000.00 .
208,000.00 . 2,156,000.00 .
22,187,000.00 . 2,018,000.00 . 2,031,000.00 . 6,202,000.00 . 6,228,000.00 .
298, 259,000. 00 430,031,000. 00 343,149,000. 00
1,616,000,000. 00
847,447,000.00 647,948,000.00 482,623,000.00
409,289,000. 00 531,952,000. 00 812,493,000.00
1,923,000.00
17,671,000. 00
ZJi
% hH ZP y ^ hH o >
fel
h^^
Digitized for FRASER http://fraser.stlouisfed.org/ Federal Reserve Bank of St. Louis

TABLE 33.—Changes in public debt issues, fiscal year 1970—Continued
Issues Outstanding Issues dm-ing year Redemptions Transferred to Outstanding 2 June 30, 1969 durhig year matmed debt June 30, 19701 2
INTEREST-BEARING DEBT—Continued § Hd
Special I s s u e s — C o n t i n u e d O td
Servicemen's group hfe insurance fund: h 6^%, certmcates $6,203,000.00 $6,203,000.00
Unemployment trustfund: O 53^% certmcates.- - 10,882,290,000.00 362,351,000.00 $10,519,939,000.00 fel 53^%, certmcates.- - -- - 2,067,244,000.00 2,067,244,000.00 534% certmcates 348,853,000.00 348,853,000.00 H 53^% certmcates-- 413,721,000.00 413,721,000.00 -. ffi 5% certmcates 191,299,000.00 191,299,000.00 --- fel 4J^%, certmcates - - . . - 820,130,000.00 820,130,000.00 4 ^ % certificates - . . . $9,956,932,000.00 9,956,932,000.00 ZP
Veterans' reopened insurance fund: feJ 7^%, certmcates 1,911,000.00 1,911,000.00 Q 7 ^ % certmcates.. 2,127,000.00 2,127,000.00 2 7H% certmcates.. 11,986,000.00 7,026,000.00 4,960,000.00 g 734% certmcates 2,383,000.00 2,383,000.00 1 7% certmcates 6,297,000.00 6,297,000.00 fj 6^% certificates 2,107,000.00 2,107,000.00 fi 65|%, certificates 4,562,000.00 4,662,000.00 ^ 63^% certmcates 17,392,000.00 17,392,000.00 o 7 ^ % notes 47,146,000.00 47,146,000.00 w 63/2% notes -- 104,316,000.00 104,316,000.00
Veterans' special life insurance fund: H 4 ^ % certificates 4,512,000.00 1,035,000.00 3,477,000.00 trj 4 ^ % certmcates 3,481,000.00 3,481,000.00 B 43^% certificates 7,032,000.00 7,032,000.00 ^ 4H% certificates 34,651,000.00 5,779,000.00 40,430,000.00 uq 4 ^ % notes 55,489,000.00 55,489,000.00 S 4M% notes 207,906,000.00 207,906,000.00 g
> Total special issues. 66,789,505,000.00 92,245,008,000.00 82,711,422,000.00 76,323,091,000.00 ZP
===================================== ^ d Total interest-bearing debt. 351,673,070,277.93 338,147,424,87L 67 320,610,494,467.78 $209,102,000.00 369,000,898,681.82 td
. y<
Digitized for FRASER http://fraser.stlouisfed.org/ Federal Reserve Bank of St. Louis
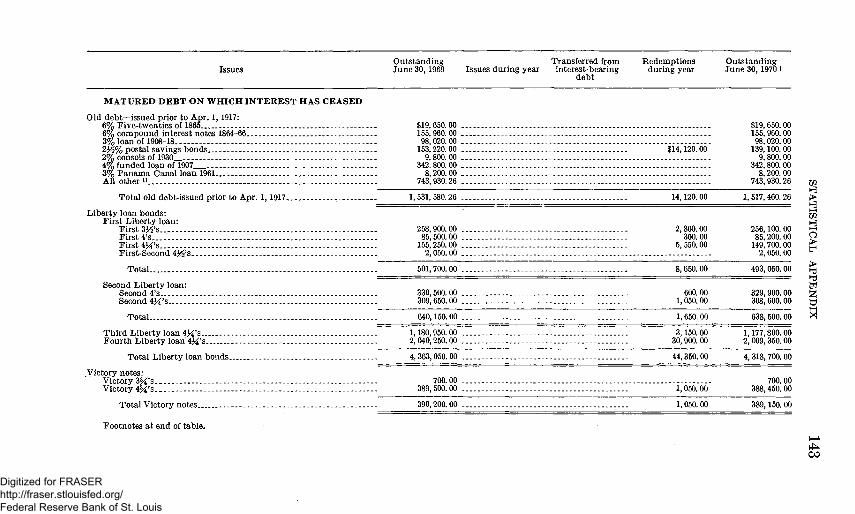
Issues Outstanding June 30, 1969 Issues during year
Transferred from interest-bearmg
debt
Redemptions during year
Outstanding June 30,1970 i
MATURED DEBT ON WHICH INTEREST HAS CEASED
Old debt—issued prior to Apr. 1,1917: 6% Five-twenties of 1865 6% compound mterest notes 1864-66 3% loan of 1908-18.... 2 ^ % postal savings bonds 2% consols of 1930_ 4%, funded loan of 1907 3% Panama Canalloan 1961 AU other n_
Total old debt-issued prior to Apr. 1,1917
Liberty loan bonds: First Liberty loan:
First 33^'s First 4's First 434's First-Second 43>! 's
Total
Second Liberty loan: Second 4's Second 434's
Total
Third Liberty loan 434's
Fourth Liberty loan 434's
Total Liberty loan bonds
Victory notes: Victory 3M's Victory 4M's
Total Victory notes
Footnotes at end of table.
$19,650.00 $19,650.00 155,960.00 155,960.00 98,020.00 98,020.00 153,220.00 $14,120.00 139,100.00 9,800.00 9,800.00
342,800.00 342,800.00 8,200.00 8,200.00
743,930.26 . . . - - . . 743,930.26
1,531,580.26 14,120.00 1,517,460.26
258,900.00 2,800.00 256,100.00 85,500.00 300.00 85,200.00
155,250.00 5,550.00 149,700.00 2,050.00 2,050.00
601,700.00"
330,600.00 309,650.00
640,150.00
1,180,950.00 2,040,250.00 . .
4,363,050.00 .. ..
700.00 389,500.00 .
390,200.00 .
8,650.00
600. 00 1,050.00
1,650.00
3,150.00 30,900. 00
44,350. 00
1,050.00
1, 050. 00
493, 050. 00
329, 900. 00 308, 600. 00
638, 500. 00
1,177, 800. 00 2, 009, 350. 00
4 318,700.00
700. 00 388 450 00
389,150 00
ZP h ^ > H^ hH ZP y ^ hH O >
> Hd Hd fel 1 ^
^4^ CO
Digitized for FRASER http://fraser.stlouisfed.org/ Federal Reserve Bank of St. Louis

T A B L E 33.—Changes in puhlic debt issues, fiscal year 1970—Continued
F^^ F4^
Issues Outstanding Transferred from Redemptions Outstanding June 30,1969 Issues during year interest-bearing during year June 30,1970 i
debt o
td fel Hd o td y ^
o fel
W fel
ZP fel o td fel h9 > td Kl
o fel y ^
W fel
td fel > ZP
td K|
MATURED DEBT ON WHICH INTEREST HAS CEASED-Con.
Treasury bonds: 3H% of 1940-43 3H% of 1941-43 334% of 1941 3H% Of 1943-47 334% Of 1943-45 334%o of 1944-46 4% of 1944-54 2M% Of 1945-47 23^% of 1945... 3M% of 1946-56 3% of 1946-48.--33^% of 1946-49 . 4M% of 1947-52 2% of 1947.... 2% of 1948-50 (dated Mar. 15, 1941) 2M% of 1948-51 1^% of 1948 23^% of 1948 2%of 1948-50 (dated Dec. 8,1939). 2% of 1949-51 (dated Jan. 15,1942) 2% of 1949-51 (datedMay 15,1942).. 2% of 1949-51 (dated July 15,1942) 33^% of 1949-52 23^% of 1949-53 l3<^%of 1950 2% of 1950-52 (dated Oct. 19, 1942) 23^% of 1950-52 . 2% of 1950-52 (dated Apr. 15,1943) 234% of 1951-53 2%) of 1951-53 2M% of 1951-54 2% of 1951-55 3% of 1951-55 . . . 2>^% of 1952-54 2% of 1952-54 (dated June 26,1944) 2% of 1952-54 (datedDec. 1, 1944) 2M% of 1952-55 . . . . . . -.
$8,950.00 $600.00 $8,350.00 26,800.00 26,800.00 8,150.00 8,150.00
43,700.00 12,200.00 31,500.00 94,850.00 2,750.00 92,100.00
179,350.00 7,260.00 172,100.00 77,100.00 25,400.00 51,700.00 88,900.00 1,750.00 87,150.00 2,500.00 2,500.00 53,400.00 53,400.00 40,150.00 750.00 39,400.00 169,650.00 16,700.00 152,950.00 194,100.00 44,000.00 150,100.00
350.00 350.00 2,000.00 2,000.00 6,150.00 6,150.00 51,500.00 3,000.00 48,500.00 4,050.00 .- 4,050.00 1,500.00 1,500.00
150.00 150.00 14,000.00 14,000.00 2,000.00 2,000.00 17,200.00 17,200.00 52,150.00 - . 1,500.00 50,650.00
272,000.00 45,000.00 227,000.00 17,300.00 1,000.00 16,300.00 60,700.00 1,000.00 59,700.00
196,500.00 9,000.00 187,500.00 48,800.00 48,800.00
416,000.00 40,000.00 376,000.00 78,700.00 8,000.00 70,700.00 13,750.00 . - --- 200.00 13,550.00
427,600.00 . . 22,650.00 404,950.00 12,900.00 . . . . . . . . . 2,100.00 10,800.00
387,500.00 . . . 37,500.00 350,000.00 990,000.00 . - - . 50,500.00 939,500.00 13,800.00 13,800.00
Digitized for FRASER http://fraser.stlouisfed.org/ Federal Reserve Bank of St. Louis

2% of 1953-55 234%) of 1954-56 2 H % of 1955-60 23^%, of 1956-58 2M% of 1956-59. . . . 234 ^ of 1956-59 2 ^ % of 1957-59 2 ^ % of 1958 2 H % 0 f l 9 5 8 . 2M% of 1958-63. 234% of 1959-62 (da ted J u n e 1, 1945) . . 234% of 1959-62 (dated N o v . 15, 1945). 2 K % o f l 9 6 0 . 2 ^ % of 1960-65 2 ^ % of 1961 2 i ^ % o f l 9 6 1 23^% of 1962-67 23^% of 1963 23^% of 1963-68. -3 % of 1964. 2 1 ^ % of 1964-69 (dated A p r . 15, 1943).. 23^% of 1964-69 (dated Sept . 15, 1943). 2 ^ 7 o o f l 9 6 5 23^% of 1965-70... 33<%ofl966 3 ^ % of 1966 3 % of 1966 35^% of 1967 Sy8% of 1968 (dated J u n e 23, 1960) 3 K % of 1968 (dated Sept . 15 ,1963) . . . . 3 ^ % of 1968. 4% of 1969 (da ted A u g . 15, 1962) 4% of 1969 (dated Oct. 1, 1957)
T o t a l T r e a s u r y b o n d s . .
3 % Adjus ted service bonds of 1945..
U . S . savings b o n d s : Series A-1935 Series B-1936 Series C-1937 Series C-1938 Series D-1939 Series D-1940 Series D-1941 Series F-1941 Series F-1942
Footnotes at end of table .
60,850. 00 47,650.00
946,150. 00 55,400. 00
109,450.00 . 650, 500. 00 .
41,000.00 . 19,500.00 . 31,500.00 . 47,550.00 .
1,610,500.00 . 1,224, 000. 00 .
34,000.00 . 352,550.00 . 236,000. 00 . 598, 500. 00 .
1,476,500.00 . 336,500.00 .
7,399,000. 00 . 251,000.00 .
57,489,000. 00 .
428, 500. 00 .
239,500.00 . 94,000. 00 .
453, 000. 00 . 849,000.00 .
3,726,000.00 . 927, 500. 00 .
1,141,000. 00 . 18, 049, 500. 00 .
102,999,300.00 .
950, 500. 00 .
195, 550. 00 . 365,775.00 . 365,575.00 . 650,475.00 . 988,900.00 .
1,915, 550; 00 . 2,130,150. 00 .
325,200.00 . 1, 225,325. 00 .
$10,339,500.00 .
31,334,000.00
14,458,500.00 .
1,000.00 800. 00
44,100. 00 6,150. 00 7,200. 00
80,000. 00 6,000. 00 4,000. 00 4,000. 00
11, 650. 00 240,000. 00 238,500. 00
1,000. 00 45, 200. 00 34,500. 00 86, 500. 00
521,000. 00 67, 500. 00
3, 966, 500. 00 38, 000. 00
47,318, 500. 00
96,'666."66'
87,'666.*66' 27,000. 00
138, 500. 00 238, 500. 00
2,146, 500. 00 476, 500. 00 656,500. 00
16, 439,000. 00
56,132,000. 00 73,354,450. 00
59,850. 00 46,850. 00
902,050. 00 49,250. 00
102,250. 00 570, 500. 00
35,000. 00 15, 500. 00 27, 500. 00 35,900. 00
1,370, 500. 00 985,500. 00 33,000.00
307,350. 00 201, 500. 00 512,000. 00 955, 500. 00 269,000. 00
3,432, 500. 00 213,000. 00
10,170, 500. 00 10,339,500. 00
338,500. 00 31,334,000. 00
152,500. 00 67,000. 00
314, 500. 00 610, 500. 00
1, 579,500. 00 451,000. 00 484,500. 00
1, 610, 500. 00 14,458, 500. 00
85, 776, 850. 00
879, 200. 00
Ui
% hH ZP H 3 hH
o > > Hd
fel
18,475. 00 29, 725. 00 34,075. 00 36, 050. 00
103, 500. 00 221, 650. 00 302,650. 00 37,100. 00
186, 725. 00
177, 075. 00 336, 050. 00 331,500. 00 614,425. 00 885,400. 00
1, 693,900. 00 1,827,500. 00 288,100. 00
1,038,600. 00 h-l
Digitized for FRASER http://fraser.stlouisfed.org/ Federal Reserve Bank of St. Louis

T A B L E 33.—Changes in public debt issues, fiscal year 1970—Continued
F4^
CO
o
td fel Hd o td
o fel
fel
ZP
o td fel H3 > td Kj
o fel h3 W fel
td fel > ZP d td K|
Issues Ou t s t and ing Transferred from R e d e m p t i o n s Ou t s t and ing J u n e 30, 1969 Issues dur ing year interest-bearhig du r ing year J u n e 30, 1970 i
deb t
M A T U R E D D E B T O N W H I C H I N T E R E S T H A S C E A S E D - C o n .
U . S . savings bonds—Cont inued ries F-1943.. ries F-1944.. ries F-1945.. ries F-1946.. ries F-1947.. ries F-1948.. ries F-1949-. ries F-1950.. ries F-1951 ries F-1952 ries F Unclassified.. ries G-1941 -ies G-1942 ries G-1943 -ies G-1944 ries G - 1 9 4 5 . . . ries G-1946 -ies G-1947 ries G-1948 •ies G-1949 -ies G-1950
Series G-1951 Series G-1952 Series G Unclass i f ied . SeriesJ-1952 SeriesJ-1953 SeriesJ-1954 SeriesJ-1955 Series J-1956 SeriesJ-1957 Series J Unclass i f ied . . Series K-1952 Series K-1953 Series K-1954 Series K-1955 Series K-1956
Ser: Ser; Ser; Ser: Ser: Ser: Ser; Ser; Ser; Ser; Ser; SerJ Ser: Seri Ser: Ser: Ser: Seri Ser: Ser; Ser;
$1,773, 1,559i 1,016,
505, 238, 492, 468, 348, 117,
12 — 2 ,
323, 1,420, 2, 621, 3,135, 2,954, 2, 607, 3,260, 2, 987, 3,410, 3, 383, 2,855, 1,081,
-49, 563,
1,524, 3, 017, 4,829, 8,442, 3,817, - 2 0 3 ,
964, 1,009, 1,774, 2, 787, 5,182,
12
.700.00 $205,800.00 $1,567,900.00 849.05 245,000.00 1,314,849.00 500.00 133,875.00 882,625.00 025.00 102,100.00 485,925.00 600.00 92,850.00 412,750.00 050.00 38,425.00 199,625.00 725.00 78,825.00 413,900.00 900.00 133,950.00 334,950.00 300.00 91,775.00 256,525.00 725.00 60,800.00 56,925.00 300.00 3,600.00 12-5,900.00 000.00 . . . 47,200.00 275,800.00 100.00 204,700.00 1,215,400.00 200.00 404,300.00 2,216,900.00 600.00 . - 342,700.00 2,792,900.00 800.00 ... 350,500.00 2,604,300.00 500.00 - -- . 333,300.00 2,274,200.00 000.00 479,000.00 2,781,000.00 300.00 ... ....... 568,600.00 2,418,700.00 400.00 641,000.00 2,769,400.00 900.00 682,000.00 2,701,900.00 900.00 550,900.00 2,305,000.00 000.00 201,000.00 880,000.00 300.00. -7,700.00 i2_4i,600.00 500.00 100,775,00 462,725.00 425.00 404,200.00 1,120,225.00 825.00 1,061,525.00 1,956,300.00 525.00 1,622,300.00 3,207,225.00 700.00 4,052,250.00 4,390,450.00 425.00 2,158,825.00 1,658,600.00 325.00 -163,250.00 i2_40,075.00 000.00 668,000.00 296,000.00 500.00 677,000.00 332,500.00 000.00 1,143,500.00 630,500.00 500.00 1,983,000.00 804,500.00 000.00 4,034,000.00 1,148.000.00
Digitized for FRASER http://fraser.stlouisfed.org/ Federal Reserve Bank of St. Louis

Series K-1957 2,775,500.00 2,441,000.00 334,500.00 Series K Unclassified 12 -47 ,000 .00 -39 ,000 .00 12 - 8 , 0 0 0 . 0 0
T o t a l U . S . savings bonds 81, 698, 549..05 27,098,575.00 54,599,974.05
A r m e d Forces leave bonds 5,017,225.00 305,525.00 4,711,700.00
T r e a s u r y notes : Regular series:
5M% A-1924 6,200.00 6,200.00 4M% A-1925 1,000.00 .• 1,000.00 4 ^ % B-1925 6,600.00 6,600.00 43^% C-1925 5,700.00 5,700.00 4M% A-1926 2,600.00 2,600.00 m % B-1926 1,600.00 1,000.00 600.00 43^% A-1927 2,200.00 2,200.00 4 K % B-1927 9,500.00 9,500.00 zP 33^% A-1930-32 12,700.00 12,700.00 H 33^% B-1930-32 9,300.00 9,300.00 > 33^% C-1930-32 6,550.00 6,550.00 H 3%A-1935 3,000.00 2>^% C-1936 5,500.00 334% A-1937 10.000.00 8,000.00 3 % B-1937 25,500.00 25,500.00 . 23^% B-1938 5,000.00 . . . . . . . . 2 ^ % D-1938 1,400.00 23^% A-1939 10,200.00 13/8% B-1939 100.00 1 ^ % A-1940 150.00 2% B-1942 2,000.00 2,000.00 . 13^%, A-1943 3,000.00 1% C-1943 .300.00 M % A-1945 100.00 134% B-1947 7,000.00 134% C-1947 28,000.00 1,000.00 13^% A-1948 8,000.00 134% G-1951 4,000.00 1 H % A-1954 2,000.00 13^% B-1954 1,000.00 13<^% A-1955 . 15,000.00 15,000.00 . 1M% B-1955 4,000.00 2% B-1956 5,000.00 23^% A-1957 28,000.00 23^% A-1958 29,000.00 33^% B-1959 1,000.00 33^%A-1960 22,000.00 9,000.00 334% B-1960. 1,000.00 4M% C-1960 . 31,000.00 3,000.00
Footnotes a t end of table .
6, UUU. UU 5, 500. 00 2, 000. 00
5,000. 00 1,400. 00
10, 200. 00 100. 00 150. 00
3,000. 00 300. 00 100. 00
7, 000. 00 27,000. 00 8,000. 00 4,000. 00 2,000. 00 1,000. 00
4, 000. 00 5, 000. 00
28,000. 00 29,000. 00 1,000. 00 13,000. 00 1,000. 00
28,000. 00
2 S ^ t> hi ^ fel !?! M
U
h-l HI iJ
Digitized for FRASER http://fraser.stlouisfed.org/ Federal Reserve Bank of St. Louis
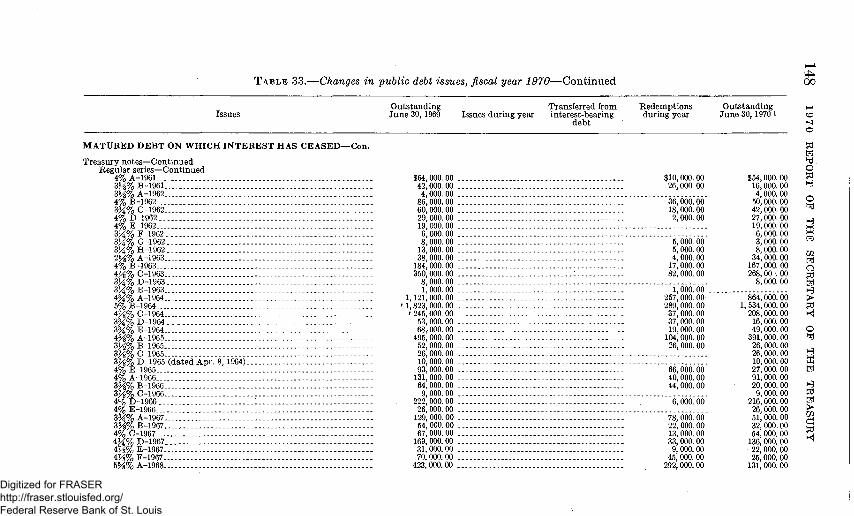
T A B L E 33.—Changes in public debt issues, fiscal year 1970—Continued 00
Issues Ou t s t and ing Transferred from Redempt ions Ou t s t and ing J u n e 30, 1969 Issues dur ing year interes t -bear ing d m i n g year J u n e 30,1970 i
d e b t
M A T U R E D D E B T O N W H I C H I N T E R E S T H A S C E A S E D - C o n .
T reasu ry notes—Cont inued Regular ser ies—Continued
4% A-1961 3 ^ % B-1961 3 ^ % A-1962 4% B-1962 3 ^ % C-1962 4% D-1962 4% E-1962 334% F-1962 3 ^ % G-1962 334% H-1962 25^% A-1963 4% B-1963 4 K % C-1963 334% D-1963 334% E-1963 4 ^ % A-1964 5% B-1964 43^% C-1964 3 ^ % D-1964 3M% E-1964 4 ^ % A-1965 3>^% B-1965 3 ^ % C-1965 3 K % D-1965 (dated Apr . 8, 1964) 4% E-1965 4% A-1966 35^% B-1966. 33^% C-1966 4% D - 1 9 6 6 . . . : 4% E-1966 3 H % A-1967 3 ^ % B-1967 4% C-1967 4 M % D-1967 47/^% E-1967 47/^% F-1967 55^% A-1968.
$64,000.00 $10,000.00 $54,000.00 42,000.00 26,000.00 16,000.00 4,000.00 4,000.00
86,000.00 36,000.00 50,000.00 60,000.00 18,000.00 42,000.00 29,00000 2,000.00 27,000.00 19,000.00 19,000.00 6,000.00 6,000.00 8,000.00 5,000.00 3,000.00
13,000.00 5,000.00 8,000.00 38,000.00 4,000.00 34,000.00
184,000.00 17,000.00 167,000.00 350,000.00 : 82,000.00 268 ,00 .00
8,000.00 8,000.00 1,000.00 1,000.00
1,121,000.00 .. 257,000.00 864,000.00 r 1,823, 000. 00 289,000.00 1,534,000.00
••245,000.00 37,000.00 208,000.00 53,000.00 37,000.00 16,000.00 68,-000.00 19,000.00 49,000.00 495,000.00 104,000.00 391,000.00 52,000.00 26,000.00 26,000.00 26,000.00 26,000.00 10,000.00 10,000.00 93,000.00 66,000.00 27,000.00 131,000.00 40,000.00 91,000.00 64,000.00 44,000.00 • 20,000.00 9,000.00 9,000.00
222,000.00 6,000.00 216,000.00 26,000.00 26,000.00 129,000.00 78,000.00 51,000.00 54,000.00 22,000.00 32,000.00 67,000.00 13,000.00 54,000.00 169,000.00 33,000.00 136,000.00 31,000.00 9,000.00 22,000.00 70,000.00 45,000.00 25,000.00
423,000.00 292,000.00 131,000.00
td fel Hd o td H3
O Hrl
fel
ZP fel o td fel h^ > td y<
o fel • W fel
y ^
td fel > ZP d td Kl
Digitized for FRASER http://fraser.stlouisfed.org/ Federal Reserve Bank of St. Louis

4M% B-1968 126,000.00 74,000.00 52,000.00 4V4% C-W68 47,000.00 31,000,00 16,000.00 5 i | % D _ 1 9 6 8 914,000.00 853,000.00 61,000.00 5 ^ % A-1969 7,765,000.00 7,470,000.00 295,000.00 6^%j B-1969 3,410,000.00 3,025,000.00 385,000.00 6% C-1969 - . $1,421,000.00 1,421,000.00 55^% B-1970 2,369,000.00 2,369,000.00 6 ^ % C-1970 6,145,000.00 6,145,000.00 13^%, EA-1956 1,000.00 1,000.00 13^% EO-1958 1,000.00 1,000.00 13^% EA-1961 10,000.00 . 10,000.00 13^% EO-1961 1,000.00 1,000.00 13^% EA-1962 . . . 26,000.00 16,000.00 10,000.00 13^% EA-1963 5,000.00 5,000.00 13^% EO-1963 . - - 1,000.00 - . 1,000.00 13^% E A - 1 9 6 4 . - • - 204,000.00 1,000.00 203,000.00 13^% EO-1964 . . . 201,000.00 201,000.00 13^% EA-1965 . - . 89,000.00 4,000.00 85,000.00 1 ) ^ % E 0 - 1 9 6 5 — 200,000.00 200,000.00 g 1 H % E A - 1 9 6 6 432,000.00 5,000.00 427,000.00 t^ 13^% EO-1966 200,000.00 200,000.00 £ 13/^% EA-1967 441,000.00 41,000.00 400,000.00 3 13^%E0-1967- - - 203,000.00 1,000.00 202,000.00 ZP 13^% EA-1968 . . . 430,000.00 30,000.00 400,000.00 H 13^%, EO-1968- . . 635,000.00 28,000.00 607,000.00 Q 13^% EA-1969 . . . 222,000.00 6,000.00 216,000.00 > 13^%E0-1969 1,000.00 1,000.00 tT" 1)^% EA-1970 - 77,000.00 77,000.00
T a x series > A-1943 4,900.00 . . 350.00 4,550.00 2 B-1943 600.00 . 600.00 ^ A-1944 6,750.00 25.00 6,725.00 g B-1944 2,000.00 2,000.00 ^ A-1945 59,625.00 850.00 68,775.00 O
Savings series: M C-1946 - 30,000.00 3,000.00 27,000.00 "^ C-1947 . . 105,300.00 13,200.00 92,100.00 C-1948 . . . . 67,200.00 67,200.00 C-1949 9,600.00 9,600.00 C-1950 5,800.00 5,800.00 C-1951 700.00 700.00 D-1951 1,500.00 1,500.00 D-1952 7,500.00 7,500.00 D-1953 3,400.00 3,400.00 A-1954 24,700.00 9,000.00 15,700.00 A-1955 43,100.00 2,000.00 41,100.00 A-1956 200.00 200.00 B-1955 1,200.00 1,200.00
T o t a l T reasu ry notes 22,547,275.00 10,013,000.00 13,301,120.00 19,259,150.00 — —= ^ h-i
f o o t n o t e s a t end of t ab le . j4^ CO
Digitized for FRASER http://fraser.stlouisfed.org/ Federal Reserve Bank of St. Louis
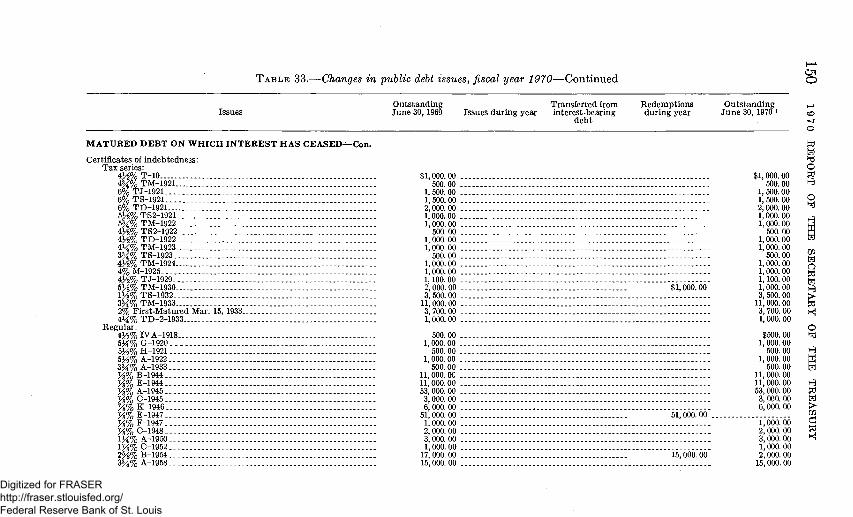
T A B L E 33.—Changes in puhlic debt issues, fiscal year 1970—Continued o
Issues Ou t s t and ing J u n e 30,1969 Issues d m h i g year
Transfen-ed from interest-bearing
d e b t
Redempt ions dur ing year
O u t s t a n d i n g J u n e 30, 1970 i
M A T U R E D D E B T O N W H I C H I N T E R E S T H A S C E A S E D - C o n .
Cer tmca tes of h idebtedness : T a x series:
43^% T-10 4M% TM-1921 6% TJ-1921 6% TS-1921 6% TD-1921 53^%TS2-1921 . 5M% TM-1922 43^%TS2-1922 43^% TD-1922 414% TM-1923 3 ^ % TS-1923 43^% TM-1924 4 % M - 1 9 2 5 . . 4J^% T J - 1 9 2 9 . . . . 63^% TM-1930 13/5% TS-1932 3M% TM-1933 . . . 2% First-Matm-ed Mar. 15, 1933 414% TD-2-1933
Regular : 43^% IVA-1918 534% G-1920 53^% H-1921 53^% A-1922 33^% A-1933 3^% B - 1 9 4 4 . . . . >!% E - 1 9 4 4 . . . . 3^% A-1945 3^% C-1945 7^% K-1946 K % E-1947 3^% F-1947 J^% C-1948 134% A-1950 13^% C-1952 25^% B-1954 3 H % A-1958
$1,000.00 500.00
1,500.00 1,500.00 2,000.00 1,000.00 1,000.00
500.00 1,000.00 1,000.00
500.00 1,000.00 1,000.00 1,100.00 2,000.00 $1,000.00 3,500.00
11,000.00 3,700.00 1,000.00
500.00 1,000.00
500.00 1,000.00
500.00 11,000.00 11,000.00 53,000.00 3,000.00 6,000.00 .
51,000.00 51,000.00 1,000.00 2,000.00 3,000.00 1,000.00
17,000.00 15,000.00 15,000.00
$1,000. 00 500. 00
1, 500. 00 1, 500. 00 2,000. 00 1,000. 00 1,000. 00
500. 00 1,000. 00 1,000. 00
500. 00 1,000. 00 1,000. 00 1,100. 00 1,000. 00 3, 500. 00
11,000. 00 3, 700. 00 1, 000.00
$500. 00 1, 000. 00
500. 00 1, 000. 00
500. 00 11, 000. 00 11,000. 00 53, 000. 00
3, 000. 00 6,000. 00
1,000. 00 2, 000. 00 3, 000. 00 1, 000. 00 2, 000. 00
15,000. 00
td
Hd O td H8
O Hrl
fel
ZP
fel o td fel y ^ > td K|
o fel
M fel
td fel > ZP d td K!
Digitized for FRASER http://fraser.stlouisfed.org/ Federal Reserve Bank of St. Louis

4% C-1958 3,000.00 3,000.00 3M% A-1960... 1,000.00 1,000.00 4 ^ % C-1960.- - - 5,000.00 5,000.00 -. 4K%A-1961- - - 30,000.00 4,000.00 26,000.00 4 ^ % B-1961 - -- - 10,000.00 -- 10,000.00 3% A-1962- - - 1,000.00 1,000.00 334%!B-1963 - 9,000.00 - - - 9,000.00 33^% D-1963 - 17,000.00 17,000.00 334% B-1964 5,000.00 - 4,000.00 1,000.00 4M% A-1966... 40,000.00 40,000.00 534% A-1967 - - - . . . 52,000.00 47,000.00 5,000.00
Total certmcates of indebtedness 386,300.00 131,000.00 255,300.00
Treasury biUs, matm-ity date: June5, 1940 30,000.00 . . 30,000.00 Jan. 14, 1942 4,000.00 4,000.00 Feb.3,1943 1,000.00 1,000.00 ZP July29, 1954 . . 5,000.00 5,000,00 t^ May 19, 1955... 1,000.00 1,000.00 g Apr.24, 1958... 15,000.00 15,000.00 ffi Mayl5,1959 . . 1,000.00 1,000.00 ZP Sept.3,1959 20,000.00 . . . . 20,000.00 H Jan. 14, 1960 1,000.00 1,000.00 ^ July 15, 1960 11,000.00 11,000.00 > July 21, 1960 5,000.00 . . . 5,000.00 t"" July 28, 1960... 6,000.00 . . . 6,000.00 Aug. 4, 1960 12,000.00 12,000.00 > Aug. 11, 1960... 3,000.00 . 3,000.00 ^ Oct. 17, 1960 1,000.00 . . . 1,000.00 g Jan. 15, 1961 41,000.00 2,000.00 39,000.00 g Jan. 26, 1961 1,000.00 1,000.00 ^ July27, 1961 10,000.00 10,000.00 O Mar. 1, 1962 . . 7,000.00 . 7,000.00 '"' Nov. 21, 1963 22,000.00... 22,000.00 Jan. 15, 1964 . . 33,000.00 . . . . 33,000.00 Apr. 15, 1964 12,000.00... 12,000.00 June 11, 1964 5,000.00 5,000.00 Apr. 30, 1965 2 ,000 .00- . . 2,000.00 July8, 1965 1 60,000.00 60,000.00 July 22, 1965 40,000.00 40,000.00 Sept. 16, 1965 19,000.00 19,000.00 Sept.30, 1965 75,000.00 75,000.00 Mar. 10, 1966 25,000.00 . . . . . 25,000.00 Mar. 24, 1966 . 10,000.00 . 10,000.00 Apr.28,1966. . . 1,000.00 1,000.00 Mayl9,1966 11,000.00 . . '. 11,000.00 May 26, 1966 . . . 50,000.00 . . 50,000.00 June 16, 1966 2,000.00. 2,000.00
X
Footnotes at end of table. O l
Digitized for FRASER http://fraser.stlouisfed.org/ Federal Reserve Bank of St. Louis

M A T U R E
Treasury bi J u n e 23, J u l y 31, A u g . 4, Sept . 15 Sept . 22 Oct. 13, Oct. 20, N o v . 3, N o v . 30 Dec . 8, Dec . 15, Dec . 31, J a n . 12, J a n . 19, J a n . 26, F e b . 16, F e b . 23, M a r . 23, Mar . 30, Mar . 31, A p r . 6, A p r . 13, A p r . 20, A p r . 21, Apr . 27, Apr . 30, May 4, ] May 11, May 18, M a y 25, J u n e 8, '. J u n e 15, J u n e 22, J u n e 30, J u l y 3 ,1 J u l y 13, J u l y 27, J u l y 31,
T A B L E 33.—Changes in
Issues
D D E B T O N W H I C H I N T E R E S T H A S C E A S E D - C o n .
Us, m a t m i t y da to—Cont inued , 1966 1966
1966 ,1966 ,1966 1966 1966 1966 ,1966 1966
1966 1 9 6 6 . . . . 1967 1967 1967
,1967 ,1967 ,1967 ,1967 ,1967 1967 1967 1 9 6 7 . . . . 1967 1967 . 1967
L967 1967 1967 1967
1967 1967 1967 1967
.967 1967 1967 1967
puhlic debt issues, fiscal year 1970
O u t s t a n d i n g J u n e 30,1969 Issues du r ing year
$6,000.00 10,000.00 1,000.00
39,000.00 . 37,000.00 19,000.00 . 15,000.00 3,000.00 6,000.00 .
50,000.00 . . . . 8,000.00 . . 1,000.00
100,000. 00 . 3,000.00
37, 000. 00 . 2,000.00 .
11, 000. 00 . . 60,000.00 . 11,000.00 . . 10,000.00 4, 000. 00 . . . 1,000.00
63, 000. 00 18,000.00 4,000.00 .
100,000.00 . 5,000.00 1,000. 00
10,000.00 12,000.00 5,000.00
12,000. 00 25,000.00 30,000. 00 21,000.00 10,000. 00 24,000.00 . 60,000.00
—Continued
Transferred from interest-bear ing
deb t
R e d e m p t i o n s d m h i g year
$39,000.00 .. 32,000.00 12, 000.00
6,000.00 ..
3,000.00 ..
2,000.00 .. 10,000. 00 50,000.00 ..
3,000. 00 10,000. 00
10,000. 00
3,000. 00
10,000. 00
10,000.00 . .
10,000. 00
Ou t s t and ing J u n e 30,1970 i
$6,000. 00 10, 000. 00
1,000. 00
5,000. 00 7,000.00
15,000.00 3,000.00
50,000.00 8,000. 00 1,000.00
100,000. 00
37,000. 00
1,000. 00
11,000. 00 10,000.00 4,000. 00 1,000. 00
60,000. 00 8,000. 00 4,000. 00
100,000. 00 5,000. 00 1,000. 00
10,000. 00 2,000. 00 5,000. 00 9,000. 00
25,000. 00 20,000. 00 21,000. 00
24,000. 00 50,000. 00
I — l
CO
<r o td fel Hd o td H
o Hrl
I'T! W fel Ui fel o td fel H ^
> 4 o ^ H Hrl fel 1^
^ fel > ZP d td K|
Digitized for FRASER http://fraser.stlouisfed.org/ Federal Reserve Bank of St. Louis
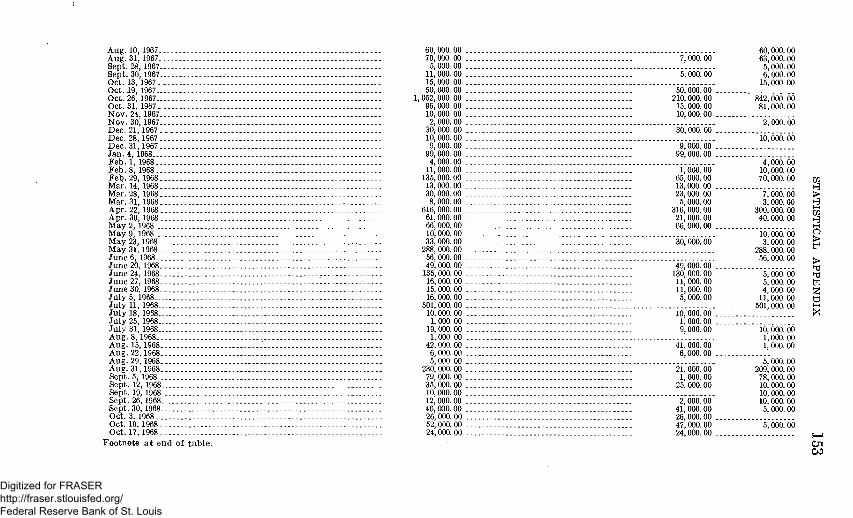
A u g . 10, 1967 '. 60,000.00 60,000.00 Aug . 31, 1967 70,000.00 7,000.00 63,000.00 Sep t .28 , 1967 5,000.00 5,000.00 Sept . 30, 1967 - 11,000.00 5,000.00 6,000.00 Oct. 13, 1967 15,000.00 15,000.00 Oct. 19, 1967 50,000.00 50,000.00 Oct. 26, 1967 1,052,000.00 210,000.00 842,006.6o O c t . 3 1 , 1967 96,000.00 . . . . 15,000.00 81,000.00 N o v . 2 4 , 1967 10,000.00 10,000.00 N o v . 3 0 , 1967 2,000.00 2,000.00 Dec.21,1967 30,000.00 30,000.00 Dec . 28, 1967 10,000.00 10,000.00 Dec.31,1967 9,000.00 9,000.00 J a n . 4 , 1968 99,000.00 99,000.00 F e b . 1, 1968 4,000.00 4,000.00 F e b . 8 , 1968 11,000.00 1,000.00 10,000.00 F e b . 2 9 , 1968 135,000.00 65,000.00 70,000.00 rp Mar. 14, 1 9 6 8 . . . 13,000.00 13,000.00 h^ Mai-.28,1968 30,000.00 23,000.00 7,000.00 > Mar. 31, 1968 8,000.00 5,000.00 3,000.00 H A.pr. 22, 1968 616,000.00 316,000.00 300,000.00 r^ A p r . 3 0 , 1968 61,000.00 21,000.00 40,000.00 H M a y 2 , 1 9 6 8 .'. 66,000.00 66,000.00 hn M a y 9, 1968 10,000.00 10, 000. 6o P May 23, 1968 33,000.00 30,000.00 3,000.00 May 31, 1968 288,000.00 288,000.00 J u n e 6, 1968 56,000.00 56,000.00 J u n e 2 0 , 1968 49,000.00 49,000.00 . M J u n e 2 4 , 1968 . 135,000.00 130,000.00 5,000.00 y^ J u n e 2 7 , 1968 . 16,000.00 11,000.00 5,000.00 fej J u n e 3 0 , 1968 15,000.00 11,000.00 4,000.00 ^ J u l y 5, 1968 16,000.00 5,000.00 11,000.00 M J u l y 11, 1968 501,000.00 501,000.00 H Ju ly 18,1968 10,000.00 10,000.00 M J u l y 25, 1 9 6 8 — . - . . 1,000.00 1,000.00 Ju ly 31, 1968 19,000.00 9,000.00 10,000.00 A u g . 8 , 1968 : 1,000.00 1,000.00 Aug . 15, 1968 . 42.000.00 41,000.00 1,000.00 A u g . 2 2 , 1968 6,000.00 6,000.00 Aug . 29, 1968 5,000.00 5, 000. 6o Aug. 31, 1968 230,000.00 21,000.00 209,000.00 Sept. 5, 1968 79,000.00 . 1,000.00 78,000.00 Sept . 12, 1968 35,000.00 25,000.00 10,000.00 Sept. 19, 1968 10,000.00 10,000.00 Sept . 26, 1968 12,000.00 2,000.00 10,000.00 Sep t .30 , 1968 46,000.00 41,000.00 5,000.00 O c t . 3 , 1 9 6 8 . . . 26,000.00 26,000.00 . Oct. 10. 1968 52,000.00 47,000.00 5, 66o. 00 Oct . 17, 1968 24,000.00 24,000.00 , _ i
Foo tno t e a t e n d of t a b l e . O i CO
>
Digitized for FRASER http://fraser.stlouisfed.org/ Federal Reserve Bank of St. Louis

T A B L E 33.—Changes in public debt issues, fiscal year 1970—Continued Ox
Issues Ou t s t and ing Transferred from Redempt ions O u t s t a n d h l g co J u n e 30, 1969 Issues d m i n g year interes t -bear ing dur ing year J u n e 30,1970 i <i
deb t o
M A T U R E D D E B T O N W H I C H I N T E R E S T H A S C E A S E D — C o n .
T r e a s u r y biUs, m a t m i t y d a t e — C o n t m u e d Oct. 24, 1968 Oct. 31, 1968 N o v . 7, 1968 Nov . 14, 1968 N o v . 21, 1968 N o v . 2 9 , 1968 N o v . 3 0 , 1968 D e c . 5 , 1968 Dec . 12, 1968 Dec . 19, 1968 Dec . 26, 1968 D e c . 3 1 , 1968 J a n . 2 , 1969 J a n . 9, 1969 J a n . 16, 1969 J a n . 23, 1969 J a n . 30, 1969 J a n . 31, 1969 F e b . 6, 1969 F e b . 13, 1959 F e b . 20, 1969 F e b . 27, 1969 F e b . 28, 1969 Mar. 6, 1969 /. Mar. 13, 1969 Mar. 20, 1969 Mar .24 , 1969 Mar. 27, 1969 M a r . 3 1 , 1969 Apr . 3, 1969 Apr . 10, 1969 A p r . 17, 1969 Apr . 22, 1969 A p r . 2 4 , 1969 A p r . 30, 1969 May 1, 1969 May 8, 1969
$19,000.00 $7,000.00 139,000.00 139,000.00 31,000.00 - 31,000.00 158,000.00 158,000.00 203,000.00 143,000.00 12, 000. 00 12, 000. 00
168,000.00 20,000.00 60,000.00 33,000.00 124,000.00 124,000.00 113,000.00 48,000.00 30,000.00 26,000.00
202,000.00 168,000.00 54,000.00 38,000.00 61,000.00 61,000.00 121,000.00 119,000.00 162,000.00 - 162,000.00 203,000.00 200,000.00 134,000.00 111,000.00 68,000.00 65,000.00 10,000.00 57,000.00 52,000.00
1,092,000.00 1,084,000.00 327,000.00 253,000.00 351,000.00 221,000.00 201,000.00 131,000.00 329,000.00 311,000.00 485,000.00 484,000.00 41,000.00 - - 31,000.00 191,000.00 191,000.00 113,000.00 68,000.00 310,000.00 253,000.00 468,000.00 442,000.00
15,515,000.00 15,190,000.00 678,000.00 617,000.00 462,000.00 438,000.00 701,000.00 700,000.00 405,000.00 300,000.00
td fel Hd o
$12,000. 00 ^ y ^
o 66,666.66 ^
i48,'666.'66 ^ 27, 000. 00 hP
65,666.66 4, 000. 00 g 34, 000. 00 ^ 16, 000. 00 y
" "§,'666.'66 ^ > td Kj
3, 000. 00 23, 000. 00 3, 000. 00
10, 000. 00 5, 000. 00 8, 000. 00
74, 000. 00 130, 000. 00 70, 000. 00 18, 000. 00 1, 000. 00
10, 000. 00
45, 000. 00 57, 000. 00 26, 000. 00
325, 000. 00 61, 000. 00 24, 000. 00 1, 000. 00
105, 000. 00
O fel
H^
M fel
H^ td fel > ZP d td Kl
Digitized for FRASER http://fraser.stlouisfed.org/ Federal Reserve Bank of St. Louis

May 15, 1969.. — . 520,000.00 . 460,000.00 60,000.00 May 22, 1969 736,000.00 - - 718,000.00 18,000.00 May29, 1969 894,000.00 - 845,000.00 49,000.00 May 31, 1969 776,000.00 722,000.00 54,000.00 June5, 1969 1,252,000.00 -.- 1,244,000.00 8,000.00 June 12, 1969 - - 3,619,000.00 3,619,000.00 . . . -June 19, 1969-.- - - 3,478,000.00 3,430,000.00 48,000.00 June23, 1969 12,488,000.00 - 12,043,000.00 445,000.00 June 26, 1969 - 11,109,000.00 11,030,000.00 79,000.00 June30, 1969 - - 57,001,000.00 56,903,000.00 98,000.00 July 3, 1969 $54,000.00 54,000.00 July 10, 1969 . - . - - - -- 123,000.00 123,000.00 July 17, 1969 - -- 108,000.00 - - 108,000.00 July 24, 1969 - 42,000.00 42,000.00 July 31, 1969 - -- 45,000.00 45,000.00 Aug. 7, 1969 - - - 73,000.00 73,000.00 Aug. 14, 1969 - . 34,000.00 . . . . . 34,000.00 ZP Aug! 2 1 , _ 1 9 6 9 ' . ' . - - I - - " ' ' I - - - - " " I - " ' - - ' ' - I - - i5 ',00a00 - " - - - - - ' ' - - " 19 'OOo! 00 g
y ^ Aug. 28, 1969 230,000.00 230,000.00 Sept. 4, 1969 492,000.00 492,000.00 Sept. 11, 1969 56,000.00 56,000.00 'ZP Sept.25,1969 . . . 1,049,000.00 1,049,000.00 t^ Sept. 30, 1969 35,000.00 35,000.00 ^ Oct. 2, 1969 .- 49,000.00 - -._ 49,000.00 > Oct. 9, 1969 -- 1,222,000.00 1,222,000.00 p Oct. 16, 1969 36,000.00 36,000.00 Oct. 23, 1969 27,000.00 27,000.00 > Oct. 30, 1969 - . _ 34,000.00 34,000.00 Hd Oct. 31, 1969 - 86,000.00 86,000.00 2 Nov. 6, 1969 - — -..- 73,000.00 73,000.00 g Nov. 13, 1969 - - 54,000.00 - 54,000.00 ^ Nov. 20, 1969 - 57,000.00 57,000.00 O Nov. 28, 1969 _ - 124,000.00 124,000.00 H Nov. 30, 1969 141,000.00 141,000.00 " Dec. 4, 1969 20,000.00 20,000.00 Dec. 11, 1969 49,000.00 49,000.00 Dec. 18, 1969 : 2,093,000.00 2,093,000.00 Dec. 22, 1969 30,000.00 30,000.00 Dec. 26, 1969 23,000.00 23,000.00 Dec. 31, 1969 - - 129,000.00 129,000.00 Jan. 2, 1970 — 125,000.00 125,000.00 Jan. 8, 1970 251,000.00 251,000.00 Jan. 15, 1970 201.000.00 201,000.00 Jan. 22, 1970 --. 264,000.00 264,000.00 Jan. 29, 1970 125.000.00 125,000.00 Jan. 31, 1970 194,000.00 194.000.00
Footnotes at end of table I — A
Ol Ol
Digitized for FRASER http://fraser.stlouisfed.org/ Federal Reserve Bank of St. Louis
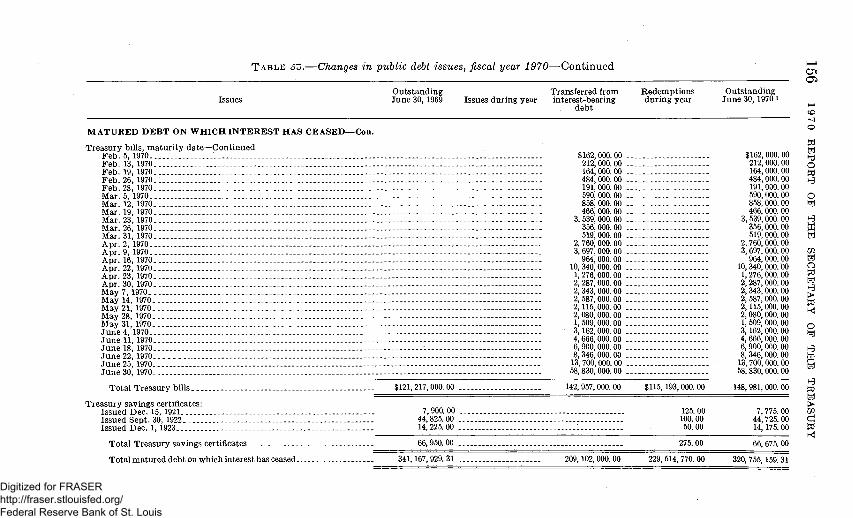
T A B L E SO.—Changes in public debt issues, fiscal year ./^70—Continued
O u t s t a n d i n g Transferred frora Rede rap t ions Ou t s t and ing Issues J u n e 30,1969 Issues dm-ing year interest-bearing d m m g year J u n e 30,19701
deb t
J u n e 30, 1970 . 58,830,000.00 58,830,000.00
To ta l T r e a s m y savings ce r t i f i ca tes . . .
To ta l m a t u r e d deb t o n w h i c h interest has ceased.
7,900.00 .. 44,825.00 14,225.00 ..
66,950.00 ..
341,167,929.31 209,102,000.00
125. 00 100. 00 50. 00
275. 00
229, 514, 770. 00
7, 775. 00 44, 725. 00 14 175 00
66, 675. 00
320,755, 159. 31
O l
M A T U R E D D E B T O N W H I C H I N T E R E S T H A S C E A S E D - C o n . td
T r e a s u r y biUs, m a t m i t y da t e—Cont inued HH F e b . 5, 1970 ' $162,000.00 $162,000.00 LJ F e b . 13, 1970 . 212,000.00 212,000.00 Q F e b . 19, 1970 164,000.00 164,000.00 HJJ Feb. 26, 1970.: 484,000.00 484,000.00 ^ Feb. 28, 1970 191,000.00 191,000.00 Mar. 5, 1970 590,000.00 590,000.00 Q Mar. 12, 1970 858,000.00 858,000.00 fel. Mar. 19, 1970 . 466,000.00 466,000.00 Mar. 23, 1970 . . 3,539,000.00 3,539,000.00 H Mar . 26, 1970. . 356,000.00 356,000.00 |lj Mar . 31, 1970 519,000.00 519,000.00 fel A p r . 2, 1970 2,760,000.00 2,760,000.00 A p r . 9, 1970 . . . 3,697,000.00 3,697,000.00 ZP A p r . 16, 1970 . : 964,000.00 964,000.00 fel Apr .22 ,1970 . 10,340,000.00 10,340,000.00 Q Apr. . 23, 1970 . . 1,276,000.00 1,276,000.00 g Apr .30 ,1970 . 2,287,000.00 2,287,000.00 g M a y 7 , 1 9 7 0 2,343,000.00 2,343,000.00 t^ May 14, 1976 . . 2,587,000.00 2,587,000.00 g May 21, 1970 2,115,000.00 2,115,000.00 Z May 28 1970 . . . - 2,080,000.00 2,080,000.00 ^ May31 ,1970 ' 1,509,000.00 1,509,000.00 ^ J u n e 4 , 1970 " 3,162,000.00 3,162,000.00 )^ J u n e 11, 1976 . 4,666,000.00 4,666,000.00 J u n e 18 1970 . . - •- 6,900,000.00 6,900,000.00 ^ J u n e 2 2 , 1970 . 8,346,000.00 8,346,000.00 M J u n e 2 5 , 1970" 13,700,000.00 13,700,000.00 g
H Tota l T r e a s m y bills $121,217,000.00 142,957,000.00 $115,193,000.00 148,981,000.00 ^
= fel T r e a s u r y savings certificates: >
Issued Dec . 15, 1921. 7,900.00 125.00 7,775.00 ZP Issued Sept . 30, 1922 44,825.00 100.00 44,725.00 d Issued Dec . 1, 1923 14,225.00 50.00 14,175.00 td
y <
Digitized for FRASER http://fraser.stlouisfed.org/ Federal Reserve Bank of St. Louis
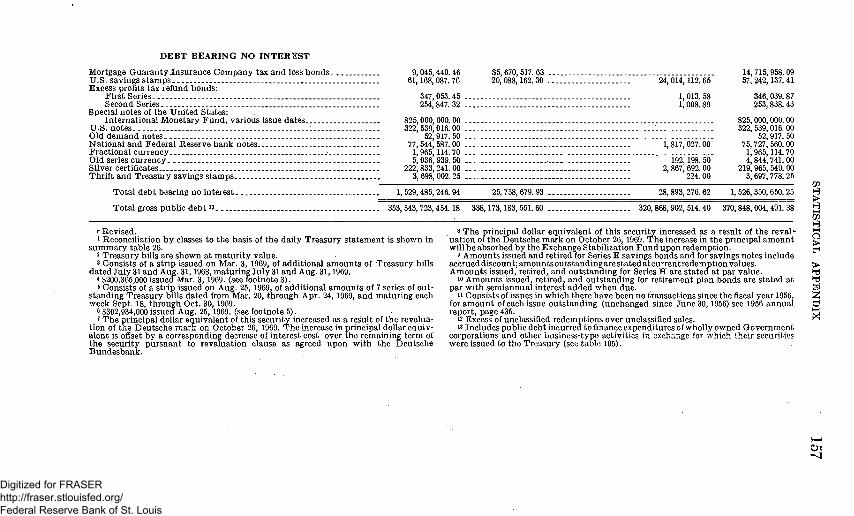
DEBT BEARING NO INTEREST
Mortgage Guaranty Insurance Corapany tax and loss bonds . U.S. savings s tamps. . Excess profits tax refund bonds:
First Series _ Second Series
Special notes of the United States: International Monetary Fund, various issue dates
U.S. notes . Old deraand notes National and Federal Reserve bank notes Fractional currency .-.. Old series currency Silver certificates .--Thrift and Treasm-y savings stamps --
9, 045, 440. 46 61,168, 087. 76
347,053.45 . 254,847.32 .
825,000,000.00 . 322,539,016.00 .
52,917.50 . 77,544,587.00 . 1,965,114.70 . 5,036,939.50 .
222,833,241.00 . 3,698,002.25 .
$5,670,517.63 20, 088,162. 30 . 24, 014,112. 65
1, 013. 58 1,008.89
1, 817, 027. 00
192,198. 50 2, 867, 692. 00
224. 00
14, 715, 958. 09 57.242,137.41
346,039. 87 253,838. 43
825, 000, 000. 00 322, 539, 016. 00
52, 917. 50 75, 727, 560. 00 1,965,114. 70 4, 844, 741. 00
219, 965, 549. 00 3, 697,778. 25
Total debt bearing no interest- 1, 529,485, 246. 94 25, 758, 679. 93 28, 893,276. 62 1, 526, 350, 650. 25 ZP
To ta l gross publ ic deb t 13 _ _ 353,543,723,454.18 338,173,183, 55L 60 . - 320,868,902,514.40 370. 848, 004, 49L 38 J;; ZP H^. hH O >
> yn Hd fel
»• Revised . 1 ReconcUiation by classes to the basis of the daily Treasury statement is shown in
summary table 26. 2 Treasury bills are shown at maturity value.' 3 Consists of a strip issued on Mar. 3, 1969, of additional amounts of Treasury bills
dated July 31 and Aug. 31,1968, maturing July 31 and Aug. 31,1969. 4 $200,365,000 issued Mar. 3, 1969. (see footnote 3). 6 Consists of a strip issued on Aug. 25, 1969, of additional araounts of 7 series of out
standing Treasury bUls dated frora Mar. 20, through Apr. 24, 1969, and raaturing each week Sept. 18, through Oct. 30, 1969.
6 $302,934,000 issued Aug . 25, 1969. (see footnote 5). 7 The principal dollar equivalent of this security increased as a result of the revalua
tion of the Deutsche mark on October 26, 1969. The increase in principal dollar equivalent is offset by a corresponding decrease of interest cost over the remaining term of the security pursuant to revaluation clause as agreed upon with the Deutsche Bundesbank.
8 The principal dollar equivalent of this security increased as a result of the revaluation of the Deutsche mark on October 26, 1969. The increase in the principal amount will be absorbed by the Exchange Stabilization Fund upon rederaption.
9 Araounts issued and retired for Series E savings bonds and for savings notes include accrued discount; araounts outstanding are stated at current rederaption values. Amounts issued, retired, and outstanding for Series H are stated at par value.
10 Amounts issued, retired, and outstanding for retireraent plan bonds are stated at par with semiannual interest added when due.
11 Consists of issues in which there have been no transactions since the fiscal year 1956, for araount of each issue outstanding (unchanged since June 30,1956) see 1956 annual report, page 435.
12 Excess of unclassmed rederaptions over unclassmed sales. 13 Includes public debt incurred to finance expenditures of whoUy owned Government
corporations and other business-type activities in exchange for v/hich their securities were issued to the Treasury (see table 105).
O l
Digitized for FRASER http://fraser.stlouisfed.org/ Federal Reserve Bank of St. Louis
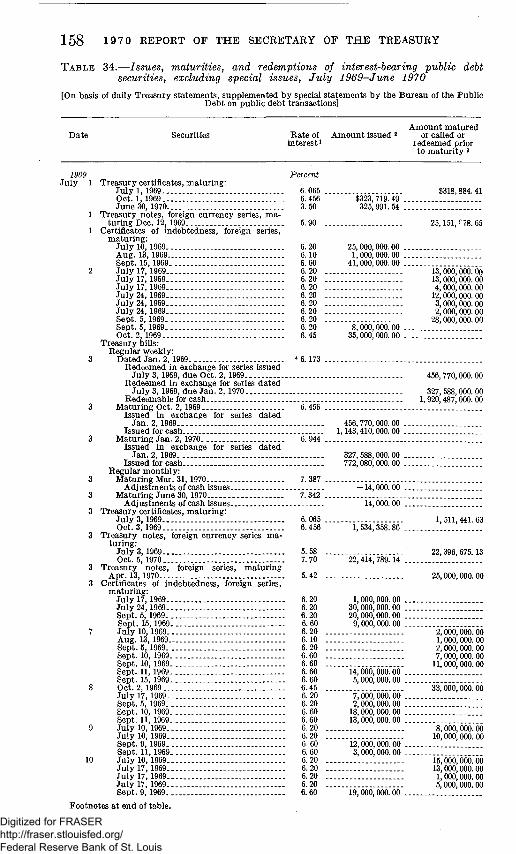
158 19 70 REPORT OF THE SECRETARY OF THE TREASURY
TABLE 34.—Issues, maturities, and redemptions of interest-bearing public debt securities, excluding special issues, July 1969-June 1970
[On basis of daUy Treasu ry s ta teraents , suppleraented b y special s ta tements b y t he Bureau of t he Pub l ic D e b t on publ ic deb t t ransactions]
D a t e Securities R a t e of interest i
A m o u n t issued 2 A m o u n t m a t u r e d
or caUed or redeemed prior
to m a t u r i t y 3
Ju ly 1 T r e a s u r y certificates, ma tu r ing : J u l y l , 1969 -Oct. 1,1969 J u n e 30,1970
1 T r e a s u r y notes, foreign cur rency series, raat u r m g Dec . 12, 1969
1 Certificates of indebtedness , foreign series, m a t u r i n g :
J u l y 10, 1969 A u g . 13, 1969 Sept . 15, 1969
2 J u l y 17, 1969 J u l y 17, 1969 J u l y 17,1969 J u l y 24, 1969 1 J u l y 24, 1969 J u l y 24, 1969 Sept . 6, 1969-Sept . 5, 1969 Oct. 2, 1969
T r e a s u r y bills: Regula r weekly:
3 D a t e d J a n . 2,1969 Redeemed in exchange for series issued
J u l y 3,1969, due Oct. 2 ,1969.-Redeemed in exchange for series da t ed
J u l y 3, 1969, due J an . 2,1970 Redeemable for cash
3 Maturu ig Oct. 2, 1969 -Issued in exchange for series da ted
J an . 2, 1969---Issued for cash
3 Ma tu r ing J an . 2, 1970 - . -Issued in exchange for series da ted
J an . 2,1969 Issued for cash
Regula r m o n t h l y : 3 Matu rh ig Mar. 31,1970
Ad jus tmen t s of cash issues 3 Ma tu rh ig J u n e 30, 1970
Ad jus tmen t s of cash issues 3 T rea su ry certificates, m a t u r i n g :
J u l y 3, 1969 Oct. 3, 1969
3 T r e a s u r y notes , foreign currency series m a t u r i n g :
J u l y 3,1969 Oct. 6 ,1970.
3 T rea su ry notes , foreign series, m a t u r m g A p r . 13, 1970
3 Cer tmcates of indebtedness , foreign series, m a t u r m g :
J u l y 17, 1969 -J u l y 24,1969 Sept . 5, 1969 Sept . 15,1969 -
7 J u l y 10, 1969 A u g . 13, 1969 -Sept . 6,1969 Sept . 10, 1969 Sept . 10, 1969 Sept . 11, 1969 Sept . 15, 1969
8 Oct. 2, 1969 . -J u l y 17, 1969 . - -Sept . 5, 1969 Sept . 10, 1969 Sept. 11, 1969
9 J u l y 10, 1969 - - - -J u l y 10, 1969 Sept . 9, 1969 Sept . 11,1969
10 J u l y 10, 1969. J u l y 17,1969 J u l y 17, 1969 J u l y 17, 1969 Sept . 9,1969
Percent
6. 065 . 6.456 3.50
$323,719.49 325, 991. 54
$318,884. 41
6.20 6.10 6.60 6.20 6.20 6.20 6.20 6.20 6.20 6.20 6.20 6.45
4 6.173 .
25,000,000. 00 . 1,000,000. 00 .
41,000, 000. 00 .
8,000,000.00 . 35,000,000. 00 .
1.944 ,
456,770,000.00 . 1,143,410,000. 00 .
327,588,000.00 . 772,080,000. 00 .
7.387
"7."342". -14,000.00 .
"14; 666'66"'
25,151, r 78. 65
13,000,000. 00 13,000,000. 00 4,000,000. 00
12,000,000. 00 3,000,000. 00 2,000,000.00
28,000,000. 00
456,770,000. 00
327, 588,000. 00 1, 920,487,000. 00
6.065 ... 6.456
5.58 .. 7.70
5.42 ..
6.20 6.20 6.20 6.60 6.20 6.10 .. 6.20 .. 6.60 .. 6.60 .. 6.60 6.60 6.45 .. 6.20 6.20 6.60 6.60 6.20 .. 6.20 .. 6.60 6.60 6.20 .. 6.20 .. 6.20 .. 6.20 .. 6.60
1,534,358.86 ...
22,414,789.14 ...
1,000,000. 00 . . 30,000,000.00 ... 20,000,000.00 ... 9,000,000.00 . .
14,000,000.00 ... 5,000,000.00 ...
7,000,000.00 ... 2,000,000.00 ... 18,000,000.00 ... 13,000,000.00 ..
12,000,000.00 ... 3,000,000.00 ...
19.000.000.00 ...
1, 511,441. 63
22,396, 675.13
25,000,000. 00
2,000,000. 00 1,000,000. 00 2,000,000. 00 7, 000,000. 00 11,000,000.00
33,000,000. 00
8,000,000. 00 10,000 000 00
15,000,000 00 13, 000,000.00 1,000,000.00 6,000,000. 00
Footnotes a t end of table .
Digitized for FRASER http://fraser.stlouisfed.org/ Federal Reserve Bank of St. Louis
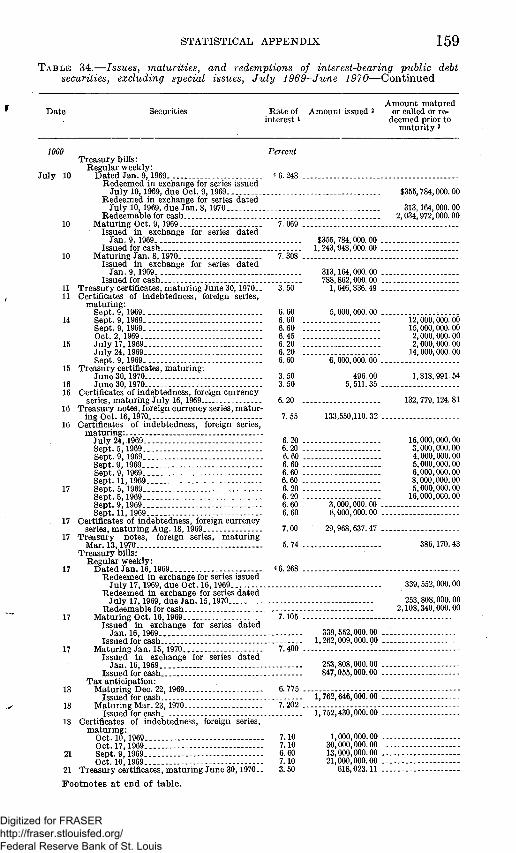
STATISTICAL APPENDIX 159
T A B L E 34.—Issues, maturities, and redemptions of interest-bearing public debt securities, excluding special issues, Ju ly 1969-Ju-ne 1970—Continued
Date Secm-ities Rate of interest i
Amount issued 2 Aniount matmed
or called or redeemed prior to
maturity 3
July 10
10
10
17
17
18
Percent Treasury bills:
Regular weekly: Dated Jan. 9, 1969 "6.248 .
Redeemed in exchange for series issued July 10, 1969, due Oct. 9,1969
Redeemed in exchange for series dated July 10, 1969, due Jan. 8,1970...
Redeemable for cash Maturmg Oct. 9, 1969 7.069 .
Issued in exchange for series dated Jan. 9, 1969
Issued for cash -Maturing Jan. 8,1970 - . . 7. 308 .
Issued in exchange for series dated Jan. 9, 1969
Issued for cash Treasury certificates, maturing June 30, 1970.. Certmcates of indebtedness, foreign series,
maturing: Sept. 9, 1969 6.60 Sept. 9, 1969 6.60 . Sept. 9, 1969 6.60 . Oct.2,1969 6.45 . July 17, 1969 6.20 . July 24, 1969 6.20 . Sept. 9, 1969 6.60
Treasury certificates, maturing: June 30,1970 3. 50 June 30,1970 3.50
Certificates of indebtedness, foreign cmrency series, maturing July 16, 1969.... 6.20 .
Treasm-y notes, foreign cm-rency series, maturing Oct. 16,1970 7. 55
Certmcates of indebtedness, foreign series, maturing: _
July24,,1969 6.20 . Sept.5,i969 6.20 . Sept.9,1969 6.60 . Sept.9,1969-- - 6.60 . Sept.9,1969-- - 6.60 . Sept. 11,1969-- - . . - - 6.60 . Sept. 5,1969.- - 6.20 . Sept.5,1969 - . . 6.20 . Sept.9,1969 6.60 Sept. 11,1969 6.60
Certmcates of mdebtedness, foreign currency series, maturing Aug. 18,1969. 7.00
Treasury notes, foreign series, maturing Mar. 13,1970-.-- 5.74 .
Treasmy bills: Regular weekly:
Dated Jan. 16,1969 46.268 . Redeemed in exchange for series issued
July 17,1969, due Oct. 16,1969.. Redeemed in exchange for series dated
July 17,1969, due Jan. 15,1970 Redeemable for cash
Matmmg Oct. 16,1969 7.105 . Issued in exchange for series dated
Jan. 16,1969 - - . . . Issued for cash
Maturing Jan. 15,1970... 7.400 . Issued in exchange for series dated
Jan. 16,1969 -Issued for cash
Tax anticipation: Matming Dec. 22,1969 - . . 6.775 .
Issued for cash -MaturingMar. 23,1970... 7.202 .
Issued for cash Certificates of mdebtedness, foreign series,
maturing: Oct. 10,1969 7.10 Oct. 17,1969.- --- 7.10 Sept.9,1969 6.60 Oct. 10,1969 7.10
Treasmy certmcates, matming June 30,1970-. 3.50
$355,784,000. 00 . 1,243,948,000. 00 .
313,164,000.00. 788,862,000.00 .
3.50 1,646,836.49 .
5,000,000.00 .
6, 000,000. 00 .
496. 00 5, 511. 35 .
133,550,110. 32 .
3,000,000.00 . 8,000,000.00 .
29,968,637.47 .
$355,784,000. 00
313,164,000. 00 2,034,972,000. 00
339,552,000.00 . 1,262,009,000.00 .
253,808,000.00 847,055,000.00
1,762,646,000.00 .
'ii752;436i666'66';
21
Footnotes a t end of table.
1,000,000.00 . 30,000,000.00 . 13,000,000.00 . 21,000,000.00 .
618,023.11 .
12,000,000. 00 15,000,000. 00 2,000, 000. 00 2,000, 000. 00
14,000,000. 00
1,818,991.54
132,779,124. 81
16,000,000.00 3,000,000.00 4,000,000.00 5,000,000.00 6,000,000.00 8.000,000.00 5,000,000.00
16,000,000.00
386,170.43
339,552,000.00
253,808,000.00 2,108,340,000.00
Digitized for FRASER http://fraser.stlouisfed.org/ Federal Reserve Bank of St. Louis
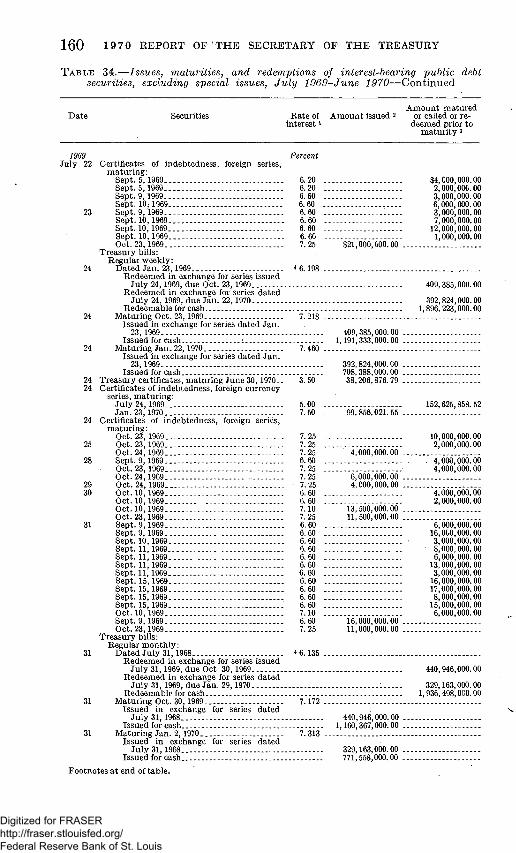
160 19 70 REPORT O F ' T H E SECRETARY OF THE TREASURY
T A B L E 34.—Issues, maturities, and redemptions of interest-bearing public debt securities, excluding special issues, Ju ly 1969-June 1970—Continued
D a t e Securities R a t e of interest i
Araoun t issued 2 A m o u n t m a t u r e d
or called or redeemed prior to
matm-i ty 3
1969 Ju ly 22
23
24
24
24
Certificates of indebtedness , foreign series, raaturing:
Sept . 5 ,1969 . . Sept .5 ,1969 Sept .9 ,1969 Sept . 10; 1969 Sept .9 ,1969 Sept . 10,1969. Sept . 10,1969 Sept . 10,1969 Oct. 2 3 , 1 9 6 9 . . .
T reasu ry bUls: Regular weekly :
D a t e d J a n . 23,1969 Redeemed in exchange for series issued
Ju ly 24,1969, due Oct. 23,1969 Redeemed in exchange for series da t ed
Ju ly 24, 1969, due J a n . 22,1970 Redeemable for cash
Matur ing Oct . 23,1969 Issued in exchange for series da ted J a n .
23,1969 Issued for cash 1
Matur ing J an . 22,1970 Issued in exchange for series da ted J a n .
23,1969- - - - . I ssued for cash
24 T rea su ry certificates, n ia tu r ing J u n e 30,1970. . 24 Certificates of indebtedness , foreign currency
series, raaturing: .July 24, 1969 J a n . 2 3 , 1 9 7 0 . . .
24 Certificates of indebtedness , foreign series, m a t u r i n g :
Oct . 23,1969 25 Oct . 23,1969
Oct . 24,1969 28 Sep t .9 ,1969-
Oct . 23,1969 Oct . 24,1969
29 Oct . 24,1969 30 Oct . 1 0 , 1 9 6 9 . . .
Oct . 1 0 , 1 9 6 9 . . . Oct . 10,1969 Oct . 23,1969 Sept .9 ,1969 Sept .9 ,1969 Sept . 10,1969 Sept . 11,1969 Sept . 11,1969 Sept . 11,1969 Sept . 11,1969 Sept . 1 5 , 1 9 6 9 . . . Sept . 15,1969 -Sept . 15,1969. . - -Sept . 15,1969 .' Oct . 10,1969 Sept .9 ,1969 Oct . 23,1969
T r e a s m y bills: Regular m o n t h l y :
D a t e d J u l y 31,1968 Redeemed in exchange for series issued
Ju ly 31,1969, due Oct. 30,1969 Redeemed in exchange for series da ted
Ju ly 31, 1969, due J an . 29,1970 Redeemable for cash
Matur ing Oct. 30,1969 Issued in exchange for series da ted
Ju ly 31,1968 Issued for cash
Matur ing J a n . 2,1970 Issued in exchange for series da ted
J u l y 31 ,1968 . . Issued for cash
Percent
6.20 6.20 6.60 6.60 6.60 6.60 6.60 6.60 7.25 $21,000,000.00
7.218 .
7.460
409,385,000.00 1,191,333,000.00
392,824,000.00 . 708,388,000.00 .
3.50 38,206,876.79 .
31
31
31
31
5.00 7.50
7.25 7.25 7.25 6.60 7.25 7.25 7.25 6.60 6.60 7.10 7.25 6.60 6.60 6.60 6.60 6.60 6.60 6.60 6.60 6.60 6.60 6.60 7.10 6.60 7.25
4 6.135
99,856,021.55 .
4,000,000.00
6,000,000.00 . 4,000,000.00
13,500,000.00 . 11,500,000.00 .
16,000,000.00 . 11,000,000.00
7.313
440,946,000.00 . 1,160,367,000.00 .
329,163,000.00 . 771,558,000.00 .
$4,000,000.00 2,000,000.00 3,000,000.00 6,000,000.00 3,000,000.00 7,000,000.00
12,000,000.00 1,000,000.00
409,385,000.00
392,824,000.00 1,896,223,000.00
152,625,858.52
10,000,000.00 2,000,000.00
."4,'666,'666.'66 4,000,000.00
4.000,000.00 2,000,000.00
6,000, 16,000 3,000 8,000, 6,000,
13,000, 3,000,
16,000, 17,000, 8,000,
15.000, 6,000,
000.00 000.00 000.00 000.00 000.00 000.00 000.00 000.00 000.00 000.00 000.00 000.00
440,946,000.00
329,163,000.00 1,936,498,000.00
Footnotes a t end of t ab le .
Digitized for FRASER http://fraser.stlouisfed.org/ Federal Reserve Bank of St. Louis
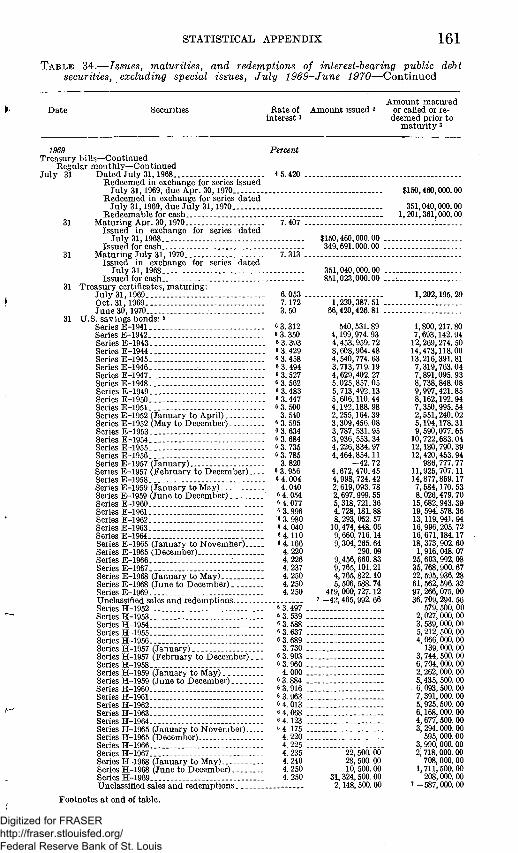
STATISTICAL APPENDIX 161
T A B L E 34.—Issues, maturities, and redemptions of interest-bearing public debt securities, excluding special issues, Ju ly 1969-June 1970—Continued
Date Securities Rate of interest i
Amount issued 2 Araount matm-ed
or caUed or redeemed prior to
maturity 3
Treasury biUs—Continued Regular monthly—Continued
July 31
31
31
Dated July 31,1968. Redeemed in exchange for series issued
July 31,1969, due Apr. 30,1970 Redeemed in exchange for series dated
July 31,1969, due July 31,1970 Redeemable for cash
Maturing Apr. 30,1970 Issued in exchange for series dated
July 31,1968-Issued for cash
Maturing July 31,1970 Issued in exchange for series dated
July 31,1968 Issued for cash
Treasury certificates, maturing: July 31,1969.-Oct. 31,1969 June 30,1970 :
U.S. savings bonds: & Series E-1941 . - . SeriesE-1942 -Series E-1943-SeriesE-1944 Series E-1945 SeriesE-1946. Series E-1947 Series E" 1948 Series E-1949 Series E-1950... Series E-1951. Series E-1952 (January to AprU) Series E-1952 (May to December) Series E-1953 Series E-1954 _ Series E-1955-Series E-1956 Series E-1957 (January) Series E-1957 (February to Deceraber) Series E-1958 Series E-1959 (January to May) Series E-1959 (June to Deceraber) Series E-1960 Series E-1961 SeriesE-1962 SeriesE-1963 Series E-1964 Series E-1965 (January to November) Series E-1965 (Deceniber) Series E-1966 Series E-1967 Series E-1968 (January to May) Series E-1968 (June to December) Series E-1969 Unclassified sales and redemptions SeriesH-1952 Series H-1953 Series H-1954 _ SeriesH-1955 -Series H-1956 Series H-1957 (January) Series H-1957 (February to December). _-Series H-1958 Series H-1959 (January to May) Series H-1959 (June to Deceraber) SeriesH-1960 SeriesH-1961 . -SeriesH-1962 SeriesH-1963 SeriesH-1964 Series H-1965 (January to November) Series H-1965 (Deceraber) SeriesH-1966 SeriesH-1967.-Series H-1968 (January to May) Series H-1968 (June to Deceraber) Series H-1969 Unclassified sales and rederaptions
Percent
4 5.420 .
7.407 .
$150,460,000.00
351,040,000.00 1,201,361,000.00
7. 313 .
$150,460,000.00 . 349,691,000.00 .
6.053 7.172 3.50
6 3.312 6 3. 350 6 3. 393 6 3.429 6 3.458 6 3. 494 6 3. 527 6 3. 562 6 3. 483 6 3.447 6 3.500 3.540
6 3. 595 6 3. 634 6 3.684 6 3. 735 Q 3.785 3.820
6 3. 956 6 4.004 4.040 6 4.054 6 4. 077 9 3. 996 6 3. 980 fi 4. 040 6 4. n o 8 4.166
4.220 4.226 4.237 4.250 4.250 4.250
8 3. 497 6 3. 539 6 3. 588 6 3. 637 6 3. 689
3.730 fi 3. 903 fi 3. 960
4.000 6 3. 884 6 3. 916 6 3. 963 6 4. 013 6 4. 068 6 4.123 0 4.175
4.220 4.225 4.235 4.240 4.250 4.250
351,040,000.00 851,023,000.00 .
1,220,387.51 66,420,426.81 .
540,531.89 4,199,974. 93 4,453, 959. 72 8,608,964.48 4,540,774. 63 3,713,719.19 4,629,402.27 5.025,857.05 5,713,492.13 5,606,110.44 4,192,188. 98 2,255,164. 39 3,309,456.08 3,787,531.95 3,936,553.34 4,226,834.97 4,464.854.11
-42. 72 4,672,470.45 4,998, 724.42 2,619,093.78 2,697,999. 55 5,318,72L36 4,728,181.88 8,293, 052. 57 10.474,448.06 9,660, 716.14 9,304,265. 64
290. 09 9,456,660.83 9, 765,101. 21 4, 765,822.10 5,506, 588. 74
419, 000, 727.12 7 -42,465, 992. 66
22, 500. 00 28, 500. 00 10, 500. 00
31,324, 500. 00 2,148, 500. 00
1,800,217. 80 7,693,142. 94 12,269,274.50 14,473,118.00 13,216,39L81 7,319,763.04 7,891,095.93 8,738,848.08 9,997,421.85 8,162,192.94 7,350,995.54 2,551,240.02 5,194,178.31 9,590,077.65 10,722,683.04 12,180,790.39 12,420,453.94
986,777.77 11,925,707.11 14,877,859.17 7.684,170. 53 8,026,479.70 15,682,943.39 19, 594,578. 36 13,119,941. 94 16,996,205. 72 16,671,184.17 18,373,902.60 1,916,048. 07
25, 603,992. 08 35, 768,900. 67 22, 595, 936. 28 61, 562, 596. 32 97,266, 075. 00 36, 709,294. 56
579, 500. 00 2, 027, 000. 00 3,539, 000. 00 5,212, 500. 00 4, 066, 000. 00
139, 000. 00 3, 744, 500. 00 6,704,000. 00 2,262, 000. 00 5,435, 500. 00
. 6, 093,500. 00 7,391,000. 00 5, 925,500. 00 6,168, 000. 00 4,677,500. 00 3, 294,000. 00
595,000. 00 3, 990, 000. 00 2,718, 000. 00
708, 000. 00 1,711,500. 00 208,000. 00
7-587,000.00
Footnotes at end of table.
Digitized for FRASER http://fraser.stlouisfed.org/ Federal Reserve Bank of St. Louis

162 19 70 REPORT OF THE SECRETARY OF THE TREASURY
TABLE 34.—Issues, maturities, and redemptions of interest-bearing public debt securities,' excluding special issues, July 1969-June 1970—Continued
D a t e
1969 Ju ly 31
31 31 31 31
31 31
Aug . 1
4
4
5
6
6 6
7
7
7
7
7
8 8
11
Securities
U . S . savings notes:* Series S-1967--Series S-1968 ( January to May) . . - . Series S-1968 ( June to Deceraber) - - -Series S-1969 . -Unclassified -
U.S . re t i rement p lan bonds - - _--Deposi ta ry bonds . Firs t Series --Treasury bonds , R E A Series Treasu ry bonds . I n v e s t m e n t Series B-1975-80-
Redeeraed in exchange for 13^% Treasury notes, Series EA-1974
Treasury notes, Series EA-1974 Miscellaneous
To ta l J u l y - . . . . . . . . .
Certificates of indebtedness , foreign series, matur ing:
Sept. 15, 1969 Oct. 10, 1969 Sept. 15, 1969 Oct. 10, 1969 . . .
T reasury certmcates, ma tu r ing J u n e 30, 1970.. T reasu ry bills:
Regular weekly: Matur ing J an . 29,1970
Adjus tments of cash issues Certificates of indebtedness , foreign series,
ma tu r ing : Oct. 10,1969 Oct. 10, 1969 Oct. 17, 1969 Sept. 11, 1969.-Sept. 15, 1969 Sept. 16, 1969. Oct. 10, 1969-.-Sept. 16, 1969
Cer tmcates of indebtedness , foreign currency series, ma tu r ing :
Aug . 6, 1969 F e b . 6, 1970
Treasury biUs: Regular weekly:
D a t e d F e b . 6, 1969 - ^ Redeemed in exchange for series issued
Aug . 7, 1969, due Nov . 6, 1969 Redeemed in exchange for series da ted
Aug . 7,1969 due F e b . 5,1970 Redeemable for ca sh . . . .
Maturh ig N o v . 6,1969 Issued in exchange for series da ted F e b .
6,1969 Issued for cash .
M a t m i n g F e b . 5, 1970. Issued in exchange for series da ted
F e b . 6,1969 Issued for cash
Cer tmcates of indebtedness , foreign series, ma tu r ing :
Oct. 17, 1969 . . . - . . . Sept . 11,1969
Treasu ry certmcates, m a t u r i n g : J u n e 30, 1970 J u n e 30, 1970
Certificates of indebtedness , foreign series, ma tu r ing :
Sept . 16, 1969 Sept . 12, 1969 Sept . 16,1969 Oct . 10, 1969 Oct . 17, 1969 Oct . 24, 1969
R a t e of interest i
Percent
4.74 4.74 5.00 5.00
" " 3 . ' 9 6 " ' 2.00 2.00 . 2M -
13^
6.60 7.10 6.60 7.10 3.50
. . 7.313 .
7.10 . 7.10 . 7.10 . 6.60 6.60 6.60 7.10 6.60
5.125 . 7.45
4 6.127 .
6. 993 .
7. 086 .
7.10 . 6.60
3.50 3.50
6.60 6.60 6.60 7.10 7.10 7.25
Araoun t issued 2
$208,882.18 362,074.16
1,196, 544. 26 33, 554,169. 00
-3,362,635. 75 204,124.14 282, 000. 00
1, 554, 000. 00 .
20,167, 912, 043. 53
46, 000, 000. 00 . 5,000, 000. 00 . 6,000, 000. 00 . 6, 000, 000. 00 .
271. 05 .
-1 ,000 .00 .
7, 000, 000. 00 . 4, 000, 000. 00 . 1,100, 000. 00 . 2, 900, 000. 00 . 2,000,000.00 .
49,872,419. 39
448,238, 000. 00 . 1,153, 902, 000. 00 .
377,308, 000. 00 . 825,938, 000. 00 .
i4,'666,'666."66'.
41,171,988. 66 . 36,536,982.26 .
28, 000,000. 00 . 13, 000, 000. 00 . 10,000, 000. 00 . 13, 000, 000. 00 . 20, 000,000. 00 . 16,000, 000. 00 .
Araoun t m a t u r e d or caUed or re
deemed prior to m a t u r i t y 3
$2,330, 754. 09 4,477,915. 51
9,234. 00 71, 543. 25
(') 122, 526. 78
2,856, 000. 00 281,000.00
1,554, 000. 00
34, 983,100. 00
16, 753, 678,773. 26
15, 000, 000. 00 1, 000, 000. 00
14, 000, 000. 00
49, 733,981. 03
448,238, 000. 00
377,308, 000. 00 1,975,216, 000. 00
6,000,000. 00
Footnotes at end of table.
Digitized for FRASER http://fraser.stlouisfed.org/ Federal Reserve Bank of St. Louis
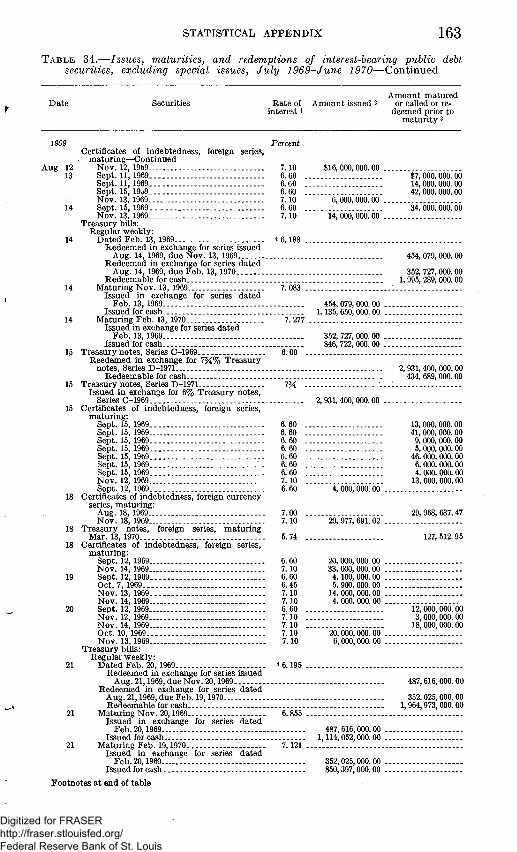
STATISTICAL APPENDIX 163 T A B L E 34.—Issues, maturities, and redemptions of interest-beai'ing public debt
securities, excluding special issues, Ju ly 1969-June 1970—Continued
D a t e Securities Araoun t raatm-ed
R a t e of A m o u n t issued 2 or caUed or re-interest 1 deemed prior to
m a t m i t y 3
1969
14
14
14
14
15
15
15
Certificates of indebtedness , foreign series, m a t m i n g — C o n t i n u e d
A u g 12 N o v . 12, 1969... 13 Sept . 11,1969
Sept . 11,1969 Sept . 15,19o9 N o v . 13, 1969 Sept. 16, 1969 N o v . 13, 1969
T rea su ry biUs: Regular weekly:
D a t e d F e b . 13, 1969----Redeeraed in exchange for series issued
Aug. 14, 1969, due N o v . 13, 1969 Redeemed in exchange for series da ted
Aug . 14, 1969, due F e b . 13, 1970 Redeemable for cash
Matur ing N o v . 13, 1969 Issued in exchange for series da ted
F e b . 13, 1969 Issued for cash .
Matur ing F e b . 13,1970-Issued in exchange for series da ted
F e b . 13, 1969 -Issued for cash -
Treasu ry notes, Series C-1969 Reedemed in exchange for 7 ^ % Treasu ry
notes, Series D-1971- . - . . Redeemable for cash
T rea su ry notes . Series D-1971 --Issued in exchange for 6% Treasu ry notes,
Series C-1969 . Certificates of indebtedness , foreign series,
ma tu r ing : Sept . 15, 1969 - . . ---Sept. 15, 1969-Sept. 15, 1969--- --Sept. 15, 1969 Sept. 15, 1969-Sept . 15,1969 - — Sept . 15, 1969 N o v . 12, 1969 Sept . 12, 1969. . - -
18 Certificates of indebtedness , foreign currency series, ma tu r ing :
Aug . 18, 1969. N o v . 18, 1969
18 T rea su ry notes, foreign series, m a t u r i n g Mar. 13,1970
18 Cer tmca tes of indebtedness , foreign series, m a t u r i n g :
Sept. 12,1969 N o v . 14, 1969
19 Sept . 12, 1969 Oct. 7, 1969 N o v . 13, 1969 N o v . 14, 1969
20 Sept . 12,1969 N o v . 12, 1969 N o v . 14, 1969 Oct . 10, 1969 N o v . 13, 1969
T rea su ry b ihs : Regular weekly :
21 D a t e d F e b . 20,1969.. Redeemed in exchange for series issued
Aug . 21,1969, due N o v . 20,1969 Redeemed in exchange for series da ted
Aug . 21,1969, due F e b . 19,1970.. . Redeemable for cash
21 M a t u r m g N o v . 20,1969 Issued in exchange for series da ted
F e b . 20,1969.. . . Issued for cash
21 Maturh ig F e b . 19,1970 Issued in exchange for series da ted
F e b . 20,1969 Issued for cash
Percent
7.10 6.60 6.60 6.60 7.10 6.60 7.10
4 6.188 .
$16, 000, 000. 00
6,000,000.00 .
'14,'666,'666.'66'.
$7,000,000.00 14,000,000.00 42, 000, 000. 00
'34,'666,'666.'66
454, 079, 000. 00 . 1,136, 650, 000. 00
i.oo
352, 727, 000. 00 . 846,722,000.00 .
7H 2,931,400,000.00
6.60 6.60 6.60 6.60 6.60 6.60 6.60 7.10 6.60
7.00 7.10
6.74
6.60 7.10 6.60 6.45 7.10 7.10 6.60 7:10 7.10 7.10 7.10
4,000,000.00
29, 977, 691.02 .
20, 000, 000. 00 . 33, 000, 000. 00 .
4,100, 000.00 . 5, 900, 000. 00 .
14,000,000.00 . 4, 000, 000.00 ,
20,000,000. 00 . 6,000,000.00 .
6. 855 .
454, 079, 000. 00
352, 727, 000. 00 1, 995, 289, 000. 00
2, 931, 400, 000. 00 434, 689, 000. 00
13, 000, 000. 00 41, 000, 000. 00
9, 000, 000. 00 6, 000, 000. 00
46, 000, 000. 00 6, 000, 000. 00 4, 000, 000. 00
13, 000, 000.00
29, 968, 637. 47
127, 512.95
12,000,000. 00 3,000,000. 00
18,000,000. 00
487, 616,000.00
352,025,000. 00 1,964,973,000. 00
7.121 .
487,616,000.00 . 1,114,052,000. 00 .
352,025,000.00 . 850,397,000.00 .
Foo tno tes a t end of table
Digitized for FRASER http://fraser.stlouisfed.org/ Federal Reserve Bank of St. Louis

164 1970 REPORT OF THE SECRETARY OF THE TREASURY
T A B L E 34.—Issues, maturities, and redemptions of interest-bearing public debt securities, excluding special issues, Ju ly 1969-June 1970—Continued
D a t e Securities R a t e of interest i
An ioun t issued 2 A m o u n t m a t u r e d
or called or redeemed prior to
m a t u r i t y 3
T r e a s u r y biUs—Continued Regular weekly—Continued
Aug. 21 Ma tu r ingJan .8 ,1970 . -Adjus tments of cash issues
21 Certificates of indebtedness , foreign series, m a t u r i n g :
Aug . 21,1969 Sept. 12,1969- .
Percent
7.308 -$5,000.00 .
22
25
Sept . 12,1969. Sept. 12,1969. Sept . 12,1969. Sept . 16,1969. Sept . 16,1969. Sept . 16,1969. Sept. 16,1969 Oct . 7 ,1969. . . . • Oct . 10,1969 . . . . Oct.10,1969 N o v . 14,1969 Sept . 10,1969 Oct . 7,1969 Oct.10,1969 Oct .10,1969. . . . ' N o v . 14,1969 Oct . 7,1969... Oct .10,1969. . Oct . 24,1969 Oct . 24,1969 Oct . 2 4 , 1 9 6 9 . . . . . . . . . . . . Oct . 24,1969 Oct . 24,1969 N o v . 14,1969..: i
T reasury bills: Regular weekly:
25 M a t m i n g September 18,1969—October 30, 1969 10
Isssed for cash 26 Certificates of indebtedness , foreign series,
ma tu r ing : N o v . 14, 1969 N o v . 14, 1969 N o v . 14, 1969 Sept. 10, 1 9 6 9 . . . Oct . 24, 1969 N o v . 14, 1969. . N o v . 14, 1969--
Treasm-y bills: Regular weekly:
D a t e d F e b . 27, 1 9 6 9 - - - -Redeemed in exchange for series issued
Aug.28,1969, due N o v . 28,1969 Redeemed in exchange for series da ted
Aug.28,1969, due F e b . 26,1970... Redeeraable for cash
M a t m h i g N o v . 28, 1969 Issued in exchange for series da ted
F e b . 27, 1969... Issued for cash
M a t m m g F e b . 26, 1970 . . . . Issued in exchange for series da ted F e b . 27,
1969 Issued for cash .
T a x anticipat ion: M a t m m g Mar. 23, 1970
Adjus t raents of cash issues 28 Cer tmcates of indebtedness , foreign series , '
ma tu r ing : • • • Sept . 10,1969. Sept . 10, 1 9 6 9 . . . . N o v . 14, 1 9 6 9 . . .
29 N o v . 14, 1969. 29 Treasu ry notes, foreign currency series, m a t u r
ing J u n e 18, 1973 . 31 U .S . savmgs bonds:*
SeriesE-1941 . . Ser iesE-1942. Series E-1943 •.-SeriesE-1944
Footnotes a t end of table .
6.15 6.60 6.60 6.60 6.60 6.60 6.60 6.60 6.60 6.45 7.10 7.10 7.10 6.60 6.45 7.10 7.10 7.10 6.45 7.10 7.25 7.25
•7.25 7.25 7.25 7.10
10,000,000.00 1,000,000.00 . 3,900,000.00 4,100, 000. 00
12,000,000.00 . 43,000,000.00 .
9,000,000.00 26,000,000.00 .
27
28
7.10 7.10 7.10 6.60 7.25 7.10 7.10
2,120, 538, 000. 00
27,000,000.00 11,000,000.00
28
28
7.292-
481,482,000.00 1,118,737,000.00
352,417,000.00 848,607,000.00 .
3,000. 00
6.60 6. 60 • 7.10 7.10
5.77
6 3. 312 6 3. 350 6 3. 393 6 3.429
365, 099. 55 2, 569,246.13 3,500,117.60 6,422,653.83
$7,000, 20,000, 4,100, 1,000, 4, 000, 2,000,
28,000, 1,100,
10, 000, 5,900,
10, 000, 4,100,
000. 00 000. 00 000. 00 000. 00 000. 00 000. 00 000. 00 000. 00 000. 00 000. 00 000. 00 000.00
3,900, 000. 00 2,100, 000. 00 4, 000,000.00 6,000,000. 00 4,000,000. 00 6,000, 000. 00
15, 000,000. 00 4, 000, 000. 00 4,000,000. 00
6,000, 000. 00 11, 000. 000. 00
481,482,000. 00
352,417, 000. 00 1, 968,235, 000. 00
1,000,000.00 2, 000,000. 00 9,000,000. 00
25,000,000. 00
100,182,893.89
1,312,429.47 5,245,450. 41 8,259,796. 73
10, 679.633. 93
Digitized for FRASER http://fraser.stlouisfed.org/ Federal Reserve Bank of St. Louis
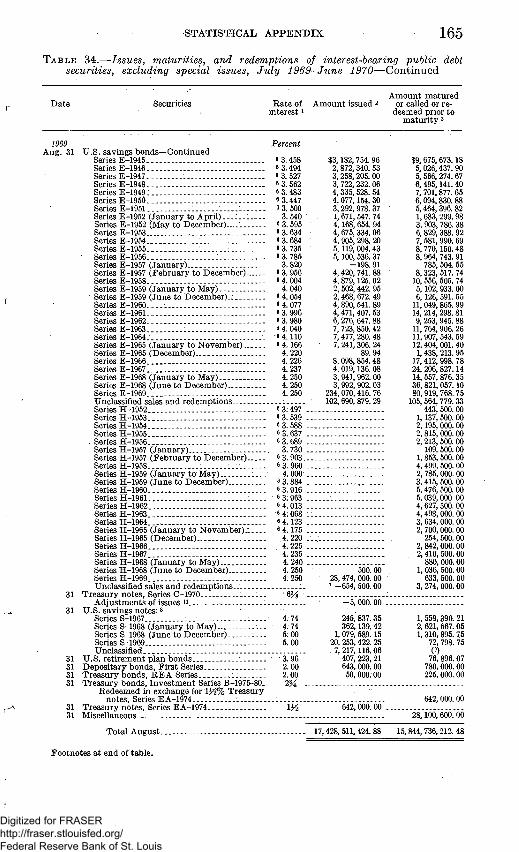
STATISTICAL APPENDIX 165 T A B L E 34.—Issues, maturities, and redemptions of interest-hearing public debt
securities, excluding special issues, Ju ly 1969-June 1970—Continued
D a t e Secmities
1969 Aug . 31 U . S . savings bonds—Cont inued
Series E-1945 SeriesE-1946 . Series E-1947 : . Series E-1948 Series E-1949. . Series E-1950 Series E - 1 9 5 1 - . : Series E-1952 ( January to A p r i l ) . . . : . . : Series E-1952 (May to December) Series E-1953. . Series E-1954 : . Series E-1955 . . . Series E - 1 9 5 6 . . . . : Series E-1957 (January) Series E-1957 (Feb rua ry to December) Series E-1958 Series E-1959 ( January to May) : Series E-1959 (June to December ) . : Series E - 1 9 6 0 . . . . . Series E-1961 SeriesE-1962 SeriesE-1963 : . . . . Series E-1964. . Series E-1965 ( January to Noveraber) Series E-1965 (Deceraber) . Series E-1966 Series E-1967 Series E-1968 ( January to May) Series E-1968 (June to Deceraber) . Series E - 1 9 6 9 . . . . Unclassmed sales and rederapt ions SeriesH-1952 : . . Series H-1953 SeriesH-1954 Series H-1955 Series H-1956 Series H-1957 ( January) Series H-1957 (Feb rua ry to DeceralDcr) Series H-1958 Series H-1959 ( Janua ry to May) : . . . Series H-1959 ( June to Deceraber) SeriesH-1960 Series H-1961 . Series H-1962 . . . SeriesH-1963 Series H-1964 Series H-1965 ( J anua ry to Noveraber) .i Series H-1965 (Deceraber) SeriesH-1966 . . SeriesH-1967 Series H-1968 ( J anua ry to May) . Series H-1968 ( June to Deceraber) Series H-1969 Unclassified sales and rederapt ions . : .
31 T r e a s u r y notes . Series C-1970 : . . . . . Ad jus tments of issnes ii
31 U .S . savings notes:» Series S-1967 : . . . . . . . : . Series S-1968 ( Janua ry t o M a y ) . . . . . . . . . Series S-1968 ( June to Deceraber) : : . . . Series S-1969 . . Unclassified
31 U . S . r e the raen t p lan bonds . . . . . . . : 31 Depos i ta ry bonds , F h s t Series 31 T rea su ry bonds , R E A Series . . . . . : . . 31 T r e a s m y bonds , Inves t raen t Series B-1975-80.
Redeemed in exchange for 13^% Treasu ry notes . Series EA-1974 :
31 Treasu ry notes . Series EA-1974 31 Miscellaneous
T o t a l August .
R a t e of interest i
Percent
8 3.458 6 3.494 6 3.527 6 3. 562 6 3.483 6 3.447 6 3. 500
3.540 6 3. 595 6 3. 634 6 3. 684 8 3. 735 6 3.785
3.820 6 3.956 6 4. 004
4.040 6 4. 054 6 4. 077 6 3.996 6 3. 980 6 4. 040 9 4.110 6 4.166
4.220 4.226 4.237 4.250 4.250 4.250
6 3:497 . 6 3. 539 . 6 3. 588 . 6 3. 637 . 6 3.689 .
3.730 . 9 3.903. . 6 3. 960 .
4. 000 . 6 3. 884 . 6 3. 916 . 8 3:963 . 6 4.013 .
•6 4.068 1 8 4.123 . 6 4.175 .
4.220 . 4.225 . 4. 235 . 4.240 .
- 4. 250 4.250
OH -
4; 74 4.74 5:00 5.00
' " "3 . "96" ' 2.00 2. 00 2M -
m
A m o u n t issued 2
$3,182,754.96 2,872,340. 53 3,258,205. 00 3, 722,232. 06 4,335, 528. 54 4, 077,154. 30 3,292, 978. 37 1, 671, 547. 74 4,168, 654. 94 4, 675, 334. 06 4, 905, 298. 20 5,119, 004.43 5,100, 536. 37
-198 .91 4, 420, 741. 88 4, 879,125. 02 2, 502, 442. 95 2,468, 672.49 4, 890, 541. 89 4, 471, 407. 53 6, 276, 647. 88 7,723,850.42 7,477, 280.48 7, 241, 306. 24
89.94 8,098,854.48 4, 019,136. 08 3, 941, 962. 00 3, 992, 902.03
234,070,416.76 102, 690, 879. 29
500.00 - 28, 474, 000. 00
7 -654 , 500. 00
-5 ,000 .00 .
245, 837.35 362,139. 42
1, 079, 589.15 20, 253, 422. 25 .7, 217,116. 06
407, 223, 21 643, 000. 00 50,000.00
642,000.00 .
17,428, 511,424. 88
A m o u n t m a t u r e d or caUed or re
deemed prior to raaturity 3
$9, 675,673.18 5, 026,437. 90 5, 566, 274. 67 6,495,141. 40 7, 701.877. 65 6,094,830.88 5,464, 396. 82 1,683,299. 98 3 903,786.38 6, 829, 388. 92 7, 581, 990. 69 8, 770,160. 48 8, 964, 743. 91
785, 504. 55 8, 323, 517. 74
10, 556, 505. 74 5,102, 933. 00 6,126, 591. 55
11, 049, 865. 99 14, 214, 298. 81 9, 253, 945. 88
11, 764, 906. 26 11, 907, 543. 59 12,404, 001.40 1,438, 213. 95
17, 412, 998. 78 24, 206, 827.14 14, 557, 876.35 36, 821, 057.10 80, 919, 768. 75
105, 564, 779.33 443, 500. 00
1,137, 500. 00 2,195, 000. 00 2, 815, 000. 00 2, 213, 600. 00
109, 500. 00 1, 853, 500.00 4, 499, 600. 00 2, 785, 000. 00 3, 415, 500. 00 5,476, 600. 00 6, 039, 000 00 4, 627, 500. 00 4,498, 000. 00 3, 634, 000. 00 2, 700, 000. 00
254, 600. 00 2, 842, 000. 00 2, 410, 500. 00
880, 000.00 1, 036, 500. 00
633, 500. 00 3, 274, 000. 00
1, 659,390. 21 2, 621, 667. 05 1,310, 896. 75
72, 798. 75 (9)
76, 896. 07 780, 000. 00 225, 000. 00
642, 000. 00
28,100, 600. 00
15,844, 736,212. 48
Footnotes at end of table.
Digitized for FRASER http://fraser.stlouisfed.org/ Federal Reserve Bank of St. Louis
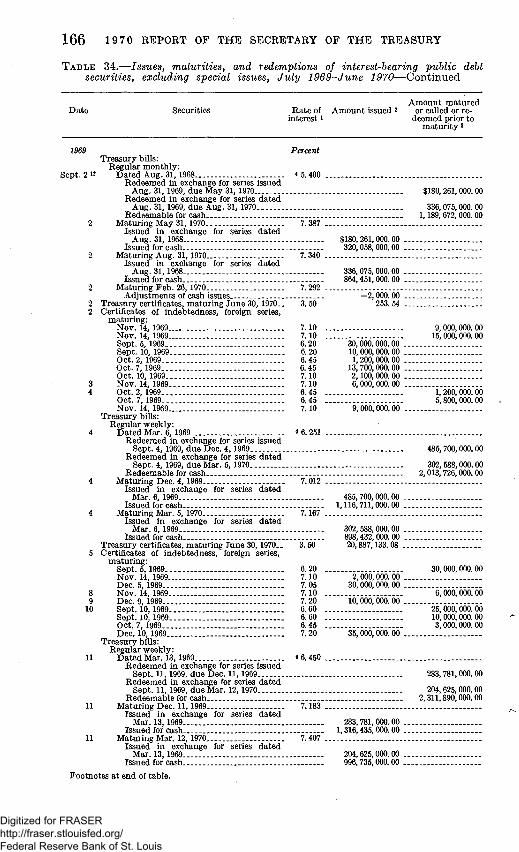
166 19 70 REPORT OF THE SECRETARY OF THE TREASURY
TABLE 34.—Issues, maturities, and redemptions of interest-bearing public debt securities, excluding special issues, July 1969-June 1970—Continued
Date Securities Rate of interest i
Amount issued 2 Araount matured
or caUed or redeeraed prior to
matmity 3
Sept. 2 12
Percent Treasmy bUls:
Regular monthly: Dated Aug. 31,1968 4 5.400
Redeemed in exchange for series issued Aug. 31, 1969, due May 31, 1970
Redeemed in exchange for series dated Aug. 31, 1969, due Aug. 31, 1970.
Redeemable for cash Maturing May 31,1970 7.387
Issued in exchange for series dated Aug. 31, 1968
Issued for cash Maturmg Aug. 31, 1970 7.340 .
Issued in exchange for series dated Aug. 31, 1968.
Issued for cash Matming Feb. 26, 1970 7.292
Adjustraents of cash issues..
$180,261,000.00 320,058,000.00 .
336,075,000.00 864,451,000.00
.50 -2,000.00
253.54
7.10 7.10 6.20 6.20 6.45 6.45 7.10 7.10 6.45 6.45 7.10
30,000,000.00 . 10,000,000.00 . 1,200,000.00 .
13, 700, 000. 00 . 2,100, 000. 00 . 6,000,000.00 .
9,000,000.00 .
Treasury certmcates, maturhig June 30, 1970.. Certmcates of indebtedness, foreign series,
maturing: Nov. 14, 1969 Nov. 14. 1969.. Sept. 5, 1969... Sept. 10, 1969... Oct. 2, 1969... Oct. 7, 1969... Oct. 10. 1969... Nov. 14, 1969 Oct. 2, 1969 Oct. 7, 1969 Nov. 14, 1969
Treasury biUs: Regular weekly:
DatedMar. 6, 1969. 4 6.251 Redeemed in exchange for series issued
Sept. 4, 1969, due Dec. 4,1969. Redeeraed in exchange for series dated
Sept. 4, 1969, due Mar. 6, 1970 Redeemable for cash..
Matmmg Dec. 4, 1969 7.012 Issued in exchange for series dated
Mar. 6, 1969 485,700,000.00 Issued for cash 1,116,711,000.00
Matmhig Mar. 5, 1970 7.167 Issued in exchange for series dated
Mar. 6, 1969 Issued for cash.
3.50
302.688,000.00 . 898,432,000.00 20,887,133. 08 .
10
6.20 7.10 7.05 7.10 7.20 6.60 6.60 6.45 7.20
2,000, 000. 00 . 30, 000,000. 00 .
"i5,"ooo,"oo5."oo".
35,000,000. 00 .
Treasury certmcates, maturing June 30,1970.. Certmcates of indebtedness, foreign series,
maturing: Sept. 5, 1969 — . Nov. 14, 1969 -Dec. 5,1969 -Nov. 14, 1969 -Dec. 9, 1969 Sept. 10,1969 Sept. 10,1969 -Oct. 7,1969 -Dec. 10,1969 -
Treasury biUs: Regular weekly:
11 Dated Mar. 13,1969 - 4 6.450 Redeemed in exchange for series issued
Sept. 11,1969, due Dec. 11,1969-.. Redeemed in exchange for series dated
Sept. 11, 1969, dueMar. 12, 1970...-Redeemable for cash -
11 Maturing Dec. 11,1969 7.183 Issued in exchange for series dated
Mar. 13, 1969 - 283,781,000. 00 Issued for cash 1,316,435,000.00
11 Maturing Mar. 12, 1970 7.407 Issued in exchange for series dated Mar. 13, 1969 - 204,625,000. 00
Issued for cash - _ 996,735,000. 00
Footnotes at end of table.
$180,261,000. 00
336,075, 000. 00 1,189, 672, 000. 00
9,000,000. 00 15, 000,000. 00
1,200,000.00 5,800,000. 00
485,700,000.00
302,588,000. 00 2,013,726,000. 00
30,000,000. 00
6,000, 000. 00
25, 000,000. 00 10, 000,000. 00 3, 000,000. 00
283,781,000. 00
204,625, 000. 00 2,311,890,000.00
Digitized for FRASER http://fraser.stlouisfed.org/ Federal Reserve Bank of St. Louis

STATISTICAL APPENDIX 167 TABLE 34.—Issues, maturities, and redemptions of interest-hearing public
securities, excluding special issues, July 1969-June 1970—Continued debt
D a t e
1969 Sep t . 11
12
15
16
17
18
IS
18
18 ' 18
19
19
22 22
23
23
24
24
Secmities
Cer tmcates of indebtedness , ma tu r ing :
Oct . 7, 1969 Oct .10,1969 N o v . 14, 1969 Dec . 11, 1969 D e c . 5 , 1969 Dec . 11,1969 Dec . 12,1969 Oct .10,1969 Oct .10,1969 Dec . 5, 1969 Oct. 7, 1969- -Oct .10,1969 Dec . 15, 1969 Oct .10,1969 Oct. 10,1969 - --
^ N o v . 14, 1969 -N o v . 14, 1969- -
foreign
Dec . 9, 1969 -Oct. 2, 1969----Oct. 7, 1969 — . Oct. 10, 1969-Oct . 17, 1969 Dec . 11, 1969 Dec . 15, 1969 - .
Treasury bills: Regular weekly:
D a t e d Mar. 20, 1969 -Redeeraed in exchange for series
Sept . 18,1969, due Dec . 18, 1969. Redeemed in exchange for series
Sept. 18, 1969, due Mar. 19, 1970. Redeemable for cash
M a t m i n g Dec . 18, 1969 Issued in exchange for
Mar. 20, 1969 Issued for cash
Matur ing Mar. 19,1970 Issued in exchange foi
Mar . 20, 1969 Issued for cash
• series
• series
Treasury certificates, m a t u r i n g J u n e 30, Certificates of indebtedness , foreign
n ia tu r ing : Oct . 17,1969 Oct. 17, 1969 Dec . 9, 1969 Dec . 11,1969 Dec . 11,1969 Dec . 12, 1969 Dec . 15, 1969 O c t . 2 , 1 9 6 9 - — Oct . 17, 1969 Dec . 12, 1969 Oct 2 1969
series,
issued
da ' ted '
"d'ate'd"
da ted
1970. . . series.
Treasury certificates, raaturing: J u n e 30, 1970 J u n e 30,1970
Cer tmcates of indebtedness , foreign scries, m a t u r i n g :
Oct . 17,1969 N o v . 13, 1969 -N o v . 13, 1969 -N o v . 13, 1969 - - . - -Oct. 2, 1969 Dec . 15, 1969 N o v . 13, 1969 N o v . 13, 1969 Dec . 10, 1969 Dec . 15, 1969
T r e a s m y notes, foreign series, raaturing: Sept . 23, 1969. Dec . 21, 1970 Sept . 24, 1969 J a n . 18, 1 9 7 1 . - . .
Treasury certmcates, ma tu r ing J u n e 30,1970. . .
R a t e of interest i
Percent
6.45 . 7.10 . 7.10 . 7.20 7.05 . 7.20 7.20 7.10 . 7.10 . 7.05 . 6.45 7.10 7.20 7.10 . 7.10 . 7.10 . 7.10 . 7.20 . 6.45 6.45 7.10 . 7.10 . 7.20 . 7.20
4 6. 389
7.156 .
7. 329 .
3.50
7.10 . 7.10 , 7.20 . 7.20 7.20 7.20 , 7.20 6.45 7.10 7.20 6.45
3.50 3.50
7.10 7.10 7.10 7.10 6.45 7.20 7.10 7.10 7.20 7.20
6. 375 7.85 6.30 7.80 3.50
Araoun t issued 2
$100, 000,000. 00 .
8, 000,000. 00 . 100, 000, 000. 00 .
12, 900,000. 00 . 3,100,000. 00 .
13, 000, 000. 00 .
4,200, 000. 00 . 800, 000. 00 .
11, 000,000. 00 .
473,292, 000. 00 . 1,327,746,000. 00 .
301,958,000. 00 . 898,740, 000. 00 .
19,416,704.74 .
1,000,000.00 .
1,000,000.00 .
13,009,825.92 . 405,243. 00 .
5,000.000. 00 . 11,000,000. 00 .
2,000,000. 00 .
100,000,000. 00 .
50,000,000. 00 . 6,473.75 .
A m o u n t m a t u r e d or caUed or re
deeraed prior to raaturity 3
$4,900,000. 00 3,100,000. 00 5, 000, 000. 00
29, 000,000. 00
3,000,000. 00 12,000,000. 00 1,000,000. 00
8, 000, 000. 00 5, 000,000. 00 4, 000, 000. 00 2, 000, 000. 00 6,000, 000. 00
7,000,000. 00 2, 000, 000. 00
15, 000,000. 00
473,292,000. 00
301,9o8,000. 00 2,228,296,000. 00
8,000,000. 00 1,000,000. 00 4,000,000. 00
85,000,000. 00 8,000,000. 00
28,000,000. 00 6,000,000. 00
11,000,000. 00 72,000,000. 00
8,000,000. 00 6,000,000. 00
14,000,000. 00 12,000,000. 00
2,000,000. 00 6,000,000. 00
10,000,000. 00
100,000,000. 00
50, 000,000. 00
Footnotes at end of table.
Digitized for FRASER http://fraser.stlouisfed.org/ Federal Reserve Bank of St. Louis

168 1970 REPORT OF THE SECRETARY OF THE TREASURY
TABLE 34.—Issues, maturities, and redemptions of interest-bearing public debt securities, excluding special issues, July 1969-June 1970—Continued
Date Securities Rate of interest i
Amount issued 2 Amomit matured
or caUed or redeeraed prior to
raaturity 3
Sept . 24 Certificates of indebtedness , foreign series, raaturing:
Oct . 24 ,1969 . . . . D e c . 10, 1969 Dec . 15, 1969 Oct .2 ,1969
Treasu ry bills: Regular weekly :
25 D a t e d Mar. 27,1969 Redeeraed in exchange for series issued
Sept . 25,1969, due Dec . 26,1969 Redeemed in exchange for series da ted
Sept . 25,1969, due Mar. 26,1970 : Redeemable for cash
25 Matur ing Dec . 26, 1969.. Issued in exchange for series da ted
Mar. 27, 1969 Issued for cash
25 M a t u r i n g M a r . 26 ,1970 . . . . Issued in exchange for series da ted
Mar. 27, 1969 Issued for cash
25 Certificates of indebtedness , foreign series, ma tu r ing :
Dec . 15,1969 . . . Dec . 15, 1969 Dec . 15,1969 Oct . 24, 1969 Dec . 10, 1969
25 Treasu ry certificates, m a t u r i n g J u n e 30,1970. . 26 Treasury notes, foreign series ma tu r ing Mar.
13, 1970 26 Certificates of indebtedness , foreign series,
ma tu r ing : Oct 2, 1969 . . . : Oct . 10, 1969 Oct . 17, 1969 N o v . 13,1969 . Dec . 10,1969.. . -Dec . 15,1969 - -Dec . 15,1969
29 Oct . 2, 1969 O c t . 2 , 1969 Oct. 2, 1969 Oct. 2, 1969 O c t . 2 , 1969 Oct . 10, 1969 : Oct. 17, 1969 Dec . 5, 1969 . . . Dec . 15, 1969
29 Treasu ry notes, foreign currency series, ma tu r ing : "
Sept . 29, 1969 . . . J a n . 29, 1971
Treasury bills: Regular m o n t h l y :
30 D a t e d Sept . 3 0 , 1 9 6 8 . . . Redeeraed in exchange for series issued "
Sept . 30, 1969, due J u n e 30, 1970 Redeemed in exchange for series da ted
Sept . 30,1969, due Sept . 30, 1970 Redeemable for cash :
30 Maturh ig J u n e 30,1970 . -Issued in exchange for series da ted
Sept . 30, 1968 -Issued for cash
30 Ma tu rmg Sept. 30 ,1970 . . : I ssued in exchange for series da ted
Sept . 30,1968. Issued for cash
30 Certificates of indebtedness , foreign series, ma tu r ing :
Oct . 2, 1969 O c t . 2 , 1 9 6 9 . . . . : . . - . Dec . 15,1969. . . . . . . . : . . Dec . 15, 1969
30 Treasury certmcates, ma tu r ing J u n e 30,1970..
Footnotes a t end of table .
Percent
7.25 7.20 7.20 6.45 $3, 000, 000. 00 .
1 6. 268 .
7.162 .
481,807,000.00 . 1,318, 763,000. 00 .
7.20 7.20 7.20 7.25 7. 20. 3.50
5.74
6.45 7.10 7.10 7.10 7.20 7.20 7.05 6.45 6.4.5 6.45 6.45 6.45 7.10 7.10 7.05 7. 20
6.16 7.85
7.357
7.350 .
6.45 . 6.45 . 7.20 . 7.20 . 3.50
278,339,000.00 . 922,776,000.00 .
2,000,000.00 . 26,000,000.00 . 46,196,917.73 .
19,000,000.00 . 35,000,000.00 . 30,000,000.00 . 40,000,000.00 . 9,000,000.00 .
29,000,000.00 . 30, 000, 000. 00 .
30,243,108.06
75,254,000.00 . 425,013,000.00 .
319,852,000.00 . 685,415,000.00 .
365.11
$2, 000,000. 00 25, 000, 000. 00 3,000,000. 00
481,807,000. 00
278,339,000. 00 2,243,815,000. 00
4, 000,000. 00 11,000,000.00 11,000,000.00
550,784. 97
4,200, 1,000, 1,000, 5, 000,
800, 35, 000, 26,000, 30, 000,
1,000,
000. 00 000.00 000. 00 000. 00 000.00 000.00 000. 00 000. 00 000. 00
30,106, 530. 80
75, 254,000.00
319, 852, 000. 00 1,105,901,000. 00
18,800,000. 00 2,200,000.00 1,000,000.00 29,000,000. 00
Digitized for FRASER http://fraser.stlouisfed.org/ Federal Reserve Bank of St. Louis
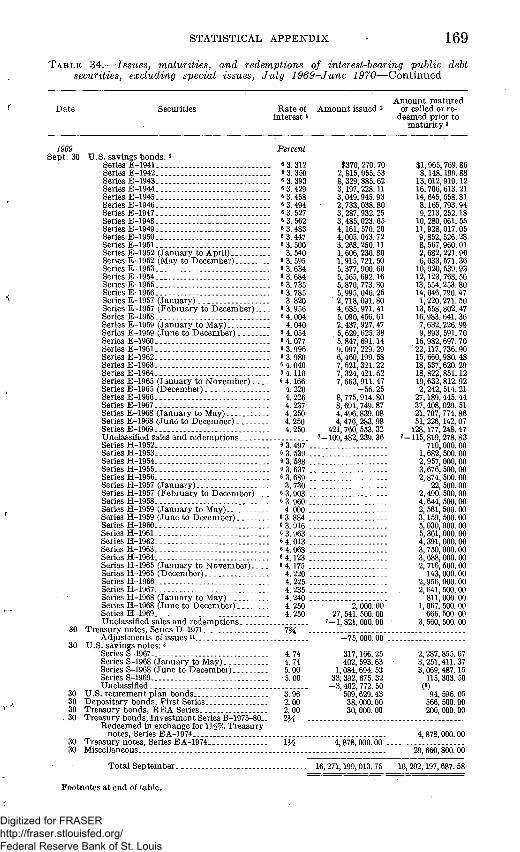
STATISTICAL APPENDIX 169
T A B L E 34.—Issues, maturities, and redemptions of interest-bearing public debt securities, excluding special issues, Ju ly 1969-June 1970—Continued
D a t e Secmities
1969 Sept . 30 U . S . savhigs bonds: s
Series E - 1 9 4 1 . _ . SeriesE-1942 Series E - 1 9 4 3 - . . Ser iesE-1944. Series E-1945 SeriesE-1946 Series E-1947 Series E-1948 Series E-1949 Series E-1950 Series E-1951 Series E-1952 ( January to April) Series E-1952 (May to December) Series E-1953 Series E-1954 Series E - 1 9 5 5 . - -Series E-1956 Series E-1957 (January) Series E-1957 (Februa ry to D e c e m b e r ) . . . . Series E-1958 Series E-1959 ( January to May) . . . Series E-1959 (June to Deceraber) SeriesE-1960 Series E-1961 SeriesE-1962 SeriesE-1963 Series E - 1 9 6 4 . . . . Series E-1965 ( January to Noveraber) Series E-1965 (Deceniber) Series E-1966 Series E-1967-Series E-1968 ( January to May) : Series E-1968 ( June to Deceniber) Series E-1969 Unclassified sales and rederapt ions SeriesH-1952 Series H-1953 Series H-1954 . . SeriesH-1955 Series H-1956 Series H-1957 (January) Series H-1957 (Februa ry to Deceraber) Series H-1958 Series H-1959 ( January to M a y ) . . Series H-1959 (June to Deceraber) SeriesH-1960 SeriesH-1961 SeriesH-1962 SeriesH-1963 Series H-1964 Series H-1965 ( January to Nove rabe r ) . Series H-1965 (D eceraber) Series H-1966 SeriesH-1967 Series H-1968 ( January to May) Series H-1968 (June to December) Series H-1969 Unclassified sales and redenipt ions
30 Treasu ry notes . Series D-1971 Adjus t raents of issues 11
•30 U .S . savings notes: s Series S-1967 Series S-1968 (January to May) Series S-1968 (June to Deceraber) Series S-1969 Unclassified
30 U .S . re t i reraent p l a n bonds 30 Deposi ta ry bonds , F i rs t Series 30 Treasury bonds , R E A Series
. 30 Treasury bonds , Inves t raen t Series B-1975-80.. Redeeraed in exchange for 1 ^ % Treasury
notes. Series EA-1974 30 Treasury notes, Series EA-1974 30 Miscellaneous . .
To ta l Septeniber .
R a t e of interest i
Percent
. 6 3.312
. 6 3. 350
. 6 3. 393
. 8 3. 429
. 6 3.458
. 8 3.494
. 6 3. 527
. 6 3. 562
. 6 3.483 6 3. 447
. 6 3. 500 3. 540
8 3 595 . 6 3. 634 . 6 3. 684
8 3. 735 . 6 3. 785
3. 820 . 6 3.956 . 6 4.004
4.040 . 8 4. 054 . 8 4. 077 . 6 3.996 . 6 3. 980
6 4. 040 8 4. n o 8 4.166
4. 220 4.226 4.237 4.250 4.250 4.250
6 3. 497 . 6 3. 539 . 6 3. 588 8 3 637 8 3. 689
3 730 8 3.903 8 3.960 .
4.000 8 3. 884 . 8 3. 916 . 8 3. 963 . 6 4. 013 . 8 4. 068 8 4 123 6 4.175
4. 220 . 4. 225 . 4. 235 . 4.240 4.250 4.250
7K -
4.74 4.74 5 00 5.00
3.96 2.00 2.00 2M
IM
-
Araoun t issued 2
$370,270.70 2, 815,055. 53 8, 329,885. 62 3,197,228.11 3, 049,945.93 2, 733,038. 80 3,287,932. 25 3,485,023. 65 4,161, 570. 20 4,005,043. 72 3,268,250.11 1, 606, 230. 80 1 915 721. 50 5, 377,900. 60 5, 565,692.16 5,870,773. 80 5,995, 046. 25 2, 718,091.80 4, 685,971. 41 5, 090,456.61 2,437,927.47
. 5, 629,625.38 5, 847, 691.14 9,097, 229. 29 6,460,199. 58 7,621, 321.22 7,324,421. 62 7,663,911.47
- 5 6 . 25 8,775,914.80 8,691,749.87 4, 496, 839. 08 4, 476, 283. 98
421, 760, 553. 32 7-109,482,239.36
2, 000. 00 27, 541, 500. 00
7-1,821.000.00
—75,000 00
317,166. 25 402, 593. 63
1,084 694 53 33,392, 675. 32
- 3 , 402, 772. 50 509,629. 43 38,000. 00 30, 000.00
4,878,000.00 .
16, 271,199, 013.75
Araoun t raatured or caUed or re
deeraed prior to m a t m i t y 3
$1,965, 769. 86 8,148,199. 88
13,012,910.12 16,706,613. 21 14, 645, 558. 81
8,165, 793. 94 9,213, 252.18
10, 280,061. 55 11,928,017. 05 9,852, 526. 28 8, 567,960. 01 2, 682,221.90 6,033, 571.36
10,920, 539.93 12,123,768. 56 13,554,253.80 14,046,790.47
1,220,271. 50 13, 558,802.47 16,983,641. 36
7,632,226.99 9,893, 591. 70
16,982,697. 70 22,117,736.90 15,660,980. 48 18, 537,620. 29 18,822,851.12 19,632,812.92 2,242, 514. 21
27,189,445. 44 37, 408,029. 51 21,707,774.86 51, 226,142. 07
128,177,248. 47 7-115,819,278.83
710,000. 00 1,682, 500. 00 2,957,000. 00 3,676, 500. 00 2,874, 500. 00
22, 500. 00 2,490, 500. 00 4,644, 500.00 2, 561, 500. 00 3,159, 500. 00 5,030,000. 00 5,361,000. 00 4,391,000.00 3,750,000. 00 3, 688,000. 00 2,716, 500. 00
143,000. 00 2,956,000. 00 2,641, 500. 00
811, 000. 00 1,067, 500. 00
666, 500. 00 3, 560, 500. 00
2,287,855. 67 3, 251,411. 37 3,069,487 15
115,303. 50 (9)
94, 596. 05 566, 500. 00 200,000. 00
4, 878,000. 00
29,660,800. 00
16,292,197,687.58
Footnotes at end of table.
Digitized for FRASER http://fraser.stlouisfed.org/ Federal Reserve Bank of St. Louis

170 1970 REPORT OF THE SECRETARY OF THE TREASURY
TABLE 34.—Issues, maturities, and redemptions of interest-hearing puhlic debt securities, excluding special issues, July 1969-June 1970—Continued
Date Securities Rate of interest i
Amount issued 2 Amount matured
or caUed or redeemed prior to
maturity 3
Oct. Percent
Treasury notes. Series EO-1969 13^ Redeemed in exchange for:
8% Treasury notes. Series E-1971 75^% Treasury notes. Series A-1973. 73^% Treasury notes, Series C-1976
Redeemable for cash— Treasm-y bonds of 1969 (10-1-57) 4. 00 --- -
Redeeraed in exchange for: 8% Treasury notes. Series E-1971 7%% Treasury notes, Series A-1973-7M% Treasmynotes, Series C-1976 -
Redeemable for cash Treasury bonds of 1964 -69 2}4
Redeemed in exchange for: 8% Treasury notes, Series E-1971 7H% Treasury notes, Series A-1973 7K% Treasury notes. Series C-1976--
Treasmy notes, Series E-1971 8. 00 Issued in exchange for:
1M% Treasury notes. Series EO-1969 $51,415,000.00 . 4% Treasmy bonds of 1969 (10-1-57) 3,168,166,000.00 . 2M% Treasmy bonds of 1964-69 955,898,500.00 .
Treasury notes, Series A~1973 --- 73^ Issued in exchange for:
13 ^% Treasury notes, Series EO-1969 12,660,000. 00 . 4% Treasury bonds of 1969 (10-1-57) 870,308,500. 00 . 2}^% Treasury bonds of 1964 -69 274,733,500.00 .
Treasury notes. Series C-1976 73^ --- -Issued in exchange for:
l}6% Treasury notes, Series EO-1969 2,347,000.00 . 4% Treasury bonds of 1969 (10-1-57) 1,108,295,500.00 .
6.45 7.10 7.20 7.10
8.00
6.456 . 7.106
23? % Treasury bonds of 1964-69 Certificates of indebtedness, foreigii series,
maturing: Oct. 2,1969 - -Oct. 17, 1969 Dec. 15,1969 -Dec. 31,1969. .
Treasury notes, foreign series raaturing Feb. 18,1971...
Treasury certificates, raaturing: Oct. 1, 1969 Jan. 1, 1970.
Treasury bUls: Regular weekly:
Dated Apr. 3, 1969 < 6. 246 Redeemed in exchange for series issued
Oct. 2, 1969, due Jan. 2, 1970 Redeemed in exchange for series dated
Oct. 2, 1969, due Apr. 2, 1970 Redeemable for cash
Maturing Jan. 2,1970 7.106 Issued in exchange for scries dated
Apr. 3, 1969 Issued for cash
Maturing Apr. 2, 1970 7. 340 Issued m exchange for series dated
Apr. 3, 1969 Issued for cash
Certificates of indebtedness, foreign series, maturing:
Oct. 2, 1969 6.45 Oct. 2, 1969 6.45 Oct. 7, 1969 6.45 Oct. 7, 1969 6.45 Oct. 10, 1969 7.10 Oct. 10, 1969 7.10 Oct. 10, 1969 7.10 Oct. 10, 1969 7.10 Oct. 10, 1969 7.10 Oct. 10, 1969 7.10 Oct. 10, 1969 7.10 Dec. 31, 1969 7.10 Oct. 17, 1969 7.10 Dec. 31, 1969 7.10
570,832,000. 00 .
1,000,000. 00 . 13,000,000. 00 . 8,000,000. 00 .
220,000,000.00 .
50,000,000. 00 .
328,944.32 .
454,212,000. 00 . 1,357,329,000. 00 .
353,138,000. 00 . 855,312, OOC. 00 .
Oct. 10, 1969. 7.10 18, 000, 000. 00 .
$51,415,000.00 12,660,000. 00 2,347,000. 00
92, 504,000. 00
3,168,166,000. 00 870,308, 500. 00
1,108,295,500. 00 1,093,061, 500. 00
955,898, 500. 00 274,733,500. 00 570,832,000. 00
323,719. 49
454,212, 000. 00
353,138, 000. 00 2,196,168,000. 00
200,000. 00 1,000,000. 00
12,900,000. 00 800,000. 00
4,200,000.00 5,000,000. 00 6, 000,000. 00 2,900,000. 00 4,100,000. 00 2,100,000. 00 2,000,000. 00
11,000,000. 00 4,000,000.00
13,000,000. 00
Footnotes at end of table.
Digitized for FRASER http://fraser.stlouisfed.org/ Federal Reserve Bank of St. Louis

STATISTICAL APPENDIX 171 T A B L E 34.—Issues, maturities, and redemptions of interest-bearing puhlic debt
securities, excluding special issues, Ju ly 1969-June 1970—Continued
Date
1969 Oct . 3
3
3
6
6 6
7
7
7
7
8 8
9
9
9
9
10
13
14
Securities
T reasu ry certificates, matm-ing: Oct . 3,1969 J a n . 3,1970 J u n e 30,1970 .
T reasu ry bUls: Regular weekly:
Matur ing Dec . 18,1969 Adjus t raen ts of cash issues Adjus t raen ts of exchange issues
R egular raonthly: Matur ing Sept . 30, 1970
Adjus t raents of cash issues Treasury notes, foreign currency series, raatur
ing Aug . 24, 1970 Treasury certificates, ma tu r ing J u n e 30,1970--. Certificates of indebtedness , foreign series,
m a t u r i n g : Oct . 17, 1969 - - - - - -N o v . 13, 1969 Oct. 7, 1969 Oct . 10, 1969 -Dec . 15, 1969 Oct. 7, 1969 N o v . 13, 1969...- - -Dec . 15, 1969 -
Treas iuy notes, foreign series ma tu r ing N o v . 2, 1970 - - -
Certificates of indebtedness , foreign currency series, raaturing:
Oct . 7,1969 A p r . 7, 1970
Treasu ry certificates, raaturing: J u n e 30, 1970. . . J u n e 30,1970
Certificates of indebtedness , foreign series, m a t u r i n g :
Oct . 10,1969 Oct. 10, 1969 Oct. 10, 1969 -Oct . 23,1969 Oct . 23, 1969 Oct . 23, 1969 N o v . 13, 1969 Dec . 10,1969 Dec . 10,1969 Dec . 15,1969
Treasury biUs: Regular weekly:
D a t e d Apr . 10, 1969 Redeeraed in exchange for series issued
Oct. 9,1969, due J a n . 8,1970. Redeemed in exchange for series da ted
Oct . 9,1969, due Apr . 9, 1970 Redeemable for cash . .
Matur ing J a n . 8, 1970 Issued in exchange for series da ted A p r .
10,1969 -Issued for cash
Matur ing Apr . 9, 1970. . - _ -Issued in exchange for series da ted Apr .
10, 1969 - -Issued for cash-- _
Certificates of indebtedness , foreign m a t m i n g :
N o v . 13,1969 Dec . 10, 1969- -Dec . 15,1969 Dec . 15,1969
Treasury biUs: Regular weekly:
Matur ing Mar. 26, 1970 -Ad jus tmen t s of cash issues Adjus tmen t s of exchange issues- -
Certificates of indebtedness , foreign raaturing:
N o v . 13, 1969- --Dec . 15, 1969 - - - - -
series,
series.
R a t e o f interest i
Percent
6.456 . 7.106 3.50
7.156 .
7. 350 -
6.33 . 3.50
7.10 -7.10 -6 .45. 7.10 7.20 6.45 -7.10 . 7.20
6.00 .
6.25 . 7.73
3.50 3.50
7.10 . 7.10 . 7.10 . 7.25 . 7.25 . 7.25 . 7.10 . 7.20 . 7.20 . 7.20
4 6. 591 .
7.047 .
7. 290 .
7.10 7.20 7.20 7.20
7.361 .
7.10 7.20
Araoun t issued 2
$1,559,123.41 . 2,176,417.54 .
- 200 , 000. 00 . 200,000. 00 .
- 3 , 000. 00 .
121,002,367.37 .
13,700,000.00 . 8,300,000. 00 .
14,000,000.00 .
45,000,000.00 .
54,686,772.78 .
75,857,567.47 . 39,110,972.88 .
11, 000,000. 00 .
351,919,000.00 . 1,448,721,000.00 .
304,208,000.00 . 896,386,000.00 .
12,000,000. 00 . 10,000,000.00 . 19,000,000. 00 . 3,000,000. 00 .
1,000.00 . -1 ,000 .00 .
21, 000,000. 00 .
Araoun t m a t u r e d or called or re
deemed prior to m a t m i t y 3
$1,534,358.86
25,101,370. 92
13,000,000. 00 2,000,000. 00
13,700,000. 00 32,000,000. 00
196,307.12
54,372,975.47
1,100,000. 00 18,000, 000. 00 8,300,000. 00 5,000,000. 00
11,500,000. 00 11,000,000. 00 6,000,000. 00 7,000,000. 00 3,000,000. 00
351,919,000.00
304,208,000.00 2,347,800,000.00
12,000,000. 00
Footnotes at end of table. 40'9-714—71 12
Digitized for FRASER http://fraser.stlouisfed.org/ Federal Reserve Bank of St. Louis
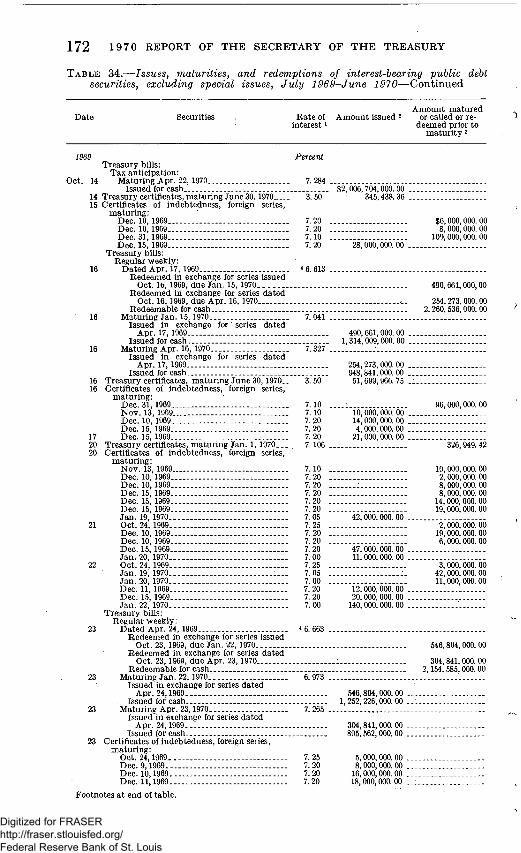
172 19 70 REPORT OF THE SECRETARY OF THE TREASURY
T A B L E 34.—Issues, maturities, and redemptions of interest-hearing public debt securities, excluding special issues, Ju ly 1969-June 1970—Continued
D a t e Securities R a t e of interest i
A m o u n t issued 2 A m o u n t m a t u r e d
or called or redeeraed prior to
raaturity 3
1969 Treasu ry bills:
Tax ant ic ipat ion: Oct . 14 Matur ing Apr . 22, 1970
Issued for cash __ 14 Treasury certificates, raaturing J u n e 30,1970 15 Certificates of indebtedness , foreign series,
ma tu r ing : Dec . 10,1969 Dec . 10,1969 Dec . 31,1969 Dec . 15,1969
Treasury biUs: Regular weekly:
16 D a t e d Apr . 17, 1969 Redeemed in exchange for series issued
Oct. 16, 1969, due J a n . 15, 1970 Redeemed in exchange for series da ted
Oct. 16, 1969, due Apr . 16, 1970 Redeemable for cash
16 Matur ing J a n . 15, 1970 Issued in exchange for series da ted
A p r . 17, 1969 Issued for cash
16 Matur ing Apr . 16, 1970 Issued in exchange for series da ted
Apr . 17, 1969 Issued for cash
16 Treasury certificates, raaturing J u n e 30,1970.. 16 Certificates of indebtedness , foreign series,
m a t u r i n g : Dec . 3i , 1969 . . N o v . 13, 1969 Dec . 10, 1969 Dec . 15, 1969. . .
17 Dec . 15, 1969. 20 Treasury certmcates, n ia tur ing J an . 1, 1 9 7 0 . . . 20 Certificates of indebtedness , foreign series,
m a t u r i n g : N o v . 13, 1969 Dec . 10, 1969 Dec . 10, 1969.. Dec . 15 ,1969. . . Dec . 15,1969 Dec . 15,1969 J a n . 19, 1970
21 Oct. 24, 1969 Dec . 10,1969 Dec . 10, 1969 Dec. 15, 1969 . . . . J a n . 20, 1970
22. Oct. 24, 1969 . . . — J a n . 19, 1970 : . . . J an . 20, 1970 Dec . 11, 1969 . . . . Dec . 15, 1969 J an . 22, 1970
Treasury bills: Regular weekly:
23 D a t e d Apr . 24, 1969 Redeemed in exchange for series issued
Oct. 23, 1969, due J an . 22, 1970. Redeemed in exchange for series da ted
Oct. 23, 1969, due Apr . 23, 1970. Redeemable for cash
23 Matur ing J a n . 22, 1970. Issued in exchange for series da ted
Apr . 24,1969 . Issued for cash ---
23 Matur ing Apr . 23,1970 Issued in exchange for series da ted
Apr . 24,1969 Issued for cash
23 Certificates of indebtedness , foreign series, ma tu r ing :
Oct. 24,1969 -- . -Dec . 9,1969 -- - - . Dec . 10,1969 Dec . 11,1969
Percent
7.284 .
3.50
7.20 7.20 7.10 7.20
4 6. 613 .
$2,006,704, 000. 00 . 345,438.36 .
28,000,000.00 .
$6,000, 000. 00 8,000, 000. 00
100,000, 000. 00
7.327
490,661,000.00 . 1.314, 009,000. 00 .
254,273,000.00 . 948,841,000.00 .
3. 50 51,699, 966. 75 .
7.10 7.10 7.20 7.20 7.20 7.106 .
7.10 7.20 7.20 7.20 7.20 7.20 7.05 7.25 7.20 7.20 7.20 7.00 7.25 7.05 7.00 7.20 7.20 7.00
4 6. 663 .
10,000, 000. 00 . 14,000,000. 00 . 4,000,000. 00 .
21,000,000.00 .
42,000,000. 00 .
47,000,000. 00 . 11, 000,000. 00 .
12, 000, 000. 00 . 20, 000, 000. 00 .
140, 000. 000. 00 .
490,661,000,00
254,273, 000. 00 2,260,536,000. 00
7.265
546,804,000. 00 . 1,252,226, 000. 00 .
304,841,000. 00 . 805, 562, 000. 00 .
7.25 7.20 7.20 7.20
5,000,000. 00 . 8, 000,000. 00 .
16,000,000. 00 . 18,000,000. 00 .
96,000, 000. 00
326,949. 42
10, 000,000. 00 2,000,000. 00 8,000, 000. 00 8, 000,000. 00
14, 000, 000. 00 19, 000,000. 00
2, 000,000. 00 19,000,000. 00 6,000,000. 00
3, 000, 000. 00 42,000, 000. 00 11,000, 000. 00
546,804,000. 00
304,841, 000. 00 2,154, 585, 000. 00
Footnotes a t end of tab le .
Digitized for FRASER http://fraser.stlouisfed.org/ Federal Reserve Bank of St. Louis
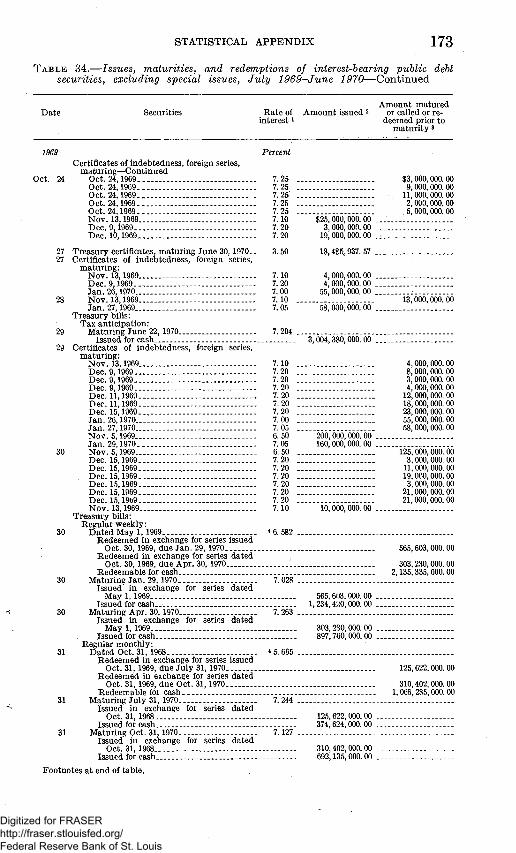
STATISTICAL APPENDIX 173 T A B L E 34.—Issues, maturities, and redemptions of interest-bearing public debt
securities, excluding special issues, Ju ly 1969-June 1970—Continued
D a t e
1969
Oct. 24
27 27
28
29
29
30
30
30
30
31
31
31
Securities
Certificates of indebtedness , foreign series, ma tu r ing—Cont inued
Oct . 24,1969 Oct . 24,1969 Oct . 24,1969- . Oct . 24,1969 -Oct . 24,1969 -N o v . 13,1969 Dec . 9,1969 Dec . 10,1969
T r e a s m y certificates, raaturing J u n e 30,1970--Certificates of indebtedness , foreign series,
m a t u r i n g : N o v . 13.1969 --Dec . 9,1969 --- --J a n . 26,1970 N o v . 13,1969 J a n . 27,1969 ---
Treasu ry biUs: Tax ant ic ipat ion:
Matur ing J u n e 22,1970 -Issued for cash
Certificates of indebtedness , foreign series, m a t u r i n g :
N o v . 13,1969 -Dec . 9,1969 - -Dec . 9,1969 -Dec . 9,1969 ---Dec . 11,1969 Dec . 11,1969 Dec . 15,1969 J a n . 26,1970 J a n . 27,1970 - - - . - - -N o v . 5,1969 . . J a n . 29,1970 N o v . 5,1969 . . . Dec . 15,1969 Dec . 15,1969 Dec . 15,1969 Dec . 15,1969 Dec . 15,1969 Dec. 15,1969 N o v . 13,1969 -
Treasu ry bUls: Regular weekly :
D a t e d M a y 1, 1969 Redeeraed in exchange for series issued
Oct . 30, 1969, due J a n . 29, 1970 Redeemed in exchange for series da ted
Oct . 30, 1969, due Apr . 30,1970 Redeemable for cash
Matur ing J a n . 29, 1970 Issued in exchange for series da ted
May 1, 1969 Issued for c a sh . .
Matur ing Apr . 30, 1970 Issued in exchange for series da ted
May 1,1969 Issued for cash
Regular m o n t h l y : D a t e d Oct. 31 ,1968 . .
Redeemed in exchange for series issued Oct. 31, 1969, due Ju ly 31, 1970
Redeemed in exchange for series da ted Oct. 31, 1969, due Oct. 31, 1970
Redeemable for cash Matur ing Ju ly 31, 1970
Issued i n exchange for series da ted Oct. 31, 1968 _
Issued for cash . Matur ing Oct. 31, 1970
Issued in exchange for series da ted Oct .31,1968
Issued for cash.
R a t e of interest i
Percent
7.25 . 7.25 . 7.25 . 7.25 . 7.25 . 7.10 7.20 7.20
3.50
7.10 7.20 7.00 7.10 . 7.05
7.204 .
7.10 . 7.20 . 7.20 . 7.20 . 7.20 . 7.20 . 7.20 . 7.00 . 7.05 . 6.50 7.05 6.50 . 7.20 . 7.20 . 7.20 . 7.20 . 7.20 . 7.20 . 7.10
4 6. 582 .
7. 028 .
7. 263 .
4 5. 665 .
7.244 .
7.127 .
A m o u n t issued 2
$25,000,000. 00 . 3,000,000. 00 .
19, 000,000. 00 .
18,485,937.57 .
4,000,000. 00 . 4, 000,000. 00 .
55,000,000. 00 .
58,000,000. 00 .
3,004,380,000. 00 .
2oo,'ooo,"ooo.'oo". 160,000,000. 00 .
10,000, 000. 00 .
565,603,000. 00 . 1,234,420,000.00 .
303,230,000. 00 . 897,760,000. 00 .
125,622,000. 00 . 374,624,000. 00 .
310,402,000.00 . 692.135.000. 00 .
Araount matm-ed or called or re
deemed prior to m a t m i t y 3
$3,000,000. 00 9,000,000.00
11,000,000. 00 2,000,000. 00 5,000,000. 00
13,000,000. 00
4,000, 000. 00 8,000,000. 00 3,000,000. 00 4,000,000.00
12,000,000. 00 18,000,000. 00 23,000,000. 00 55,000,000. 00 .58, 000,000. 00
125, 000,000. 00 3,000,000. 00
11, 000,000. 00 19,000,000. 00 3,000,000. 00
21,000,000.00 21,000, 000. 00
565,603,000. 00
303,230,000. 00 2,135,335,000. 00
125,622,000. 00
310,402,000.00 1,066,285,000. 00
Footnotes at end of table.
Digitized for FRASER http://fraser.stlouisfed.org/ Federal Reserve Bank of St. Louis

174 19 70 REPORT OF THE SECRETARY OF THE TREASURY
TABLE 34.—Issues, maturities, and redemptions of interest-bearing public debt securities, excluding special issues, July 1969-June 1970—Continued
Date Securities Amount matured
Rate of Amount issued 2 or caUed or re-interest 1 deeraed prior to
raaturity 3
1969 Percent Oct. 31 Treasury notes, foreign series, maturing:
Oct. 31, 1969 .5.90 Mar.25, 1971 7.35
31 Treasury bonds, foreign series, maturing Nov. 1,1969... 4.25
31 Certificates of indebtedness, foreign series, maturing:
Nov. 13, 1969 7.10 Nov. 13, 1969 7.10 Nov. 13. 1969.. 7.10 Dec. 10, 1969 7. 20 Dec. 15, 1969- ---. 7. 20
31 Treasury certificates, maturing: Oct. 31, 1969... 7.172 Jan. 31, 1970 7.030 June 30, 1970 3. 50
31 U.S. savings bonds: s Scries E-1941 63.312 SeriesE-1942 83.350 Series E-1943 63.393 SeriesE-1944 63.429 Series E-1945 83.453 SeriesE-1946 6 3.494 Series E-1947 63.527 Series E-1948 6 3.562 Series E-1949 63.433 Series E-1950 33.447 Series E-1951 63.500 Series E-1952 (January to April). 3. 540 Series E-1952 (May to Deceraber) 6 3. 595 Series E-1953 63.634 Series E-1954 6 3.684 Series E-1955 83.735 Series E-1956 63.735 Series E-1957 (January) 3.820 Series E-1957 (February to December).... 6 3. 956 Series E-1958 . _ - 8 4. 004 Series E-1959 (January to May) 4. 040 Series E-1959 (June to Deceraber) _ - - 6 4. 054 SeriesE-1960 - - 64.077 Series E-1961 63.990 SeriesE-1962 6 3. 98O SeriesE-1963 6 4. 040 Series E-1964 64.110 Series E-19o5 (January to November) « 4.166 Series E-1965 (D ecember) - - - 4. 220 Series E-1966 - --- ---- 4.226 Series E-1967 --- - 4.237 Series E-1968 (January to May) 4. 250 Series E-1968 (June to December) 4. 250 Series E-1969 - 4.250 Unclassi fied sales and redemptions Series H-1952 83.497 Series H-1953 - « 3. 539 Series H-1954 -- . . 8 3. 533 Series H~1955 8 3. 637 Series H-1956 6 3.689 Series H-1957 (January) 3. 730 Series H-1957 (February to December). . . 6 3. 903 Series H-1958 83.900 Series H-1959 (January to May). 4. 000 Series H-1959 (June to December) 6 3.334 Series H-1960 8 3.916 Series H-1961 6 3. 953 SeriesH-1962 64.013 Series H--1963 6 4. 068 SeriesH-1964 64.123 Series H-1965 (January to November) 6 4.175 Series H-1965 (December) 4. 220 Series H-1966 4. 225 Series H~1967 4. 235 Series H-1968 (January to May) 4.240 Series H-1968 (June to December)., 4. 250 Series H-19b9 4.250 Unclassified sales and redem ptions
31 Treasury notes, Series C-1970 6H Adjustraents of issues n
Footnotes at end of table.
$100,000,000.00 $125,000,000.00
30,000,000.00
8,000,000.00 4,000,000.00 10,000,000.00 16,000,000.00
4,000,000.00
1,220,387.51 1,242,269.06
15,400,038.70
390,427.60 1,620,765.82 2,860,725. 52 6,309,554. 98 6.462.320.64 10,017,323.18 2,736,170. 34 12,787,181. 43 3,520,423.90 11,140,035.04 2,765,730. 61 6,220,695. 81 3, 054, 577. 71 6,895,927. 64 3,281,459.44 8,021,069.45 3,808,510. 37 8,975,683. 60 3,617,051.72 7,488,094.85 3,236,203. 61 6,454,955. 04 1,446,106. 80 2,383, 696. 92 1,715,282.48 4,910,668. 73 4,135,197. 96 8,390,000. 73 4,445,823.67 9,344,72L35 4,569,610. 62 10,468,825. 82 4,742,439.02 11,085,728.00
19. 93 897,718. 69 4,821,748.19 10,114,212. 06 4,617,680. 04 12,576, 570. 79 2,197,362. 76 5,732,047. 06 2, 574,388. 06 7,752,635. 72 6, 530,099. 29 13,213,997. 04 7,295,491.34 17,085,777.10 13,942,916.32 12,566,316.85 8, 519,656.15 14,239,342.17 7,869,573. 71 14,521,205. 75 7,934,787. 07 15,161,724. 31 -92,777.84 1,645,538.08
8,940,817.40 • 21,223,312.67 8,396,717. 85 28,748,083. 82 4,424,917.18 16,522,380. 98 3.763.192.65 37,431,98L18
313,058,3.34. 88 118,925,365. 35 81,362,708.82 33,980,808.89
625,000.00 2,336,500.00 4,783,000.00 6,581,500.00 5,472,000.00 929,500.00
3,327,000.00 6,138,500.00 3,686,500.00 4,751,500.00 6,455,000.00 7,110,000.00 6,009,000.00 5,474,000.00 4,834,000.00 3,780,500.00
.-- 117,500.00 -- 3,834,000.00
3,198,000.00 --- 1,123,000.00
1,279,000.00 28,807, 000. 00 921,000. 00
7 -1,311, 000. 00 7 _i2,632,500. 00
" " 4 , ' i 8 6 , ' 5 5 0 . ' 0 0 ' - - " ^ ' - - - - ' - - - ' "
Digitized for FRASER http://fraser.stlouisfed.org/ Federal Reserve Bank of St. Louis

STATISTICAL APPENDIX 175 T A B L E 34.—Issues, maturities, and redemptions of interest-bearing public debt
securities, excluding special issues, Ju ly 1969-June 1970—Continued
Date Securities Rate of interest i
Araount issued 2 Amount matured
or called or redeemed prior to
maturity 3
Oct. 31 Treasury notes. Series A-1976 -Adjustments of issues n . . .
U.S. savings notes: 8 Series S-1967 Series S-1968 (January to May) Series S-1968 (June to December) Series S-1969 Unclassified.
U.S. retirement plan bonds Depositary bonds. First Series Treasury bonds, REA Series. Treasury bonds, Investment Series B-1975-80.
Redeemed in exchange for: W2% Treasury notes, Series EA-1974. __ W2% Treasury notes. Series EO-1974-_.
31 Treasury notes. Series EA-1974 31 Treasury notes. Series E 0-1974. 31 MisceUaneous
Percent
31
31 31 31 31
4.74 4.74 5.00 5.00
3.96 2.00 2.00 2M
$12,702,000.00
298,766. 70 368,153. 25
1,095, 551. 03 27,977,784. 75 6, 208,704.99
35, 617.42 274, 000. 00 30, 000. 00
$1,837,776.69 2,334,046.96 3,820, 535.18
88,492. 50 (8) 134, 223.90 500,000. 00 855, 000. 00
m m 20,975,000. 00 .
1, 758, 000. 00 .
20,975, 000. 00 1,758,000. 00
45, 396,000. 00
Total October. 31,100,822,051.46 26,652,806,129.62
Treasury biUs: Regular weekly:
Nov. 3 Maturmg Jan. 22,1970-Adjustments of cash issues
3 Maturhig Apr. 23,1970 Adjustments of cash issues Adjustments of exchange issues
Regular monthly: 3 Maturhig July 31,1970
Adjustments of cash issues -3 Maturing Oct. 31,1970 -
Adjustments of cash issues Adjustments of exchange issues
3 Certmcates of Indebtedness, foreign series, maturing:
Nov. 5,1969—-Nov. 13,1969
. Dec. 10,1969 Dec. 15,1969 Jan. 19,1970
Treasury bills: Regular weekly:
4 Maturmg Jan. 29,1970 ---Adjustraents of cash issues
4 Maturhig Apr. 30,1970-Adjustraents of cash issues
5 Maturing Jan. 8, 1970 Adjustraents of cash issues
6 Maturhig Apr. 9,1970 Adjustraents of cash issues
5 Certmcates of mdebtedness, foreign series, maturing:
Dec. 15,1970 - - -Jan. 19,1970
Treasmy bUls: Regular weekly:
6 Dated May 8,1969 Redeemed in exchange for series issued
Nov. 6,1969, due Feb. 5,1970—-Redeemed in exchange for series dated
Nov. 6,1969, due May 7,1970---. Redeemable for cash.
6 Maturing Feb. 5,1970. Issued in exchange for series dated
May 8,1969 Issued for cash - --.
6 Maturing May 7,1970 Issued in exchange for series dated
May 8,1969- -- . ---Issued for cash
6 Certmcates of indebtedness, foreign series, maturing:
Jan. 19,1970 Jan. 19,1970 - - .-Jan. 22,1970:
7 Dec. 15,1969.... Jan. 12,1970. Jan. 19,1970
6.973 .
'7." 265'. -50,000.00 .
-73,000.00 . 63,000.00 .
7.244 .
'7.'i27'. 75,000.00 .
-75,000.00 .
6.50 7.10 7.20 7.20 7.05
7.028 .
"7.'263".
'7.'647".
'7.'296".
40,000,000.00 . 16,000,000. 00 . 7,000,000.00 . 3,000,000.00 .
75, 000,000.00
-100,000.00 .
" - i , '6o6. '66 '^
""i6, '66o.'oo'!
'- i6,'6oo.'o6'^
7.20 7.05
4 6. 576
84,000,000.00 . 26,000,000.00 .
6.999 .
7.281
486,286,000.00 . 1,315,396,000.00 .
427,516,000.00 . 774,614,000.00 .
7.05 7.05 7.00 7.20 7.05 7.05
2,000,000.00 . 8,000,000.00 .
26,000,000.00 .
486,286,000. 00
427, 516,000. 00 , 988,620,000. 00
3,000,000.00 22,000,000.00 70,000,000. 00
Footnotes at end of table.
Digitized for FRASER http://fraser.stlouisfed.org/ Federal Reserve Bank of St. Louis

176 19 70 REPORT OF THE SECRETARY OF THE TREASURY
TABLE 34i.^Issues, maturities, and redemptions of interest-bearing puhlic debt securities, excluding special issues, July 1969-June 1970—Continued
Date
1969
Nov. 10
10
10
10
12
13
13
13
13
13
17 17
17
18
18
18
18
19
20
Secmities
Treasury biUs: Regular weekly:
Maturing Apr. 16,1970. Adjustments of cash issues
Maturhig Jan. 29,1970 Adjustments of cash issues
Maturing Apr. 30,1970 Adjustments of cash issues
Certificates of indebtedness, foreign series, maturing:
Dec. 11,1969-.-Dec. 15,1969-Dec. 30,1969 - -Jan. 12,1970 -Dec. 15,1969 Jan. 12,1970 . - -Feb. 11,1970 Nov. 13,1969 -Dec. 5,1969 .--Dec. 30,1969 . Feb. 11,1970 : .
Treasury notes, foreign currency series, maturing:
Sept. 3,1970 ---Oct. 1,1970 Dec. 2,1970 . Jan. 4,1971 -
Treasury biUs: Regular weekly:
Dated May 15, 1969 Redeemed in exchange for series issued
Nov. 13. 1969, due Feb. 13, 1970 Redeenied in exchange for series dated
Nov. 13, 1969, due May 14, 1970 Redeeraable for cash-
Maturing Feb. 13, 1970— -Issued in exchange for series dated
May 15, 1969. Issued for cash
MaturingMay 14, 1970 Issued in exchange for series dated May
15,1969.. Issued for cash
Treasury certiflcates, maturhig June 30, 1970.. Treasury notes, foreign series niaturing,
Nov. 2,1970 Certmcates of indebtedness, foreign series,
niaturing: Feb. 13, 1970 Feb. 13, 1970. Dec. 5, 1969 Jan. 12, 1970 Jan. 12, 1970 Feb. 11,1970
Certificates of indebtedness, foreign currency series, maturing Nov. 18, 1969
Treasury notes, foreign currency series, maturing Feb. 18,1971
Treasury bUls: Regular monthly:
Maturing Oct. 31, 1970 Adjustnients of cash issues... --Adjustments of exchange issues
Certmcates of indebtedness, foreign series, maturinG::
Feb. 11, 1970 Dec. 11,1969-.. . Dec. 15, 1969 Dec. 15,1969 Dec. 15, 1969 Jan. 12,1970 Jan. 12, 1970 Feb. 11,1970 Feb. 13.1970
Rate of interest i
Percent
7.327 .
""7. '628'-
""7.'263".
7.20 7.20 7.10 7.05 7.05 7.05 7.15 7.10 . 7.05 . 7.10 . 7.15 .
6.44 . 6.25 . 5.65 . 6.37 .
4 6. 681 .
7.157 .
7.435 .
3.50
6.40 .
7.15 7.15 7.05 . 7.05 . 7.05 . 7.15 .
7.10 .
7.60
7.127 .
7.15 . 7.20 . 7.20 . 7.20 . 7.20 . 7.05 . 7.05 . 7.15 . 7.15 .
Amount issued 2
-$5,000.00
-2,000.00
-1,000.00
30,000,000.00 . 4,000,000. 00
22,000,000.00 . 7,000,000.00 . 5,000,000.00 .
20,000,000. 00 163,000,000.00
518,846, OOQ. 00 . 1,281,512,000. 00 .
255,392,000. 00 948,677,000. 00 . 66,553,826. 57 .
8,000, 000. 00 . 18,000,000. 00 .
29,799,029. 80 .
-40,000.00 . 40,000. 00 .
Amount matured or caUed or re
deemed prior to raatmity 3
$40,000,000. 00 1,000,000.00
22,000,000. 00 93,000,000. 00
49,720,323.18 49,705,494.94 50,144,164.47 50,006, 250. 78
518,846, 000. 00
255,392,000. 00 2,115,965, 000. 00
3,626,620. 77
4,000,000. 00 8,000,000. 00 2,000,000. 00 2,000,000. 00
29,977,691. 02
3, 000,000. 00 30,000,000. 00 7,000,000. 00 4,000,000. 00
16,000. 000. 00 5,000,000. 00 9,000,000. 00
65,000,000. 00 8.000.000.00
Footnotes at end of table.
Digitized for FRASER http://fraser.stlouisfed.org/ Federal Reserve Bank of St. Louis
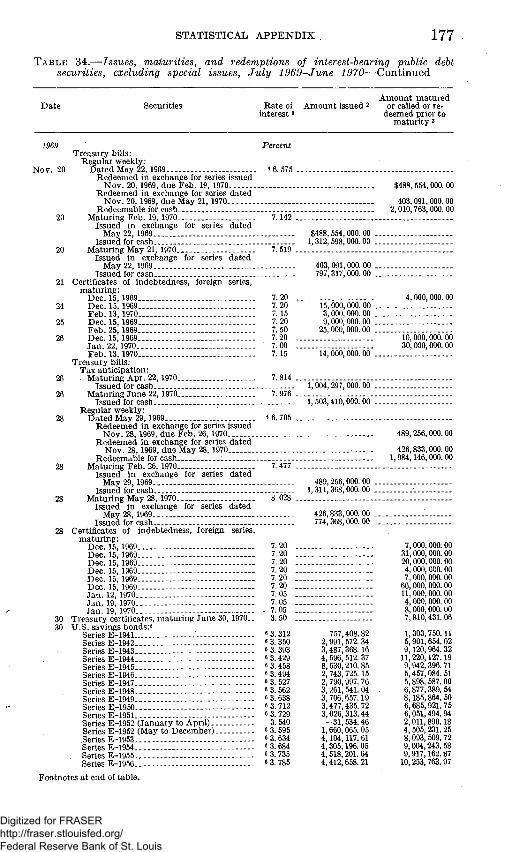
STATISTICAL APPENDIX 177 T A B L E 34.—Issues, maturities, and redemptions of interest-bearing public debt
securities, excluding special issues, Ju ly 1969-June 1970—Continued
D a t e
1969
N o v . 20
20
20
21
24
25
26
26
26
28
28
28
28
30 30
Securities
Treasu ry biUs: Regular weekly:
D a t e d May 22, 1969 Redeemed in exchange for series
N o v . 20, 1969, due F e b . 19, 197C Redeemed in exchange for series
N o v . 20, 1969, due May 21, 1970 Redeemable for cash
Matur ing F e b . 19, 1970. Issued in exchange for series
May 22, 1969 Issued for cash . .
Matur ing May 21, 1970 Issued in exchange for series
May 22, 1969 Issued for cash
Certificates of indebtedness , foreign m a t u r i n g :
Dec . 15, 1969 Dec . 15,1969 F e b . 13, 1970 Dec . 15, 1969 F e b . 25,1969 Dec . 15, 1969 J a n . 22, 1970 F e b . 13,1970
Treasu ry biUs: Tax ant ic ipat ion:
Matur ing Apr . 22,1970. Issued for cash
Matur ing J u n e 22,1970 Issued for cash
Regular weekly: D a t e d May 29,1969
Redeemed in exchange for series N o v . 28, 1969, due F e b . 26, 1970
Redeemed in exchange for series N o v . 28,1969, due May 28, 1970
Redeemable for cash i . M a t m i n g F e b . 26,1970
Issued in exchange for series May 29,1969
Issued for cash M a t m i n g May 28,1970
Issued in exchange for series Mav 28 1969
Certificates of indebtedness , foreign m a t m i n g :
D e c 15, 1 9 6 9 . -Dec . 15 ,1969. . . Dec . 15, 1969. Dec . 15, 1969 Dec . 15,1969 Dec . 15, 1969 J a n . 12, 1970. . J a n 19 1970 . . . J an . 19, 1970
Treasury certificates, ma tu r ing June 30, U . S . savings bonds:5
SeriesE-1941 SeriesE-1942 . . - -Series E-1943 - - . . ---SeriesE-1944 -Series E-1945. SeriesE-1946 - - - -Series E-1947 -Series E-1948 - - --Series E-1949 Series E-1950 Series E-1951 - -Sprips E-1952 CJanuarv to April) Series E-1952 (May to December) . . Series E-1953 . - . . ---Series E-1954 Series E-1955 - -Series E-1956
issued
dated
"d'a't'e'd'
da ted
series.
issued
'd'ate'd'
da ted
da ted
series,
' 1 9 7 0 -
R a t e of interest i
Percent
4 6. 575 .
7.142 .
7.519 .
7.20 . 7.20 7.15 7.20 7.50 7.20 . 7.00 -7.15
7. 814 .
7.976 .
4 6. 705 .
7.477 .
8. 028 .
7.20 . 7.20 . 7.20 . 7.20 -7.20 . 7.20 . 7.05 . 7.05 -
- 7.05 . 3.50 -
8 3. 312 6 3. 350 6 3. 393 6 3.429 6 3.458 6 3.494 6 3. 527 6 3. 562 6 3. 638 6 3. 712 6 3.729
3.540 6 3. 595 8 3. 634 6 3. 684 0 3. 735 6 3. 785
A m o u n t issued 2
$488,554,000.00 . 1,312, 598,000. 00 .
403,091, 000. 00 . 797,317, 000. 00 .
15, 000,000. 00 . 3,000,000. 00 . 9, 000, 000. 00 .
25,000,000. 00 .
14,000,000.00 .
1,004,297,000.00 .
1, 503,410,000. 00 .
489,256,000. 00 . 1,311,368,000.00 .
. 426,833,000. 00 . 774,368,000. 00 .
757,408. 82 2,991, 572. 34 3,487,368.16 4, 596, 512. 37 8, 530,210. 85 2,743,725.15 2,790,997. 76 3,261, 541. 04 3,706,657.19 3,477,435.72 3,026,313.44
-31,534.46 1,660,065.05 4,104,117. 61 4,305,196.06 4, 518,201. 64 4,412,658.21
Anioun t m a t u r e d or caUed or re
deeraed prior to raaturity 3
$488, 554,000. 00
403,091,000.00 2,010.763,000. 00
4,000,000. 00
10,000,000. 00 30,000,000. 00
489,256,000. 00
426,833,000. 00 1,984.146,000. 00
7,000,000.00 31.000,000. 00 20,000,000. 00 4,000,000. 00 7,000,000. 00
66,000,000. 00 11,000,000. 00 4,000,000. 00 8,000,000. UO 7,810,431.06
1,303, 750.11 5, 901,654. 02 9,120,964.32
11,220,127.19 9,942,396. 71 5,457,084.51 5,898, 587. 00 6,877,389. 64 8,185,864. 50 6,685,92L75 6,051,494. 94 2, o n , 890.18 4,505,231. 25 8,093,509. 72 9,004,243.58 9,917,162.87
10,253,763.97
Footnotes at end of table.
Digitized for FRASER http://fraser.stlouisfed.org/ Federal Reserve Bank of St. Louis

178 19 70 REPORT OF THE SECRETARY OF THE TREASURY
TABLE 34.—Issues, maturities, and redemptions of interest-bearing public debt securities, excluding special issues, July 1969-June 1970—Continued
Date
1969 N o v . 30
30
30
30
30
30 30 30 30
30 30'
Dec . 112
1
Secmities
U . S . savings bonds : s—Continued Series E-1957 (January) . . Series E-1957 (Februa ry t'o 'December) Series E-1958 Series E-1959 ( January to May) Series E-1959 ( June to D ecember) . SeriesE-1960 Series E-1961 SeriesE-1962 Ser iesE-1963 . - - . - . Series E-1964 Series E-1965 ( January to Nove rabe r ) . Series E-1965 (Deceraber) Series E-1966 Series E-1967 Series E-1968 ( Jahuary to May) Series E-1968 (June to Deceraber) _ . . Series E-1969 Unclassified sales and rederapt ions SeriesH-1952 Series H-1953 SeriesH-1954 SeriesH-1955 Series H-1956 Series H-1957 ( January) Series H-1957 (Feb rua ry to December) Series H-1958 Series H-1959 ( January to May) Series H-1959 (June to December) . . . Series H-1960 . . SeriesH-1961 SeriesH-1962 Series H-1963 SeriesH-1964 Series H-1965 ( Janua ry to Nove rabe r ) . Series H-1965 (Deceraber) SeriesH-1966 SeriesH-1967 Series H-1968 ( J anua ry to May) Series H-1968 ( June to December) Series H-1969 Unclassified sales a n d redempt ions
Treasury no'tes, Series E-1971 Adjus tments of issues n
Treasury notes, Series A-1973 Adjus t raents of issues n .
Treasury notes, Series C-1976 Adjus tments of issues 11. . .
U . S . savings notes:« Series S-1967... Series S-1968 ( January to M a y ) . Series S-1968 (June to December) Series S-1969 Unclassmed
U . S . re t i rement p lan bonds Depos i ta ry bonds , Fi rs t Series Treasu ry bonds , R E A Series _ Treasu ry bonds, Inves t raent Series B-1975-80-
Redeemed in exchange for l}47o T r e a s m y notes, Series E 0-1974
Treasury notes, Series E 0-1974 Miscellaneoiis
To ta l November
T reasu ry biUs: Regular m o n t h l y :
D a t e d N o v . 30,1968 Redeemed in exchange for series issued
N o v . 30,1969, due Aug . 31,1970 Redeeraed in exchange for series da ted
Nov . 30,1969, due N o v . 30,1970 Redeemable for cash
Matur ing Aug. 31, 1970-Issued in exchange for series da ted N o v .
30,1968-Issued for cash
R a t e of interest i
Percent
3.820 6 3. 956 6 4.004
4.040 6 4. 054 6 4. 077 6 4.103 6 4.049 6 4. 040 6 4. n o 6 4.166
4.220 4.226 4.237 4.250 4.250 4.250
6 3.497 -8 3. 539 -8 3. 588 -6 3.637 -8 3.689 -
3. 730 . 6 3. 903 -8 3. 959 -
4.000 -8 4. 032 -8 4.046 -6 4. 077 -6 4.107 . 6 4.141 . 8 4.172 . 6 4.205 .
4. 220 . 4. 225 . 4.235 . 4.240 . 4.250 . 4.250
8.00 -
7 ^ -- — --—_
4.74 4.74 5.0O 5.00
' " " 3 . " 9 7 " 2.00 2.00 . 2M -
m
4 5.814 .
7.777 .
Araoun t issued 2
$799.07 5,433,473,06 5,399,725. 53
-52,982.92 2,122,816. 30 6,261,945.47 6,765,170. 04
11,481,749.40 7,245,694.83 7,183,745.18 7,130,671. 94
104. 93 8,094,576.99 8,001,066. 69 9,186,925.13 7,182,314. 09
299,923,389. 06 7 -40,190,614. 21
24,893, 500.00 7 -4 , 251,000.00
-153,000.00 -
618,000,00 .
360,617.77 377,845.89
1.207.314. 92 26. 683.101.55
-3,237,180. 25 144, 654.56 416,000.00
1,582,000.00 .
15,624, 557,728.33
139,208,000.00 361,458,000.00 .
A m o u n t m a t u r e d or caUed or re
deemed prior to m a t u r i t y 3
$978,801. 71 9,648,824.71
11,653,210.01 5,277,701.35 7,713,769.15
12,304,049. 25 15,851,032.37 11,889,126. 90 13,188,796.18 13,684,476.63 14,415,355.69 1,687,675.89
20,947,636. 95 26,567,931. 86 15,222,470.38 32,941,394.82
122,008,917. 03 7 -79,426,328. 36
463,500. 00 1,037,000.00 2,387,500. 00 3,149, 500. 00 2,498,000. 00
282,000. 00 2,089,000. 00 3,652,000.00 2,193,000.00 4,127,000. 00 4,205,000.00 4,980,000.00 3,999,000.00 3,743, 500. 00 2,987,000. 00 2,456,500.00
95,500. 00 2,806,000. 00 2,125, 500. 00
682,000. 00 836 500.00 828,000.00
3,184,500.00
1, 647,590.47 2 004,641. 84 4, 593,731.63
149, 262.75 C)
70 180.92 638,000.00 786,000.00
1,582,000.00
34,316, 500.00
13,004,840,262.41
139, 208,000.00
275,467,000.00 1,086,326,000.00
Footnotes at end of table.-
Digitized for FRASER http://fraser.stlouisfed.org/ Federal Reserve Bank of St. Louis

STATISTICAL APPENDIX 179 T A B L E 34.—Issues, maturities, and redemptions of interest-bearing public debt
securities, excluding special issues, Ju ly 1969-June 1970—Continued
D a t e Securities R a t e of Amovmt issued 2 interest 1
A m o u n t m a t u r e d or called or re
deeraed prior to m a t u r i t y 3
Dec* 1 7.591
7.20 7.05 7.05 7.05 7.15 7.50 7.05 7.00 7.45 7.45
7.814
7.976
;.028
10
10
10
11
Percent Treasu ry bi l ls :—Continued
Regu la r mon th ly .—Con t inued M a t m i n g N o v . 30,1970.
Issued in exchange for series da ted N o v . 30,1968.
Issued for c a s h , . -1 Certificates of indebtedness , foreign series,
m a t u r i n g : Dec . 5, 1969 Dec . 15, 1969 . - . J a n . 12, 1970 J a n . 19,1970 F e b . 13,1970 Mar. 2, 1970 -
2 Dec . 5,1969 - . . J an . 26, 1970. . - - - - . -Mar. 3,1970 -
3 Mar. 4,1970 T r e a s m y biUs:
T a x ant ic ipat ion: 4 Matur ing Apr . 22,1970.--
Adjus t raents of cash issues 4 M a t m i n g J u n e 22,1970
Adj us tmen t s of cash issues Regular weekly:
4 M a t u r i n g M a y 28,1970. . Adjus tments of cash issues
4 D a t e d J u n e 5,1969 4 6.762 Redeemed in exchange for series issued
Dec. 4, 1969, due Mar. 5, 1970 Redeemed in exchange for series da ted
Dec. 4,1969, due J u n e 4 ,1970. . Redeemable for cash
4 M a t m i n g Mar. 5,1970 7.452 Issued in exchange for series da ted
J u n e 5, 1969 Issued for cash— - . .
4 Matur ing J u n e 4,1970 7.613 Issued in exchange for series da ted
J u n e 5, 1969 Issued for cash
4 Certificates of indebtedness , foreign series, ma tu r ing :
J a n . 26 ,1970. . Mar . 4,1970
5 Dec . 5, 1969 Dec . 5,1969 Mar. 5,1970 7.45
8 Mar. 4, 1970 7.45 T rea su ry biUs:
Regular weekly: 8 M a t m i n g Apr . 23,1970. 7.265
Adjus tmen t s of cash issues Adjus tments of exchange issues -.
9 Certificates of indebtedness, foreign series, ma tu r ing :
Jan . 12 ,1970 . . - -Jan . 26,1970 - - -Mar. 4, 1970 - -Dec . 10,1969-Dec . 10,1969 J an . 12,1970 -Mar. 4,1970 Mar. 10,1970
Treasury certmcates, ma tu r ing .Tune 30,1970.. Treasury bills:
Regular weekly: Matur ing May 7, 1970
Adjus tments of cash issues D a t e d J u n e 12,1969 47.068 . Redeemed in exchange for series issued
Dec. 11,1969, d u e M a r . 12,1970 Redeemed in exchange for series da ted
Dec . 11,1969, due J u n e 11,1970 Redeeraable for cash
$275,467,000.00 725,732.000.00 .
14,000,000.00 . 15,000,000.00 . 35,000,000.00 . 12,000,000.00 . 5,000.000.00 .
15,000,000.00 . 16,000,000.00 . 25,000,000.00 . 14,000,000.00 . 6,000,000.00 .
3 175,000 00
160,000.00
-12,000.00
$440.858,000.00
303,028, 000.00 2,159,881, 000. 00
440,858,000.00 1,358,936,000.00 .
303,028,000.00 897,209,000.00
7.00 7.45 7.05 7.05
5,000,000.00
30,000,000.00 . 17,000,000.00 .
3,000.00 . -3,000.00 .
7.05 7.00 7.45 7.20 7.20 7.05 7.45 7.70 3.50
7.281
10,000,000.00
1,000,000.00 . 6,000,000.00
35,000,000.00 112.50
-743,000.00
14,000,000.00
14,000, 000.00 16, 000,000.00
1, 000,000.00 11,000,000.00
19,000, 000. 00 16,000,000.00
294,473,000. 00
210,199,000.0 0 2,396,154.000.00
Footnotes at end of table.
Digitized for FRASER http://fraser.stlouisfed.org/ Federal Reserve Bank of St. Louis

180 19 70 REPORT OF THE SECRETARY OF THE TREASURY
TABLE 34.—Issues, maturities, and redemptions of interest-bearing public debt securities, excluding special issues, July 1969-June 1970—Continued
D a t e Securities Araoun t m a t u r e d
R a t e of A m o u n t issued 2 or called or re-interest 1 deeraed prior to
m a t u r i t y 3
1969
Dec. 11
15
18
18
18
22
Treasury bills— Cont inued Regular weekly—Cont inued
Matming Mar. 12,1970 Issued in exchange for series da ted
J u n e 12,1969. . . Issued for cash
Matur ing June 11,1970.. . Issued in exchange for series da ted
June 12,1969. . . Issued for cash
Certificates of indebtedness, foreign series, raaturing:
Jan . 12,1970 Mar. 12,1970 Dec. 15,1969 Dec . 15,1969 Dec. 15, 1969 Dec. 15,1969 Dec . 15,1969. . . Dec. 15, 1969 J a n . 12,1970 Jan . 26, 1970 Mar. 16,1970.
Treasu ry certificates, ma tu r ing : • Dec. 15,1969.
J u n e 15,1970 Treasury bonds of 1964-69
Redeeraable for cash Certificates of indebtedness, foreign series,
ma tu r ing : Jan . 22,1970 Jan . 26, 1970 Mar. 3, 1970.. Mar. 4,1970 Mar. 4, 1970.. Mar. 4,1970 Mar. 4,1970 Jan . 22, 1970 J an . 26,1970 Mar. 4,1970. .
T reasu ry biUs: Regular weekly:
D a t e d J u n e 19,1969.. Redeemed in exchange for series issued
Dec . 18,1969, due Mar. 19,1970 Redeemed in exchange for series da ted
Dec . 18,1969, due June 18,1970... Redeemable for cash . - - - . .
M a t m i n g Mar. 19,1970 Issued in exchange for series da ted
J u n e 19,1969 Issued for cash.
Matur ing June 18, 1970... Issued in exchange for series da ted
J u n e 19,1969 Issued for cash
Certificates of indebtedness , foreign series, ma tu r ing :
Mar. 16, 1970 .Tan. 12, 1970 . : J a n . 12,1970 J a n . 12, 1970 J a n . 19, 1970 J a n . 19,1970.- . . -J a n . 26, 1970 J a n . 26,1970 F e b . 13,1970 F e b . 13,1970.. Mar. 4,1970
Treasu ry bills: Tax ant ic ipat ion:
Matur ing Dec. 22, 1969 Redeemable for c a sh . .
Treasury certificates, m a t u r i n g J u n e 30, 1970.. Treasury bonds , ma tu r ing Dec. 23, 1979
Percent
7.701
7.803 .
$294,473,000.00 1,505, 500,000.00
210.199,000.00 . 990,124,000.00 .
7.05 7.70 7.20 7.20 7.20 7.20 7.20 7.20 7.05 7.00 7.70
1.00 1.00 2M
:, 000.000.00 $2. 000. 000. 00
2.000.000.00 16,000,000.00 91,000,000.00 ,
2, 801, 855. 51
7.00 7.00 7.45 7.45 7.45 7.45 7.45 7.00 7.00 7.45
4 6.965 .
11,000,000.00
7. 920 .
7.921
316,297,000.00 . 1,485,149,000.00
255,262,000.00 945,617,000.00
7.70 7,000,000.00
18,000,000.00 2, 000,000.00 4, 000, 000. 00
15, 000,000. 00 9,000,000.00
15,000,000.00
2,700,648.01
'677,'433," 000.'00
25,000,000.00
14.000, 6,000, 5,000,
17,000, 1,000,
15,000, 4,000, 9, 000,
000. 00 000. 00 000.00 000.00 000. 00 000.00 000.00 000.00
316, 297,000.00
255, 262,000.00 2, 330, 240,000. 00
7.05 7.05 .-7.05 7. 05 . -7.05 .-7. 00 .. 7.00 7.15 7.15 .. 7.45
6.775 ..
3.50 3M
21,852,401.70 .. 75,000,000.00 ..
32, 000, 000. 00 1, 000,000. 00 2, 000,000. 00
18. 000, 000. 00 12, 000,000. 00 12, 000, 000. 00 11,000, 000. 00 18, 000, 000. 00 3, 000, 000. 00 5, 000, 000. 00
1, 762,646,000. 00
Footnotes at end of table.
Digitized for FRASER http://fraser.stlouisfed.org/ Federal Reserve Bank of St. Louis

STATISTICAL APPENDIX 181 T A B L E 34.—Issues, maturities, and redemptions of interest-hearing public debt
securities, excluding special issues, Ju ly 1969-June 1970—Continued
Date
1969 D e c . 23
24
24
26
26
26
26
29 29
30
31
31
31
31
31
Securities
Certificates of indebtedness , foreign series, ma tu r ing :
F e b . 13,1970 Mar. 4, 1970. Mar. 12,1970 F e b . 13,1970 F e b . 13,1970 Mar. 5, 1970 Mar. 10,1970 Mar. 16, 1970 . . . . Mar. 24,1970
Treasm-y notes, foreign series, m a t u r i n g N o v . 2,1970
T r e a s m y bills: Regular weekly:
D a t e d J u n e 26,1969 Redeeraed in exchange for series issued
Dec . 26,1969, due Mar. 26,1970 Redeemed in exchange for series da ted
Dec . 26, 1969, due J u n e 25,1970 Redeemable for c a s h . .
Matur ing Mar. 26 ,1970. . . Issued in exchange for series da ted
J u n e 26, 1969 Issued for cash
Matm-ing J u n e 25, 1970 Issued in exchange for series da ted
J u n e 26, 1969 Issued for cash . . .
Certificates of indebtedness , foreign series, ma tu r ing :
Mar. 5"; 1970.. Mar. 10, 1970 Mar. 16, 1970
Treasu ry certificates, m a t u r i n g J u n e 30,1970. . Certificates of indebtedness , foreign series,
m a t u r i n g : F e b . 13, 1970 Mar. 3, 1970 Mar. 4, 1970 •.. Mar. 5, 1970 Mar. 12, 1970 Mar. 16, 1970 Mar. 30, 1970 Mar. 30, 1970 F e b . 13, 1970 Mar. 31, 1970 J a n . 29, 1970 Mar. 3, 1970 Mar. 4. 1970 Mar. 12, 1970 Mar. 12, 1970 Mar. 16, 1970 Mar. 16, 1970 Mar. 16, 1970 Mar. 16, 1970 Mar. 16, 1970 Mar. 30, 1970 F e b . 13, 1970
Treasury certificates, ma tu r ing June 30 ,1970 . . . T reasury biUs:
Regular m o n t h l y : D a t e d Dec . 3 1 , 1 9 6 8 . . . .
Redeemed in exchange for series issued Dec . 31,1969, due Sept. 30,1970
Redeemed in exchange for series da ted Dec . 31,1969, due Dec . 31,1970
Redeeraable for cash Matur ing Sept . 30,1970.
Issued in exchange for series da ted Dec . 3 1 , 1 9 6 8 . . . .
Issii6d for cash Matm-ing Dec . 31,1970
Issued in exchange for series da ted Dec. 31 1968 - -
Issued for cash
R a t e of interest i
Percent
7.15 . 7.45 . 7.70 . 7.15 . 7.15 . 7.45 -7.70 . 7.70 7.80
6.40 .
4 7. 050 .
7.805 .
7.815 .
7.45 7.70 7.70 3.50
7.15 7.45 7.45 7.45 7.70 7.70 7.80 7.80 . 7.15 8.10 7.05 . 7.45 . 7.45 . 7.70 . 7.70 . 7.70 . 7.70 . 7.70 . 7.70 . 7.70 . 7.80 . 7.15 3.50
4 6.294 .
7.801 .
7.561 .
Araoun t issued 2
$54,000,000.00 . 15, 000, 000. 00 .
377,470,000.00 . 1,431,878,000.00 .
305,994,000.00 . 903,141, 000. 00 .
28, 000,000. 00 . 10, 000, 000. 00 . 26,000, COO. 00 .
155, 527, 487. 76 .
7,000,000.00 . 7,000,000.00 .
75,000, 000. 00 . 2,000,000.00 .
28,000,000.00 . 22,000,000.00 .
165,000,000.00 .
10,000,000.00 . 42,000,000. 00 .
8,000,000.00 . 1,323,287.67
116,757,000.00 . 383,396,000. 00 .
252,026,000.00 . 749,962,000.00 .
Araount m a t u r e d or caUed or re
deemed prior to m a t m i t y 3
$2,000,000.00 1, 000,000. 00 2,000,000. 00
12,000,000. 00 5, 000,000. 00
30, 000, 000. 00 10, 000,000. 00
56,342. 30
377, 470,000. 00
305, 994, 000. 00 2, 217, 376, 000. 00
140, 000,000.00
30,000,000.00 7,000,000. 00
75,000, 000. 00 2,000,000. 00
28,000,000.00 91,000,000. 00
7,000,000. 00 54,000,000.00 26,000,000. 00 5,000,000.00
25,000,000. 00
4, 562,406. 79
116,757, 000. 00
252, 026,000. 00 1,130,919,000. 00
Footnotes at end of table.
Digitized for FRASER http://fraser.stlouisfed.org/ Federal Reserve Bank of St. Louis

182 19 70 REPORT OF THE SECRETARY OF THE TREASURY
T A B L E 34.—Issues, maturities, and redemptions of interest-bearing public debt securities, excluding special issues, Ju ly 1969-June 1970—Continued
Date Securities Rate of interest i
Araount issued 2 Amount raatured
or caUed or redeemed prior to
maturity 3
1969 Percent Dec. 31 U.S. savings bonds:5
SeriesE-1941 63.340 SeriesE-1942 6 3.397 Series E-1943 6 3.450 SeriesE-1944 63.521 Series E-1945_.. 63.575 SeriesE-1946. 6 3.661 Series E-1947.. 63.719 Series E-1948 63.730 Series E-1949... 6 3.883 Series E-1950 63.963 Series E-1951 63.735 Series E-1952 (January to April) 3. 570 Series E-1952 (May to December) 6 3.633 Series E-1953 6 3.696 Series E-1954 63.732 Series E-1955 6 3. 866 Series E-1956... 6 4. ooi Series E-1957 (January) 4.080 Series E-1957 (February to Deceraber) 6 4.217 Series E-1958. 64.308 Series E-1959 (January to May) 4.370 Series E-1959 (June to December) 6 4. 330 SeriesE-1960 64.433 Series E-1961 6 4. 506 Series E-1962 6 4. 553 SeriesE-1963 6 4.315 Series E-1964. 64.173 Series E-1965 (January to November) 6 4.266 Series E-1965 (December) 4.420 Series E-1966 4.449 Series E-1967 4. 555 Series E-1968 (January to May) 4.640 Series E-1968 (June to December) 5. 035 Series E-1969 (January to May) 4.800 Series E-1969 (June to December) 5.000 Unclassified sales and redemptions SeriesH-1952 63.539 Series H-1953--.. 63.593 SeriesH-1954 63.673 SeriesH-1955 63.743 Series H-1956 63.354 Series H-1957 (January)... 3.920 Series H-1957 (February to December) 6 4.120 Series H-1958 64.202 Series H-1959 (January to May) 4. 270 Series H-1959 (June to Deceraber) 6 4.322 SeriesH-1960 64.336 Series H-1961 6 4. i65 SeriesH-1962 6 4.064 Series H-1963 6 4.145 SeriesH-1964.. 64.235 Series H-1965 (January to November) « 4.326 Series H-1965 (December) 4. 570 SeriesH-1966 4.594 SeriesH-1967 4.664 Series H-1968 (January to May) 4.720 Series H-1968 (June to December) 4.769 Series H-1969 (January to May) 4.830 Series H-1969 (June to December) 5.000 Unclassified sales and redemptions
31 Treasury notes. Series D-1970 6H Adjustments of issues n
31 Treasmy notes. Series D-1971 7M Adjustments of issues u
31 Treasury notes. Series E-1971 8.00 Adjustments of issues "
31 Treasury notes, Series A-1973 7M Adjustments of issues n
31 Treasm-y notes, Series B-1976 6M Adjustments of issues u.
31 Treasury notes. Series C-1976 ly , Adjustments of issues n.
Footnotes at end of table.
$2,090,902.93 $1,748,476.66 3,967,808.15 7, 559, 559. 01 3, 877,384. 85 12,134, 313.65 10,922,217. 66 14, 029, 554.11 8,944,316. 41 12,232,283. 80 3,645, 716. 49 7,120,781. 82 3,635,218. 00 7,406,319. 58 4,450,103. 69 8, 566,185.11 5,436,437.48 10, 387,632. 26 4, 204,999. 28 8,325, 055. 63 3,688,989. 69 7, 299,114. 78 -25, 225. 23 2, 527,208.98 1, 786, 619. 87 5, 283, 652. 35 4,158, 287. 08 9, 650, 556. 58 4, 099,644. 73 10,907, 033. 75 4,493, 445. 07 11, 827,643. 97 4, 568,476. 55 12, 215,786. 30
419. 96 1, 054,454. 08 2,725, 373. 52 11, 246,118. 83 6, 254, 347. 74 14, 057, 883.92 3,420,037.99 5,985,031.81 2, 254, 562. 40 9,050, 043. 31 5, 200, 306. 65 14,447,857. 53 6, 248, 412. 41 18, 068, 737. 34 13,101, 756. 89 15,467, 620. 50 7,950,944.88 15,883,877. 21 8,207,473. 50 16, 626, 881. 65 3,725, 779. 22 17,104.489. 60 4, 517,880. 51 2, 065,271. 56 9,311, 534. 69 24, 514,362.11 9,134,602.14 30, 750, 899. 95 -147,766.53 17,054,831.36
13, 037, 791. 42 34, 520, 285. 43 -900,702,173.47 -49,789,016.43 1, 309, 615, 836. 90 192,991,781. 25 7 - 74,417,781.03 7 _ 103,480,470.10
379,000.00 1,382,500.00 2,378,500.00
. 3,324,000.00 2,533,500.00 129,000.00
2,383,000.00 3,391,500.00 1,731,000.00 3,925,500.00 3,478,000.00 4,381,500.00 3,462,000.00 3,251,500.00 2,413,000.00 2,129,500.00
9,500.00 2,733,500.00 2,065,500.00 806,500.00 643,500.00
-128, 286, 500. 00 406,000. 00 145, 012,000. 00 257,000. 00 8,216, 500. 00 6,624,000. 00
6,'ooo.'oo'---'-'---!------
"-67," ooo.'oo"'.'--'-.'.'.'-."-----
-708," 000." O O ' - - - - " . ' - ' . - - - -
-243," 656.'65"-----"."-'-".'---------------------------------
"'74,"655."5o'.".'.'."'-.".'.'-.'-.".".''.'.'--
Digitized for FRASER http://fraser.stlouisfed.org/ Federal Reserve Bank of St. Louis
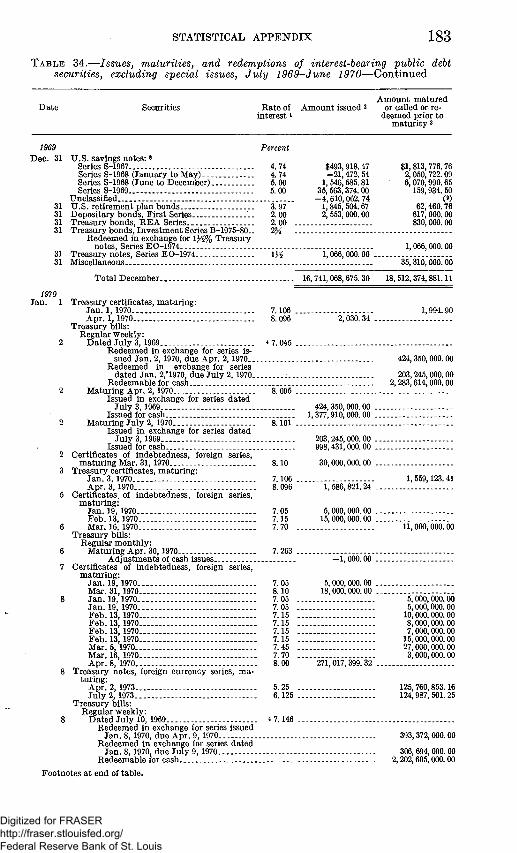
STATISTICAL APPENDIX 183 TABLE 34.—Issues, maturities, and redemptions of interest-hearing public debt
securities, excluding special issues, July 1969-June 1970—Continued
Date
1969 Dec. 31
31 31 31 31
31 31
1970 Jan. 1
Secmities
U.S. savings notes:» Series S-1967... Series S-1968 (January to May) Series S-1968 (June to Deceraber) . . Series S-1969
Unclassified U.S. retirement plan bonds Depositary bonds. First Series . . . Treasury bonds, REA Series Treasury bonds, Investment Series B-1975-80..
Redeemed in exchange for 13 ^% Treasm-y notes, Series EO-1974..
Treasury notes. Series E 0-1974 Miscellaneous.
Total December,.
Treasury certificates, maturing:
Rate of hiterest i
Percent
4.74 4.74 5.00 5.00
3.'97" 2.00 2.00 . 2M .
.........
Amount issued 2
$493,918. 47 -21,472. 54
1, 546, 585. 81 35, 563,374.00
-4,610,062. 74 1,845, 504.67 2, 553,000. 00
i,'o66,'o55.'65'
16,741,068,675. 30
Amount matured or caUed or re
deemed prior to maturity 3
$1,813,776.76 2,050,722.09 6,070,990.65
159,934. 60 («)
62,460.76 617, 000. 00 830, 000.00
1, 066, 000.00
35,310,000. 00
18, 512,374,881.11
Jan. 1,1970 Apr. 1, 1970
Treasury bills: Regular weekly:
Dated July 3,1969 Redeemed in exchange for series is
sued Jan. 2, 1970, due Apr. 2, 1970... Redeemed in exchange for series
dated Jan. 2,''1970, due July 2, 1970.. Redeeraable for cash
Maturing Apr. 2, 1970 Issued in exchange for series dated
July 3, 1969 Issued for cash
Maturing July 2, 1970 Issued in exchange for series dated
July 3, 1969 Issued for cash
Certificates of indebtedness, foreign series, maturing Mar. 31,1970
Treasury certificates, maturing: Jan. 3, 1970 Apr. 3, 1970
Certificates, of indebtedness, foreign series, maturing:
Jan. 19,1970 Feb. 13,1970 Mar. 16, 1970
Treasury biUs: Regular monthly:
Maturing Apr. 30, 1970 Adjustraents of cash issues.
Certificates of indebtedness, foreign series, maturing:
Jan. 19,1970 Mar. 31, 1970 Jan. 19, 1970 Jan. 19,1970-- -Feb. 13,1970 Feb. 13, 1970---Feb. 13, 1970 -Feb. 13,1970—- - -Mar. 6, 1970- -Mar. 16, 1970 - -Apr. 8, 1970
Treasury notes, foreign currency series, maturing:
Apr. 2, 1973 -July 2,1973 - -
Treasury bills: Regular weekly:
Dated July 10,1969-Redeemed in exchange for series issued
Jan. 8, 1970, due Apr. 9, 1970-Redeemed In exchange for series dated
Jan. 8,1970, due July 9, 1970 Redeemable for cash
7.106 . 8.096
4 7. 045 .
2,030.34 . 1,994.90
8. 095 .
424,350, 000. 00
203, 245, 000.00 2, 283,614,000. 00
424,350,000.00 . 1,377,910,000.00
203,245,000.00 . 998,431,000.00 .
30,000,000.00 .
7.106 8.096 1,586,821.24 .
1, 559,123.41
7.05 7.15 7.70
7.263 .
5,000,000.00 . 15,000,000.00 .
11,000, 000.00
-1,000.00 .
7.05 8.10 7.05 7.05 7.15 7.15 7.16 7.15 7.45 7.70 8.00
5.25 6.125
4 7.146 .
5,000,000.00 . 18,000,000.00
271,017,399.32 .
5,000,000.00 5,000,000. 00
10,000,000.00 8,000,000.00 7,000,000.00
15,000,000.00 27,000,000.00 3,000,000.00
125,760,853.16 124,987, 501. 25
393,372,000. 00
306, 694, 000. 00 2,202. 605, 000. 00
Footnotes at end of table.
Digitized for FRASER http://fraser.stlouisfed.org/ Federal Reserve Bank of St. Louis
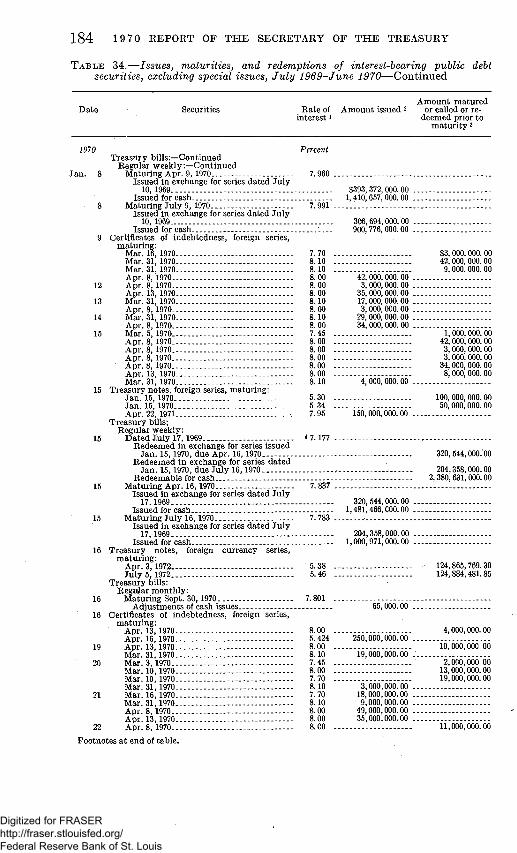
184 19 70 REPORT OF THE SECRETARY OF THE TREASURY
TABLE 34.—Issues, maturities, and redemptions of interest-bearing public debt securities, excluding special issues, July 1969-June 1970—Continued
D a t e Securities R a t e of mterest i
Araoun t issued 2 Araoun t m a t u r e d
or called or redeeraed prior to
m a t m i t y 3
1970 T r e a s u r y biUs:—Continued
Regular wee k ly :—C on t inue d J a n . 8 Matur ing A p r . 9, 1970
Issued in exchange for series da ted Ju ly 10, 1969
Issued for cash 8 Matur ing Ju ly 9, 1970
Issued in exchange for series da ted Ju ly 10,1969 -
Issued for cash 9 Certificates of indebtedness , foreign series,
ma tu r ing : Mar. 16, 1970 Mar. 31, 1970 Mar. 31, 1970. . . Apr . 8, 1970
12 Apr . 8, 1970 Apr . 13, 1970..
13 Mar. 31, 1970 Apr . 8, 1970
14 Mar. 31, 1970 A p r . 8, 1970
15 Mar. 5, 1970 Apr . 8, 1970 Apr . 8, 1970 Apr . 8, 1970 Apr . 8, 1970 A p r . 13, 1970 Miar. 31, 1970
15 Treasury notes, foreign series, raaturing: J an . 15, 1970 J a n . 15, 1970 Apr . 22, 1971
T r e a s u r y bills; Regu la r weekly :
15 D a t e d Ju ly 17,1969. . Redeeraed in exchange for series issued
J a n . 15, 1970, due Apr . 16,1970_ R e d e e m e d in exchange for series da t ed
J a n . 15,1970, due J u l y 16,1970. Redeemable for cash
15 M a t m h i g Apr . 16, 1970 Issued in exchange for series da ted J u l y
17,1969. I ssued for cash
15 Ma tu r ing J u l y 16,1970 Issued in exchange for series da ted J u l y
17,1969 Issued for cash
16 T r e a s u r y notes , foreign cur rency series, m a t m i n g :
Apr . 3, 1972 J u l y 5 ,1972 . .
T r e a s u r y biUs: Regujar m o n t h l y :
16 M a t m m g Sept. 30,1970 ---Adjus tmen t s of cash issues
16 Certificates of indebtedness , foreign series, m a t u r i n g :
Apr . 13,1970 -Apr . 16, 1970 . . . .
19 Apr . 13,1970 Mar . 31,1970
20 Mar . 3,1970 Mar . 10,1970 - - - -Mar. 10,1970 Mar . 31,1970
21 Mar . 16 ,1970 . . . . - - -Mar. 31,1970 - - -Apr . 8, 1970 Apr . 13,1970
22 Apr . 8,1970.- -
Percent
$393, 372, 000. 00 . 1,410,657,000.00 .
306,694,000.00 . 900,776,000.00 .
7.70 8.10 8.10 8.00 8.00 8.00 8.10 8.00 8.10 8.00 7.45 8.00 8.00 8.00 8.00 8.00 8.10
5.30 5.34 7.95
4 7.177 .
42,000,000.00 3,000,000.00 .
35,000,000.00 . 17,000,000.00 3,000,000.00
29,000,000.00 . 34,000,000.00
4,000,000.00 .
$3, 000, 000. 00 42, 000, 000. 00
9, 000, 000. 00
150,000,000.00 .
7.837 .
7.783 .
320,544,000.00 . 1,481,466,000.00 .
204,358,000.00 . 1,000,971,000.00 .
5.38 5.46
7.801 65,000.00
00 . 424 00 . 10 45 . 00 . 70 . 10 70 10 00 00 CO
250,000,000.00
"i9,'oo5,'o55."o5"
3,000.000.00 18,000,000.00 9,000,000.00
49,000,000.00 35,000,000.00
1, 000, 000. 00 42,000, 000. 00 3,000, 000. 00 3,000, 000. 00
34,000,000. 00 8,000, 000. 00
100, 000, 000. 00 50, 000, 000. 00
320, 544, ooo.'oo
204,358,000.00 2,380, 631,000.00
124,865,769.30 124,884,481.85
4,000,000.00
10,000,000.00
2,000,000.00 13,000,000.00 19,000,000.00
11,000,000.00
Footnotes a t end of t ab le .
Digitized for FRASER http://fraser.stlouisfed.org/ Federal Reserve Bank of St. Louis

STATISTICAL APPENDIX 185
T A B L E 34.—Issues, maturities, and redennptions of interest-bearing public debt securities, excluding special issues, Ju ly 1969-June 1970—Continued
D a t e Securities R a t e of interest i
A m o u n t issued 2 A m o u n t m a t u r e d
or called or redeemed prior to
matm-i ty 3
1970 Percent
7.50 8.08
7.561 .
7.70 7.70 8.00 7.70 7.70, 7.70 8.00
7.801
T r e a s m y bills: Regular weekly:
Jan . 22 D a t e d J u l y 24,1969 4 7 . 1 5 8 . Redeemed in exchange for series issued
J an . 22,1970, due Apr . 23,1970 Redeemed in exchange for series da ted
J a n . 22,1970, due Ju ly 23,1970 . Redeemable for cash
22 M a t u r m g A p r . 23 ,1970 . . . . 7 . 788 . I ssued in exchange for series da ted J u l y
24,1969. Issued for cash . . . —.
22 Matur ing J u l y 23,1970 7 . 6 6 3 . Issued in exchange for series da ted Ju ly
2 4 , 1 9 6 9 . . . : . - . . I ssued for cash . . — . . .
23 Certificates of indebtedness , foreign currency" series, m a t u r i n g :
J a n . 2C1970— J u l y 23,1970.
T rea su ry bills: Regular m o n t h l y :
23 Matur ing Dec . 31,1970 Adjus tments of cash issues
23 Certificates of indebtedness , foreign series, m a t u r i n g :
Mar . 16,1970 26 Mar. 16,1970 •
Apr . 8,1970 27 Mar. 16,1970
Mar . 16.1970 Mar. 16,1970 Apr . 8,1970
T r e a s m y biUs: Regular m o n t h l y :
27 M a t m i n g Sept. 30,1970 Adjus tmen t s of cash issues Adjus tments of exchange issues
28 Certificates of indebtedness , foreign series, m a t u r i n g Apr . 8,1970 1
28 T r e a s m y notes , foreign currency series, m a t u r i n g :
F e b . 19,1973 F e b . 19,197313.. Oct. 2 , 1973 . . Oct. 2,197313 :
T r e a s m y bills: RegiUar weekly :
29 D a t e d Ju ly 31,1969 Redeemed in exchange for series issued
J a n . 29,1970, due Apr . 30,1970 Redeemed in exchange for series da ted
J a n . 29,1970, due Ju ly 30,1970 . Redeemable for cash— 1
29 Ma tu rh ig A p r . 30, 1970 . . . . 7 .890 . Issued in exchange for series da ted
J u l y 3 1 , 1 9 6 9 . . . . I ssued for cash
29 Matu r ing Ju ly 30,1970 7 .776 . Issued in exchange for series da ted
Ju ly 31,1969 . - - -I ssued for cash
29 Certificates of indebtedness , foreign series, m a t u r i n g :
J a n . 29, 1970 7.05 . Mar . 16,1970 - 7.70 . Apr .8 ,1970 8.00 . A p r . 8 , 1970 - 8.00 Apr . 29, 1970 • 7.90
30 Mar . 16,1970 l ' 7.70 Mar .31,1970 8.10 Mar.31,1970 8.10 . Mar.31,1970 8.10 . Mar .31,1970 . . - 8.10
Footnotes a t end of tab le .
$370,542,000.00 1,431; 525,000.00
254,653,000.00 . 949,544,000.00 .
9,791,134.83 .
75.000.00
23,000,000.00 . 159,000,000.00 46,000,000.00
6,000,000.00 .
25,000.00 . -25,000.00 .
8.00
5.20 3.05 6.23 4.43
4 7.136
-124,393,581.29 . 134,590,058.25 .
-124,263,737.36 . 134,019,834.92 .
364,436,000.00 . 1,436,313,000.00 .
302,477,000.00 897.825.000.00
130,000,000.00
$370,542,000.00
254,653,000.00 2,274, 997,000. OQ
99,856,021.55
60,000,000.00 23,000,000.00 18,000,000.00
29,000,000.00
364,436,000.00
302,477,000.00 2,233,728,000.00
130,000,000.00 35,000,000.00
9,000,000.00 1,000,000.00
"64,"55o,'ooo.'o6 21,000,000.00 18,000,000.00 18,000,000.00 17,000,000.00
Digitized for FRASER http://fraser.stlouisfed.org/ Federal Reserve Bank of St. Louis

186 1970 REPORT OF THE SECRETARY OF THE TREASURY
T A B L E 34.—Issues, maturities, and redemptions of interest-bearing public debt securities, excluding special issues, Ju ly 1969-June 1970—Continued
D a t e Securities R a t e of interest i
A m o u n t issued 2 A m o u n t m a t u r e d
or called or redeemed prior t o
m a t u r i t y 3
1970 Percent J a n . 30 T r e a s u r y notes, foreign series, m a t u r i n g :
J a n . 30,1970 5.30 May 20,1970.- 8.10
30 T r e a s u r y notes , foreign currency series m a t u r ing:
J a n . 30,1970 - 5.40 J a n . 30,1970 - 5.30 J u n e l , 1971 - 8.10
30 Treasm-y certificates, m a t u r i n g : June30 ,1970 3.50
31 J a n . 31, 1970 - - 7.030 A p j . 30, 1970 - - . - 7.888
31 U . S . savings bonds : ^ SeriesE-1941 63.340 SeriesE-1942 - 63.39,7 Series E-1943 - 63.46O S e r i e s E - 1 9 4 4 . . - - 63.521 Series E-1945 63.575 SeriesE-1946 .- - 6 3.661 Series E-1947 - 63.719 Series E-1948 63.730 Series E-1949- 63.333 Series E - 1 9 5 0 . . - 63.953 Series E-1951 . . - 63.735 Series E-195 2 ( J anua ry to April) 3.570 Series E-1952 (May to December) 6 3.633 Series E-1953 6 3.696 Series E-1954 63.732 Series E-1955 . - - 63.366 Series E-1956 6 4.001 Series E-1957 ( January ) 4.080 Series E-1957 ( F e b r u a r y to D e c e m b e r ) . . . . 6 4.217 Series E-1958 64.303 Series E-1959 ( J a n u a r y to May) 4.370 Series E-1959 ( June to December) 6 4.330 SeriesE-1960 64.433 Series E-1961- - 64.506 SeriesE-1962 - --- 64.553 SeriesE-1963 64.315 Series E-1964 _ 64.173 Series E-1965 ( J a n u a r y to November ) 64.266 Series E-1965 (December) 4.420 Series £--1966 4.449 Series E-1967. 4.555 Series E-1968 ( J a n u a r y to May) 4.640 Series E-1968 ( June to D e c e m b e r ) . . . 5.035 Series E-1969 ( J a n u a r y to May) 4.800 Series E-1969 ( June to December) 5.000 Unclassified sales a n d r eden ip t i ons . - - . Ser iesH-1952. 63.539 Series H-1953 63.593 SeriesH-1954 «3.673 SeriesH-1955 63.743 Series H-1956 63.354 SeriesH-1967 ( January) 3.920 Series H-1957 (Februa ry to December) 6 4.120 Series H-1958 64.202 Series H-1959 ( January to May) 4.270 Series H-1959(June to Deceniber) 8 4.322 SeriesH-1960 64.336 SeriesH-1961 84.105 Series H-1962._ 64.064 SeriesH-1963 64.145 SeriesH-1964 64.235 Series H- l965(January to November) 6 4.326 Series H-1965 (December) 4. 570 SeriesH-1966 4.594 S e r i e s H 1967 4.664 S e r i e s H 1968(January to M a y ) . . . 4.720 Series H-1968(June to December) 4. 769 Series H-1969 (Jan ua ry to May) 4.830 Series H-1969(June to December) 5.000 Unclassified sales a n d redemptions
31 Treasury notes, Series D-1971. 7 y Adjus tments of issues n
31 Treasury notes. Series E-1971 8.00 Adjus tmen t s of issues n
Footnotes a t end of tab le .
$100,000,000.00 $100,000,000.00
125,425,118.79 25,554,652.11
25,533,890.44
3,546,519. 92 5,406,964.35 1,242,269.06
1,264, IOL 94
561,125.47 1,378, 734.07 4,241,938.32 5, 659,153.47 4,407,495.76 9,019,404.22 8,601,356.32 10,657,68L36 4,585,009.24 9,812,490.80 3,663,763.43 5,259.407.30 4,589,688.90 5,433,973.87 4,975,49L81 6,294,872.64 5,653,874.21 7,356,801. 58 5,815,323.86 6,168,120.60 4,230,720.67 5,381,553.91 2,315,424. 97 1,805,107.41 3,352,470.41 3,814,287.70 3,819,37L40 7,109,666.43 3,950,360.50 7,585,078.69 4,239,451. 63 8,452,608. 57 4,364,974.14 8,853,813'. 18
-70 ,347.83 792,473.48 4,593,374.50 8,224,886.19 4,857,607.13 10,152,939.77 2,547,393. 59 4,524,040.86 2,591,230.00 7,008,451. 51 5,233,882.61 10,221, 244. 57 2,558,875. 90 13,158, 736.08 9,297,492.96 11,954,237.26
10,704,237.01 11,454,007. 76 9,753,035.72 12.208,618.57 9,183,478. 27 13,255, 556.53
102.38 1,254,277. 75 9,485,805.13 17,518,165. 56 9,827,685. 55 22,092,329.57 4,931,742.06 12,260,835. 64 4,457,875.89 23,92L440.08 4,958,326.06 32,920,749.27
286,356,485. 56 91,905, 506. 25 80,240,284.09 191,027,681.80
442,500.00 1,458,000.00 2,798,500.00 3,983,500.00 3,250,500.00
123,500.00 3,199,000.00 4,671,000.00 1,295,000.00 5,405,500.00 4,471,500.00 5,741,000.00 5,154,500.00 4,043,000.00
. - . 4,126,500.00 2,533,000.00
684,500.00 3,993,000.00 3,206,000.00
. - - 957,500.00 11, 500. 00 1,300, 000. 00 36, 500. 00 543,000. 00
32,372,000. 00 449,000. 00 2,841, 000.00 2,081,000. 00
"-7,'027,'555.'55".'--.'.''.'.'.'--r--."'
9," 6 5 5 ^ 0 6 - - - - - - - - - - -
Digitized for FRASER http://fraser.stlouisfed.org/ Federal Reserve Bank of St. Louis
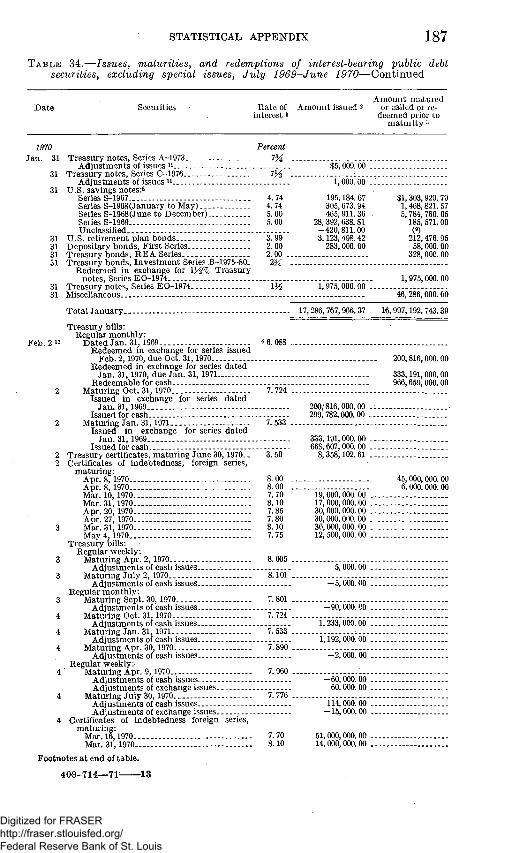
STATISTICAL APPENDIX 187 T A B L E 34.—Issues, maturities, and redemptions of interest-bearing public debt
securities, excluding special issues, Ju ly 1969-June 1970—Continued
D a t e Securities R a t e of interest i
Araoun t issued 2 Araoun t matm-ed
or called or redeemed prior to
m a t u r i t y 3
1970 Jan . 31 Treasu ry notes . Series A-1973
Adjus t r aen t s of issues u Treasury notes, Series C-1976
Adjus tmen t s of issues n U . S . savings notes:8
Series S-1967 Series S-1968(January to May) Series S-1968 (June to December) Series S-1969 Unclassified
U . S . re t i rement p lan bonds Depos i ta ry bonds . F i rs t Series. Treasury bonds , R E A Series
ol Treasury bonds , Inves tn ien t Series B-1975-80. Redeeraed in exchange for i y % Treasm-y
notes, Series EO-1974 31 Treasury notes. Series E 0-1974. 31 MisceUaneous
31
31
31 31 31
Percent 73^
i y " $5,000. 00 .
4.74 4.74 5.00 5.00
3.99 2.00 2.00 . 2M
1, 000. 00 .
195,184. 67 305,673. 94 465. 911. 36
28,392, 638. 81 - 4 2 0 , 8 n . 0 0 3,123, 498.42
283, 000. 00
$1,303,929. 79 1,468,821. 57 5,784,760. 05
185, 571. 00 (8)
212,476. 95 58, 000. 00
328, 000. 00
m 1,975, 000. 00 . 1,975,000. 00
46,286,000. 00
F e b . 2 12
To ta l J a n u a r y . - . 17,286,767,066.37 16,997,192,743.39
Treasu ry biUs: Regular m o n t h l y :
D a t e d J a n . 31,1969 - - - 4 6.088 --- ---Redeeraed in exchange for series issued
F e b . 2,1970, due Oct. 31,1970--.. -Redeeraed in exchange for series da ted
J a n . 31,1970, due J a n . 31,1971 Redeemable for cash -
Matur ing Oct. 31, 1970 ..- 7.724 Issued in exchange for series da ted
J a n . 31, 1969 - - - -Issued for cash . - .
M a t m i n g J a n . 31,1971 - - - 7.533 . Issued in exchange for series da t ed
J a n . 31,1969 ---Issued for cash. .
200;816,000.00 . 299, 782. ooo; 00 .
3.50
8.00 8.00 7.70 8.10 7.85 7.80 8.10 7.75
095 .
8.101
801
2 Treasury certificates, ma tu r ing J u n e 30,1970-. 2 Certificates of indebtedness , foreign series,
ma tu r ing : A p r . 8,1970 A p r . 8, 1970 Mar. 10,1970 Mar. 31,1970 Apr . 20, 1970 Apr . 27, 1970 -
3 Mar. 31,1970 May 4, 1970
Treasury biUs: Regular weekly:
3 Matur ing Apr . 2,1970 Adjus tmen t s of cash issues
3 Matur ing Ju ly 2,1970 Ad jus tmen t s of cash issues.
Regular m o n t h l y : 3 Matur ing Sept. 30,1970
Adjus tmen t s of cash issues 4 Matm-ing Oct. 31,1970
Adjus tments of cash issues 4 Matur ing J an . 31, 1971
Adjus tmen t s of cash issues 4 M a t m i n g Apr . 30, 1970
Adjus tmen t s of cash issues Regular weekly:
4 ' Matur ing Apr . 9,1970 Adj us tmen t s of cash issues Adjus tments of exchange issues
4 Matur ing Ju ly 30,1970 Adjus tmen t s of cash issues Adjus tmen t s of exchange issues.
4 Certificates of indebtedness foreign series, m a t m i n g :
Mar. 16,1970 7.70 Mar. 31,1970 8.10
Foo tno tes a t end of t ab le .
4 0 - 9 - 7 1 4 — 7 1 ' 1 3
333,191,000.00 . 668,607, 000. 00 .
8,358,102.61 .
19,000,000.00 . 17,000,000.00 . 30,000,000.00 . 30,000,000.00 . 36,000,000.00 . 12,500,000.00 .
5,000.00 .
-5,000.00 .
7.724 . -90,000.00 .
7. 533 1,233,000.00 .
7.890 . 1,192,000.00 .
-2 , 000. 00 .
7.C
7.776 .
-60,000.00 . 60,000. 00 .
114,000.00 . -15,000.00
51,000,000.00 . 14, 000.000.00 ,
200,816,000. 00
333,191,000. 00 966,659,000.00
45, 000,000. 00 6, 000,000. 00
Digitized for FRASER http://fraser.stlouisfed.org/ Federal Reserve Bank of St. Louis
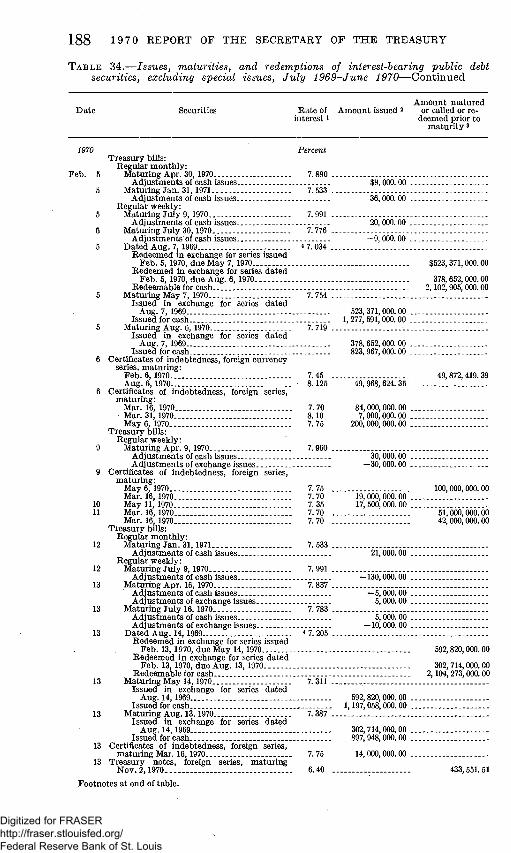
188 19 70 REPORT OF THE SECRETARY OF THE TREASURY
TABLE 34.—Issues, maturities, and redemptions of interest-bearing public debt securities, excluding special issues, July 1969-June 1970—Continued
Date Securities Rate of interest i
Aniount issued 2 Araount matured
or called or redeeraed prior to
maturity 3
$9, 000. 00
36, 000. 00
20,000.00
-9 ,000 .00
$523, 371,000.00
378, 652, 000. 00 2,102, 905, 000. 00
378, 652,000. 00 . 823, 967, 000. 00 .
49,968,624.35 .
84,000,000. 00 . 7,000,000.00 .
200, 000, 000. 00 .
30,000.00 . -30, 000. 00 .
19, 000, 000. 00 . 17, 500, 000. 00 .
21,000. 00 .
-130,000.00 .
-5,000.00 . 6,000. 00 .
6, 000.00 , -10,000.00 .
302,714,000.00 . 897, 948, 000. 00 .
14, 000, 000. 00 .
49,872,419. 39
1970 Perceiit Treasmy biUs:
Regular monthly: Feb. 5 Matm-ing Apr. 30, 1970 7.890
Adjustments of cash issues 5 Maturing Jan. 31, 1971 7.533
Adjustments of cash issues Regular weekly:
5 Maturing July 9, 1970 7.991 Adjustments of cash issues.
5 Matm-ing July 30,1970 7.776 Adjustments of cash issues . — J.
5 Dated Aug. 7,1969 47.034 Redeemed in exchange for series issued
Feb. 5, 1970, due May 7, 1970 Redeemed In exchange for series dated
Feb. 6, 1970, due Aug. 6,1970 Redeemable for cash
6 Matming May 7,1970 7.754 Issued in exchange for series dated
Aug. 7, 1969 523,371,000.00 Issued for cash 1,277,591,000.00
5 Matm-mg Aug. 6, 1970 7.719 Issued in exchange for series dated
Aug. 7, 1969 Issued for cash
6 Certificates of indebtedness, foreign currency series, matm-ing:
Feb. 6,1970 7.45 . Aug. 6, 1970 8.125
6 Certificates of indebtedness, foreign series, matm-hig:
Mar. 16, 1970 7.70 Mar. 31, 1970 8.10 May 6, 1970 7.75
Treasury bills: Regular weekly:
9 Maturing Apr. 9,1970 7.960. Adjustments of cash issues Adjustments of exchange issues
9 Certificates of indebtedness, foreign series, maturing:
May 6, 1970 7.75 . Mar. 16, 1970 7.70
10 May 11, 1970 7.35 11 Mar. 16, 1970 7.70 .
Mar. 16, 1970 7.70 . Treasury bills:
Regular monthly: 12 Maturmg Jan. 31, 1971 7.533.
Adjustments of cash issues Regular weekly:
12 Matming July 9,1970 7.991. Adjustments of cash issues.
13 Matming Apr. 16, 1970 7.837. Adjustments of cash issues. Adjustments of exchange issues
13 Maturhig July 16,1970 7.783. Adjustments of cash issues Adjustments of exchange issues
13 Dated Aug. 14,1969 47.205. Redeemed in exchange for series issued
Feb. 13,1970, due May 14,1970 Redeemed in exchange for series dated
Feb. 13, 1970, due Aug. 13,1970.. Redeemable for cash
13 Maturhig May 14,1970 7.311 -Issued in exchange for series dated
Aug. 14,1969 -. 592,820,000.00 Issued for cash 1,197,058,000.00
13 Matming Aug. 13,1970 7.387 Issued in exchange for series dated
Aug. 14,1969 Issued for cash _._ ._
13 Certtficates of indebtedness, foreign series, matming Mar. 16,1970. 7. 75
13 Treasury notes, foreign series, matming Nov. 2,1970 6.40
100,000,000.00
51,000,000. 00 42, 000,000. 00
692,820,000. 00
302,714, 000.00 2,104,273,000.00
433, 551. 61
Footnotes at end of table.
Digitized for FRASER http://fraser.stlouisfed.org/ Federal Reserve Bank of St. Louis

STATISTICAL APPENDIX 189 TABLE 34.—Issues, maturities, and redemptions of interest-hearing public debt
securities, excluding special issues, July 1969-June 1970—Continued
D a t e Securities R a t e of interest i
A m o u n t issued 2 A m o u n t raatured
or called or redeemed prior to
n i a tu r i t y 3
1970 Percent F e b . 15 Treasu ry bonds of 1970 (1-15-65) 4.00
Redeemed in exchange for: 83^% Treasury notes. Series F - 1 9 7 1 . . : $1,583,986,500.00 8 1 ^ % Treasu ry notes. Series B-1973 1,245,119,000.00 8% Treasu ry notes, Series A-1977 . • . . . 1,140,528,500. 00
Redeeraable for cash 411,785,000.0 15 Treasu ry bonds of 1965-70 2 y
Redeeraed in exchange for: 8 1 ^ % Treasury notes. Series F-1971 668,399, 500. 00 8 H % Treasm-y notes, Series B-1973 594,282,000.00 8% Treasu ry notes, Series A-1977 715,096,500.00
15 Treasu ry notes. Series F-1971 834 Issued in exchange for:
4% Treasu ry bonds of 1970 (1-15-65). $1, 583,986, 500. 00 23^% T r e a s m y bonds of 1965-70 668,399,500.00
15 T r e a s m y notes. Series B-1973 83^ . -Issued in exchange for:
4% T r e a s m y b o n d s of 1970 (1-15-65) 1,245,119,000.00 -23^ T r e a s m y bonds of 1965-70 594,282.000.00 -
15 T r e a s m y notes . Series A-1977 8.00 . - - -Issued hi exchange for:
4% Treasu ry b o n d s of 1970 (1-15-65) 1,140,528, 500. 00
7.70 7.75 7.70 7.70 7.70 7.70 7.70 7.70 6.80
30,000,000.00 30,000,000.00 .
162,000,000.00 . 150,000, 000. 00 .
23^% Treasu ry bonds of 1965-70 715,096,500. 00 . 16 Certtficates of indebtedness , foreigii series,
ma tu r ing : Mar. 16,1970 - - . May 6,1970.
17 Mar. 16,1970 Mar. 16 ,1970 . . . . Mar. 16, 1970 ^ . . .
18 Mar. 16, 1970 19 Mar. 12,1970
Mar. 16,1970 _•.... May 19,1970
T r e a s m y bills: RegrUar weekly:
19 D a t e d Aug. 21,1969. . - . 47.135 Redeemed in exchange for series issued
F e b . 19,1970, due May 21,1970 Redeemed in exchange for series da ted
F e b . 19,1970, due Aug. 20,1970. - - -Redeemable for cash
19 Matur ing May 21,1970 6.775 Issued in exchange for series da ted
Aug. 21,1969- 594,826,000. 00 . Issued for cash 1,207,759,000.00 .
19 Matm-ing Aug . 20,1970 6.917 -Issued in exchange for series da ted
Aug . 21,1969 Issued for cash _
Regular mon th ly : 20 Matur ing J a n . 31,1971 7 . 5 3 3 .
Ad jus tmen t s of cash issues - . --Adjustraents of exchange issues
24 Certtficates of indebtedness , foreign series, m a t m i n g :
May 19,1970 -25 F e b . 25,1970 - - -
Mar. 12,1970 Mar. 16,1970 Mar. 16,1970 -Mar. 16,1970 May 19,1970 May 25,1970
Treasury biUs: Regular m o n t h l y :
26 Matur ing Apr . 30,1970 Adjus tments of cash issues Adjus tmen t s of exchange issues
Regular weekly: 26 D a t e d Aug. 28,1969 47.1
Redeeraed in exchange for series issued F e b . 26,1970, due May 28,1970-
Redeemed in exchange for series da ted F e b . 26,1970, due Aug. 27,1970
Redeemable for cash
30,000,000. 00 100,000,000. 00 12,000, 000. 00 19,000,000. 00 6, 000, 000. 00
594,826, 000. 00
302, 600, 000. 00 2,106,148, 000. 00
302,600,000.00 . 894,738,000.00 .
9, 000. 00 . 10,000.00
6.80 7.50 7.70 7.70 7.70 7.70 6.80 6.85
7.8
25,000,000.00
75,000,000. 00 25,000, 000. 00 30, 000, 000. 00 30,000, 000. 00 16, 000, 000. 00 8, 000, 000.00
75,000, 000. 00
-196,000.00 . 196, 000.00 .
596,115,000. 00
351, 225,000. 00 2,064,306,000. 00
Foo tno tes a t end of tab le .
Digitized for FRASER http://fraser.stlouisfed.org/ Federal Reserve Bank of St. Louis

190 19 70 REPORT OF THE SECRETARY OF THE TREASURY
TABLE 34.—Issues, maturities, and redemptions of interest-bearing public debt securities, excluding special issues,, July 1969-June 1970—Continued
D a t e Securities R a t e of interest i
A m o u n t issued 2 A m o u n t m a t u r e d
or called or redeemed prior to
m a t u r i t y 3
1970
F e b . 26
26
26
27
T r e a s m y bi l ls—Continued Regular week ly—Cont inued
M a t m i n g May 28,1970 Issued in exchange for series da ted
Aug.28,1969. Issued for cash
Matur ing Aug. 27,1970 Issued in exchange for series da ted
Aug . 28,1969 Issued for cash
Certificates of indebtedness, foreign series, m a t m i n g :
Mar. 16,1970 May 26,1970 Mar. 16,1970 . . . . Mar. 31,1970
28 Treasm-y certificates, ma tu r ing J u n e 30,1970. . . 28 U . S . savings bonds : ^
SeriesE-1941 SeriesE-1942 Series E-1943 . SeriesE-1944 Series E-1945 SeriesE-1946 . . Series E-1947 Series E-1948 Series E-1949 Series E-1950 Series E-1951 Series E-1952 (January to April) Series E-1952 (May to December) Series E-1953 . -Series E-1954 Series E-1955 Series E-1956 Series E-1957 (January) Series E-1957 (Februa ry to Deceraber) Series E-1958 Series E-1959 ( January to May) Series E-1959 (June to Deceraber) Se r i e sE-1960 . - -Series E-1961 SeriesE-1962 Ser iesE-1963- -Series E-1964 Series E-1965 ( January to Noveraber) Series E-1965 (Deceraber) Series E-1966 Series E-1967 Series E-1968 ( January to May) Series E-1968 (June to Deceniber) Series E-1969 ( January to M a y ) - -Series E-1969 ( June to Deceraber) - - -Unclassified sales and rederapt ions SeriesH-1952--Series H-1953 Series I-I-1954 -Series I-I-1955 -Series H-1956 - - -Series H-1957 (January) Series H-1957 (Februa ry to December) Series H-1958--- . - - -Series .H-1959 ( January to May) Series H-1959 (June to December) SeriesH-1960 - -Series H - 1 9 6 1 . . SeriesH-1962 SeriesH-1963 SeriesH-1964 Series H-1965 ( Janua ry to November ) '. Series H-1965 (December) SeriesH-1966 SeriesH-1967 Series H-1968 ( January to May) Series H-1968 (June to December) Series H-1969 ( January to May)
Percent
6. 813 .
$596,115, 000. 00 . 1, 205, 002, 000. 00 .
7.70 6.85
351,225,000.00 949, 553, 000. 00 .
200, 000, 000. 00 . $15, 000, 000. 00
Footnotes at end of tab le ;
7.70 . 8.10 .. 3.50 ...
6 3. 340 6 3. 397 6 3. 460 6 3. 521 6 3. 575 6 3. 661 6 3. 719 6 3. 780 6 3.883 • 8 3. 963 6 3. 735 3.570
6 3.633 6 3. 696 e 3. 782 6 3. 866 6 4. 001 4.080
0 4. 217 6 4. 308 4.370
6 4. 380 8 4. 433 6 4. 506 6 4. 558 6 4. 315 6 4.173 6 4. 266 4.420 4. 449. 4.555 4.640 5.035 4.800 5.000
6 3.-539 ... 6 3.598 ... 8 3.673 .. 6 3.743 .. 6 3. 854 3.920 ...
6 4.120 ... 6 4. 202 4.270 ...
8 4. 322 8 4.336 ... 6 4.165 6 4.064 ., 6 4.145 ... 6 4. 235 6 4.326 ... 4.570 4.594 . 4.664 4.720 4. 769 4.830
382, 601. 36 , 2, 591,126. 58 3,410,094.10 6,449, 647.19 3, 276, 034. 84 2, 830, 769. 53 3, 206, 639. 45 3,672, 359. 52 4, 280, 354. 47 4, 219,447. 22 3, 309,003. 73 1, 694, 546. 35 4, 237,891. 27 4, 660,102. 33 4, 961, 378. 03 5,191,166. 46 5, 068,634. 50
.768.75 4, 371,101. 46 4, 792, 514. 08
. 2, 415, 950. 29 2, 475, 241. 21 4, 796, 202. 59 6, 070,155. 56 7,804, 258. 47 7, 795, 400. 47 7, 489, 885. 95 7,124, 214.16
450. 00 8,149,478. 63 8,131,855. 54 4,101, 365. 99 4,044, 565. 62 6, 998, 315. 91
320, 706, 472. 25 45, 239, 313.15
1, 000. 00 3, 000. 00 1, 500. 00
12, 500. 00
131, 000, 000. 00 11, 000, 000. 00 14, 869,151. 22
1, 662, 344. 20 5, 755, 517. 59 8,939,811.22 10, 967, 640. 32 9, 795, 727. 89 5, 321, 737. 25 5, 706,487. 67 6, 932, 247. 93 7,921, 295. 37 6, 284,174. 51 5, 577, 020. 29 1, 753, 892. 94 4,150, 945. 92 7, 235, 078. 32 7, 536,839. 93 8, 360, 604. 99 8, 709,147. 04
730, 055.14 8, 094, 238. 21 10, 038, 048. 42 4, 239, 294. 33 7,123, 429. 53 9, 878, 859. 40 12, 361, 912. 37 12, 242,273.14 11,114,461. 54 11, 642, 338. 05 10, 754, 671. 72 1, 449,150. 28
15, 942, 479. 34 20, 860, 601. 77 11, 273, 716. 93 23, 503, 639. 06 30, 940, 326. 54 115, 772, 390. 88 104,836,672 07
316, 500. 00 911, 500. 00
1, 949,000. 00 2, 565, 000. 00 2 225 000 00
90, 500. 00 1, 627, 000. 00 3, 506 500. 00 2,129, 000. 00 2 057 000 00 9, 895, 000. 00
. 4, 988, 500. 00 4, 825, 500. 00 4,132, 500. 00 4,191, 000. 00 2, 801, 000. 00
198 500 00 3, 447, 500. 00 3,173,000. 00 1,118, 500. 00 1, 389,000. 00 1. 233, 500. 00
Digitized for FRASER http://fraser.stlouisfed.org/ Federal Reserve Bank of St. Louis
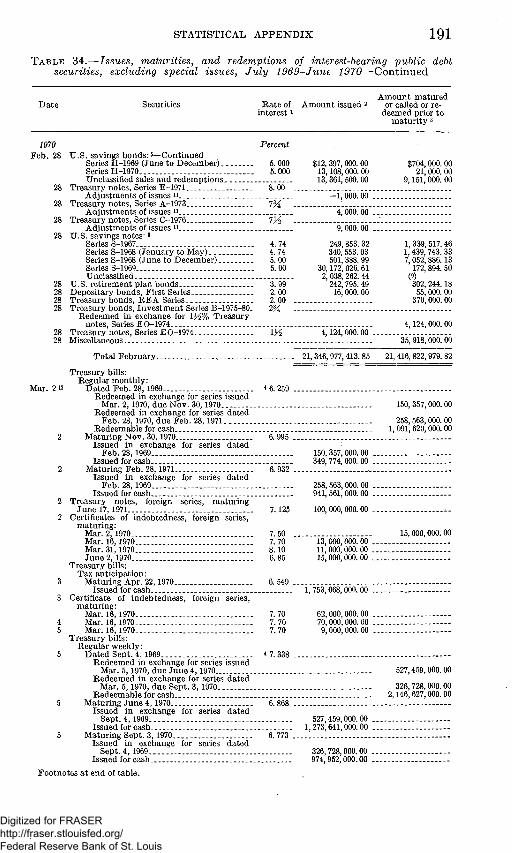
STATISTICAL APPENDIX 191 T A B L E 34.—Issues, maturities, and redemptions of interest-bearing public debt
securities, excluding special issues, Ju ly 1969-June 1970—Continued
D a t e Securities R a t e of interest i
A m o u n t issued 2 Anioun t matm-ed
or called or redeemed prior to
m a t u r i t y 3
$704,000. 00 21,000. 00
9,151,000. 00
4, 000. 00 .
1970 Percent F e b . 28 U . S . savings bonds : 5—Continued
Series H-1969 (June t o Deceraber) 5. 000 $12. 397,000. 00 Series H-1970 5.000 13,108,000.00 Unclassified sales and redempt ions 13,361,500. 00
28 Treasury notes, Series E-1971 8.00 Adjus tmen t s of issues 11 —1,000.00 .
28 T r e a s m y notes . Series A-1973 7% Adjus tments of issues n
28 T r e a s m y notes , Series C-1976 73^ Adj us tmen t s of issues n . . . .
28 U . S . savings notes: § Series S-1967 . Series S-1968 ( January to May) Series S-1968 (June to December) Series S-1969 Unclassified
28 U .S . re t i rement p lan bonds 28 Deposi tary bonds , F i rs t Series 28 Treasm-y bonds , R E A Series 28 Treasury bonds , Inves tn ien t Series B-1975-80.
Redeemed in exchange for 13^% Treasury notes. Series EO-1974
28 Treasu ry notes, Series E 0-1974 13^ 4,124,000. 00 28 Miscellaneous
4.74 4.74 5.00 5.00
3.99 2.00 2.00 2M
9,000.00 .
249,853. 32 340, 553. 03 501, 388. 99
30,172, 026. 61 2, 038,262. 44
242, 795. 49 16, 000. 00
1, 339, 517. 46 1,439, 743. 33 7,052, 886.13
172, 894. 50 (e) 302, 244.18
55, 000. 00 370,000. 00
4,124, 000. 00
35, 918,000. 00
Mar. 2 12
150, 357,000. 00
258, 563,000. 00 1, 091,620,000. 00
150,357,000.00 349, 774, 000. 00 .
258,563,000.00 941,561,000.00 .
7.125
7.50 7.70 8.10 6.85
100,000,000.00 .
13, 000,000. 00 . 11, 000, 000. 00 . 15,000,000.00 .
15, 000,000. 00
T o t a l F e b r u a r y . . 21,346,977,413.85 21,416,822,979.82
Treasury bills: Regular raonthly:
D a t e d F e b . 28,1969 4 6. 259 Redeemed in exchange for series issued
Mar. 2, 1970, due N o v . 30, 1970 Redeemed in exchange for series da ted
F e b . 28,1970, due F e b . 28, 1971. Redeemable for cash
M a t m i n g N o v . 30,1970 6. 995 Issued in exchange for series da ted
F e b . 28,1969 Issued for cash
M a t m i n g F e b . 28, 1971 6.932 Issued in exchange for series da ted
F e b . 28,1969. . Issued for cash
Treasm-y notes, foreign series, ma tu r ing J u n e 17,1971
Certificates of indebtedness , foreign series, ma tu r ing :
Mar. 2, 1970 Mar. 16, 1970.. Mar. 31,1970 J u n e 2,1970
Treasm-y bills: T a x ant ic ipat ion:
Matm-ing Apr . 22,1970 Issued for cash
Certificate of indebtedness , foreign series, m a t u r i n g : Mar. 16,1970 7.70 Mar. 16,1970 7.70 Mar. 16,1970 7.70
T r e a s u r y bills: Regular weekly:
D a t e d Sept . 4,1969 47.333 Redeeraed in exchange for series issued
Mar. 5,1970, due J u n e 4 , 1 9 7 0 . . . . . . . . . Redeemed in exchange for series da ted
Mar. 5,1970, due Sept . 3,1970 Redeeraable for cash
Matur ing J u n e 4 ,1970. . 6.868 Issued in exchange for series da ted
Sept . 4,1969 527,459,000.00 Issued for cash 1,273,641,000.00
Matur ing Sept . 3,1970 6.773 Issued in exchange for series da ted
Sept . 4,1969 326,728,000.00 Issued for cash . 974,952,000.00
6.549 1, 753,068, 000. 00 .
62,000,000.00 70,000,000. 00 9,000,000. 00
527,459,000.00
326,728,000. 00 2,146,627,000. 00
Foo tno tes a t end of table .
Digitized for FRASER http://fraser.stlouisfed.org/ Federal Reserve Bank of St. Louis

192 19 70 REPORT OF THE SECRETARY OF THE TREASURY
T A B L E 34.—Issues, maturities, and redemptions of interest-bearing public debt securities, excluding special issues, Ju ly 1969-June 1970—Continued
Date
1970 Mar. 6
9
9
10
10
10
12
12 12 12 13
13
15
16
16
18
18
18
19 19 19
23 23
24
24
• 26
Securities
Certificates of indebtedness , foreign series, m a t u r i n g :
May 26,1970. . . . Mar. 12 ,1970. . . Mar. 16,1970
Treasu ry biUs: Regular weekly:
Matur ing May 14,1970 Adjus t raents of cash issues
Matur ing Aug . 13,1970 Adjus tments of cash issues
Matur ing Aug . 6, 1970 Adjus tments of cash issues Adjus tments of exchange issues
Matur ing Apr . 23, 1970.. Ad jus tmen t s of cash issues Adjus tments of exchange issues
Certificates of indebtedness , foreign series, n ia tur ing:
Mar. 10,1970 Mar. 10,1970 Mar. 10,1970 Mar. 12,1970 J u n e 11,1970
T r e a s u r y bills: Regular weekly:
D a t e d Sept . 11,1969 Matur ing J u n e 11,1970 Matur ing Sept . 10,1970 Matur ing May 28,1970
Adjus t raents of cash issues T rea su iy notes, foreign series, ma tu r ing Mar.
13,1970... T reasu ry bonds of 1965-70 . .
Redeemable for cash Treasu ry biUs:
Regular weekly: Matur ing A u g . 27, 1970 :
Ad jus tmen t s of cash issues Certificates of indebtedness , foreign series,
m a t u r i n g : Mar. 16,1970 Mar. 16,1970 Mar. 16,1970 Mar. 16,1970 Mar. 16,1970 J u n e 15,1970
T r e a s u r y bills: Regular m o n t h l y :
Matur ing N o v . 30,1970 Adjus tmen t s of cash issues
Matur ing F e b . 28, 1971 Adjus tmen t s of cash issues
Regular weekly: Matur ing A u g . 20, 1970.
Adj u s tmen t s of cash issues D a t e d Sept . 18,1969 Matur ing J u n e 18,1970 Matur ing Sept . 17,1970
T a x ant ic ipat ion: Matur ing Mar. 23, 1970.
Certificates of indebtedness , foreign series, m a t u r i n g :
J u n e 23, 1970 Mar. 24, 1970 J u n e 24,1970
Treasu ry bills: Regular week ly :
Matur ing J u l y 30, 1970 Adj u s t m e n t s of cash issues Ad jus tmen t s of exchange issues
T reasu ry notes , foreign series, ma tu r ing Ju ly 2 2 , 1 9 7 1 . . . .
R a t e of interest i
Percent
6.85 . 7.70 7.70
7.311 .
7.387 .
" " 7 . " 7 i 9 " .
"'"'7."788"-
7.70 . 7.70 . 7.70 . 7.70 . 6.90
4 7. 583 . 6.877 6.729 6.813 .
5.74 . 23^ .
6.974 .
7.70 . 7.70 . 7.70 . 7.70 . 7.70 . 6.90
6.995 .
'""6."932".
6.917 .
"'"4"7."684'. 6.837 6.707
7. 202 .
6.85 7.80 . 6.30
7.776 .
6.70
A m o u n t issued 2
$30,000,000.00 . 46,000,000.00 .
-1 ,000 .00 .
-3 ,000 .00 .
20,000.00 . -20,000.00 .
8,000.00 . -8 ,000.00 .
30,000,000.00 .
1,798,040,000.00 . 1,301,270,000. 00 .
-13,000.00 .
7,000.00 .
200,000,000.00 .
-10,000.00 .
7,000.00 .
250,000.00 .
1,802,540,000.00 . 1,303,370,000.00 .
20,000.000.00 .
15,000,000.00 .
5,000.00 . -5 ,000 .00 .
100,000,000.00 .
A m o u n t m a t u r e d or caUed or re
deeraed prior to raaturity 3
$100,000,000. 00
19,000,000. 00 6,000,000. 00
10,000,000. 00 30,000,000. 00
3,001,333,000. 00
13, 970, 546. 50
301,930,000. 00
13,000,000. 00 62,000,000. 00 70,000,000. 00
9,000,000. 00 46,000,000. 00
3,002,144,000. 00
1,752,433,000. 00
15,000,000. 00
Footnotes at end of table.
Digitized for FRASER http://fraser.stlouisfed.org/ Federal Reserve Bank of St. Louis

STATISTICAL APPENDIX 193 TABLE 34.—Issues, maturities, and redemptions of interest-bearing public debt
securities, excluding special issues, July 1969-June 1970—Continued
Date Securities Rate of interest i
Amount issued 2 Amount matured
or caUed or redeemed prior to
maturity 3
1970 Percent Treasury bills:
Regular weekly: Mar.26 Dated Sept. 25,1969 47.628.
26 Maturing June 25,1970 6.264 26 Maturing Sept. 24, 1970 6.184 26 Maturing Apr. 23, 1970 7.788.
Adjustments of cash issues 26 Maturing May 21,1970 6.775.
Adjustments of cash issues Adjustments of exchange issues
26 Maturing Aug. 13,1970- 7.387. Adjustraents of cash issues
26 Matming Aug. 20, 1970 6.917 Adjustments of cash issues...
Regular monthly: 26 Matming Apr. 30, 1970.. 7.890
Adjustments of cash issues Adjustments of exchange issues
26 Matming Feb. 28, 1971 6.932 Adjustments of cash issues
Tax anticipation: 26 MaturingSept. 22, 1970.. 6.177 26 Certificate of indebtedness, foreign series,
maturing: Apr. 13, 1970 8.00
31 Mar. 31, 1970 8.10 Mar. 31, 1970 8.10 Mar. 31, 1970 8.10 Mar. 31, 1970 8.10 Mar. 31, 1970 8.10 Mar.31, 1970 8.10 Mar. 31, 1970 8.10 Mar. 31, 1970 8.10 Mar. 31, 1970 8.10 June 11, 1970 6.90 June 15,1970 6.90 June30, 1970 6.35
31 Treasury notes, foreign series, niaturing July 29, 1971.- - - 6. 79
Treasmy bills: Regular monthly:
31 Dated Mar. 31, 1969 4 6.551 31 Maturhig Dec. 31, 1970 6.101 31 Matming Mar. 31, 1971 6.132 31 Treasury notes, foreign cmrency series,
matming: Jan. 3, 197214 5.28 Oct.2, 197214 ..... 5.73 Dec.22, 197214 6.25
31 Treasury certificates, maturing June 30, 1970.. 3. 50 31 U.S. savings bonds: ^
SeriesE-1941 63.340 SeriesE-1942 63.397 Series E-1943 63.400 Series E-1944 6 3. 521 Series E-1945.. 63.575 Series E-1946 6 3.66I Series E-1947 63.719 Series E-1948 63.730 Series E-1949 63.333 Series E-1950 63.903 Series E-1951- 63.735 Series E-1952 (January to April) 3.570 Series E-1952 (May to December) 6 3.633 Series E-1953 63.696 Series E-1954 63.732 Series E-1955- - . . . - 63.306 Series E-1956 ---- 64.OOI Series E-1957 (January) - - ' 4.080 Series E-1957 (February to December) 6 4.217 Series E-1958 --- 6 4.308 Series E-1959 (January to May) 4.370 Series E-1959 (June to Deceraber) 6 4.330 SeriesE-1960 64.433 Series E-1961 64.506 SeriesE-1962.- - 64.658 SeriesE-1963 64.315
Footnotes at end of table.
$3,010,463,000.00 $1,804,050,000.00 1,302,380,000.00
2,'55o.'55"".]'-------!-^
-2," 5 5 5 . ' 6 5 ' . ' - - - - - - - . " - - ^
1,000.00
H i ; 6 5 5 ' 5 5 ' - - - - - - - - - - -
- 3 i ' 5 5 6 . " 5 5 ' - - - - ' . - - - - - -- i 8 7 , ' 5 6 6 . ' 5 5 ' - - - - - - - - - - -
-21,000.00
"" i 6 , ' 5 o 6 . ' 5 5 - - - - - - - - - - -
1,757,600,000.00
20,000,000.00 4,000,000.00 19,000,000.00 3,000,000.00 9,000,000.00 17,000,000.00 36,000,000.00 14,000,000.00 7,000,000.00 11,000,000.00 30,000,000.00 20,000,000.00
45,000,000.00
100, 000, 000. 00
1,501,357,000.00 500,400,000.00
1,201,040,000.00
10,005,646.95 9,996,196.74 10,395,014.61 ...-
8,045,754.62
362, 233. 96 2, 570, 391.03 2, 762,820. 76 10,188,728. 98 8, 223, 408. 43 15, 585, 567. 81 3, 069,613.12 20,043,610. 01 2,834, 356.18 17,352, 594.82 2, 624,416. 30 10,060,995. 85 3,188,203.38 11,493,286.41 3,368,462.38 12,921,597.83 4,030,314.20 15,385,105.66 4,072,956.14 14,052,099.21 3,223,190.16 10,684,864.37 1,659,751.50 3,614,894.56 1,921,400.30 7,859,799.13 5,214,340. 84 14,082,334.38 5.523.724.92 15,896,912.81 5,878,786.90 17,247,776.22 5.917.954.18 16,434,538.92 2,699,729.64 1,489,887.35 4,476,718.26 14,705,983.95 4.821.265.19 18,960,463.02 2,403,642.72 8,070,505.04 5,431,892.84 11,895,813.58 5,677,436.25 20,360,676.34 6.700.354.93 24,021,087.44 7,806,253.50 23,535,552.. 38 7,530,767.98 20,062,003.08
Digitized for FRASER http://fraser.stlouisfed.org/ Federal Reserve Bank of St. Louis

194 1970 REPORT OF THE SECRETARY OF THE TREASURY
T A B L E 34.—Issues, maturities, and redemptions of interest-bearing public debt securities, excluding special issues, Ju ly 1969-June 1970—Continued
Date Securities Rate of interest i
Amount issued 2 Amount matured
or caUed or redeeraed prior to
raaturity 3
1970 Percent Mar. 31 U.S. savings bonds:5—Continued
Series E-1964.. 64.173 $7,178,817.07 Series E-1965 (January to November) 6 4.266 7,329,078.48 Series E-1965 (December)... 4.420 675.00 Series E-1966 4.449 8,583,274.58 Series E-1967 4.555 8,524,878.44 Series E-1968 (January to May) 4.640 4,342,993.07 Series E-1968 (June to December) 5.035 3,937,486.92 Series E-1969 (January to May) 4.800 7,552,720.31 Series E-1969 (June to Deceraber) 5.000 376,756,295.45 Series E-1970 5.000 45,679,931.59 Unclassified sales and redemptions 7 —7 951 967.30 SeriesH-1952 : . . . . 63.539 Series H-1953 63.593 ___. SeriesH-1954 63.673 SeriesH-1955 63.743 Series H-1956 83.354 Series H-1957 (Jan^ary) _ 3.920 Series H-1957 (February to December) 84.120 Series H-1958 64.202
^ Series H-1959 (January to May) 4.270 Series H-1959 (June to December) 64.322 SeriesH-1960 64.330 Sei-iesH-1961 6 4.165 Series H-1962.- 64.064 - -Series H-1963 64.145 SeriesH-1964 64.235 --Series H-1965 (January to November) 6 4.320 _ - -Series H-1965 (December)- 4.570 - . . SeriesH-1966 4.594 SeriesH-1967 4.664 Series H-1968 (January to May) 4.720 Series H-1968 (June to December) 4.769 Series H-1969 (January to May) 4.830 48,500.00 Series H-1969 (June to Deceniber) 5.000 2,274,500.00 Series H-1970 5.000 43,526,000.00 Unclasstfied sales and redeniptions _. 7—7,985,000.00
U.S. savings notes:8 Series S-1967 4.74 287,994.01 Series S-1968 (January to May) 4.74 365,430.74 Series S-1968 (June to December) 5.00 477,875.08 Series S-1969 5.00 32,184,954.16 Series S-1970 5.00 1,621,154.46. Unclassified -987,997.50
U.S. retirement plan bonds.. 3.99 337,519.11 Depositary bonds. First Series 2.00 90,000.00 Treasury bonds, REA Series 2.00 Treasury bonds. Investment Series B-1975-80. 2%
Redeemed in exchange for 13^% Treasury notes, Series EO-1974
31 Treasury notes, Series EO-1974 13^ 8,066,000.00. 31 MisceUaneous
31
31 31 31 31
$18, 17, 2, 25, 27, 14, 27, 31,
135.
-52,
1, 3, 3, 3,
2, 5, 2, 2, 12, 7, 6, 5, 4, 3,
4, 4, 1, 1, 1,
-1,
423,660. 68 586,458.90 065,802.13 488,812 59 847,352.38 211,698. 96 388,809.85 473,718. 29 330,059. 25 74,006. 25 174,784. 24 753,500.00 667,500.00 439,000.00 '995,000.00 510,500.00 63,500.00
756,500.00 206,000.00 720,000.00 453,000.00 191,000.00 459,500.00 074,000.00 328,000.00 514,500.00 776,500.00 243,000.00 294,000.00 379,000.00 286,000.00 320,000.00 493,500.00 777,000.00
15,500.00 288,000.00
1, 667,493. 56 1, 698, 652. 53 6, 699, 891.87 1, 798, 919.46
(8) 202,889. 34
82,000.00 875,000.00
8,066,000.00
'36,"843.'666.'66
Total March 20,876,890,966.92 18,420,676,813.10
6.40
8.00 7.85
Apr. 1 Treasury certificates, maturhig: AprU 1,1970 8.096 July 1,1970 6.330
1 Treasury notes, Series EA-1970 l y Redeemable for cash
1 Treasury notes, foreign series, maturing Nov. 2, 1970.
2 Certificates of indebtedness, • foreign series maturing:
Apr. 13,1970 Apr. 20, 1970
Treasury bills: Regular weekly: '
2 Dated'Oct. 2, 1969.. : 47.792 2 Matm-ing July 2, 1970... 6.329 2 Maturing Oct. 1,1970 1 6.392 2 Matm-ing Aug. 27, 1970 6.974
Adjustments of cash issues 3 MaturhigMay 14, 1970... 7.311
Adjustments of cash issues 3 Matm-hig June 25,1970 6.264
Adjustments of cash issues 3 MaturingSept. 17, 1970- . . - . - . - 6.707
Adjustments of cash issues
2,07L43 . 2,030.34
1,800,270,000.00 1,301,180,000.00
87, 529,000.00
284,985.16
15,000,000.00 10,000.000.00
3,010, 715,000.00
-6,000.00
1,000.00 .
20,000.00
4,000,00
Footnotes at end of table.
Digitized for FRASER http://fraser.stlouisfed.org/ Federal Reserve Bank of St. Louis

STATISTICAL APPENDIX 195 T A B L E 34.—Issues, maturities, and redemptions of interest-bearing , public debt
securities, excluding special issues, Ju ly 1969-June 1970—Continued
D a t e Securities R a t e of interest i
A m o u n t issued ^ Araoun t raatured
or called or redeemed prior to
matm-i ty 3
1970 Regular m o n t h l y :
Matm-ing F e b . 28,1971 Adjus tmen t s of cash issues
Apr . 3 M a t m i n g Mar. 31,1971 Adjus tmen t s of cash issues
3 T reasu ry certificates, ma tu r ing . : Apr . 3, 1970 Ju ly 3,1970
6 Treasm-y notes, foreign currency series, matur ing:
A p r . 6, 1970. . . J u ly 6, 1971 . - - - - -
7 Certificates of indebtedness , foreign currency series, ma tu r ing Apr . 7, 1970
7 Treasury certificates, ma tu r ing J u n e 30, 1970-. 8 Certificates of indebtedness , foreign series,
matm-ing: Apr . 8, 1970 - - - - -Ju ly 8, 1970
9 Treasury notes, foreign series, ma tu r ing Aug . 26, 1971
9 Certificates of indebtedness , foreign series, matm-ing Apr . 20, 1970.
Treasury biUs: Regular weekly :
9 D a t e d Oct . 9, 1969 9 Matur ing J u l y 9, 1970.. 9 Matur ing Oct . 8, 1970.. 9 M a t m i n g J u l y 30, 1970
Adj u s tmen t s of cash issues 9 M a t m i n g Aug . 13, 1970 -
Adjus tmen t s of cash issues 9 Matur ing Aug . 27, 1970- -
Adjus tments of cash issues Regular m o n t h l y :
10 Matur ing N o v . 30,1970 . Ad jus tmen t s of cash issues
10 Matur ing F e b . 28,1971 Adjus tmen t s of cash issues
Regular weekly: 13 Matur ing J u n e 4, 1970 ---.
Ad jus tmen t s of cash issues 13 Maturh ig Sept. 24, 1970 -- -.
Ad jus tments of cash issues 14 Treasury certificates, raaturing J u n e 30, 1970-. 15 Treasui-y notes, foreigii series, raaturing N o v .
2, 1970 . . - -16 Certificates of indebtedness , foreign series,
ma tu r ing : A p r . 16, 1970 ---J u l y 16, 1970
Treasury biUs: Regular weekly:
16 M a t m i n g Sept . 17, 1970 Adjus t raents of cash issues
16 D a t e d Oct. 16, 1969 -- --- . 16 Matur ing J u l y 16, 1970 16 Matur ing Oct. 15, 1970 20 Certificates of indebtedness , foreign series,
m a t u r i n g A p r . 20, 1970. Treasu ry biUs:
Tax ant ic ipat ion: 21 Matur ing Sept . 22, 1970
Ad jus tmen t s of cash issues 22 Maturhig Apr . 22, 1970.. 22 Certificates of indebtedness , foreign series,
ma tu r ing J u n e 15, 1970 Treasury bUls:
Regular weekly: 23 D a t e d Oct . 23, 1969 . . . 23 Matur ing J u l y 23, 1970._ -23 Matur ing Oct . 22, 1970 -27 Certificate of indebtedness , foreign series,
ma tu r ing : A p r . 27, 1970 -
28 J u l y 28, 1970 29 A p r . 29, 1970 -
J u l y 29, 1970
Footno tes a t end of table .
Percent
6.932 .
" " ' 6 . ' i 32" .
6.995 .
'6.'932".
6.868
"6."i84"
"3." 5 6 "
6.40
5.424 . 5.424
6.707
7.85 .
6.177 .
"'4'7." 126'.
6.90 .
$7,000.00
"20,'66o."66'
6.330
6.15 --6.75
7.73 --3.50
8.00 6.40
6.84
7.85 _-
1,618,938.50
52, 251,457. 24 .
1,762. 60 .
271,017,399.32 .
100, 000, 000. 00 .
4 7.692
$1, 586,821. 24
52, 204,176. 33
54,686, 772. 78
271,017,399. 32
6.408 1,801,980,000.00 . 6.455 1,304,990,000.00 . 7.776
3,000.00 . 7.387
6,000.00 . 6.974
-4 ,000 .00 .
-47,000.00 .
"'-i'm'bb'.
-10,000.00 1,571.77 .
250,000,000.00 .
-4,"6o6."66'!
15,000, 000. 00
3, 004, 613, 000. 00
488,350. 34
250,000, 000.00
4 7.633 3,005,119,000.00 6.310 1,802,350,000.00 6.247 1,300,760,000.00
5,000,000.00
600,000.00 4, 767,244, 000.00
75,000,000. 00
4 7.579 3,002,462,000.00 6.476 1,802,710,000.00 6.494 1,302,570,000.00
30, 000, 000. 00
"i35,"656,'oo5.'6o 10,000,000.00 . 6.90
7.90 6.90 70,000.000.00 .
Digitized for FRASER http://fraser.stlouisfed.org/ Federal Reserve Bank of St. Louis

196 19 70 REPORT OF THE SECRETARY OF THE TREASURY
TABLE 34.—Issues, maturities, and redemptions of interest-bearing puhlic debt securities, excluding special issues, July 1969-June 1970—Continued
Date Secmities Amount matmed
Rate of Amount issued 2 or caUed or re-interest 1 deemed prior to
maturity 3
1970 Apr . 29
30 30 30 30 30 30 30
30
30
30
Treasury notes, foreign series, m a t m i n g N o v . 2,1970 _ -
Treasu ry biUs: Regular mon th ly :
D a t e d Apr . 30, 1969 Matur ing J u l y 30, 1970 Matur ing Oct . 29, 1970 D a t e d Apr . 30, 1969- - - - - -M a t m i n g J a n . 3 1 , 1 9 7 1 . . -Maturh ig A p r . 30, 1971 -
Treasury notes, foreign series, raaturing: A p r . 30, 1970 -A p r . 30, 1970 -A p r . 30, 1970 Sept. 23,1970 -
Certificates of indebtedness , foreign series, ma tu r ing :
J u n e 15 1970 June30,1970 -
T r e a s m y certificates, ma tu r ing : Apr . 30, 1970 J u n e 30,1970 -J u l y 31, 1970 -
U .S . savhigs bonds:8 SeriesE-1941 SeriesE-1942 - -Series E-1943 Series E-1944 -Series E-1945 SeriesE-1946 Series E-1947 -Series E-1948-Series E-1949 - -Series E-1950 Series E-1951 Series E-1952 ( January to AprU) . Series E-1952 (May to December) Series E-1953 -Series E-1954 -Series E-1955 Series E-1956 Series E-1957 ( J a n u a r y ) . . Series E-1957 (Feb rua ry to Deceraber) Series E-1958. Series E-1959 ( January to May) Series E-1959 (June to December) SeriesE-1960 Series E-1961 Series E-1962. _ SeriesE-1963 Series E-1964. Series E-1965 ( January to November ) Series E-1965 ( D e c e m b e r ) . . . Series E-1966 Series E-1967. Series E-1968 ( January to May) Series E-1968 (June to December) Series E-1969 ( January to May) Series E-1969 (June to December) Series E-1970 Unclassified sales and redempt ions SeriesH-1952 1 Series H-1953 SeriesH-1954 SeriesH-1955 Series H-1956 Series H-1957 ( January) Series H-1957 (Feb rua ry to D e c e m b e r ) . . . . Series H-1958 Series H-1959 ( January to May) Series H-1959 ( June to December) Series H-1960 Series H-1961. SeriesH-1962 SeriesH-1963
Percent
6.40 .
4 7.639 . 6.876 7.253
4 6.423 . 6.843 6.814
6.93 . 6.02 . 6.21 . 7.46
6.90 . 6.35 .
7. 888 . 3.50 . 6.876
8 3.340 6 3. 397 6 3.460 6 3. 521 6 3. 576 6 3.661 6 3.719 6 3. 780 6 3.883 6 3.963 6 3. 735
3.570 6 3.633 6 3. 696 6 3. 782 6 3. 866 6 4.001
4.080 6 4. 217
. 6 4.308 4.370
, 6 4. 380 . 6 4.433 . 6 4. 506 . 6 4. 558
6 4.315 . 6 4.173
6 4. 266 4.420 4.449 4. 555 4.640 5. 035 4. 800 5. 000 5. 000
. 6 3. 539 .
. 6 3. 598 .
. 6 3. 673 .
. 6 3, 743 .
. 8 3.854 . 3.920 .
. 6 4.120 .
. 6 4. 202 . 4.270 .
. 8 4.322 .
. 6 4.336 .
. 6 4.165 .
. 6 4. 064 .
. 6 4.145 .
$1,801,210,000.00 . . 1,301,290,000.00 . .
500,310,000.00 . . 1,199,980,000.00 . -
200,000,000.00 . .
1,289,030.03 . .
361,065.46 2,860,613.46 6.488.311.07 2.624.252.08 3,460,882. 70 2,700,007. 86 2,994,381.40 3,206,873. 67 3,719,467. 68 3,721,674.30 3,244,412.82 1,497,725. 25 1,750,743.38 4,067,710.40 4,477,711.10 4,653,394.12 4,762,128. 51
225. 00 4, 748,710.14 4,478, 507.28 2,138,674.34 2, 508,647.43 6,467,014.62 7,169,140.94
13,671,018.10 8,625,853.77 7,866, 581.99 7,811,103.45 -126,093.88 8,971,016.38 8, 693,262.65 4,484,099.74 3,971,699.16 4,864. 584.27
137,930, 538.15 315, 028,359. 23
7-94,548,136.38
$1,897,486. 67
3,001, 535, 000. 00
1, 500,785,000. 00
75,000, 000. 00 75,000, 000. 00 50,000, 000. 00
105,000,000. 00 45,000, 000. 00
1,264,101. 94 8,679,666.43
2,355,132.33 9, 504,097. 71
15,386,864. 59 19,229,130. 67 16,028, 597. 52 9,173,889.31
10,170,763.49 11,711,143.58 13,282,737. 51 12,343, 823.45
9,394,635.97 3,484,320. 61 7,368,393.62
13,157,020.23 13,867,735.67 15,615.292. 60 15,277,592.84
1, 586,266.08 14,257,070. 78 17,390,777. 74 7,905, 596. 74
10, 790,398. 70 19,502,006.74 21,896,016. 74 22,342,972.71 19,772,208.18 30,352,488. 56 18,351,346. 77
2,126,436.63 34,337,127. 72 30,959,293. 54 14,211,100.40 25,329,174.49 26,369,499. 06
139,220,236. 50 161,250.00
7 -134,461,407.44 746,000.00
1,790, 500.00 4,063,000.00 5, 548,000.00 5, 842,000.00
956,000.00 3,126,000.00 5,435, 500.00 3,106, 500.00 2,183,500. 00
11,178,000.00 6,956, 500. 00 6, 537,000.00 6,221,000.00
Footnotes at end of table.
Digitized for FRASER http://fraser.stlouisfed.org/ Federal Reserve Bank of St. Louis

STATISTICAL APPENDIX 197 T A B L E 34.—Issues, maturities, and redemptions of interest-bearing public debt
securities, excluding special issues, Ju ly 1969-June 1970—Continued
D a t e Securities R a t e of hiterest i
A m o u n t issued 2 Araoun t raatured
or called or redeemed prior to
m a t u r i t y 3
1970 Apr . 30 U .S . savings bonds:s—Cont inued
SeriesH-1964 Series H-1965 ( January to Noveraber) Series H-1965 (Deceraber) Series H-1966 S e r i e s H - 1 9 6 7 . . . Series H-1968 ( January to May) Series H-1968 (June to Deceraber) Series H-1969 ( January to May) Series H-1969 (June to Deceraber) Series H-1970__ Unclassified sales and rederapt ions
Treasu ry notes. Series D-1971 Adjus t raents of issues n . . .
T reasu ry notes. Series E-1971 . -Adjus tments of issues H-
Treasu ry notes, Series A-1973 Adjus t raents of issues n . -
U . S . savings notes: 3 Series S-1967 Series S-1968 ( January to May) Series S-1968 ( June to Deceraber) Series S-1969 Series S-1970 . - - -Unclassified-- -
U .S . ret i reraent p lan bonds Depos i ta ry bonds . F i rs t Series- -Treasu ry bonds , R E A Series T reasu ry bonds , I n v e s m e n t Series B-1975-80-
Redeeraed in exchange for: i y 7 o T r e a s m y notes. Series EO-1974 13^^% Treasu ry notes . Series EA-1975
30 Treasu ry notes . Series E 0-1974 30 Treasu ry notes, Series E A-1975 30 Miscellaneous -
Percent
6 4.235 6 4.236 .
4. 570 . 4.594 . 4.664 . 4.720 4.769 4.830 5.000 5.000
30
30
30
30
30 30 30 30
7M
'8.'66"
$2,000.00 12, 500.00 10,000. 00
195,000. 00 41, 003,500.00
^ -9 ,494 , 500. 00
$5,331,500. 00 4,850,000. 00
194,000. 00 5,237,000.00 3,828, 500. 00 1,361, 500.00 1,492,000. 00 1,311, 500. 00
942, 500.00 169,500. 00
r -23,815,000.00
2,000.00
7M
4.74 4.74 5.00 5.00 5.00
3.99 2.00 2.00 2%
1,000.00 .
-7,'666." 66'!
304,301. 37 348,973.25 544,898. 98
15,643,590. 94 17, 779,340. 66
-13,582,798.25 273, 548.78 260,000. 00
1,667,322. 96 1,704, 500.27 5,211,935.11 3,864,164.16
1,660. 50
(«) 193,391.91 743,000.00 515,000.00
ly ly
4,179,000.00 221,000.00 .
4,179,000. 00 221,000.00
42,199,100. 00
To ta l AprU 18,745,676,748.16 23,295,957,397.79
May 4 Certtficates of indebtedness , foreign series, m a t u r i n g :
May 4,1970 - --. Aug . 4, 1970 -
5 A u g . 5, 1970 - -Treasu ry biUs:
Regular weekly: 5 Matur ing Oct. 22,1970 - . - - . .
Ad jus tments of cash issues— 6 Matur ing Ju ly 30,1970- - .---
Adjus tmen t s of cash issues -6 Matur ing Oct. 29,1970
Adjus tments of cash issues 6 T rea su ry notes , foreign currency series, raa
tur ing : May 6,1970 Aug . 6,1971 -
6 Certtficates of indebtedness , foreign series, m a t m i n g May 6, 1970
Treasu ry biUs: Regular weekly:
D a t e d N o v . 6,1969 Matur ing Aug. 6, 1970 Matur ing N o v . 5, 1970..
Certificates of indebtedness , foreign series, ma tu r ing :
May 11, 1970 Aug . 11, 1970 May 12, 1970 J u n e 2, 1970..
T reasu ry bUls: Regular weekly:
D a t e d N o v . 13,1969. M a t m i n g Aug . 13, 1970... Matur ing N o v . 12, 1970
Treasu ry notes, Series B-1970 Redeemed in exchange for:
7M% Treasu ry notes. Series G-1971 7M% Treasu ry notes, Series A-1973 8% Treasu ry notes. Series A-1977
Redeemable for cash .
7.75 6.90 7.20
6.494 .
'6. '876'.
'7. '253'.
12,500,000.00 . 15,000,000.00 .
12, 500,000. 00
-20,000.00..
'-'i6,'6o6.'66'!
'" i6,'666.'66''
7 7 7
11
14 14 14 15
6.40 7.70
6.85 -
25,595,085.74
47.565 7.184 7.493
7.35 7.20 6.85 -
1,800,730,000.00 1,301,030,000.00 .
17,500,000.00 .
6.85
47.361
25,445,292.62
100,000, 000. 00
3,002,349,000.00
6.994 7.20L
5 ^
1,802,030,000.00 . 1,301,580,000.00 .
17,500,000. 00
'25,'666,'666.'66 5, 000,000.00
2,993,940,000.00
1,001,116,000.00 3,495,218,000. 00 2,671,112,000.00
625,369,000.00
Footnotes at end of table.
Digitized for FRASER http://fraser.stlouisfed.org/ Federal Reserve Bank of St. Louis

198 19 70 REPORT OF THE SECRETARY OF THE TREASURY
TABLE 34.—Issues, maturities, and redemptions of interest-bearing public debt securities, excluding special issues, July 1969-June 1970—Continued
Amount raatured Date Securities Rate of Amount issued 2 or called or re-
interest 1 deemed prior to maturity 3
1970 Percent May 15 Treasury notes, Series C-1970-- - 6^ . - . .
Redeemed in exchange for: 7^% Treasmy notes. Series G-1971 $6,427,695,000.00 7M% Treasury notes. Series A-1973 . . . 1,186,492,000.00 8% Treasmy notes. Series A-1977.. - - 638,959,000.00
Redeeraable for cash - - - 510,379,000.00 16 Treasury notes. Series G-1971 - 7M - - -
Issued in exchange for: 5^% Treasury notes, Series B-1970 $1,001,116,000.00 6M% Treasmy notes, Series C-1970- - --.- 6,427,695,000.00
Issued for cash-- 3,313,724,000.00 . . . . : 16 Treasury notes, Series A-1973 (Additional
issue) 7M - -Issued in exchange for:
b%% Treasmynotes, Series B-1970 3,495,218,000.00 63 7o Treasury notes, Series C-1970- 1,186,492,000.00 -.
16 Treasury notes. Series A-1977 (Additional issue) -. .-- 8.00
Issued in exchange for: 55^% Treasury notes. Series B-1970 2,671,112,000.00 -6M% Treasury notes. Series C-1970 638,959,000.00
16 Treasury notes, foreign series maturing: May27, 1971 - 7.60 100,000,000.00 -June24, 1971 , 7.60 100,000,000.00
15 Certificates of indebtedness, foreign series, maturing:
June2, 1970 6.85 10,000,000.00 June 23, 1970... 6.85 20,000.000.00 June24, 1970. 6.30 15,000,000.00 July 28, 1970 6.90 10,000,000.00 July 29, 1970. 6.90 70,000,000.00 Aug. 4, 1970 6.90 12,500,000.00 Aug. 5, 1970... 7.20 15,000,000.00 Aug. 11, 1970.... 7.20 17,500,000.00
19 Treasury notes, foreign currency series, maturing:
May 19, 1970 ' 6.35 27,742,457.52 Aug. 19, 1971 . 7.73 27,790,643.82
20 Treasmynotes, foreign series, raaturing Nov. 2, 1970-. . - - . . . - . 6.40 783,632.99
21 Treasury certificates, maturing June 30,1970--- 3.50 2,866.05 Treasury bills:
Regular weekly: 21 Dated Nov. 20, 1969 4 7.072 - 3,002,992,000.00 21 Maturing Aug. 20, 1970 - 6.827 1,789,770,000.00: 21 Maturing Nov. 19, 1970 : 6.996 1,303,530,000.00 28. Dated Nov. 28, 1969 47.300 3,002,293,000.00 28 Maturing Aug. 27, 1970. 7.133 1,801,900,000.00 28 Matming Nov. 27, 1970 7..356 1,300,570,000.00.. 31 U.S. savings bonds: s
SeriesE-1941.. 63.340 785,434.53 1,207,766.11 SeriesE-1942 63.397 3,049,155.21 5,510,206.22 Series E-1943 63.46O 3,506,60L67 8,973,088.56 SeriesE-1944 63.521 4, .505,966.86 10,783,685.91 Series E-1945 63.575 8,644,152.05 9,411,202.69 SeriesE-1946 63.661 2,701,405.34 6,373,25L54 Series E-1947 63.719 2,743,423.45 6,086,087.53 Series E-1948- e 3. 78O 3,197,932.04 6,910,166.67 Series E-1949.. 6 3.883 3,631,429.18 7,286,232.96 Series E-1950 63.963 3,567,348.19 7,238,068.23 Series E-1951 83.735 3,035,972.38 5,618,101.10 Series E-1952 (January to April) 3. 570 -76,702.31 1,950,623.89 Series E-1952 (May to December) 6 3.633 1,631,644.48 3,997,424.27 Series E-1953 6 3.696 4,035,952.29 7,465,978.89 Series E-1954 63.782 4,329,589.08 7,974,139.97 Series E-1955... 63.866 4,594,420.34 9,082,539.45 Series E-1956 84.OOI 4,390,170.90 9,463,558.30 Series E-1957 (January) 4. 080 87.45 869,608.16 Series E-1957 (February to December).... 6 4.217 5,396,019. 04 8,081,354.84 Series E-1958. _. 6 4. 308 5,276,167.80 10,338,30L77 Series E-1959 (January to May) 4.370 -115,982.84 4,622.912.21 Series E-1959 (June to December) 6 4.38O 1,997,270.07 6,339,898.38 SeriesE-1960 64.433 5,181.407.05 11,710,110.50 Series E-1961 84.506 5,506,478.03 12,180,073.67 Series E'1962 6 4.558 3,994,152,20 13,178,026.97
Footnotes at end of table.
Digitized for FRASER http://fraser.stlouisfed.org/ Federal Reserve Bank of St. Louis

STATISTICAL APPENDIX 199 T A B L E 34.—Issues, maturities, and redemptions of interest-bearing public debt
securities, excluding special issues, Ju ly 1969-June 1970—Continued
Date Securities Amount matured
Rate of Amount issued 2 or caUed or re-interest 1 deemed prior to
maturity 3
1970 May 31 U.S. savings bonds s—Continued
SeriesE-1963 - . - . . Series E-1964 Series E-1965 (January to November) Series E-1965 (December).. Series E-1966 Series E-1967 Series E-1968 (January to May) Series E-1968 (Jmie to Deceraber). Series E-1969 (January to May) Series E-1969 (June to Deceraber) Series E-1970 Unclassified sales and rederaptions SeriesH-1952 Series H-1953 SeriesH-1954 SeriesH-1955 Series H-1956 Series H-1957 (January) Series H-1957 (February to Deceraber). - . Series H-1958 Series H-1959 (January to May) .-Series H-1959 (June to Deceraber)-SeriesH-1960 SeriesH-1961 SeriesH-1962. SeriesH-1963.. SeriesH-1964 Series H-1965 (January to November) Series H-1965 (Deceraber) SeriesH-1966 .-SeriesH-1967 Series H-1968 (January to May) Series H-1968 (June to Deceraber) Series H-1969 (January to May)— Series H-1969 (June to Deceraber).. Series H-1970 Unclasstfied sales and rederaptions
31 Treasury notes. Series E-1971. Adjustraents of issues n
31 Treasury notes, Series F-1971 Adjustments of issues n.
31 Treasury notes. Series A-1973 Adjustments of issues n. .
31 Treasury notes. Series B-1973 Adjustments of issues n —
31 Treasury notes. Series C-1976 Adjustments of issues " .
31 Treasury notes. Series A-1977 Adjustments of issues "
31 U.S. savings notes: 8 Series S-1967 Series S-1968 (January to May) Series S-1968 (June to Deceraber) Series S-1969... Series S-1970 Unclasstfied
U.S. retireraent planbonds Depositary bonds. First Series Treasury bonds, REA Series Treasury bonds. Investment Series B-1975-80.
Redeemed in exchange for: 13^% Treasury notes. Series EO-1974 13^% Treasury notes. Series EA-1975
Treasury notes, Series EO-1974.. Treasury notes. Series EA-1975 MisceUaneous.
Percent
6 4.315 6 4.173 6 4. 266
4.420 4.449 4.555 4.640 5.035 4.800 5.000 5.000
6 3.539 . 6 3.598 . 6 3. 673 . 6 3.743 . 6 3.854 .
3.920 . 6 4.120 . 6 4.202 .
4.270 . 6 4.322 . 6 4.336 . 6 4.165 . 6 4.064 . 6 4.145 . 6 4.235 . 6 4.326 .
4.570 . 4.594 4.664 . 4.720 . 4.769 . 4.830 . 5.000 5.000
8.00
" 7 %
,.00
4.74 4.74 5.00 5.00 5.00
31 31 31 31
3.99 2.00 2.00 2%
31 31 31
13^ i H
$7,293, 7,171,
7,994, 7,840, 3,945, 3,666, 3,319,
20,706, 245,024, 92,999,
500. 83 405. 55 531.17 26.01
831.19 852. 79 943. 86 444. 27 864. 08 082. 29 306. 25 825. 88
8,000. 00
93, 500. 00 25,067,000. 00 4,790,500.00
191,000.00 .
319,225. 96 312,074.46 634,935. 89
2,738,390. 51 16,810,618. 50
-5,203.50 217.387. 80 112,000. 00 10,000. 00
18,952,000.00 . 835,000.00 .
$11, 630, 13,156, 10,368, 1,136,
18,001, 18,172, 8, 526,
14,741, 15,300, 66,832, 32,346, 56,083,
336, 596,
1, 566, 2,265, 2,202,
188, 1,625, 2,814, 1, 529,
965, 5,487, 3,293, 2,812, 2, 579, 2, 541, 2,641,
53, 2, 599, 2,056,
765, 723, 607, 526, 10,
11, 536,
851. 83 526. 57 430.45 756.30 557. 95 231. 33 475.96 124. 75 927.16 997. 85 075. 00 778. 72 000. 00 500. 00 000. 00 000.00 000. 00 000. 00 500. 00 000. 00 500. 00 000. 00 000. 00 000.00 000. 00 500. 00 000. 00 000. 00 500. 00 000. 00 000. 00 500. 00 500.00 000. 00 000. 00 500. 00 500.00
3,830,500.00
2,134,000.00
3,141,000.00 . . .
6,248,000.00 .
787.500.00
1,016,937. 90 1,064,606.42 2,876,018. 74 3,766, 536.90
3,827. 25 («) 122,096.82 262,000. 00 650,000. 00
18,952,000. 00 835,000.00
50,267,400.00
Total May 32,013,413,133.5 29, 521,870,249. 82
Treasury biUs: Regular Monthly:
Juneli2 Dated May 31,1969 46.643. 1 Maturing Feb. 28,1971. 1 Maturing May 31,1971 1 Treasury certtficates, maturing:
June 30,1970 2 June 30,1970
7.393 7.277 3.50 3.50
499,960,000.00 . 1,200,170,000.00 .
3,310.50 .
1,500,544,000.00
11,321,368. 50
Footnotes at end of table.
Digitized for FRASER http://fraser.stlouisfed.org/ Federal Reserve Bank of St. Louis

200 19 70 REPORT OF THE SECRETARY OF THE TREASURY
T A B L E 34.—Issues, maturities, and redemptions of interest-bearing public debt securities, excluding special issues, Ju ly 1969-June 1970—Continued
Date Securities Amount matured
Rate of Amount issued 2 or caUed or re-interest 1 deemed prior to
maturity 3
1970 Treasury biUs:
Regular weekly: June 2 Maturing July 23,1970 6.476
Adjustments of cash issues 4 Dated Dec. 4,1969 4 7.166 4 Maturing Sept. 3,1970 6.824 4 Maturing Dec. 3, 1970 6.858 4 Maturing Aug. 27,1970 7.133
Adjustments of cash issues 4 Maturing Nov. 27,1970 7.356
Adjustments of cash issues 4 Treasury notes, foreign series, maturing
Aug. 26,1971 7.55 Treasury biUs:
Regular weekly: 11 Dated Dec. 11,1969 47.248 11 Maturing Sept. 10, 1970-- 6.783 11 Maturing Dec. 10,1970 - 6.895 11 Certtficates of indebtedness, foreign series,
maturing Sept. 11,1970 6.80 11 Treasury notes, foreign currency series,
maturing: June 11,1970. 6.375 Sept. 13,1971 7.60
11 Treasury notes, foreign series, maturing Oct. 28, 1971.. 7.65
Treasm-y biUs: Regular weekly:
12 Maturing Oct. 15, 1970 6.247 Adjustments of cash issues
15 Certtficates of indebtedness, foreign series, maturing:
Sept. 11, 1970. 6.80 Sept. 15, 1970. 6.80
15 Treasmy certificates, maturing: June 15. 1970 LOO Dec. 15, 1970 1.00
18 Dec. 15, 1970 LOO 18 Treasury notes, foreign series, maturing
Oct. 28,1971. 7.65 Treasury bills:
Regular weekly: 18 DatedDec. 18, 1969.... 47.27I 18 Matmhig Sept. 17, 1970 6.732 18 Maturmg Dec. 17, 1970. 6.946 19 Matming Oct. 29, 1970 7.253
Adjustments of cash issues Tax anticipation:
22 Dated Oct. 29, 1969 4 7.461 22 Treasury certtficates, maturhig June 30, 1970.. 3. 50 23 Treasury notes, foreign series, maturing
June 23, 1970. 4.66 24 Certificates of indebtedness, foreign series,
maturing Sept. 24,1970 6.65 25 Treasmy notes, foreign series, maturing
Nov. 18, 1971 7.63 Treasury bUls:
Regular weekly: 25 Dated Dec. 26, 1969 4 6.886 25 Maturing Sept. 24, 1970 6.626 25 Maturmg Dec. 24, 1970 6.929 26 Certificates of indebtedness, foreign series,
maturing: July 23, 1970. 6.50 Sept. 11, 1970 6.80
26 Treasm-y notes, foreign series, raaturing Nov. 2, 1970. 6.40
Treasmy biUs: Regular monthly:
30 Dated June30, 1969 47.347 30 Matmmg Mar. 31,1971. 7.068 30 Maturing June 30, 1971 7.079 30 Certificates of indebtedness, foreign series,
raaturing Sept. 30, 1970 6.45 30 Treasmy certificates, raaturing:
June30,1970 3.50 June30,1971 3.50
Footnotes at end of table.
-$10,000.00 $3,001,707,000.00
1,800,910,000.00 1,306,400,000.00
86, '566. '55 ' . ' ! - - . ' . ' -^ ' ' - ' - . ' -
2i6,'666.'66 '.'."'.".".''.".".".".'.''.."
100,000,000.00
2,998,363,000.00 1,803,030,000.00 1,302,860,000.00
50,000,000.00
23,280,176.93 23,193,784,07
100,000,000.00
96 , '666 . '66" ! " . - . ' . ' " - " - ' . " - - . ' . ' -
50,000,000.00 150,000,000.00
. 2,801,855.51 5,315,864.79 .
5,047,523.09
100,000,000.00
3,003,419,000.00 1,802,570,000.00 1,302,670,000.00
' " " " ' " - 7 6 , ' 6 6 6 . " 6 6 ' - - - - - - - - . " . " : ^
4,507,950,000.00
1,745,205.48
85,000,000.00
100,000,000.00
200,000,000.00
- 3,013,205,000.00 1,801,070,000.00 1,302,570,000.00
70,000,000.00 100,000,000.00
203,559.54
1,701,673,000.00 500,560,000.00
1,201,460,000.00
20,000,000.00
774,536,670.79 782,178,792.97
Digitized for FRASER http://fraser.stlouisfed.org/ Federal Reserve Bank of St. Louis
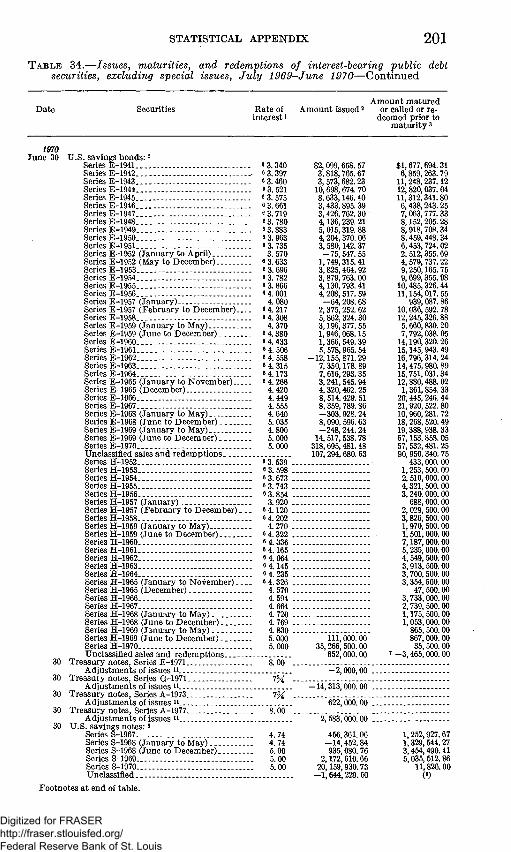
STATISTICAL APPENDIX 201 TABLE 34.—Issues, maturities, and redemptions of interest-hearing public debt
securities, excluding special issues, July 1969-June 1970—Continued
Date Securities Amount raatured
Rate of Amount issued 2 or called or re-interest 1 deemed prior to
matmity 3
1970 June 30 U.S. savings bonds: ^
Series E-1941 SeriesE-1942 Series E-1943 SeriesE-1944 Series E-1945 SeriesE-1946 Series E-1947 Series E-1948 Scries E-1949.-- - -Series E-1950 Series E-1951 Series E-1952 (January to April)-Series E-1952 (May to December) -. Series E-1953 Series E-1954 . .- -Series E-1955 Series E-1956 .-. Series E-1957 (January) Series E-1957 (February to December)-. Series E-1958 Series E-1959 (January to May) Series E-1959 (June to December) -SeriesE-1960-- -Series E-1961 - - -. SeriesE-1962 Series E-1963 -Series E-1964 -. Series E-1965 (January to November)-.. Series E-1965 (D ecember) Series E-1966 Series E-1967 Series E-1968 (January to May) Series E-1968 (June to December) Series E-1969 (January to May) -.. Series E-1969 (June to December) Series E-1970 - -.. Unclassified sales and redemptions SeriesH-1952 Series H~1953 -- -.. SeriesH-1954 SeriesH-1955 -Series H-1956 -Series H-1957 (January) Series H-1957 (February to December) _ Series H-1958 Series H-1959 (January to May) --. Series H-1959 (June to December) SeriesH-1960-- .- - . . . SeriesH-1961 SeriesH-1962. SeriesH-1963 SeriesH-1964 Series H-1965 (January to Noveraber).. Series H-1965 (Deceraber) Series H-1966 SeriesH-1967 Series H-1968 (January to May) _ _ Series H-1968 (June to Deceraber) Series H-1969 (January to May) _ Series H-1969 (June to Deceraber) Series H-1970 Unclassified sales and rederaptions
30 Treasury notes. Series E-1971 Adjustraents of issues n
30 Treasury notes. Series G-1971 Adjustments of issues n
30 Treasury notes. Series A-1973 Adjustments of issues "
30 Treasury notes. Series A-1977 Adjustments of issues n
30 U.S. savings notes:» Series S-1967 Series S-1968 (January to May) Series S-1968 (June to Deceraber) Series S-1969 Series S-1970.. Unclassified
6 4,
3.340 3.397 3.460 3. 521 3.575 3.661 3.719 3.780 3.883 3.963 3.735 3.670 3.633 3.696 3.782 3.866 4.001 4.080 4.217 4.308 4.370 4.380 4.433 :.506
4. 558 4.315 4.173 4.266 4.420 4.449 4.555 4.640 5.035 4.800 5.000 5.000
63. 539 . 3.598 . 3.673 . 3.743 . 3. 854 . 3.920 . 4.120 . 4.202 . 4.270 . 4.322 . 4.336 . 4.165 . 4. 064 . 4.145 . 4. 235 . 4.326 . 4. 570 . 4. 594 . 4. 664 . 4.720 . 4.769 . 4.830 . 5.000 5.000
1.00
7M
"7'A
4.74 4.74 5.00 5.00 5.00
$2, 099,658. 57 3, 818,765.67 3, 573,682.23 10,698,674. 70 8,633,146. 40 3,433,895.39 3,426,762.30 4,136,239.21 5, 015,319.88 4,204,370. 06 3, 580,142.37 -75, 547. 55 1,749,315.41 3,825,464.92 3,879, 763.00 4,130,793.41 4,208, 517. 59 -64,208.68
2,375,252.62 5, 862,324.30 3,196,377. 55 1,946,068.15 1,366, 549.39 5, 578,965. 54
-12,155,87L29 7,350,178.89 7,616,293.35 3,241, 545. 94 4,320,462.25 8, 514,429. 51 8.359,789.86 -303,928.24 8,090, 596.63 -248,244.24
14, 517, 538.78 318,695,481.48 107,294,680.63
111, 000. 00 35,266, 500. 00
652,000. 00
-2,000,00 .
-14,313.000.00 .
622,000.00
2,583,000.00 .
456,361.06 -14,452.84 935,080.76
2,172,610.66 20,159,930.73 -1,644,229. 50
$1,677, 6,859, 11,248, 12,820, 11,312, 6,438, 7, 063, 8,152, 8,918, 8,459. 6,453, 2, 512, 4,579, 9,250, 9.699, 10,485, 11,154,
939, 10,036, 12,245, 5,660, 7,792, 14,190, 15,145, 16,796, 14,475, 15,751, 12,880, 1,361,
20,445, 21,920, 10,960, 18,268, 19,388, 67,153, 57, 532, 90,950,
433, 1,253, 2,510, 4,321, 3,240. 688,
2,029, 3,826, 1,970, 1, 501, 7,187, 5,235, 4,549, 3,913, 3.700, 3,354,
47, 3,733, 2,739, 1,175, 1,053, 865, 867, 35,
-3,465,
694. 31 263. 79 237.12 037.04 341.80 243.25 777.33 205.28 708.34 448.34 724.02 355.69 737.22 165. 75 355.98 326.44 017.55 087.86 592. 78 326.88 830.20 038. 05 320. 26 943.49 314.24 980.89 031.34 488.02 854. 33 246.44 522. 80 281.72 520.49 938. 33 858. 05 481.25 340.75 000.00 500. 00 000. 00 500.00 000.00 000. 00 500. 00 500. 00 500. 00 000. 00 000. 00 000.00 500.00 500.00 500. 00 500. 00 500.00 000.00 500.00 500.00 000.00 500.00 000. 00 500. 00 000. 00
1,252,927.67 1,329,544.27 3,454,490.41 5,035,512.86
11,826.00 («)
Footnotes at end of table.
Digitized for FRASER http://fraser.stlouisfed.org/ Federal Reserve Bank of St. Louis

202 19 70 REPORT OF THE SECRETARY OF THE TREASURY
T A B L E 34.—Issues, maturities, and redeirriptions of interest-bearing puhlic debt securities, excluding special issues, Ju ly 1969-June 1970—Continued
Date Securities Rate of interest i
Araount issued 2 Amount raatured
or called or le-deemed prior to
raa turity 3
1970 June 30
30 30
30 30
U.S. retireraent plan bonds Depositary bonds. First Series . Treasury bonds, REA Series : Treasury bonds, Investment Series B-1975-80.
Redeemed in exchange for i y % Treasury notes, Series EA-1975
Treasury notes, Series EA-1975 Miscellaneous
Percent 3.99 2.00 2.00 2M
l y
$724, 882. 60 368, 000. 00
1,362,000.00 .
$237, 523. 86 847, 000. 00 320, 000. 00
1, 362, 000. 00
"49,"853,"666."65
TotalJune 18,242,299,1 •. 26 21, 370, 452, 216. 85
Total fiscal year 1970 245,846,097,053.69 238,083,606,347.23
1 For Treasury bills, average rate on bank discount basis is shown; for savings bonds, approximate yield to maturity is shown.
2 Since May 1, 1957, Series E and H bonds have been the only savings bonds on sale. Amounts shown for Series E represent issue price plus accrued discount and for Series H issue price at par.
3 For savings bonds of Series E, amounts represent current redeniption value (issue price plus accrued discount); and for Series H, amounts represent redemption value at par.
4 Average interest rate for corabined original and additional issues. 5 At option of owner, Series E bonds dated May 1,1941, through Apr. 1, 1952, may be
held and wiU accrue interest for additional 20 years; bonds dated on and after May 1, 1952, may be held and will accrue interest for additional 10 years. At option of owner. Series H bonds dated June 1, 1952, through Nov. 1, 1965, may be held and wiU accrue interest for additional 10 years.
6 Represents a weighted average of the approximate yield of bonds of various issue dates within the yearly series if held to maturity or if held from issue date to end of applicable extention period, coraputed on the basis of bonds outstanding June 30, 1969. (See Treasury Chculars Nos. 653 (8th Revision) and 905 (5th Revision), as revised and amended, for detaUs of yields by issue dates for Series E and H savings bonds respectively.)
7 Amounts transferred from unclasstfied sales or rederaptions to sales or redemptions of designated series.
8 Redeemable after 1 year frora issue date at option of owner. 9 Unclassified rederaptions of savtngs notes are included in unclassified redeniptions
of Series E savings bonds beginning May 1, 1968. 10 Represents an additional $302,934,000 on each of seven series of outstanding Treasury
biUs issued in a strip to raature each week frora Sept. 18 to Oct. 30,1969. 11 Adjustraents of amounts originally reported on date of issue or exchange. 12 Settleraent raade subsequent to last day of nionth in which bills matured. 13 The principal doUar equivalent of this security increased as a result of the revalua
tion of the Deutsche mark on October 26,1969. The increase in principal dollar equivalent is offset by a corresponding decrease of interest cost over the reraaining term of the security pursuant to revaluation clause as agreed upon with the Deutsche Bundesbank.
14 The principal dollar equivalent of this security increased as a result of the revaluation of the Deutsche mark on October 26, 1969. The increase in the principal amount will be absorbed by the Exchange Stabilization Fund upon redemption.
NOTE: Reports of issues and retirements of Treasury biUs broken down as to exchange and cash were discontinued effective with the bUls issued on Mar. 12, 1970.
Digitized for FRASER http://fraser.stlouisfed.org/ Federal Reserve Bank of St. Louis
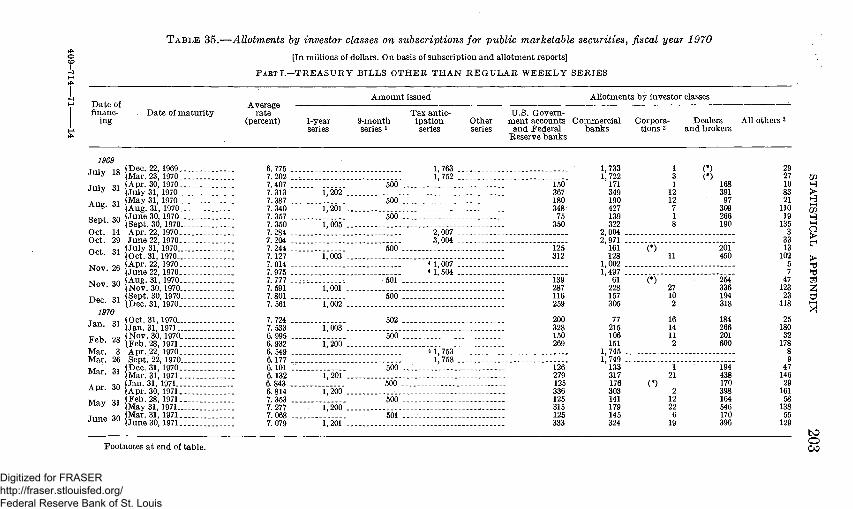
TABLE 35.- -Allotments hy investor classes on subscriptions for puhlic marketable securities, fiscat year 1970 [In mUlions of dollars. On basis of subscription and aUotment reports]
PARTI .—TREASURY BILLS OTHER THAN REGULAR WEEKLY SERIES
D a t e of financ- . D a t e of m a t u r i t y
ing
1969 Tnlv 18 j D e c . 22, 1969. . . j m y 18 JMar. 23, 1970 Tnlv - l | A p r . 30, 1970 •^^ly '^l \ J u l y 31, 1970.. . . . . . ^ Ol (May 31, 1970
A u g . 6i JAug. 31, 1970 Spnt ^0 | J u n e 3 0 , 1970 bep t . 3U | ggp^ 3Q g7Q_ _ Oct . 14 A p r . 22, 1970 Oct . 29 J u n e 22,1970. . . . . Opt qi ( Ju ly 31, 1970 .
Nov Ofi (Apr . 22, 1970 NOV. 2b Jj^j^g22, 1970.. Nov on (Aug . 31, 1970 . . . JNOV. 60 | ^ Q ^ _ 3Q ^970 r>pn ^1 (Sept . 30, 1970 u e c . 6 i JDec . 31 ,1970 . .
1970 j ^ ^ o. (Oct . 31, 1970 •^^'^' 31 | J a n . 3 1 , 1971 Fph OQ ( N o v . 30, 1970 J^eD. ZiS j j , g ^ 28, 1971 . . Mar . 3 A p r . 22 1970 Mar. 26 Sept . 22, 1970 Mar ^1 ( D e c . 3 1 , 1 9 7 0 . . . . . . . . . . . . . ^ ^ ^ ' 31 JMar. 31, 1971 Anr SO ( Jan . 31, 1971 A p r . 60 J^p^, 3Q jg^^ _ _ M«v " l ( F e b . 28, 1971 M a y 31 j j ^ ^ y 3^^ jg^^ T,nr,o ^n (Mar. 31, 1971
• ^^ ^Mjune3o,i97i.....:.:::... Footnotes a t end of tab le .
Average ra te
(percent)
6.775 . . 7.202 . . 7.407 . . 7.313 7.387 . . 7.340 7.357 . . 7.350 7.284 . . 7 . 2 0 4 . . 7.244 . . 7.127 7 . 0 1 4 . . 7.975 . 7.777 . . 7.591 7.801 . . 7.561
7.724 . . 7.533 6.995 . . 6.932 6.549 . . 6.177 . . 6.101 . : 6.132 6.843 6.814 7.353 . . 7.277 7.068 . . 7.079
1-year series
1, 202 .
1,201 .
1,005 .
1,003 .
1,001 .
1,002 .
1,003 .
1,200 .
1,201 .
1,200 .
1,200 .
1,201 .
A m o u n t issued
9-month series i
500 .
' " " ' 6 5 5 "
.... .....
500 .
501 . -----
502 .
" " 5 5 5 " "
500 .
'5'o"6'."
" " ' 5 6 5 ' ]
501 -
Tax anticipa t ion series
1,763 . 1,752 .
2,007 .. 3,004 .
4 1,007 .. 4 1,504 ..
4 1, 753 . 1,758 .
U . S . Govern-Other m e n t accounts series a n d Federa l
Reserve b a n k s
150 367 180 348
75 350
--g-312
139 287 116 259
200 328 150 269
----279 125 336 125 315 125 333
AUotments b y investor classes
Commerc ia l b a n k s
1,733 1,722
171 349 190 427 139 322
2,004 . 2,971 .
161 128
1,002 . 1,497 .
61 228 157 305
77 215 106 151
1,745 . 1,749 .
133 317 176 303 141 179 145 324
Corporat ions 2
(*)
(*)
(*)
1 3 1
12 12 7 1 8
11
27 10 2
16 14 11 2
.... 21
2 12 22
6 19
Dealers a n d brokers
(*) (*)
168 391
97 309 266 190
201 450
254 336 194 318
184 266 201 600
"194" 438 170 398 164 546 170 396
AU others s
29 27 10 83 21
110 19
135 3
33 13
102 5 7
47 123 23
118
25 180
32 178
8 9
47 146 29
161 58
138 55
129
ZP H >
HH
0
> >
w t--{
[xl
bO 0 00
Digitized for FRASER http://fraser.stlouisfed.org/ Federal Reserve Bank of St. Louis

to o F 4 ^
TABLE 35.—Allotments hy investor classes on subscriptions for puhlic marketable securities, fiscal year 1970—Continued [In mill ions of dollars] '
P A R T I I . — S E C U R I T I E S O T H E R T H A N T R E A S U R Y B I L L S
Issue AUotments b y investor classes
td & Hd o
o
W
ZP
o
yri > pi Kl o
M
?d
ZP
d
D a t e of financing
Descr ipt ion s
A m o u n t issued
I n ex-For change for
Cash other secm-ities
U . S . Gove r n m e n t accounts a n d Fed
eral Reserve b a n k s
Coramercial b a n k s 6
Ind i v iduals 7
Insurance companies
M u t u a l savings b a n k s
Corpora t ions
S ta te a n d local P r i v a t e governraents» pension a n d re- Pens ion
t i reraent a n d retire- Other funds raent funds funds
Dealers and
brokers
537 240 136 380
86 241 345 270 157 146
All other 9
184 381 65 56
243 112 64 349 314 71
Aug . 15 7 K % note , F e b . 15, 1971-D 2,924 125 1,438 301 38 [8% note . May 15, 1971-E 4,176 564 2,111 217 65
Oct. 1 - ^ 7 ^ % note , May 15, 1973-A 1,160 125 660 87 23 l7M% note , A u g . 15, 1976-C 1,683 564 476 96 29
1970 f8K% note , Aug . 15, 1971-F 2,255 292 1,175 85 47
F e b . 15 ^ 8 H % note , A u g . 15, 1973-B 1,846 288 942 51 17 [8% note , F e b . 15, 1977-A 1,856 458 746 48 38 (7M% note , N o v . 15, 1971-G 3,665 7,064 7,005 2,352 391 7
May 15 -^7%% note , May 15, 1973-A 4 4,686 2,421 1,442 171 23 [8% note , F e b . 15, 1977-A 4 3,313 2,125 819 53 7
52 42
20 17 14 15 28 19
62 254
12 31
169 76 47 34 33
6
31 15 4
6 11
2 13
1 1 2
150 276 37 24
125 97 77
297 90 55
•Less t h a n $500,000. 1 Addi t iona l issue of biUs w i t h original m a t u r i t y of 1 year . 2 Exclusive of b a n k s a n d insurance companies . 3 Includes indiv iduals , insurance companies , m u t u a l savings b a n k s , p r iva te pension
funds. S ta te and local funds, savings and loan associations, nonprofit ins t i tu t ions , a n d inves tments of foreign balances a n d in ternat ional accounts in th is coun t ry . Also includes certahi Gove rnmen t deposit accounts and Government-sponsored agencies.
4 Reopening of earlier issue. 6 Excludes l y percent T rea su ry E A a n d E O notes issued in exchange for nonmarke t
able 2 ^ percent T r e a s u r y b o n d s . I n v e s t m e n t Series B-1975-80. 6 Inc ludes t rus t companies and stock savings b a n k s .
7 Includes par tnersh ips and personal t r u s t accounts . 8 Consists of t rus t , s inking, a n d i nves tmen t funds of S ta te and local g o v e r n m e n t s ,
a n d their agencies. 9 Includes savings a n d loan associations, nonprofit ins t i tu t ions , and inves tmen t s of
foreign balances and in terna t ional accounts in th is coun t ry . Also includes certain Gove rnmen t deposit accounts a n d Government-sponsored agencies.
N O T E . — A U o t m e n t s frora J u l y 15,1953, th rough May 15,1959, wiU be found in the 1959 a n n u a l report , p p . 628-530. For succeeding fiscal years see corresponding tables in successive annua l reports and for cu r ren t figures see raonthly " T r e a s u r y Bu l l e t i n . "
Digitized for FRASER http://fraser.stlouisfed.org/ Federal Reserve Bank of St. Louis

T A B L E 36.—Allotments of Treasury notes issued during the fiscal year 1970, by Federal Reserve districts
[In thousands]
Federa l Reserve d is t r ic t
7% percent Series D-1971 • notes issued tn exchange for 6 percent Series
C-1969 T rea su ry notes m a t u r h i g Aug . 15,1969 1
8 percent Series E-1971 notes issued in exchange for i— 7M percent Series A-1973 notes issued hi exchange for i
l y percent Series EO-1969 T rea su ry notes
m a t u r i n g Oct. 1, 1969
4 percent T r e a s u r y
bonds of 1969 m a t u r i n g
Oct . 1, 1969
2 y percent T r e a s u r y
bonds of 1964-69 m a t u r i n g Dec . 15,1969
T o t a l issued
l y percent Series EO-1969 Treasu ry notes
m a t u r i n g Oct . 1,1969
4 percent T rea su ry
bonds of 1969 m a t u r h i g
Oet. 1,1969
2 y percent T r e a s u r y
bonds of 1964-69 m a t u r i n g Dec . 15,1969
T o t a l issued
ZP
) — I
ZP H^ t—I
o > > hj Hd
300 100 550
Bos ton $118,605 $1,560 $150,857 $5,523 $157,940 $146 N e w Y o r k 1,362,457 24,966 1,531,123 460,206 2,016,295 390 Ph i l ade lph ia 86,286 788 95,810 35,191 131,789 1,720 Cleveland 190,604 3,081 150,375 40,228 193,684 R i c h m o n d : 75,579 1,275 98,028 26,607 125,911 A t l a n t a 132,686 1,661 132,303 14,051 148,014 100 Chicago 383,529 5,267 393,637 129,632 528,536 S t . L o u i s 128,052 1 ,967- 149,328 39,217 190,511 Mhineapolis 62,430 112 69,061 14,574 83,747 K a n s a s C i t y 133,325 2,456 149,889 34,601 186,946 DaUas 87,832 1,075 77,978 10,574 89,627 S a n F r a n c i s c o 142,290 7,070 161,577 146,827 315,474 5,825 T r e a s u r y 19,958 4,438 3,581 8,019 100
T o t a l aUotments Exchanged in concurrent oflerhig.
T o t a l exchanged^ N o t s u b m i t t e d for exchange
T o t a l eligible for exchange 158,926 6,239,832 2,484,310 8,883,068 158,926
$20,403 274,686
25, 758 66,154 16, 369 30,940
236,982 57,117 30,170 43,476 23,945 40,874 1,990
$2,491 176, 561 10,024 14,309 4,266
10, 946 23, 882 10,256 4,574 6,949 4,237 7,082
$23,040 451, 637
37, 502 80,463 20, 635 41,986
264, 555 67, 673 34,844 50,975 28,182 53, 781
5,178
2,923,633 51, 278 15, 250
66, 528 92,398
3,164,404 1,978,026
5,142,430 1,097,402
960,811 850,139
1, 810,950 673, 360
4,176,493 2, 843,415
7,019,908 1,863,160
12,922 53, 606
66, 528 92, 398
868, 864 4,273, 566
5,142,430 1,097,402
278, 665 1, 532, 286
1,810,951 673, 359
1,160,451 5, 859,458
7,019,909 1,863,159
6,239, 832 2,484,310 8, 883, 068
F o o t n o t e a t end of t ab le .
O
Digitized for FRASER http://fraser.stlouisfed.org/ Federal Reserve Bank of St. Louis
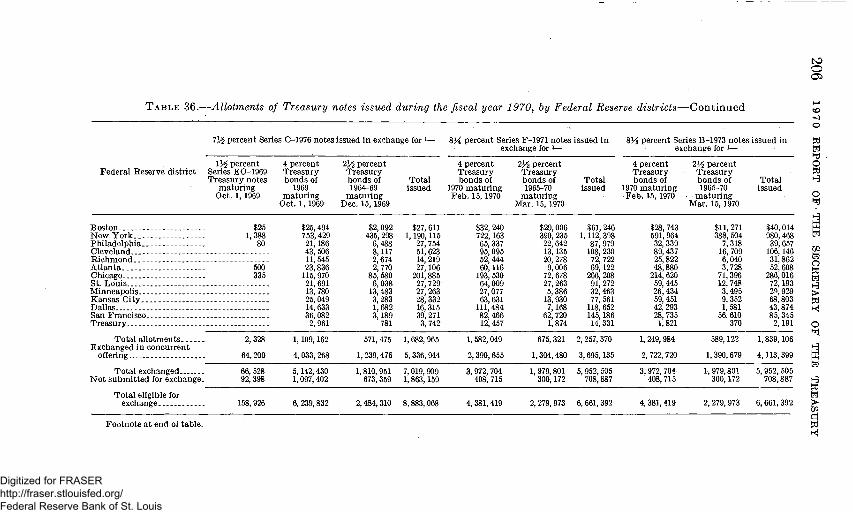
CO
o
T A B L E 36.—Allotments of Treasury notes issued during the fiscal year 1970, by Federal Reserve distr icts—Continued
71^ percent Series C-1976 notes issued in exchange for 1 s y percent Series F-1971 notes issued in exchange for 1—
814 percent Series B-1973 notes issued in exchange for 1—
Federal Reserve district l y percent
Series EO-1969 Treasmy notes
maturing Oct. 1, 1969
4 percent Treasmy bonds of
1969 maturing
Oct. 1, 1969
2 y percent Treasury bonds of 1964-69
matming Dec. 15, 1969
Total issued
4 percent Treasury bonds of
1970 maturing Feb. 15, 1970
2 y percent Treasm-y bonds of 1965-70
maturing Mar. 15, 1970
Total
4 percent Treasmy bonds of
1970 raaturing Feb. 15, 1970
2 y percent Treasury bonds of 1965-70
maturing Mar. 15, 1970
2,484,310 8,883, ( 4, 381,419 2, 279, 973 6, 661, 392 4,381,419
Total issued
Boston... $25 $25,494 $2,092 $27,611 $32,240 $29,006 $61,246 $28,743 $11,271 $40,014 NewYork 1,388 753,429 435,298 1,190,115 722,163 390,235 1,112,398 591,964 388,504 980,468 Philadelphia 80 21,186 6,488 27,754 65,337 22,642 87,979 32,339 7,318 39,657 Cleveland 43,506 8,117 51,623 95,095 13,135 108,230 89,437 16,709 106,146 Richmond 11,545 2,674 14,219 52,444 20,278 72,722 25,822 6,040 31,862 Atlanta 500 23,836 2,770 27,106 60,116 9,006 69,122 48,880 3,728 52,608 Chicago. 335 115,970 85,580 201,885 193,530 72,678 266,208 214,620 71,396 286,016 St.Louis 21,691 6,038 27,729 64,009 27,263 91,272 59,445 12,748 72,193 Minneapolis. 13,780 13,483 27,263 27,077 5,386 32,463 26,434 3,495 29,929 KansasCity 25,049 3,283 28,332 63,631 13,930 77,561 59,451 9,352 68,803 Dallas - 14,633 1,682 16,315 111,484 7,168 118,652 42,293 1,581 43,874 SanFrancisco. 36,082 3,189 39,271 82,466 62,720 145,186 28,735 56,610 85,345 Treasury 2,961 781 3,742 12,457 1,874 14,331 1,821 370 2,191
Total aUotments 2,328 1,109,162 571,475 1,682,965 1,582,049 675,321 2,257,370 1,249,984 589,122 1,839,106 Exchanged in concurrent
offering . . . 64,200 4,033,268 1,239,476 5,336,944 2,390,655 1,304,480 3,695,135 2,722,720 1,390,679 4,113,399
Total exchanged 66, 528 5,142,430 1,810, 951 7,019, 909 3,972, 704 1, 979,801 5, 952, 505 3, 972, 704 1, 979,801 5, 952, 505 Not submitted for exchange. 92,398 1,097,402 673,359 1,863,159 408,715 300,172 708,887 408,715 300,172 708,887
Total eligible for exchange 158,926 6,239,832 2, 279, 973 6, 661. 392
o
Hd O
y ^
o
M
ZP
a
y ^ > y <
o
y ^
W
H^
> ZP
d y <
Footnote at end of table.
Digitized for FRASER http://fraser.stlouisfed.org/ Federal Reserve Bank of St. Louis
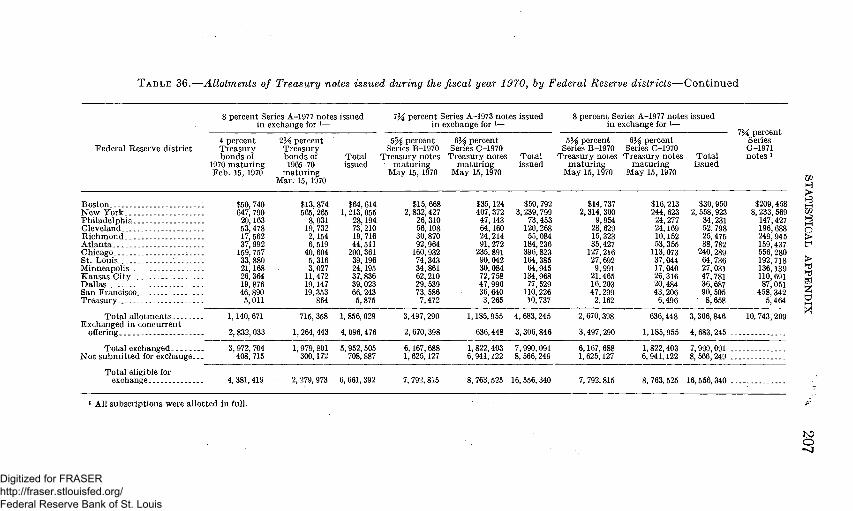
T A B L E 36.—Allotments of Treasury notes issued during the fiscal year 1970, by Federal Reserve districts—Continued
Federa l Reserve dis t r ic t
Bos ton N e w Y o r k Ph i l ade lph ia Cleveland R i c h m o n d A t l a n t a Chicago 1 . . . St . Louis . Minneapolis Kansas C i ty . . Dal las San Francisco Treasm-y
T o t a l aUotraents Exchanged in concurren t
offering
T o t a l exchanged . N o t s u b m i t t e d for exchange . .
T o t a l eligible for exchange
8 percent Series A-1977 notes issued in exchange for i—
4 percent T reasu ry bonds of
1970 m a t u r i n g F e b . 15, 1970
: $50,740 647, 790
20,163 63,478 17,562 37,992
159, 757 33, 880 21,168
"26,364 19, 876 46, 890
5,011
1,140, 671
2, 832, 033
3, 972, 704 408, 715
4, 381, 419
2 y percent T r e a s m y bonds of 1965-70
m a t u r i n g Mar. 15, 1970
$13, 874 565, 265
8,031 19, 732 2,154 6,519
40, 604 5,316 3,027
11, 472 19,147 19,353
864
715,358
1, 264, 443
1, 979, 801 300,172
2, 279, 973
T o t a l ' issued
$64,614 1, 213, 055
28.194 73, 210 19, 716 44,611
200,361 39,196 24.195 37, 836 39, 023 66, 243 5,875
1, 856, 029
4, 096, 476
6, 952,505 708, 887
6, 661, 392
7% percent Series A-1973 notes issued in exchange for i—
b y percent Series B-1970
Treasury notes m a t u r i n g
May 15, 1970
$15, 668 2,832,427
26, 310 56,108 30,870 92,964
160,932 74,343 34,861 62,210 29,539 73,586
7,472
3,497,290
2, 670,398
6,167,688 1, 625,127
7, 792, 815
6H percent Series C-1970
Trea su ry notes m a t u r i n g
May 15, 1970
$35,124 407,372
47,143 64,160 24,214 91,272
235,891 90,042 30,084 72,758 47,990 36, 640 3,265
1,185,955
636,448
1,822,403 6, 941,122
8, 763,525
T o t a l issued
$50,792 3,239,799
73,453 120,268
55,084 184,236 396,823 164,385
64,945 134,968
77,529 110,226
10,737
4, 683,245
3,306,846
7,990,091 8, 566,249
16, 556, 340
8 percent Series A-1977 notes issued in exchange for i—
b y percent Series B-1970
Treasm-y notes m a t u r i n g
May 15, 1970
$14,737 2,314,300
9,954 28, 629 15,323 35,427
127,216 27,692
9,991 21,465 16,203 47,299
2,162
2, 670,398
3,497,290
6,167,688 1, 625,127
7, 792, 815
6 ^ percent Series C-1970
Trea su ry notes m a t u r i n g
May 15, 1970
$16,213 244,623
24,277 24,169 10,152 53,355
113,073 37,044 17,040 26,316 20,484 43,206
6,496
636,448
1,185,955
1, 822,403 6, 941,122
8,763,525
T o t a l issued
$30,950 2, 558,923
34,231 52,798 25,475 88,782
240,289 64,736 27,031 47,781 36,687 90,505
' 8,658
3,306, 846
4,683,245 .
7,990,091 . 8,566,249 .
16,556,340 .
7% percent Series G-1971 notes 1
$209,458 8,233, 569
147,427 196,688 249, 945 159,437 556, 280 192,718 136,139 110, 691 87,051
458,342 5,464
10, 743,209
ZP
O
> >
'A
I All subscriptions were allotted in fuU.
to o
Digitized for FRASER http://fraser.stlouisfed.org/ Federal Reserve Bank of St. Louis
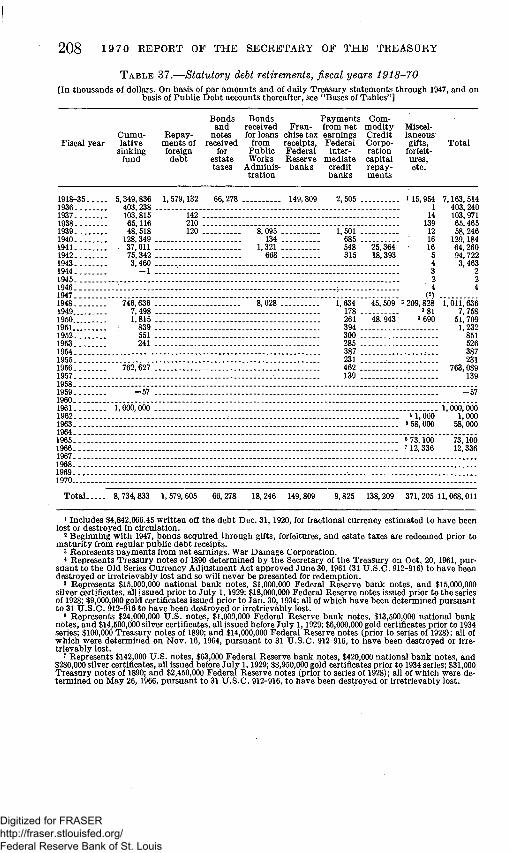
208 19 70 REPORT OF THE SECRETARY OF THE TREASURY
TABLE 37.—Statutory debt retirements, fiscal years 1918-70 [In thousands of dollars. On basis of par amounts and of daily Treasury statements through 1947, and on
basis of Public Debt accounts thereafter, see "Bases of Tables"]
Fiscal year
1918-35 1936 1937 1938. 1939 1940. 1941 1942. 1943 1944. . . 1945 1946 1947 1948 . . 1949 1950 1961 1952. 1953 1954 1955 1956. 1957 1958 1959 1960 1961 . . 1 9 6 2 . . 1963 . . . 1964 . . 1965 1966 1967 . .
C u m u lat ive
s inking fund
5,349,836 403, 238 . 103,815 65,116 48, 518
: 128,349 . 37,011 . 75,342 . 3,460 .
- 1 .
746, 636 . 7, 498 . 1,815 .
839 . 551 . 241 .
762,627 .
- 5 7 .
1, 000, 000 .
Repaym e n t s of foreign
deb t
1,679,132
142 210 120
Bonds a n d
notes received
for estate taxes
66,278
Bonds received for loans
from P u b l i c Works
Adminis t ra t ion
" " 8 , ' 6 9 5 " 134
1,321 668
8,028
F r a n chise tax receipts . Federa l Reserve
b a n k s
149,809
P a y m e n t s from ne t earnings Federa l
intermed ia te
credit b a n k s
2,505 .
I, loi". 685 . 548 315
1,634 178 . 261 394 . 300 . 285 . 387 . 231 . 462 . 139 .
Comm o d i t y Credi t Corporat ion capital repaym e n t s
""25, '364' 18,393
45, 509
"""48," 943'
Miscellaneous
gifts, forfeit-m e s , e tc .
115,954 1
14 139
12 16 16
5 4 3 2 4
(?) 3 209, 828
3 81 3 690
41,000 »58, 000
6 73,100 7 12,336
T o t a l
7,163, 514 403,240 103,971 65, 465 58,246
129,184 64, 260 94, 722 3,463
2 2 4
1, Oil, 636 7,758
51, 709 1,232
851 526 387 231
763,089 139
—67
1, 000, 000 1,000
58, 000
73,100 12,336
1968 1969 1970
To ta l 8,734,833 1, 579,605 66, 278 18, 246 149,809 9,825 138,209 371, 205 11, 068, Oil
1 Includes $4,842,066.45 written ofl the debt Dec. 31,1920, for fractional cmrency estimated to have been lost or destroyed in chculation.
2 Beginning with 1947, bonds acquired through gifts, forfeitures, and estate taxes are redeemed prior to maturity from regular public debt receipts.
3 Represents payments from net earnings. War Damage Corporation. 4 Represents Treasury notes of 1890 determined by the Secretary of the Treasury on Oct, 20, 1961, pur
suant to the Old Series Currency Adjustment Act approved June 30,1961 (31 U.S.C. 912-916) to have been destroyed or irretrievably lost and so will never be presented for redemption.
5 Represents $15,000,000 national bank notes, $1,000,000 Federal Reserve bank notes, and $15,000,000 sUver certificates, al] j ssued prior to July 1.1929; $18,000,000 Federal Reserve notes issued prior to the series of 1928; $9,000,000 gold certificates issued prior to Jan. 30,1934; all of which have been determined pursuant to 31 U.S.C. 912-916 to have been destroyed or irretrievably lost.
6 Represents $24,000,000 U.S. notes, $1,000,000 Federal Reserve bank notes. $13,500,000 national bank notes, and $14,500,000 sUver certiQcates, aU issued before July 1,1929; $6,000,000 gold certtficates prior to 1934 series; $100,000 Treasmy notes of 1890; and $14,000,000 Federal Reserve notes (prior to series of 1928); aU of which were determined on Nov. 16, 1964, pmsuant to 31 U.S.C. 912-916, to have been destroyed or irretrievably lost.
^ Represents $142,000 U.S. notes, $63,000 Federal Reserve bank notes, $420,000 national bank notes, and $280,000 sUver certificates, all issued before July 1,1929; $8,950,000 gold certificates prior to 1934 series; $31,000 Treasm-y notes of 1890; and $2,450,000 Federal Reserve notes (prior to series of 1928); all of which were determined on May 26,1966, pursuant to 31 U.S.C. 912-916, to have been destroyed or irretrievably lost.
Digitized for FRASER http://fraser.stlouisfed.org/ Federal Reserve Bank of St. Louis

STATISTICAL APPENDIX 209
T A B L E 38.—Cumulative sinking fund, fiscal years 1921-70
[On basis of Public Debt accounts, see "Bases of Tables"]
PART I.—APPROPRIATIONS AND EXPENDITURES
[In mUlions of doUars.]
Fiscal year Appropriations
1921-46 11,73L9 1947 587.6 1948 603.5 1949 619.6 1950 619.7 1951 619.8 1952 619.8 1953 619.8 1954 619.8 1955 619.8 1956 623.8 1957.. 633.3 1958 . 633.3 1959 633.3 1960 633.3 1961 657.1 1962... . 680.8 1963.... 680.8 1964 680.8 1965 680.8 1966 680.8 1967 680.8 1968 . . -- 680.8 1969 680.8 1970 680.8
Total 27,203.2 Deduct cumulative expenditures 8,727.1 ^
Available for expendi- -tme dmmg
yeari
6,525.0 6,112. 6 . 6,716.0 6.589.0 7,201.2 7,819.2 8.438.1 9,057. 4 9, 676. 9 .
10,296.7 . 10, 920. 6 10, 791.2 . 11,424.5 . 12,057. 9 . 12,69L3 . 13,348.4 13.029.3 . 13,710.1 . 14,39L0 . 16,071. 8 . 15,762. 7 . 16,433. 5 . 17.114.4 . 17, 795. 2 . 18,476.0 .
Debt rethed 2
Par amount
6,214. 7
746.6 7.5 L8 .8 .6 .2
762.6
1, 000. 0
8, 734. 8
Cost (principal)
6,207.0
746.6 7.5 L8 .8 .6 .2
762.6
1,000.0
8,727.1
Unexpendedbalance 18,476.1 . .
PART II.—TRANSACTIONS ON ACCOUNT OF THE CUMULATIVE SINKING FUND FISCAL YEAR 1970
Unexpended balance July 1,1969 $17,795,207,402.66 Appropriation for 1970 :
Initial credit: (a) Under the Victory Liberty Loan Act (2^ percent of the
aggregate amount of Liberty bonds and Victory notes outstanding on July 1, 1920, less an amount equal to the par amount 01 any obligation of foreign govermnents heldbythe United States on July 1, 1920) $253,404,864.87
(b) Under the Emergency Relief and Construction Act of 1932 {2\^ percent of the aggregate amount of expenditures from appropriations made or authorized under this act) 7,860,606.83
(c) Under the National Industrial Recovery Act (2ir percent of the aggregate amount of expenditmes from appropriations made or authorized under this act) 80,164,079.53
Total initial credit 341,429, 55L 23 Secondary credit (the interest which would have been payable during
the fiscal year for which the appropriation is made on the bonds and notes purchased, redeemed, or paid out of the sinking fund during such year or in previous years) 339,419,534.24 680,849,085.47
Total available 1970 18,476,056,488.13
Unexpended balance June 30,1970 2 18,476,056,488.13
1 Represents appropriations authorized by Congress. There are no specific funds set aside for this account since any retirements of public debt charged to this account are made from cash balances to the credit of the Treasurer ofthe United States.
2 Net discount on debt rethed through June 30,1970, is $7.7 million.
NOTE.—Comparable annual data for 1921 through 1946 are shown in the 1962 annual report, p. 726.
Digitized for FRASER http://fraser.stlouisfed.org/ Federal Reserve Bank of St. Louis

210 19 70 REPORT OF THE SECRETARY OF THE TREASURY
III. U.S. savmgs bonds and notes
T A B L E 39.—Sales and redemptions of Series E through K savings bonds by series, fi.scal years 1941-70 and monthly 1970 ^ 2
[In miUions of dollars]
Fiscal year or m o n t h
1941-55. 1956 1957 1958 1959 1960 1961 1962. 1963 . . . . 1964 1966 1966 1967 . 1968. 1969 1970
T o t a l th rough J u n e 30, 1970..
1969—July A u g u s t Sep tember October N o v e m b e r December
1970—January F e b r u a r y M a r c h . Apr i l May J u n e _-_
1941-65 1956 1967 1958 1959 I960 . . . . 1961 1962 1963 1964 1965 1966 1967 1968. . . . . — 1969 1970
To ta l th rough J u n e 30, 1970..
1969—July Augus t September October N o v e m b e r December
1970—January F e b r u a r y March _ A p r U . . . . M a y J u n e
Footnotes a t end 0:
Sales
. . 79,203.6
. . 5,259.9
. . 4,613.0
. . 4,670.1
._ 4,506.0
._ 4,307.0
. - 4,463.7
. - 4 ,42L5
. - 4,518.0
. . 4,656.4
. - 4,543.0
. . 4,660.1
. - 4,965.4
._ 4,738.9
. . 4,649.7
. . 4,449.2
. . 148,515.5
388.7 347.6 32L1 403.7 274.3 345.7 380.6 382.8 426.7 365.7 366.7 446.6
. - 31,096.5 586.3 268.4
:: 8
. . 31,95L2
f table .
Accrued discount
9,183.8 1,114.1 1,132. 6 1,160. 7 1,174. 5 1,194. 2 1, 253. 7 1,331. 0 1, 386. 5 1,468. 0 1, 602.1 1, 541. 6 1, 618. 6 1, 730. 7 1, 787. 7 1,841. 4
30, 411. 0
167.8 138.4 159.3 15L8 142.7 169.2 172.4 15L2 160.2 156.8 137.3 134.4
836.9 99.6 83.4 65.2 53.6 46.0 32.1 27.4 2 L 6 .17.7 14.9 12.1 7.8 3.9 L 2
1, 323. 2
Sales p lus
accrued discount
88,387.4 6,374. 0 5, 745. 5 5, 830. 8 5, 680. 4 5, 501. 2 5, 717. 4 5, 752. 5 5, 904. 5 6,114. 4 6, 045.1 6,191.7 6,583. 9 6,469. 5 6, 337. 5 6, 290. 6
178, 926. 6
556.5 486.0 480.4 555.5 417.0 514.8 553.0
• 534.0 586.8 522.6 504.1 680.0
Redempt ions
To ta l Original
purchase price
Series E and H
49,102. 2 4, 730.1 5,176. 2 5,187.1 5,106. 8 5, 602. 2 4, 626. 7 4, 603. 3 4, 500. 5 4, 736. 3 4, 987.4 5, 304. 6 5,448. 7 5, 714. 7 6,198. 2 6, 720. 6
127,645. 6
634.4 536.2 532.9 570.1 420.7 477.6 654.6 583.2 660. 3 562.9 48L9 605. 9
Series F , G,
31, 933.3 686.0 35L8 65.2 53.6 46.0 32.1 27.4 2 L 6 17.7 14.9 12.1 7.8 3.9 L 2
33, 274.4
12, 634. 4 3,104.8 3, 773.5 3, 350. 6 2,137. 2 3,049. 3 1,188.0 1,109. 9
770.7 426.3 357.5 418.3 472.3 266.0 140. 0. 27.0
33,225. 7
2.9 3.6 4.9 3.6 1.4 1.6 L 8 L 3 L 8 1.5 L 3 L 4
45, 969. 3 4,069.1 4,444. 0 4, 431. 9 4, 309. 8 4, 616. 3 3, 905. 8 3, 872. 7 3, 758. 6 3, 981. 8 4,154.1 4,407. 5 4, 535. 7 4, 738. 6 5,112. 2 5,484. 0
111, 791. 3
622.8 44L7 443.3 470.1 350.4 392.9 52L0 477.7 638.1 453.0 387.8 486.1
J, a n d K
12,298. 8 2,940.6 3,605. 0 3,234. 6 2,063.4 2,921. 2 1,128. 8 1,059.0
721.7 399.8 333.1 383.7 434.2 239.1 124.3 23.7
31,91L 1
2.4 3.3 4.6 3.2 L 2 L 2 L 6 1.1 L 6 L 3 LO L 2
Accrued discount
3,132. 9 660.9 732.2 755.3 797.0 885.9 720.8 730.6 742.0 754.5 833.3 897.1 912.9 976.1
1, 086. 0 1, 236. 6
15, 854.1
11L6 94.5 89.6
100.0 70.2 84.7
133.6 105.6 122.2 109.8 94.1
120.8
335.6 164.2 168.5 115.9
73.8 128.1 59.1 50.9 49.0 26.6 24.4 34.5 38.1 26.8 15.7 3.3
1,314. 5
. 4
. 3
. 3
. 3
. 2
. 4
. 2
. 2
. 3
. 1
. 2
. 3
Amo outstan
In teres t -bearing
39, 285.1 . 40,929.1 . 41,498.6 . 42,142. 2 . 42,715.8 . 42,714.8 . 43, 805. 6 . 44,954.8 . 46.358.8 . 47.736.9 . 48,794.5 . 49,68L6 . 50,816. 9 . 51,57L7 . 51, 710. 9 . 61, 281. 0 .
61,281. 0 .
51,633. 0 . 51, 582. 8 . 61,530.3 . 51, 516. 7 . 51, 512.1 . 51, 549.4 , 51.447.7 . 51.398.5 . 51,325. 0 . 51.284.6 . 51.306.8 . 61,281. 0 .
19, 080. 3 16,567.6 13,123. 5 9,842.2 7,786.7 4, 829. 0 3, 708. 7 2,651.9 1,954.9 1, 662.6 1, 248.1
856.7 396.6 140.0
u n t Lding 3
M a t u r e d non
interest-bearing
218.4 312.8 334.7 33L0 302.8 257.3 22L6 195.8 143.7 127.4 99.3 85.5 80.2 74.7 76.8 48.7
48.7
72.9 69.3 64.3 60.8 69.3 57.7 56.0 54.7 52.9 5L4 60.2 48.7
Digitized for FRASER http://fraser.stlouisfed.org/ Federal Reserve Bank of St. Louis

STATISTICAL APPENDIX 211
TABLE 39.—Sales and redemptions of Series E through K savings bonds by series. fiscal years 1941-70 and monthly 1970 12—Continued
Fiscal year or m o n t h
1941-55 1956. . . . 1957 1958. 1959.. 1960 1961 . . . . 1962 1963 1964.. 1965 1966 1967...-1968.. 1969 1970
. To ta l through J u n e 30, 1970.. .
1969- Ju ly Augus t September October Noveraber Deceraber
1970—January F e b r u a r y M a r c h . AprU . May J u n e
1952-55 1956 1957 1958 1959 I960 . . . . 1961 1962 1963. 1964 1965 1966 1967 1968 1969 1970
To ta l through J u n e 30, 1970.. .
1969—July Augus t Septeraber October Noveraber December .
1970—January . . . F e b r u a r y M a r c h . . A p r U . . May J u n e
Sales
. 77,018.7
. 4,219.3
. 3,919.2
. 3,888.6
. 3,688.0
. 3,603.2
. 3,689.2
. 3,674.3
. 3,914.0
. 4,135.6
. 4,112. 3 ,- 4,245.7 . 4,598.8 . 4,465.8 . 4,343. 2 . 4, 288.8
. 137,804.7
374. 2 334. 0 309.1 391.1 264.8 334. 2 362. 5 364.7 413. 2 354.5 355. 0 431. 6
. 2,184. 9 .
. 1,040.6 . 693. 8 . 781. 6 . 818. 0 . 703.9 . 774. 5 . 747. 2 . 604.1 . 520. 8 . 430. 7 . 404.4 . 366. 6 . 273.1 . 206. 5 . 160. 4 .
. 10,710.9 .
14. 5 . 1 3 . 6 . 12. 0 . 12.6 . 9.5 .
1L4 . 18.1 . 18. 0 . 1 3 . 5 . n . 2 . n . 7 . 1 4 . 1 .
Accrued dis
count
9,183.8 1,114.1 1,132.6 1,160. 7 1,174. 5 1,194. 2 1, 253. 7 1, 331. 0 1,386. 5 1,458. 0 1, 502.1 1, 541. 6 1, 618. 6 1, 730. 7 1, 787. 7 1, 841. 4
30, 411. 0
167.8 138.4 159.3 15L8 142.7 169.2 172. 4 15L2 160.2 156.8 137.3 134.4
[In mill ions of doUars]
Sales -plus
accrued discount
86,202. 5 5,333.4 5, 051. 8 5, 049. 3 4,862. 5 4, 797. 4 4,942. 9 5, 005. 3 5,300. 4 5, 593.6 5,614. 4 5, 787. 3 6, 217. 3 6,196.4 6,130. 9 6,130. 3
168,215. 7
642.0 472.4 468.3 542.9 407.5 503.4 534.9 615.9 573.4 5 n . 2 492.4 565.9
2,184.9 1,040. 6
693.8 78L6 818.0 703.9 774.5 747.2 604.1 620.8 430. 7 404.4 366.6 273.1 206.5 160.4
10, 710. 9
14.5 13.6 12.0 12.6 9.5
n . 4 18.1 18.0 13.5 n . 2 n . 7 14.1
Redempt ions
To ta l Original
pur chase price
Series E
49 016 1 4,622.0 4,980. 6 4,951.0 4,889.4 5,180. 6 4, 393. 8 4, 343. 3 4, 202.9 4,363.1 4, 538.4 4,800. 6 4,895. 3 5,154.1 5, 547. 8 5,958.9
121,837. 7
557.8 477.5 47L3 499.9 365.9 423.3 588.7 514.5 58L9 499.3 429.6 549.1
45,883.2 3,961.0 4, 248. 5 4,195. 8 4,092.4 4,294.7 3,672.9 3,612. 6 3,461.0 3,608.6 3,705.0 3,903. 6 3,982.4 4,178. 0 4,461.8 4,722.3
105,983.7
446.2 382.9 38L8 399.9 295.6 338.7 455.1 409.1 459.7 389.4 335.6 428.3
Series H
86.1 108.1 195.5 236.1 217.4 32L6 232.9 260.1 297.5 373.3 449.0 504.0 553.4 560.6 650.4 76L8
5, 807.9
76.6 58.8 6L6 70.1 54.8 54.2 65.9 68.6 78.4 63.6 52.3 56.8
86.1 108.1 . 195.5 . 236.1 . 217.4 . 32L6 . 232.9 . 260.1 •. 297.5 . 373.3 449.0 . 504.0 . 553.4 . 560.6 . 650.4 . 76L8 .
5,807.9 .
76.6 58.8 . 6 L 6 . 70.1 . 54.8 . 54.2 . 65 9 68.6 . 78.4 . 63.6 . 52.3 . 56.8 .
Accrued dis
count
3,132.9 660.9 732.2 755. 3 797.0 885.9 720.8 730. 6 742.0 754.5 833.3 897.1 912.9 976.1
1, 086. 0 1,236. 6
15,854.1
i n . 6 94.5 89.6
100.0 70.2 84.7
133.6 105.5 122.2 109.8 94.1
120.8
Exchanges
OfE
A r a o u n t out
s tand ing bonds for ( interest-H bonds
20L3 188.3 218.6 19L3 206.3 188.1 212.5 216.1 195.6 183.7 209.5
2,211. 2
19.0 14.2 13.7 14.9. n . i 13.5 17.2 20.9 24.4 20.5 18.3 2L9
20L3 188.3 218.6 191.3 206.3 188.1 212.5 216.1 195.6 183.7 209.5
2,211.2
19.0 14.2 13.7 14.9 n . i 13.5 17.2 20.9 24.4 20.5 18.3 2L9
bearing)
37,186.4 37,897. 8 37,969. 0 38,067. 2 38, 040. 3 37,455. 7 37,816.6 38,260.1 39,166. 2 40,190.4 41,078.4 41,852.6 42,958. 6 43,805.4 44,204.9 44,166.7
44,166. 7
44,170.0 44,150. 8 44,134.1 44,162. 2 44,192.7 44,259.2 44,188.2 44,168.8 44,135.8 44,127.3 44,171.8 44,166.7
2,098.7 3,031.2 3,529. 6 4,075.0 4,675. 5 5,259.1 5,989.0 6,694.7 7,192. 5 7, 546.4 7,716.1 7,829.0 7,858.2 7,766.3 7, 506.1 7,114.2
7,114.2
7,463.0 7,432.1 7,396. 2 7, 353.6 7,319.4 7,290.1 7,259.5 7,229.7 7 189.2 7,157.3 7,134.9 7.114.2
Footnotes at end of table.
Digitized for FRASER http://fraser.stlouisfed.org/ Federal Reserve Bank of St. Louis

212 19 70 REPORT OF THE SECRETARY OF THE TREASURY
TABLE 39.—Sales and redemptions of Series E through K savings bonds hy series, fiscal years 1941-70 and monthly 1970 ^ 2—Continued
Fiscal year or m o n t h Sales Accrued discount
Sales plus
accrued discount
. Redempt ions
Tota l Original Accrued purchase discount
price
A m o u n t ou ts tanding
Interest bearing
Matured non
interest-bearing
Series F '
1941-55 1956 1957 ". 1958 1959 1960 1961 1962. . . . 1963.. 1964 1965 1966 1967 1968 1969 . 1970 . . . [ . ,
T o t a l through J u n e 30, 1970
1969—July Augus t September October
1970—January F e b r u a r y
Apr i l M a y .
1941-55. . . 1956 1957 . 1958 1959 . . 1960 1961. 1962 1963 1964 1965 1966 1967 1968... 1969 1970
To ta l through J u n e 30, 1970.....
1969 - Ju ly . . . . " A u g u s t September
N o v e m b e r
1970—January F e b r u a r y March A p r U . . . . M a y . J u n e
4,957. 6 (*)
(*) (*)
. . .4 ,957.7
23, 437. 9
. .23,437.9
826.9 87.7 67.5 47.1 35.7 27.8 15.4 10.6 5.0 L 4
(*)
1,125.1
5, 784.5 • 87.7 67.5 47.1 35.7 27.8 15.4 10.6 5.0 L 4
(*)
6, 082. 8
23,437. 9
23, 437. 9
2,800.0 665.3 709.3 487.9 285.2 483.5 212.3 177.9 167.4 67.3 8.6 3.4 2.7 2.1 L 3 L 4
6, 075. 5
. 1
. 1
. 1
. 2
. 1
. 1
. 1
. 1
. 2
. 1
. 2
. 1
2,464.8 502.3 544.8 377.6 215.3 370.3 157.9 132.5 124.3 49.9 6.4 2.6 2.0 L 6 LO LO
4,954. 2
. 1 (*)
(*) '
Series G
9,743. 5 2,300. 5 2, 719. 5 2, 506. 5 1, 668. 6 2, 055. 9
843. 9 805.4 496.6 196.8 3 L 5 16.0 10.4 6.9 6.1 4.8
23, 412. 8
. 3
. 5
. 5
.4
.2
. 4
. 5
. 3
. 6
.6
. 2
. 3
9,743. 5 . 2,300.5 . 2.719.5 . 2, 506. 5 . 1.668.6 . 2,055.9 .
843.9 . 805.4 . 496.6 . 196.8 . 3 L 5 16.0 . 10.4 6.9 6.1 4.8
23,412.8 .
. 3
. 5
. 5
. 4
. 2
. 4
. 5
. 3
. 6
.6
. 2
. 3
335.1 163.0 164.6 110.3 69.9
113.1 54.4 45.4 43.1 17.5 2.2
.9
.7
. 5
. 3
. 4
1,121.4
(*) . 1
(*) (*) (*) (*)
2,876.9 2,249.9 1,598.3 1,169.1
943.9 508.2 33L2 182.9
57.8
13, 583.3 11,238. 5 8, 506. 3 5.992.1 4,327.4 2.297.2 1,469.0
670.4 188.7
107.6 157.1 166.8 155.3 13L0 i n . i 9 L 2 72.1 34.9 26.8 18.1 14.7 12.0 10.0 8.7 7.3
7.3
8.5 8.5 8.4 8.2 8.1 8.0 7.9 7.8 7.7 7.6 7.4 7.3
m . i 155.4 168.0 175.7 m.8 146.2 130.5 123.7 108.8 100.7 69.2 53.2 42.8 35.9 29.9 25.1
25.1
9.96 22.1 28.6 28.2 28.0 27.6 27.1 26.8 26.2 25.6 25.3 25.1
Footnotes at end of table.
Digitized for FRASER http://fraser.stlouisfed.org/ Federal Reserve Bank of St. Louis

STATISTICAL APPENDIX 213
T A B L E 39.- -Sales and redemptions of Seizes E through K savings bonds hy series, fiscal years 1941-70 and monthly 1970^^—Continued
Fiscal year or m o n t h
1952-55 1956 1957.. 1958 1959 I960 . . . . 1961 1962 1963 1964 1965 1966 1967 . 1968 1969 1970
To ta l th rough J u n e 30, 1970 . . . .
1 9 6 9 - J u l y . . - -Augus t Septeraber Oc tobe r . . . N o v e m b e r Deceraber
1970—January F e b r u a r y March AprU M a y -J u n e
1952-55 1956 1957 1958 1959 1960 . . 1961 1962 1963 1964 1965 1966 1967 1968 1969 1970
To ta l through J u n e 30, 1970
1969_ju iy Augus t Septeraber October . . Noveraber Deceniber
Sales
696.8 183.2
92.4 (*) (*)
..........
972.4
2,004. 2 403.1 176.0
2, 583. 3
Accrued discount
10.0 n.9 15.9 18.1 17.8 18.2 16.7 16.8 16.6 16.3 14.9 12.1
7.8 3.9 LO
198.1
Sales plus
accrued = discount
706.8 195.2 108.3
18.1 17.8 18.2 16.7 16.8 16.6 16.3 14.9 12.1
7.8 3.9 LO
1,170. 5
2, 004. 2 403.1 176.0
(*) (*)
2, 583. 3
Redempt ions
To ta l
Series
33.7 59.6
106.5 98.4 5L2
144.2 39.1 37.2 33.2 46.2 87.6
124.4 136.0 95.0 55.4 9.7
1,157. 6
L 5 . 9
L l LO .6 . 5 .7 .6 . 8 .4 .7 .9
Original pm-cliase
price
; J
33.2 58.4
102.5 92.8 47.3
129.2 34.4 3L7 27.4 37.1 65.4 90.8 98.6 68.7 40.1
7.0
964.6
1.1 .6 . 8 .7 . 5 . 3 . 5 .4 .6 . 3 . 5 .6
Series K
57.2 79.5
238.2 257. 7 132.2 365.8 92.7 89.4 73.5
116.0 229.8 274.4 323.2 162.0 77.2 I L l
2, 579. 7
LO 2.2 3.2 2.0 . 5 .6
57.2 . 79.5 .
238. 2 . 257.7 . 132.2 . 365.8 .
92.7 . 89.4 . 73.5 .
116. 0 . 229. 8 . 274.4 . 323.2 . 162.0 . 77.2 . 11.1 .
2,579.7 .
LO . 2.2 . 3.2 . 2.0 .
. 5 .
.6 .
Accrued discount
0.5 1.3 3.9 5.6 3.9
15.0 4.8 5.5 5.9 9.1
22.2 33.6 37.4 26.3 15.4 . 2.7 .
193.1 .
.4 .
. 3 .
. 3 . ;3 .2 . . 1 . . 2 . . 2 . . 2 . . 1 . .2 . .2 .
A m o u n t ou ts tanding
Interest bearing
673.1 . 808.6 . 810.4 . 730.2 . 696. 9 . 570.8 . 548.4 . 527.9 . 51L3 . 48L4 . 403.8
" 287. 5 154.1 59.8
1,947. 0 2,270.6 2, 208. 5 1,950. 7 1,818.6 1,452.8 1,360.1 1,270.7 1,197.2 1,081.3
844.3 568.2 242.5
80.1
Matured non
interest-bearing
4.8 8.8
14.0 17.1 22.5 12.8
12.8
2 L 1 20.2 19.0 18.0 17.4 16.9 16. 2 15.6 14.8 14.4 13.7 12.8
7.2 8.8
11.4 11.7 14.7 3.6
3.6
13.7 11.5 8.3 6.4 5.9 5.2
Footnotes at end of table.
Digitized for FRASER http://fraser.stlouisfed.org/ Federal Reserve Bank of St. Louis

214 19 70 REPORT OF THE SECRETARY OF THE TREASURY
T A B L E 39.—Sales and redemptions of Series E through K savings bonds by series, fiscal years 1941-70 and rhonthly 1970^"^—Continued
Sales Accrued plus
Redemptions Amount outstanding
Fiscal year or nionth Sales discount accrued Total Original Accrued Interest Matmed discount purchase discount bearing non-
price interest-bearing
Series K—Continued
1970—January .4 February .4 March .3 April .3 May .1 June. . . .1
.4 .
.4 .
.3 .
.3 .
.1 .
.1 .
4.8 4.4 4.2 3.9 3.7 3.6
*Less than $50,000. 1 Sales and redemption figures include exchanges of rainor aniounts of raatured Series E for Series G and
K bonds frora May 1951 through April 1957, and Series F and J for Series H bonds beginning January 1960; they exclude exchanges of Series E for Series H bonds. Rederaption figures for fiscal 1953-54 and fiscal years 1960-63 also include the raaturing Series F and G savings bonds exchanged for raarketable Treasury securities during special exchange offerings. The araounts involved were $416.6 million in 1953, $.7 million in 1954, $745.4 raUlion in 1960, $147.3 miUion in 1961, $320.1 million in 1962, and $75.1 raiUion in 1963.
2 Sales of Series E, F, and J bonds are included at issue price, and their rederaptions and amounts outstanding at current redemption value. Series G, H, and K bonds are included at face value throughout.
3 Matured F, G, J, and K bonds outstanding are included in the interest-bearing debt until all bonds of the annual series have matured, and are then transferred to matured debt on which interest has ceased.
NOTE.—Series E and H are the only savings bonds now being sold. Series A-D, sold frora Mar. 1, 1935 through Apr. 30, 1941, have all matured and are no longer reflected in these tables. Series F and G were sold from May 1, 1941, through Apr. 30, 1952. Series J and K were sold from May 1, 1952, through Apr. 30, 1957. Sales figures for Series F, G, J, and K after fiscal 1957, represent adjustraents. Details by raonths for Series E, F, and G bonds from May 1941 wiUbe found on p. 608 of the 1943 annual report, and in corresponding tables in subsequent reports. Monthly detail for Series H, J, and K bonds wiU be found in the 1952 annual report, pp. 629 and 630, and in corresponding tables in subsequent reports.
Digitized for FRASER http://fraser.stlouisfed.org/ Federal Reserve Bank of St. Louis

T A B L E 40.—Sales and redemptions of Series E and H savings bonds by denominations, fiscal years 1941-70 and monthly 1970 ^ [In thousands of pieces. Es t ima ted on basis of daUy Treasu ry s ta te raents and reports frora Bureau of the P u b h c Deb t ]
Fiscal year or m o n t h To ta l , aU denomi
nat ions 2 $25 $50 3 $75 $100 4 $200 $500 $1, 000 $5, 000 8 6 $10, 000
Sales '
1941-55 1,696,608 1,155,275 1956 90,053 56,719 1957 - 90,160 56,327 1958... - 89,431 54,908 1959 85,882 52,895 1960 85,607 52,972 1961.- 86,495 53,453 1962.-: "..-- - ----- 86,479 53,010 1963 - . 89,627 54,629 1964 96,609 59,230 1965 - 99,560 60,928 1966 103,500 63,430 1967 114,433 71,506 1968. 117,279 75,925 1969 118,184 78,508 1970.--1 -. 117,026 78,043 1969—July...... 10,679 7,389
August.... 8,851 5,844 Septeniber 8,415 5,566 October 11,488 8,002 N o v e m b e r . 7,325 4,900 December 9,401 6,237
1970—January 9,807 6,738 F e b r u a r y . . 9,321 6,104 March . 11,121 7,319 A p r i L . . 9,718 6,562 May 9,189 5,890 J u n e . . . . 11,712 7,492
1 9 4 1 - 5 5 . . . . - . . . . . . . . - - - - - . - - - - - - - . . - - - . - - . - . - - - - . - 1,229,060 892,320 1956 89,953 60,014 1957 93,175 60,612 1958 93,452 59,880 1959 -•-. . . 88,647 56,036 I 9 6 0 . . . . . 90,748 56,796 1961 85,077 54,280 1962 83,804 52,958
F o o t n o t e s a t e n d of t a b l e .
267,768 189,789 8,798 26,230 27,519 106 18,784 10,090 929 1,608 1,854 48 20,256 9,969 851 1,320 1,396 29 21,043 9,824 893 1,304 1,413 33 20,108 9,477 798 1,212 1,340 35 20,220 9,208 774 1,165 1,230 27 20,434 9,273 789 1,201 1,299 31 20,901 9,286 813 1,186 1,237 30 ' 21,903 9,623 928 1,233 1,270 25 23.442 135 10,324 1,006 1,220 1,214 22 23,947 1,141 10,409 982 1,087 1,033 18 24,704 1,469 10,714 1,010 1,101 1,042 17 26,476 1,749 11,411 1,068 1,131 1,064 15 25,823 1,860 10,769 987 987 906 11 25,106 1,822 10,192 869 871 796 8 24,675 1,682 10,072 878 868 796 7
2,116 136 832 70 70 65 1 1,892 133 778 65 70 68 1 1,843 118 717 62 56 51 (*) 2,259 153 876 71 66 59 1 1,543 101 632 52 51 45 (*) 2,043 138 804 66 60 51 (*) 1,919 134 785 73 77 79 1 1,982 138 841 75 91 89 1 2,372 166 1,008 89 88 78 1 1,975 146 821 73 73 68 1 2,040 141 882 84 80 71 1 2,691 177 1,095 98 86 71 1
Redempt ions
182,015 . - - - 1 - - - ; - - . 109,032 3,061 12.605 11,839 4 16,503 9,925 537 1,255 1,281 5 18,165 10,590 633 1,354 1,485 9 19,467 10,433 639 1,320 1,464 11 18,598 10,394 675 1,301 1,451 9 1 9 , 5 0 7 . : 10,634 725 1,351 1,567 15 18,654 9,197 616 1,076 1,139 10 18,746 9,150 653 1,077 1,126 10
48 21 12 14 16 11 15 16 16 16 14 13 14 12 11 6
ZP
> y ^ h-i ZP
h-i a >
>
h-l
to
Digitized for FRASER http://fraser.stlouisfed.org/ Federal Reserve Bank of St. Louis

TABLE 40.—Sales and redemptions of Series E and H savings bonds by denominations, fiscal years 1941-70 and monthly 1970^—Cont.
[In thousands of pieces. Estimated on basis of daUy Treasm-y statements and reports frora Bureau of the Public Debt]
Fiscal year or month Total, all
denominations 2
$25 $50 3 $75 $100 4 $200 $500 $1, 000 $5,000 56$10,00-
1963 83,469 1964..... 87,242 1965.... 90,012 1966 94,720 1967 98,349 1968 -•- 105,057 1969 114,396 1970 118,696 1969—July 11,210
August 9,890 September 9,867 October.. 10,034 Noveraber 7,693 Decembei- 9,176
1970—January 10,293 February 9,981
. March 11,585 AprU 9,669 May 8,415 June 10,884
53,018 55, 264 56,736 59,235 61,960 66, 953 73,560 76,446
7,176 6,411 6,360 6,467 5,066 6,151 6,400 6,288 7,468 6,178 5,434 7,045
19,022 . . 20, 034 20, 744 21, 948 22,627 23,604 25,308 25, 789
2,459 2,152 2,181 2,177 1,618 1,897 2,271 2,257 2,515 2,117 1,806 2,339
(*) 245 585 837
1,032 1,205 1,303
123 105 107 108 84 98
106 111 128 108 98
127
8,715 9,080 9,322 9,822 9, 839
10, 276 10, 955 11,410
1,093 931 929 963 694 788
1,117 988
1,107 950 807 '
1,043
601 648 694 756 760 808 864 933
89 73 73 78 55 62 97 83 89 78 69 87
1,005 1,051 1,070 1,113 1,084 1,107 1,165 1,297
125 101 102 111 82 83
135 114 126
no 93 115
1,028 1,088 1,122 1,182 1,169 1,208 1,266 1,438
137
no 109 123 87 92
160 131 143 120 103 123
12 15 19 22 24 24 28 33 3 3 3 3 2 2 3 3 4 3 2 2
5 7 9
10 12 13 14 18 2 1 1 2 1 1 2 2 2 2 1 I
o S3
o • ^
W
ZP
Q S3
>
O
M
Si
> ZP
d y<
*Less than 500 pieces. » Sales of Series H began on June 1, 1952, the. denominations authorized were: $500,
$1,000, $5,000, and $10,000. 2 Totals include $10 denoraination Series E bonds sold to Armed Forces only from
June 1944—March 1950. Details by years will be found in the 1952 annual report, pp. 631, 633; thereafter, monthly detail for each fiscal year appears in a footnote to the redemptions by denorainations table of successive annual reports. Details in thousands of pieces by raonths in fiscal year 1970 follow:
3 Sales of $75 denomination Series E bonds began in May 1964. 4 Sales of $200 denomination Series E bonds began in October 1945. 5 Sales of $10,000 denomination Series E bonds were authorized on May 1, 1952. 8 Includes sales of $100,000 denomination Series E bonds which are purchasable only
by trustees of employees' savings plans beginning April 1954, and personal trust accounts beginning January 1955.
7 See table 39, footnote 1.
Fiscal year
1970
>> H-S
3
1 3
CQ
2
o O
2
> o
2
6 P
2
i l - s
3 3
c3
3
a <
3
^ ^
2
H i
3
"3 "o EH
30
Digitized for FRASER http://fraser.stlouisfed.org/ Federal Reserve Bank of St. Louis

STATISTICAL APPENDIX 217
T A B L E 41.—Sales and redemptions of U.S. savings notes, fiscal years 1967-70 and monthly 1970
[In miUions of dollars]
Fiscal year or month Sales
L5 200.8 326.2 322. 7
851.1
30.4 27.5 30.0 34.2 23.5 3L0 26.8 3L1 31.6 18.8 18.3 19.6
Accrued discount
o.'s" 1L4 24.6
36.3
L6 1.7 L8 L8 L9 2.0 2.2 2.2 2.3 2.3 2.5 2.5
Sales plus accrued -discount
L5 20L1 337.6 347.3
887.5
32.0 29.2 3L8 35.9 25.4 33.0 28.9 33.3 33.9 2L0 20.8 22.1
Redemptions
Total Sales Accrued price discount
(*) 0.1
35.2 110.6
145.9
6.9 5.6 8.7 8.1 8.4
10.1 8.7
10.0 11.9 12.4 8.7
I L l
(*) 0.1
33.7 104.9
138.7
6.6 5.3 8.3 7.7 8.0 9.6 8.3 9.5
n.o n . 8 8.3
10.5
(*) L4 5.7
7.2
.3
.3
.4
.4
.4
.5
.4
.5
.8
.6
.4
.6
Amount out
standing
L6 202.5 504.9 741.6
741.6
529.9 553.5 576.6 604.6 621. 4 644.3 664.5 687.8 709.9 718.5 730.6 741.6
1967 1968 1969 1970......
Total through June 30, 1970
1969—July. August September October November December
1970—January February March April May June
•Less than $50,000.
NOTE.—Sales of U.S. savings notes began May 1,1967. For details on terms and conditions, see 1967 annual report, pp. 187-190.
Digitized for FRASER http://fraser.stlouisfed.org/ Federal Reserve Bank of St. Louis
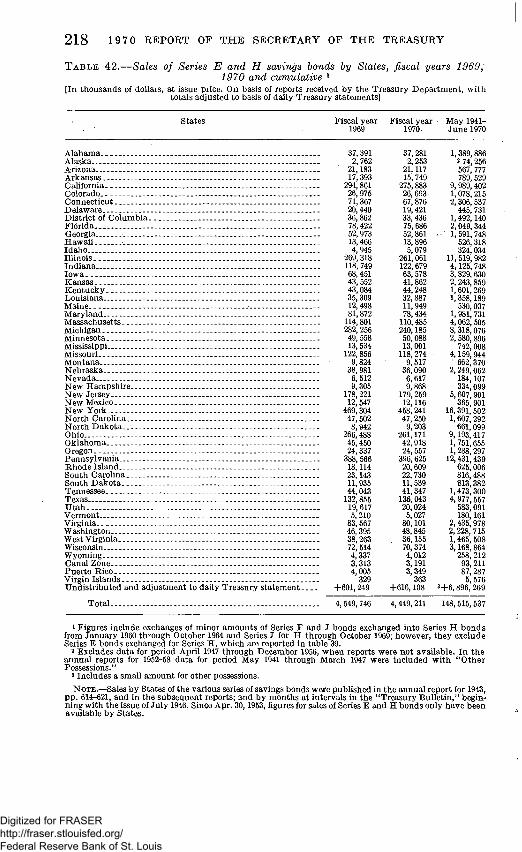
218 19 70 REPORT OF THE SECRETARY OF THE TREASURY
States, fiscal years 1969, T A B L E 42.—Sales of Series E and H savings bonds 1970 and cumulative
[In thousands of doUars, at issue price. On basis of reports received by the Treasury Department, with totals adjusted to basis of dailyTreasury statements]
States Fiscal year 1969
37,391 2,762
21,183 17,393 294,861 26, 975 71, 367 20,440 36,862 78,422 52, 973 13,466 4,945
269,318 118, 749 68,451 43,552 43,084 35,309 12,498 81,872 114,801 282,256 49, 558 13, 534 122,856 9,824
38, 981 6,512 9,305
178,221 12, 547
469,304 47,502 8,942
266,488 45,450 24,337 388, 566 18,114 23,143 11, 935 44,043 132,855 19, 617 5,210 83, 567 46,395 38, 263 72, 514 4,337 3,313 4,005 329
-1-601,249
4, 549, 746
Fiscal year 1970-
37,281 2,253 21,117 15, 749 275,883 26,693 67,876 19,421 33,436 75, 686 52,861 13,896 5,079
261,061 122,679 63,578 41,862 44,248 32, 887 11,949 78,434 no, 485 240,185 50,088 13,001 118,274 9, 517
36,090 6,617 9,868
179,259 12,116 458,241 47,250 9,203
261,171 42, 918 24, 557 396, 625 20, 609 22,730 11,539 41,347 136,043 20,024 5,027 80,101 48,845 36,155 70,374 4,012 3,191 3,349 363
-f 616,108
4,449,211
May 1941-June 1970
1,389,886 2 74,256 567, 777 789, 529
9, 989,402 1, 078, 215 2,306,537 445, 731
1,492,140 2,049,344
'• 1,591,748 526,318 324,034
11, 519, 982 4,125, 748 3,829, 630 2,243,859 1, 601,269 1,358,189 530,037
• 1,981,731 4,062,505 8,318,076 2,580, 896 742,008
4,159,944 • 662, 370 2,249, 062 184,107 334,099
5,607, 901 365, 901
16,391, 502 1,607,292 661,099
9,193,417 1,751,655 1,288, 297 12,431,439
625,006 816,488 813, 382
1,473,300 4,977,557 583,091 180,161
2,435,978 2,228,715 1,465, 508 3,168, 864 258, 212 93, 211 87,287 5,576
3-1-6,896,269
148,515, 537
Alabama Alaska Arizona Arkansas California— Colorado Connecticut Delaware District of Colurabia Florida Georgia Hawaii. Idaho IlUnois Indiana.. Iowa Kansas Kentucky Louisiana Maine . Maryland Massachusetts Michigan Minnesota Mississippi Missouri Montana Nebraska Nevada New Hampshire New Jersey. New Mexico New York North Carohna North Dakota Ohio Oklahoma. Oregon Pennsylvania . Rhode Island South Carolina South Dakota Tennessee Texas Utah --Vermont -.. Virginia Washington WestVirginia Wisconsin Wyoming Canal Zone -Puerto Rico - - . Virgin Islands Undistributed and adjustraent to daily Treasury stateraent.
Total
1 Figures include exchanges of minor aniounts of Series F and J bonds exchanged into Series H bonds frora January 1960 through October 1964 and Series J for H through October 1969; however, they exclude Series E bonds exchanged for Series H, which are reported in table 39.
2 Excludes data for period April 1947 through Deceniber 1956, when reports were not available. In the annual reports for 1952-58 data for period May 1941 through March 1947 were included with "Other Possessions."
3 Includes a sraall araount for other possessions.
NOTE.—Sales by States of the various series of savings bonds were published in the annual report for 1943, pp. 614-621, and in the subsequent reports; and by months at intervals in the "Treasury BuUetin," beginning with the issue of July 1946. Since Apr. 30,1953, figures for sales of Series E and H bonds oiUy have been available by States.
Digitized for FRASER http://fraser.stlouisfed.org/ Federal Reserve Bank of St. Louis
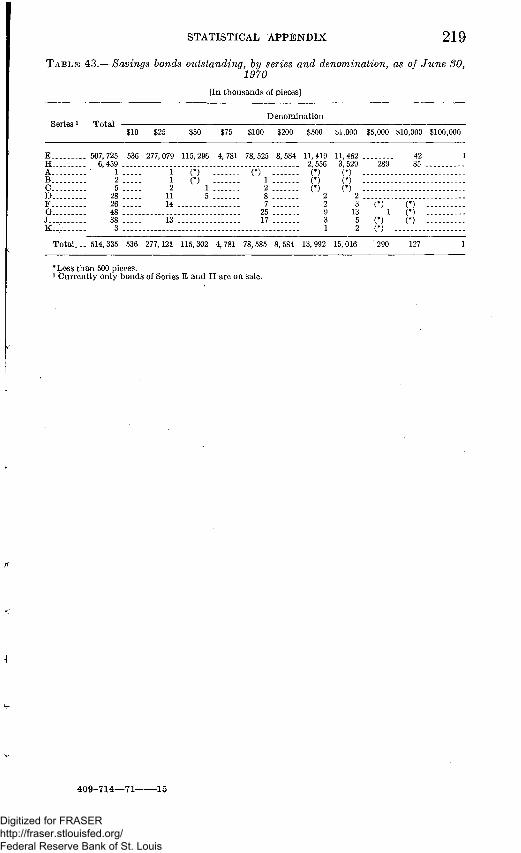
STATISTICAL APPENDIX 2 1 9
T A B L E 43.—Savings bonds outstanding, by series and denomination, as of June 30,
1970
[In thousands of pieces]
Series i
E I-I . A B . . . . C D F G . . J K
T o t a l . .
To ta l -
. 507,725
. 6,459 1 2 5
28 26 48 38
3
. 514,335
$10
536
536
$25
277, 079
1 1 2
11 14 ---
277,121
$50
115, 296
(*)
5
115, 302
$75
4,781
4,781
Denoni ina t ion
$100
78, 525
(*) 1 2 8 7
25 17
78, 585
$200
8,584
8,584
$500
11,419 2,556 (*) (*) ' \
2 9 3 1
13, 992
$1,000
11, 462 3, 529 (*) (*) (*)
2 3
13 5 2
15, 016
$5,000
""289"
1 (*) (*) 290
$10,000
42 85
(*) (*)
127
$100,000
1
1
*Less than 500 pieces. I Currently only bonds of Series E and H are on sale.
409-714—71 15
Digitized for FRASER http://fraser.stlouisfed.org/ Federal Reserve Bank of St. Louis

220 19 70 REPORT OF THE SECRETARY OF THE TREASURY
IV.—Interest
T A B L E 44.—Amount of interest-bearing public debt outstanding, the computed annual interest charge, and the computed rate of interest, J u n e SO, 1989-70, and at the end of each month during 1970
[On basis of daUy Treasury statements, see "Bases of Tables"]
End of fiscal year or month Interest-bearing
debtl Computed Computed
annual interest rate of charge 2 interest'
1939 $39, 1940 42, 1941 48, 1942 71, 1943 135, 1944 199, 1945 256, 1946 268, 1947.. 255, 1948 250, 1949 250, 1950 255, 1951.- 252, 1952 256, 1953 263, 1954 268, 1956 271, 1956.- 269, 1957 268, 1958.. 274, 1969 281, 1960 283, 1961 285, 1962 294, 1963 301, 1964 307, 1965 313, 1966 315, 1967 322, 1968 - 344, 1969 351,
Footnotes a t end of table.
886,969,732.00 376,495,928.00 387,399,539.00 968,418,098.00 380,305,795.00 643,355,301.00 366, 616,818. 00 110,872,218.00 113,412,039.00 063,348,379.00 761,636,723.00 209,353,372.00 851,766,497.00 862,861,128.00 946,017,740.00 909,766,664.00 741,267, 507.00 883,068,041.00 485,662,677.00 697,660,009.00 833,362,429.00 241,182,755.00 671,608, 619.00 442,000,790.00 953,730,701.00 356,561,635.00 112,816,994.00 431,054,919.00 285,952,387.89 400,507,282.32 729,446,327.01
$1,036,937,397. 00 1,094,619,914.00 1,218,238,846.00 1,644,476,360.00 2,678,779,036.00 3,849,254,656.00 4,963,730,414.00 5,350,772,231.00 5,374,409,074.00 5,455,476,79L0U 5, 606,929,714.00 6, 612,676,516.00 5,739,615,990.00 6,981,357,116.00 6,430,991,316.00 6,298,069,299.00 6,387,225,600.00 6,949,699,626.00 7,326,146,696.00 7,245,154,946.00 8,065,917,424.00 9,316,066,872.00 8.761,495,974.00 9,618,857,333.00
10,119,294,647.00 10,900,360,741.00 11,466,618,472.00 12,516,397, 677.00 12,952,924,175.84 15,403,812.018.91 17, 086, 631, 003.48
Percent 2.600 2.583 2.618 2.286 1.979 L929 L936 1.996 2.107 2.182 2.236 2.200 2.270 2.329 2.438 2.342 2.351 2.676 2.730 2.638 2.867 3.297 3.072 3.239 3.360 3.660 3.678 3.988 4.039 4.499 4.891
Digitized for FRASER http://fraser.stlouisfed.org/ Federal Reserve Bank of St. Louis

STATISTICAL APPENDIX 221
TABLE 44.—Amount of interest-hearing public debt outstanding, the computed annual interest charge, and the computed rate of interest, June 30, 1939-70, and at the end of each month during 1970—Continued
Interest-bearing debt 1
• Computed annual interest
charge 2
Computed rate of
interest 2
• Percent 1970 369,025,522,033.47 20,338,884,039.66 5.567 1969—July. . . : . . . . 355,122,266,597.28 17,542,875,308.63 4.977
• August 358,328,655,809.68- 17,892,783,83L 45 5.031 • September 358,818,229,135.85 18,100,482,695.76 6.084 •• October . . . . : 362,420,072,057.69 18,848,169,565.50 6.246 ; November 366,262,722,523.61 19,232,955,278.62 5.298
December.. 366,221,365,317.80 19,539,481,870.03 5.384 1970—January . . . . : 365,619,701,540.78 19,656,806,005.15 5.426
. February. 366,858,331,974.81 20,073,184,30L 95 5.622 March 369,963,026,128.63 20,175,164,040.71 5.503
. AprU 365,099,022,479.00 19,666,756,426.40 5.434 , May 369,143,871,363.06 20,256,697,597.71 5.536 . June - 369,025,522,033.47 20,338,884,039.56 5.667
> Includes face amount of securities, except that current redemption value is used for savings bonds of Series C-F and J, U.S. savings notes, and retirement plan bonds. The face value of matured savings bonds and savings notes outstanding Is included untU aU of the annual series have matured, when the enthe amount is transferred to matured debt on which interest has ceased.
2 Comparable annual data 1916-38 are contained in 1962 annual report, p. 735. Current monthly figures are published in the Treasury Bulletin. Comparable monthly data 1929-36 appear in 1936 annual report, p. 442, and from 1937 in later reports. Annual interest charge monthly 1916-29 appears in 1929 annual report, p. 509.
NOTE.—The computed annual interest charge represents the ampunt of interest that would be paid if each interest-bearing issue outstanding at the end of the month or year should remain outstanding for a year at the apphcable annual rate of interest. The charge is computed for each issue by applying the appropriate annual interest rate to the amount outstanding on that date.
Beginning Dec. 31,1968, the coraputed average rate is based upon the rate of effective yield for issues sold at premiums or discounts. Before that date the computed average rate was based upon the coupon rates of the securities. That rate did not materiaUy differ from the rate on the basis of effective yield. The "eflective yield" method of computing the average interest rate on the public debt more accurately reflects the interest cost to the Treasury, and is believed to be in accord with the intent of Congress where legislation has required the use of the rate of effective yield for various purposes. •
Digitized for FRASER http://fraser.stlouisfed.org/ Federal Reserve Bank of St. Louis

TABLE 45.—Computed annual interest rate and computed annual interest charge on the puhlic debt by classes, June 30, 1960-70
[Dollar amounts in mUlions. On basis of daUy Treasury statements, see "Bases of Tables"]
to
Marketable issues Nonmarketable issues
End of fiscal year or month Tota l -
p u b h c deb t
2. 200 2.270 2. 329 2. 438 2. 342 2.351 2 576 2. 730 2.638 2 867 3. 297 3. 072 3.239 3 360 3. 560 3 678 3 988 4. 039 4. 499 4. 891 5. 557 4. 977 5. 031 5. 084 5. 246 5.298 5. 384 5.426 5. 522 5. 503 5.434 5. 536 5.557
T o t a l 1
L958 L981 2.051 2.207 2.043 2.079 2.427 2.707 2.546 2.891 3.449 3.063 3.285 3.425 3.659 3.800 4.134 4.165 4.757 5.232 5.986 5.336 5.407 5.482 5.715 5.782 5.849 5.905 6.037 5.996 5.897 6.032 5.986
BUls 2
1.187 L569 1.711 2.254
.843 L539 2.654 3.197 L033 3.316 3.815 2.584 2.926 3.081 3.729 4.064 4.845 4.360 5.711 6.508 7.340 6.786 6.903 7.143 7.334 7.475 7.676 7.830 7.862 7.670 7.451 7. 416 . 7. 340 .
Certificates
L163 L875 L875 2.319 L928 L173 2.625 3.345 3.330 2.842 4.721 3.073 3.377 3.283
4.851 5.250
Notes
C o m p u t e d
L344 L399 L560 1.754 1.838 L846 2.075 2.504 2.806 3.304 4.058 3.704 3.680 3.921 3.854 3.842 4.321 4.764 5.294 5.668 6.420 5.668 5.734 5.734 5.916 5.916 5.916 5.916 6.061 6.061 6.065 6.421 6. 420
Treasu ry bonds
annua l in te
2.322 2.327 2.317 2.342 2.440 2.480 2.485 2.482 2.576 2.619 2.639 2.829 3.122 3.344 3.471 3.642 3.655 3.686 3.681 3.722 3.762 3.722 3.722 3. 723 3. 726 3.726 3.738 3.739 3.754 3.761 3.761 3.761 3.762
T o t a l
-est rate
2.569 2.623 2.659 2.720 2.751 2.789 2.824 2.853 2.892 2.925 3.219 3.330 3.364 3.412 3.462 3.493 3.713 3.751 3.876 3.979 4.327 3.987 3. 987 3.990 4.014 4.024 4.237 4.255 4.273 4.286 4.275 4.278 4.327
Savings bonds 3
2.748 2.742 2.745 2.760 2.793 2.821 2.848 . 2.880 . 2.925 . 2.961 . 3.293 . 3.408 . 3.449 . 3.482 . 3.517 . 3.537 . 3.744 . 3.780 3.816 3.884 4.187 3.885 3.886 3.888 3.890 3.917 4.164 4.165 4.167 4.173 4.180 4.183 4.187
Tax and savings notes 3
L383 L567 L785 2.231 2.377 2.359
4.740 4.740 4.905 4.948 4.912 4.918 4.923 4.928 4.931 4.935 4.938 4.941 4.944 4.945 4.947 4.948
Othe r
2.407 2.717 2.714 2.708 2.709 2.708 2.713 2.718 2.718 2.714 2.715 2.713 2.670 2.770 2.917 3.105 3.380 3.398 4.340 4.648 5.160 4.708 4.701 4.705 4.821 4.737 4.698 4.842 4.950 4.981 4.872 4.883 5.160
Special issues
2.589 2.606 2.675 2.746 2.671 2.585 2.705 2.636 2.630 2.694 2.772 2.803 2.891 3.003 3.238 3.372 3.693 3.854 4.133 4.555 5. 235 4.628 4.670 4. 699 4.720 4.745 4.818 4.823 4.896 4.906 4. 905 4. 972 5.235
O
o
ZP
o
o
y ^
w a y ^
> ZP
d
1950 1951 1952 1953 1954.. 1956 1956 1957 1968 1959 1960 1961 1962 1963 1964 1965 1966 1967 1968 1969 1970 1969—July
August September October... November December.
1970—January... February. March April May June
Digitized for FRASER http://fraser.stlouisfed.org/ Federal Reserve Bank of St. Louis

Computed annual interest charge
1950 1951 1952 1953 1954... 1955 1956 1957 1958 1959 1960 1961 1962 1963 1964 1965 1966 1967 1968 1969 1970 1969—July
August September. October Noveraber. December.
1970—January... February. March AprU May June
$5,613 6,740 5,981 6.431 6,298 6,387 6,950 7,325 7,245 8,066 9,316 8,761 9,519 10,119 10,900 11,467 12,516 12,953 15,404 17,087 20, 339 17, 543 17, 893 18,100 18, 848 19, 233 19, 539 19, 657 20, 073 20 175 19, 666 20, 257 20, 339
$3,040 2,731 2,879 3,249 3,071 3,225 3,758 4,210 4,242 6,133 6,317 6,718 6,422 6,944 7,613 7,878 8,580 8,709 10, 684 11,703 13,743 12,109 12, 358 12, 520 13, 255 13, 569 13, 604 13, 757 14,042 14, 081 13, 609 14,076 13, 743
$160 213 293 442 164 299 649 743 231
1,046 1,249 937
1,212 1,433 1,855 — 2,135 ... 2,595 2,490 3,573 —. 4,302 ... 5, 380 -. 4, 709 -.. 4,932 .. 5 095 5,577 5 893 5,946 6,101 6,130 .. 6,178 5,709 .-5,711 ---5,380 ...
$214 178 533 368 355 162 428 685
1,096 962 833 410 467 728
80 295
$274 501 296 534 588 752 746 776 673 902
2,088 2,084 2,408 2,043 2,591 2,017 2,186 2,339 3,764 4,473 5,998 4,473 4,500 4,500 5,051 5,051 5,050 5,050 5,534 5,535 5,533 5,999 5,998
$2,387 1,835 1,753 1,903 1,962 2,010 2,034 2,005 2,341 2,221 2,145 2,288 2,344 2,740 3,067 3,727 3,718 3,585 3,347 2,928 2,364 2, 927 2,926 2,925 2,627 2,626 2,608 2,606 2,378 2,369 2,367 2,366 2,364
$1, 735 2,106 2.093 2,069 2.099 2,044 1,972 1,881 1,787 1,728 1,754 1,781 1,798 1,830 1,878 1,948 2,049 2,080 2,259 2,341 2,601 2,343 2,341 2,343 2,381 2,377 2,515 2,518 2,541 2,559 2,537 2,535 2,601
$1,581 1,579 1,583 1,598 1,622 1,647 1,637 .. 1,573 -1,520 — 1,496 „ 1,566 — 1,619 „ 1,642 . 1,682 -1,734 . 1,770 „ 1,892 „ 1,936 1,973 2,009 2,147 2,006 2,005 2,004 2,004 2,018 2,147 2,143 2,142 2,142 2,144 2,146 2,147
$117 123 118 99 121 45
(*) 10 25 37 26 27 28 30 31 32 33 34 35 36 36 37
$37 405 391 372 357 352 334 308 266 232 189 162 156 148 144 178 157 144 276 308 417 311 309 311 348 328 336 342 365 382 358 353 417
$838 903
1,010 1,115 1,128 1,118 1,220 1,234 1,216 1,206 1,245 1,263 1,299 1,345 1,509 1,641 1,888 2,164 2.460 3,042 3, 995 3,090 3,194 3,238 3,"212 3, 287 3,421 3,382 3,490 3,536 3,520 3,645 3,995
ZP H > »rl
S h-l
>
^
s W V, n X
*Less than $600,000. » Total includes Panama Canal bonds prior to 1961, and posta] savings bonds prior
to 1956. 2 Included in debt outs tanding a t face amount, bu t the annua l interest
charge and the annua l interest r a t e are computed on the discount value. 3 The annual interest charge and annual interest ra te on United States
savings bonds amd United Sta;tes savings notes are computed on the basis of the ra te to matur i ty applied against the amount outstanding.
NOTE.—For methods of computing annual interest rate and charge see note to table 44. See table 26 for amounts of public debt outstanding by classification. For figures for 1939-49 see 1966 annual report, pages 770-1.
to CO
Digitized for FRASER http://fraser.stlouisfed.org/ Federal Reserve Bank of St. Louis

224 1969 REPORT OF THE SECRETARY OF THE TREASURY
TABLE 46.—Interest on the public debt by classes, fiscal years 1966-70 [In miUions of doUars, on an accrual basis. On basis of Public Debt accounts]
Class of securities
Public issues: Marketable:
Treasury bills » Certificates of indebtedness Treasury notes Treasury bonds '
Total marketable issues
Nonmarketable: Depositary bonds Foreign currency series:
Certificates of indebtedness Treasury notes _ . . Treasury bonds.-
Foreign series: Certificates of indebtedness Treasury notes... Treasury bonds
Treasmy bonds, investment series Treasmy bonds, REAseries U.S. savings bonds:
Series E, F, and J i . . Series G, H, and K
U.S. savings notes * U.S. retirement planbonds Treasury certificates Treasury bonds Other . . .
Total nonmarketable issues
Total public issues
Special issues: Certificates of indebtedness Treasury notes Treasury bonds
Total special issues
Total interest on public debt
Other 2
Total interest and charges
1966
2 469.8 35.7
2,015.9 3,783.3
8,304.7
.9
6.9
39.6
22.4 10.5 7.8
8L5 5
. . 1 553.0 323.9
.5 3.4 .3
2,05L1
10,355.8
367.3 62.1
1,225.7
1,655.2
12, on. 0
2.9
12,013.9
1967 .
3,105. 3 293.1
2,199. 3 3, 656. 6
9,254.3
.9
24.7 10.0 7.6 .
9.2 6.5
10.9 72.8
.5
1, 641. 4 322.7
.7 2.4
(*) -
2, no. 3
11,364. 6
55L8 338.5
1,133.8
2,024.1
13,388.7
2.3
13,391.0
1968 1969
3,360.9 4,196.4 37.4
3,08L0 4,190.9 3,512.3 3,160.0
9,991.7 11,537.3
.8 .6
10. 9 21. 5 54.4 97. 7
47.2 20.3 5.3
70.2 .5
1,728.1 330.4
.3
.9 L2
2,270. 6
27.6 79.9 4.0
68.3 .4
1, 783.6 326.4 1L3 L l .4
L3
2,424. 0
12,262.3 13,961.2
631.6 761.0 584.1 829.4
1,094.1 1,036.6
2,309.8 2,627.0
14, 572.1 16,588. 2
1.0.
14,573.0 16,588.2
1970
5 662.8
5 113.5 2, 626. 2
13, 302. 5
.6
15.6 98.9
45.2 99.2 2.7
66.7 .4
1,844. 7 319.0 24.3 L4
20.4
2.6
2,641. 6
15, 844. 2
1,067. 6 1,428.2
963.8
3,459. 6
19,303.7
19,303. 7
•Less than $50,000. 1 Amounts represent discount treated as interest. 2 Charges for gold and foreign cmrency pmchases authorized by act of June 19,1962 (22 U.S.C. 286e-2(c))
and act of Oct. 23,1962 (76 Stat. 1168).
Digitized for FRASER http://fraser.stlouisfed.org/ Federal Reserve Bank of St. Louis

v.—Prices and yields of securities
TABLE 47.—Average yields of taxahle ^ long term Treasury honds hy months, Octoher 1941-June 1970 [Averages of daily figures. Percent per annum compounded semiannuaUy]
Year Jan. •^Feb. Mar. A p r . May June July Aug. Sept. Oct. Nov. Dec. Average
1941.. 1942.. 1943.. 1944.. 1946..
1946.. 1947.. 1948.. 1949.. 1950..
1951.. 1952.. 1953.. 1954.. 1965..
1956.. 1957.. 1958-1959.. I960..
1961. 1962. 1963.. 1964. 1965..
1966.. 1967. 1968. 1969.. 1970..
2.48 2.46 2.49 2.44
2.21 2.21 2.45 2.42 2.20
2.39 •2.74 2.80 2.69 2.68
2.88 3.34 3.24 3.91 4.37
3.89 4.08 3.89 4.15 4.14
4.43 4.40 6.18 6.74 6.86
2.48 2.46 2.49 2.38
2.12 2.21 2.45 2.39 2.24
2.40 2.71 2.83 2.62 2.78
2.85 3.22 3.28 3.92 4.22
3.81 4.09 3.92 4.14 4.16
4.61 4.47 5.16 5.86 6.44
2.46 2.48 2.48 2.40
2.09 2.19 2.44 2.38 2.27
2.47 2.70 2.89 2.63 2.78
2.93 3.26 3.25 3.92 4.08
3.78 4.01 3.93 4.18 4.15
4.63 4.45 5.39 6.05 6.39
2.44 2.48 2.48 2.39
2.08 2.19 2.44 2.38 2.30
2.56 8 2.64 «2.97
2.48 2.82
3.07 3.32 3.12 4.01 4.18
3.80 3.89 3.97 4.20 4.15
4.56 4.51 5.28 5.84 6.53
2.45 2.46 2.49 2.39
2.19 2.19 2.42 2.38 2.31
2.63 2.57 3.11 2.54 2.81
2.97 3.40 3.14 4.08 4,16
3.73 3.88 3.97 4.16 4.14
4.57 4.76 5.40 5.85 6.94
2.43 2.45 2.49 2.35
2.16 2.22 2.41 2.38 2.33
2.65 2.61 3.13 2.55 2.82
2.93 3.58 3.20 4.09 3.98
3.88 3.90 4.00 4.13 4.14
4.63 4.86 5.23 6.05 6.99 .
2.46 2.45 2.49 2.34
2.18 2.25 2.44 2.27 2.34
2.63 2.61 3.02 2.47 2.91
3.00 3.60 3.36 4.11 3.86
3.90 4.02 4.01 4.13 4.15
4.75 4.86 5.09 6.07
2.47 2.46 2.48 2.36
2.23 2.24 2.46 2.24 2.33
2.57 2.70 3.02 2.48 2.95
3.17 3.63 3.60 4.10 3.79
4.00 3.98 3.99 4.14 4.19
4.80 4.95 5.04 6.02
2.46 2.48 2.47 2.37
2.28 2.24 2.46 2.22 2.36
2.56 2.71 2.98 2.52 2.92
3.21 3.66 3.75 4.26 3.84
4.02 3.94 4.04 4.16 4.25
4.79 4.99 5.09 6.32
3 2.34 2.45 2.48 2.48 2.36
2.26 2.27 2.45 2.22 2.38
2.61 2.74 2.83 2.54 2.87
3.20 3.73 3.76 4.11 3.91
3.98 3.89 4.07 4.16 4.28
4.70 6.19 6.24 6.27
2.34 2.47 2.48 2.48 2.33
2.25 2.36 2.44 2.20 2.38
2.66 2.71 2.86 2.57 2.89
3.30 3.57 3.70 4.12 3.93
3.98 3.87 4.11 4.12 4.34
4.74 6.44 5.36 6.62
2.47 . . 2.49 2.49 2.48 2.33
2.24 2.39 2.44 2.19 2.39
2.70 2.76 2.79 2.59 2.91
3.40 3.30 3.80 4.27 3.88
4.06 3.87 4.14 4.14 4.43
4.65 6.36 6.66 6.81
2.46 2.47 2.48 2.37
2.19 2.25 2.44 2.31 2.32
2.57 2.68 2.94 2.55 2.84
3.08 3.47 3.43 4.08 4.02
3.90 3.95 4.00 4.16 4.21
4.66 4.86 5.26 6.12
1 >; H ZP H
1 •TI M
U
• Taxable bonds are those on which the Interest is subject to both the normal and surtax rates of the Federal income tax. This average commenced Oct. 20,1941.
2 Prior to October 1941 yields were on partiaUy tax-exempt long-term bonds. For January 1930 through December 1945, see the 1966 amiual report, page 492, and for January 1919 through December 1929, see the 1943 annual report, p. 662.
8 B e ^ n l n g Oct. 20, 1941, through Mar. 31, 1952, yields are based on bonds neither due nor caUable for 16 years; beginning Apr. 1, 1962, through Mar. 31, 1963, on bonds neither due nor caUable for 12 years; beginning Apr. 1,1963, on bonds neither due nor caUable for 10 years.
NOTE.—For bonds selling above par and caUable at par before maturity, the yields are computed on the basis of redemption at first caU date; whUe for bonds seUing below par, yields are computed to maturity. Monthly averages are averages of daUy figures. Each daily figure is an unweighted average ofthe yields ofthe Individual issues. Yields before 1953 are computed on the basis of the mean of closing bid and ask quotations in the over-the-counter market. Commencing AprU 1963, yields, as reported by the Federal Reserve Bank of New York, are based on over-the-counter closing bid quotations. See Treasury Bulletin for current monthly yields. to
to Ol
Digitized for FRASER http://fraser.stlouisfed.org/ Federal Reserve Bank of St. Louis

to to
TABLE 48.- -Prices and yields of marketable puhlic debt issues June 30, 1969, and June 30, 1970, and price range since first traded [Price decimals are 32d's and -^ indicates addi t iona l 64th's]
Issue •
J u n e 30, 1969 J u n e 30, 1970 Price range since first t r aded 2
Pr ice
B i d Ask
Yield to - caU or
m a t u r i t y 3
Pr ice
B id Ask
Yield to caU or
m a t u r i t y 3
H igh L o w
Price D a t e Pr ice
yt O
o "
w ZP H-
a
>
o • ^
y ^
W S3
> ZP
Kl
T r e a s u r y bonds : 4 % 0 c t . 1,1969 99.02-1- 99. 04-h 2 H % Dec. 15, 1964-69 97.29 97.31 4% F e b . 15, 1970 97.31 98.01 2 H % Mar. 15, 1965-70 97.00-1- 97.02-1-4% Aug . 16, 1970 96.10 96.14 2 H % Mar. 15, 1966-71 93.06 93.14 4% Aug . 15, 1971 93.28 94.04 37^% N o v . 15, 1971 93.06 93.14 4% F e b . 15, 1972.. 92.10 92.18 2M% J u n e 15, 1967-72 89.02 89.10 4% Aug . 15, 1972 9L08 9L 16 2 H % Sept . 15, 1967-72 88.02 88.10 2 K % Dec. 15, 1967-72 87.13 87.21 4 % Aug. 15, 1973 89.18 89.26 4 H % N o v . 15, 1973 89.18 89.26 4 H % F e b . 15, 1974 89.06 89.14 4>4% May 15, 1974 89.12 89.20 3 ^ % N o v . 15, 1974 87.28 88.04 4 1 ^ % May 15, 1975-85 79.26 80.10 4% F e b . 15, 1980 80.16 8L 00 3 H % N o v . 15, 1980 76.28 77.12 3M% J u n e 15, 1978-83 7L 16 72.00 33^% May 15, 1985 70.16 7L00 3M% F e b . 15, 1990 70.14 70.30 4 K % Aug . 15, 1987-92 75.16 76.00 4% F e b . 15, 1988-93 72.16 73.00 4 K % May 15, 1989-94 73.14 73.30 3 % F e b . 15, 1995 70.12 70.28 3>^% Nov. 15, 1998 70.12 70.28
Percent Percent 7.70 110.14 7.26 107.24 7.39 99.19 6.90 107.23 7.48 99.23 99.25 6.24 100.14 6.80 96.25 96.29 7.26 107.22 7.16 96.12 96.16 7.42 IOL 27 7.04 95.12 95.16 7.49 100.28 7.27 94.18 94.26 7.62 IOL 20 6.64 90.29 9L05 7.60 106.16 7.18 92.28 93.04 7.70 IOL 20 6.70 89.19 89.27 7.72 109.18 6.62 88.18 88.26 7.70 106.16 6.96 89.19 89.27 7.82 99.06 6.93 89.08 89.16 7.81 100.01 6.90 88.22 88.30 7.77 99.18 6.86 88.16 88.24 7.74 IOL 07 6.69 85.18 85.26 7.84 110.24 6.28 71.20 72.20 7.44 105.28 6.58 74.26 75.10 7.76 103.18 6.39 7L00 72.00 7.59 97.24 6.36 66.02 67.02 7.36 l l L 28 6.20 65.22 66.22 7.00 IOL 04 6.02 65.12 66.12 6.70 106.26 6.27 68.12 69.12 7.11 104.10 6.24 66.26 67.26 6.93 100.11 6.24 66.22 67.22 7.02 100.26 6.08 65.12 66.12 5.61 IOL 12 5.56 65.12 66.12 6.07 95.14
Apr . A p r . J a n . Apr . A u g . Apr . Dec . Dec . Dec . A p r . Dec . A p r . Apr . N o v N o v . J a n . J an . Apr . May May May A u g . J u n e Apr . Dec . J an . Aug . J u n e May
21,1958 6,1946
22,1965 6,1946 2,1963
16,1946 26,1962 26,1962 26,1962 16,1946 26,1962 6,1946 6,1946
12,1964 12,1964 22,1965 12,1964 22,1958 15,1967 12,1961 12,1961 4,1954
11,1958 21,1958 26,1962 16,1963 28,1963 18,1956 12,1961
93.29 8L04 93.08 80.10 92.18 79.20 9L30 90.25 9L02 79.12 89.24 78.24 79.06 85.31 85.24 84.28 84.22 82.14 66.30 7L04 66.24 62.02 6L08 59.20 63.00 62.18 6L26 59.20 59.20
Aug . J a n . A u g . J a n . A u g . J a n . A u g . A u g . Oct . J a n . Dec . J a n . J a n . Dec . Dec . Dec . Dec . Dec . May Dec . May May May May May May May May May
29,1966 6,1960 29,1960 6,1960 29,1966 6,1960 29,1966 29,1966 1,1969 6,1960 29,1969 6,1960 6,1960 29,1969 29,1969 29,1969 29,1969 29.1969 25.1970 29.1969 24.1970 26,1970 26,1970 26,1970 26,1970 26,1970 26,1970 26,1970 26,1970
Digitized for FRASER http://fraser.stlouisfed.org/ Federal Reserve Bank of St. Louis

T r e a s u r y notes: 6 H % D , A u g . 15, 1 9 7 0 . . . . . 98.30 99.00 7.38 100.01 100.03 5.97 5% A, N o v . 15, 1970 96.17 96.21 7.71 99.09 99.13 6.95 6 ^ % C, F e b . 15, 1 9 7 1 . . . . . . 96.28 97.04 7.45 98.31 99.03 7.10 7 y % T > , F e b . 15, 1971 . 100.10 100.14 7.23 5 K % A, May 15, 1 9 7 1 . . . - . 96.24 7.28 98.11 98.15 7.25 8% E , May 15, 1971. 100.16 100.20 7.40 8 M % F , A u g . 15,1971 : 100.31 IOL 03 7.34 5 3 ^ % B , N o v . 15, 1 9 7 1 . . . . . . . . . 96.06 96.14 7.15 97.10 97.14 7.47
. 7M% G, N o v . 15, 1 9 7 1 . . . . . 100.06 100.10 7.60 4 M % A, F e b . 15, 1972 . . 93.28 94.04 7.36 95.20 95.28 7.67 4M% B , May 15, 1972 . 93.20 93.28 7.25 95.02 95.10 7.63 7M% A, May 15, 1973 100.01 100.09 7.74 8 y % B , A u g . 15, 1973 . . . . . . IOL 04 IOL 12 7. 71 6 5 ^ % B , A u g . 15, 1974 94.02 94.10 7.03 92.14 92.22 7.81 5M% A, N o v . 16, 1974 94.20 94.28 6.97 92.16 92.24 7.81
" 6M% A, F e b . 15, 1975. . . . . . : 94.14 94.22 6.96 92.03 92.11 7.82 6% B , May 15, 1975 96.06 96.14 6.80 93.05 93.13 7.71 6M% A, F e b . 15, 1976 97.10 97.18 6.76 93.09 93.17 7.75 6 3 ^ % B , M a y 15, 1976 98.12 98.20 6.80 94.04 94.12 7.76 7 y % C, A u g . 15, 1976 99.17 99.25 7.60 8% A , F e b . 15, 1977 . . . . J 100.20 100.28 7.88 1 K % E O , Oct . 1, 1969 98.12 98.20 8 . 1 4 . . . . 1 K % E A , A p r . 1, 1970 . 96.08 96.20 6 . 7 1 . . 1M% E O , Oct . 1, 1970 94.00 95.00 6.58 98.02 98.18 9.44 1M% E A , A p r . 1, 1971. 9L 30 92.14 6.44 95.08 96.08 8.16 1 H % E O , Oct . 1, 1971 89.30 90.30 6.37 92.04 93.04 8.25 1 H % E A , A p r . 1, 1972. 87.28 88.28 .6.38 89.04 90.04 8.30 1M% E O , Oct . 1, 1972 86.12 87.12 6.19 86.20 87.20 8.12 1 H % E A , A p r . 1, 1973 84.08 85.08 6.28 84.06 85.06 8.02 1 H % E O , Oct . 1, 1 9 7 3 - . . . . 82.22 83.22 6.20 8L 24 82.24 7.98 13^% E A , Apr . 1, 1974 8L 18 82.18 6.02 79.12 80.12 7.97 1 M % E 0 , Oct . 1, 1974 77.12 78.12 7.86 1 H % E A , A p r . 1, 1975 75.06 76.06 7.86
100. 01 102. 09 100. 01 100. 30 103. 09 101.11 102. 00 104. 02 100. 06 101.16 100. 04 102.18 103. 22 100. 02 101. 20 101. 06 102. 28 100. 20 100.04 103.16 105. 06
99.12 99.00 98. 02 95.08 92.04 89.26 88.10 87.04 86.02 82.28 77. 22 75.28
J u n e Apr . Aug . Mar. Apr . Mar. Mar. Apr . May Apr . May Oct. Mar. Sept . J an . Ju ly Aug . Apr . May Oct. Mar. Aug . F e b . J u n e J u n e J u n e Aug. Dec. Oct. Oct. Apr . Mar. Apr .
30,1970 7.1967 2.1968 25,1970 7.1967 25,1970 25,1970 10,1967 29,1970 10,1967 12.1967 21.1969 25.1970 24.1968 2.1968 23.1968 2,1968 14.1969 15,1969 21.1969 10.1970 29.1969 27.1970 30,1970 30,1970 30,1970 7,1968 2,1968 7,1968 1,1968
30.1969 31.1970 25,1970
98.21 96.13 96.15 99.19 95.30 99.24
J u l y J u l y J u l y J a n . Sept . Sept .
100. OZy J a n . 95.03 Oct . 99.20 92.24 9L30 99.14
May Dec. Dec . May
100. OSy J a n . 89.14 Dec . 89.22 89.18 90.24 9L20 92.16 97.28 99.31 89.02 87.26 86.08 85.03 84.16 85.12 83.18 81. 20 79.04 76.00 73.30 74. 26
Dec, Dec . J an . J a n . J a n . May May Sept . A u g . Aug . Sept . Oct . Dec . J a n . J an . J a n . J a n . J a n . May
1,1969 !, 1969 1,1969 ', 1970 ,, 1969 1.1969 1.1970 ,1969 1,1970 1,1969 1.1969 ,1970 1.1970 ', 1969 , 1969 1.1969 K1970 1.1970 1,1970 ,1970 ,1970 1,1966 1,1966 1,1966 ,1966 , 1966 , 1967 1,1970 ', 1970 , 1970 1,1970 1,1970 1,1970
ZP
t—I ZP
o > >
1 Excludes T r e a s u r y bills, which are fully taxable . Fo r description a n d a m o u n t of each issue ou t s t and ing on J u n e 30,1970, see t ab le 28; for inforraation as of J u n e 30,1969, see 1969 "Sta t i s t ica l A p p e n d i x , " p . 77.
2 Beginning Apr i l 1953, prices are closing b id quo ta t ions . Prices for prior da tes are t he m e a n of closing b id a n d ask quota t ions ; " w h e n i ssued" prices are inc luded in price range. Da t e s of highs a n d lows in case of recurrence are t he latest da tes . Issues w i t h original m a t u r i t y of less t h a n 1 year are excluded.
3 Yields are c o m p u t e d to earliest call da t e when prices are above par a n d to matm-i ty da t e w h e n prices are a t p a r or below.
N O T E . — P r i c e s a n d yields (based on closing b id prices) on J u n e 30, 1969 a n d 1970 are over-the-counter quo ta t ions , as repor ted to the T r e a s u r y D e p a r t m e n t b y t h e Federa l Reserve B a n k of N e w York . Yields are percent per a n n u m compounded semiannuaUy except t h a t on securities hav ing only one interest p a y m e n t , they are compu ted on a s imple interes t basis .
to to
Digitized for FRASER http://fraser.stlouisfed.org/ Federal Reserve Bank of St. Louis

to to 00
VI.—Ownership of Federal securities
TABLE 49.—Estimated ownership of Federal securities outstanding June 30, 1960-70
[Pa r value.i I n biUions of doUars]
o
o
o
K|
o
y ^
> CO
d Kj
J u n e 30 T o t a l
a m o u n t out- T o t a l
s t and ing 2
Held b y banks
Commercial banks
Federa l Reserve b a n k s
Held b y U .S . Gov
e rnmen t accounts
Held b y p r iva te n o n b a n k investors
T o t a l ndivid-uals 3
• Insurance companies
Mu t ua l savmgs banks
Corporat ions *
S ta te , and MisceUa-local gov- neous e rnmen t s « hivestors ^
I . P u b h c deb t issues
I960.. 1961.. 1962.. 1963.. 1964.. 1965-. 1966.. 1967.. 1968.. 1969.. 1970..
286.3 289.0 298.2 305.9 3 n . 7 317.3 319.9 326.2 347.6 353.7 370.9
8 L 8 89.8 94.8 96.3 95.0 97.3 97.0
102.2
nn.o r 109. 4
I ILO
65.3 62.6 66.1 64.3 60.2 58.2 64.8 56.6
'•59.7 '•55.3
53.3
26.5 27.3 29.7 32.0 34.8 39.1 42.2 46.7 52.2 54.1 57.7
53.1 53.7 54.3 55.6 68.6 6 L 1 64.3 7 L 8 76.1 84.8 95.2
15L4 145.6 149.2 163.9 168.2 158.9 158.7 152.2
'•159.5 '•159.6
164.7
69.7 64.6 65.7 66.0 68.8 70.9 73.1 70.9
••74.8 '•77.9
82.5
12.0 1L4 1 L 3 10.9 10.8 10.6 9.6 8.6 8.1 7.7 6.8
6.3 6.2 6.0 5.8 6.6 6.0 4.1 3.9 3.3 2.9
19.6 18.6 18.2 18.7 18.9 15.3 14.2
'•11.0 13.0
'•12.6 11.1
18.8 19.3 20.1 2L4 22.6 24.1 24.6
'•23.6 '•24.6 '•25.2
-24. 6
24.8 25.4 27.7 30.9 3L4 32.6 32.3
'•34.0 ••35.1 '•32.9
36.9
Digitized for FRASER http://fraser.stlouisfed.org/ Federal Reserve Bank of St. Louis
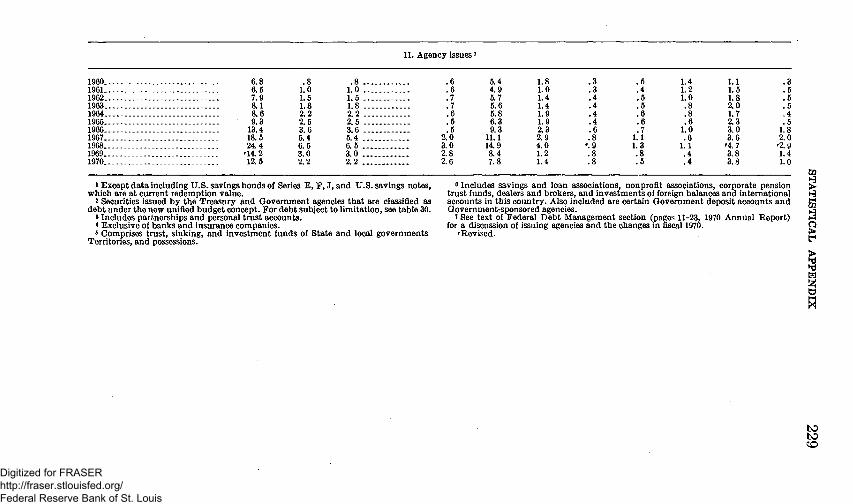
II. Agency issues ^
I960.. 1961.. 1962.. 1963. 1964.. 1966.. 1966.. 1967.. 1968.. 1969.. 1970-.
6.8 6.5 7.9 8.1 8.6 9.3
13.4 18.6 24.4 14.2 12.6
. 8 LO L 5 L 8 2.2 2.6 3.6 5.4 6.5 3.0 2.2
. 8 1.0 1.5 -1.8 2.2 2.5 3.6 -5.4 6.6 3.0 2.2
. 6
. 6
. 7
. 7
. 6
. 5
. 5 2.0 3.0 2.8 2.6
5.4 4.9 6.7 6.6 6.8 6.3 9.3
I L l 14.9 8.4 7.8
L 8 LO L 4 1.4 L 9 L 9 2.3 2.9 4.0 L 2 L 4
.6
.4
.5
.5
.6
.6
.7 L l L3
L 4 L 2 LO . 8 . 8 . 6
LO . 6
L l . 4 . 4
L l L 6 L 8 2.0 L 7 2.3 3.0 3.6
••4.7 3.8 3.8
.3
.5
.6
.5
.4
.5 L8 2.0
'2.9 L4 LO
CQ
I ZP
a %
%
1 Except data including U.S. savings bonds of Series E, F, J, and U.S. savings notes, which are at current redemption value.
2 Securities issued by the Treasury and Government agencies that are classified as debt under the new unifled budget concept. For debt subject to limitation, see table 30.
8 Includes partnerships and personal trust accounts. * Exclusive of banks and insmance companies. » Comprises trust, sinking, and investment funds of State and local governments
Territories, and possessions.
fl Includes savings and loan associations, nonprofit associations, corporate pension trust funds, dealers and brokers, and investments of foreign balances and intemational accounts in this country. Also included are certain Government deposit accounts and Government-sponsored agencies.
7 See text of Federal Debt Management section (pages 11-23, 1970 Annual Report) for a discussion of issuing agencies and the changes in fiscal 1970.
•^Revised.
to to CO
Digitized for FRASER http://fraser.stlouisfed.org/ Federal Reserve Bank of St. Louis

230 19 70 REPORT OF THE SECRETARY OF THE TREASURY
TABLE 50.—Summary of Treasury survey of owner [Par value. In
Classification
N u m b e r of ins t i tu t ions or funds
PubUc deb t issues: Interest-bearing publ ic debt securities:
Marketable Nonraarke tab le 5 Special issues
To ta l interest-bearing publ ic deb t securi t ies . .
Ma tu red deb t and deb t bearing no interes t . .
To ta l publ ic debt securit ies.
Gove rnmen t agency issues: Regular issues Par t ic ipa t ion certificates f
To ta l Government agency securities covered in Treasury survey
Nonsurveyed Government agency secur i t ies . . . _
To ta l Gove rnmen t agency securities _.
To ta l Federal securi t ies . .
Memorandura : Securities issued b y selected Governraent-sponsored agencies K . .
Tota l a raoun t outs tanding i
J u n e 30
1969
226,107 58,833 66, 790
351,729
1,991
363,720
1,963 10,414
12,377
1,880
14,256
367,977
8 25,060
1970
232,599 60,103 76,323
369,026
1,893
370,919
1,913 8,813
10, 726
1,783
12,509
383,428
8 35,822
U .S . Governm e n t accounts
and Federal Reserve b a n k s
J u n e 30
1969
70,099 2,071
66, 738
138,908
138,908
137 2,453
2,689
257
2,847
141,754
472
1970
74,689 2,071
76,124
152,884
152,884
100 2,211
2,311
243
2,663
155,437
117
To ta l pr iva te investors
Jurie 30
1969
156,008 56,762
52
212,822
1,991
214,813
1,826 7,961
9,787
1,623
11,410
226,223
24,688
1970
157,911 58,032
199
216,142
1,893
218,035
1,813 6,602
8,416
1,640
9,955
227,990
35,705
He ld b y pr ivate investors covered in Treasury
survey
Comraerc ia l baiU5s2
J u n e 30
1969
6,808
44,132 54
.44,187
44,187
275 1,937
2,212
3,868
1970
6,743
42,451 49
42,500
42,600
241 1,424
1,666
4,885
Mutua l savings b a n k s 2
J u n e 30
1969
499
3,267 25
3,293
3,293
134 486
619
1,314
1970
496
2,848 14
2,862
2,862
120 403
523
1,407
1 Securities issued by the Treasury and Government agencies that are classified as Federal debt under the unified budget concept. For debt subject to limitation, see table 30.
2 Excludes trust departments. 3 Included with aU other investors are those banks, insurance corapanies, savings and loan associations,
corporations, and State and local government funds not reporting in the Treasury survey. Also included are certain (Jovernment deposit accounts and Government-sponsored agencies.
Digitized for FRASER http://fraser.stlouisfed.org/ Federal Reserve Bank of St. Louis

STATISTICAL APPENDIX 231 ship of Federal securities, J u n e 30, 1969 and 1970
mUlions of dollars]
Held b y pr ivate investors covered in Treasury survey—Cont inued
Insu rance companies
Life
J u n e 30
1969
293
3,384 34
3,419
3,419
139 47
186
68
1970
290
3,238 32
3,270
3,270
137 44
181
95
Fire , casual ty ,
a n d mar ine
J u n e 30
1969
460
3,199 31
3,230
3,230
21 316
337
279
1970
458
2,631 28
2,658
2,658
35 296
331
390
Savings a n d loan
associations
J u n e 30
1969
488
4,472 12
4,483
4,483
77 168
245
867
1970
488
3,564 10
3,574
3,574
66 134
200
1,693
Corporations
J u n e 30
1969
469
6,377 1
5,378
5,378
23 179
202
1,040
1970
468
3,639 1
3,640
3,640
69 103
172
981
Sta te a n d local governments
General funds
J u n e 30
1969
316
9,353 57
9,411
9,411
274 586
860
2,859
1970
316
9,804 44
9,848
9,848
106 531
637
3,243
Pension a n d re t i rement
funds
J u n e 30
1969
187
4,233 62
4,294
4,294
229 846
1,075
219
1970
187
3,432 58
3,491
3,491
245 887
1,132
291
AU other pr ivate
investors 3
J u n e 30
1969
78,591 56,485
52
136,128
1,991
137,119
653 3,398
4,051
=
14,076
1970
86,303 67,796
199
144,298
1,893
146,191
794 2,781
3,576
22,719
Memor a n d u m : He ld b y corporate pension
t rus t funds«
J u n e 30
1969
28,761
1,860 157
2,007
2,007
25 172
197
228
1970
36,401
1,784 138
1,922
1,922
30 174
204
395
4 Consists of corporate pension trust funds and profit sharing plans which involve retirement benefits. Quarterly data are presented in the Survey of Ownership section of the "Treasury Bulletin."
5 Series E U.S. savings bonds and U.S. savings notes are included at current redemption value. 6 Export-Import Bank and Government National Mortgage Association issues. ^ Federal Home loan banks. Federal land banks, and beginning in.1969, the Federal National Mortgage
Association, banks for cooperatives, and Federal intermediate credit banks. 8 Includes securities issued for use as collateral for short term borrowings.
Digitized for FRASER http://fraser.stlouisfed.org/ Federal Reserve Bank of St. Louis
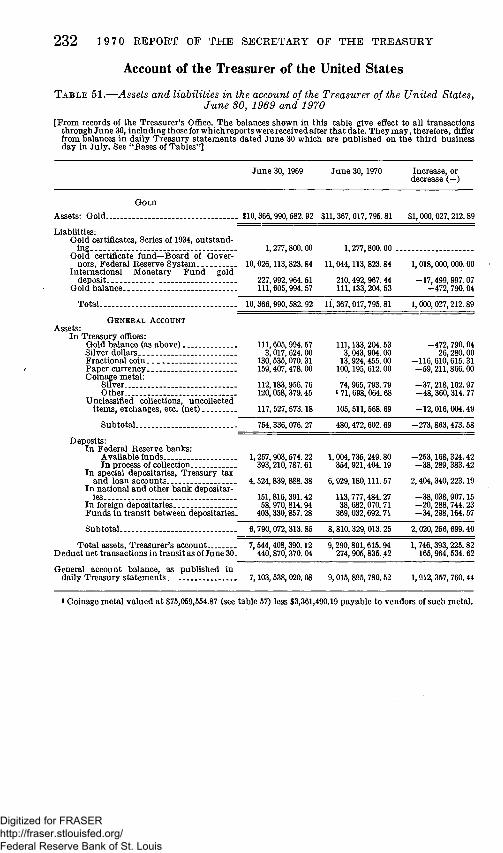
232 19 70 REPORT OF THE SECRETARY OF THE TREASURY
Account of the Treasurer of the United States
TABLE 51.—Assets and liabilities in the account of the Treasurer of the United States, June 30, 1969 and 1970
[From records of the Treasurer's OfBce. The balances shown in this table give eflect to all transactions through June 30, including those for which reports were received after that date. They may, therefore, difler from balances in daily Treasury statements dated June 30 which are published on the third business day in July. See "Bases of Tables"]
June 30, 1969 June 30, 1970 Increase, or decrease (—)
GOLD
Assets: Gold $10,366,990,582.92 $11,367,017,796.81 $1,000,027,212.89
Liabilities: Gold certificates. Series of 1934, outstand
ing , 1,277,800.00 1,277,800.00 Gold certificate fund—Board of Gover
nors, Federal Reserve System 10,026,113,823.84 11,044,113,823.84 1,018,000,000.00 International Monetary Fund gold
deposit - 227,992,964.61 210,492,967.44 -17,499,997.07 Gold balance — 111,606,994.67 111,133,204.63 -472,790.04
Total 10,366,990,582.92 11,367,017,795.81 1,000,027,212.89
GENERAL ACCOUNT Assets:
In Treasury oflQces: Gold balance (as above) 111, 605,994. 67 111, 133,204. 53 -472,790.04 Silver dollars 3,017,624.00 3,043,904.00 26,280.00 Fractional coin 130,635,070.31 13,924,455.00 -116,610,615.31 Paper currency - 159,407,478.00 100,195,612.00 -59,211,866.00 Coinage metal:
Silver - - 112,183,966.76 74,966,793.79 -37,218,162.97 Other 120,068,379.45 171,698,064.68 -48,360,314.77
Unclassified collections, uncollected items, exchanges, etc. (net) „ ._ 117,527,573.18 105,611,668.69 -12,016,004.49
SubtotaL — 754,336,076.27 480,472,602.69 -273,863,473.68
Deposits: In Federal Reserve banks:
Available funds 1,257,903,574.22 1,004,736,249.80 - 253,168,324.42 In process of coUection. 393,210,787.61 364,921,404.19 -38,289,383.42
In special depositaries, Treasury tax and loan accounts 4,624,839,888.38 6,929,180, 111. 67 2,404,340,223.19
In national and other bank depositaries 161,816,39L 42 113,777,484.27 -38,038,907.15
In foreign depositaries 58,970,814.94 38,682,070.71 -20,288,744.23 Funds in transit between depositaries- 403,330,857.28 369, 032,692.71 -34,298,164.57
Subtotal — . 6,790,072,313.85 8,810,329,013.25 2,020,266,699.40
Total assets. Treasurer's account 7,644,408,390.12 9,290,801, 615.94 1,746,393,225.82 D educt net transactions in transit as of June 30. 440,870,370. 04 274,905,835.42 165,964,534.62
General account balance, as published in daily Treasury statements 7,103,538,020.08 9,016,895,780.52 1,912,357,760.44
1 Coinage metal valued at $76,069,664.87 (see table 67) less $3,361,490.19 payable to vendors of such metal.
Digitized for FRASER http://fraser.stlouisfed.org/ Federal Reserve Bank of St. Louis

STATISTICAL APPENDIX 2 3 3
TABLE 52.—Accountability of the Treasurer of the United States on an accounting hasis, June SO, 1964-70
[On basis of daUy Treasmy statements and accounts of the Treasmer of the United States]
Published In Transactions lu Fiscalyear dailyTreasury transit as of Total
statements June 30
1964 $6,766,466,061 -$27,889,624 $6,738,666,437 1966 6,216,666,047 61,116,375 6,266,781,422 1956 6,646,183,868 263,384,165 6,799,668,033 1957 6,589,952,362 68,517,897 5,648,470,259 1958 9,749,102,978 48,349,862 9,797,452,839 1959 6,350,391,763 41,300,160 6,391,691,923 1960 8,004,740,998 151,277,138 8,156,018,136 1961 6,694.119,964 76.497,633 6,770.617,586 1962 10,430,393,649 73,817,403 10,504,210,952 1963 12,116,176,163 264,232,225 12,380,408,389 1964 11,035,731,209 80,408,596 11,116,139,804 1965 12,610,264,635 99,732,049 12,709,996,684 1966 12,407,377,210 42,138,112 12,449,515,322 1967 7,758,994,525 119,526,350 7,878,519.874 1968 6,694,062,122 90,630,717 6,784,692.839 1969 7,103,638,020 440,870,370 7,544,408,390 1970 9,015,895,781 274,905,835 9,290,801,616
Digitized for FRASER http://fraser.stlouisfed.org/ Federal Reserve Bank of St. Louis
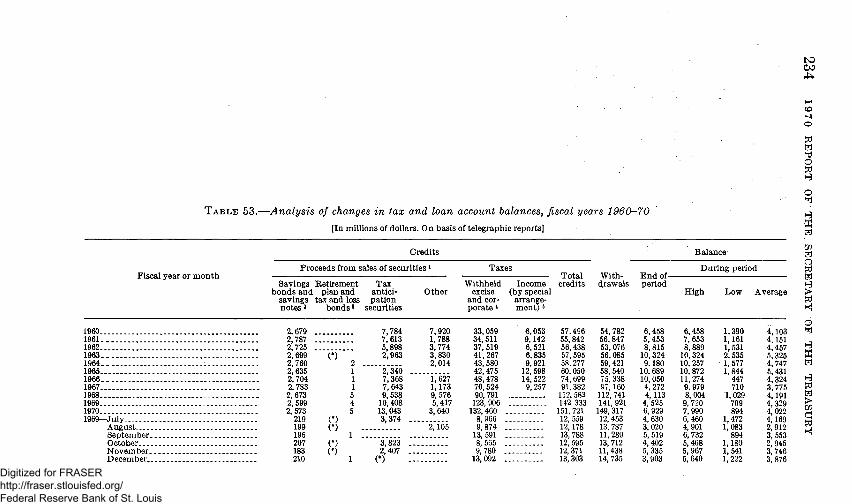
to CO
T A B L E 53.—Analysis of changes in fax and loan account balances, fiscal years 1960-70
[In miUions of dollars. On basis of telegraphic reports]
Pi
o H O
o pi
y ^
> Pi y<
o
y ^
W
Pi
> ZP cl Kl
Fiscal year or month
Credits Balance
Proceeds from sales of securities» Taxes
Savirigs Rethement Tax bonds and plan and antici-
savings tax and loss pation notes 2 bonds s securities
Other Withheld
excise and corporate *
Total Income credits
(by special arrangement) *
Withdrawals
End of period
During period
High Low Average
1960 1961 1962 1963 1964 1965 1966 1967 1968 1969 1970 1969—July
August Septeniber. October Noveraber.. Deceraber..
2,679 2,787 2,725 2,699 (*) 2,760 2 2,636 1 2,704 1 2,783 1 2,673 5 2,599 4 2,573 5 219 (*) 199 (*) 196 1 207 (*) 183 (*) 210 1
7,784 7,920 7, 613 1, 788 6,898 3,774 2,963 3,830
2,014 2,340 7,368 1,627 7, 643 1,173 9,638 9, 576 10,408 5, 417 13,043 3, 640 3,374
2,105
"3,'823 .'.'.'-".".'.'-'.'.' 2,407 (*)
33,059 6,053 57.496 54,782 6,458 6,458 1,390 4,103 34,511 9,142 55,842 56,847 5,453 7,653 1,161 4,151 37,519 6,521 56,438 53,076 8,816 8,889 1,531 4,457 41,267 6,835 57,595 56,085 10,324 10,324 2,535 5,325 43,580 9.921 58,277 59,421 9.180 10,257 1.577 4.747 42,475 12.598 60,050 58,540 10.689 10,872 1,844 6,431 48,478 14,522 74,699 75,338 10,050 11,274 447 4,324 70,524 9.257 91,382 97,160 4,272 9.979 710 3.775 90,791 112.583 112,741 4,113 8,004 1,029 4.191 123,906 142,333 141,921 4,525 9,720 709 4,329 132,460 151,721 149,317 6,929 7,990 894 4,022 8,966 12,559 12,453 4,630 6,460 1,472 4,169 9,874 12,178 13,787 3.020 4,901 1,083 2,912 13,591 13,788 11,289 5,519 6,732 894 3,553 8,565 12,595 13,712 4,402 5,468 1,180 2,945 9,780 12,371 11,438 5,335 5,967 1,541 3,746 13,092 13,303 14,735 3,903 6,640 1,222 3,876
Digitized for FRASER http://fraser.stlouisfed.org/ Federal Reserve Bank of St. Louis

7.953 10,128 15,957 12,452 12, 594 12,819
5,188 5,592 5.630 5,123 4,605 6,929
5,333 6,419 6,666 5,123 6,267 7,990
1,803 3,840 3,487 1,206 3,468 1,677
3.329 5,472 5,331 3,454 4,850 4,632
1970—January. 1. . . 258 (*) 8.980 9,238 February 227 (*) 10.305 10.532 March 224 1 3,438 12,332 15.994 AprU 224 1 (*) 11,719 11.944 May. 210 (*) 1,535 10,331 12,076 June 217 1 1 14,925 15,143
•Less than $500,000. * Taxes eligible for credit consist of those deposited by taxpayers in the depositary * Special depositaries are permitted to make payment in the form of a deposit credit banks, as foUows: Withheld income taxes beginnhig March 1948; taxes on eraployers and
for the purchase price of U.S. Governraent securities purchased by thera for their own employees under the Federal Insurance Contributions Act beginning January 1950, account, or for the account of their customers who enter subscriptions through them, and under the RaUroad Retirement Tax Act begiiming July 1951; a number of excise when this method of payment is permitted under the terms of the circulars inviting taxes beginning July 1953; estiraated corporation income taxes beginning AprU subscriptions to the issues. 1967; and aU corporation incorae taxes due on or after Mar. 15,1968.
2 U.S. savings notes first offered for sale as of May 1, 1967 and discontinued after ^ Under a special procedure begun in Mar. 1951, authorization was given during certain June 30, 1970. periods for income tax payinents, or a portion of them made by checks of $10,000 or
3 Retirement plan bonds first offered for sale as of Jan. 1,1963; tax and loss bonds first more drawn on a special depositary bank to be credited to the tax and loan account in ^ issued hi March 1968. that bank. This procedure was discontinued in AprU 1967. yq
h-i ZP
o >
to CO CTl
Digitized for FRASER http://fraser.stlouisfed.org/ Federal Reserve Bank of St. Louis
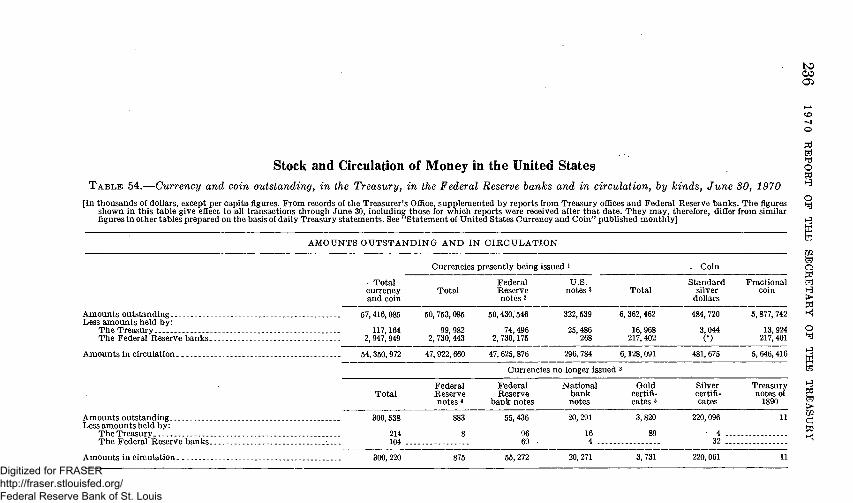
bO CO
Stock and Circulation of Money in the United States TABLE 54.—Currency and coin outstanding, in the Treasury, in the Federal Reserve hanks and in circulation, hy kinds, June 30, 1970
[In thousands of dollars, except per capita figmes. From records of the Treasurer's Oflace, supplemented by reports from Treasury oflfices and Federal Reserve banks. The figmes shown in this table give effect to all transactions through June 30, including those for which reports were received after that date. They may, therefore, difler from similar figures in other tables prepared on the basis of daily Treasury statements. See "Statement of United States Currency and Coin" published monthly]
AMOUNTS OUTSTANDING AND IN CIRCULATION
Currencies presently being issued '
- Total cm-rency and coin
Total Federal Reserve notes 2
U.S. notes 3 Total
Amounts outstanding Less amounts held by:
The Treasury The Federal Reserve banks.
Amounts in chculation
Amounts outstanding Less amounts held by:
TheTreasury. The Federal Reserve banks.
Amounts in circulation
Coin
Standard silver
doUars
Fractional coin
67, 416,085
117,164 2,947,949
54,360,972
Total
. - 300,538
. . . . . 214 . . . . 104 . .
300, 220
60, 753,085
99, 982 2, 730,443
47, 922, 660
Federal Reserve notes *
883
8
875
60,430,646
74,496 2, 730,175
47,625, 876
Currencies
Federal Reserve
bank notes
55,436
96 69 -
65, 272
322,539
25,486 268
296, 784
no longer issued
National bank notes
20,291
16 4
20, 271
6,362,462
16, 968 217,402
6,128,091
3
Gold certificates 5
3,820
89
3,731
484, 720
3,044 (*)
481, 675
Silver certificates
220,096
4 . . . 32 . . .
220, 061
5, 877, 742
13, 924 217, 401
5, 646,416
Treasury notes of
1890
11
11
Pi
Id o ?d
O
ZP
O Pi
> Pi Kj
o
W
y ^
> ZP
d pi
Digitized for FRASER http://fraser.stlouisfed.org/ Federal Reserve Bank of St. Louis
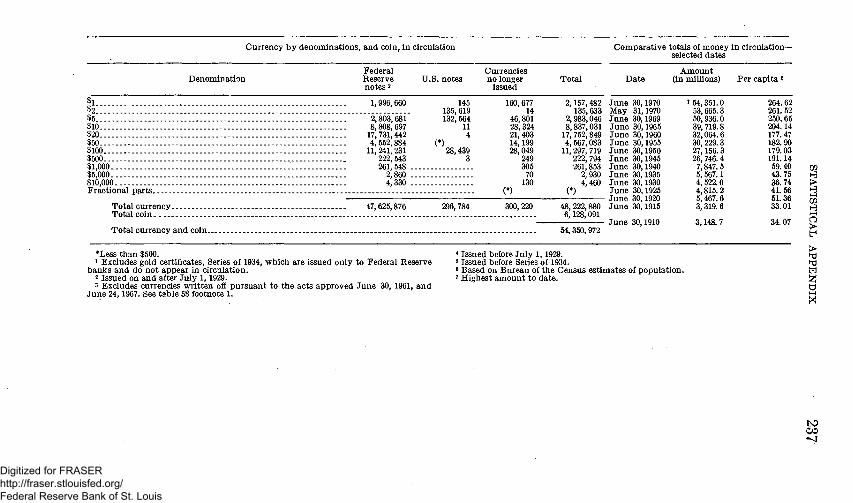
Currency by denominations, and coin, in circulation
Denomination Federal Reserve notes 2
U.S. notes Cm-rencies no longer
issued
$5.
$20.
$100 $500 $1,000-. $5,000 $10,000 Fractional parts.
1,996,
"2,'803," 8,808,
17,731, 4, 552,
11, 241, 222, 261,
2, 4,
660
681 697 442 884 231 543 548 . 860 . 330 .
145 135,619 132, 664
11 4
(*) 28,439 3
160,677 14
46,801 28,324 21, 403 14,199 28,049
249 305 70
130 (*)
Total cmrency. Total coin
47,625,876 296,784 300,220
Total currency and coin-
Total
2,157,482 135, 633
2,983,046 8,837,031
17,752,849 4,567,083
11, 297, 719 222, 794 261,853
2,930 4,460
(*) 48, 222,880 6,128,091
64,350,972
Comparative totals of raoney in circulation-selected dates
Date Amount
(in milhons) Per capita e
June May June June June June June June June June June June June June
30,1970 31,1970 30,1969 30,1965 30,1960 30,1955 30,1950 30,1945 30,1940 30,1935 30,1930 30,1925 30,1920 30,1915
June 30,1910
7 54,351.0 53,665.3 50,936.0 39,719.8 32,064.6 30, 229.3 27,156. 3 26, 746. 4 7,847.5 5,567.1 4, 522.0 4,815.2 5,467. 6 3,319. 6
3,148.7
264.62 261. 52 250.65 204.14 177.47 182.90 179.03 191.14 59.40 43.75 36.74 4L56 5L36 33.01
34.07
ZP
I ZP h-i Q >
> y ^
hd
a HH
*Less than $600. 1 Excludes gold certificates. Series of 1934, which are issued only to Federal Reserve
banks and do not appear in circulation. 2 Issued on and after July 1,1929. 3 Excludes currencies written off pursuant to the acts approved June 30, 1961, and
June 24,1967. See table 58 footnote 1.
4 Issued before July 1,1929. 6 Issued before Series of 1934. 6 Based on Bureau of the Census estimates of population. 7 Highest araount to date.
to CO
Digitized for FRASER http://fraser.stlouisfed.org/ Federal Reserve Bank of St. Louis

bO oo (X)
TABLE 55.—Stock of money hy kinds, selected years, June SO, 1936-70 pi
[In thousands of doUars, except percentage of gold to total stock of money. For basis of data see headnote to table 54] hd O Pi
Kind of money 1935 1940 1945 1950 1956 1960 1965 1968 1969 1970 H3
_____ ^ BulUon and coin: ^
Gold 9,116,643 19,963,091 20,212,973 24,230,720 21,677,576 19,322,238 13,934,083 110,136,912 110,138,998 111,156,525 SUver'buUion (at mo'netary value) 313,309 1,353,162 1,520,295 2,022,835 2,187,429 2,252,075 2 1,267,417 (2) (2) (2) H Standard silver dollars 545,642 547,078 493,943 492,583 490,347 487,773 484,720 484,720 484,720 484,720 ffl Subsidiary coin ' ' 312,416 402,261 825,798 1,001,574 1,296,140 1,552,106 2,375,327 4,554,118 4,538,237 4,703,397 H Minorcoin " 133,040 173,909 303,639 378,463 449,625 659,148 853,388 1,022,946 1,085,133 1,174,345
Subtotal 10,420,050 22,439,501 23,356,548 28,126,175 26,101,115 24,173,340 18,914,934 16,198,695 16,247,087 17,518,986 ^ Less: Gold, silver bulhon, and standard silver G
doUars held as security for, or redemption g of outstanding paper currencies 3. . . . 7,287,471 19,807,106 20,079,777 25,504,665 23,594,948 21,611,053 14,715,025 10,025,639 10,027,392 11,045,392 ^
Total bullion and coin (net).. 3,132,579 2,632,395 3,276,771 2,621,510 2,506,168 2,562,287 4,199,909 6,173,056 6,219,696 6,473,596 ^ ^
Currency: Gold certificates, and credits payable therein 4 6,320,236 17,821,133 18,106,600 23,022,852 21,028,137 19,059,416 13,670,235 10,025,639 10,027,392 11,045,392 Q Less: Araount included in collateral held by Federal bj
Reserve agents for Federal Reserve notes.. 3,294, 639 6,557,600 10,968,000 14,349,000 11,108,000 10,565,000 6,295, OQO 5,258,000 3,287,000 3,322,000 • : H
Subtotal . '. 3,025,597 12,263,633 7,138,600 8,673,851 9,920,137 8,494,416 7,375,235 4,767,639 6,740,392 7,723,392 ^ Gold certificates prior to Series of 1934 5 13,340 4,011 3,934 3,820 M Silver certificates 6 810,014 1,828,771 1,815,988 2,324,628 2,409,630 2,394,456 889,176 238,571 222,967 220,096 Treasury notes of 1890 7 1,182 1,163 1,150 1,145 1,142 1,142 42 11 11 11 yq United States notes 8.. 346,681 346,681 346,681 346,681 346,681 346,681 322,681 322,639 322,539 322,539 pi Federal Reserve notes 9 3,492,854 5,481,778 23,650,975 23,602,680 26,629,030 28,394,186 37,347,185 44,432,153 47,284,487 50,431,429 t^ Federal Reserve bank notes 10. -- 84,354 22,809 533,979 277,202 164,412 100,736 68,793 59,048 57,088 55,436 > National bank notes 11 . . . . 769,096 167,190 121,215 87,615 67,379 55,979 22,283 20,701 20,477 20,291 ZP
d Total paper currency (net). 8,529,778 20,112,025 33,608,588 35,313,803 39,538,411 39,787,595 46,038,735 49,844,672 54,651,875 58,777,015 W
. K^
Total Stock of money 11,662,357 22.744,420 36,885,360 37,935.313 42,044,579 42,349,882 .50,238,644 56,017,727 60,871,570 65,250,610 Percentage of gold to total stock of money 78.16 87.77 54.80 63.87 51.56 45.63 27.74 18.10 16.66 17.10 Digitized for FRASER
http://fraser.stlouisfed.org/ Federal Reserve Bank of St. Louis

1 Excludes gold deposited with the United States by the International Monetary Fund.
3 Excludes buUion carried at monetary value but released for coinage use. 8 Comprises the security for: Gold certificates and credits payable therein (100
percent in gold); U.S. notes (gold to theextent of the reserve required by law (31 U.S.C. 408)); and silver certificates and Treasury notes of 1890 (100 percent in sUver buUion or standard sUver doUars). Since enactment of the Old Series Currency Adjustment Act (31 U.S.C. 912-916) on June 30, 1961, gold certificates prior to the Series of 1934; sUver certificates issued before July 1, 1929, and Treasury notes of 1890 have been payable from the general fund. The requirement for a gold reserve against U.S. notes was repealed by Public Law 90-269, approved Mar. 18, 1968. SUver certificates issued on and after July 1, 1929, became redeemable from the general fund on June 24, 1968 (31 U.S.C. 405a-3). The amount of security shown on this line for years after those dates has been reduced accordingly.
* Consists of: Gold certificates outside of the Treasury (issues prior to Series of 1934 are included through 1961). and credits with the Treasurer of the United States payable to the Board of Governors, Federal Reserve System, in gold certificates. These obligations are fuUy secured by gold in the Treasury.
5 Pursuant to the Old Series Currency Adjustment Act are redeemable from the general fund of the Treasury and upon redemption wiU be rethed.
« SUver certificates were originally secured by shver bullion at monetary value ($1.29-1-per fine troy ounce) and standard silver dollars held in the Treasury. They are now payable from the general fund (see footnote 3).
7 Treasury notes of 1890 have been in process of retirement since March 1900 (31 U.S.C. 411) upon receipt by the Treasury. UntU June 30, 1961, secured by silver and by gold reserve; thereafter redeeraable from general fund.
8 U.S. notes were secured by a gold reserve (31 U.S.C. 408) untU this requhement was repealed by Public Law 90-269, approved Mar. 18, 1968. This reserve, which was also a reserve for Treasury notes of 1890 untU June 30, 1961, araounted to $156,039,431 for aU dates in this table through 1967. The act of May 31,1878 (31 U.S.C. 404) required
that the amount of U.S. notes then outstanding, $346,681,016, be kept in chculation. The Old Series Currency Adjustment Act provided that this amount should be reduced by such amounts of notes as the Secretary of the Treasury might determine to bave been destroyed or irretrievably lost. To date, the Secretary has made such determinations with respect to $24,142,000 of the U.S! notes issued prior to July 1, 1929.
» Federal Reserve banks secure Federal Reserve notes by depositing like amounts of coUateral with Federal Reserve agents. The Federal Reserve Act, as amended (12 U.S.C. 412), authorizes the use of the following assets for this purpose: (a) gold certtficates or gold certificate credits; (b) certain discounted or purchased coraraercial paper; (c) securities issued by the United States; and^d) Special Drawing Rights certificates issued by the Exchange Stabilization Fund. Federal Reserve notes are obligations ofthe United States and are a first lien on aU assets of the issuing Federal Reserve bank.
Pursuant to the Old Series Currency Adjustment Act of 1961, funds were deposited by the Federal Reserve banks on July 28,1961, with the Treasurer of the United States for the redemption of aU series of Federal Reserve notes issued before the Series of 1928. The araount shown for 1970 hicludes $883,185 for such series.
10 Federal Reserve bank notes at issuance were secured by direct obligations of the United States or coramercial paper. Since termination of their issuance on June 12, 1945 (12 U.S.C. 445 note), the notes have been in process of retirement, and lawful money has been deposited with the Treasurer of the United States for their rederaption.
11 National bank notes at issuance were secured by direct obligations of the United States. From Dec. 23, 1916 (12 U.S.C. 441) these notes have been in process of rethement, and lawful money has been deposited with the Treasurer of the United States for theh rederaption.
NOTE.—Figures for years not shown appeared in the following annual reports: 1860-1947 in the 1947 report, page 482; 1948 and 1949 in the 1956 report, page 542; 1951-61 in the 1961 report, page 634; 1962-64 in the 1964 report, page 596; and 1966-67 in the 1967 report, page 654.
ZP
i h-t ZP y ^ M
o
% te)
o
to CO CO
Digitized for FRASER http://fraser.stlouisfed.org/ Federal Reserve Bank of St. Louis

to
o
TABLE 56.—Money in circulation hy kinds, selected years, June 30, 1936-70 [In thousands of doUars. For basis of data, see headnote to table 54]
o pi H
O
w
g o pi > Pi y<
o
Pi
> ZP
d Kj
June 30 Standard
Gold cer- sUver tificates» doUars
Treasury SUver cer- notesof Subsidiary Minor tificates i 1890 * coin coin
United Federal States Reserve notes * notes *
Federal Reserve
bank notes 1
National bank notes >
Total
1936 _ 117,167 32,308 701,474 1,182 295,773 125,125 286,417 3,222,913 81,470 704,263 5,667,093 1940 - 66,793 46,020 1,681,662 1,163 384,187 168,977 247,887 6,163,284 22,373 166,155 7,847,501 1945 52,084 126,178 1,660,689 1,150 788,283 291,996 322,587 22,867,459 527,001 120,012 26,746,438 1960 - 40,772 170,185 2,177,251 1,145 964,709 360,886 320,781 22,760,285 273,788 86,488 27,166,290 1956 34,466 223,047 2,169,726 1,142 1,202,209 432,612 319,064 26,617,776 162,673 66,810 30,229,323 1960 30,394 305,083 2,126,833 1,142 1,484,033 649,367 318,436 27,093,693 99,987 65,652 32,064,619 1965 13,209 481,698 829,177 42 2,355,380 824,585 301,978 34,823,233 68,333 22,167 39,719,801 1968 3,868 481,689 225,266 11 3,877,813 949,604 299,188 4L 723,506 68,854 20,664 47,640,463 1969 3,804 481.688 222,828 11 4,260,860 1,047,364 294,478 44,647,642 56,885 20,467 50,936,026 1970 3.731 481,675 220,061 11 4,519,799 1.126,617 296,784 47,626,751 55,272 20,271 54,350,972
» For description of security required to be held against the various kinds of paper currency, and for retirement provisions, see footnotes to table 65.
NOTE.—Figures for years not shown appeared in the foUowing annual reports: 1860-1947 in the 1947 report, page 485; 1948-49 in the 1966 report, page 643; 1951-61 hi the 1961 report, page 636; 1962-64, in the 1964 report, page 698; and 1966-67 in the 1967 report, page 666.
Digitized for FRASER http://fraser.stlouisfed.org/ Federal Reserve Bank of St. Louis
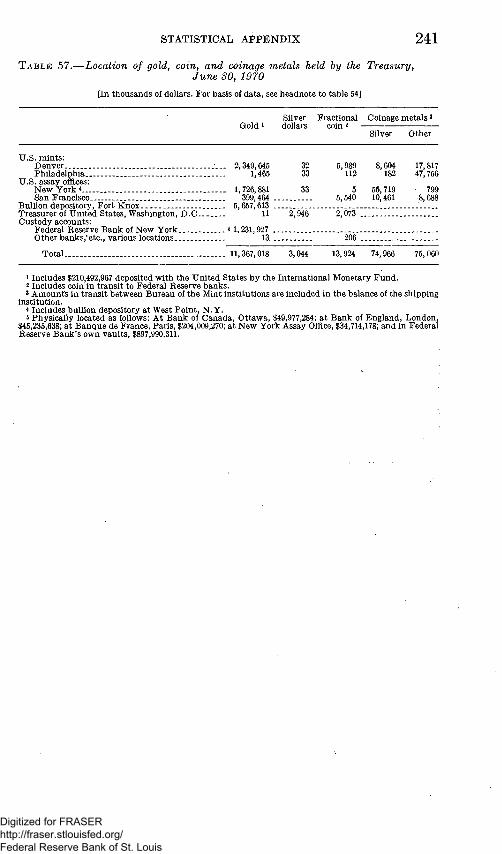
STATISTICAL APPENDIX 2 4 1
TABLE 57.—Location of gold, coin, and coinage metals held by the Treasury, June 30, 1970
[In thousands of dollars. For basis of data, see headnote to table 54]
U.S. raints: Denver Philadelphia
U.S. assay oflaces: New York 4 San Francisco
Bullion depository, F Treasurer of United S Custody accounts:
Federal Reserve ] Other barUfS,*etc.
Total
o r tK Itates,
Bank , varic
iiox Washington, D.C
of New York )us locations
Goldi
. . . 2,349,645 1,465
. . . 1,726,881 399,464 -
. _ 5,667,613 . 11
5 1,231,927 13
. . . 11,367,018
Silver doUars
32 33
33
2,946
3,044
Fractional coin 2
5,989 112
6 5,540
2,073 _
206 .
13,924
Coinage nietals 3
SUver Other
8,604 182
55,719 10,461
74,966
17,817 47,756
799 8,688
75, 060
1 Includes $210,492,967 deposited -with the United States by the International Monetary Fund. 2 Includes coin in transit to Federal Reserve banks. 3 Amounts in transit between Bureau of the Mint institutions are included in the balance of the shipping
institution. 4 Includes bulUon depository at West Point, N.Y. 8 PhysicaUy located as follows: At Bank of Canada, Ottawa, $49,977,284; at Bank of England, London,
$45,235,638; at Banque de France, Paris, $204,009,270; at New York Assay Office, $34,714,178; and in Federal Reserve Bank's own vaults, $897,990,311.
Digitized for FRASER http://fraser.stlouisfed.org/ Federal Reserve Bank of St. Louis

242 19 70 REPORT OF THE SECRETARY OF THE TREASURY
T A B L E 58.—Paper currency issued and redeemed during the fiscal year 1970 and outstanding June 30, 1970, by classes and denominations
[For basis of data , see headnote to table 54]
Issued Redeemed dur ing 1970 dur ing 1970
Outs tanding J u n e 30, 1970 i
I n I n Federal I n Treasury Reserve b a n k s circulation
$21, 701,8
C L A S S
Gold certtficates—Series of 1934.
U . S . n o t e s 2 Federa l Reserve n o t e s -
issued on and after J u l y 1, 1929 15,199,488,000
Currencies no longer issued: 2 Federa l Reserve n o t e s -
issued before J u l y 1, 1929
Federa l Reserve b a n k notes
Na t iona l bank notes Gold certificates—issued
before Series of 1934 . Silver certificates. T rea su ry notes of 1890
""$2i,'76i,"8o'o"
12, 052, 471,118
"$"2'5V486',3'57'"
74,495, 755
$1, 277,800 . 268, 300
2, 730,174, 652
'"$"2"9"677'8"4V359
47, 625,875,873
74, 670
1, 631, 285 185, 742
114, 075 2, 871,146
7, 990 .
96, 288 15, 582
89,400 . 4,240
68, 655 4,200
875,195
55, 271, 545 20, 271, 289
3, 730,869 220,060.562
10,534
T o t a l - 15,221,189,800 12,079,049,836 100,195,612 2,731,825,107 48,222,880,226
D E N O M I N A T I O N $1 1,443,488,000 $2 $5"r . "" - - -7- - -" . " . ' . - - " - r . ' . ' " . " ' i , ' 832 ," 480,'ooo' $10 3,587,360,000 $20 5,445,120,000 $50 893,300,000 $100 1,816,501,800 $500 28,700,000 $1,000 78,550,000 $5,000 36,860,000 $10,000. 58,830,000 $100,000 Fract ional par t s
1, 279,825, 960 224, 236
1, 692, 042, 200 3,401, 590,325 4,204,176,190
503, 231,325 700,175,600 61,112,000
124,147,000 43,145,000 69,380,000
2, 629, 066 559
8,068,117 13, 021, 375 38, 709, 020
6,075,075 31,474, 900
94, 500 83,000 10,000 30,000
387, 734,462 2,800
316, 714, 735 657, 648, 630 876, 615, 280 211,870, 950 274,827, 250
2,030, 000 2, 761, 000
n o , 000 310, 000
1,200,000 .
2,157,481, 589 135, 632,803
2,983,045,768 8,837,031,140
17, 752,849,314 4,567,083, 325
11,297,718,800 222, 794,000 261,853,000
2, 930, 000 4, 460, 000
' 487
Tota l 15,221,189,800 12,079,049,5 100,195, 612 2, 731,825,107 48,222,880, 226
1 T h e Secretary of the Treasu ry is authorized to deterraine, frora t irae to t irae, t he a raounts of certain currencies, which , in his judgraen t , have been destroyed, are i r retr ievably lost or are held in collections and so wiU never be presented for rederapt ion, and to reduce the outs tanding a m o u n t thereof accordingly. T h e totals of such reduct ions effected through J u n e 30,1970, were:
Authorized b y Old Series Currency Adjus tmen t Act (31 U . S . C . 915c) approved J u n e 30, 1961: Issued before J u l y 1,1929:
U . S . n o t e s - - $24,142,000 Federal Reserve notes 34,450,000 Federa l R e s e r v e b a n k notes 2,063,000 N a t i o n a l b a n k notes 28,920,000 Gold certificates. 16,600,000 Silver certtficates 29,780,000 T rea su ry notes of 1890 1,131,000
Gold certificates, Seriesof 1928 7,^350,000 Author ized b y act approved J u n e 24, 1967 (31 U . S . C . 405a-2):
Silver certificates, issued after J u n e 30, 1929 200,000,000
Tota l 344,436,000
2 A m o u n t s ou t s tand ing are also included in the p u b h c deb t (see table 33, final page).
Digitized for FRASER http://fraser.stlouisfed.org/ Federal Reserve Bank of St. Louis

STATISTICAL APPENDIX 2 4 3
Trust and other funds
TABLE 59.—Civil service retirement and disability fund, June 30, 1970
[This trust fund was established in accordance with the provisions of the act of May 22, 1920, as amended (5 U.S.C. 2267). For further detaUs see annual report of the Secretary for 1941, p. 136]
I. RECEIPTS AND EXPENDITURES (EXCLUDING INVESTMENT TRANSACTIONS IN FEDERAL AND NON-FEDERAL SECURITIES)
Curaulative Cumulative through Fiscal year 1970 through
June 30,1969 June 30,1970
Receipts: Deductions from salaries, service credit pay
ments, and voluntary contributions of employees subject to retireraent act i $18,258,624,186.84 $1,740,420,273.46 $19,999,044,460. 30
Federal contributions 2 _ _._ 4,672,352,923.21 230,816,600.00 4,903,169.523.21 Payraents by employing agencies 2 11,748,689,928. 02 1,721,472,270.52 13,470,162,198.64 Interest and profits on investments 7,626,285,441.37 990,225,810. 66 8,616,511,252.03 Transfer from the Comptroller of the Cur
rency retireraent fund 5,050,000.00 6,060,000.00
Totalreceipts . 42,311,002,479.44 4,682,934,954.64 46,993,937,434.08
Expenditures: Annuity payraents, refunds, etc '21,789,794,271.16 2,751,326,378.18 24,541,120,649. 33 Transfers to policemen's and firemen's relief
fund, D . C , deductions and accrued interest thereon '•638,227.08 279, OIL 31 817,838.39
Total expenditures — '"21,790,332,498.23 2,751,606,989.49 24,541,938,487.72
Balance ''20,520,669,981.21 1,931,328,965.15 22,451,998.946.36
IL ASSETS HELD BY THE TREASURY DEPARTMENT
Fiscal year 1970,
Assets June 30, 1969 increase, or June 30, 1970 decrease (—)
Investments in public debt securities: Special issues, civil service retirement fund
series raaturing June 30: Treasury notes:
41^% of 1970 $69,699,000.00 —$69,699,000.00 4J^%ofl970 - . - 40,692,000.00 —40,692,000.00 4J^%ofl971 1,785,656,000.00 $1,785,656,000.00 4M%ofl974.-- 1,758,171,000.00 - 1,768,171,000.00 5^% of 1976--. 1,628,319,000.00 . „ - . . 1,628,319,000.00 63? % of 1976 - _. 2,909,267,000.00 2,909,257,000.00 7^% of 1977 2,961,729,000.00 2,951,729,000.00
Treasury bonds: 2H%ofl970 616,527,000.00 —615,627,000.00 — 2J^%ofl970 69,913,000.00 —69,913,000.00 3 ^ % of 1970 --- 60,976,000.00 —60,976,000.00 . . . 37^% of 1970 80,227,000.00 —80,227,000.00 4H%ofl970.- ._ 72,775,000.00 —72,776,000.00 2 ^ % of 1971 616,627,000.00 615,527,000.00 27^% of 1971 69,913,000.00 69,913,000.00 3 ^ % of 1971 60,976,000.00 60,976,000.00 37^% of 1971 80,227,000.00 80,227,000.00 43^% of 1971 142,474,000.00 142,474,000.00 3M%ofl972. 60,976,000.00 . . . 60,976,000.00 37^% of 1972 632,981,000.00 . . . 632,981,000.00 4H%0fl972 375,160,000.00 375,160,000.00 3M%0fl973 60,976,000.00 . : 60,976,000.00 3%% of 1973 103,448,000.00 103,448,000.00 43/8% Of 1973 552,988,000.00 552,988,000.00 3 ^ % of 1974. 60,976,000.00 60,976,000.00 3 ^ % of 1974 80,227,000.00 80,227,000.00 43^%ofl974 212,387,000.00 212,387,000.00 2^% of 1975 409,443,000.00 -217,404,000.00 192,039,000.00 3M%0fl975.. 60,976,000.00 60,976,000.00 37^% of 1975 80,227,000.00 80,227,000.00 43^% of 1975 167,167,000.00 167,167,000.00 2J^%ofl976 328,364,000.00 -151,499,000.00 176,865,000.00 3M%ofl976-.- 60,976,000.00 60,976,000.00 33^% of 1976- ..-. 80,227,000.00 80,227,000.00 43^% of 1976- 142,474,000.00 142,474,000.00 3M%ofl977 746,416,000.00 746,416,000.00
Footnotes at end of table.
Digitized for FRASER http://fraser.stlouisfed.org/ Federal Reserve Bank of St. Louis

244 19 70 REPORT OF THE SECRETARY OF THE TREASURY
TABLE 59.—Civil service retirement and disability fund, June 30,1970—(Continued)
IL ASSETS HELD BY THE TREASURY DEPARTMENT-Continued
June 30, 1969 Fiscal year 1970,
increase, or decrease (—)
June 30, 1970
Investraents in public debt securities—Continued Special issues, civil service retirement fund
Series maturing June 30:—Continued Treasury bonds:—Continued
3 ^ % of 1977 .-43^% of 1977 37^% of 1978 43^% of 1978. 43^% of 1979 4J-8%Ofl980-
$80,227,000.00 . 142,474,000.00 . 826,643,000.00 . 142,474,000.00 . 969,117,000. 00 . 969,117,000. 00 .
$80,227,000.00 142,474,000. 00 826,643,000. 00 142,474,000. 00 969,117, 000.00 969,117,000.00
Total special issues 17,306,770,000.00 $1,573,017,000.00 18,879,787,000.00
Public issues: Treasury bills Treasury notes:
5% Series A-1970 b%% Series B-1970 53^% Series A-1971-6H% Series B-1971 5 ^ % Series C-1971 7%% Series C-1971 4 ^ % Series A-1972 4M% Series B-1972 5^% Series B-1974...'. 5M% Series A-1974.. 5M% Series A-1975 6% Series B-1975 63^% Series A-1976 63^% Series B-1976 73^% Series C-1976 8% Series A-1977
Treasury bonds: 23^% of 1964r-69 (Sept. 15,1943). 4% of 1969 (Oct. 1, 1957) 4% of 1970 37^% of 1971 4% of 1972 (Nov. 15, 1962) 4% of 1972 (Sept. 15, 1962) 4% of 1973 43^% of 1973 3K%ofl974 43^% of 1974 4 ^ % of 1974 4 ^ % of 1975-85 3M% Of 1978-83 33^% of 1980 4% of 1980 334% of 1985 4K% of 1987-92 43^% of 1989-94 3K% of 1990 3% of 1996 ^y% of 1998
146,400,000. 00 . 17,000,000. 00 19,500,000.00 . 25,000,000.00 . 25,000,000.00 .
no, 600, 99,000, 61,300,
162, 500, 55,900,
328,750, 10,000, 10,000,
000.00 . 000.00 . 000.00 . 000.00 . 000.00 . 000.00 . 000.00 . 000.00 .
16,400, 60,400, 54,600, 6,100, 5,350,
28,700, 23,800, 33,600, 53, 650, 57,900, 129,060, 53,105, 16,800, 15,700,
no, 394, 85, 900,
347,920, 10, 750, 98,600, 55,205, 83,269,
000. 00 000.00 000.00 . 000.00 . 000.00 . 000.00 . 000.00 . 000.00 . 000.00 . 000.00 . 000.00 . 000.00 . 000.00 . 000.00 . 000.00 . 000.00 . 000.00 . 000.00 . 000.00 . 000.00 . 000.00 .
100,000,000. 00
'-i7,'6oo,'oo6.'oo".
'""94,'366,"6o6."oo
76,800,000.00 42,250,000. 00
-16,400,000.00 . -60,400,000.00 .
100,000,000. 00
146,400,000. 00
19, 500, 25,000, 26,000, 94,300,
no, 600, 99,000, 61,300,
162, 500, 55,900,
328,750, 10,000, 10,000, 76,800, 42,250,
000.00 000.00 000.00 000.00 000. 00 000. 00 000. 00 000. 00 000.00 000. 00 000.00 000. 00 000. 00 000. 00
54,600, 6,100, 5,350,
28,700, 23,800, 33,600, 53,650, 57,900, 129,060, 53,105, 16,800, 15,700,
no, 394, 85,900,
347,920, 10,750, 98,600, 55,205, 83,269,
000. 00 000.00 000.00 000. 00 000.00 000.00 000. 00 000.00 000.00 000.00 000.00 000.00 000.00 000.00 000.00 000.00 000.00 000. 00 000.00
Total public issues 2,418,153,000.00 219,550,000.00 2,637,703,000.00
Federal National Mortgage Association secondary raarket operations debentures:
by% of 1969 6% of 1969. 6M%ofl970
25,000,000. 00 41,500,000.00 20,000,000. 00 .
-25,000,000. 00 , -41,600,000. 00 .
20,000,000. 00
Total non-Federal securities. 86,600,000.00 -66,600,000.00 20,000,000.00
Footnotes at end of table.
Digitized for FRASER http://fraser.stlouisfed.org/ Federal Reserve Bank of St. Louis

STATISTICAL APPENDIX 245
T A B L E 59.—Civil service retirement and disability fund, June 30,1970—(Continued)
IL ASSETS HELD BY THE TREASURY DEPARTMENT-Continued
Assets June 30, 1969 Fiscal year 1970,
increase, or decrease (—)
June 30, 1970
Investments in agency securities: Government National Mortgage Association
participation certificates: Federal assets liquidation trust:
5% of 1972 63^% of 1972 5.20% of 1982
Federal assets finance trust: 6% of 1971.. 6.40% of 1987 6.05% of 1988 6.45% of 1988 Qy% of 1978
Total agency securities..
Total investments. Undisbursed balance.
$50,000,000.00 . 50,000,000.00 .
100,000,000.00 .
35,000,000.00 . 75,000,000. 00 . 65,000,000.00 . 35,000,000.00 .
100,000,000. 00 .
510,000,000.00 .
$50,000,000. 00 50,000,000. 00
100,000,000. 00
35,000,000. 00 75,000,000. 00 65,000,000. 00 35,000,000. 00
100,000,000. 00
610,000,000. 00
20.321,423,000.00 »• 199,246,981. 21
1,726,067,000. 00 205,261,965.16
22,047,490,000.00 404,508,946. 36
Totalassets »• 20,620,669,98L21 1,931,328,965.15 22,451,998,946.2
I- Revised. 1 Basic corapensation deductions have been at the rate of 63^ percent since the day before the first pay
period which began after Sept. 30, 1956. Since 1958 District of Colurabia and Governraent corporations' contributions have been included with contributions from agency salary funds.
2 Begimiing July 1, 1957, appropriations are not made directly to the fund. Instead, in accordance with the act approved July 31, 1956 (6 U.S.C. 2254(a)), the employing agency contributes (from appropriations or funds from which the salaries are paid) amounts equal to the deductions from employees' salaries.
Digitized for FRASER http://fraser.stlouisfed.org/ Federal Reserve Bank of St. Louis

246 19 70 REPORT OF THE SECRETARY OF THE TREASURY
T A B L E 60.—Employees health benefits fund. Civil Service Commission, June 30, 1970
[On basis of reports from the CivU Service Comraission. This trust revolving fund was established in accordance with the provisions of the act of Sept. 28, 1959, as amended (5 U.S.C. 3007)]
I. RECEIPTS AND EXPENDITURES (EXCLUDING INVESTMENT TRANSACTIONS
Cumulative Cumulative through Fiscal year 1970 through
June 30,1969 June 30, 1970
Receipts: Direct appropriations $135,131,000.00 $31,139,000.00 $166,270,000.00 Employees' and annuitants' withholdings 2,931,752,277. 66 671,373,782. 30 3,603,126,059. 96 Agency contributions. 1,348,916,247.84 203,334,882.30 1,552,251,130.14 Interest and profits on investments 20,718,676.09 6,960,839.48 27,679,515.57
Totalreceipts. 4,436,518,20L59 912,808,504.08 5,349,326,705. 67
Expenditures: Subscription charges paid to carriers 4,218,096,329. 57 864,742,048. 06 5,082,838,377. 63 Contingency reserve paid to carriers 78,062,534.71 49,862,332.00 127,924,866.71 Carrier refunds -253,289.40 -253,289.40 Adrainistrative expenses 10,971,131.50 1,166,838.30 12,137,969.80 Interest on administrative expenses paid by em
ployees'life insurance fund i 43,625.79 43,625.79 Other2 -1,618,523.08 100,803.66 -1,517,719.42
Total expenditures 4,305,301,809.09 915,872,022.02 5,221,173,831.11
Balance 131,216,392.50 -3,063,517.94 128,152,874.56
IL ASSETS HELD BY THE TREASURY DEPARTMENT
Fiscal year 1970 Assets June 30, 1989 increase, or June 30,1970
decrease (—)
Investraents in public debt securities: Public issues:
Treasmy biUs $588,000.00 -$338,000.00 $250,000.00 Treasury notes:
6^% Series B 1970 1,951,000.00 -1,951,000.00 6M% Series C 1970 7,442,000.00 -7,442,000.00 5 ^ % Series B 1974 423,000.00 423,000.00 5M% Series A 1975 1,298,000.00 1,298,000.00 6% Series B 1975 40,000,000.00 40,000,000.00 6J^% Series A 1976 1,602,000.00 1,602,000.00 73^% Series C 1976.. 1,000,000.00 1,000,000.00
Treasury bonds: 4% of 1969 (dated Oct. 1, 1957) 1,000,000.00 -1,000,000.00 4% of 1970 - 4,093,000.00 -4,093,000.00 3K%ofl971 6 804 000.00 5,804,000.00 4%ofl971 3,732,000.00 3,732,000.00 4% of 1972 (dated Sept. 15, 1962) 4,410,500.00 4,410,500.00 4%of 1972 (dated Nov. 16, 1962)... 3,792,500.00 3,792,500.00 4% of 1973 3,441,500.00 3,441,500.00 43^% of 1973 2,246,000.00 2,246,000.00 3>^%ofl974.... 3,785,500.00 3,785,500.00 43^% of 1974... 9,923,500.00 9,923,500.00 434% of 1974 ---- 1,481,500.00 1,481,500.00 3 ^ % of 1978-83 190,000.00 190,000.00 33^% of 1980 738,000.00 738,000.00 434% of 1987-92.... 3,000,000.00 3,000,000.00 33^% of 1990 2,130,500.00 2,130,500.00 33^% of 1998 3,950,000.00 3,950,000.00
Total investraents 106,699,500.00 -13,401,000.00 93,198,500.00 Undisbursed balance. 24,616,892.50 10,337,482.06 34,954,374.56
Totalassets 131,216,392.50 -3,063,517.94 128,152,874.56
1 As provided in the act (6 U.S.C. 3008(a)). 2 Dift'erence between cost and face value of investraents.
Digitized for FRASER http://fraser.stlouisfed.org/ Federal Reserve Bank of St. Louis
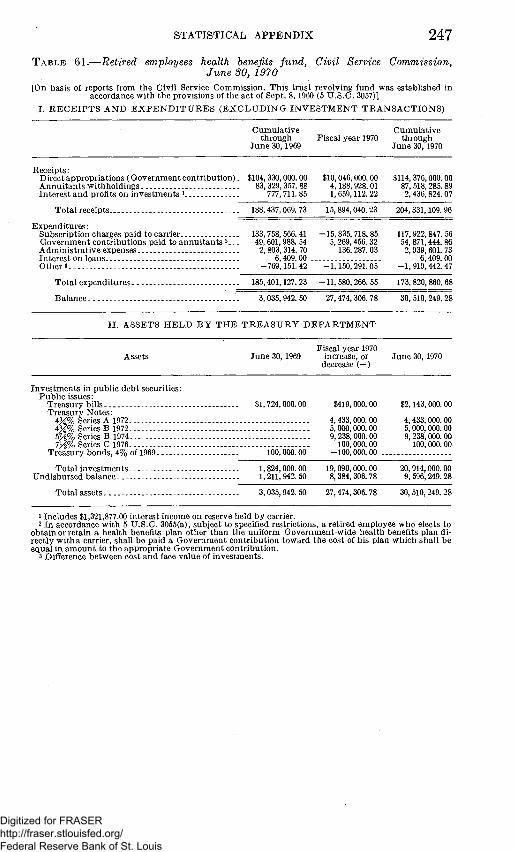
STATISTICAL APPENDIX 2 4 7
TABLE 61.—Retired employees health benefits fund. Civil Service Commission, June 30, 1970
[On basis of reports from the CivU Service Commission. This trust revolving fund was established in accordance with the provisions of the act of Sept. 8,1960 (5 U.S.C. 3057)]
I. RECEIPTS AND E X P E N D I T U R E S (EXCLUDING INVESTMENT TRANSACTIONS)
Cumulative Cumulative through Fiscal year 1970 through
June 30,1969 June 30,1970
Receipts: Direct appropriations (Government contribution). $104,330,000. 00 $10,046,000.00 $114,376,000.00 Annuitants withholdings 83,329.357.88 4,188,928.01 87,518,285.89 Interest and profits on investments 1 777,71L85 1,659,112.22 2,436,824.07
Totalreceipts 188,437,069.73 15,894,040.23 204,331,109.96
Expenditures: Subscription charges paid to carrier 133,758, 566. 41 -15,835,718. 85 117,922,847. 56 Government contributions paid to annuitants 2.. . 49, 601,988. 54 5,269,456. 32 54,871,444. 86 Administrative expenses 2,803,314.70 136,287.03 2,939,60L73 Interest on loans 6,409.00 6,409.00 Other3 -769,151.42 -1,150,291.05 -1,919,442.47
Total expenditures 185,401,127.23 -11,580,266.55 173,820,860.68
Balance. . 3,035,942.50 27,474,306.78 30,510,249.28
II . A.SSETS HELD BY THE TREASURY DEPARTMENT
Fiscal year 1970 Assets June 30,1969 increase, or June 30,1970
decrease (—)
Investments in public debt securities: Public issuGS'
Treasuryb'ills $1,724,000.00 $419,000.00 $2,143,000.00 Treasury Notes:
4 ^ % Series A 1972 4,433,000.00 4,433,000.00 4 ^ % Series B 1972 5,000,000.00 5,000,000.00 5^% Series B 1974 9,238,000.00 9,238,000.00 73^% Series C 1976 100,000.00 100,000.00
Treasury bonds, 4% of 1969 100,000.00 -100,000.00
Total investments... 1,824,000.00 19,090,000.00 20,914,000.00 Undisbursed balance 1,211,942.50 8,384,306.78 9,596,249.28
Totalassets 3,035,942.50 27,474,306.78 30,510,249.28
1 Includes $1,321,877.00 interest income on reserve held by carrier. 2 In accordance with 5 U.S.C. 3055(a), subject to specified restrictions, a retired employee who elects to
obtain or retain a health benefits plan other than the uniforra Governraent-wide health benefits plan directly witha carrier, shall be paid a Governraent contribution toward the cost of his plan which shall be equal in araount to the appropriate Governraent contribution.
3 Difierence between cost and face value of investments.
Digitized for FRASER http://fraser.stlouisfed.org/ Federal Reserve Bank of St. Louis

248 1970 REPORT OF THE SECRETARY OF THE TREASURY
TABLE 62.—Employees' life insurance fund, Civil Service Commission, June 30,1970
[On basis of reports from the Civil Service Comraission. This trust revolving fund was established in accordance with the provisions of the act of Aug. 17,1964, as araended (6 U.S.C. 8714)]
L RECEIPTS AND EXPENDITURES (EXCLUDING INA^ESTMENT TRANSACTIONS)
Cumulative Fiscalyear Cumulative through 1970 through
June 30, 1969 June 30, 1970
Receipts: Employees' withholdings $1,684,294,960.02 $277,293,254.91 $1,861,688,204.93 Government contributions : . . 760,029,678.97 115,071,226.60 875,100,904.67 Preraiuras collected frora beneficial association
members - 37,864,696.54 2,659,163.34 40,513,859.88 Interest and profits on investments 124,672,676. 00 28,888,984.70 163,661,560. 70 Other -. 100,835.87 17,716.81 118,552.68 Assets acquired frora beneficial associations:
U.S. securities 13,958,336.40 13,958,336.40 Other 8,174,16L72 13,865,437.65 22,039,599.27
Totalreceipts 2,529,086,235.52 437,795,782.91 2,966,881,018.43
Expenditures: Preraiuras paid to insurance companies:
For Federal employees generaUy 2,296,722,205.64 387,401,286.39 2,684,123,491.93 Less return of premiuras paid 1 456,206,007.27 101,707,819.98 557,913,827.25
For beneficial association raerabers 67,709,713.54 6,671,212.24 74,280,925.78 Less return of premiuras paid 2 12,686,68L58 1,736,966.81 14,322,647.39
Administrative expenses . 3,644,603.77 463,989.00 4,108,492.77
Other3 -24,181,940.30 -13,971,054.18 -38,162,994.48
Total expenditures - - - 1,875,102,793.70 277,020,647.66 2,162,123,44L 36
Balance 653,982,44L 82 160,776,135.26 814,757,577.07
Footnotes at end of table.
Digitized for FRASER http://fraser.stlouisfed.org/ Federal Reserve Bank of St. Louis

STATISTICAL APPENDIX 249
TABLE 62.—Employees' life insurance fund. Civil Service Commission, June 30, 1970—Continued
II. ASSETS HELD BY THE TREASURY DEPARTMENT
June 30,1969 Fiscal year 1970
increase, or decrease (—)
June 30, 1970
Investments in public debt securities: Special issues, employees' life insurance fund series
maturing June 30: Certificate of indebtedness:
6.10% of 1969 7.13% of 1970
Total special issues.
Public issues: Treasury biUs Treasury notes:
5% Series A-1970 5H% Series C-1971 4M% Series A-1972 4 ^ % Series B-1972 13^% Series EA-1974 . . . . . 5 ^ % Series B-1974 by% Series A-1974 5M% Series A-1975 6% Series B-1975 6y% Series A-1976 63^% Series B-1976 7^% Series C-1976 8% Series A-1977
Treasury bonds: 23^% of 1964-69 (dated Sept. 15,1943).. 2 ^ % of 1966-71... 4% of 1969 3K% of 1971 4% of 1971 4% of 1972 (dated Sept. 16,1962) 4% of 1972 (dated Nov. 15, 1962) 4% of 1973 43^% of 1973. 4H% of 1974.... 4>^% of 1974 3>g% of 1974.. 434% of 1975-85.. 3K% of 1978-83 33* % of 1980 4% of 1980 SH% of 1985. 434% of 1987-92 4% of 1988-93 43^% of 1989-94 33^% of 1990 3% of 1995 33^% of 1998 23^% Investraent Series B-1975-80
. $50, 000, 000. 00
50, 000, 000. 00
-$50,000,000.00 .. 60,000, 000. 00
10, 000, 000. 00
$60,000.000.00
60,000,000. 00
14,155, 000. 00 -10,925, 000. 00
6,450, 000. 00 6, 225, 000. 00
32, 072, 000. 00 23,661, 000. 00 30, 656, 000. 00 22,105,000.00 . 5,497,000.00 . 5, 500, 000. 00
5,000, 3,864, 15,330, 2,806, 15,000, 12,000, 5,783, 2,000, 13,373, 26,244, 30,861, 25,370, 40,612, 13,087, 18,056, 46,696, 8,486, 53,791, 16,877, 33,783, 31,276,
135, 21,358,
179,
000. 00 500. 00 . 000. 00 500.00 . 000.00 . 000. 00 000. 00 000. 00 000. 00 500. 00 000. 00 000. 00 000.00 . 000.00 . 500.00 . 500. 00 500.00 . 000.00 . 500.00 . 500.00 . 000.00 . 500. 00 . 500.00 . 000. 00 .
513, 150,
15,474, 10,855, 2,000,
37, 541, 16,984, 25,600,
000.00 000.00 000.00 000.00 000.00 000.00 000.00 000.00
2,000,000. 00 20,330,000.00 1,798,000. 00
-6,000,000. 00 .
-i5,'330,"oo5.'oo'.
4,000,000.00 11,608,600.00 9,061,000. 00 5,949,000.00 6,600,000.00 12,500,000. 00
226,500. 00
Total investraents. Undisbursed balance
638,193,000. 00 15,789,441. 82
161,560,000. 00 -784,864. 75
3,230,000. 00
513, 150,
21,924, 17,080, 2,000,
69,613, 40,645, 56,256, 22,105, 5,497, 7, 500, 20,330, . 1,798,
000. 00 000. 00 000.00 000. 00 000. 00 000. 00 000. 00 000. 00 000.00 000.00 000.00 000.00 000. 00
3,864,600.00
2,806, 15,000, 16,000, 17,391, 11,061, 19,322, 31,744, 43,361, 26,596, 40,612, 13,087, 18,056, 47,321, 8,486,
63,791, 16,877, 33,783, 31,276,
135, 21,358,
179,
500. 00 000.00 000. 00 500. 00 000. 00 000. 00 500. 00 000. 00 600. 00 000. 00 000. 00 500. 00 500.00 500. 00 000. 00 600. 00 500.00 000.00 600. 00 500. 00 000.00
Total public issues 588,193,000.00 151,560,000 00 739,753,000.00
799,753,000. 00 16,004,577.07
Totalassets _ 653,982,44L 82 160,775,135.25 814,757,577.07
1 Premium payments in excess of the $100 million contingency reserve set by the CivU Service Coraraission, which are requhed to be retm-ned to the fund by the insuring corapanies (5 U.S.C. 8712).
2 Return of preraiura payments in excess of annual claims paid, expenses, and other costs. 3 Difference between cost and face value of investments.
Digitized for FRASER http://fraser.stlouisfed.org/ Federal Reserve Bank of St. Louis

250 19 70 REPORT OF THE SECRETARY OF THE TREASURY
T A B L E 63.—Federal disability insurance trust fund, June 30, 1970
[This trust fund was established in accordance with the provisions of the Social Security Act amendments approved Aug. 1, 1956 (42 U.S.C. 401(b))]
I. RECEIPTS AND EXPENDITURES (EXCLUDING INVESTMENT TRANSACTIONS IN FEDERAL AND NON-FEDERAL SECURITIES)
Cumulative Cumulative through Fiscal year 1970 through
June 30, 1969 June 30,1970
Receipts: Appropriations! $17,384,471,110.17 $3,808,430,010.31 $21,192,901,120.48
Less refund of internal revenue coUections. -192,100,000.00 -38,487,500. 00 -230, 587, 500. 00 Deposits by States 1,429,050,791.04 371,415,571.03 1,800,466,362.07 Interest and proflts on investments 2 783,917, 739.81 222, 635,375.98 1,006, 743, 542. 79 Payments frora railroad retheraent account. 26,831,000.00 26,831,000.00 Other (HEW) 708,927.76 3 93,945.06 749,214.82 Transfers from general fund 64,000,000.00 16,000,000.00 80,000,000. 00
Totalreceipts 19,496,879,568.78 4,380,087,402.38 23,877,103,740.16
Expenditures: Benefit payments 14,677,222,402.83 2,777,987,936.59 17,455,210,339.42 To raUroad rethement account 175,875,000.00 10,439,000.00 186,314,000.00 Admhiistrative expenses:
To general fund 51,833,106.54 7,539,058.01 59,372,164.55 Salaries and expenses 339,280,366.45 135,339,715.00 474,620,081.45 Construction of buildmgs 2,776,458.00 1,861,977.96 4,638,435.96
Vocational RehabUitation—Administrative expenses - 1,074,000.00 335,160.00 1,409,160.00
Vocational rehabUitation program payraent. 38,311,440. 83 16,486,601.36 54,798,042.19 To Federal Suppleraentary Medical Insur
ance Trust Fund 3,813,782.00 3,813,782.00 To Federal old-age and sm-vivors insurance
trustfund 531,576,185.00 360,837.00 531,937,022.00 From Federal hospital hisurance trust fund. -235,948.00 -235,948.00
Total expenditmes 15,817,713,011.65 2,954,164,067.92 18,771,877,079.57
Balance 3,679,166,567.13 1,426,060,103.46 5,105,226,660.59
II. ASSETS HELD BY THE TREASURY D E P A R T M E N T
Fiscal year 1970 Assets June 30, 1969 increase, or June 30,1970
decrease (—)
Investraents in public debt securities: Special issues, Federal disability insurance
trust fund series maturing June 30: Treasury notes:
4 ^ % of 1971 $6,486,000.00 -$2,000,000.00 $4,486,000.00 4 ^ % of 1974. 309,178,000.00 309,178,000.00 5 ^ % of 1975. 583,612,000.00 583,612,000.00 63^%ofl976 1,151,608,000.00 1,151,608,000.00 7^% of 1977 1,394,466,000.00 1,394,466,000.00
Treasury bonds:. 2 ^ % of 1974 77,006,000.00 77,006,000.00 3M%ofl974 20,738,000.00 20,738,000.00 25^% of 1976 132,894,000.00 132,894,000.00 3M%ofl975... 20,738,000.00 20,738,000.00 3M%0fl976 153,632,000.00 153,632,000.00 3M%0fl977 153,632,000.00 153,632,000.00 3 ^ % of 1978 153,632,000.00 153,632,000.00 43^% of 1979... 153,632,000.00 . 153,632,000.00 43^% of 1980 1.. 125,606,000.00 125,606,000.00
Total special issues 3,042,394,000.00 1, 392,466,000.00 4,434,860,000.00
Footnotes at end of table.
Digitized for FRASER http://fraser.stlouisfed.org/ Federal Reserve Bank of St. Louis

STATISTICAL APPENDIX 251
T A B L E 63.—Federal disability insurance trustfund, J u n e 30, 1970—Continued
II. ASSETS HELD BY THE TREASURY DEPARTMENT-Continued
Assets June 30, 1969 Fiscal year 1970
increase, or decrease (—)
June 30, 1970
$26,000,000. 00 10, 000,000. 00
-26,000,000.00 . -10,000,000.00 .
Public issues: Treasury notes:
5M% series A-1975 $10,000,000.00 6% series B-1975 3,750,000.00 73^% series C-1976 8% series A-1977
Treasury bonds: 4% of 1969 (dated Oct. 1, 1957) 26, 000,000.00 4% of 1970 (dated Jan. 15, 1965) 10, 000,000. 00 4% of 1970 (dated June 20,1963) 14,000, 000. 00 4% of 1972 (dated Nov. 15, 1962) 2,000,000.00 4% of 1972 (dated Sept. 15, 1962) 2, 000, 000. 00 4% of 1973 16,500,000.00 3J^%of 1974 5,000,000.00 43/g%of 1974 10,000,000.00 434% of 1975-85 20,795,000.00 4% of 1980 30,250,000.00 434% of 1987-92 80,800,000.00 43/g% of 1989-94 68,400,000.00 33^% of 1990... 10,500,000.00 3 ^ % of 1998 5,000,000.00
Total public issues 314,995, 000. 00
Investments in non-Federal secmities: Federal National Mortgage Association,
secondary market operations debentures:
6M%ofl970
Total non-Federal securities
Investraents in agency securities: Government National Mortgage Associa
tion participation certificates: Federal assets liquidation trust:
53^% of 1972 50,000,000.00 Federal assets finance trust:
6.35% of 1970 50,000,000.00 -50,000,000.00 6.30%ofl971
Total agency securities
Total investments—par value Undisbm-sed balance
Subtotal • Unamortized discount and premimn on in
vestments (net)
Totalassets 3,677,639,220.93 1,426,056,95L 41
$10, 000, 000. 00 3, 750, 000. 00 26, 000, 000. 00 10, 000, 000. 00
14, 000, 2, 000, 2, 000, 16, 500, 5, 000, 10,000, 20,795, 30,250, 80,800, 68,400, 10, 500, 5, 000,
000. 00 000. 00 000. 00 000. 00 000. 00 000. 00 000. 00 000.00 000. 00 000. 00 000.00 000.00
314, 995, 000. 00
20,000,000.00
20,000,000.00 .
20,000,000.00
20 noo onn nn
50, 000, 000. 00
15,000,000.00 .
115,000, 000. 00
. 3,492,389, 000. 00 186, 777, 557.13
- 3, 679,166,557.13
-1,627,336.20
-50,000,000.00
1, 342,466, 000. 00 83, 594,103. 46
1,426, 060,103. 46
-3,152.05
15, 000,000. 00
65, 000, 000. 00
4, 834,855,000. 00 270, 371, 660.59
5,106, 226, 660. 59
— 1 , 630,488. 25
5,103, 596,172. 34
1 Appropriations are equal to the araount of eraployraent taxes collected as estiraated by the Secretary of the Treasm-y and adjusted in accordance with wage reports certified by the Secretary of Health, Education, and Welfare for distribution to this fund, the Federal old-age and survivors insurance trust fund, and the Federal hospital insurance trust fund.
2 Through June 30, 1967, includes amortization of preraiura and discount, net. 3 Includes $70,706.00 reiraburseraent of interest frora Federal old-age and survivors insurance trust fund
and $13,175.00 reiraburseraent of interest frora Federal hospital insurance trust fund. 4 Includes the foUowing balances in accounts as of June 30:
1969 1970 Benefit payraents Vocational rehabilitation program payments.
$186, 874, 734. 48 -97,177. 35
$269, 275, 734. 30 1, 095, 926. 29
409-714—71- -17
Digitized for FRASER http://fraser.stlouisfed.org/ Federal Reserve Bank of St. Louis

252 19 70 REPORT OF THE SECRETARY OF THE TREASURY
T A B L E 64.—Federal hospital insurance trust fund, J u n e 30, 1970
[This trust fund was established in accordance with the provisions of the Social Security Act araendraents approved July 30, 1965 (42 U.S.C. 1395(i))]
I. RECEIPTS AND EXPENDITURES (EXCLUDING IN\^ESTMENT TRANSACTIONS IN FEDERAL AND NON-FEDERAL SECURITIES)
Curaulative Cumulative through Fiscal year 1970 through
June 30,1969 June 30,1970
Receipts: Appropriations ' $10,674, 295,820. 66 $4,389,125,227.96 $15,063,421,048.62
Less refund of internal revenue collections. -97,550,000.00 -49,200,000.00 -146,750,000.00 Deposits by States 958,020,680.43 444,864,029.27 1,402,884,709.70 Interest and profits on investments 2. 208,604,731. 73 133,444,614. 22 342,049,345. 95 Transfers from general fund. 1,392,449,324.42 628,262,000.00 2,020,711,324.42 Payments from railroad retirement accounts. 114, 522,000.00 63, 537,000. 00 178,059,000. 00 Other 738,339.98 34,519,864.88 5,258,204.86
Totalreceipts 13,251,080,897.22 5,614,552,736.33 18,865,633,633.55
Expenditures: Benefit payments.. 10,898,091,833.79 4,804,242,482.90 15,702,334,316.69 Administrative expenses:
To general fund. 17,139,558.03 6,219,936.56 23,359,494.59 To Federal old-age and survivors insurance
trustfund 52,867,519.00 13,307,475.00 66,174,994.00 To Federal disabihty insurance trust
fund. 249,123.00 249,123.00 Salaries and expenses 258,493,083.18 125,729.230.00 384,222,313.18 Construction 615,876.15 615,876.15
Public health services... 7,722,000.00 3,555,000.00 11,277,000.00
Total expenditures 11,234,563,117.00 4,953,670,000.61 16,188,233,117.61
Balance 2,016.517.780.22 660,882,735.72 2,677.400,515.94
Footnotes at end of table.
Digitized for FRASER http://fraser.stlouisfed.org/ Federal Reserve Bank of St. Louis

STATISTICAL APPENDIX 253 T A B L E Q4i.^Federal hospital insurance trust fund, June 30, 1970—Continued
II. ASSETS HELD BY THE TREASURY DEPARTMENT
Assets June 30,1969 Fiscal year 1970
increase, or decrease (—)
June 30,1970
Investraents in public debt securities: Special issues. Federal hospital insurance
trust fund series raaturing June 30: Treasury notes:
47^% of 1971 4 ^ % of 1972 434% of 1973 4K%ofl974 55^% of 1976-63^% of 1976 .. 7^% of 1977
$157,770,000. 00 46,131,000. 00 46,131,000. 00
415,179,000. 00 . 495,529,000.00 . 729,200,000.00 .
—$157,770,000.00 . —46,131,000.00 . —22,075,000. 00
919,358,000. 00
$24,056,000. 00 415,179,000. 00 495,529,000. 00 729,200,000. 00 919,358,000. 00
Total special issues 1,889,940,000.00 693,382,000. 00 2,583,322,000. 00
Investraents in non-Federal securities: Federal National Mortgage Association
secondary raarket operations debentures: 6% of 1969 41,500,000.00
Total non-Federal securities 41,600,000. 00
-41,500,000.00 .
—41,500,000.00 .
Investraents in agency securities: Governraent National Mortgage Association
participation certificates: Federal assets liquidation trust:
5.20% of 1982 Federal assets finance trust:
.6.30% of 1971
50,000,000. 00 .
20,000,000. 00 .
50,000,000. 00
20, 000, 000. 00
Total agency securities. 70,000,000. 00 . 70,000,000. 00
Total investments par value 2,001,440,000. 00 Undisbursed balance 15,077,780.22
651,882,000. 00 9,000,735. 72
2,653, 322, 000. 00 24,078,515. 94
Subtotal 2,016,517,780.22 660,882,735.72 Unamortized discount and premiura on in
vestments (net). 3,602.31 —3,602.31
2,677,400,515.94
Totalassets 2,016,521,382.53 660,879,133.41 2,677,400,515.94
1 Appropriations are equal to the amount of employment taxes coUected as estiraated by the Secretary of the Treasmy and adjusted in accordance with wage reports certified by the Secretary of Health, Education, and Welfare for distribution to this fund, the Federal old-age and survivors insurance trust fund, and the Federal disability insurance trust fund.
2 Through June 30, 1967, includes araortlzatlon of premium and discount, net. 3 Includes: $4,511,000.00 reimbursement of interest frora Federal Suppleraentary Medical Insurance Trust
Fund.
Digitized for FRASER http://fraser.stlouisfed.org/ Federal Reserve Bank of St. Louis

254 19 70 REPORT OF THE SECRETARY , OF THE TREASURY
TABLE 65.—Federal supplementary medical insurance trust fund, June 30, 1970
[This trust fund was established in accordance wdth the provisions of the Social Security Act araendraents approved July 30, 1965 (42 U.S.C. 1395(t))]
L RECEIPTS AND EXPENDITURES (EXCLUDING INVESTMENT TRANSACTIONS)
Cumulative through
June 30, 1969 Fiscal year 1970
Cumulative through
June 30, 1970
Receipts: Premiums transferred from Federal old-age
and survivors insurance trust fund, Federal disability insurance trust fund, railroad retirement account, and civil service retirement and disabihty fund $1,862, 575,331.06 $763,515,823. 79 $2,626,091,154. 85
PremiuraS' deposited by States. 161,014,284,60 97,208,601. 66 258,222,886. 26 Preraium collections by Social Security
Administration 224,377,972.54 75,275,522.48 299,653,495.02 Federal matching contributions 2,241,286,675.58 928,151,000.00 3,169,437,675.58 Interest on investraents 58,659,in.40 16,141,780.33 74,800,89L73 MisceUaneous incorae 648,660.72 15,672.71 664,333.43
Total receipts 4,548, 562,035.90 1,880,308,400.97 6,428,870,436.87
Expenditures: Benefit payraents 3,698,725,272. 26 1,979,287,386. 33 5,678,012,658. 59 Interest paid to Federal Hospital Insurance
Trust Fund 4,511,000.00 4,511,000.00 Administrative expenses:
Salaries and expenses 452,876,750.00 219,325,525.00 672,202,275.00 Construction of buildings 683,860.89 683,860.89 To general fund 33,664.14 26,216.07 59,880.21 To CivU service 199,678.76 22,098.00 221,776.76 To Federal Disability Insurance Trust
Fund -3,813,782.00 -3,813,782.00 To Federal old-age and survivors insur-
sance trust fund 14,767,537.00 94,707.00 14,862,244.00 To Public Health Service.- 4,185,000.00 765,000.00 4,950,000.00
Total expenditmes 4,170,787,902.16 2, 200,902, OIL 29 6,371,689,913.45
Balance. 377,774,133.74 -320,593,610.32 57,180,523.42
II. ASSETS HELD BY THE TREASURY DEPARTMENT
June 30, 1970 Fiscal year 1970,
Assets June 30, 1969 increase, or decrease (—)
Investments in pubhc debt securities: Special issues. Federal suppleraentary raedi
cal insurance trust fund series, maturing June 30:
Treasury notes: 4 ^ % of 1974- $134,238,000.00 -$134,238,000.00 . 5^% of 1975 6,527,000.00 -6,527,000.00 . 63^% of 1976 217,206,000.00 -206,644,000.00 7^% of 1977 2,855,000.00
Total investments 357,971,000.00 -344, 554,000.00 Undisbursed balance 19,803,133. 74 23,960,389.68
Totalassets 377,774,133.74 -320,593,610.32
$10, 562, 000. 00 2, 855,000. 00
13, 417,000. 00 43, 763, 523. 42
57,180, 523. 42
Digitized for FRASER http://fraser.stlouisfed.org/ Federal Reserve Bank of St. Louis
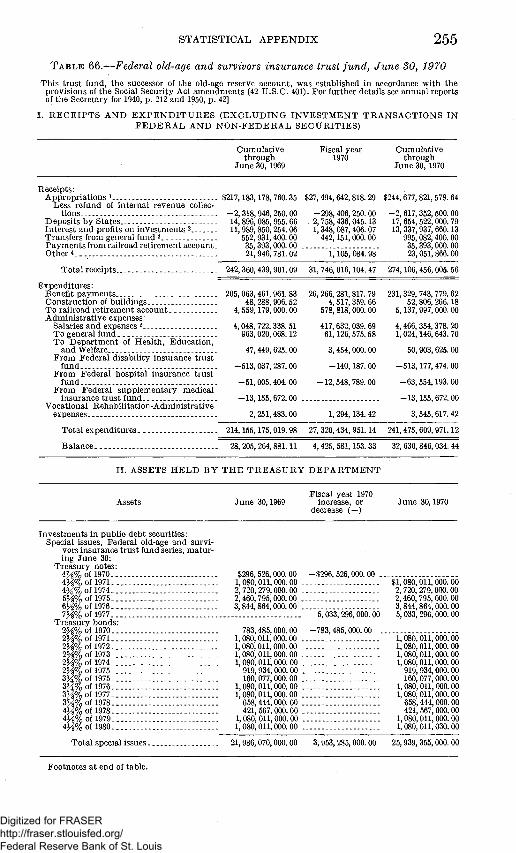
STATISTICAL APPENDIX 255
T A B L E 66.—Federal old-age and survivors insurance trust fund, June 30, 1970
Thi s t rus t fund, the successor of the old-age reserve account , was established in accordance wi th t h e provisions of the Social Secm-ity Act a m e n d m e n t s (42 U .S .C . 401). For further details see annua l reports of the Secretary for 1940, p . 212 and 1950, p . 42]
I . R E C E I P T S A N D E X P E N D I T U R E S ( E X C L U D I N G I N V E S T M E N T T R A N S A C T I O N S I N F E D E R A L A N D N O N - F E D E R A L S E C U R I T I E S )
Cumulative through
June 30, 1969
Fiscal year 1970
Cumulative through
June 30, 1970
Receipts : Appropr ia t ions i $217,183,178, 760.35 $27,494,642,818. 29 $244,677, 821,578.64
Less refund of in ternal revenue collect ions -2,318,946,250.00 -298,406,260.00 -2,617,352,500.00
Depos i t s b y States 14,896,085,955.66 2,758,436,045.13 17,654,522,000.79 In teres t and profits on inves tmen t s 2 11,989,850,254.06 1,348,087,406.07 13,337,937, 660.13 Transfers from general fund 3 552,931,400.00 442,151,000.00 995,082,400.00 P a y m e n t s from railroad re t i rement account . 35,393,000. 00 35,393,000.00 Other 4__. 21,946,781.02 1,105,084.98 23,051,866.00
T o t a l receipts 242,360,439,901.09 31,746,016,104.47 274,106,456,005.56
Expendi tu res : Benefit p a y m e n t s 205,063,461,961. 83 26,266, 281,817. 79 231,329,743, 779. 62 Const ruc t ion of bui ldings 48,288,906.62 4,617,359.66 62,806,266.18 T o railroad ret ireraent account 4,559,179,000. 00 578,818,000.00 6,137,997,000.00 Adra in is t ra t ive expenses:
Salaries and expenses 5 4,048,722,338.61 417,632,039.69 4,466,354,378.20 T o general fund 963,020,068.12 61,126,575.58 1,024,146,643.70 T o D e p a r t m e n t of Hea l th , Educa t ion ,
and Welfare 47,449,625.00 3,454,000.00 50,903,625.00 F r o m Federa l disabil i ty insurance t rus t
fund -613,037,287.00 -140,187.00 -513,177,474.00 F r o m Federa l hospi tal insurance t rus t
fund -51,005,404.00 -12,648,789.00 -63,554,193.00 F ro ra Federa l suppleraentary raedical
insurance t rus t fund -13,165,672.00 -13,155,672.00 Vocational RehabUita t ion-Adrainis t ra t ive
expenses 2,251,483.00 1,294,134.42 3,545,617.42
To ta l expendi tures 214,155,175,019.98 27,320,434,951.14 241,475,609,971.12
Balance 28, 205, 264, 88L 11 4,425,581,153.33 32,630,846,034.44
I I . A S S E T S H E L D B Y T H E T R E A S U R Y D E P A R T M E N T
J u n e 30,1969 .Fiscal year 1970
increase, or decrease (—)
June 30,1970
Inves t raents in pub l ic deb t securities: Special issues, Federal old-age and survi
vors insurance t rus t fund series, raaturing J u n e 30:
Treasury notes: " % of 1970
4K^%of 1971._ 43<%of l974 . - . 5 M % o f l 9 7 5 . . . 63^% of 1976--. 7 H % 0 f l 9 7 7 . . .
T reasu ry bonds : 2 H % o f 1970. . . 2 H % o f 1971- . . 25^% of 1972. . . 2 H % o f l 9 7 3 . . . 2 ^ % of 1974. . . 2 ^ % of 1975. . . 3 % % of 1975. . . 3 M % o f l 9 7 6 . _ . 3 J ^ % o f l 9 7 7 . - . 3 > g % o f l 9 7 8 . . . 43^% of 1978. . . 43^% of 1979. . 43^% of 1980. . .
$296,526,000.00 -$296,526,000.00 _. 1,080,011,000.00 $1,080,011,000.00 2,720,279,000.00 2,720,279,000.00 2,460,795,000.00 2,460,795,000.00 3,844,864,000.00 3,844,864,000.00
5,033,296,000.00 5,033,296,000.00
783,485,000. 00 1,080,011,000.00 . 1,080,011,000.00 . 1,080,011,000.00 . 1,080,011,000.00 .
919,934,000.00 . 160,077,000.00 .
1,080,011,000.00 . 1,080,011,000.00 .
658,444,000.00 . 421,567,000.00 .
1,080,011,000.00 . 1,080,011,000.00 .
-783,485, 000. 00 1, 080, o n , 000.00 1,080, o n . 000.00 1,080, o n , 000.00 1,080, o n , 000.00
919,934,000. 00 160,077,000.00
1,080,011,000.00 1,080, o n , 000.00
658,444,000. 00 421, 567,000. 00
1,080, o n , 000.00 1,080, o n , 030.00
To ta l special issues 21,986,070,000.00 3,953,285,000.00 25,939,355,000.00
Footnotes a t end of table.
Digitized for FRASER http://fraser.stlouisfed.org/ Federal Reserve Bank of St. Louis

256 19 70 REPORT OF THE SECRETARY OF THE TREASURY
TABLE 66.—Federal old-age and survivors insurance trustfund, June SO, 1970—Con. II . ASSETS HELD BY THE TREASURY DEPARTMENT-Continued
Fiscal year 1970 Assets June 30, 1969 increase, or June 30, 1970
decrease (—)
Investments in public debt securities—Continued
Public issues: Treasm-y bonds:
2y% of 1964-69 (dated Sept. 15, 1943)-... $33,000,000. 00 -$33,000,000. 00 2y% of 1967-72 (dated Oct. 20, 1941) 250. 00 $250. 00 4%of 1969 (dated Oct. 1, 1957).. 57,500,000.00 -57,500,000.00 4%ofl970- 15,000,000.00 -15,000,000.00 4% of 1971 100,000,000.00 100,000,000.00 4% of 1973 38,000,000.00 38,000,000.00 3^^% of 1974 24,500,000.00 . 24,500,000.00 4^%ofl974 . 61,934,000.00 61,934,000.00 43^% of 1974 6,352,000.00 6,352,000.00 4M% of 1976-85 . 78,023,000.00 78,023,000.00 334% of 1978-83 60,200,000.00 60,200,000.00 4% of 1980 163,100,000.00 153,100,000.00 33^% of 1980 - 449,450,000.00 . . . . : 449,450,000.00 334%0fl985 26,700,000.00 25,700,000.00 434% Of 1987-92 33,000,000.00 33,000,000.00 43^% of 1989-94 91,300,000.00 91,300,000.00 33^% of 1990 556,250,000.00 656,250,000.00 3%ofl995.. 70,170,000.00 70,170,000.00 33^% of 1998. 552,037,000.00 552,037,000.00
Treasmy notes: 6M% Series A-1975 7,000,000.00 7,000,000.00 6% Series B-1975..- 17,450,000.00 17,450,000.00 6K% Series A-1976 5,000,000.00 5,000,000.00 63^% Series A-1976 22,180,000.00 22,180,000.00 73^% Series C-1976. 90,500,000.00 90,500,000.00 8% Series A-1977 15,000,000.00 15,000,000.00 2y% Investment Series B-1975-80 1,064, 902,000.00 1,064,902,000. 00
Total public issues: 3,522.048,250.00 3,522,048,250.00
Investraents in non-Federal securities: Federal National Mortgage Association
secondary market operations debentm-es:
63^% of 1969--- 25,000,000.00 -25,000,000.00 6% of 1969 41,600,000.00 -41,500,000.00 . 5M%ofl970 20,000,000.00 20,000.000,00
Total non-Federal securities 86,500,000.00 -66,500,000.00 20,000,000.00
Footnotes at end of table.
Digitized for FRASER http://fraser.stlouisfed.org/ Federal Reserve Bank of St. Louis

STATISTICAL APPENDIX 257
TABLE 66.—Federal old-age and survivors insurance trustfund, June 30,1970—Con.
II. ASSETS HELD BY THE TREASURY DEPARTMENT-Continued
Assets June 30, 1969 Fiscal year 1970
increase, or decrease (—)
June 30, 1970
Investments in agency securities: Governinent National Mortgage Association:
Federal assets liquidation trust: 53? % of 1972 $50,000,000.00 . 5.20% of 1982 100,000,000.00 . 6.10% of 1987 60,000,000.00 .
Federal assets finance trust: 6% of 1971 35,000,000.00 . 6.40% of 1987 75,000,000.00 . 6.05% of 1988 65,000,000.00 . 6.45% of 1988 35,000,000.00 . 6.20% of 1988 230,000,000.00 .
Total agency securities 640,000,000.00 .
Total investments, par value 26,234,618,250. 00 Undisbursed funds 6 . 1,970,646,63L 11
Subtotal 28,205,264,881.11 Unamortized discount and premiura on in
vestments (net) -14,447,353.86 Accrued interest purchased . . 121,447. 48
Total assets 28,190,938,974.73
$3,886, 785,000. 00 538,796,153.33
4,425, 581,153. 33
-43,383.93 -121,447.48 .
$50,000,000. 00 100,000,000. 00 50,000,000. 00
35,000,000. 00 75,000,000. 00 65,000,000. 00 35,000,000. 00
230,000,000. 00
640,000,000. 00
30,121, 403, 250. 00 2,509,442, 784.44
32,630,846,034. 44
-14,490,737.79
4,425,416,321. 92 32,616,355, 296. 65
1 Appropriations are equal to the amount of employraent taxes collected as estimated by the Secretary of the Treasury and adjusted in accordance with wage reports certified by the Secretary of Health, Education, and Welfare for distribution to this fund, the Federal disability insurance trust fund, and the Federal hospital trust fund.
2 Through June 30,1967, includes amortization of premium and discount, net. »In connection with payments of benefits to survivors of certain World War II veterans who died within
3 years after separation from active service. * Incidental recoveries, and beginning with fiscal year 1958, includes reirabmseraent of interest in the net
amount of $14,649,148.00 transferred from the Federal disabUity insurance trust fund; beginmng with the fiscal year 1966, $1,929,801.00 from the Federal hospital insurance trust fund; and beginning with the fiscal year 1967, $1,132,572.00 from the Federal supplementary medical insurance trust fund.
« Paid directly from the trust fund beginning with the fiscal year 1947 under annual appropriation acts. 9 Includes the foUowing balances in accounts as of June 30:
1969 1970 Benefit payraents $1,965,024,696.02 $2,494,823,510.18 Salaries and expenses . . . 5,064,04L67 12,693,53L92 Construction of buildings . . . . 557,893.42 1,844,518.78 Vocational Rehabilition Prograra Payraent 81,223.56
Digitized for FRASER http://fraser.stlouisfed.org/ Federal Reserve Bank of St. Louis

258 19 70 REPORT OF THE SECRETARY OF THE TREASURY
T A B L E 67.—Foreign service retirement and disability fund, J u n e 30, 1970 [This t rus t fund was established in accordance wi th the provisions of the act of May 24, 1924, and the act of
Aug . 13, 1946 (22 U . S . C . 1062). For further details, see annua l report of the Secretary for 1941, p . 138]
L R E C E I P T S A N D E X P E N D I T U R E S ( E X C L U D I N G I N V E S T M E N T T R A N S A C T I O N S )
Cumulative through
June 30, 1969
Fiscal year 1970
Cumulative through
June 30, 1970
Receipts : Deduct ions from salaries, service credit p a y m e n t s ,
a n d vo lun t a ry contr ibut ions of employees subject to re t i rement a c t . . $62,006,439.63 $7,303,337.98
A p p r o p r i a t i o n s ! ^ 25,815,900.00 P a y r a e n t s b y eraploying agency i ^ 30,826, 630. 34 6,898, 271. 74 Receipts frora civil service ret i reraent and dis
abi l i ty fund . 14,390,201.25 5,322,020.23 Adjus tn ien ts m widow survivor benefits 29,375.00 4,800. 00 In te res t a n d profits on inves tmen t s 26, 507,813. 82 2,319,080. 36
T o t a l r e c e i p t s 159,576,360.04 21,847,510.31 Expend i tu res :
A n n u i t y p a y m e n t s and refunds I l l , 487, 780. 37 17, 212, 947. 00
Balance 48,088,579.67 4,634,563.31
$69, 309, 777. 61 25,815, 900. 00 37, 724, 902. 08
19, 712, 221. 48 34,175. 00
28, 826, 894.18
181,423,870. 35
128, 700, 727. 37
52, 723,142.'
I L A S S E T S H E L D B Y TI-IE T R E A S U R Y D E P A R T M E N T
J u n e 30, 1969 Fiscal year 1970,
increase, or decrease (—)
J u n e 30, 1970
Inves tmen t s in publ ic deb t securities: Special issues, foreign service re t i rement fund
series m a t u r i n g J u n e 30: Treasu ry notes :
4% of 1970.. . 4% of 1971 4% of 1972 4% of 1973 4% of 1974 4% of 1975 63^% of 1976 7 ^ % of 1977
T rea su ry bonds : 4% of 1976. 4% of 1977 4% of 1978 4% of 1979 4% of 1980 4% of 1981 4% of 1982 4% of 1983.
To ta l inves t raen t s . Und i sbursed balance
$3, 017.000. 00 3,017,000.00 . 3,017,000.00 . 3,017,000.00 . 3,017,000.00 . 3,017,000.00 . 5, 082,000. 00 .
3,017,000.00 . 3,017,000.00 . 3,017,000.00 . 3,017,000.00 . 3,017,000.00 . 3,017,000.00 . 3,017,000.00 . 3,017,000.00
-$3,017,000.00 .
47, 320,000. 00 768, 579. 67
6, 721,000. 00
$3,017,000. 00 3,017,000.00 3, 017,000. 00 3, 017,000. 00 3,017,000. 00 5,082,000.00 6, 721,000. 00
3, 017,000. 00 3,017,000. 00 3,017,000. 00 3, 017,000.00 3,017,000. 00 3,017,000.00 3, 017,000. 00 3, 017,000.00
3, 704,000. 00 930, 563. 31
51, 024,000. 00 1, 699,142. 98
Tota l assets. . 48, 088, 579. 67 4, 634, 563. 31 52, 723,142.!
f Revised. 1 Beginnmg J u l y 1, 1961, appropr ia t ions are not raade directly to the fund. Ins tead, in accordance wi th
t he act approved Sept . 8, 1960 (22 U . S . C . 1071(a)), t h e eraploying agency contr ibutes (frora appropr ia t ions or funds from which the salaries are paid) amomi t s equal to the deduct ions from employees ' salaries.
Digitized for FRASER http://fraser.stlouisfed.org/ Federal Reserve Bank of St. Louis

STATISTICAL APPENDIX 2 5 9
TABLE 68.—Highway trust fund, June 30, 1970
[This trust fund was estabhshed in accordance with the provisions of section 209(a) of the Highway Revenue Act of 1956 (23 U.S.C. 120 note)]
I. RECEIPTS AND EXPENDITURES (EXCLUDING INVESTMENT TRANSACTIONS)
Curaulative Curaulative through Fiscal year 1970 through
June 30, 1969 June 30, 1970
Receipts:
Gasohne 2 $31,545,850,257.81 $3,474,592,099.26 $35,020,442,357.07 Diesel and special raotor fuels 1,570,394,950.87 263,164,835.27 1,833,559,786.14 Tires 2 4,215,431,710.18 588,478,594.86 4, 803,910, .305.04 Tread mbber 2 268,523,425.62 28,031,575.42 296,555,001.04 Trucks, buses, and traUers 2 3,716,974,576.01 699,926,670.44 4,416,901,246.45 Truckuse 1,000, 591, 58L 57 136,805,692.16 1,1.37,397,273.73 Inner tubes 2 258,127,184.02 26,126,234.47 284,253,418.49 Othertires 272,718,179.33 272,718,179.33 Parts and accessories for trucks, buses,
etc 250,211,288.29 87,209,453.00 337,420,741.29 Lubricating oils 310,644,756.06 109,365,603.19 420,010,359.25
Totaltaxes 43,409,467,909.76 5,413,700,758.07 48,823,168,667.83 Transfer to land and water conservation
fund . . 121,800,000.00 28,000,000.00 149,800,000.00
Gross taxes 43,287,667,909.76 5,385,700,758.07 48,673,368,667.83
Deduct—Reiraburseraent to general fund-refund of tax receipts:
Gasoline used on farms 1,252,546,845.55 833.095.59 1,253,379,941.14 Gasoline for nonhighway purposes or local
transit systeras 285,310,071.55 16,396,432.48 301,706,504.03 Gasoline, other 103,007.84 103,007.84 Tires and tread rubber. 97,416.90 97,416.90 Trucks, buses, and trailers 66,650.55 66,650.55 Floor stock taxes . -640.38 . -640.38 Lubricating oils not used in highway
raotor vehicles.... 55,059,915.36 14,844,297.12 69,904,212.48
Total refunds of taxes 1,593,183,267.37 32,073,825.19 1,625,257,092.56
Nettaxes 41,694,484,642.39 5,353,626,932.88 47,048,111,575.27 Interest on investnient 199,038,155.82 115,409,814.76 314,447,970.58 Advances frora general fund 489,000,000.00 489,000.000.00
Less return of advances to general fund.. . -489,000, 000. 00 -489,000,000.00 Reunbursement frora general fund 15,097, 772.00 15,097,772.00
Net receipts 41,908, 620, 570.21 5,469,036,747. 64 47,377,657,317. 85
Expenditures: Highway program:
Reimburseraent to general fund. 501,018,553.13 501,018,553.13 FederalAidHighway Actof 1956.-.. 39,877,875,059.07 4,375,172,833.57 44,253,047,892.64 Pentagon road network 2,243,393.37 1,215.90 2,244,609.27 Right-of-way Revolving Fund : 3,078,856.00 3,078,856. 00
Total highway prograra 40, 381,137,005. 57 4, 378,252,905.47 44, 759,389,911.04 Services of Departraent of Labor (admin
istration and enforcement of labor standards) 368,225.00 368,225.00
Interest on advances from general fund 6,288,48L44 6,288,481.44
Total expenditures 40,387,793,712.01 4,378,252,905.47 44,766,046,617.48
Balance 1,520,826,858.20 1,090,78.3,842.17 2,611,610,700.37
Footnotes at end of table.
Digitized for FRASER http://fraser.stlouisfed.org/ Federal Reserve Bank of St. Louis

260 19 70 REPORT OF THE SECRETARY OF THE TREASURY
TABLE 68.—Highway trustfund, June 30, i570—-Continued n . ASSETS HELD BY THE TREASURY DEPARTMENT
Assets Jmie 30,1969 Fiscal year 1970
increase, or decrease (—)
June 30, 1970
Investraents in public debt secmities: Special issues, Treasury certificates of in
debtedness, highway trust fund series matm-ing June 30:
53^% of 1970 $1,512,735,000.00 -$1,512,735,000.00 . 6% of 1971 2,601,737,000.00
Total investments 1,512,735,000.00 1,089,002,000.00 Undisbmsed balance - 8,091,858.20 1,781,842.17
Totalassets. . . . . . . : . . . 1,520,826,858.20 1,090,783,842.17
$2, 601, 737,000. 00
2,601,737,000. 00 - 9,873,700.37
2, 611, 610, 700. 37
1 Amounts equivalent to specified percentages of receipts from certain taxes on motor fuels, vehicles, tires and tubes, and use pf certain vehicles are appropriated and transferred monthly from general fund receipts to the trust fund oii the basis of estimates by the Secretary of the Treasm-y, with proper adjustments to be made in subsequent transfers as required by section 209(c) of the Highway Revehue Act of 1956, as amended (23 U.S.C. 120 note). See also, the annual report to Congress on the financial condition and results of operations of the highway trust fund. . .
2 Includes floor stocks taxes.
TABLE 69.—Judicial survivors annuity fund, June 30, 1970 [This fund was established in accordance with the provisions of the act of Aug. 3, 1956 (28 U.S.C.376(b))]
I. RECEIPTS AND EXPENDITURES (EXCLUDING INVESTMENT TRANSACTIONS)
Cumulative through
June 30,1969
Fiscal year 1970
Cumulative through
Juhe 30,1970
Receipts: . Deductions from salaries and contributions $9, 239,209. 89
Interest and proflts on investments 983, 583.77
Totalreceipts.. 10,222,793.66 Expenditures:
Amiuity payments, refunds, etc . . . . . . . . 5,495,799.65
Balance '. : . . . 4,726,994.01
$1, 264, 613. 65 • 206,852.44
1, 471,466. 09
696,461. 66
775, 004. 43
$10, 503,823. 54 1,190, 436. 21
11,694, 259. 75
, 6,192,26L31
5, 501, 998. 44
•II. ASSETS HELD BY THE TREASURY DEPARTMENT
Assets June 30,1969 Fiscal year 1970,
increase, or decrease (—)
June 3d, 1970
$165,000.00
-40,500.00
232, 500. 00
163, 500. 00
785, 500. 00 -10,495.57
$146,000.00 • 660,000.00
293, 000. 00 40,000. 00
Investments in public debt securities: Public issues:
Treasury notes: 5 ^ % Series B-1971 $146,000.00'. 5^% Series B-1974 495,000.00 6% Series B-1975 293,000.00.. 73^% Series C-1976...
Treasury bonds: 4% Of 1969 40,500.00
. 4%ofl971 . . . 240,000.00. 4% of 1972 (dated Sept. 15, 1962). 150,000.00 4% of 1973 43^% of 1973... 70,000.00 . 3K%0fl974 169,000.00 . 434% of 1974 261,500.00 4 ^ % of 1975-85 537,500.00 . 3K%0fl978-83 273,500.00 . 33^%ofl980 306,500.00 . 4% of 1980 500,500.00 4K% of 1987-92. 722,000.00 . 43/g% of 1989-94. -- 167,000.00 . 33^% of 1990 188,500.00 . 3%ofl995: 51,000.00 . 33^% of 1998.. 113,500.00 .
Total investments . ' 4,725,000.00 Undisbursed balance 1,994.01
Totalassets 4,726,994.01
240,000.00 150,000.00 225,000. 00 70, 000. 00 169,000. 00 494,000. 00 537, 500. 00 273, 500. 00 306,500.0) 664,000. 00 722,000.00 167,000. 00 188,500.00 51, 000. 00 113,500.00
5, 510, 500. 00 - 8 , 501. 56
775,004.43 5, 501, 998. 44
Digitized for FRASER http://fraser.stlouisfed.org/ Federal Reserve Bank of St. Louis

T A B L E 70.—Library of Congress t rustfunds, J u n e 30, 1970 [Establ ished in accordance-with provisions of t h e act of Mar. 3,1925, as amended (2 U . S . C . 154-161). Fo r fmther detaUs see 1941 a n n u a l report , p . 149]
Pei-manent loan account
F u n d s on deposit w i th Treasurer of t h e Uruted States
In te res t a t 4 percent paid b y U . S . T reasu ry
Incorae frora donated securities, etc.
F i s c a l y e a r C u m u l a t i v e F i s c a l y e a r C u m u l a t i v e C u m u l a t i v e F i s c a l y e a r C u m u l a t i v e J u n e 30, 1969 1970 J u n e 30, 1970 th rough 1970 through through 1970 through
J ime 30, 1969 J u h e 30, 1970 J u n e 30, 1969 J u n e 30, 1970
N a m e of donor: Bab ine , Alexis V Benjamin , WiUiam E Bowker , R i cha rd R . . . 1 Carnegie Corpora t ion of N e w York Coolidge, El izabe th S Elson, Louis C , memor ia l fund Feinberg , Lenore B . and Charles F u n d . . - . F r i ends of Music in t he L i b r a r y of C o n g r e s s - . . . . Guggenheim, D a n i e l . . . : . . . . . . . . . . - - ^ - - - - -H a n k s , N y m p h u s Corr idon H u n t i n g t o n , Archer M.^ Koussev i tzky Music F o u n d a t i o n , I n c . - _ . ^ Longwor th , Nicholas, F o u n d a t i o n M c K i m F u n d : MUler, D a y t o n C Na t iona l L ib ra ry for the Bl ind , I n c . PenneU, Joseph •. , Por te r , Hem-y K. , memoria l fund Rober t s fund Scala, N o r m a n P . , memoria l fund Sonneck memoria l fund Stern memoria l fund WhittaU, Ger t rude C..:
Collection of St radivar i i n s t rumen t s and T o u r t e b o w s . . . .
Poe t ry f u n d . . ,,. -General l i t e r a tu re - . Apprecia t ion a n d . under s t and ing of good
l i tera ture . .- . -- --Wilbur, J ames B .
$6,684. 74 . 83,083.31 . 14,843.15 . 93,307.98 . 804,444.26 . 12,585.03 .
9,409.09 .90,654.22 . 5,227.31 .
260,577. 66 . 208,099.41 . 10,69L59
$1,000. 00 25.00
$6,684.74 83,083.31 14,843.15 93,307.98 804,444. 26 12,585.03 1,000.00 . 9,434.09 90,654.22 , 5, 227.31
260,677. 66 208,099. 41 10,691. 59
$8,551.10 72,898. 61 9,420. 06
116,830. 42 626,218. 03 12,153. 91
"'6^ 353'99* 112,052.90 2,811.36
235, 778.19 129, 237. 21 11,635. 86
$267.39 3,323.34 693.72
3,732.32 32,177. 78
503. 40 15.91
376. 90 3,626.16 209.10
10,423.10 8,323. 98 427. 66
$8,818.49 76, 221. 95 10,013. 78 120,662. 74 658,395. 81 12,657.31 .
15.91 . 6, 730. 89
115, 679. 06 3,020.46 .
246, 201. 29 137,56L19 . 11, 963. 52
$1,785.58 . 49,744.50 . 8,024.80 . 37,838.36 . 131,904.-76 .
$1,785. 58 49, 744. 50 8.024. 80 37,838. 36 131,904. 76
318.22 . 32,759.36 .
318. 22 32, 759.36
500, 904. 06 1 $21,595. 69 622,499. 65
757.02
20,548.18 . 36,015.00 . 303,250.46 . 290,500.00 .
62,703.75 . 92,228.85 . 12,088.13 . 27,648.58 .
20,548.18 36,015. 00
303, 250. 46 290,500. 00 62,703. 75 92, 228. 85 12,088.13 27,548. 68
1,638,609.44 1,638,609.44 414,698.20 414,698.20 393,279.59 393,279.59
150,000.00 . . 150,000.00 , 305,813, 57 ; . . . . . . ; . . . . . 305,813.;57
20,118. 81 24,024. 27
340,789. 52 266,148. 04
45, 589. 25 9,986. 05
14,938. 78 6,341.95
990,150. 21 118,036. 62 174,550. 04
91,898.31 386,690.56
821.92 1,440. 60
12,130. 02 11,620.00 2,508.16 3, 689.15
483. 52 1,101. 94
20,940. 73 25,464.87 .
352,919.54 277,768. 04 48,097.41 . 13,676.20 .
15,422.30 6,443. 89
2 50,803.31 757.02
50, 803.31 412.50
85,487.80 25,369.03 .
85,487. 80-25,369. 03
ZP
I-H ZP y ^
h-i Q >
!
4,429.73 . 75.00 .
61,544.38 1,051,694. 59 3,382. 00 16,587.92 134,624.64 15,7,3L18 190,28L22 2,168.26
4,429. 73 75.00
3,382. 00
'2,'i68.'26
6,000.00 12,232.56
97,898.31 398,923.12 107,345.09 107,345.09
Dona t ions a n d inves tmen t income 6,246,891. 50 . ^ 1,025.00 5,247^ 916. 60 3,732,104.05 • E x p e n d i t m e s from inves tmen t i n c o m e . . . . . . 3,400,949!32
Balances in t h e accounts : . . . 6,246,89L 50 3i ,026,00 6,247,916.50 331,154.73
209,892.11 3,941,996.16 992,706.07 72,398.90 1,065.104.97 .200,452.64 3,601,40L 96.. 977,116.38 12,403.17 989,519.65
9,439. 47 340,594. 20 15,589. 69 69,995. 73 . 75,585. 42
1 Includes income from securities held as i nves tmen t unde r deed of t r u s t da ted N o v . 17, 1936, adminis te red b y designated t rustees including the B a n k of N e w Y o r k . '
2 Income from securities cur ren t ly being held b y L ib ra ry of Congress. 8 Represents unappropr i a t ed receipts.
N O T E . — A b o v e table does not include $41,000 face a m o u n t U S T Securities representing bequests to t he "Rosenwa ld CoUection" a n d t h e " K a t i e a n d Walter Louchhe im F u n d " donat ions. Also does not include securities received from t h e beques t of the late Leonora Jackson McKim Es ta t e consisting of various stocks, notes a n d bonds listed b y the probate court a t an appraised or carrying value of $948,074.18.
Digitized for FRASER http://fraser.stlouisfed.org/ Federal Reserve Bank of St. Louis

262 19 70 REPORT OF THE SECRETARY OF THE TREASURY
TABLE 71.—National service life insurance fund, June 30, 1970 [This t rus t fund was estabUshed in accordance w i t h t he provisions o f t h e act of Oct. 8,1940 (38 U . S . C . 720).
For further details, see annua l report of t he Secretary for 1941, p . 143]
I . R E C E I P T S A N D E X P E N D I T U R E S ( E X C L U D I N G I N V E S T M E N T T R A N S A C T I O N S I N F E D E R A L A N D N O N - F E D E R A L S E C U R I T I E S )
C u m u l a t i v e th rough
J u n e 30,1969 Fiscal year 1970
Curau la t ive th rough
J u n e 30, 1970
Receints* P remiuras and other receipts $13,239,027,836.22 In te res t on inves tmen t s 4,326,743,876.90 P a y m e n t s from general fund 4,781,940, 221.83
To ta l r ece ip t s 22,347,711,934.95 Expend i tu re s :
Benefit p a y m e n t s , d iv idends , and r e f u n d s . . 16, 033,190,612. 52
Balance 6,314,521,322.43
$461, 269,750. 21 $13, 700, 297, 686.43 246,816, 827.07 4,573, 560,703. 97
3,323, 755. 03 4,785, 263, 976.86
711, 410, 332. 31
685,084,080.66
23, 059,122, 267. 26
16, 718, 274, 693.18
26,326, 251. 65 6, 340,847, 574.0
I I . A S S E T S H E L D B Y T H E T R E A S U R Y D E P A R T M E N T
J u n e 30, 1969 Fiscal year 1970
increase, or decrease (—)
J u n e 30, 1970
I n v e s t m e n t s in pub l i c deb t securities: Special issues, na t ional service life insurance
fund series, raaturing J u n e 30: T rea su ry notes :
3 ^ % of 1970 $6,946,000.00 4 ^ % of 1970 13,696,000.00 48^% of 1971 544,480,000.00 53^% of 1975 332,597,000.00 634% of 1976 305,419,000.00 7 ^ % Of 1 9 7 7 . - - ,
T rea su ry bonds : 3 % of 1970. 379,000,000.00 3M%of l970 7,873,000.00 3 % of 1971 379,000,000.00 3 H % o f 1971 6,946,000.00 3 ^ % of 1971 7,873,000.00 3%of l972 379,000,000.00 3 ^ % of 1972 6,946,000.00 3 ^ % of 1972 7,873,000.00 3 % of 1973 . . 379,000.000.00 3 ^ % of 1973 6,946,000.00 3 ^ % of 1 9 7 3 . . . 7,873,000.00 3 % of 1974 379,000,000.00 3 ^ % of 1974 6,946,000.00 3 M % o f l 9 7 4 . 7,873,000.00 3 ^ % of 1975 6,946,000.00 33<%0fl975 : 386,873,000.00 33^% of 1976. . 343,149,000.00 3M%of 1976 43,724,000.00 3 H % o f l 9 7 6 : . 6,946,000.00 334% of 1977 - 386,307,000.00 3 ^ % of 1 9 7 7 . . . : . . 7,512,000.00 33^% of 1 9 7 8 . . - : . . . . . . 298,259,000.00 3 ^ % of 1978 . : 95,560,000.00 3S^%ofl979 . . . . 393,819,000.00 35^% of 1980 393,819,000.00 434% of 1981 - . 225,452,000.00
T o t a l special i s s u e s . . : 5,753,653,000.00
-$6,946,000.00 -13,696,000.00
$544,480,000.00 332,597,000.00 305,419,000.00
569,007,000. 00 569,007,000. 00
-379,000,000.00 -7,873,000.00
379,000, 6, 946, 7,873,
379, 000, 6, 946, 7,873,
379, 000, 6, 946, 7,873,
379,000, 6, 946, 7,873, 6, 946,
386,873, 343,149, 43, 724, 6, 946,
386,307, 7, 512,
298, 259, 95, 560, 393,819, 393,819, 225,452,
000.00 000.00 000. 00 000. 00 000. 00 000. 00 000. 00 000.00 000.00 000.00 000.00 000. 00 000.00 000. 00 000.00 000.00 000.00 000.00 000.00 000. 00 000. 00 000.00 000. 00 000. 00
161, 492,000.00 5, 915,145, 000. 00
Footnotes at end of table.
Digitized for FRASER http://fraser.stlouisfed.org/ Federal Reserve Bank of St. Louis
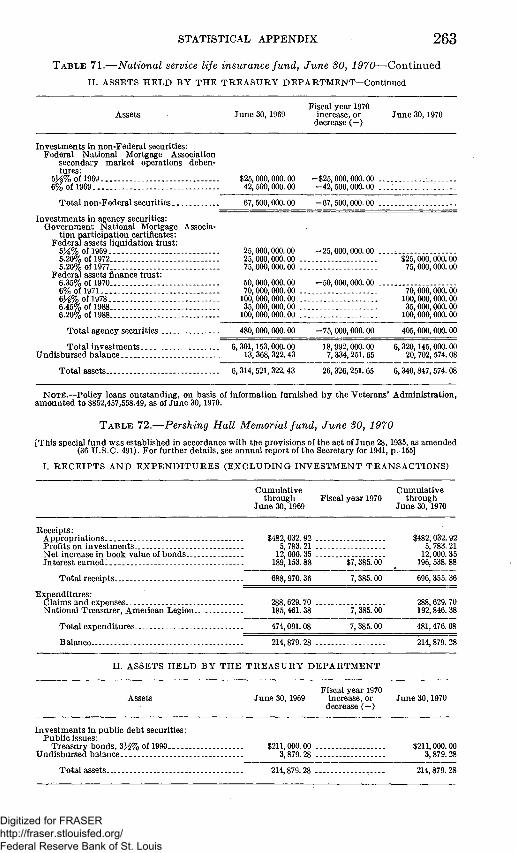
STATISTICAL APPENDIX 263
T A B L E 71.—National service life insurance fund, J u n e SO, 1970—Continued
II. ASSETS HELD BY THE TREASURY DEPARTMENT-Continued
Assets June 30, 1969 Fiscal year 1970
increase, or decrease (—)
June 30,1970
Investments in non-Federal securities: Federal National Mortgage Association
secondary market operations debentures:
53^% of 1969 $25,000,000.00 -$25,000,000.00 6% of 1969 42,500,000.00 -42,500,000.00
Total non-Federal securities 67,500,000.00 -67,500,000.00
Investments in agency securities: Government National Mortgage Associa
tion participation certificates: Federal assets liquidation trust:
6K%of 1969 5.20% of 1972 5.20% of 1977
Federal assets finance trust: 6.35% of 1970 6% of 1971 63^% of 1978-6.45% of 1988... 6.20% of 1988
25,000,000.00 25,000,000.00 . 75,000,000.00 .
50,000,000.00 70,000,000.00 .
100,000,000.00 . 35,000,000.00 .
100,000,000.00 .
-25,000,000.00
-50,000,000.00
$25,000,000.00 75,000,000. 00
70,000,000.00 100,000,000. 00 35,000,000.00
100,000,000.00
Total agency securities..
Total investments. Undisbursed balance
480,000,000.00 -75,000,000.00
6, 301,153,000. 00 13,368, 322. 43
18,992,000. 00 7,334,251. 65
Totalassets 6,314,521,322.43
405,000.000.00
6, 320,145, 000. 00 20, 702, 574. 08
26, 326,251.65 6,340,847, 574. (
NOTE.—Policy loans outstanding, on basis of information furnished by the Veterans' Administration, amounted to $852,457,558.49, as of June 30,1970.
T A B L E 72.—Pershing Hall Memorial fund, June 30, 1970
[This special fund was established in accordance with the provisions of the act of June 28,1935, as amended (36 U.S.C. 491). For further details, see annual report of the Secretary for 1941, p . 155]
I. RECEIPTS AND EXPENDITURES (EXCLUDING INVESTMENT TRANSACTIONS)
Cumulative through
June 30,1969 Fiscal year 1970
Curaulative through
June 30, 1970
Receipts: Appropriations Profits on investraents Net increase in book value of bonds.. Interest earned.
Totalreceipts..
Expenditures: Claims and expenses National Treasurer, American Legion..
Total expenditures.
$482,032. 92 . 5,783.21 .
12, 000. 35 . 189,153. 88 $7,385.00
$482, 032. 92 5, 783. 21
12,000. 35 196, 538. 88
688,970. 36
288, 629. 70 185,461. 38
474,091. 08
7, 385. 00
7, 385. 00
7, 385.00
696, 355. 36
288, 629. 70 192,846. 38
481, 476.08
Balance 214,879.28 214, 879. 28
II. ASSETS HELD BY THE TREASURY DEPARTMENT
Fiscal year 1970 Assets June 30,1969 increase, or
decrease (—) June 30,1970
Investments in public debt securities: Public issuGS'
Treasury bonds, 33^% of 1990 Undisbmsed balance
Totalassets
$211,000.00 $211,000.00 3,879.28 3,879.28
214,879.28 214,879.28
Digitized for FRASER http://fraser.stlouisfed.org/ Federal Reserve Bank of St. Louis

264 19 70 REPORT OF THE SECRETARY OF THE TREASURY
TABLE 73.—Railroad retirement account, June 30, 1970
[This trust account was established in accordance with the provisions of the act of June 24, 1937 (45 U.S.C. 2280(a)). For further details, see annual report of the Secretary for 1941, p. 148]
L RECEIPTS AND EXPENDITURES (EXCLUDING INVESTMENT TRANSACTIONS IN.FEDERAL AND NON-FEDERAL SECURITIES)
Curaulative through
June 30, 1969 Fiscal year 1970
Curaulative through
June 30, 1970 •
Receipts: Tax collections:
.. Appropriated i '. ' . . . $16, 377,420,079. 78 Unappropriated -2,081,372.05
Less refunds of taxes 2 -832,497.71 Fines and penalties 1,713.47 . Interest and profits on investments 2, 505,355, 263. 58. Payments from Federal old-age and sur
vivors and Federal disability insurance 3_. 4,735, 054,000.00 Payments to Federal hospital insurance
trust fund.. . -113,589,000.00 Railroad unemployment insurance account:
Interest on advances . ' . . . 77,878,376. 04 Repaym_e_nt of advances . 585, 611,000.00
• Total receipts.. 24,164,817, 563.11
Expenditures: .Benefit payments, etc 18,546,028,974.18 Administrative expenses * 177,644,896.09 Payments to railroad unemployment in
surance account 1,043.00 .Federal old-age and sm-vivors and Federal
disabiUty insurance trust funds: -Payments ' : 26,831,000.00 . Interest payments . . . ' 35,393,000.00 .
Advances to raihoad uneraployraent in-.smance account . . . . : • . : . . , 700,601,000.00
In te res t on re funds oftaxes 38,812. ,52
T o t a l expendi tures 19,486, 538, 725. 79
Transfer frora railroad ret i renient suppleraental account 906,181. 67
B a l a n c e . . . . . . . . 4,679,185,018.99
$964, 295,153.13 1,710,821. 63 - 7 1 1 , 967.18
'"2ii,"623,'776."io'
•'589, 257, 000. 00
-61,307,000.00
4,876,165.97 78, 635, OOO.OO..
$17, 341, 715, 232. 91 -370 , 550. 42
- 1 , 544, 464. 89 1,713. 47
2, 716, 979, 039. 68
5, 324, 311,000. 00
-174,896,000.00
82, 754, 542. 01 664, 246, 000. 00
1, 788,378,.949. 65 V 25, 953,196, 512. 76
1,538,648,218.66 16,260,816.45
5, 228,000.00
. 44, 950,000. 00 8,503.66;
20,084,677,192.84 193,905, 712. 54
5, 229,043. 00
26,831^000.00 35,393,000. 00
745, 551,000. 00 . 47,316.18
1, 605,095, 538. 77 21, 091, 634, 264. 56
-24, 620, 064. 95 -23,713,883.28
158,663,345.93 " 4,837,848,364.92
I L A S S E T S H E L D B Y T H E T R E A S U R Y D E P A R T M E N T
Assets J u n e 30, 1969 Fiscal year 1970
increase, or decrease (—)
J u n e 30, 1970
Inves tmen t s in publ ic deb t secmit ies: Special issues, railroad ret i reraent series,
m a t u r i n g J u n e 30: Treasm-y no tes :
4 J ^ % o f l 9 7 1 . 4M%of 1974
• 5 ^ % of 1975 63^% of 1976 7 ^ % of 1977.. . .1.
• T rea su ry bonds : 4% of 1972 43^% of 1972.. . . . . . -. 4% of 1973 43^% of 1973 •.. 4% of 1974 43^% of 1974 4% of 1975. 4 ^ % Of 1975 4% of 1976 43^% of 1976 4% of 1977 ..•. 43/8% of 1977 . . . . . . . . . . : 4% of 1978 .
$5, 552, 000. 00 416,402,000.00 482,623,000.00 . 647, 948,000. 00 .
185, 23,
185, 23,
185, 23,
185, 23,
185, 23,
185, 23,
185,
091, 000. 00 110,000. 00 091,000. 00 n o , 000.00 091, 000. 00 n o , 000 .00 . 091,000.00 . 110,000.00 . 091, 000. 00 . n o , 000 .00 . 091,000. 00 . 110,000.00 . 091,000.00 .
-$5, 552,000. 00 . -7,113, 000. 00
847, 447,000. 00
-186,091,000.00 . -23,110,000.00 . -185,091,000.00 . -23,110,000.00 . -112,962,000.00
$409, 289, 000. 00 482, 623, 000.00 647,948,000.00 847, 447, 000. 00
72,129, 23, no, 185,091, 23, no, 185,091, 23, no, 185, 091, 23, no, 185, 091,
000.00 000. 00 000. 00 000. 00 000. 00 000. 00 000. 00 000. 00 000. 00
Footnotes at end of table.
Digitized for FRASER http://fraser.stlouisfed.org/ Federal Reserve Bank of St. Louis

STATISTICAL APPENDIX 265 T A B L E 73.—Railroad retirement account, June SO, 1970—Continued
IL ASSETS HELD BY THE TREASURY.DEPARTMENT
Assets June 30, 1969 Fiscal year 1970
increase, or decrease (—)
June 30,1970
Investments in public debt securities:—Continued Special issues, railroad retireraent series
raaturing June 30:—Continued Treasury notes:—Continued
43^% of 1978. 43^% of 1979. 43^% of 1980
$23,110,000.00 . 208,201,000.00 208,201,000.00
$23, no, 000. 00 208, 201,000. 00 208, 201, 000. 00
Total special i ssues . . . . . ' 3,426,334,000.00 . $305,418,000.00 3,731,752,000.00
Public issues: Treasury notes:
5%, Series B-1970... 4M%, Series A-1972 4M%, Series B-1972 by% Series A-1975. 6% Series A-1975 6K% Series A-1976 73^% of Series C-1976
Treasm-y bonds: 4% of 1969 (dated Oct. 1, 1957)... 4% of 1970 37^% of 1971 4% of 1971 : 4% of 1972 (dated Sept. 15, 1962). 4% of 1972 (dated Nov. 15, 1962).; 37^% of 1974 434% of 1975-85
. 3 ^ % of 1980 . . . . . . . : 4% of 1980. dy% of 1985 434% of 1987-92 4% of 1988-93... 43^% of 1989-94 ...• 33^% of 1990 3% of 1995 33^%of 1998...
Total public issues..
Federal National Mortgage Association secondary market operations debentures:
6% of 1969..... . . . . . b%% of 1970
Total non-Federal secm-ities.
Investnients in agency securities: Governraent National Mortgage Association
participation certificates: Federal assets liquidation trust:
6.20% of 1977 Federal assets finance trust:
6.35% of 1970 -6% of 1971 6.30% of 1971.-. .'..
Total agency securities..
32,000,000.00 18,000,000.00 20,000,000.00 14,000,000.00 7,000,000.00
51,000,000.00
57,000, 36,000, 46,500, 8,500,
33,500, 21,000,
156, 700, 47, 261, 6,000,
125,550, 6, 900,
14, 000, 6,000,
13,100, 38,925,
3, 200, 31,550,
000. 00 000.00 000.00 000.00 000.00 000.00 . 000.00 000.00 . 000.00 000.00 000.00 000.00 . 000.00 000. 00 000. 00 000.00 000.00
57, 000, 000. 00
-67,000,000.00 .
792,686,000.00
41,500,000. 00 20,000,000.00
-41,500,000.00
61,500,000. 00 -41,500,000. 00
50,000,000.00 .
50,000,000. 00 70,000,000.00 . 40,000,000.00 .
-60,000,000.00
210,000,000. 00 - 50,000,000.00
Total investments 4,490,520,000.00 Undisbursed balance 188,665,018.99
213,918,000.00 -55,254, 654. 07
32,000,000.00 18,000,000. 00 20, 000,000.00 14, 000,000. 00 7, 000, 000. 00
51,000,000.00 67,000,000. 00
36,000, 46,500, 8,500, 33,500, 21,000, 156, 700, 47, 261, 6, 000,
125,550, 6, 900, 14,000, 6,000, 13,100, 38,925, 3, 200, 31,650,
000. 00 000. 00 000. 00 000. 00 000. 00 000. 00 000. 00 000. 00 000.00 000. 00 000. 00 000. 00 000. 00 000. 00 000. 00 000. 00
792, 686, 000. 00
20,000,000.00
20,000,000. 00
50,000,000. 00
70,000,000.00 40,000,000.00
160,000,000.00
4, 704,438,000. 00 133,410,364. 92
Totalassets .'. 4,679,185,018.99 158,663,345. 93 4,837, 848,364. 92
1 Includes the Government's contribution for creditable military service under the act of Apr. 8, 1942, as amended by the act of Aug. 1, 1956 (45 U.S.C. 228c-l(n)(p)). Effective July 1, 1951, appropriations of receipts are equal to the amount of taxes deposited in the Treasury (less refunds) under the Railroad Retirement Tax Act (26 U.S.C. 3201-3233).
2 The result of reclassification, prior to 1967 was included in "Unappropriated." 3 Pm-suant to act of June 24, 1937(45 U.S.C..228e(k)). •-4 Beginning Aug. 1, 1949, paid from the trust fund under title IV, act of Jyne 29. 1949 (45 U.S.C. 228 p)
and subsequent annual appropriations acts.
Digitized for FRASER http://fraser.stlouisfed.org/ Federal Reserve Bank of St. Louis

2 6 6 19 70 REPORT OF THE SECRETARY OF THE TREASURY
T A B L E 74.—Railroad retirement holding account, J u n e SO, 1970
I. RECEIPTS AND EXPENDITURES (EXCLUDING INVESTMENT TRANSACTIONS)
Cumulative Cumulative through Fiscal year 1970 through
June 30, 1969 June 30, 1970
Receipts: Appropriated tax collections $2,418,000.00 -$604,000.00 $1,914,000.00 Interest and profits on investnients. 34,000.00 -17,000.00 17,000.00
Totalreceipts . . . . . 2,452,000.00 -621,000.00 1,931,000.00 Expenditures:
Benefit payments, etc
Balance 2,452,000.00 -521,000.00 1,931,000.00
II. ASSETS HELD BY THE TREASURY DEPARTMENT
Fiscal year 1970 Assets June 30, 1969 increase, or June 30, 1970
decrease (—)
Investments in public debt securities: Special issues, railroad retirement series, raaturing
June 30: Treasury certificates of indebtedness:
5%% of 1969. $2,264,000.00 -$2,254,000.00 7M%pf 1971 1,923,000.00 $1,923,000.00
Total investraents 2,264,000.00 -331,000.00 1,923,000.00 Undisbursed balance 198,000.00 -190,000.00 8,000.00
Totalassets 2,452,000.00 -521,000.00 1,931,000.00
T A B L E 75.—Railroad retirement supplemental account, J u n e 30, 1970
[The trust fund was established in accordance with the provisions ofthe act of Oct. 30,1966 (45 U.S.C. 228o (b))]
I. RECEIPTS AND EXPENDITURES (EXCLUDING INVESTMENT TRANSACTIONS)
Cumulative Cumulative through Fiscal vear 1970 through
June 30, 1969 June 30, 1970
Receipts; Tax coUections:
Appropriated $75,855,608.97 $34,555,273.79 $110,410,882.76 Less refunds of taxes
Interest and profits on investnients. 1,694,145. 93 690,474.99 2,284,620. 92
Totalreceipts 77,549,754.90 35,145,748.78 112,696,603.68
Expenditures: Benefit payraents 65,906,209.69 47,755,216.02 113,661,426.71 Interest on refunds of taxes
Total expenditures 65,906,209.69 47,755,216.02 113,661,425.71
Transfer to railroad retirenient account —906,181. 67 24,620,064. 95 23,713,883. 28
Balance 10,737,363.54 12,010,597.71 22,747,96L25
II. ASSETS HELD BY THE TREASURY D E P A R T M E N T
Fiscal year 1970 Assets June 30, 1969 increase, or June 30, 1970
decrease (—)
Investments m public debt securities: Special issues, railroad retirenient series, matur
ing June 30: Treasury certificates of indebtedness:
63^% of 1970 $5,228,000.00 -$5,228,000.00 7M%of 1971 17,671,000.00 $17,671,000.00
Total investments 5,228,000.00 12,443,000.00 17,671,000.00 Undisbursed balance 5,609,363.54 -432,402.29 5,076,96L25
Totalassets 10,737,363.64 12,010,597.71 22,747,96L25
Digitized for FRASER http://fraser.stlouisfed.org/ Federal Reserve Bank of St. Louis

STATISTICAL APPENDIX 2 6 7
T A B L E 76.— Unemployment trustfund, J u n e SO, 1970
[This trust fund was established in accordance with the provisions of Sec. 904(a) of the Social Security Act of Aug. 14, 1935 (42 U.S.C. 1104). For further details see annual report of the Secretary for 1941, p. 145]
I. RECEIPTS AND EXPENDITURES (EXCLUDING INVESTMENT TRANSACTIONS IN FEDERAL AND NON-FEDERAL SECURITIES)
Cumulative through
June 30,1969
Fiscal year 1970
Cumulative through
June 30, 1970
STATE UNEMPLOYMENT ACCOUNTS
Receipts: Appropriations from general fund i $138,024,733.38 $138,024,733.38 Deposits by States 53,831,464,438.65 $2,563,745,034.92 66,395,209,473.57 Interest earned:
Collected r 5,621,220,625. 51 574,319,280.46 6,196,539,905.97 Accrued-. . '•25,965,215.10 859,598.22 26,824,813.32
Totalreceipts 59,616,675,012.64 3,138,923,913.60 62,755,598,926.24
Expenditures: Withdrawals by States 47,529,859,239.35 2,794,633,783.12 60,324,393,022. 47 Advances to States
Total expenditures... 47,529,859,239.35 2,794,533,783.12 50,324,393,022.47
Transfers: From Employment Security Administra
tion Account (1958 Act) 21,626,148.97 2 12,548.93 21,638,697.90 To the railroad unemployment insm-ance
account 107,226,93L 89 107,226,93L 89 From Federal unemployraent account 236,765,000.00 236,765,000.00 Frora Federal extended corapensation
account (reimbursement).. 46,282,805.47 46,282,805.47 To Federal uneraployraent account 220,021,386.20 220,021,386. 20
Nettransfers.. 22,574,363.65 12,548.93 22,561,814.72
Balance 12,064,241,409.64 344,402,679.41 12,408,644,089.05
RAILROAD UNEMPLOYMENT INSURANCE ACCOUNTS
BENEFIT PAYMENTS ACCOUNT
Receints* Deposits by RaUroad Retirement Board... . 2,676,727,783. 64 127,944,793. 78 2,804,672,577.42 Advances from the railroad retireraent
account 700,601,000.00 44,950,000.00 745,551,000.00 From the railroad unemployraent insurance
adrainistration fund 106,187,199.00 106,187,199.00 Advance by the Secretary of Treasury 15,000,000.00 15,000,000.00 IntcrGst Giirnpd*
Collected ' ^222,200, 721. 57 83,460.09 222,284,181.66 Accrued '•27,528.17 124.92 27,653.09
Totalreceipts 3,720,744,232.38 172,978,378.79 3,893,722,61L 17
Expenditures: Benefit payments 3,122,373,645.34 92,955,042.06 3,215,328,687.40 To the railroad unemployment insurance
administration fund 12,338,198.54 12,338,198.54 Repayment of advances to railroad retire
raent account 585,611,000.00 78,635,000.00 664,246,000.00 Repayraent of advance to the Secretary of
theTreasury 15,000,000.00 15,000,000.00 Repayment of advances from general fund
for teraporary uneraployraent corapensation benefits 19,398,592.24 19,398,592.24
Payraent of interest on advances from railroad retirement account 77,878,376.04 4,876,165.97 82,754,542.01
Total expenditures 3,832,599,812.16 176,466,208.03 4,009,066,020.19
Transfers: To the railroad uneraployraent insurance
administration fund 3 3,464,997.48 3,464,997.48 From State unemployraent funds 107,226,93L 89 107,226,931.89 From the raihoad unemployment insurance
adniinistration fund ^
Net transfers
Balance
Footnotes at end of part I.
409-714—71 18
13,858, 773. 87
117,620, 708. 28
5,765,128. 50
1,932,083.06
1,932,083.06
-1,555,746.18
15, 790, 856. 93
119, 552, 791.34
4,209,382. 32
Digitized for FRASER http://fraser.stlouisfed.org/ Federal Reserve Bank of St. Louis
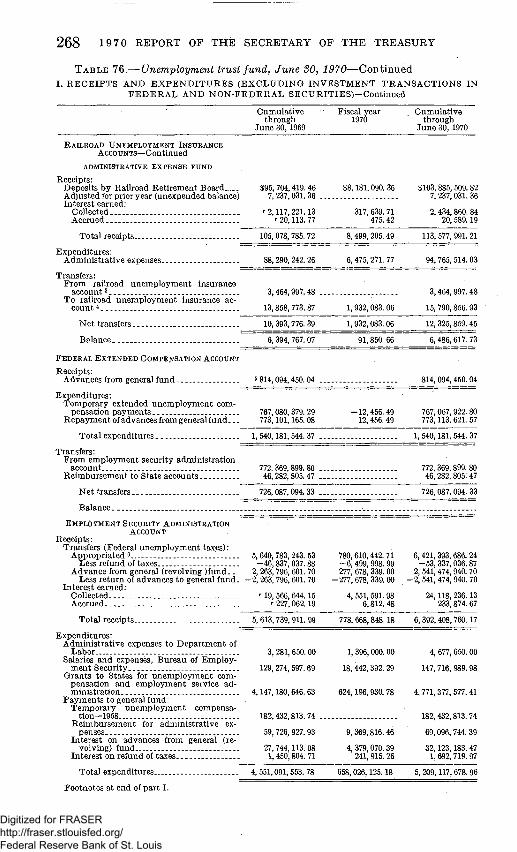
2 6 8 19 70 REPORT OF THE SECRETARY OF THE TREASURY
TABLE 76.— Unemployment trustfund, June 30, 1970—Continued I . R E C E I P T S A N D E X P E N D I T U R E S ( E X C L U D I N G I N V E S T M E N T T R A N S A C T I O N S I N
F E D E R A L A N D N O N - F E D E R A L S E C U R I T I E S ) — C o n t i n u e d
Curau la t ive through
June 30, 1969
Fiscal year 1970
Curau la t ive th rough
J u n e 30, 1970
R A I L R O A D U N E M P L O Y M E N T I N S U R A N C E ACCOUNTS-Continued
ADMINISTRATIVE E X P E N S E FUND
Deposits b y RaUroad Ret i reraent Board Adjus ted for prior year (unexpended balance) In teres t earned:
C oUected Accrued
Tota l receipts
$95, 704, 419. 46 7,237,03L36 .
$8,181, 090. 36
Expend i tu res : Adra in i s t ra t ive expenses.
Transfers: F ro ra railroad u n e m p l o y m e n t insurance
account 3 T o railroad unemployraen t insurance ac
count 4
3,464,997.48 .
13, 858,773. 87 1,932,083. 06
N e t t ransfers .
Balance
F E D E R A L E X T E N D E D C O M P E N S A T I O N ACCOUNT
Receipts : Advances from general fund
Expend i tu res : Te rapora ry extended unemploy raen t com
pensat ion p a y m e n t s R e p a y m e n t of advances from general f u n d . . .
Transfers: F r o m eraployraent securi ty adminis t ra t ion
account R e i m b u r s e m e n t to State accounts _
N e t t ransfers .
B a l a n c e .
E M P L O Y M E N T SECURITY A D M I N I S T R A T I O N ACCOUNT
Receipts : Transfers (Federal unemployraen t taxes):
Appropr ia t ed 6 5,640,783,243.53 Less refund of taxes -46,837,037.88
A d v a n c e from general (revolving ) f u n d . . 2, 263,796, 601. 70 Less r e tu rn of advances to general fund . —2,263,796, 601. 70
In te res t earned: Collected '•19,566,644.15 Accrued ••227,062.19
780, 610,442. 71 - 6 , 499, 998. 99 277, 678, 339. 00
-277,678,339.00
4, 551, 591. 98 6,812. 48
$103,885, 509. 82 7, 237, 031. 36
r 2,117, 221.13 r 20,113. 77
105,078, 785. 72
88, 290,242. 26
317, 639. 71 475. 42
8,499, 205. 49
6,475,271. 77
2,434, 860. 84 20, 589.19
113, 577, 991. 21
94, 765, 514. 03
3, 464, 997. 48
15, 790, 856. 93
10, 393, 776. 39
6, 394, 767. 07
fi 814,094,450. 04 . . .
767, 080, 379. 29 773,101,165. 08
1,540 181 544.37
772,369,899.80 . . . 46, 282, 805. 47
726,087,094.33 . . .
1, 932,083.06
91,850. 66
-12,456.49 12, 456. 49
12, 325, 859. 45
6,486, 617. 73
814, 094,450. 04
767, 067, 922. 80 773,113.. 621. 57
1, 540,181, 544. 37
772, 369, 899. 80 46, 282,805; 47
726, 087. 094. 33
6,421, 393, 686. 24 -53,337,036.87
2, 541,474, 940. 70 - 2 , 541, 474, 940. 70
24,118, 236.13 233,874.67
T o t a l r e c e i p t s . 5,613,739,911.99 778, 668, 848.18 6, 392,408, 760.17
Expend i tu re s : Admin i s t r a t i ve expenses to D e p a r t r a e n t of
Labor 3,281,650.00 1,396,000.00 Salaries and expenses, B m e a u of Eraploy
m e n t Secur i ty . 129,274,597.69 18,442,392.29 G r a n t s to Sta tes for u n e m p l o y r a e n t com
pensat ion and e m p l o y m e n t service admin is t ra t ion 4,147,180,64.6.63
P a y m e n t s to general fund: T e m p o r a r y unerap loyraen t corapensa
tion—1958 182,432,813.74 Re imburse raen t for adra in is t ra t ive ex
penses 59,726,927.93 Interes t on advances frora general (re
volving) fund 27,744,113.08 4,379,070.39 32,123,183.47 In te res t on refund of taxes 1,450,804.71 241,915.26 1,692,719.97
4, 677, 650. 00
147,716,989.98
624,196, 930. 78 4,771,377, 577. 41
182,432,813.74
9,369,816. 46 69,096, 744. 39
To ta l expenditures 4, 551,091, 553. 78
Footnotes at end of pa r t I .
658, 026,125.18 5, 209,117, 678. 96
Digitized for FRASER http://fraser.stlouisfed.org/ Federal Reserve Bank of St. Louis

STATISTICAL APPENDIX 2 6 9
TABLE 76.— Unemployment trustfund, June 30, 1970—Continued
L RECEIPTS AND EXPENDITURES (EXCLUDING INVESTMENT TRANSACTIONS IN FEDERAL AND NON-FEDERAL SECURITIES)—Continued
E M P L O Y M E N T SECURITY ADMINISTRATION ACCOUNT—Cont inued
Transfers: T o Sta te accoun t s . . T o Federa l u n e m p l o y m e n t account :
Excess 6 R e d u c e d tax credits :
A la ska . Michigan _
T o Federa l extended compensat ion accoun t .
N e t transfers
Balance . . . .
F E D E R A L U N E M P L O Y M E N T ACCOUNT •
Receipts : Appropr ia t ions from general fund i . . In te res t earned:
Collected . . . . . . Accrued
T o t a l receipts . . .
Expend i tu res : 'To B u r e a u of E m p l o y r a e n t Securi ty , De
p a r t m e n t of Labor
Transfers: T o Sta te u n e m p l o y m e n t accounts.-
• F r o m Sta te uneraployraent accoun t s . . . Frora employmen t securi ty adrainis t ra t ion
account—reduced tax credits F r o m emplo5mient securi ty adminis t ra t ion
account—excess 7
N e t transfers. '.
Balance
Und i s t r i bu t ed earnings: Collected . . . Accrued
Balance
S U M M A R Y OF Balances
Sta te u n e m p l o y m e n t accounts Rai l road u n e m p l o y m e n t insurance accounts :
Benefit p a y m e n t s account A d m i n i s t r a t i v e expense fund
Federa l extended compensat ion account E m p l o y m e n t security adminis t ra t ion accoun t . Federa l unen ip loym ent account U n d i s t r i b u t e d earnings
To ta l assets
Cumula t i ve th rough
J u n e 30,1969
$21,626,148.97
202,982,152.81
1,362, 411. 44 . . 15,381,202.36 . .
772,369,899.80 . .
1,013,721,815. 38
48, 926, 542. 83
207,350,872.17 . .
r 140,685,268. 79 r 1,139,952.98
349,176,093. 94
6,070,787.08-..
236,765,000.00 . . 220,021,386. 20 .
16,743,613.80
202, 982,152. 81
202,982,152. 81
•546,087,459.67
12,064,241, 409. 64
5,765,128. 50 6,394,767.07
48,926, 542.83 546,087,459.67
12,671,415,307. 71
Fiscal year 1970
$12,548.93
3,000,336.16
3,012, 885. 09
117,629, 837. 91
25,948,778.10 38,838.19 ,
25, 987,616. 29
3,000,336.16
3,000,336.16
28, 987, 952. 45
71. 84 -.11
7L95
344,402,679. 41
-1,555,746.18 91,850.66
117,629,837. 91 28, 987, 952. 45
7L95
489, 556, 646.20
Cumula t ive through
J u n e 30, 1970
$21, 638, 697. 90
205,982,488. 97
1, 362,411.44 15,381,202.36
772, 369,899. 80
1,016, 734, 700. 47
166, 556, 380. 74
207,350,872.17
166,634,046. 89 1,178, 791.17
375,163, 710. 23
6,070,787.08
236,765,000. 00 220,021,386. 20
16,743,613.80
205, 982, 488. 97
205, 982,488. 97
575,075,412.12
• 71.84 .11
71. 95
12,408,644,089. 05
4,209,382.32 6,486,617. 73
166, 556,380. 74 575,075,412.12
7L95
13,160, 971,953.91
1 Amounts appropriated to the unemployment trust fund prior to enactment of the Employment Security Act of 1960 representing the excess of collections from Federal unemployment tax over emplojmient security expenses (42 U.S.C. 1101(b)).
2 Represents transfer of $451.08 to Alaska, $3,203.85 to California, $661.77 to Indiana, $1,167.02 to Michigan $75.76 to Minnesota, $5,704.71 to New Jersey, $1,284.74 to West Virginia.
3 Amount transfered pmsuant to Public Law 88-133, approved Oct. 5, 1963 (77 Stat. 219). 4 Represents the excess in the administrative expense funds transferred pmsuant to sec. 11(d) ofthe Rail
road Unemployment Insurance Act (45 U.S.C. 361(d)). 8 Includes $36,274,280.68 not repayable to general fund pmsuant to sec. 905(a) of the Social Secmity Act as
amended. 8 Excludes unappropriated receipts of —$2,641,307.18 7 Represents excess in the employment security administration account transferred pm'suant to 42 U.S.C.
1102. »• Revised.
Digitized for FRASER http://fraser.stlouisfed.org/ Federal Reserve Bank of St. Louis

270 19 70 REPORT OF THE SECRETARY OF THE TREASURY
TABLE 76.— Unemployment trustfund, June SO, 1970—Continued I I . A S S E T S H E L D B Y T H E D E P A R T M E N T O F T H E T R E A S U R Y ( A C C R U A L B A S I S )
Assets J u n e 30, 1969 Fiscal year 1970
increase, or decrease (—)
J u n e 30,1970
I n v e s t m e n t s in publ ic d e b t secm-ities: Special issues, u n e m p l o y m e n t t rus t fund
series, m a t u r i n g J u n e 30: T reasu ry certificates of indebtedness :
4 M % o f l 9 7 0 63^% of 1971.
$9,956,932,000.00 -$9,956,932,000.00 10, 519,939,000.00 $10, 519,939,000. 00
T o t a l special issues 9,956,932,000.00 563,007,000. 00 10,519,939,000. 00
Pub l ic issues: T reasu ry notes:
5% Series A-1970. 534% Series A-1971 4M% Series A-1972 43^% Series B-1972 5 ^ % Series A-1975 6% Series B-1975 ^ y % Series A-1976 63^% Series B-1976 73^% Series C-1976 8% Series A-1977
T rea su ry bonds : 23^% of 1964^69 (dated Sept. 15,1943). 23^% of 1965-70 4% of 1969 (dated Oct. 1, 1957) 4% of 1970 (dated J an . 1, 1965) 4% of 1970 (dated J u n e 20, 1963).. 4% of 1971 3 ^ % of 1971 4% of 1972 (dated Sept. 15, 1962) 4% of 1972 (da ted N o v . 15, 1962) 4% of 1973 4 H % o f l 9 7 3 37^% of 1974 43^% of 1974. 4 ^ % of 1 9 7 4 . . . 43^% of 1975-85 3 ^ % of 1978-83 4% of 1980 33^% of 1980 3> i%of l985 4 ^ % of 1987-92 4% of 1988-93 43^% of 1989-94. 33^% of 1990. 33^% of 1998 2 y % I n v e s t m e n t Series B-1975-80
T r e a s u r y bUls m a t u r i n g : A u g . 31, 1969 Sept . 30, 1969 N o v . 5, 1970.
5,750,000.00 . 68,200,000.00 . 7,000,000.00 .
192,000,000.00 . 31,500,000.00 . 3,000,000.00 .
19,000,000.00 . 1,000,000.00 .
5,600,000.00 15,000,000.00 26,100, 000. 00
119,250,000. 00 3,000,000.00 .
10,000,000.00 . 12,000,000.00 . 46,500,000.00 . 31,500,000.00 . 48,000,000.00 .
9,000,000.00 . 16,000,000.00 .
127,000,000.00 . 2,640,000.00 .
32,710,000.00 . 53,050,000.00 .
106,000,000.00 . 53,000,000.00 . 14,000,000.00 .
104,000, 000.00 17, 500, 000. 00 .
174,300,000.00 . 112, 221,000.00 43,200,000.00 .
745,000,000.00 .
20,400,000.00 4,000,000.00
31, 700,000.00 134,250,000. 00
—5,600,000.00 . —15,000,000.00 . —26,100,000.00 .
—119,250,000.00 .
2, 490,000.00
788,000.00
—20,400,000.00 . —4,000,000.00 .
10,650,000. 00
5, 750,000.00 68,200,000.00 7,000,000.00
192,000,000. 00 31, 500,000.00 3,000,000.00
19,000,000.00 1,000,000.00
31,700,000.00 134,250,000.00
3,000,000.00 10,000,000.00 12,000,000.00 46, 500,000.00 31, 500,000. 00 48,000,000.00 9,000,000.00
16,000,000.00 127,000,000.00
2,640,000. 00 32,710,000.00 53,050,000.00
106,000,000.00 53,000,000.00 14,000,000.00
106,490,000.00 17, 500,000.00
174,300,000.00 113,009,000. 00 43,200,000. 00
745,000,000. 00
10,650,000. 00
To ta l pubUc issues 2,278,421,000.00 —10, 472,000. 00 2,267, 949,000. 00
Digitized for FRASER http://fraser.stlouisfed.org/ Federal Reserve Bank of St. Louis

STATISTICAL APPENDIX 271 TABLE 76.— Unemployment trust fund, June SO, 1970—Continued
IL ASSETS HELD BY THE DEPARTMENT OF THE TREASURY (ACCRUAL BASIS) -Continued
Assets June 30, 1969 Fiscal year 1970
increase, or decrease (—)
June 30, 1970
Investments in non-Federal secmities: Federal National Mortgage Association sec
ondary market operations debentures: 53^% of 1969 $25,000,000.00 —$25,000,000.00 . 6% of 1969 41,500,000.00 —41,500,000.00 . 5 ^ % of 1970 20,000,000.00
Total non-Federal securities 86,500,000.00 —66, 500,000.00
$20,000,000.00
20,000,000.00
Investments in agency securities: Government National Mortgage Association
Federal assets liquidation trust: 5M%of 1969-. 5.20% of 1972.
Federal assets finance trust: 6.35% of 1970 .-6% of 1971 6.30% of 1971
$50,000,000.00 100,000,000.00 .
15,000, 000. 00
-$50,000,000.00 . $100, 000, 000. 00
-15,000,000.00 .
Total agency securities..
70,000,000.00... 30,000,000.00 . . .
265,000, 000.00 -65,000,000.00
70, 000,000. 00 30, 000, 000. 00
200,000,000. 00
Total investraents, par value Unexpended balances:
T rust account Railroad unempl03rment insurance ac
counts: Benefit payments account Administrative expense fund.
Federal extended compensation account Employment security administration ac
count Accounts receivable
12, 586, 853,000.00
16, 324, 645. 89
600, 354. 66 762, 455. 92
421,035,000. 00 13,007,888,000. 00
12, 958, 588.19 29,283, 234.08
-200,042.06 -490, 271. 77
400, 312. 60 272,184.15
45, 925, 644. 43 45,419. 38
56,113,880. 63 -45, 419. 38 .
102, 039, 525. 06
Subtotal. Accrued interest on investments. Unamortized discount Unamortized premium Accrued interest purchased
12, 650, 511, 520. 28 27, 379,872. 21
- 7 , 266, 909. 23 785, 348. 91
5, 475. 54
0, 371,735. 61 905,849. 34
-747,079. 23 -98,422.46 124, 562. 94
13,139,883, 255. 89 28, 285,721. 55
-8,013, 988. 46 686, 926. 45 130,038.48
Totalassets 12,671,415,307.71 489, 556, 646. 20 13,160,971,953. 91
Digitized for FRASER http://fraser.stlouisfed.org/ Federal Reserve Bank of St. Louis

TABLE 76.— Unemployment trustfund, June 30, 1970—Continued
I I I . B A L A N C E O F U N E M P L O Y M E N T T R U S T F U N D B Y S T A T E S A N D O T H E R A C C O U N T S A S O F J U N E 30,1969 O P E R A T I O N S I N 1970, A N D B A L A N C E J U N E 30, 1970
States a n d other accounts Balance
J u n e 30, 1969 . Operat ions in fiscal 1970
Deposi ts Earn ings Transfers Withdrawals
Ba lance ^ June 30,1970
Pi
O Pi
o
ZP
o pi
y ^
> Pi y<
o
Pi
> ZP
d
A l a b a m a $125,788,159.34 $26,103,000.00 $6,146, Alaska 22,137,230.19 15,421,345.28 1,262, Arizona 99,606,725.17 21,769,036.24 5,029, Arkansas 1 48,910,289.16 15,436,248.68 2,343, California 1, 208,623,956.. 31 530,954,967.53 69,631, Colorado 77,344,232.63 13,906,444.94 3,696, Connect icut 298,374,774.84 67,314,627.99 13,828, Delaware 24,228,828.88 6,290,000.00 1,093, Dis t r ic t of Co lumbia 74,865,602.24 8,125,116.93 3,476, F lo r ida . 248,004,135.04 34,897,000.00 11,868, Georgia 302, 229,12L 26 37,797,550.88 14,789, Hawai i 38,607,553.82 14,222,798.30 1,964, I d a h o 41,781,577.60 9,037,875.00 2,019, Illinois 504,026,499.02 53,888,110.33 -22,488, I n d i a n a 304,374,899.68 49,929,955.23 14,788, Iowa 130,547, OOL 63 14,204,795.41 6,066, Kansas 95,678,816.10 16,462,247.61 4,490, K e n t u c k y 163,608,080.60 27,950,000.00 7,835, Louis iana 161,947,314.26 31,975,362.92 7,402, Mame 43,363,3n.76 10,189,470.00 2,013, Maryland 225,872,903.78 22,232,779.00 10,474, Massachuset ts 388,853,198.85 ' 121,699,856.15 18,694, Michigan 610,563,417.90 125,787,892.79 28,382, Mhmesota 99,777,87L07 - 46,545,000.00 5,317, Mississippi 83,127,778.01 7,550,000.00 3,912, Missouri 280,254,038.69 37,803,426.86 13,051, Montana 23,684,766.62 6,618,950.00 1,146, Nebraska 52,873,666.50 7,148,085.50 2,538, N e v a d a 34,249,409.93 12,230,000.00 • 1,743, N e w H a r a p s h i r e . 50,636,624.00 6,151,567.31 2,473, N e w J e r s e y 458,645,239.97 181,410,000.00 21,784, N e w Mexico 40,807,297.55 7,089,314.00 1,936, N e w York 1, 745,097,3IL 87 320,029,39L 78 81,950,
,642.89 . . . : $23,500,000.00 897.44 i$45L08 9,021,238.41 483.40 - 9,736,550.48 368.67 17,525,000.00 468.19 13,203.85 500,746,275.38 365.97 10,065,000.00 242.00 87,505,12L68 114.51 7,713,000.00 248.40 11,055,000.00 324.08 26,670,600.00 030.86 . 21,514,000.00 857.01 9,750,000.00 012.45 8,460,000.00 980.49 131,950,000.00 016.41 166L77 42,275,000.00 609.67 . - 22,414,399.32 500.21 22,948,359.72 69L81 - . 28,765,000.00 696.27 - . 48,763';321. 00 275.19 . - 13,905,129.98 64L30 . ..• 36,585,000.00 838.98 123,890,000.00 544.45 11,167.02 179,265,000.00 312.40 75.76 35,880,000.00 477 62 - 11,585,000.00 397.56 - - 57,819,854.88 197.71 7,050,000.00 585.33 - . . . . . . . 7,350,000.00 201 20 9,445,440.00 983 78 - - - 4,091,000.00 095.89 15,704.71 ^ 191,10.0,000.00 675 00 . . . . 8,290,000.00 183*44 " " -- 381,584,477.53
$134, 29, 116,
84, 292, 23, 75, 268, 333, 45, 44, 448, 326, 128, 93, 170, 152, 41, 221, 405, 585, 115, 83, 273, 24, 55, 38, 55, 470, 41,
1,765,
537,802. 23 800,685. 58 668,694.33 164,906.51 467,320. 50 882,043. 54 012.523.15 898,943.39 411,967. 67 198.859.12 301,703. 00 045.209.13 378,465. 05 453,689.84 818,533. 09 404,007.39 683,203. 20 628,772.41 562,052:45 660,926. 97 995,324.08 357,893. 98 470.022.16 760,259. 23 005,255. 63 289,008. 23 299,914.33 210,337.33 777,171.13 171,175. 09 745,040. 57 543,286. 55 492,409. 56
Digitized for FRASER http://fraser.stlouisfed.org/ Federal Reserve Bank of St. Louis
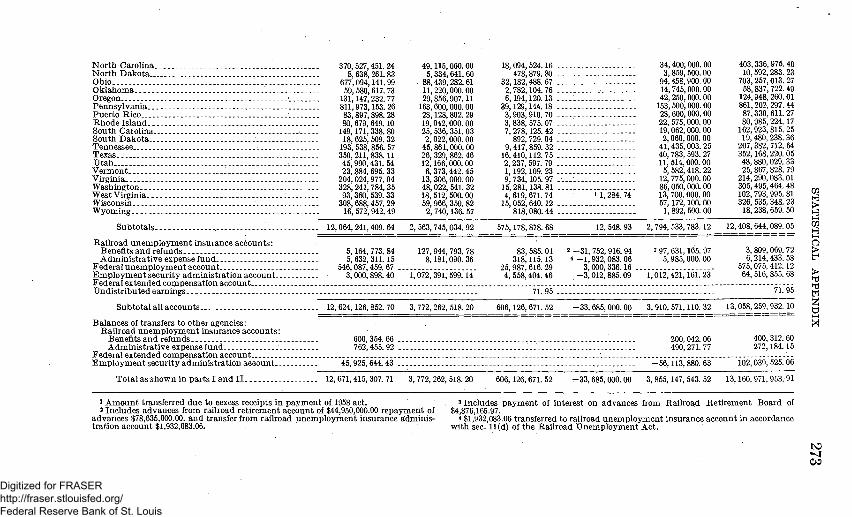
N o r t h Caro l ina . N o r t h D a k o t a . . . Ohio .-Oklahoraa Oregon P e n n s y l v a n i a . . . Pue r to Rico R h o d e I s l a n d - . . South Carolhia.-South D a k o t a . . . Tennessee Texas U t a h . . . . Ver raon t Virginia Washhigton West V h g i n i a . . -Wisconsin Wyoming
" 370,527, 8,638,
677,094, 59,580,
131,147, 811,973, 83,897, 80, 679,
149,171, 18, 625,
193, 538, 350,211, 45,990, 23, 884,
204,024, 328,241,
93, 360, 308, 688,
16, 572,
451. 24 261. 83 14L99 617. 73 232. 77 153. 26 898.28 649.10 338. 80 509. 32 856. 57 838.11 431. 54 695. 33 977. 04 784. 35 539. 33 457. 29 942. 49
49,115, 5,334,
88,439, 11,220, 29,856,
163,600, 28,128, 19,042, 25, 536, 2,022,
45, 861, 26, 329, 12,166, 6,373,
13,306, 48,022, 18, 512, 59,966,
2, 740,
000. 00 64L60 282.61 000.00 907.11 000. 00 802. 29 000. 00 351. 03 000. 00 000. 00 862. 46 000. 00 442. 45 000. 00 541. 32 500. 00 350. 82 136. 57
18, 094, 478,
32,182, 2,782, 6,194,
39,129, 3,903, 3, 838, 7, 278, 892,
9,417, 16,410, 2, 237, 1,192, 9, 734, 15, 281, 4, 619, 15,052,
818,
524.16 . 879.80 . 488.67 . 104.76 . 120.13 . 144.18 . 910.70 . 575.07 . 125.42 . 729.04 . 859. 32 . 112. 75 . 597.79 . 109.23 . 105.97 . 138.81 . 67L 74 640.12 . 080.44 .
1 1,284. 74
34,400, 3,859, 94,458, 14,745, 42,250, 153,500, 28,600, 22, 575, 19,062, 2,060, 41,435, 40,783, 11, 514, 5, 582,
12, 775, 86,050, 13, 700. 57,172, 1, 892,
000. 00 500. 00 900. 00 000. 00 000. 00 000. 00 000. 00 000. 00 000. 00 000. 00 003. 25 593. 27 000. 00 418. 22 000. 00 000.00 000. 00 100. 00 500. 00
403,336, 10,592,
703,257, 58,837, 124,948, 861,202, 87,330, 80,985, 162,923, 19,480,
207,382, 352,168. 48,880, 25, 867,
214,290, 305,495, 102, 793, 326, 535, 18, 238,
975. 40 283.23 013. 27 722.49 260.01 297.44 611. 27 224.17 815. 25 238. 36 712.64 220. 05 029. 33 828. 79 083.01 464. 48 995. 81 348. 23 659. 50
S u b t o t a l s . . . 12,064,241,409.64 2,563,745,034.92 575,178, 878. ( 12, 548. 93 2, 794, 533,783.12 12, 408, 644, < 1.05
RaUroad u n e m p l o y m e n t insurance accounts : Benefits a n d refunds Admin i s t r a t i ve expense fund
Fede ra l unerap loyrnen t account E m p l o y m e n t secur i ty admin i s t r a t ion account . . Fede ra l extended compensat ion account Und i s t r i bu t ed eamhigs
5,164, 773. 84 5, 632,31L 15
646,087,459. 67 . 3,000,898. 40
127, 944,793. 78 8,181,090. 36
'i, '672,'39i,'599.'i4'
83, 585. 01 318,115.13
25,987, 616. 29 4, 558,404. 46
2 -31,752, 916. 94 4 -1 ,932,083. 06
3,000, 336.16 . -3 ,012 , 885. 09
3 97, 631,165. 97 5,985,000. 00
'i , 'oi2,"42i, ' i6i. '23'
3, 809,069. 72 6,214, 433. 58
575,075, 412.12 64, 516, 855. 68
7L 95 . 71.95
Sub to ta l aU accounts 12,624,126,852.70 3,772,262,518.20 , 126, 671. 52 -33, 685,000. 00 3, 910, 571,110. 32 13,058, 259,932.10
Balances of transfers to o ther agencies: Rai l road u n e m p l o y m e n t insurance accounts :
Benefits a n d refunds A d m i n i s t r a t i v e expense fund . ,
Federa l extended compensa t ion account E r a p l o y m e n t secur i ty admin i s t r a t ion a c c o u n t . . .
600,354.66 . 762,455.92
200,042. 06 490,271. 77
400, 312. 60 272,184.15
45, 925, 644. 43 . -56 ,113 , 880. 63 102,039, 525. 06
ZP
> t-H ZP
>
h^
T o t a l as s h o w n in p a r t s I a n d I I 12,671,415, 307. 71 3,772, 262, 518. 20 , 126,671. 52 -33,685,000. 00 3, 855,147, 543. 52 13,160,971, 953. 91
J A m o u n t transferred d u e to eexcss receipts in p a y m e n t of 1958 act.. 2 Inc ludes advances from rai lroad re t i r ement account of $44,950,000.00 r e p a y m e n t of
advances $78,635,000.00, a n d transfer from rai lroad u n e m p l o y m e n t insurance adminis t ra t ion account $1,932,083.06.
3 Inc ludes p a y m e n t of interest on advances from Rai l road Re t i r emen t Board of $4,876,165.97.
4 $1,932,083.06 transferred to railroad unemploy raen t insurance account i n accordance wi th sec. 11(d) of the Rai l road U n e m p l o y m e n t Act .
IN:)
0 0
Digitized for FRASER http://fraser.stlouisfed.org/ Federal Reserve Bank of St. Louis

274 19 70 REPORT OF THE SECRETARY OF THE TREASURY
TABLE 77.— U.S. Government life insurance fund, June 30, 1970
[This trust fund operates in accordance with theprovisionsof theact of June 7,1924, asamended (38 U.S.C. 755). For further details, see annual report of the Secretary for 1941, p. 142]
I. RECEIPTS AND E X P E N D I T U R E S (EXCLUDING INVESTMENT TRANSACTIONS)
Cumulative through
June 30, 1969 Fiscal year 1970
Cumulative through
June 30, 1970
Receipts: Premiums and other receipts $2,139,267,736.08 $10,123,009.60 $2,149,390,745.68 Interest and profits on investments 1,364,478,403.71 31,346,682.73 1,395,825,086.44 Paynients from general fund 1 -52,061.03 57,67L92 5,610.89
Totalreceipts 3,503,694,078.76 41,527,364.25 3,545,221,443.01 Expenditures:
Benefit payments, dividends, and refunds.. 2, 658,613,686. 73 84,177,896. 94 2, 742, 791,583. 67
Balance 845,080,392.03 -42,650,532.69 802,429,859.34
II. ASSETS HELD BY THE TREASURY DEPARTMENT
Assets June 30, 1969 Fiscal year 1970
increase, or decrease (—)
June 30, 1970
Investments in public debt securities: Special issues, U.S. Government life insur
ance fund series, maturing June 30: Treasury notes:
4^%ofl971 $77,986,000.00 . 534% of 1975 64,365,000.00 . 6% of 1976 32,638,000.00 . 734% of 1977
Treasury bonds: 33^% of 1970 73,100,000.00 3 ^ % of 1970 670,000.00 3>^%0fl971 73,100,000.00 3M%ofl971 670,000.00 . 33^% of 1972... 73,100,000.00 -3M%ofl972 670,000.00 . 33^% of 1973 73,100,000.00 . 3K%ofl973.. . : 670,000.00 . 33^% of 1974 73,100,000.00 . 3M%ofl974 670,000.00 . 3M%ofl975 73,770,000.00 . 33^% of 1976 67,799,000.00 . 3M%ofl976 - 5,971,000.00 . 3>^%ofl977 49,963,000.00 . 3M%ofl977 23,807,000.00 . 3 ^ % of 1978 48,214,000.00 . 434% of 1978 25,556,000.00 . 43^% of 1979 2,912,000.00 .
Total special issues 841,831,000. 00
Total investments 841,831,000. 00 Undisbursed balance 3,249,392.03
Totalassets... 845,080,392.03
$29, 964, 000. 00
-73,100,000. 00 . -670,000. 00 .
-1,282,000.00
-45, 088, 000. 00
-45, 088, 000. 00 2,437, 467. 31
$77, 986,000. 00 64,365,000. 00 32,638, 000. 00 29, 964,000. 00
71, 818, 670,
73,100, 670,
73,100, 670,
73,100, 670,
73, 770, 67, 799,
5, 971, 49,963, 23,807, 48,214, 25, 556, 2, 912,
000. 00 000.00 000.00 000.00 000.00 000.00 000. 00 000.00 000. 00 000.00 000. 00 000. 00 000. 00 000. 00 000. 00 000. 00
796, 743,000. 00
796, 743, 000. 00 5, 686, 859. 34
-42, 650, 532. 69 802,429,859. 34
1 Included under premiums and other receipts prior to fiscal 1962. Negative aniounts frora adjustnients of prior years' receipts.
NOTE.—Policy loans outstanding on basis of inforniation furnished by the Veterans' Administration araounted to $80,410,245.10 as of June 30, 1970.
Digitized for FRASER http://fraser.stlouisfed.org/ Federal Reserve Bank of St. Louis

STATISTICAL APPENDIX 275
Customs Operations T A B L E 78.—Merchandise entries, fiscal years 1969 and 1970
Entr ies 1969 1970 Percen tage increase, or
decrease (—)
Consurap t ion free 531,859 548,258 C o n s u m p t i o n du t iab le 1,917,505 2,119,320 Warehouse a n d rewarehouse 84,160 75,298 Other formal 4,316 2,862
To ta l formal entries 2,537,840 2,745,738
Warehouse wi thdrawals 484,954 375,283 Appra i sement 886 791 Drawback 23,229 20,172 Outbound—immedia t e t ranspor ta t ion; t ranspor ta t ion and
exportarion, etc 824,465 903,778 Mai l 2,343,462 2,928,674 Inforraal 878,118 971,905 Passenger declarations—total 5,468,176 6,418,719 Crew declarations—total 1,323,301 1,454,905 M i h t a r y declarat ions—total 1,872,355 1,901,182 Passengers declarat ions—dutiable 545,123 653,284 Crew dec la ra t ions—dut iab le . : 167,134 128,847 MiUtary declarat ions—dutiable 62,859 64,413 Other—informal 1,790,251 1,952,971
3.08 10.52
-10.53 - 3 3 . 69
8.19
-22. 61 -10. 72 -13.16
9.62 24.97 10.68 17.38
9.95 L 5 4
19.84 -22 .91
2.47 9.09
T A B L E 79.- -Carriers and persons arriving in the United States, fiscal years 1969 and 1970 1
T y p e of en t r an t 1970 Percentage increase, or
decrease (—)
Carriers arr iv ing: Vessels entering direct from foreign ports 49,500 48,063 —2.90 Vessels entering via U . S . ports (36,462) (41,293) 13.25 Vessels report ing only from foreign por ts :
Governraent 1,382 (*) Ferries 59,756 57,495 - 3 . 7 8 Other 43,247 (*)
Comraercial planes 191,930 200,912 Comraercial planes entering via U .S . ports 2 (17,591) (21,415) Mili tary planes 50,301 46,608 P r iva t e planes 100,306 97,883 Other g round vehicles 63,589,368 62,088,494 Fre ight carrier vehicles 3,049,360 3,222,313
To ta l carriers 67,135,150 65,761,768
Persons arr iving on: Vessels entering 728,457 722,618 Vessels report ing only frora foreign por ts :
Governmen t 296,246 (*) Ferries 1,431,454 1,152,141 Other 119,084 (*)
Conmiercial planes 8,778,008 10,820,010 Comraercial planes via U .S . ports 118,216 155,675 Mili tary planes 1,812,275 1,692,338 P r iva t e planes 332,202 263,988 L a n d border crossers 213,877,419 210,873,398
To ta l persons 227,493,361 225,680,168 - 0 . 8 0
4.68 2L74
- 7 . 3 4 - 2 . 4 2 - 2 . 3 6
5.67
- 2 . 0 5
-0 .80
- 1 9 . 51
23.26 31.69
- 6 . 6 2 - 2 0 . 53
- 1 . 4 0
* Statistics no longer collected. 1 Excludes Pue r to Rico and the Virgin Is lands . 2 N o t included in totals , a lready counted unde r entering vessels frora foreign ports .
Digitized for FRASER http://fraser.stlouisfed.org/ Federal Reserve Bank of St. Louis
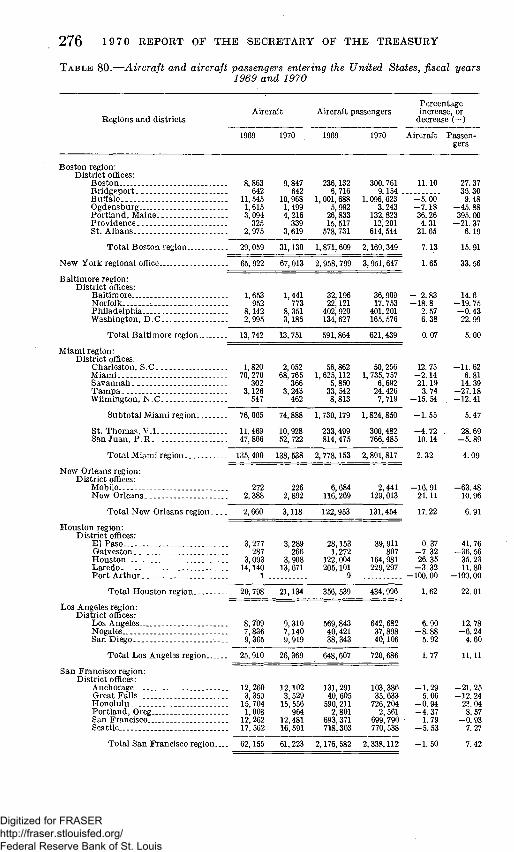
276 19 70 REPORT OF THE SECRETARY OF THE TREASURY
T A B L E 80.—Aircraft and aircraft passengers entering the United States, fiscal years 1969 and 1970
Regions and distr icts Ahcraf t
1969
8,863 642
. 11,545 1, 615 3, 094
325 2, 975
1970
9,847 642
10, 968 1,499 4, 216
339 3,619
Aircraft passengers
1969
236,132 6,716
1, 001, 688 5,992
26, 833 15, 517
578, 731
1970
300, 761 9 154
1,096,'623 3,243
132,823 12,201
614, 544
Percei increa
decrea;
Aircraft
ILIO
- 5 . 0 0 - 7 . 1 8 36.26 4.31
21.65
ntage se, or 3 e ( - )
Passengers
27.37 36.30
9.48 - 4 5 . 88 395. 00
- 2 L 3 7 6.19
Boston region: Distr ic t offices:
Boston Br idgepor t Bufialo Ogdensburg P o r t l a n d , Maine . Providence S t . A l b a n s
T o t a l Bos ton region 29,059 31,130
N e w York regional office 65,922 67,013
Bal t imore region: Dis t r ic t offices:
Ba l t imore 1,653 1,441 Norfolk . 952 773 Phi lade lph ia 8,142 8,351 Washington, D . C 2,995 3,186
To ta l Bal t imore region 13, 742 13,751
Miarai region: Dis t r ic t offices:
Charleston, S.C 1,820 2,052 Miami 70,270 68,765 Savannah 302 366 T a m p a 3,126 3,243 Wilrahigton, N . C 547 462
Subtota l Miami region
St. T h o m a s , V . I San J u a n , P . R
Tota l Miami region
N e w Orleans region: Dis t r ic t offices:
Mobile N e w Orleans
To ta l N e w Orleans region
Hous ton region: Dis t r ic t offices:
E l P a s o 3,277 Galveston 287 Hous ton 3,093 Laredo 14,140 P o r t Ar thur 1
To ta l Hous ton region 20,798 21,134
Los Angeles region: Dis t r ic t offices:
LosAnge les 8,709 9,310 Nogales 7,836 7,140 S a n D i e g o 9,365 9,919
Tota l Los Angeles region 25,910 26,369
S a n Francisco region: Distr ic t offices:
Anchorage 12,260 12,102 G r e a t F a U s 3,359 3,529 Honolu lu 15,704 15,556 Por t l and , Oreg 1,008 964 S a n F r a n c i s c o 12,262 12,481 Seattle 17,562 16,591
Tota l San Francisco region 62,155 61,223
1,871, 609 2,169, 349
2, 958, 799 3,951, 647
7.13
L65
591, 864 621,439
56,862 1, 625,112
5,850 33,542 8,813
50,256 1, 735, 757
6,692 24,426
7,719
. 76,065
. 11,469
. 47,866
. 135,400
272 2,388
2, 660
74,888
10, 928 52,722
138, 538
226 2,892
3,118
1, 730,179
233,499 814,475
2, 778,153
6,684 116,269
122,953
1,824,850
300,482 766,485
2,891,817
2,441 129,013
131,454
0.07
12.75 - 2 . 1 4 21.19
3.74 - 1 5 . 54
- L 5 5
- 4 . 7 2 10.14
-16. 91 2L11
17.22
356, 539 434,996
569,843 40,421 38,343
642,682 37,898 40,106
648,607 720,686
131,291 40,605
590,211 2,801
693,371 718,303
103,386 35,633
726,204 2,561
699,790 770, 538
2,176, 582 2,338,112
6.90 -8 .88
5.92
L77
- 1 . 29 5.06
-0 .94 -4 .37
L79 -5 .53
-1 .50
15.91
33.56
32,196 22,121
402,920 134, 627
36,909 17,753
401,201 165, 576
- 2.83 - 1 8 . 8
2.57 6.38
14.6 - 1 9 . 7 5 - 0 . 4 3 22. 99
5.00
- 1 1 . 6 2 6.81
14.39 - 2 7 . 1 8 - 1 2 . 4 1
5.47
28.69 - 5 . 8 9
4.09
- 6 3 . 4 8 10.96
6.91
3,289 266
3,908 13,671
28,153 1,272
122, 004 205,101
9 . .
39, 911 807
164, 981 229,297
0.37 - 7 . 3 2 26.35
- 3 . 3 2 -100 .00
41.76 - 3 6 . 56
35.23 n . 8 0
-100 .00
22.01
12.78 - 6 . 2 4
4.60
I L l l
- 2 1 . 25 -12. 24
23. 04 8.57
- 0 . 9 3 7.27
7.42
Digitized for FRASER http://fraser.stlouisfed.org/ Federal Reserve Bank of St. Louis
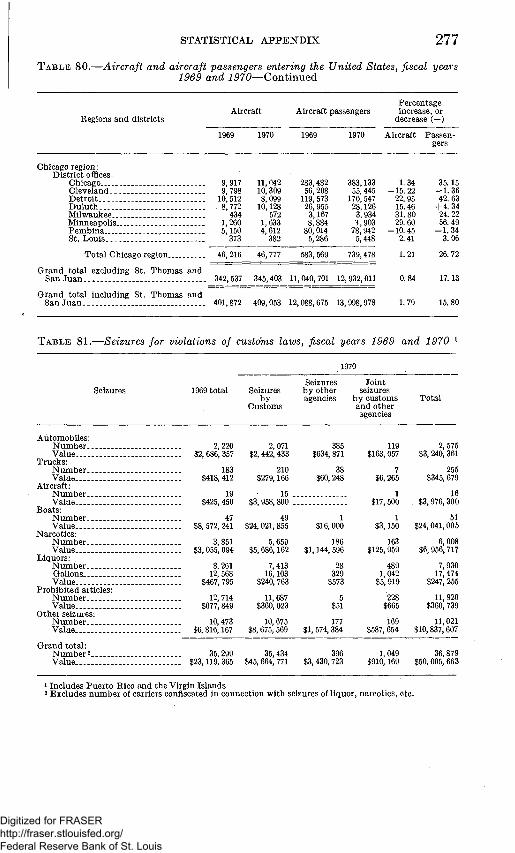
STATISTICAL APPENDIX 277
T A B L E 80.—Aircraft and aircraft passengers entering the United States, fiscal years 1969 and i^70—Continued
Regions and districts Ahcraft
1970
Aircraft passengers
1970
Percentage increase, or decrease (—)
Aircraft Passengers
Chicago region: District offices:
Chicago.... 9,917 11,042 283,482 383,133 1.34 35.15 Cleveland 9,798 10,309 56,208 55,445 -15.22 -1.36 Detroit 10,512 8,099 119,573 170,547 22.95 42.63 Duluth 8,772 10,128 26,955 28,126 15.46 -f4.34 Milwaukee 434 572 3,167 3,934 3L80 24.22 Minneapolis.. 1,260 1,633 8,884 3,903 29.60 56.49 Pembina , 5,150 4,612 80,014 78,942 -10.45 - L 3 4 St .Louis . . 373 382 5,286 5,448 2.41 3.06
Total Chicago region 46,216 46,777 583,569 739,478 1.21 26.72
Grand total excluding St. Thomas and San Juan 342,537 345,403 11,040,701 12,932,011 0.84 17.13
Grand total including St. Thomas and SanJuan 401,872 409,053 12,088,675 13,998,978 L 79 15.80
T A B L E 81.—Seizures for violations of customs laws, fiscal years 1969 and 1970 ^
1970
Seizures Joint Seizmes 1969 total Seizures by other seizures
by agencies by customs Total Customs and other
agencies
AutomobUes: Number 2,220 2,071 385 119 2,575 Value $2,686,357 $2,442,433 $634,871 $163,057 $3,240,361
Trucks -Number 183 210 38 7 255 Value $418,412 $279,166 $60,248 $6,265 $345,679
Aircraft: Number 19 15 1 16 Value $425,450 $3,958,800 $17,500 $3,976,300
Boats: Number 47 49 1 1 51 Value $8,572,241 $24,021,855 $16,000 $3,150 $24,041,005
Narcotics: Number. 3,851 5,659 186 163 6,008 Value... $3,055,094 $5,686,162 $1,144,596 $125,959 $6,956,717
Liquors: Number 8,261 7,413 28 489 7,930 GaUons 12,568 16,103 329 1,042 17,474 Value $467,795 $240,763 $573 $5,919 $247,255
Prohibited articles: Number . . . . 12,714 11,687 5 228 11,920 Value $677,849 $360,023 $51 $665 $360,739
Other seizm-es: Number. . . 10,473 10,675 177 169 11,021 Value $6,816,167 $8,675,569 $1,574,384 $587,654 $10,837,607
Grand total: Number 2 35,299 35,434 396 1,049 36,879 Value $23,119,365 $45,664,771 $3,430,723 $910,169 $50,005,663
1 Includes Puerto Rico and the Virgin Islands 2 Excludes number of carriers confiscated in connection with seizures of liquor, narcotics, etc.
Digitized for FRASER http://fraser.stlouisfed.org/ Federal Reserve Bank of St. Louis

2 7 8 19 70 REPORT OF THE SECRETARY OF THE TREASURY
T A B L E 82.—Investigative activities, fiscal years 1969 and 1970
Activity Percentage increase, or decrease (—)
Drawback.. Classification Market value SmuggUng, narcotics Sinuggling, all other. Undervaluation, false invoicing, etc .Prohibited iraportations Navigation, aircraft, and vehicle violations. Baggage declarations Custoras brokers, cartraen and lightermen. Petitions for relief.. Personnel Custoras procedure CoUection of duties and penalties Cooperation with other agencies. Neutrality Pilferages and shortages Export control Federal tort clahns MisceUaneous Dumping. CountervaUing duties
Total
922 150 557
10, 562 2, 539 2,348 506 716 868 561
2,356 1, 993 422 386
1,718 203 681 304 156 161 53 13
660 219
1,020 14, 221 2, 056 1,882 475 588 713 732
2,010 3,286 381 254
1,970 220 654 208 162 262 60 7
-28. 42 46.00 83.12 34.64
-19.02 -19.85 -6.13 -17.88 -17.86 30.48
-14.69 64.88 -9.72 -34. 20 14.67 8.37
-3.96 -31. 58
3.85 62.73 13.21
-46.15
28,175 13.72
T A B L E 83.- -Principal commodities on which drawback was paid, fiscal years 1969 and 1970 i
Commodity 1969
$3, 056, 560 761,307 80, 065 81,305
7,408,365 31,847
2, 687,802 711, 909 408,519 158,148 27,586
122, 042 161,499 471,376 79, 047 52,263 581,110 131, 922 39,043
1, 285,012 20,834 238,901 98,652 . 164,731
14,697,425 30,479 66,549 750,225
2,447,324 665,304 166, 944
1,138, 253 302,135 787,739 188, 543 123,734
. 40, 224,499
1970
$2, 648,670 183,325 455, 232 61, 794
4,714,332 5,350
5,303,893 2, 530,036 374,036 107,438 28,530 129,350 153,338 115, 923 77,516 50,613
253,649 158,550 44,665 16,278 3,067
337,705 106,136 144,306
12,509,314 111,485 37,839
1,264.173 3,175,112 1,179, 226
40, 260 1,159,810 436,512 543,058 232,284
1,396,082
40,088,887
Percentage mcrease
or decrease (-)
-13.34 -75. 92 468. 58 -24. 00 -36. 36 -83. 20 97.33
255. 39 -8.44 -32.06
3.42 5.99
-5.05 -75. 41 -L94 -3.16 -56. 35 20.18 14.40
-98. 73 -85. 28 4L36 7.59
-12.40 -14.89 265. 78 -43.14 68.51 29. 74 77.25
-75. 88 L89 44.48
- 3 L 06 23.20
1, 028. 29
-.34
Aluminum Animal and vegetable oils, fats, and greases. Automobiles, aircraft, and parts Burlap C hemicals Chromium and alloys Citrus fruit juices C oal-tar products Copper and manufactures Cotton cloth Cotton manufactures Diesel engines Electrical machinery Ferroalloying ores and metals Fruits and preparations Glass and glass products Lead ore, matte, pigs, and bars Machinery, other than electric Magnesite Magnesium Manganese ore Medica 1 preparations Nickel Paper and manufactures Petroleum and products Pigments, paints and varnishes Quicksilver or mercury Rayon and other synthetic textiles Steel mill products . Sugar Tires and tubes, rubber and synthetic Tobacco and manufactures Tungstenore Watch movements and parts Z inc ore and manufactures Other
Total
1 Includes Puerto Rico.
Digitized for FRASER http://fraser.stlouisfed.org/ Federal Reserve Bank of St. Louis

STATISTICAL APPENDIX 279
Engraving and Printing Production T A B L E 84.—New postage stamp issues delivered, fiscal year 1970
Issues Denomina- Number of
tions stamps delivered (in thousands)
Coraraeraoratives: California Bicentennial John Wesley Powell 150th Anniversary of Alabama Statehood. l l th International Botanical Congress Moon Landing Air Mail Dartmouth College Case 100 Years of Professional Baseball 100 Years of Intercollegiate Football Dwight D. Eisenhower Crippled Children American Painting (WUliam M. Harnett). Natural History Series -. 150th Anniversary of Maine Statehood
Special: Christmas—Series 1969
Special Delivery: Special Delivery
06 06 06 06 10 ,06 06 06 06 06 06 06 06
06
45
81, 045 135, 375 147,855 159,195 148, 538 128, 540 130,925 138, 555 149, 622 127, 545 145, 789 200,630 40,380
1, 707,150
52, 590
T A B L E 85.—Deliveries of finished work by the Bureau of Engraving and Printing, fiscal years 1969 and 1970
Class Number of pieces
1969 1970 - Face value 1970
Currency: U.S. notes 768,000 . Federal Reserve notes. 2,430,608,000
Specimens 357 2,509,728,000 .
183 .
$15,619,680, 000
Total 2,431,376,357 2,509,728,183 15,619,680,000
Military payraent certificates. Speciraens
90,800,000 432
82,080,000 1,824 .
246, 060,800
Total- 90,800,432 82,081,824 246, 060,800
Bonds, notes, bUls, certificates, and debentures: Bonds:
Treasury Treasury, special series Governraent National Mortgage Association-
mortgage backed Consolidated Federal farm loan bonds Consolidated notes of the Federal home loan
banks Notes:
Treasury. Consolidated notes of the
Federal home loan banks Federal National Mortgage Association, short
term discount notes Tennessee Valley Authority Farmers Home Administration Insured—
Insurance Contract Treasury—Special Series
Bills: Treasm-y.
Certificates: Treasury certificate of indebtedness, special series.. Participation certificates in Government liquida
tion trust . Participation certificates in Export-Import Bank
ofthe United States Participation certificates in Government Na
tional Mortgage Association Participation—in Small Business Obligations
Trust Mortgage backed in Govemment Mortgage
Association Commodity Credit Corporation, special series
59,900 500
188,142
132,163
1,041,581
125,000
1,004 10,700
120
5, 917,500
1,550
18,044
20,534
36,765
154,350 200 .
14,244 370,019
462,124
1, 967,360
107,099
1,944,800,000
1,577,500,000 4, 222, 000,000
14,258, 500,000
53,809,000,000
4,200,000,00
26,000
5,100 .
7, 587, 500
16,450
2,030,000,000
349, 260,000,000
535, 500,000
16.024 .
1,000
400
5,527 ...
10,000, 000
3,000,000
Digitized for FRASER http://fraser.stlouisfed.org/ Federal Reserve Bank of St. Louis

280 19 70 REPORT OF THE SECRETARY OF THE TREASURY
TABLE 85.—Deliveries of firiished work by the Bureau of Engraving and Printing fiscal years 1969 and 1970—Continued
Number of pieces Class Face value 1970
1969 1970
Bonds, notes, biUs, certificates, and debentures:—Continued Debentures:
Consolidated collateral trust for: Twelve Federal intermediate credit banks $155,000 $340,452 $10,865,000,000 Thirteen banks for cooperatives 135,500 87,500 3,140,000,000
Federal National Mortgage Association, secondary market operations. 113,228 375,951 11,866,500,000
Federal National Mortgage Association Capital.... 15,386 12,034 974,000,000 Department of Housing and Urban Development,
Federal Housing Administration (Special Risk Insurance Fund) 10,706
Federal Housing Administration. 5,000 500,000 Export-Iraport Bank of the United States 2,646
Total 8,001,993 11,538,310 458,696,300,000
Stamps: Customs 3,248,000 1,426,400 U.S. Internal Revenue 2,507,202,473 2,644,205,837 668,645 Puerto Rican Internal Revenue.... 257,706,100 185,622,500 Virgin Islands Internal Revenue 102,700 U.S. Postage:
Ordinary 19,602,493,800 18,791,484,200 1,242,073,700 Airmail 1,048,768,000 972,401,200 112,894,590 Comraeraorative 2,223,017,020 1,771,304,256 112,219,456 Specialissue 4,352,743,720 4,471,975,000 269,272,600 Special delivery 33,750,000 56,645,400 24,882,000 Postage due. 143,890,000 118,760,000 16,696,600
Postal insurance booklets 207,600 317,700 63,540 U.S.savings.. . . 110,827,000 72,643,500 12,252,500 Federal raigratory bird hunting 3,294,000 3,093,000 9,279,000 Canal Zone postage 2,991,500 8,677,000 922,300 Food coupons 502,040,373 963,942,775 1,364,610,150 Food certificates 1,089,200 271,875
Total 30,792,179,586 30,063,690,668 3,166,106,956
Miscellaneous: Cards, certificates, etc. to office of issue 12,279,172 9, 552,736 . Grand total 33,334,637,540 32,676,591,721 477,728,147,756
TABLE 86.—Statement of financial condition June SO, 1969 and 1970
June 30,1969 Jmie 30, 1970
ASSETS Current assets:
Cash on hand $40 Cash with the Treasury 4,286,418 $4,483,307 Accounts receivable 2,303,317 3,356,819 Inventories: i
Finished goods 2,653,341 1,664,866 Work in process.... 3,730,959 4,688,484 Rawmaterials 1,416,257 1,259,524 Stores 1,419,096 1,381,437
Prepaid expenses . 153,165 138,763
Total cmrent assets 15,962,593 16,973,200
Footnotes a t end of table.
Digitized for FRASER http://fraser.stlouisfed.org/ Federal Reserve Bank of St. Louis

608, 987
31, 771, 265 17, 942, 788
13,828,477
888
13, 829, 365
230,070
30, 022, 028
2,151, 925
34,244, 631 19, 390, 980
14,-853, 651
3,844
14,857,495
222,237
32,052, 932
STATISTICAL APPENDIX 2 8 1
T A B L E 86.—Statement of financial condition J u n e 30, 1969 and 1970—Continued
June 30, 1969 June 30, 1970
ASSETS—Continued Fixed assets:'
Plant machinery and equipment 22,635,075 23,153,898 Motor vehicles 163,862 163,862 Officemachines 318,936 344,339 Fmnitm-e and fixtures 494,045 541,477 Dies, rolls, and plates 3,955,961 3,955, 961 Building appm-tonances 3,594, 399 3, 933,169 Fixed assets under construction ~
Subtotal. . . Less accumulated depreciation
Subtotal Excess fixed assets (written down to 10 percent and 15 percent of book
value, 1969 a.nd 1970, respectively)
Total fixed assets
Deferred charges
Totalassets
LIABILITIES AND INVESTMENT OF THE UNITED STATES
LiabUities: Accounts payable 321,491 581,252 Accrued liabUities:
PayroU 1,329,050 1,672,650 Accrued leave 1,993,307 2,074,513 Constructive receipts 3 581,150 2,072,402 Other . 200,429 338,879
Trust and deposit habilities 304,774 153,951 Otherliabilities 1,631 4,613
Total liabiUties <
Investment ofthe U.S. Government: Appropriation from U.S. Treasury Donated assets, net
Subtotal
Accuraulated earnings, or deficit (—)*
Total investment of the U.S. Government
Total UabiUties and investment of the U.S. Government 30,022,028 32,052, 932
1 Finished goods and work in process inventories are valued at cost, including administrative and service overhead. Included in the work in process inventory is $730,795 of slow-moving or inactive engraved stock for secm-ities of the Bureau of the Public Debt. Except for the distinctive paper which is valued at the acquisition cost, raw materials and stores inventories are valued at the average cost of the materials and supplies on hand.
2 Plant machinery and eqmpment, fmniture and fixtures, office machines, and motor vehicles acquired on or before June 30, 1950, are stated at appraised values. Additions since June 30, 1950, and aU buUding appm-tenances are valued at acquisition cost. The act of August 4,1950 (31 U.S.C. 181a), which established the Bureau of Engraving and Printing fmid, specffically excluded land and buildings valued at about $9,000,000 from the assets of the fund. Also excluded are appropriated funds of about $7,184,000 expended or transferred to GSA for extraordinary expenses in connection with uncapitalized building repairs and air conditioning. As of June 30, 1970, fixed assets included $7,888,585 of fully depreciated items, principaUy plant machinery and equipment and building appmtenances. Dies, roUs, and plates were capitalized on July 1, 1951, on the basis of average unit costs of raanufacture, reduced to recognize their estiraated useful life. Since July 1,1951, all costs of dies, roUs, and plates have been charged to operations in the year acquired.
3 The accrual for constructive receipts is the estiraated value of work perforraed by contractors to special specification, which had not been delivered to or accepted by the Bmeau as of June 30, 1969, and June 30 , 1970. Contra entries are to raw raaterials, $93,402 and $192,884;J stores, $9,376 and $17,343; and fixed assets under construction, $478,372 and $1,862,175, respectively.
* In addition, outstanding commitments with suppliers for unperformed contracts and undelivered purchase orders totaled $19,046,885 as of June 30, 1969, $14,877,230 as of June 30, 1970. Included in the total of $14,877,230 is $11,688,668 representing the remaining 3 years of a 4-year contract entered into with a supplier of distinctive paper,,
^ The act of August 4, 1950, provided that customer agencies make payraent to the Bmeau at prices deemed adequate to recover all costs incidental to performing work or services requisitioned. Any surplus accruing to the fund in any fiscal year is to be paid into the general fund of the Treasm-y as misceUaneous receipts except that any smplus is applied first to restore any impairment of capital by reason of variations between prices charged and actual costs. Accordingly, $128,711 of the total profit of $167,977 which resulted from operations in fiscal year 1969 was applied to offset accumulative losses in prior years and the balance or $39,266, was retujrned to the Treasury as raisceUaneous receipts.
4,731, 832
3, 250, 000 22, 000, 930
25, 250, 930 39, 266
25, 290,196
6,898,260
3, 250, 000 22,000, 930
25, 250, 930 -96, 258
25,154, 672
Digitized for FRASER http://fraser.stlouisfed.org/ Federal Reserve Bank of St. Louis
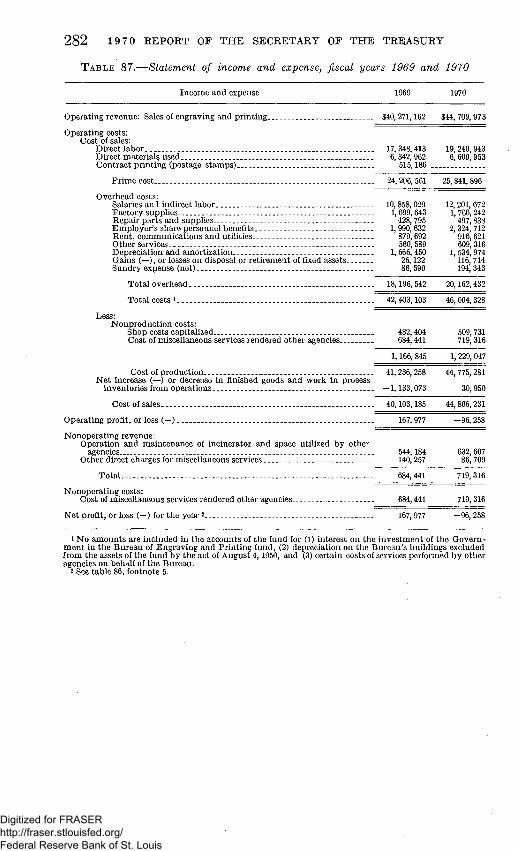
2 8 2 1 9 7 0 REPORT OF THE SECRETARY OF THE TREIASURY
T A B L E 87.—Statement of income and expense, fiscal years 1969 and 1970
Incorae and expense 1969 1970
Operating revenue: Sales of engraving and printing $40, 271,162 $44, 709, 973
Operating costs: Cost of sales:
Directlabor.. 17,348,413 19,240,943 Direct materials used 6, 342, 962 6, 600, 953 Contract printing (postage stamps) 515,186
Primecost 24,206,561 25,841,896
Overhead costs: Salaries and indirect labor 10,858, 029 12, 201, 672 Factory supplies 1,699,643 1,766,242 Repah- parts and supplies 428, 795 497,838 Employer's share personnel benefits . 1, 990, 632 2,324, 712 Rent, coramunications and utilities 879,692 916,621 Other services. 560,589 609,316 Depreciation and amortization 1,666,450 1, 534, 974 Gains (—), or losses on disposal or retirenient of fixed assets 26,122 116, 714 Sundry expense (net) 86,590 194,343
Total overhead 18,196,542 20,162,432
Total costs 1 42,403,103 46,004,328
Less: Nonproduction costs:
Shop costs capitalized 482,404 509,731 Cost of miscellaneous services rendered other agencies 684,441 719,316
1,166,845 1,229,047
Cost of production 41,236,258 44,775,281 Net increase (—) or decrease in finished goods and work in process
inventories from operations —1,133,073 30,950
Costofsales. 40,103,185 44,806,231
Operating profit, or loss ( - ) 167,977 -96,258
Nonoperating revenue: Operation and maintenance of incinerator and space utilized by other
agencies 544,184 632, 607 Other direct charges for miscellaneous services 140, 257 86, 709
Total 684,441 719,316
Nonoperating costs: Cost of miscellaneous services rendered other agencies 684,441 719,316
Net profit, or loss ( - ) for the year 2 167,977 -96,258
1 No araounts are included i.n the accounts of the fund for (1) interest on the investment of the Government in the Bureau of Engraving and Printing fund, (2) depreciation on the Bureau's buildings excluded from the assets of the fund by the act of August 4,1950, and (3) certain costs of services performed by other agencies on behalf of the Bureau.
2 See table 86, footnote 5.
Digitized for FRASER http://fraser.stlouisfed.org/ Federal Reserve Bank of St. Louis

STATISTICAL APPENDIX 2 8 3
TABLE 88.—Statement of source and application of funds, fiscal years 1969 and 1970
Funds provided and applied 1969 1970
Funds provided: Sales of engraving and printing $40,271,162 $44,709,973 Operation and maintenance of incinerator and space utilized by other
agencies 544,184 632,607 0 ther direct charges for raiscellaneous services 140,257 86,709
Total 40,955,603 45,429,289 Less cost of sales and services (excluding depreciation and other charges
not requiring expenditure of funds: Fiscal year 1969, $1,692,572; fiscal year 1970, $1,651,688) 39,095,054 43,873,859
1, 860, 549 1, 555,430 Sale of surplus equipraent 15,479 4,273 Decrease in working capital 1,155,821
Total funds provided 1,876,028 2,715,524
Funds applied: Acquisition of fixed assets 1,403,350 2,622,531 Acquisition of experimental equipraent; and plant repairs and alterations
to be charged to future operations 193,357 53,727 Operating surplus returned to Treasury—31 U.S.C. 181a(e)i 39,266 Increase in working capital 279,321
Total funds applied. 1,876,028 2,715,524
See table 86, footnote 5.
International Claims
TABLE 89.—Status of Class I I I Awards of the Mixed Claims Commission, United States and Germany, and Private Law 609 as of June 30, 1970
Class III Private Law Description awards—over 509, approved
$100,000 July 19,1940
AWARDS i Prmcipal of awards $117,387,252.24 $160,000.00
Less amounts paid by Alien Property and others 266,072. 77 Interest to Jan. 1, 1928, as specified in awards 53,245,392.03 64,000.00 Interest thereon to date of payment or, if unpaid, to June 30, 1970, at 5
percent per annum, as specffied in the Settlement of War (Claims Act of 1928 81,526,247.28 178,192.02
Total due claimants. 251,892,818.78 402,192.02
PAYMENTS Prmcipal of awards 76,955,283.40 101,053.06 Interest to Jan. 1, 1928 53,245,392.03 64,000.00 Interest at 5 percent from Jan. 1, 1928, to date of payment 75,215,328.48 163,513.97
Total payments 2 205,416,003.91 328,567.03
BALANCE D U E Principal of awards 40,165,896.07 58,946.94 Accrued interest from Jan. 1, 1928, through June 30, 1970 6,310,918.80 14, 678. 05
Balance due claimants... 4.6,476,814.87 73,624. 99
Total reimbm-sement for administrative expenses 3 1,027,112.41 1,642. 78
1 Excludes Class I awards (on account of death and personal injury) which have been paid in full and also Class II awards on which there remain balances totaling $42,830.84. For details concerning all classes of awards, including clainis of U.S. Government, see 1962 annual report, pages 138 and 826.
2 Amounts shown are gross; deductions for administrative expenses are shown below (see footnote 3). 3 Deductions of y of 1 percent are made from each payraent to cover administrative expenses. These
amounts are covered into the Treasury as misceUaneous receipts.
NOTE.—On Feb. 27,1953, the Gerraan Government agreed to pay $97,500,000 (U.S. doUars) over a period of 25 years in fuU settlement of Germany's obligations on account of Class III awards and the award under Private Law 509. Through June 30, 1970, $65,500,000 has been received under the agreement and obligated for payment to awardholders. An additional $32,000,000 has been received from the Government of Germany and deposited into a special account on behalf of the Deutsche Bundesbank. Each year, beginning on April 1, 1971, through AprU 1, 1978, $4,000,000 wiU be transferred from the Deutsche Bundesbank accomit into the German deposit fmid for distribution to awardholders.
409-714—71' 19
Digitized for FRASER http://fraser.stlouisfed.org/ Federal Reserve Bank of St. Louis

to (X)
T A B L E 90.—Status of claims of American nationals against certain foreign governments as of June SO, 1970
Bulgaria Hungary Rumania Poland War Claims Fund
Yugoslavia (1964)
Awards certified to the Treasury: Number of awards . 231 1,302 565 7,363 i8,793 659 Amount of awards:
Principal $4,684,186.46 $58,277,457.94 $60,011,347.78 $100, 737,68L 63 $340,509,577.34 $9,685,093.22 Interest.. . • 1,887,637.43 22,186,408.58 24,717,942.92 51,051,825.01 2,866,279.97
Total 6,571,1 0,463,866.52 84,729,290.70 151,789,506.64 340,509,577.34 12,551,373.10
Deposits in claims funds. 2,817,088.93 Statutory deduction for administrative expenses 140,854.44
2,355,513.69 21,225,487.01 20,000.000.00 223,250,000.00 3,500,000.00 117,775.73 1,061,274.33 2 200,000.00 (3) 3 145,827.41
Amounts avaUable for payment on awards 2,676,234.49 Payments on awards:
Principal 2,674,753.65 Interest
2,237,737.96 20,164,212.68 19,800,000.00 223,250,000.00 3,354,172.59
2,221,390.21 20,160,019.29 19,719,629.96 221,462,710.83 3,310,231.53
Balances in claims funds. 1,4 16,347.75 4,193.; 80, 370. 04 1,787,289.17 43. 941. 06
Pi
o pi y ^
o
W
O Pi
> Pi y<
o
M
Pi
> ZP
d y<
1 Private Law 91-88. 2 PubUc Law 90-421, approved July 24, 1968, araended the International Clairas
Settlement Act of 1949 to permit the 5 percent deduction to be raade frora the installment payments made under the clainis agreements, rather than from each payment to awardees.
3 Statutory deductions of 5 percent made by the Foreign Claims Settlement Commission prior to the funds being transferred to Treasury,
Digitized for FRASER http://fraser.stlouisfed.org/ Federal Reserve Bank of St. Louis

STATISTICAL APPENDIX
International Financial Transactions
285
TABLE 91.— U.S. net monetary gold transactions with foreign countries and international institutions, fiscal years 1946-70
[In millions of doUars at $35 per ounce. Negative figures represent net sales by the United States; positive figures, net purchases]
Afghanistan Algeria Argent ina Aust ra l ia Aus t r i a . B a n k for Internatioriai Set t lements Belginm _ _ Bolivia Brazil B u r m a . C a r a b o d i a . . . . . Cameroon Republ ic C a n a d a . . . . . Cen t ra l African Republ ic C e y l o n . . C h a d Chile Colombia . Congo (Eansliasa) Costa R i c a . . . . . . . . . . . . C y p r u s Dahoraey Denraa rk Dora in ican Repub l i c Ecuador . . E l Salvador E th iop ia . . I . F in l and France Gabon Ger inany, Federal Blepublic of Ghana Greece. Guinea . . Ha i t i H o n d u r a s . . . . Iceland Indones ia In te rna t iona l B a n k In te rna t iona l Monetary F u n d i I r an I r aq I re land Israel I t a ly . I vo ry Coast J a r a a i c a . . . . . . . . . . J a p a n Jo rdan Korea K u w a i t . . Laos - . Lebanon Liberia Malagasy . Malaysia . MaU Malta M a m i t a n i a Mexico Morocco._ Nepa l Ne the r l ands . . . . . . N e w Zealand _ N ica ragua . Niger , Nigeria N o r w a y P a k i s t a n . . . . P a n a m a P a r a g u a y P e r u . . Phi l ippines Por tuga l Repub l i c of Congo (Brazzaville)
1945-65
- 5 . 3 - 1 5 . 0 829.9 .
'.'.""-blKs - 5 1 3 . 3 . - 6 7 6 . 2
1 8 . 6 . 186.9
- 2 4 . 8 . - 1 5 . 9 .
- L 9 796.3
- . 7 - n . 8
- . 7 14.8
140.6 27.3
- 5 . 4 - 2 . 0 .. - . 8
- 9 8 . 4 - 1 9 . 2 - 3 . 4
- 2 4 . 6
. . - 2 L 7 " . .
. . - 2 , 2 4 4 . 8 - . 7 '
- 656 .9 . . - 5 . 6 . .
- 1 3 6 . 4 - 2 . 8 . .
- ] - 9 " 6 " . . - 1 1 3 . 5 . .
18 8 880.6
- 2 2 . 2 - 3 9 . 8 - 2 . 3
- 2 4 . 5 . . - 2 4 3 . 1 . .
- L 5
] ] ' " " " -202 . ' 7" .. ^. . . .
- 2 2 . 3 . . - L 9 . .
- 8 5 . 4 -. ^ . . . .
- . 6 . .
- . 8 10.9 . .
- 2 L 1
- 7 3 6 . 3 . .
19.8 - . 8 . .
- 2 0 . 0 . . 1L7 .-
" ~ 3 S . l ' . . 8 2 . 7 . .
- 4 L 6 . . - . 7
1966
- 3 . 2 - . 8
- 8 . 3 . - 6 2 . 5 .
- 2 L 0 .
- 3 . 8
- . 2 150.0
- . 1 - 4 . 2 - . 1
- 5 . 4 6.2
- . 6 - . 4
- . 1 - 1 3 . 3 ..
- . 6 - L 3
- L O . .
- 577 . 7 - . 1
- . 4
- . 2 - L O
182.8 - 7 . 5 - 4 . 0 - 2 . 3
- . 2 - 2 . 5 . .
- 5 6 . 3 . . - . 6 . .
- L 3 . .
- 1 0 . 8 - 2 . 4 - L O . .
- . 1
3.8
- 2 . 1
.-..^.....
- . 9 . .
- . 1
1967
- L 9 - . 8
- 3 9 . 7 .
- L 7
- . 2 100.0
- . 1 - . 1 - . 1
- 7 . 5 - . 4 . .
- 2 . 4 - L 8
- . 1
- . 8 - . 2
-277 . 3 - . 1
- . 6 - 1 . 0 . .
- . 2 - . 1
- L 8
50.1 - 1 5 . 0
- . 2 - 1 . 3
- 6 0 . 0 - . 2
- . 6 - . 3
- . 1
- . 9
- . 2 - . 1
....--.-...
" " 2 5 . ' 6 " " - L 3
- . 1
1968
- 2 . 7 - 1 5 0 . 4
- 5 . 1
- 5 7 . 6 . - . 1 - . 6 .
- 2 . 1
- . 2 150.0 .
- . 1 - . 6 - . 1
- 8 . 2
- . 6 - 1 3 . 4 ..
- . 1
- . 9 - 2 6 . 7
- 2 . 6
220.0 - . 1
- . 4 . 18.4
- . 3
(*) - L l
- 3 . 0
- 6 3 . 2 . . - 4 5 . 4
- 2 9 4 . 0 - . 2
- 1 4 . 1 - 6 . 5
- 9 4 . 5 . . - . 4
- 3 3 . 5 . .
- . 1
- L l - 6 . 0 . .
- 1 8 . 5 . . - L 8 - . 1 - . 1
- 9 . 3 . .
- . " § ' (*)
io. 'o'" ' - . 4
- . 1
1969
- . 5 - 5 0 . 6 - 2 0 . 0
- . 1
- . 2
- . 1 - . 7 .. - . 1
- 4 . 9
- . 5
- . 1 25.0 .
- L 2 4.0 . .
- . 4
705.0 . . - : 1 .
"-ii.'i" - . 3
(*) -. - . 1
- L 5
2.5 - . 1 . .
- 8 . 0
- 7 6 . 0 . . - . 2
- 2 . 9 . . - . 1
- 2 4 . 9
- . 5
- 1 4 . 7 - . 1
- 1 . 4
- L l . . - . 2 - . 1
- . 9 - . 7
- 4 . 2
• " - 8 . 1 " ' 33.8
- 5 . 0 . . - . 1
1970
- 3 . 7 - . 7
- 3 0 . 0
3.'5 199.5
—.1
—'i - . 2
- . 1
- 4 . 0 - L 2
- . 1 — .4 - . 1
—.5
- . 2
- . 1 500.0
—.6 - . 8
(*) - . 1
- . 2 - 2 . 0
31.6
43.2
- . 2 - 2 . 0
(*) 24.9 - . 6
- . 3
2.6 - . 1
- 1 . 5 (*)
- . 1 - . 2
- . 9 - 1 . 2
(*) . . . . . . . .
16.6
- . 1
Footnotes at end of table.
Digitized for FRASER http://fraser.stlouisfed.org/ Federal Reserve Bank of St. Louis

286 19 70 REPORT OF THE SECRETARY OF THE TREASURY
TABLE 91.—U.S. net monetary gold transactions with foreign countries and international institutions, fiscal years 1946-70—Continued
1945-65 1966 1967 1968 1969 1970
Rwanda - . 2 - . 2 - . 7 - . 1 - . 1 SaudiArabia -64.2 -25.0 -25.0 Senegal —2.5 Singapore -53.0 -16.7 Soraalia.... -2 .0 - . 9 - . 2 - . 3 - . 1 South Africa 1,12L3 Southern Yemen. Spain : -664.4 -30.0 Sudan -7 .7 - 3 . 1 - . 5 - . 9 - L 3 -1 .6 Surinam .1 -11.6 5.0 5.0 Sweden 246.4 -18.7 Switzerland -890.7 18.0 -50.0 -50.0 -25.0 Syria -15.5 -4 .0 - . 6 -9 .4 - . 4 - . 1 Togo . - 1 . 1 Trinidad and Tobago —4.8 Tunisia... - L 6 -3 .5 - . 4 - . 6 - . 7 - . 6 Tmkey 33.3 -20.9 -5 .8 -12.0 3.0 -13.0 United Arab Republic -152.5 - 3 . 3 - . 6 United Kingdora -544.5 169.9 75.2 -1,697.4 15.0 - . . . . UpperVolta - . 8 - . 1 - . 1 - . 1 - . 1 - . 1 Uruguay -4 .0 - . 3 - . 2 (*) -16.2 Vatican City - . 6 4.5 1.2 Venezuela -360.9 -25.0 Vietnara - . 3 - L 3 Yemen Arab Republic —1.5 Yugoslavia -24.3 -2 .6 -2 .8 -3 .4 -3 .9 - L 7 AUother -159.6 - . 7 - . 1 - . 3 - 3 . 1 - . 4
Total -5,099.5 -378.4 -232.2 -2,337.6 470.8 735.7
*Less than $50,000. 1 Includes U.S. gold subscription payraents of $687.5 raiUion in 1947, $343.8 raiUion in 1959, and $258.8
million in 1965. Prior to 1961 includes gold purchases by IMF on behalf of raeraber countries for their payments to IMF. Beginning 1965 figures include gold deposits by IMF, and withdrawals of deposits, under the mitigation program connected with payments of gold portion of quota increases of other countries.
Digitized for FRASER http://fraser.stlouisfed.org/ Federal Reserve Bank of St. Louis
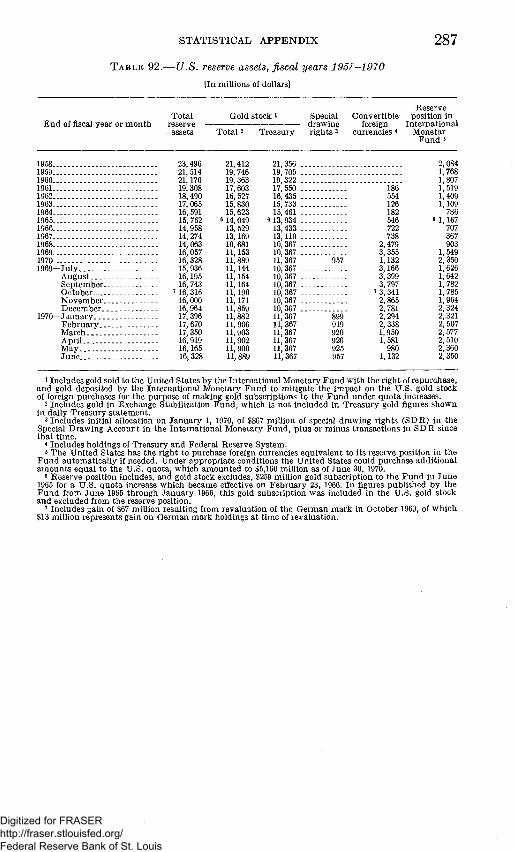
STATISTICAL APPENDIX 287 T A B L E 92.—U.S. reserve assets, fiscal years 195f-1970
[In raiUions of doUars]
End of fiscal year or month Total
reserve • assets
Gold stock 1
Total 2 Treasury
Reserve Special Convertible- position in
drawing foreign International rights 3 currencies 4 Monetar
Fund i
1958.... 23,496 21,412 1959. 21,514 19,746 1960 21,170 19,363 1961 19,308 17,603 1962 18,490 16,527 1963.. 17,065 15,830 1964 16,591 15,623 1965 15,762 6i4^o49 1966 14,958 13,529 1967 14,274 13,169 1968 14,063 10,681 1969 16,057 11,153 1970 16,328 11,889 1969—July 15,936 11,144
August 16,195 11,154 Septeraber 16,743 11,164 October 7i6,316 11,190 November 16,000 11,171 Deceraber 16,964 11,859
1970—January 17,396 11,882 February 17,670 11,906 March 17,350 11,903 AprU 16,919 11,902 May 16,165 11,900 June 16,328 11,889
21,356 2,084 19,705 1,768 19,322 1,807 17,550 186 1,519 16,435 554 1,409 15,733 126 1,109 15,461 182 786
5 13,934 546 e 1,167 13,433 722 707 13,110 738 367 10,367 2,479 903 10,367 3,355 1,549 11,367 957 1,132 2,350 10,367 3,166 1,626 10,367 3,399 1,642 10,367 3,797 1,782 10,367 7 3^341 1,785 10,367 . . . . . 2,865 1,964 10,367 2,781 2,324 11,367 899 2,294 2,321 11,367 919 2,338 2,507 11,367 920 1,950 2,577 11,367 926 1,581 2,510 11,367 925 980 2,360 11,367 957 1,132 2,350
1 Includes gold sold to the United States by the International Monetary Fund with the right of repurchase, and gold deposited by the International Monetary Fund to mitigate the impact on the U.S. gold stock of foreign pm'chases for the purpose of making gold subscriptions to the Fund under quota .increases.
2 Includes gold in Exchange Stabilization Fund, which is not included in Treasury gold figures shown in daily Treasury stateraent.
3 Includes initial aUocation on January 1, 1970, of $867 raiUion of special drawing rights (SDR) in the Special Drawing Account in the International Monetary Fund, plus or minus transactions in SDR since that time.
4 Includes holdings of Treasury and Federal Reserve System. 5 The United States has the right to purchase foreign currencies equivalent to its reserve position in the
Fund automatically if needed. Under appropriate conditions the United States could purchase additional amounts equal to the U.S. quota, which amounted to $5,160 million as of June 30, 1970.
6 Reserve position includes, and gold stock excludes, $259 million gold subscription to the Fund in June 1965 for a U.S. quota increase which became effective on February 23, 1966. In figures published by the Fund frora June 1965 through January 1966, this gold subscription was included in the U.S. gold stock and excluded from the reserve position.
7 Includes gain of $67 miUion resulting from revaluation of the German raark in October 1969, of which $13 raillion represents gain on Gerraan raark holdings at tirae of revaluation.
Digitized for FRASER http://fraser.stlouisfed.org/ Federal Reserve Bank of St. Louis

to 00 oo
TABLE 93.— U.S. liquid liabilities to foreigners, fiscal years 1968-70
[In miUIons of doUars]
1958 7 16,056 1959 - 7 18,065 1960 20,472 1961 21,296 1962 23,699 1963 25,807 1964 26,478 1965 28,086 1966 28,819 1967 29,620 1968 32,514 1969... '•39,043 1970 43,347
200 200 n.a. 7,931 n.a. n.a. 5,886 n.a. n.a. 589 n.a. 200 200 n.a. 8,967 n.a. n.a. 6,706 n.a. n.a. 542 n.a. 600 500 10,482 9,511 971... 8,145 7,524 621 1,345 590 755 800 800 10,875 10,038 837 7,999 7,464 535 1,622 689 933 800 800 11,869 11,205 664 8,870 8,357 513 2,160 1,119 1,041 800 800 13,915 12,377 1,036 502 9,011 8,634 377 2,081 1,016 1,065 800 800 14,168 12,102 1,241 825 9,655 9,300 355 1,855 848 1,007 800 800 14,456 12,201 1,126 1,129 11,200 10,732 468 1,630 831 799 983 183 800 14,425 12,661 1,106 658 12.373 11,883 490 1.038 605 433
1,033 233 800 14,093 12,802 917 374 13,703 13.165 538 791 561 230 1,030 230 800 12.101 10,733 557 811 18,713 18,100 613 670 504 166 1,028 228 800 '•10,237 '•9,112 459 666 '•27,062 '•26,606 456 '•716 '•668 48 1,010 210 800 15,289 14,463 397 429 26,374 25,838 536 674 622 52
Pi
yt o
o
End of flscal year or month
Total liquid habilities toaU for
eigners
Liabilities to International
xvionebary J? unu arising irom gold transactions
Gold Total Gold invest- Total
deposit 1 ment»
Liabilities to foreign countries
Oflacial Institutions»
Short-term habilities
reported by
banks in the
United States
Marketable U.S.
Government bonds and
notes *
Nonmarketable convertible U.S. Treasury
bonds and
notes
Banks and other foreigners
Short-term liabilities
Total reported by
banks In the
United States
Marketable U.S.
Government bonds and
notes 4
Liabihties to nonmonetary international and regional
organizations «
Short-term liabilities
Total reported by
banks in the
United States •
Marketable U.S.
Govemment bonds
and notes 4
K3
M o pi 1^
> pi y<
o > H3
y ^
Pi
>
Pi y<
Digitized for FRASER http://fraser.stlouisfed.org/ Federal Reserve Bank of St. Louis

1969—July 40,141 August. . . . . 41,616 September 42,655 October 8 43,092 Noveniber 42,892
Deceraber e { f^'J^jl 1970—January.. 42', 826
February 42,972 March 42,943 April 4.3,335 May... 43,198 June 43,347
1,028 1,028 1,019 L019 L019 1,019 1,019 1,019 LOIO 1,010 1,010 1,010 1,010
228 228 219 219 219 219 219 219 210 210 210 210 210
800 800 800 800 800 800 800 800 800 800 800 800 800
9.980 11,039 12,481
812, 686 12,014 11, 992 11, 992 12, 680 14, 022 14, 763 14,409 14, 788 15, 289
8,780 9,839 11,281 11,611 11,128 11, 054 11,054 11,868 13,213 13,954 13,600 13, 977 14,463
450 450 450 333 331 383 383 383 380 380 380 382 397
750 750 750 i742 555 555 555 429 429 429 429 429 429
28,402 28, 821 28,430 28, 707 29,103 28,106 28,205 28, 397 27,128 26, 369 27,154 26, 701 26, 374
27,921 28, 329 27, 898 28,166 28, 559 27, 577 27. 676 27,866 26, 644 25,893 26, 669 26,200 25,838
481 492 532 541 544 529 529 531 484 476 485 501 536
731 728 725 680 716 659 660 730 812 801 762 699 674
682 679 676 631 666 609 610 680 762 751 711 648 622
49 49 49 49 50 50 50 50 50 50 51 51 52
^ Revised. 1 Represents liabiUty on gold deposited by the International Monetary Fund (IMF)
to mitigate the impact on the U.S. gold stock of foreign purchases for the purpose of raaking gold subscriptions to the IMF under quota increases.
2 U.S. Governraent obhgations at cost value and funds awaiting investment obtained from proceeds of sales of gold by the International Monetary Fund to the United States to acquire income-earning assets. Upon termination of investment, the same quantity of gold can be reacquired by the IMF.
3 Includes Bank for International Settlements and European Fund. 4 Derived by applying reported transactions to benchmark data; breakdown of
transactions by type of holder estimated 1960-63. Includes securities issued by corporations and other agencies of the U.S. Government, which are guaranteed by the United States.
5 PrincipaUy the International Bank for Reconstruction and Development and the Inter-American Developraent Bank.
6 Includes difference between cost value and face value of securities in IMF gold investraent account. Liabilities data reported to the Treasury include the face value of these securities, but in this table the cost value of the securities is included under "Gold investment." The difference, which amounted to $44 mUUon as of the end of June 1970, is included in this column.
11ncludes total foreign holdings of U.S. Govemment bonds and notes, for which breakdown by type of holder is not available.
8 Includes $17 miUion increase in doUar value of foreign currency liabihties resulting from revaluation of the German mark in October 1969.
9 Data on the two lines shown for this date differ because of changes in reporting coverage. Figures on the first line are comparable in coverage to those shown for the preceding date; figures on the second line are comparable to those shown for the foUowing date.
n.a. Not avaUable.
NOTE.—Table is based on Treasury Department data and on data reported to the Treasury Department by banks and brokers in the United States. Table excludes IMF "holdings of doUars," and holdings of U.S. Treasury letters of credit and non-negotiable, noninterest-bearing special U.S. notes held by other international and regional organizations. The liabiUties figures are used by the Department of Coinmerce in the statistics measuring the balance of international payments of the United States on the liquidity basis; however, the balance-of-payments statistics include certain adjustments to Treasury data prior to 1963 and some rounding differences, and may differ because of varying timing in incorporating revisions of Treasury data. The table does not include certain nonhquid liabiUties to foreign oflacial institutions which enter into the calculation of the oflacial reserve transactions balance by the Department of Coraraerce.
ZP
y ^
ZP y ^
»-H
o
> yn
o >
to (X) CD
Digitized for FRASER http://fraser.stlouisfed.org/ Federal Reserve Bank of St. Louis

CO O
T A B L E 94.—International investment position of the United States by area, at yearend ^
[In raUlions of doUars]
L a t i n Other T o t a l 1 Western E u r o p e C a n a d a J a p a n Araer ican foreign
T y p e of inves t raen t Republ ics countr ies
1968 1969P 1968 1969^ 1968 1969^ 1968 1969" 1968 1969" 1968 1969"
N e t in te rna t iona l inves t raen t posi t ion of t h e
U n i t e d S t a t e s 65,524 67,046 - 8 , 5 2 1 -14 ,090 20,800 22,550 1,453 1,591 16,100 16,863 20.881 23,232
U . S . assets ab road 1 . . . . 1 4 6 , 7 7 2 157,836 39,721 41,373 31,810 34,323 5,732 6,469 24,923 26,261 27,034 29,542
Non l iqu id 131,062 140,872 36,198 38,593 31,806 34,323 5,731 6,468 24,923 26,261 27,034 29,542
P r i v a t e 102,519 110,152 28,177 30,310 31,795 34,308 5,005 5,737 19,653 20,439 13,777 14,972
Long-terra 89,529 96,029 24,738 26,721 30,581 32.600 1,682 2,110 16,103 16,946 12,314 13,266
D h e c t inves t raen ts 2 64,983 70,763 19,407 21,554 19,535 21,075 1,050 1,218 13,101 13,811 9,160 10,043 Foreign dollar bonds 10,565 10,579 652 583 5,995 6,110 309 265 721 688 1,507 1,609 Othe r foreign bonds 1,139 1,133 104 24 741 802 (*) (*) 211 242 83 65 Fore ign corporate s tocks 6,452 6,953 2,899 2,816 3,201 3,406 74 398 101 114 177 219 Cla ims repor ted b y U .S . banks 3,367 3,037 527 454 228 208 122 88 1,377 1,330 1,113 957 O t h e r 4 3,023 3,564 1,149 1,290 881 999 127 141 592 761 274 373
Shor t - te rm 12,990 14,123 3,439 3,589 1,214 1,708 3,323 3,627 3,550 3,493 1,463 1,706
Cla ims repor ted b y U . S . banks 8,711 9,606 1,181 1,418 533 826 3,114 3,372 2,889 2,805 994 1,185 O t h e r 4 . _ . 4,279 4,517 2,258 2,171 681 882 209 ' 255 661 688 469 521
U.S . Governraen t 28,543 30,720 8,021 8,283 11 15 726 731 5,270 5,822 13,257 14,570
Pi
yn o Pi
o
Line
In t e rna t iona l organizations
a n d unaUocated i
1968 1969" ZP
O S3
14,812 16,898 ^ = = 1^
17,552 19,867 > = = = = = W
5,370 5,684 K{
4,113 4,384 O = "
4,112 4, 384 ! y ^
3 2, 731 3 3, 060 W 1,381 1,324 H
: " : : : : : : : : : : : : : : y ^
. . - . pi
-111 >
- - - (•) 3
1, 257 1, 300
Digitized for FRASER http://fraser.stlouisfed.org/ Federal Reserve Bank of St. Louis

16 Long-term credits 5. 25,940 28,210 7,805 8,034 4 10 677 698 5,237 5,792 10,965 12,382 1,252 1,295
17 Repayable in doUars 19,967 21,971 6,730 6,981 4 10 577 599 4,644 5,120 6,760 7,966 1,252 1,295
18 Others.. 6,973 6,239 1,075 1,053 100 99 593 672 4,205 4,415
19 Foreign currencies and other claims 2,603 2,510' 216 249 7 6 49 33 33 30 2,292 2,188 5 5
20 Liquid: U.S. m.one.ta.ry reserve assets. 15,710 16,964 3,523 2,780 4 (*) 1 1 12,182 14,183
21 Gold 10,892 11,859 . 10,892 11,859 22 Convertible currencies . 3,528 2,781 3,523 2,780 4 (*) 1 1 23 IMF gold tranche position 1,290 2,324 1,290 2,324 24 U.S. liabilities to foreigners 81,248 90,790 48,242 55,463 11,010 11,773 4,279 4,878 8,823 9,398 6,153 6,310 2,740 2,969
36 U.S. Government. 4,744 4,927 2,878 3,207 1,361 1,162 11 33 35
37 Certahi liabilities to foreign oflacial agencies 7.. 2,723 2,645 1,029 1,251 1,334 1,129 359 265 . 38 Other. 2,021 2,282 1,849 1,956 27 33 11 33 35 47 99 214 .
Footnotes at end of table.
ZP 25 Nonliquid 47,634 48,872 30,934 32,707 7,829 7,489 950 1,029 4,050 3,642 2,757 2,548 1,113 1,458
26 Private 42,890 43,945 28,056 29,500 6,468 6,327 939 996 4,015 3,595 2,299 2,069 1,113 1,458 H
27 Long-term.. 40,353 40,986 26,301 27,452 6,187 6,049 848 853 3,803 3,341 2,101 1,833 1,113 1,458 fn C/2
28 Direct investments 10,815 11,818 7,750 8,510 2,659 2,834 181 176 182 193 43 105 H 29 Corporate and other bonds 4,214 4,800 3,366 3,770 69 87 (*) (*) 149 141 96 63 534 739 P^ 30 Corporate stocks 19,551 18,140 13,186 12.106 3,285 2,950 9 10 2,364 2,156 559 758 148 160 s^ 31 Liabilities reported by U.S. banks. 3,166 2,490 17 i| 54 1 (*) 658 655 856 525 1,203 697 431 559 ^ 32 To private foreigners... 825 983 6 54 (**) (**) (**) (**) 345 316 (**) (**) 431 559 > 33 To foreign oflacial agencies 2,341 1,507 11 (**) (**) (**) (**) 511 209 (**) (**) hd 34 Other4 ._. 2,607 3,738 1,982 3,012 173 178 (*) 12 252 326 200 210 g
35 Short-term 4 1 2,537 2,959 1,755 2,048 281 278 91 143 212 254 198 236 (*) (*) O
to CD
Digitized for FRASER http://fraser.stlouisfed.org/ Federal Reserve Bank of St. Louis
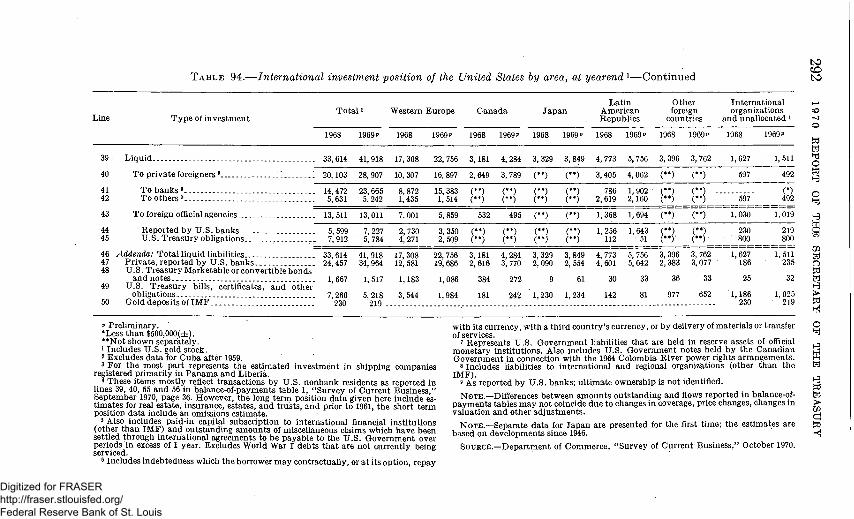
T A B L E 94.—International investment position of the United States by area, at yearend ^—Continued CD bO
Lme
39-
40
41 42
43
44 45
46 47 48
49
50
T y p e of i nves tmen t
L iqu id
T o p r iva te foreigners 8 : : :
T o b a n k s " T o others 8.
T o foreign oflacial agencies
Repor t ed b y U . S . b a n k s U . S . T r e a s u r y obligations . . . . .
Addenda: T o t a l l iquid l iabihties . . P r iva t e , repor ted b y U . S . b a n k s U .S . T r e a s u r y Marke tab le or conver t ib le bonds
a n d n o t e s . . U . S . T r e a s u r y bills, certificates, a n d o ther
obligations Gold deposi ts of I M F
T o t a l 1
1968
33,614
20,103
14,472 5,631
13,511
5,599 7,912
33, 614 24,457
1, 667
7,260 230
1969"
41,918
28, 907
23,665 5,242
13,011
7,227 5, 784
41,918 34, 964
1,517
5,218 219 .
Western E u r o p e
1968
17, 308
10,307
8,872 1,435
7,001
2,730 4,271
17, 308 12, 581
1,183
3, 544
1969"
22, 756
16,897
15, 383 1,514
5,859
3,350 2,509
22,756 19, 686
1,086
1,984
C a n a d a
1968
3,181
2,649
(**) (**)
532
(**) (**) 3,181 2,616
384
181
1969"
4,284
3,789
(**) (**)
495
('")' 4,284 3, 770
272
242
J a p a n
1968
3, 329
(**) (**) (**) (**) (**) (**) 3,329 2,090
9
1,230
1969"
3,849
(**) (**) (**) (**)
('."1 3,849 2,554
61
1,234
L a t i n Amer ican Republ ics
1968 1969"
4, 773
3,405
786 2,619
1, 368
1,256 112
4,773 4,601
30
142
5,756
4,062
1, 902 2,160
1,694
1,643 51
5,756 5,642
33
81
Other foreign
countr ies
1968
3,396
(**) (**)• (**)
(**)
R 3,396 2,383
36
977
1960"
3, 762
(**) (**) -(**) (**) (**) (**) 3,762 3.077
33
652
In t e rna t iona l organizations
a n d unaUocated i
1968
1,627
597
597
1,030
230 800
1,627 186
25
1,186 230
1969"
1, 511
492
(*) 492
1.019
219 800
1,511 235
32
1,025 219
C O
o
pi
o pi y ^
o
g H
t=i
R Pi
> ^ y<
" Preliminary. •Less than $500,000(±). **Not shown separately. 1 Includes U.S. gold stock. 2 Excludes data for Cuba after 1959. 3 For the most part represents the estimated investment in shipping corapanies
registered primarily in Panama and Liberia. 4 These items mostly reflect transactions by U.S. nonbank residents as reported in
lines 39, 40, 56 and 56 in balance-of-payments table 1, "Survey of Current Business," September 1970, page 36. However, the long term position data given here include estimates for real estate, insurance, estates, and trusts, and prior to 1961, the short term position data include an omissions estimate.
5 Also includes paid-in capital subscription to international financial institutions (other than IMF) and outstanding aniounts of misceUaneous claims which have been settled through international agreeraents to be pay'able to the U.S. Governraent over periods in excess of 1 year. Excludes World War I debts that are not currently being serviced.
6 Includes indebtedness which the borrower may contractuaUy, or at its option, repay
with its currency, with a third country's currency, or by delivery of niaterials or transfer of services.
7 Represents U.S. Government liabiUties that are held in reserve assets of official monetary institutions. Also includes U.S. Govemment notes held by the Canadian Govermnent in connection with the 1964 Colombia River power rights arrangements.
8 Includes habihties to international and regional organizations (other than the IMF).
9 As reported by U.S. banks; ultiraate ownership is not identified.
NOTE.—Differences between amounts outstanding and flows reported in balance-of-payments tables may not coincide due to changes in coverage, price changes, changes in valuation and other adjustraents.
NOTE.—Separate data for Japan are presented for the first time; the estimates are based on developments since 1946.
SOURCE.—Department of Commerce, "Survey of Current Business," October 1970.
O
y ^
y ^ Pi
> ZP d Pi y<
Digitized for FRASER http://fraser.stlouisfed.org/ Federal Reserve Bank of St. Louis

STATISTICAL APPENDIX 2 9 3
TABLE 95.—Assets and liabilities of the Exchange Stabilization Fund as of June 30, 1969, and June SO, 1970
Fiscalyear Assets and UabUities June 30,1969 June 30,1970 1970, increase
or decrease (—)
ASSETS
Treasmer of the United States $33,750,081.95 $321,396,629.18 $287,646, 547. 23 Federal Reserve Bank of New York, special
account .' . . . 298,860,367.00 298,860,367.00 Imprest fund 500.00 1,500.00 1,000.00
Total cash 33,750,58L95 620,258,496.18 586,507,914.23 Special Drawing Rights 957,188,497.00 957,188,497.00 Special Account of the Secretary of the Treasury
in the Federal Reserve Bank of New Y o r k -gold (schedule 1) 786,357,929.22 522,042,903.20 -264,316,026.02
Foreign exchange due from foreign banks: Oesterreichische Nationalbank 3,951.36 -3,95L36 Banque Nationale de Belgique 57,044.65 7,058.40 -49,986.25 Bank of Canada. 20,686.26 20,686.26 Deutsche Bundesbank 1.865,829.83 2,751,639.52 885,809.69 Bank of England.-... 1,028,987,376.20 218,740,975.90 -810,246,400.30 Banque de France 200,000,000.00 -200,000,000.00 Banca d'ltalia 131,988,90L 13 9,777,090.29 -122,211,810.84 De Nederlandsche Bank. 43,873.89 -43,873.89 Sveriges Riksbank 4,952.77 4,952.77 . . . . . . Banque Nationale Suisse. 100,089.15 13,074.51 -87,014.64 Bank for International Settlements 108,727, 795. 20 177,870,897.32 69,143,102.12
Investments in U.S. Governraent securities (schedule 2) 22,800,000.00 12,400,000.00 -10,400,000.00
Investments in foreign securities (schedule 2) 49, 529,075.81 32,771,217.69 -16,757,858.12 Accounts receivable. 167,578.99 112,833.15 -54,745.84 Accrued interest receivable—U.S. Government
securities 225,791.61 27,691.55 . -198,100.06 Accrued interest receivable—SD R holdings 2,329,744.00 2,329,744. 00 Accrued interest receivable—foreign 7,607,700.87 3, 548,435. 28 -4,059,265.59 Prepaid expense 379.99 436.17 56.18 Undistributed charges 162,230.10 -162,230.10 Deferred charges 650,000.00 650,000.00 Furniture and equi]3raent, less allowance for de
preciation : 169,997.95 167,207.47 -2,790.48 Land and structures.. 150,000.00 150,000.00
Totalassets... 2,372,721,766.93 2,560,833,836.66 188,112,069.73
LIABIMTIES AND CAPITAL Accounts payable 1,335,727.38 3,031,995.52 1,696,268.14 Contractual Obligations 650,000.00 650.000.00 Special accounts. 673,774,840.69 7,000,000.00 -666,774,840.69 Undistributed credits. 65,668.07 -65,668.07 Advance from U.S. Treasury (U.S. drawings on
IMF). 1,125,000,000.00 650,000,000.00 -475,000,000.00 Special Drawing Rights Certificates 400,000,000.00 400,000,000.00 Deferred LiabiUty—"DM Revaluation 32,789,675.13 32,789,675.13 Special Drawing Rights Allocations 866,880,000.00 866,880,000.00 Capital account . . . . : 200,000,000.00 200,000,000.00 Cumulative net income (schedule 3) 372, 545, 530. 79 400,482,166. 01 27,936,635.22
Total liabiUties and capital 2,372,721,766.93 2, 560,833,836. 66 188,112, 069.73
Digitized for FRASER http://fraser.stlouisfed.org/ Federal Reserve Bank of St. Louis

294 1970 REPORT OF THE SECRETARY OF THE TREASURY
Table 96.—Assets and liabilities of the Exchange Stabilization Fund as of June SO, 1969, and June SO, 1970—Continued
SCHEDULE L—SPECIAL ACCOUNT OF THE SECRETARY OF THE TREASURY IN THE FEDERAL RESERVE BANK OF NEW YORK—GOLD
June 30,1969 June 30,1970 Gold accounts
Ounces Dollars Ounces Dollars
Federal Reserve Bank of New York 9,836,408.168 344,274, 285.48 14,628,438. 275 511,995, 339.12 Federal Reserve Bank of New York, Ac
count No. 4 (BaiUc of England).. . 486,483.383 17,026,918.39 U.S. Assay Oflace, New York 5,715,636.990 200,047,299. 68 287,073.116 10,047, 564. 08 Banque de France, Paris, Account N o . l . . 6,428,840.733 225,009,425.67
Totalgold 22,467,369.274 786,357,929.22 14,915, 51L 391 522,042,903.20
SCHEDULE 2.—INVESTMENTS HELD BY THE EXCHANGE STABILIZATION FUND JUNE 30,1970
Secmities Face value Cost (in Accrued doUars) interest
Investments in public debt secmities: Public issues:
Treasury bonds: 23^% of 1966-71 $2,400,000.00 $2,398,843.75 $17,445.65 2y% of 1967-72 (dated Nov. 15, 1945) 10,000,000.00 10,000,000.00 10, 245. 90
Total public issues. . . 12,400,000.00 12,398,843.75 27,691.55
Foreign securities: RepubUc of Germany, Treasm-y biUs DM122,800,000,00 32,771,217.69
SCHEDULE 3.—INCOME AND EXPENSE
Jan. 31,1934 through-Classification
June 30, 1969 June 30, 1970
Income: Proflts on transactions in:
Gold and exchange (including profits from handling charges on gold) $164,617,884.26 i $141,841, 860.10
Sale of silver to U.S. Treasury 3,473,362.29 3,473,362.29 Silver. 102,735.27 102,735.27 Investments 1,408,003.14 1,369,608.84 Miscellaneous 159,962.38 175,379.29
Interest on: Investraents 181,441,889.03 181,908,354.05 Special Drawing Rights . : 127,012.00 Foreign balances.. 86,920,918.01 143,499,774.10
Total incorae... 438,124,754.38 472,498,085.94
Expense: Personnel compensation and benefits. 46,698,708,96 51,628.224.98 Travel 2,834,949.63 3,118,242.35 Transportation of things 3,903,576.09 3,953,215.06 Rent, communications, and utilities 1,399,838.68 1,550,883. 47 Supplies and materials. 401,433.53 432,076.40 Other - 10,340,716.70 11,333,277.67
Total expense....- 65,579,223.59 72,015,919.93
Cumulative net income 372,545,530.79 400,482,166.01
1 Exchange profits include $67 miUion increase in value of DM holdings due to revaluation, less $91 raillion increase in liabUities due to DM revaluation. On June 30,1970, $32.8 raillion of increased liabilities remained and is shown on balance sheet as a deferred liability.
Digitized for FRASER http://fraser.stlouisfed.org/ Federal Reserve Bank of St. Louis

STATISTICAL APPENDIX 2 9 5
TABLE 96.—Summary of receipts, withdrawals, and balances of foreign currencies acquired by the U.S. Government without payment of dollars, fiscal year 1970
[In U.S. doUar equivalents]
Balance held by Treasmy Department, July 1,1969 _ $1, 588,041,174. 71 Receipts:
Sale of agricultural coramodities pursuant to: Title I, Pubhc Law 480, Agricultural Trade Development
and Assistance Act of 1954, as amended (7 U.S.C. 1704-1705).. $352,154,957. 79 Commodity Credit Corporation Charter Act (15 U.S.C. 713a).. 334,209. 78
Loans and other assistance: Title I, Public Law 480, loan repayments, including interest:
Sec. 104(e) loans to private enterprises 35, 771,478.99 Sec. 104(f) loans to foreign governments 115,940,857. 25
Sec. 612, Foreign Assistance Act of 1961 (22 U.S.C. 2362) loan repayments including interest 153,703,388.83
Lend-lease and surplus property agreements (22 U.S.C. 412b) and (50App. U.S.C. 1641(b)(1), 1946ed.)i. 854,072.70
Bilateral agreements 5 percent and 10 percent comiterpart funds (22 U.S.C. 1852 (b)) 1,738,704.29
Interest on depositary balances 24,747,919.83 AU other sources 235^443,474^28
Total collections.. 770,694,063.74
Total available 2,358,735,238.45 Withdrawals:
Sold for dollars, proceeds credited to: 3 MisceUaneous receipts of the general fund 96, 602,84.9.11 Coramodity Credit Corporation, Agricultm-e 228,999,065. 61 Other fund accounts 2 54,247, 56L 72
Total sold for dollars 379,849,476.44
Requisitioned for use -without reimbursement to the Treasm-y pursuant to:
Sec. 104, PubUc Law 480, as araended (7 U.S.C. 1704) 299, 276,159.72 Other authority 2,219,648.55
Total requisitioned without reiraburseraent 301,495,808. 27
Total withdrawals.... 681,345,284.71
Adjustment for rate differences —7,726,381.12
Balances held by Treasmy Departraent, June 30,1970 1,669,663, 572. 62
Analysis of balances held by Treasury Departraent June 30, 1970: Proceeds for credit to miscellaneous receipts of the general fund 722,131,665.44 Proceeds for credit to agency accounts:
Comraodity Credit Corporation, Agricultm-e 553,134,958. 54 Informational media guaranties fund, USIA 9,578.01 Other -48,144,856.16
For program aUocations: Sec. 104, t i t lel , Public Law 480, as amended 442,532,226.79
Total 4 1,669,663,572.62
Balances held by other executive agencies June 30, 1970, for pm-pose of: Economic and technical assistance under Mutual Secmity Act 7,296,968. 85 Prograra uses under Agricultm-e Trade Developraent Assistance Act 447,947,822.05 Mihtary family housing in foreign countries 262,757.21 Trust agreeraents with foreign comitries 48,818,944.86 Other : . . . 14,941,285.28
Total 519,267,778.25
Grand total 2,188,931,350.87
1 Collections under lend-lease and surplus property agreeraents will continue to be made until such agreements are satisfied, although the act originally authorizing such action has been repealed.
2 Includes Special Letters of Credit activity araounting to $38,900,000.00. 3 DoUars acquired frora the sale of foreign cmrencies are derived frora charges against the dollar appro
priations of the Federal agencies which use the currencies. These doUar proceeds are credited to either raiscellaneous receipts or other appropriate accomits on the books of the Treasmy.
4 Represents the dollar value of cm-rencies held in the accounts of the Treasmy Departraent only. Currencies transferred to agency accomits pursuant to requisitions subraitted to the Treasury Departraent or as otherwise authorized, are accounted for by the U.S. Government agencies. Balances held by executive departments and agencies as of Jmie 30,1970 are stated at the end of summary.
NOTE.—For the purpose of providing a common denominator, the cmrencies of 101 foreign couiitries are herein stated in U.S. dollar equivalents. It should not be assumed that dollars in amounts equal to the balances shown are actually available. The dollar equivalents are calculated at varying rates of exchange. Foreign cm-rencies deposited under certain provisions of Public Law 480 and the Mutual Secmity Act were converted at deposit rates provided for in the international agreements with the respective countries. The greater portion of these currencies is available to agencies without reimbursement pmsuant to legislative authority and, when disbursed to the foreign governments, will generally be accepted by them at the deposit or collection rates. Cmrencies avaUable for sale for dollars and certain other U.S. uses were converted at the end of the month for transactions during the month, these market rates being those used to pay U.S. obligations. The closing balances were converted at the June 30,1970 market rates.
For Sumraary data on collections and withdrawals by country and prograra, see part V of the "Combined Statement of Receipts, Expenditures and Balances of the United States Governnient for the Fiscal Year ended June 30,1970."
Digitized for FRASER http://fraser.stlouisfed.org/ Federal Reserve Bank of St. Louis

296 19 70 REPORT OF THE SECRETARY OF THE TREASURY
T A B L E 97.—Balances offoreign currencies acquired by the U.S. Government without payment of dollars, J u n e 30, 1970
Country Currency In Treasury accounts
Foreign currency DoUar equivalent
In agency accounts
Foreign currency
DoUar equivalent
Afghanistan Argentina. Austraha Austria Bahamas.. Barbados Belgium Bermuda BoUvia BrazU. British Honduras. Burma Cambodia Cameroon Canada Ceylon Chad Chile.. China Colombia Congo, Republic
ofthe. Costa Rica Cyprus Czechoslovakia... Dahomey Denmark Dominican Re
pubhc. Ecuador... ElSalvador Ethiopia Finland France Gambia Germany, West... Germany, Eas t . . . Ghana Greece Guatemala Guinea Guyana Hai t i . . Honduras Hong Kong Hungary Iceland... India Indonesia Iran Ireland .Israel
Afghani Peso Dollar SchiUing Dollar Dollar . . Franc Pound Peso Cruzeiro Dollar K y a t . . Riel CFA Franc. Dollar Rupee CFA Franc. Escudo N.T. Dollar. Peso . . . Zaire
Colon Pound Koruna CFA Franc. Krone Peso
Sucre Colon -DoUar Markka Franc Pound W.D.Mark.. E.D.Mark. . Cedi Drachma Quetzal Franc Dollar Gourde Lempira DoUar. Forint Krona Rupee Rupiah Rial Pound Pound
—75, 585, 912. 00 -29, 503. 99 -14,726.63
-192,403.67 -536. 31
-25,191. 82 7,470, 725. 00
- 3 , 878.30 -26, 742, 975. 07 -9,789,476.13
-215.47 59, 385, 707. 46
-4,409, 023. 80
38, 372. 48 15, 292,183. 32
-2,377,915.31 31, 747, 773. 56 3, 000, 335. 23 -285, 944.13
-74, 631. 36 - 1 , 307. 34
7,161, 557. 00
-20, 699. 40 -95, 521. 76
- n o , 000. 00 139,107. 05
1, 359, 303.42 176, 966. 02
3,314,886. 79
-413, 32,
1, 952, 121, 442,
303, 1, 443, 208,
- 1 , 400, 381,
-87, 882,
5,215, 5, 840, 685,
120, no, - 1 6 , 943,
20, 6,156,
751. 98 042. 69 464.37 021. 95 549. 70 797. 59 389. 00 000. 00 no. 26 743. 70 693. 00 722. 20 118.13 510. 63 916. 00 819. 81 078. 72
-927,434.50 -7,376.00 -16,522.64 -7,457. 51 -536.47
-12,608.52 150, 558. 75 -3, 897. 79
-2, 251, 092.18 -2,161,032. 26
-129.41 12, 581, 717. 68 -80, 354. 00
35, 728. 56 2, 579, 653. 06
-175,104.22 793, 694. 34 163, 952. 75
-571,888. 27
-11, 273. 62 -3,154.04 994, 660. 69 .
- 2 , 757. 71 -95, 521. 76
-5,164. 32 55, 620. 56 547, 885. 30 42, 539. 91 515,376. 90
-113, 2,
1, 914, 4, 048, 303,
5, 854,
80, 190, -13, 29, 59,
768, 511, 315,
-222, 49,
1, 758,
699. 36 584. 09 180. 76 067. 39 549. 70 802. 43 •695. 20 000. 00 555.13 681.17 423.10 337. 00 199. 75 250. 68 215. 30 963.45 879. 63
75, 585, 29, 14,
198,
25, 1,435,
3, 48,496, 23, 564,
22, 209, 13, 366, 3, 597,
1, 6, 996,
53, 2, 377,
279, 664, 6,105, 394,
912. 00 503. 99 726. 63 042.09 536. 31 191.82 869.00 878. 30 495. 93 361. 74 215. 47 071.10 183. 22 094.00 339. 52 042. 59 436.00 915.31 098.47 028. 66 817.67
78,760. 94 1,307.34
6,558,816.00 27,448.67 129,472.37
119,812.92 7,472.88
289,100.89 20,845.00 280,992,97 1, 000. 00
573, 587. 58
7, 353,905. 23 412, 538.00 1,405.46
4,436, 260,181. 50 1,389.00
6,446. 50 82, 773.70 100,136. 30 219, 750. 00
1, 579, 646,882. 59 174, 562, 545.63 51, 765,168.00
524. 78 54,019,409. 80
927, 7,
16, 7,
12, 28, 3,
4,082, 5,201,
4, 705, 243, 13, 1,
1,180,
175, 6,991, 333,
434. 51 376. 00 522. 64 676.05 536.47 608. 52 937. 30 897.79 196. 63 845.84 129.41 311. 67 597. 29 032. 95 247.23 169.13 193. 61 104.22 602.46 608.13 635. 35
11,897.42 3,154.04
23,763.83 3,656.90
129,472. 37
5,625.02 2,987.96
116,525.96 5,010.82 50,895.31 2,420.14
157,622.31
7,209,711.11 13,751.27 1,405.46
17,996,998.71 695.20
3,223. 25 13,686.13 3,337. 88 2, 500.00
207,848,274. 04 458,169.4r 678,887.45 1, 263. 02
15,434,117. 09
Footnotes at end of table.
Digitized for FRASER http://fraser.stlouisfed.org/ Federal Reserve Bank of St. Louis

STATISTICAL APPENDIX 297
T A B L E 97.—Balances of foreign currencies acquired by the U.S. Government without payment of dollars, J u n e 30, 1970—Continued
C o u n t r y Cur r ency I n T r e a s u r y accounts
Foreign cur rency DoUar equ iva len t
I n agency accounts
Foreign currency
DoUar equ iva len t
I t a l y L i ra Ivo ry Coast C F A F r a n c . . . Jaraaica P o u n d J a p a n Y e n . . J o r d a n D i n a r K e n y a ShiUing Korea Won Laos K i p L e b a n o n P o u n d L i b y a P o u n d Malawi ! P o u n d Malays ia . . Dollar Mali F r a n c Mexico. . Peso . Morocco Di rha ra N e p a l I n d i a n R u p e e . . N e p a l R u p e e Ne the r l ands Gui lder N e w Zealand Dollar Nica ragua Cordoba Nigeria P o u n d N o r w a y K r o n e . . P a k i s t a n R u p e e P a r a g u a y Guaran i P e r u . Sol Phi l ipp ines Peso Po land Zloty Por tuga l Escudo Senegal . C F A F r a n c . . . Sierra Leone Leone Somali ShiUing South Africa PLand Spain Pese ta Su d an P o u n d Su r inam F l orin Sweden HCrona Swi tzer land F r a n c Syr ian A r a b P ound
Repub l i c . T h a i l a n d B a h t T r i n i d a d T & T D o l l a r , Tun i s i a D i n a r T u r k e y L i r a . U g a n d a ShiUing U n i t e d A r a b P o u n d
Repub l i c . U n i t e d K i n g d o m . P o u n d U p p e r V o l t a C F A F r a n c . . . U r u g u a y Peso Venezue l a . - . . Bolivar V i e t n a m Pias t re Yugoslavia D i n a r . Z a m b i a . . . K w a c h a
- 3 0 , 917, 789. 00 - 8 5 , 009,431. 00
1, 521. 96 7, 079, 583, 347. 00
- 7 1 8 , 355. 60 - 1 5 , 641. 97
-2,104,045,887.62 - 1 1 3 , 947. 61
-12 ,281.00 - 1 2 3 . 67 - 5 9 . 54
-14 ,373 .73
-49 ,153 . 88 - 3 0 8 , 005.18
1, 827. 08 19, 665, 509. 28
- 2 , 012, 200. 57 -2 ,192 . 59
-6 ,835,756.63 - 4 7 4 . 78
- 3 , 772. 96 - 3 4 6 . 71 -144 .55
- 4 , 720. 44
- 5 9 , 782. 71 40,206,862.42
- 4 , 786. 45 8,009, 335.15
1, 497, 539. 90 -5 ,452 .09
1, 621, 599. 35
413,228. 45 - 6 , 1 6 4 . 73 231, 657. 05
-30 ,087.44 793, 558,183. 84 22, 323.208. 28
-510 , 683. 45 5, 956, 522.19
9, 905,021, 599. 57 - 1 8 8 , 933. 20
-144,438,543.00
- 4 , 2 1 5 . 1 1 165,497,014. 35
177,168. 32 - 1 1 , 772. 32 966,026. 95
412, 709, 233. 32 - 6 , 631. 56
- 5 2 3 , 328. 06
776, 649.13 -688 .14
28, 469,266. 00 143,885. 76
- 8 4 7 . 50 -20 ,481.59
5, 400,715. 30 - 6 , 313, 347. 67
-996,069.52 - 1 0 . 50
7, 427, 309. 08 59, 017, 248. 70
-12 ,152.10 114, 901, 758. 72
- 2 6 7 , 363. 30 847, 913. 00
3,489, 601. 02 252,467. 40
- 1 , 438, 661, 544. 75 774,211,588.30
-84 ,168.29
109, 387. 20 - 9 7 0 . 30
408, 454. 31 41,465. 64
-453 .45 - 3 , 942. 56
1,250, 744. 63 - 1 , 517, 631. 65
- 4 7 , 8 4 1 . 96 - 5 . 2 6
14,147, 255.40 6, 557, 472. 08
- 1 , 703. 41 206,806, 621. 37
3, 270,952, 85, 036,
8, 993, 718, 425,
2,154, 241, 1, 025,346,
12,
14, 120, 788,
59, 55, 921,
118, 722, 6,
273, 5,
14, 24, 70,
302, 659, 385, 351,
1, 536, 6,081,
50, 452, 204,
457,854,
124, 1,
14, 917, 2,184,
23, 14,
27. 293,
903. 00 706. 00 318. 70 446. 00 355. 60 323. 35 336. 68 738. 52 281.00 123. 67 59.54
373. 73 736. 00 782. 71 438.89 939. 51 133.87 508.81 452. 09 558. 35 242. 57 493. 50 286.54 190. 36 536.28 576.87 458.16 653. 40 468. 00 108.42 691.19 122. 68 962. 00 353. 60 847. 50 399. 59 581. 55 347. 67
34, 289, 987. 76 360. 65
3, 567, 087. 74 48, 566,118. 79
178, 782. 90 31, 992, 730. 26
-641,620.61 268,198.66 3, 072.15 3, 574,449. 00
13, 997. 60 8, 649, 604.46 56, 354. 33 62,075.45
-12,192,046.99 4, 334, 948, 38L 96 62, 000, 927. 07 92, 397,938.45
-118 ,88L76 84,168.29
5, 200,
24, 2,012,
59, 6, 998, 4, 272,
3,
4, 218,
4, 11,139, 15, 621,
75, 6. 2,
68, 9,
60, 989, 3,058,
35, 986,
2,102, 7,
1, 658,
17, 1,
214, 6,294,
4, 3,
6, 560,
243. 08 104. 01 382. 59 981. 79 200. 56 619.19 834. 76 278. 08 772. 96 346. 71 144. 55 720. 44 820.17 786. 45 728. 86 439. 41 597. 85 471. 53 164. 73 079.76 250. 56 875.81 470. 34 342.79 420. 39 308.28 185. 76 183. 34 893. 00 130.11 562.14 583. 02 031. 02 967.15 453.45 504. 25 376. 92 900.88
1, 646, 973. 47 180. 51
6, 794, 452.87 5, 396, 235.41
25,060. 68 57, 582, 307.89
643, 625. 31 12, 950. 90 34, 695. 57 13,856.13
36, 736,850. 70 7, 391,835. 07
118,881. 75
T o t a l . 11,669,663,572.62 1519,267,778.25
1 F o r t he purpose of provid ing a common denomina tor , the currencies of 101 foreign countr ies are herein s ta ted in U . S . dollar equiva len ts . I t shou ld not be assumed t h a t doUars in a m o u n t s equal to the balances shown are ac tua l ly avai lable .
Digitized for FRASER http://fraser.stlouisfed.org/ Federal Reserve Bank of St. Louis
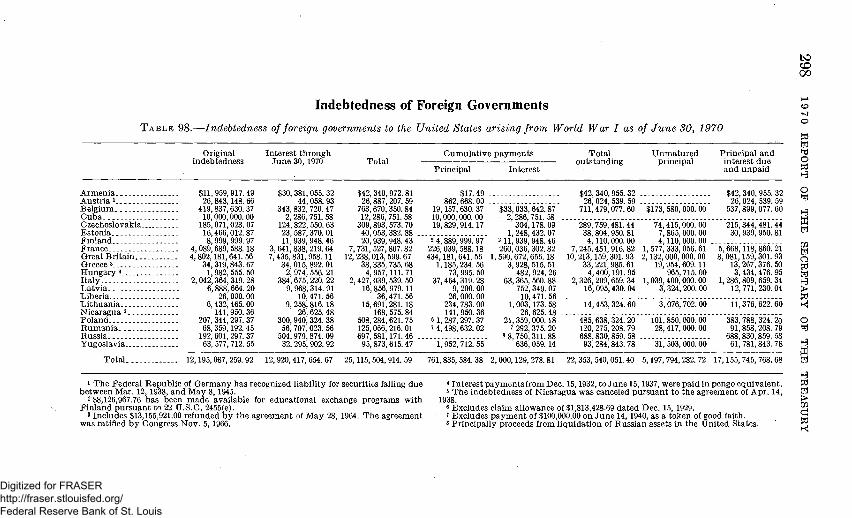
CD GO
Indebtedness of Foreign Governments
T.ABLE 98.—Indebtedness of foreign governments to the United States arising from World War I as of J u n e SO, 1970
Original indebtedness
Interest through June 30, 1970
Cumulative payraents
Principal Interest
Total outstanding
Unraatured principal
Principal and interest due and unpaid
Pi
yn o Pi H
$42,340,955.32 $42,340,955.32 2 26,024,539.59 26,024,539.59 ^
,642.87 711,479,077.60 $173,580,000.00 537,899,077.60 ^ i,75L58 M ,178.09 289,759,481.44 74,415,000.00 215,344,48L 44 H ;,432.07 38,804,950.81 7,865,000.00 30,939,950.81 ^ 1,948.46 4,110,000.00 4,110,000.00 ^^ i, 302.82 7,245,451,916.82 1,577,333,056.61 5,668,118,860.21 ^ !,656.18 10,213,159,301.93 2,132,000,000.00 8,081,159,301.93 r< ,515.51 33,221,985.61 19,954,609.11 13,267,376.50 ^ !,924.26 4,400,19L95 965,715.00 3,434,476.95 t=J 1,560.88 2,326,209,659.34 1,039,400,000.00 1,286,809,659.34 ^ :,349.07 16,095,430.04 3,324,200.00 12,771,230.04 >
0,471.56 Pi ~, 173.58 14,453,324.60 3,076,702.00 11,376,622.60 KJ 1,625.48 1,000.18 485,638,324.20 101,850,000.00 383,788,324.20 O 1,375.20 120,275,208.79 28,417,000.00 91,858,208.79 ^ 1,311.88 688,830,859.58 688,830,859.58 1,059.14 93,284,843.78 31,503,000.00 61,781,843.78 ^
761,835,584.38 2,000,129,278.81 22,353,540,05L 40 5,197,794,282.72 17,155,745,768.68 i^
Pi
> ZP
Pi
Arraenia $11, Austria 1 26, Belgiura 419, Cuba 10, Czechoslovakia 185, Estonia 16, Finland 8, France 4,089, Great Britain 4,802, Greece 3 34, Hungary 4 i, Italy 2,042, Latvia 6, Lib eria Lithuania 6, Nicaragua ^ Poland 207, Rumania 68, Russia 192, Yugoslavia 63,
Total 12,195,087,259.92
959,917. 49 843,148. 66 837,630. 37 000,000. 00 071,023. 07 466,012. 87 999,999. 97 689,588.18 181,641. 56 319,843. 67 982, 555. 50 364,319. 28 888, 664. 20 26,000. 00 432,465. 00 141,950. 36 344,297. 37 359,192. 45 601, 297. 37 577,712. 55
$30, 381, 44,
343,832, 2, 286,
124,822, 23, 587, 11, 939,
3, 641,838, 7,435,831
34,015, 2, 974,
384,675, 9, 968,
10, 9, 258,
26, 300, 940, 56, 707 504, 979; 32, 295,
055. 32 058. 93 720. 47 751. 58 550. 63 370. 01 948.46 219.64 958.11 892. 01 556. 21 220. 22 314. 91 471. 56 816.18 625. 48 324. 38 023. 56 874. 09 902. 92
$42, 26,
763, 12,
309, 40, 20,
7, 731, 12, 238,
38, 4,
2,427, 16,
15,
508, 125, 697,
95,
, 340,972. 81 , 887, 207. 59 670,350. 84 286, 751. 58
, 893, 573. 70 053,382. 88 939, 948. 43 527,807. 82 013, 599. 67 335, 735. 68
, 957, 111. 71 , 039, 539. 50 ,856,979.11
36,471. 56 . 691, 281.18 168, 575. 84
, 284,621. 75 066, 216. 01
, 581,171. 46 , 873,615. 47
$17. 49 862, 668. 00
19,157,630. 37 10,000, 000. 00 19,829, 914.17
'"2'4,''889,'999."97' 226,039, 588.18 434,181, 641. 56
1,185, 234. 56 73,995. 50
37,464,319. 28 9, 200. 00
26, 000. 00 234, 783. 00 141, 950. 36
6 1, 287, 297. 37 7 4,498, 632. 02
""i,'952,"7i2."55"
$33,033, (
' 304', 1,248,'
211, 939,! 260,036,;
1, 590.672, ( 3,928,
482,! 63, 365, J
752,; 10,'
1,003,: 26, (
21,359, < 7 292,;
8 8, 750,; 636, <
12, 920,417,654. 67 25,115, 504, 914. 59
1 The Federal Republic of Germany has recognized liability for securities falling due between Mar. 12, 1938, and May 8, 1945.
2 $8,126,967.76 has been made available for educational exchange programs with Finland pursuant to 22 U.S.C. 2455(e).
3 Inc ludes $13,155,921.00 refunded b y the agreeraent of M a y 28, 1964. T h e agreement was ratified b y Congress N o v . 5, 1966.
4 Interest payments from Dec. 15,1932, to June 15,1937, were paid in pengo equivalent. 5 The indebtedness of Nicaragua was canceled pursuant to the agreement of Apr. 14,
1938 6 Excludes claim al lowance of $1,813,428.69 da ted Dec. 15, 1929. 7 Excludes p a y m e n t of $100,000.00 on J u n e 14,1940, as a token of good faith. 8 Principally proceeds from liquidation of Russian assets in the United States.
Digitized for FRASER http://fraser.stlouisfed.org/ Federal Reserve Bank of St. Louis

T A B L E 99.—Status of German World War I indebtedness as of June 30, 1970
Funded Interest through Total indebtedness June 30,1970
Cumulative payments
Principal Interest Total Unmatured outstanding
principal
Principal and interest due and
unpaid ZP
i M ZP y ^
>
Agreements as of June 23,1930, and May 26,1932: Mixed claims (reichsmarks)... i 1,632,000,000.00 Ai-my costs (reichsmarks) 1,048,100,000.00
735,420,000. 00 683,868,301. 50
2,367,420,000. 00 1,731, 968,301. 50
81,600, 000. 00 50, 600,000. 00
5, 610,000. 00 856,406. 25
2,280, 210,000. 00 448,800,000. 00 1,831,410,000. 00 1,680,511,895.25 1,680,511,895.25
Total (reichsmarks) 2,680,100,000.00 1,419, 288,30L 50 4,099,388,30L 50 132,200,000.00 6,466,406.25 3,960,721,895.25 448,800,000.00 2 3,511,921,895.25 U.S. doUar equivalent 3 $1,059,107,665.84 $571,839,284.20 $1,630,946,950.04 4 $31, 539, 595. 84 4 $2, 048, 213. 85 $1,597,359,140.35 $181,001,040.00 $1,416,358,100.35
Agreeraent of February 27,1953, mixed claims (U.S. doUars)... 97,500,000.00 97,500,000.00 65,500,000.00 32,000,000. 00 32,000,000. 00
1 Agreement of Feb. 27, 1953, provided for cancellation of 24 bonds totaling 489,600,000 reichsmarks and issuance of 26 doUars bonds totaUng $97,500,000.00. The dollar bonds mature serially over 25 years beginning Apr. l, 1953. All uninatured bonds are of $4,000,000.00 denomination.
2 Includes 4,027,611.95 reichsmarks (1,629,049.46 on moratorium agreement (Ai-my costs) and 2,498,562.50 interest on funded agreeraent) deposited by Gei-man Government in the Konversionskasse fur Deutsche Auslandsschulden and not paid to the United States in dollars as required by the debt and moratorium agreement.
3 The unpaid portion of this indebtedness is converted at 40.33 cents to the reichsmarks, which was the exchange rate at the time of default. The 1930 agreement provided for a conversion forraula for payments relating to the time of payment. These figures are estimates made solely for this statistical report.
4 Payraents converted to U.S. doUars at rate applicable at the tirae of payraent, i.e., 40.33 or 23.82 cents to the reichsraark.
to CD CD'
Digitized for FRASER http://fraser.stlouisfed.org/ Federal Reserve Bank of St. Louis

TABLE 100.—Outstanding indebtedness offoreign countries on U.S. Government credits (exclusive of indebtedness arising from World War I) as of June 30, 1970, by area, country, and major program ^
[In miUions of doUars]
CO O o
Area and coun t ry
Western E u r o p e : Aus t r i a . . . . . Be lg ium C y p m s . D e n m a r k F i n l a n d . . F rance Gerraany , Federa l Repub l i c of.. . G r e e c e . . Iceland . L Ire land . . . . . i I t a ly L u x e r a b o u r g . . N o r w a y Por tuga l Spain Sweden Uni ted Kingdom Yugoslavia E u r o p e a n Atomic E n e r g y C o m m u n i t y E u r o p e a n Steel and Coal C o m m u n i t y N o r t h At lan t i c T r e a t y Organizat ion (Mainte
nance Supp ly Services Agency) Western Europe—Regional
T o t a l Western Eu rope
Other E u r o p e : Czechoslovakia . H u n g a r y Po land . . R u m a n i a Soviet Union . . .
To ta l other E u r o p e
Unde r Expor t -I m p o r t
B a n k Act
1L6 22.1
'35. '6 ' 1L7 17.8 18.9 4.5
23.6 259.5
... 45.3
316.6 12.5
566.6 70.8 12.8
27.9
1,457. 5
3.9
3.9
Unde r foreign
assistance (and related)
acts
34 .3 '
27. ' i '
2.9
77.7 13.3 95.5
18.3 2L2 46.3
285.0 109.4
5L2
. 1
784.1
43.9
43.9
U n d e r Agr icul tura l T r a d e Deve lopmen t and Assistance Act
Loans of foreign currencies
T o foreign T o pr iva te governments enterprises
2.3.8
. 7
is.'i'
52.3 6.9
2.6 187.4
19L2
483.0
. 2 .... . 2
4.0
(*)
5.5
Long-term doUar
credits
16.1 4.4
3.7 7.1
226.8
258.1
Lend-lease, surp lus
proper ty , and other
war accounts 2
3.0
----298.6
L 8
L 9
462.4
n
772.0
4.9 2.1 8.0
162.3
177. 3
C o m m o d i t y Credi t
Corporat ion export
credits 3
.9 .
3 L 0 .
. 5 .
13.4 . .
45.8
.7 . 37.8 . 10.9 .
49.4 . .
O the r credits
2, 965. 2
45.2
3, 010. 4
T o t a l
35.4 59.4
1.8 . . 2 7 . 1
58.5 313.4
19.6 200.0 29.1
119.1 26L4
L 8 19.1 72.8
557.4 12.5
4,279.2 61L6
58.0 5L2
. 1 27.9
6,816.4
4.9 2.8
93.6 10.9
162.3
274.5
CO
0
Pi
0 Pi H
0
*
g W
ZP
1 yji Hi
n " H
H w t?j > ZP
U pi y<
Digitized for FRASER http://fraser.stlouisfed.org/ Federal Reserve Bank of St. Louis

Asia: Afghanistan 15.7 26.9 . 5 . . 8.9 52.0 Burma --.- : 30.0 15.5 . 45.5 Ceylon 19.7 1 L 9 . . 35.2 66.8 China (Taiwan) 83.1 175.6 31.0 6.0 . 30.2 116.0 ' . 3 442.2 India . 240.7 2,719.4 1,914.8 82.2 26L 7 1.9 5.2 14.4 5,240.3 Indonesia 94.0 113.7 12.5 325.4 36.4 582.0 I r a n . 136.9 269.1 28.8 1.5 20.6 24.1 3.0 484.0 Iraq . . . : : . . . . 8.4 8.6 17.0 Israel -- . 77.0 205.0 20L 6 7.0 102.4 593.0 Japan 343.6 97.8 . . 230.5 67L9 Jordan . 1.4 12.0 1.6 4.5 19.5 Korea 19.1 248.2 . 3.2 98.5 2L 0 39.8 429.8 Kuwait 35.0 . : . . : 35.0 Lebanon 3.4 2.1 23.2 28.7 Malaysia 32.1 15.8 .." 47.9 Nepal - . .3 2.4 2.7 Pakistan. 55.6 1,332.9 408.7 19.4 90.2 4.5 1,911.3 ZP Philippines 100.5 38.9 9.2 2.2 25.4 (*) 18.8 195.0 g Ryukyu Islands 6.7 .3 10.0" 17.0 g SaudiArabia . . . . . . 10.8 68.2 . (*) 79.0 3 Syria 1.2 1 1 . 0 . . : .2 12.4 ZP Thailand.. 31.8 50.4 3.1 . 2 . 85.5 ^ Turkey • 18.3 859.8 154.9 27.1 43.4 1,103.5 o Vietnam.. . . ._ : 27.1 . : . . . . . 27.1 >!
TotalAsia 1,307.4 6,216.3 2,905.3 148.6 1,06L9 429.9 95.3 24.4 12,189.1
R
Western Hemisphere: ^ Antigua. L2 L2 g Argentina.... . . . . . . : . . . . . . 192.6 124.5 .7 : . . . : . . . . . . . . . . . . J 317.8 g Bahamas... 26.0 26.0 2$ Bolivia 39.8 103.3 22.8 2.0 18.2 (*) 186.1 O BrazU 50L4 933.7 34 .4 . 10L9 3.5 5.3 .2 1,580.4 ^ Canada. 18.1 18.1 ChUe 325.0 548.7 25.5 .2 47.8 .1 947.3 Colombia 55.6 528.5 10.7 .8 24.1 .1 619.8 Costa Rica 15.1 50.2 65.3 Cuba 36.3 . 36.3 Dorainican Republic 24.2 138.7 31.1 194.0 Ecuador 17.2 84.4 3.2 .2 7.1 112.1 ElSalvador L2 49.7 50.9 Guatemala . 10.8 29.3 . 8 - . . . .1 41.0 Guyana 18 .0 . . .3 18.3
- HaitL. ' 28.7 5.4 .1 : . . . . . . . . . . . . 34.2 Honduras.. . . .6 33.4 .1 34.1 Jamaica.. 6.2 7.4 13.6 Mexico 305.9 97.2 9.3 412.4 Nicaragua. 4.9 58.8 .1 63.8
CO Footnotes at end of table. O
Digitized for FRASER http://fraser.stlouisfed.org/ Federal Reserve Bank of St. Louis

CO
o
T A B L E 100.—Outstanding indebtedness of foreign countries on U.S. Government credits (exclusive of indebtedness arising from World War I) as of J u n e 30, 1970, by area, country, amd major program ^—Continued
[In mUlions of doUars] •
Area and country
Western Heniisphere—Continued Panaraa Paraguay. . . Pern Surinam Trinidad and Tobago. Uruguay Venezuela
Western Heraisphere—Regional Western Heraisphere—Unspecified. . .
Total Western Heraisphere
Africa: Algeria Angola Cameroon Congo (Brazzaville) Congo (Kjnshasa) . . Dahomey Ethiopia. Ghana Guinea . . Ivory Coast Kenya . . . . . . Liberia Malagasy Repubhc
Under Export-Import
Bank Act
15.6 6.3
52.6 . . . . • 3.9
13.8 L7
129.7
1,834.4
6.7 2.7 0.1
.... ..... 38.8
.4 11.0
-._. .....
Under foreign
assistance (and related)
acts
67.4 24.2
113.4 LO
39.7 138.7 43.3
3, 238. 9
14.4
50.1 .2
37.0 97.4 7.2 5.0 5.3
48.6 2.6
Under Agricultural Trade Development and Assistance Act
Loans of foreign currencies
To foreign governments
-6.4 14.9
.2
128.1
6.8
.'4' 13.1 4.1 1.0
To private enterprises
LO L l
.(*)
5.3
.7
.... .3
Long-term doUar
credits
5.5 . .9 .
18.7 .
256.4
8.7 .
29.6 . ------14.0 . 10.8 . 3.7 . 7.8 . L8
Lend-lease, surplus
property, and other
war accounts 2
6.8 .
10.4
1
17.7 .
Coramodity Credit Other
Corporation credits export
credits 3
.1
5.4 .7
Total
83.0 43.4
182.9 4.9
13.8 60.4
268.4 43.3 6.8
5,479. 6
8.7 6.8
17.1 .1
87.2 0.2
52.2 164.4 22.8 20.7 13.1
140.7 2.6
Pi
hd O Pi
o
ZP
o pi
>
O
> ZP d Pi y<
Digitized for FRASER http://fraser.stlouisfed.org/ Federal Reserve Bank of St. Louis

Malawi Mah Morocco Mozambique Niger Nigeria Senegal Sierre Leone Somalia . . ._ . . . , South Africa Sudan Tanzania Tunisia Uganda United Arab Republic. Zambia.. Africa—Regional
Total Africa..
Oceania: Australia New Guinea—Papua.. New Zealand
Total .Oceania..
United Nations Worldwide—Unspecified 4
Total all areas
19.5 5.7
0.2 . 0.9
276. 3 .1 .
40.9 36.3 .
3.9
'ib'2~
2.1 32.9
6.4 .2
.9
9.0 L9 .5
L 5
23.4 3.5 2.6
5.1 20.6 .
147. 3 7.6 .
73.1
7. 2 .
"'55.'7"
"336.'i"!
6.9
35.5
' l l ' b '
4.0
"ss.T
848.8 172.1
386. 5 . 0.7 .
49.5 . (*)
-(*)
40L1 -233.9 . 81..4
5,654. 4 10,898.1 163.4 1,748. 2 1,407. 3 266.0 3,116. 9
0.2 LO
380.7 5.9 2.1
36.8 0.9
12.1 9.5 .9
12 3 20'. 6
244.6 7.6
505.5 3.5
10.9
1, 791. 7
386.5 0.7
49.5
81.4. 167.2
27, 236. 0
ZP
> ^ •
h-i-ZP y ^
o > > yn yn
!
1 Includes estimates for the U.S. dollar equivalent of receivables denorainated in other than doUars and/or payable at the option of the debtor in foreign currencies, goods or services. The total amount of such estimates approximates $6,246.3 miUion.
2 Data under lend-lease, surplus property and other-^war accounts include $3.6 miUion for surplus property credits which are not reported in the "Status of accounts under lend-lease and surplus property agreements" in table 101. Data exclude indebtedness shown in table 101 consisting of $21.7 miUion in net uncoUected short-term "cash" receivables, $50.6 million deferred interest, and $46.4 miUion capitalized interest, but includes $230.5 miUion indebtedness arising from war account settlements not reflected in table 101.
• 3 Includes credits of over 1 year raaturity under GSM-3 and GSM-4 regulations. Total GSM-3 credits outstanding were $77.9 raillion and".GSM-4 credits outstanding" were $187.1 raillion.
4 Includes credits held by the Export-Import Bank with the guarantee of the Department of Defense amounting to $401.1 million, of which $384.1 mUlion, were extended under the foreign assistance (and related) acts. In addition $150.2 mUlion of military credits extended under the foreign assistance (and related) acts are outstanding in unspecified countries.
* Less than $50,000.
CO O CO
Digitized for FRASER http://fraser.stlouisfed.org/ Federal Reserve Bank of St. Louis

CO
o
T A B L E 101.—Status of accounts under lend-lease and surplus property agreements (World War I I ) as of J u n e SO, 1970
Country, etc.
Settleraent obligation and interest billed
(net)
Credits Status of amounts outstanding
Collections
U.S. doUars Foreign currency
(in U.S. dollar . equivalent)
Other credits • Total
outstanding Amounts past duel
Due over a period of years by agreement
o
P6 fej hd O Pi y ^
o
ZP
O
>
O
H3 Pi fel > ZP d Pi y<
Australia $44,061,710.80 Austria 10,591,496.96 Belgium 116,627,909.50 Burma 6,708,049.14 Canada 388,765,007.77 China 184,906,615.76 Czechoslovakia 10,605,607.78 Denmark 5,240,272.66 Ethiopia ' 4,558,958.36 Fmland. 25,102,613.04 France 1,267,692,769.69 Germany, Federal Republic of. 3 224,354,467..74 Greece 72,203,795.61 Greenland 8,35L28 Hungary 21,609,075.22 . Iceland - . . 4,855,98L42 India . . 4 igg, 174,37L 24 Indonesia. • 84,074,736.94 Iran • 45,444,248.13 Iraq ...- 54.00 Italy - 268,034,03L 77 Japan 13,728,409.82 . Korea 35,412,910.86 . Liberia.. . . . . . . . . . . .- 19,440,619.66
$34, 635,924. 87 3,054,425. 08
40,103, 955.'55 1, 005, 394. 68
388, 765,007. 77 . 16,062,109.14
596, 730. 50 4, 266,935. 24 3,899,523.26
17, 809,919. ,32 866, 303,300. 31
3, 790,821., 21 41, 703,906. 52
8,35L28 .
""'4,"496,"553."29" 184,777,327.13 43,024,232. 71 3,027,267. 45
54.00 . 164,301,462. 72
$8, 662,268. 75 6,980,264. 86
12,196,412. 53 ; . 5,560,577.14
$863, 517.18 . 556,807.01 .
61,340, .822.18 142,077. 32 .
$2,986, 719. 24 . $2,986,719.24
1, 591,795. 64
1,062, 961. 45 931,000. 00 23,620. 60
2,271,136.46 51,445, 798.03
218,766,344.92 .
29,344,892.63
8, 521, 770. 94
1,990,965. 94 42,337.42 . 635, 814. 50 . 697,805.34
51,402, 738. 29
1,156, 763.08 j
162, 315, 375. 77 | ^g^^ g ^ ggg ^ -3, 584,435, 73 j 6, 954, 949. 8" 5,591,386.91
78,000, 739. 36 - 3 , 584,435. 73 1,363,562.98
. 4,323,75L92 . 298, 540, 933.06 .
1,808,30L61
4, 323, 751. 92 . 298,540,933. 06
1, 808,301. 61
17,689,565.60 359,428.13 .
,6,943,404. 63 ,3,765,000.00 7,829,287. 39 .
1,818,002. 31
2-1,766.62
'2,''ioi,'507.'3i" .1,429,024. 93
- 1 , 766. 62
'672,'482."38
287, 954. 38 6,165, 685.10 6,165, 685.10 . 904,647.09. 36,380,857.14 ..
- . ,34,587,693.29 .34,687,693.29. 36, 380, 857.14
1, 717,937. 27. .
98,269, 393. 91 12,971,483.00 2, 524,307. 70
3, 541, 571. 44 756, 926. 82 .
3,977, 576. 38
1, 921, 603. 70
28, 911, 026. 78 17,-722,682.39 .
49, 866. 00
'7,'96i,'007.'36'
1, 871, 737. 70
20,950,019. 42 17. 722, 682. 39
Digitized for FRASER http://fraser.stlouisfed.org/ Federal Reserve Bank of St. Louis

L e b a n o n . . . . . - . . - . . . . 1,656,638.01 . Luxembourg -...^ . . . 120; 00 Middle E a s t . . 60,377,089.88 Ne the r l ands 176,795,845.11 N e w Zealand : . 4,935,288.23 N o r w a y . . . . . . I . . ' . . . . . 21,277,848.08" P a k i s t a n : . . . - 40,308,976.14 P h i l i p p i n e s . - : ! - . . : :. : . . . . 5,000,000.00 . P o l a n d . 60,914,328.37, S a u d i A r a b i a 21,427,119.60 Southern Rhodes ia . ."....-. 1,415, 510.78 Sweden 2,115,455.91 T h a U a n d . 7,064,989.28 T u r k e y . , : .14,474,333.51 U n i o n o f South Afr ica. . . 117,774,297.35 Un i t ed K i n g d o m 1,145,332,892.97 U . S . S . R . . . : . - . . . . . . . . . . . 348,087,628.78. Y u g o s l a v i a . . . : : / . . . . . . . , . 713,167.09 Amer ican Repub l i c i.;..:.:. ' 136,685,117.19. Amer ican R e d C r o s s . . . . . . . . . : 2,023,386.90 Federa l agencies . . . . . 243,114,726. 52 MUitary wi thd rawa l s . -. 187,629. 76 MisceUaneous i tems . . . . " . : . 1 1,472,077.38 United-Nat-ions-Relief a n d - R e h a b i l i t a t i o n Ad
mhi i s t ra t ion 7,226,762.25
. 11,142, 103,219,
2,176, 11; 262, 40, 308,
120.00 . 266. 72 746. 41 363. 59 135.23 976.14 .
32, 539, 21,427,
1,371, 240,
2, 235, 11,082,
116, 608, 436,957, 185, 549,
63, 114,365,
2,023, 243,092,
1,136,
719. 43 119. 60 . 931. 69 . 689. 98 736. 09 482.30. 622. 69 210.77 911. 65 . 376. 50 404.88 386. 90 . 796. 09 649.00 573.15
7,226, 762. 25 .
521, 818. 51 1,134, 819. 50
39,234,823.16 . 45,192, 686. 41
2, 098, 842. 28 8,435,074. 95
28,383,412.29 . 644,920. 86
1,580,637.90 . 15,16L 50 15,161. 50
2,005,855.29 10, 385, 744.17 .
2,988,158. 91 5,985.80 . 7,988,864.77 i4.77
1,824,653.33 4,178, 321. 72
-.2,110,714.-28 242,487. 98
40,792,550.15
50,112. 60 . 650,93L47 .
. 1,281,136.93 . 923,186. 68 .
154, 635, 335. 62
43,579.09 43, 579. 09
. 16,300.00 11, 921,129. 75
623, 065. 20 3,154,>183.21
512,947,796.43 5 512,947,796.43 162, 537,717.13 - 82,244,256. 90 80,293,460. 23
10,425.39 . . : 10,425.39 - 7,244,399.35 494,399.35 6 6,750,000.00
21,930.43 . 186,980.76 . 335, 504. 23 .
T o t a l 5,452,583,294.23 3,167,283,120.36 658,683,360.77 334,687,998.79 7 1,291,928,814.31 222,837,956.25 1,069,090, 858. (
1 Pr incipal and interest considered pas t due as bf J u n e 30, 1970, a n d i tems subject to negotiat ion.
2 Credi t . Represents a m o u h t s coUected-under advance p a y m e n t agreements no t appUed to ou ts tanding indebtedness .
3 Reduced due to set t leraent of a th i rd p a r t y claim. 4 Agreement provides for repajrment of 37,099,999.99 m p e e s . « Inc ludes $84,881,702.21 principal a n d interest postponed p u r s u a n t to agreement , fl Represents a m o u n t v/hich is pos tponed b y agreement pending se t t lement of certain
claims.
7 Inc ludes $369,841,613.07 due unde r surp lus p roper ty agreements , $640,001,475.86 due u n d e r lend-lease se t t l ement agreements , a n d $282,086,725.39 due u n d e r o ther lend-lease agreements . •
N O T E . — N o se t t lement agreeraent for lend-lease has been reached w i t h Ch ina , Greece, or the U . S . S . R .
ZP
I ZP H3
fel
CO
o
Digitized for FRASER http://fraser.stlouisfed.org/ Federal Reserve Bank of St. Louis
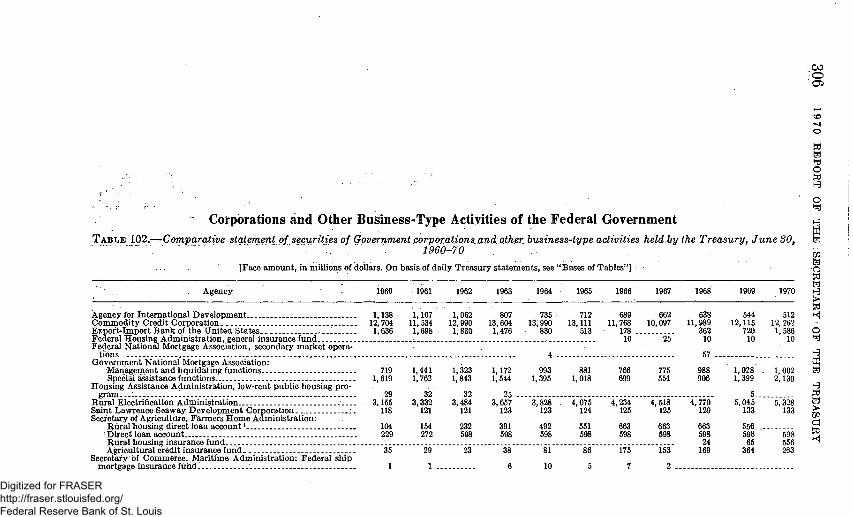
CO
-o
Pi fej hd
o : . ' • • • - : : . . - : • h ^
•: ' ' \ • • • . : , q
< ' ' • ' •
- . . • . ' O - - : -: - - . h r j
Corporations and Other Business-Type Actiyities of the Federal Government h • . •' W
T A B L E 102 .—Compara t i ve s ta tement of secur i t ies of Government co rpora t ions a n d other bus iness- type activit ies held by. the T r e a s u r y , J u n e 3 0 , .fej • ' " - . - - - - -- - - • 1960-70 -^
- . ' - - fej [Face amount, in milhons of doUars. Onbasisof daUy Treasury statements, see "Bases of Tables"] -O
. W
. ^ . . _ _ __ . . ^ ^ Agency : 1960 1961 1962 1963 1964 1965 1966 1967 1968 1969 1970 i
'. : . • : : : -. : '. >
• . W
Agency for Intemational Development 1,138 1,107 1,062 807 735 712 689 662 638 544 612 K| Commodity Credit Corporation 12,704 11,634 12,990 13,604 13,990 13,111 11,768 10,097 11,989 12,115 12,262 Export-Import Bank of the Unitea States 1,636 1,698 1,830 1,476 830 513 178 362 720 1,586 O Federal Housing Administration, general insurance fund. 10 25 10 10 10 ^ Federa] National Mortgage Association, secondary market opera- -
tibns.. 4 67 J; Governmen t Na t iona l Mortgage Association: . . . p!
'Management and l iqu ida t ing functions 719 1,441 1,323 1,172 993 881 766 775 988 1,028 . 1,002 feJ Special assistance funct ions . . 1,619 1,762 1,843 1,544 1,395 1,018 699 554 906 1,399 2,130
Housing Assistance Admin is t ra t ion , low-rent publ ic housing pro- . H gram.. .L. . . . : 1 29 32 32 25 5 g
Rmal Electrification Admmistration : . . . . 3.155 3,332 3,484 3,657 3,828 . 4,075 4,234 4,518 4,770 5,045 6,328 t^ SamtLawrenceSeaway Development Corporation.... : . 118 121 121 123 123 124 125 125 129 133 133 f l Secretary of Agricul ture , Fa rmer s H o m e Admin is t ra t ion : JH
Ri i ra l housing dhec t loan account 1 104 154 232 391 492 551 663 663 663 656 b Dhrect loan account . 229 272 598 598 598 598 698 598 598 598 598 S R u r a l housing insurance fund 24 65 656 ^ Agr icu l tmal credit insurance fund 36 29 23 38 81 86 175 153 169 364 263
Secretary of Commerce , Mar i t ime Admin i s t r a t i on : Federa l sh ip mor tgage insurahce f i ihd . . . ^ 1 1 6 10 6 7 2
Digitized for FRASER http://fraser.stlouisfed.org/ Federal Reserve Bank of St. Louis

Secretary of Housing and Urban Development: CoUege housing loans 779 988 1,227 1,532 1,746 1,983 2,305 2,066 1,366 950 1,400 National flood insurance fund (*) Pubhc facUity loans. 48 60 80 113 161 195 254 203 170 220 '260 Urban renewal fund 150 165 260 360 410 575 575 400 400 400 600
Secretary of the Interior: Bureau of Commercial Fisheries, Federal ship mortgage
insurance fund, fishing vessels (*) - -Bmeauof Mines, hehum fund... 2 22 41 64 94 110 140
Sraithsonian Institution: John P. Kennedy Center parking facilities . . . . = 16 20
Secretary of theTreasmy (Federal CivU Defense Act oi 1950). 1 (*) (*) (*) (*) (*) Tennessee Valley Authority .- 50 85 95 100 100 100 100 100 U.S. Information Agency 19 20 20 21 21 22 22 22 22 22 22 Veterans' Administration (veterans' dhect loan program) 1,180 1,330 1,530 1,730 1,730 1,730 1,730 1,730 1,730 1,730 1,730 Virgin Islands Corporation. (*) l l l l l l l 1 Defense Production Act of 1950, as amended: ^
Export-Import Bank of Washhigton 20 10 ^ General Services Administration. 1,715 1,765 1,790 1,804 1,921 1,945 1,912 1,737 1,737 1,912 1,872 > Secretary of Agricultme 64 65 65 66 66 78 79 79 81 81 94 y Secretary of the Interior, Defense Minerals Exploration ^
Admmistration 32 32 31 32 32 33 33 36 36 39 39 ^ Secretary of the Treasmy 140 93 91 21 M
D.C. Commissioners: Stadium sinking fund. Armory Board, ^ D.C - (*) 1 1 1 1 1 (*) (*) (*) p
Total 25,636 26,011 28,634 29,172 29,266 28,354 26.964 24,611 27,040 28,164 30,660 >~ hd yn
1 This account was abolished as of the close of business June 30,1970; and aU its assets, provided by an act approved Dec. 24, 1969 (42 U.S.C. 1487(ra)). t^ liabilities, and authorizations were transferred to the rural housing insurance fund as *Less than $500,000. ^
O
CO O
Digitized for FRASER http://fraser.stlouisfed.org/ Federal Reserve Bank of St. Louis
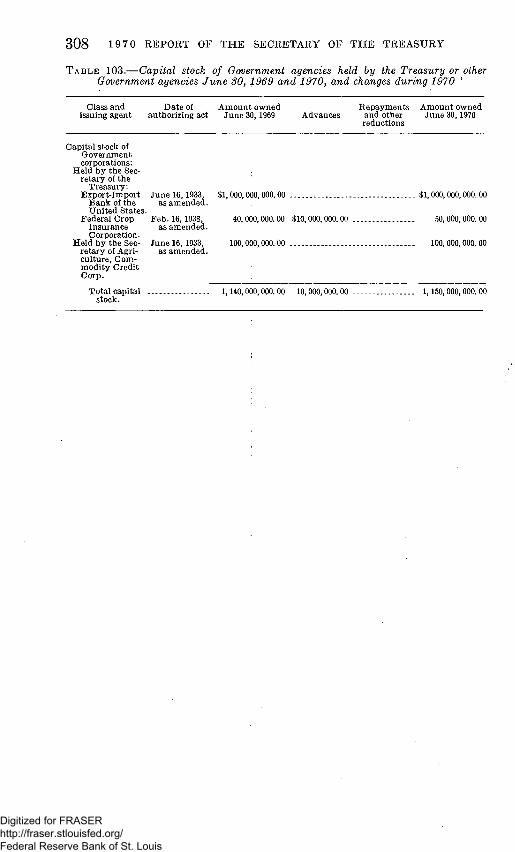
308 19 70 REPORT OF TI-IE SECRETARY OF THE TREASURY
TABLE 103.—Capital stock of Government agencies held by the Treasury or other Government agencies June SO, 1969 and 1970, and changes during 1970 *
Class and Date of Araount owned Repayraents Amount owned issuing agent authorizing act June 30, 1969 Advances and other June 30,1970
reductions
Capital stock of Government corporations:
Held by the Secretary of the
Treasury: Export-Iraport June 16,1933, $1,000,000,000.00 $1, 000,000,000. 00
Bank of the as araended. United States.
FederalCrop Feb. 16, 1938, 40,000,000.00 $10,000,000.00... 50,000,000.00 Insurance asamended. Corporation.
Held by the Sec- June 16, 1933, 100,000,000.00 100,000,000.00 retary of Agri- as amended, culture. Commodity Credit Corp.
Total capital 1,140,000,000.00 10,000,000.00 1,150,000,000.00 stock.
Digitized for FRASER http://fraser.stlouisfed.org/ Federal Reserve Bank of St. Louis

STATISTICAL APPENDIX 309
T A B L E 104.—Borrowing authority and outstanding issues of Government corporations and other business-type activities whose securities are issued to the Secretary of the Treasury, June'SO, 1970
[In millions of doUars. On basis of daily Treasury statements]
Corporation or activity i
Out-Borrowing standing authority securities
held by Treasury
Unused borrowing authority
Agency for InternationEil Development: Mutual defense program—economic assistance India emergency food aid.
Coramodity Credit Corporation Export-Import Bank ofthe United States.. Federal Deposit Insurance Corporation Federal home loan banks Federal Housing Adrainistration, general insurance fund Federal National Mortgage Association: 3
Secondary raarket operations fund Federal Savings and Loan Insurance Corporation Government National Mortgage Association:
Management and liquidating functions fund Special assistance functions fund
Panaraa Canal Company Rural Electrification Adininistration Saint Lawrence Seaway Developraent Corporation Secretary of Agriculture, Farmers Home Administration:
Direct loan account -.. Rural housing insurance fund Agricultural credit insurance fund
Secretary of Housing and Urban Development: C ollege housing loans - .---Low rent public housing fund s National flood insurance fund National insurance development fund Public faciUty loans Urban renewal fund . . .
Secretary of the Interior: Bureau of Mines, heliura fund
Secretary of Transportation: "Urban raass transportation fund
Sraithsonian Institution: John F . Kennedy Center parking facilities
Tennessee Valley Authority United States Information Agency, informational raedia guaranties
fund -- ---Veterans* Adrainistration (veterans direct loan program) Defense Production Act of 1950, as araended:
General Services Administration Secretary of Agriculture Secretary of the Interior, Defense Minerals Exploration Admin— Unallocated
.District of Columbia Coramissioners, stadium sinking fund. Armory Board, District of Columbia
492 21
14, 500 6,000 3,000 . 4,000 .
2 10
2,250 . 750 .
1,002 7,627
10 . 6,475
140
598 5 733 7 500
3,775 1,500 .
250 250 . 600
1,000
144
50 .
20 9 150
28 1,730
1,959 102 39
(*) 10(*)
492 . 21 .
12, 262 1,586
1,002 . 2,130
5,328 133
598 . 6 556
263
1,400
• • " ( * y — -
260 600
140
20 . 100
22 1,730 .
1,872 94 39
(*)
2,238 4,414 3.000 4,000
4 2, 250 750
5,497 10
1,147 6
177 237
2,375 1,500
250 250 340 400
50
50
6
(*)
Total. 59, 706 30, 660 29, 046
1 Excludes authorizations to borrow from the public; also excludes authorizations to expend from public debt receipts for subscriptions to capital stock of the following agencies: International Bank for Reconstruction and Developraent, $6,350 miUion; International Monetary Fund, $2,325 million; International Finance Corporation, $35 million; and a Governraent corporation, $999 raiUion. In addition, the authorized credit to the United EZingdom, ofwhich $2,965 raillion is outstanding has been excluded.
2 Funds raay be borrowed as needed pursuant to an act approved Aug. 10,1965 (12 U.S.C. 1735d). 3 This Association was converted to private ownership effective Sept. 30,1968, by an act approved Aug. 1,
1968 (12 U.S.C. 1716b). 4 Represents unused portion of authorization to expend from public debt receipts avaUable for loans to the
secondary market operations fund without further action by Congress. 5 Represents amount due Treasury, net amount obligated, and unobligated balance, less unexpended
fund balance. Funds may be borrowed as needed, but, except as raay be authorized in appropriation acts, not for the original or any additional capital of the fund, as provided by an act approved Aug. 10,1965 (42 U.S.C. 1487(h)).
fl Represents a liability of the former rural housing direct loan account. This account was abolished as of the close of business June 30,1970; and all its assets, liabilities, and authorizations were transferred to the rural housing insurance fund as provided by an act approved Dec. 24,1969 (42 U.S.C. 1487(ra)).
7 Represents araount due Treasury, net amount obhgated, and unobhgated balance, less unexpended' fund balance. Authority to borrow from the Treasm-y is indeiinite in amount. Funds may be borrowed as needed to carry out provisions of an act approved Aug. 8,1961 (7 U.S.C 1929(c)).
8 This fund is now borrowing through the Office of the Secretary pursuant to an act approved Aug. 1,1968 (42 U.S.C. 1403).
9 Represents amount of interim securities outstanding which may be issued to the Secretary of the Treasury under specified conditions as provided by an act approved Aug. 6,1959 (16 U.S.C. 831n-4(c))).
10 Funds may be borrowed from the Secretary of the Treasury under certain conditions as provided by an act approved July 28,1958 (2 D.C. Code 1727).
•Less than $500,000.
Digitized for FRASER http://fraser.stlouisfed.org/ Federal Reserve Bank of St. Louis

310 19 70 REPORT OF THE SECRETARY OF THE TREASURY
T A B L E 105.—Description of securities of Government corporations and other business-type activities held by the Treasury, J u n e SO, 1970
[On basis of daily Treasury statements, see "Bases of Tables"]
Title and authorizing act
Agency for International Development: Act of Apr. 3,1948, as amended:
Notes of Adrainistrator (ECA) . . . Actof June 15,1951:
Notes of Dh-ector (MSA)
Total
Commodity Credit Corporation, act of Mar. 8,1938, as aniended:
Advance Advances
Do Do D o . . . D o . .
Total
Export-Import Bank of the United States, act of July 31,1945, as amended:
Note, Series 1970 Note, Series 1971 .. Notes, Series 1971.
Do Note, Series 1972 Notes, Series 1972 Note, Series 1973 Note, Series 1974
Do Notes, Series 1975 ..
Do Note, Series 1975 Note, Series 1976 Notes, Series 1976 Notes, Series 1977 Note, Series 1977
Do
Total - .
Federal Housing Administration: General insurance fund, act of
Aug. 10,1965: N o t e . . .
Government National Mortgage Association, act of Aug. 2, 1954, as amended:
Management and liquidating function Advances
Do Do. Do Do Do Do Do
Subtotal
Date of issue
. Variousdates..
. Feb. 6,1952....
. Oct. 1,1969
. Various dates. . do do do do
. July 9,1968
. May 6,1969
. Variousdates.. - d o . . .
. June 30,1969...
. Various dates. _
. Apr. 25, 1969...
. June 30,1969... do
. Various dates. _ do
. May 29, 1969...
. Ju ly l , 1969
. Various dates. . do
. Apr.2,1970.. . . do
Jan. 25,1966
s: . Various dates . .
do. . . . do do do do. do do.
Date payable i
. June 30,1984...
. Dec. 31,1986...
. Oct. 1,1970 do do do do do
. July 9, 1970
. May 6,1971
. Various dates.. . do
. June 30,1972... - Variousdates... - Apr. 25, "1973... . June 30,1974...
do . Dec. 31,1975....
do do
. Dec. 31,1976.... do
. June 30, 1977.... do do
. Jan. 24,1981
. July 1,1970 do do
. July 1,1972 do do
. Ju ly l , 1973 do
Rate of interest
Percent
2
None
-. 1
51/8
: i bH
- 53I 53/8 6 3 6H
7
4 ^
• 58/1
5y
Principal amount
$491, 535, 243. 31
20, 731, 918. 66
512, 267,161. 97
3, 363,154,838. 00 94, 000, 000. 00
908, 000, 000. 00 7, 647, 000, 000. 00
168, 000, 000. 00 81,429,129. 61
12, 261, 583, 967. 61
412 500 00 6, 000,000. 00 4,196,979. 60
13, 623,894. 72 107,250. 00
36, 360,223. 69 6,000,000. 00 8,080, 000. 00
160, 000. 00 451,000,000.00 44,000, 000.00
108,100 000.00 125,000,000.00 408, 900, 000.00 11,000,000. 00 81, 600,000.00
281, 900, 000. 00
1, 586,440,848, 01
10, 000, 000.00
364,660,000. 00 67, 520,000. 00 44, 670,000.00
344,140,000.00 35,910.000.00 30,260,000. 00 54,430,000.00 60, 870,000.00
1,002,450,000 00
Footnotes a t end of table.
Digitized for FRASER http://fraser.stlouisfed.org/ Federal Reserve Bank of St. Louis
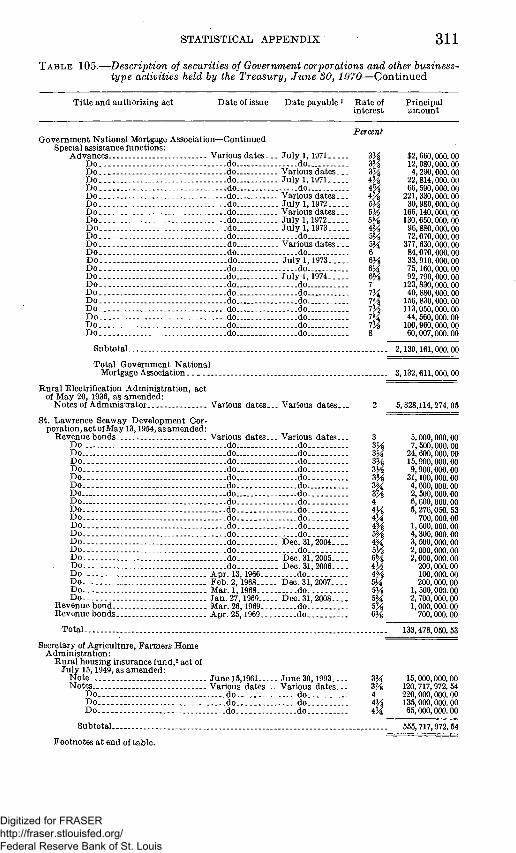
STATISTICAL APPENDIX 311
TABLE 105.—Description of securities of Gov en iment corporations and other business-type activities held by the Treasury, June SO, 1970—Continued
Title and authorizing act Date of issue
Governraent National Mortgage Association—Continued Special assistance fimctions:
Advances. Do Do. Do Do D o . . Do Do Do Do Do Do Do Do Do Do Do Do. Do D o . . Do D o . D o . . .
Subtotal -
Total Government Nationa Mortgage Association
Rural ElectrUacation Administration, act of May 20, 1936, as amended:
Notes of Administrator
St. Lawrence Seaway Developraent Corporation, act of May 13,1954, as araended:
Revenue bonds Do. . . . Do Do Do Do Do Do Do Do Do Do Do Do Do Do Do Do Do. . Do Do
Revenue bond Revenue bonds
Total
Various dates . . do.. do.. do.. do.. do.. do.. do.. do..
. . . . . .do . . do.. do-. do.. do-. do.. do.. do.. do.. do.. do.. do.. do.-do..
a
Various dates .-
Various rlatft.«? do-. do.. do.. do.. do.. do.. do.. do.. do.. do.. do. do.. do.. do.. do. do.
Apr. 13, Feb. 2, ] Mar. 1,: Jan. 27, Mar. 26, Apr. 25,
1966... L968.-.. L968.... 1969.... 1969... 1969...
Date payable i
. July 1,1971 -do...
. Variousdates. . .
. Ju ly l , 1971 do
. Variousdates. . .
. Ju ly l , 1972
. Various dates
. Ju ly l , 1972 . Ju ly l , 1973
do. . . . . Variousdates. . .
do .. July 1,1973
do . July 1,1974
do do. . . . do do do do
.do. .
- Various dates. . .
Various dates d o - . . . do do do do do do do do do do d o . . .
. Dec. 31,2004 d o . . . .
. Dec. 31,2005....
. Dec. 31, 2006 d o . . .
. Dec. 31, 2007.... .do
. Dec. 31, 2008... . do
.do
Rate of interest
Percent
3H 3M
m 43/8
4 ^
m 5% 5y 6H 4 ^ 5 ^ 6M 6 6H 6M 6 ^ 7 7H
7 y
'ry 8
=
2
3
3J^ zy zy 3H
3 j | 4 ^y m iVs by ^H 5y 6 ^ ^y m 5H 5y 5M
1%
Principal araount
$2,660,000.00 12,080,000.00 4,290,000.00
22, 814,000.00 66, 590,000.00
221,330,000. 00 30,980,000. 00
166,140,000.00 130,650,000.00 96,880,000. 00 72,070,000.00
377, 630,000.00 84,070,000.00 33,910,000.00 75,160,000. 00 92, 790,000.00
123,830,000.00 40,880,000. 00
156,830,000.00 113,050,000.00 44, 560,000. 00
100,960,000.00 60,007,000.00
2,130,161,000. 00
3,132,611,000 00
5,328,114,274.05
5,000,000. 00 7, 500,000.00
24, 600,000.00 15,900,000.00 9,900,000. 00
31,100,000.00 4, 600,000.00 2, 600,000.00 6,600,000.00 6,276,050.53
700,000.00 1,600,000. 00 4,300,000. 00 3, 500,000.00 2,000,000.00 2,000,000.00
200,000. 00 100,000. 00 200, 000.00
1,500,000.00 2,700,000. 00 1,000 000 00
700,000.00
133,476,050. 53
Secretary of Agricultme, Farmers Home Administration:
Rural housing insurance fund,2 act of July 15,1949, as araended:
Note. June 15,1961... Notes Various dates.
Do do Do . . do Do do
. .June 30,1993
. Various dates. . . .do . d o . . . . do
3M
4K
Subtotal...
Footnotes at end of table.
15,000,000.00 120,717,972. 54 220,000,000.00 135,000,000. 00 65,000,000.00
556,717,972.54
Digitized for FRASER http://fraser.stlouisfed.org/ Federal Reserve Bank of St. Louis

312 19 70 REPORT OF THE SECRETARY OF THE TREASURY
TABLE 105.—Description of securities of Government corporations and other business-type activities held by the Treasury, June SO, 1970—Continued
Title and authorizing act Date of issue Date payable i Rate of interest
Principal . amount
Percent
Secretary of Agriculture, Farmers Home Adrainistration—Continued Dhect loan account, acts of July 8,
1959, June 29, 1960, and June 30, 1961:
Note June 30,1966 June 30,1971. Do June 30,1969 June 30,1974. Do June 30,1970 June 30,1975..
Subtotal
47^ $326, 000, 000. 00 6H 4,963,355.49 8 266, 996, 251. 85
597,959,607.34
Agricultural credit insurance fund, act of Aug. 14,1946, as araended:
Advances Various dates June 30,1971. Do. . . do June 30,1973. Do do do.. Do do June 30,1974. "Do , do do Do. 1 do do.
by 7H 7y
Subtotal
Total Secretary of Agriculture.
3, 600, 000. 00 57, 370,000. 00 40,825,000. 00 6, 300, 000. 00
53,420, 000. 00 101, 280, 000. 00
262, 795, 000. 00
1, 416, 472, 579. i
Secretary of Housing and Urban Development:
CoUege housing loans, act of Apr. 20, 1950, as amended:
Note, Series CH Jan. 1,1970 Jan. 1,1971.. 2M 1, 400,000,000.00
National flood insurance fund, act of Aug. 1,1968:
Note July 7,1969 On demand. 7y 51, 945. 01
Public facility loans, act of Aug. 11, 1955:
Note, Series PF May 1,1967 June 1,1978. Do Apr. 11,1968 July 1,1982..
. Do May 22,1969 July 1,1983..
3Mo 170,500,000.00 4 50, 000, 000. 00 4K 40, 000, 000. 00
Subtotal. 260, 500, 000. 00
Urban renewal fund, act of July 15, 1949, as araended:
Note, Series URA July 1,1969 On demand.
Total Secretary of Housing and Urban D evelopment : ."
by 600,000, 000. 00
2, 260, 551, 945. 01
Secretary of the Interior: Bureau of Mines:
Helium fund, act of Sept. 13,1960: Notes • Variousdates Sept. 13,1985..
Do do.. do Note Dec. 28,1965 do .. Notes Various dates do
Do do ..--do Do do. do '.... Do do. do Do do -do Do dd. . . .do Do - do do Do do. ..do Do do.. . do Do.. . .do. .-do. Do do - do.. . Do do. .do
Note Apr. 10,1970 do
4 ^ 4K 43/8
m 4 ^ 4 3 ^ 4 / 8 5 by bH by b y
ti m m
20, 500,000. 00 9, 000,000. 00 2, 000, 000. 00
10, 500, 000. 00 8,000,000.00 4,000, 000. 00
11, 700, 000. 00 3, 500, 000. 00 4, 200,000. 00"
10,400,000. 00 13,100,000. 00 8, 700, 000. 00 4,800,000. 00
18,000,000.00 11, 400,000.00
500, 000. 00
Total. 140,300,000.00
Footnotes at end of table.
Digitized for FRASER http://fraser.stlouisfed.org/ Federal Reserve Bank of St. Louis

STATISTICAL APPENDIX 313 T A B L E 105.—Description of securities of Government corporations and other business-
type activities held by the Treasury, J u n e 30, 1970—Continued
Title and authorizing act Date of issue Date payable i Rate of interest
Principal amount
Smithsonian Institution: John F . Kennedy Center Parking
Facilities, act of Jan. 23,1964: Revenue bonds Various dates.
Do. do Do ..do Do do Do - do
Revenue bond June 12,1969.. Revenue bonds Various dates..
Do do Do . . .do
. Dec 31,2017.. do do
. Dec. 31,2018.. do do do do
. Variousdates.
Total.
. June 30,1986.. do do do. do do do. . . . do do do do.. do do.. .
. Various dates. do
. June 30, 1989.. do
Total.
Veterans' Administration (veterans' direct loan prograra), act of Apr. 20, 1950, as araended:
Agreements Various dates.. Do do Do .do Do do.. .
Agreement Dec. 31,1956... Do Mar.29,1957... Do June 28,1957... Do Apr. 7,1958.... Do Oct. 6,1958....
Agreements Variousdates.. Do do.. . Do : do Do .do. Do do. Do do
Agreement.. . . Feb. 5,1960... Agreements Variousdates..
Percent
m ^ 2
Indefinite do do do.. . do do do do do do do. . . . do
. . . . . do do do do do
7/8
Tennessee Valley Authority, act of Aug. 6,1959:
Advances.. Variousdates. . . Variousdates.
U.S. Information Agency: Informational raedia guaranties fund,
act of Apr. 3,1948, as amended: Note of Admimstrator ( E C A ) . . . . Oct. 27,1948...
Do . . . .do Do. . . do Do Jan. 24,1949... Do do Do .do Do . . . .do Do do Do do. . . . Do do Do.. . . . .do Do. . . . . .do Do do
Notes of Adrainistrator (E C A ) . . . Various dates. Do . . .do
Note of Adrainistrator (ECA) Aug. 12,1959.. Do .do
2 y 2M 2 y 3 3H 'iy 3H 3 ^ 3M
k 5/8
$3,800, 2, 900, 1, 200, 2, 200, 4, 300, 1,000, 1, 300, 1, 900, 1,800,
000. 00 000. 00 000. 00 000. 00 000. 00 000. 00 000. 00 000. 00 000. 00
20, 400,000. 00
100, 000, 000. 00
l y 2 2y 2Y2 2y 2% 2y 3 3H ZH 33/g
m m m 4
'4 m
1,410,000.00 1,305,000. 00 2,272,610.67
775,000.00 75,000.00
302, 389. 33 1,865,000. 00 1,100,000. 00
510,000. 00 3,431, 548. 00
495,000. 00 220,000.00
2, 625,960. 00 3,451.000. 00 1,234. 332. 67
983.300. 00 57, 859. 33
22,114,000.00
88,342, 53,032, 102,845, 118,763, 49,736, 49,768, 49,838, 49,571, 48, 855, 99,889, 392,344, 110,000, 20, 703, 109,387, 99,909, 20,000, 267,090,
741.00 393.00 334.00
00 333.00 442. 00 707.00 200.00 090.00 310.00 555.00 000. 00 541. 07 321.00 137. 93 000.00 023.00
Total - - - - 1,730,077,996.00
Footnotes at end of table.
Digitized for FRASER http://fraser.stlouisfed.org/ Federal Reserve Bank of St. Louis

314 19 70 REPORT OF THE SECRETARY OF THE TREASURY
T A B L E 105—Description of securities of Government corporations and other business-type activities held by the Treasury, June 30, 1970—Continued
Title and authorizing act Date ofissue Date payable i Rateof Principal interest araount
Percent Defense Production Act of 1950, as
araended: General Services Adniinistration:
Note of Administrator, Series D . . July 1,1965...... July 1,1970 4H $42, 000,000. 00 Do Sept. 4,1967 Sept. 4,1972 bH 60,000,000.00
Notesof Administrator, SeriesD.. Various dates . . . Various da tes . . . 5 ^ 87,000.000.00 Do do do b y 230,000,000.00
Note of Adrainistrator, Series D . . Mar. 6,1968 Mar. 6,1973 by% 87,000,000.00 Notesof Adrainistrator, SeriesD-. Various dates.. Various dates.. bH 254,000,000.00
Do do do 6 100,000,000.00 Do do.. do %y 105,000,000.00 Do do do 6M 270,000,000.00 Do : - do do 6H 158,000,000.00 Do do do 6H 320,000,000.00 Do. do do 7 29,000,000.00
Note of Adininistrator, Series D . . Nov. 1,1969 Nov. 1,1974 7y 46,000,000. 00 Do Jan. 25,1970 Jan. 25,1975 7 y 12,500,000.00 Do May 12,1970 May 12,1975 7 y 30,000,000.00
Notes of Administrator, Series D . . June 30,1970 June 30,1975 8 52, 000,000.00
Subtotal 1,872,500,000.00
Secretary of Agriculture: Note July 1,1965 July 1,1970 4 ^ 1,031,008.80
Do . . J u l y 1,1967 July 1,1972 47^ 15,089,567.31 Do July 1,1968 July 1,1973 5 ^ 3,017,355.93 Do July 1,1969 July 1,1974 6 ^ 74,711,546.17
Subtotal- 93,849,478.21
Secretary of the Interior, Defense Minerals Exploration Administration:
Note July 1,1967 July 1,1977 5 9,400,000.00 Do July 1,1968 July 1,1978 b y 29,400,000.00
Subtotal - 38,800,000.00
Total Defense Production Act of 1950, as amended 2,005,149,478.21
District of Columbia Commissioners: Stadium sinking fund. Armory Board,
D . C , act of Sept. 7, 1957, as amended:
Note - Dec. 1,1969 When funds are 7K 40,000.00 avaUable.
Do May 28,1970 . . . .do 7 315,000.00
Total 355,000.00
Total securities 3 . . . 30, 659, 914, 30L 27
1 Securities may be redeenied at any tirae. 2 The rural housing direct loan account was abolished as of the close of business June 30. 1970; and all
its assets, liabilities, and authorizations were transferred to the rural housing insurance fund as provided by an act approved Dec. 24,1969 (42 U.S.C 1487(m)).
3 These securities were issued to the Treasury in exchange for advances by the Treasury from public debt receipts under congressional authorization for specified Government corporations and business-type activities to borrow frora the Treasury. I -
Digitized for FRASER http://fraser.stlouisfed.org/ Federal Reserve Bank of St. Louis
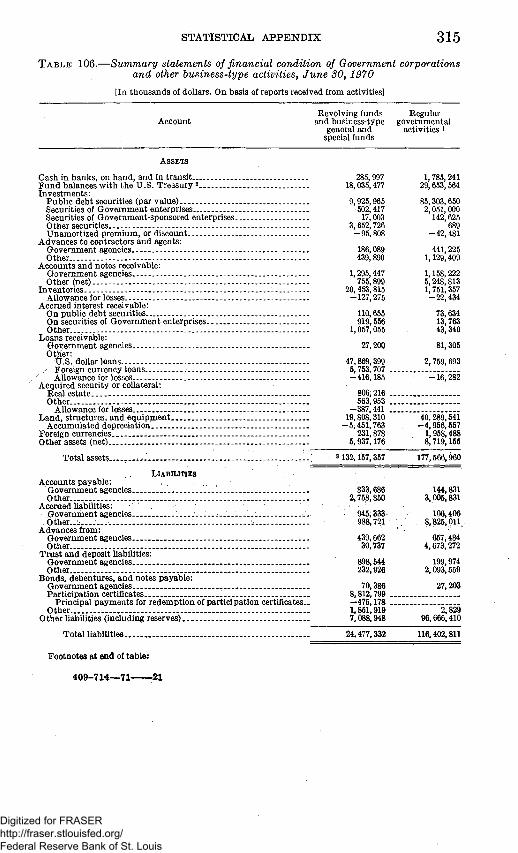
STATISTICAL APPENDIX 315 T A B L E 106.—Summary statements of financial condition of Government corporations
and other business-type activities, J u n e SO, 1970
[In thousands of dollars. On basis of reports received from activities]
Account Revolving funds Regular
and business-type governmental general and activities i
special funds
ASSETS
Cash in banks, on hand, and in transit Fund balances with the U.S. Treasury 2 Investraents:
Public debt securities (par value) Securities of Governraent enterprises Securities of Governraent-sponsored enterprises Other securities Unamortized premium, or discount
Advances to contractors and agents: Govemment agencies Other
Accounts and notes receivable: (Jovernment agencies.. Other (net)
Inventories Allowance for losses
Accrued interest receivable: On public debt securities On securities of Government enterprises Other
Loans receivable: Goveriiment agencies.. Other:
U.S. doUar loans / Foreign currency loans
-" . Allowance for losses Acquired security or coUateral:
Real estate Other
Allowance for losses Land, structures, and equipment
Accumulated depreciation . . . . ^ Foreign currencies.. , Otherassets (net)...
Totalassets ..— .,.
. LIABILITIES Accounts payable:
Government agencies Other
Accrued UabUities: ' ' . • Govemment agencies.. j . . . . . . . . . . ; . . . . . . . . . . :.... .bther..^.: . . . . . .^ . . . . . . . . ^ . . ^ . . 1 - ^ . .^ . . . .
Advances from: Government agencies Other
Tmst and deposit habilities: Government agencies Other
Bonds, debentmes, and notes payable: Government agencies.. Participation certificates _
Principal pajnnents for redemption of participation certificates. Other
Otherliabilities (includingreserves)
Total UabiUties
Footnotes at end of table:
4Q9-714—71 21
285,997 18,035,477
9,925,965 502,417 17,003
3,652,726 -95,808
186,089 439,890
1,295,447 755,899
20,453,815 -127,275
110,655 919,556
1,057,055
27,200
47,869,399 5,753,707 ... -416,185
806,216
1, 785, 241 29,653,564
85,303,650 2,051,000
142, 625 689
-42,481
441,225 1,129,409
1,158,222 5,248,813 1,751,357 -22,434
73,634 13,763 43,340
81,305
2, 759, 693
-16,282
663,953 —387,441 . 19.808,310 -5,451.763
231,878 6.937,176
8 132,157,357
833.686 2.758.860
945,333 988.721 ,
439.662 30.737
898.644 232,926
70.386 8,812.799
40.289,641 -4,966,667 1,968,488 8,719.165
177,566.960
144.831 3.006.831
106.406 8,826.011^
667,484 4.673,272
199,974 2,093,669
27.203
-475.178 1,861.919 7,088,948
24,477.332
2.829 96,666,410
116.402.811
Digitized for FRASER http://fraser.stlouisfed.org/ Federal Reserve Bank of St. Louis

316 19 70 REPORT OF THE SECRETARY OF THE TREASURY
TABLE 106.—Summary statements of financial condition of Government corporations and other business-type activities, June 30, 1970—Continued
[In thousands of doUars. On basis of reports received from activities]
Account Revolving funds Regular
and business-type governmental general and activities i special funds
N E T INVESTMENT U.S. interest:
Interest-bearing investment: Capital stock Borrowings from the U.S. Treasury Other
Noninterest-bearing investment: Capital stock Appropriations Capitalization of assets (net) Other
Accumulated net income, or deficit Deposits of general and special fund revenues.
Total U.S. interest
Trust and private interest: Principal of fund Accumulated net income, or deficit
Total trust and private interest
Total liabihties and investraent
100,000 26, 770, 286 20,400 2,062,277
1,050,000 •. 67, .437, 600 99,997,264 9,529,692 8, 061.598
30,228,622 11,163,704 -18.276,463 -48,279,643 -5,617,686 -3,952,498
103,284,328
14,616 4,381,180
4,395,696
132,157,357
66, 990,926
57,628, 027 -63.464,804
-6,826,777
177,566.960
iTConsists of activities reporting on an annual basis which are principaUy of a nonbusiness type. 2 Consist raainly of unexpended balances of general, special, and revolving fund accounts against which
checks raay be drawn to pay proper charges under these funds. The funds are considered assets of the agencies, but not of the U.S. Governnient since funds must be provided out of cash balances of the Treasurer of the United States and future receipts to take care of checks to be issued against the balances. Undeposited coUections and unconfirmed deposits are included In cash in banks, on hand, and in transit in these statements.
3 Includes foreign currency assets, representing loans and other receivables recoverable in foreign currencies in U.S. depositaries., aggregating $6,039 raiUion in dollar equivalent. These currencies, acquired primarUy without dollar payments, were generated under various Government programs, principaUy the Agricultural Trade Development and Assistance Act of 1964, as amended, and the Mutual Security Acts, as amended. Dollar equivalents are computed for reporting purposes to provide a common denominator for the currencies of the many countries involved. Foreign currencies on hand and on deposit and loans under section 104(e) of the Agricultural Trade Development and Assistance Act of 1964, as amended, are stated at the rates as of June 30. 1970. at which the United States could purchase currencies on the market for regular operating purposes. Other loans are stated at the rates at which they are to be repaid or at rates in effect when the loans were extended. Currencies that are doUar denominated or guaranteed as to rate of exchange are stated at rates specified in the agreements.
NOTE.—Business- and non-business-type activities report pursuant to Department Circular No. 966, issued Jan. 30,1956, and Suppleraent No. 1 (Revised), issued June 16,1966. Stateraents of financial condition of business-type activities by type of fund, departraent, and agency are published quarterly in the monthly "Treasury Bulletin."
Digitized for FRASER http://fraser.stlouisfed.org/ Federal Reserve Bank of St. Louis

STATISTICAL APPENDIX 317 T A B L E 107.—Statement of loans outstanding of Government corporations and other
business-type activities, J u n e SO, 1970 [In thousands of doUars]
Type of loan and lending agency
U.S. doUar loans
Total Loan account i
Foreign currency
Expenditure loans 2 account
To AID AGRICULTURE
Loans to cooperative associations: Economic opportunity loan fund Farraers Horae Adrainistration:
Direct loan account State rm-al rehabUitation funds Rm-al Electrification Administration
Crop, livestock, and coramodity loans: Commodity Credit Corporation Farmers Home Administration:
D irect loan account Emergency credit revolving fund
Storage facUity and equipment loans: Coramodity Credit Corporation
Farm mortgage loans: Farmers Horae Administration:
Agricultm-al credit insmance fund Dhect loan account.... Rm-al housing insmance fund State rmal rehabUitation funds
Other loans: Consumer and Marketing Service:
MUk market orders assessment fund Economic opportunity loan fund:
Loans to aid farra or rural faraUies Farraers Home Adrainistration:
D hect loan account Rural housing and other loans Rural rental housing loans.. Senior citizens' rural housing loans State rm-al rehabUitation funds
Total to aid agriculture
To AID HOMEOWNERS
Mortgage loans: Housing and Urban Development Department:
Federal Housing Administration: Coramunity disposal operations fund Revolving fund
Government National Mortgage Association: Manageraent and liquidating functions Special assistance functions
Low-rent public housing fund Interior Department:
Bmeau of Indian Affahs: Liquidation of Hoonah housing project
Veterans' Administration: Dhect loans to veterans and reserves Loan guaranty revolving fund
Federal Home Loan Bank Board: Federal Savings and Loan Insurance Corpora
tion Other loans:
Funds appropriated to the President: Appalachian housing fund
Agriculture Department: Farmers Home Administration:
Self help housing land development fund: Loans to public and private nonprofit organi
zations • Veterans' Administration:
Dhect loans to veterans and reservesi-Loan guaranty revolving fund
Total to aid homeowners...^
Footnotes at end of table.
15,863 16,863
360,409 360,409 13 13
6,342,930 6,342,930
2,788,364 2,788,364 .
264 254
128,175 128,175
164,130 164,130
252,666 252,656 3 252,219 8 262,219 3837,593 8837,593
10,461 10,461
605 605
69,266 59,266
3741,333 8 741,333-7,210 7,210
27,472 27,472 40,401 40,401 1,378 1,378
11,030,721 8,242,367 2,788,354 .
10, 803 4 641,467
3 1, 763,554 3 3,083,727
76
144
3 1,324,416 16,683
10,803 4 641,467
31,763,554 8 3,083,727
76
144
8 1,324,416 16,683
243,553 243,553'
985 985 ,
. 60,068 81,368,216
60,058 . 3 1,358,216 .
8,493, 796 8,492,810
Digitized for FRASER http://fraser.stlouisfed.org/ Federal Reserve Bank of St. Louis

318 19 70 REPORT OF THE SECRETARY OF THE TREASURY
TABLE 107.—Statement of loans outstanding of Government corporations and other business-type activities, June 30, 1970—Continued
[In thousands of doUars]
Type of loan and lending agency U.S. dollar loans
Total Loan account i
Foreign currency
Expenditure loans 2 account
To AID INDUSTRY
Loans to railroads: Expansion of defense production:
TreasuryDepartment Other pm-poses:
Treasmy Department: Reconstruction Finance Corporation loans in
liquidation....; Interstate Coraraerce Comraission
Ship mortgage loans: Coraraerce Department:
Federal ship mortgage insmance fund Maritime Administration
Other loans: Expansion of defense production:
Interior Departraent Treasury Department. General Services Administration
Defense production guarantees: Ah- Force Department Army Department Navy Department
Other purposes: Coramerce Department:
Economic Developraent Adrainistration: Econoraic development revolving fund.
Interior Department: Bureau of Commercial Fisheries:
Fisheries loan fmid. Geological Smvey
Transportation Department: Urban mass transportation fund
Treasury Department: Reconstruction Finance Corporation loans in
liquidation General Services Adrainistration:
Reconstruction Finance Corporation liquidation fund
Small Business Administration: B usiness loan and investment fund
Total to aid industry
To AID EDUCATION
Health, Education, and Welfare Department: National Institutes of Health:
Loans to institutions: Health professions education fund Nurse,training fund... Other student loan programs
OflEice of Education: Eleraentary and secondary educational activi
t ies. . Higher educational activities, loans to institu
tions Higher educational activities, advances for re
serve funds.. Higher education facUities loans fund Loans to students in institutions of higher edu
cation Student loan insurance fund
Social and RehabUitation Service: Assistance to refugees in the United States
Housing and Urban Development Department: College housing loans
Total to aid education
Footnotes a t end of table.
1,850 1,850 .
4,671 28,439
22, 052 50, 682
2,586 .. 5,219
30
1,088 464
2,891
4, 571 . 28,439
22, 062 . 50, 682 .
5,219 . 30 .
1,088 . 464 .
2,891 .
225, 629
9,930 2,808 .
4,676
73
226,629 .
9,930 .
4,575 .
73 .
i 1,259,626 8 1 259,625
1, 623,000 1,617, 606
3 30,190 3 15,505 129,991
1,974
8,468
18,689 . 3 424,207
1,321,286 . 3,263
22,257
3 3,169,348
1,974
8,468
• 8 424,207
3,263
22,257
3 3,169,348
2,586 .
5,394 .
3 30,190 . 3 15,605 . 129,991 .
18,689
1,321,286 .
6,146,179 3,629,617 1,515,661 .
Digitized for FRASER http://fraser.stlouisfed.org/ Federal Reserve Bank of St. Louis
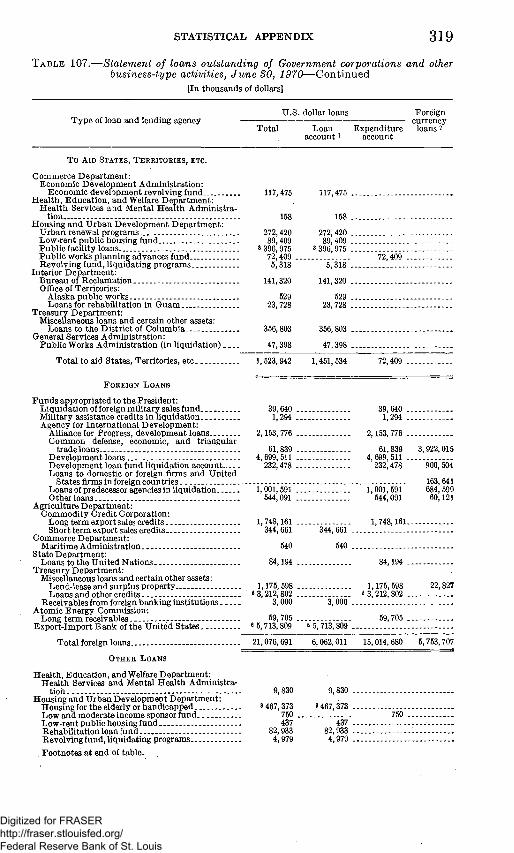
STATISTICAL APPENDIX 319
T A B L E 107.—Statement of loans outstanding of Government corporations and other business-type activities, J u n e 30, 1970—Continued
[In thousands of doUars]
T y p e of loan a n d lending agency U . S . dollar loans
T o t a l Loan account i
Foreign currency
Expend i tu re loans 2 account
T o A I D S T A T E S , T E R R I T O R I E S , ETC.
Commerce D e p a r t m e n t : Economic Deve lopmen t Admin i s t ra t ion :
Economic deve lopment revolving f u n d . . 117,475 H e a l t h , Educa t i on , a n d Welfare D e p a r t m e n t :
H e a l t h Services a n d Menta l H e a l t h Admin i s t r a t ion 158
Hous ing a n d U r b a n Deve lopmen t D e p a r t m e n t : U r b a n renewal programs 272,420 Low-ren t publ ic housing fund 89,409 P u b l i c facility loans a 396,975 P u b l i c works p lann ing advances fund 72,409 . Revolv ing fund, l iqu ida t ing p rogra ras . 6,318
Inter ior D e p a r t m e n t : B u r e a u of Rec lamat ion 141,320 Office of Terr i tor ies:
Alaska publ ic works 529 Loans for rehabi l i ta t ion in G u a m 23,728
T rea su ry D e p a r t m e n t : Miscellaneous loans a n d certain other assets:
Loans to t he Di s t r i c t of Columbia 356,803 General Services Admin i s t ra t ion :
P u b h c Works Admin i s t ra t ion (in l iquidat ion) 47,398
T o t a l to aid States , Terri tories , etc 1,523,942
117,475
158
272,420 89,409
3396,975 72,409 .
6,318
141,320
529 23,728
356,803
47,398
1,451,534 72,409 .
F O R E I G N L O A N S
F u n d s appropr ia ted to the Pres ident : L iqu ida t ion of foreign mi l i t a ry sales fund Mili tary assistance credits in l iquidat ion Agency for In te rna t iona l Deve lopmen t :
Alliance for Progress, development loans . Co imnon defense, economic, a n d t r iangular
t r ade loans Deve lopmen t loans Deve lopmen t loan fund l iquidat ion account Loans to domestiic or foreign firms a n d U n i t e d
States firms in foreign countries Loans of predecessor agencies in l iquidat ion Other loans
Agr icul ture D e p a r t m e n t : Coraraodi ty Cred i t Corpora t ion:
Long t e rm export sales c r e d i t s . Shor t terra export sales credits
Coraraerce Depa r t r aen t : Marit irae Adrain is t ra t ion
Sta te Depa r t r aen t : Loans to t he U n i t e d Nat ions —
T r e a s u r y D e p a r t m e n t : Miscellaneous loans and certain other assets:
Lend-lease a n d surp lus p roper ty Loans a n d other credits
Receivables frora foi-'eign bank ing ins t i tu t ions A t o m i c Ene rgy Comraission:
Long t e r m receivables • Expor t - Impor t B a n k of t he Un i t ed States
39,640 . 1,294 .
2,153, 776 .
61,839 . 4,699,511 .
232,478 .
1,001,591 . 544,091 .
1,748,161 . 344, 661
540
84,194
1,175,598 . 6 3,212,802 .
3,000
39,640 . 1,294 .
2,153,776 .
61,839 4,699,511 .
232,478
3, 922,015
'"900," 604
344,661
540
1,001, 591 544,091
1,748,161.
84,194 .
3,000
1,175, 598 fi 3,212,802
To ta l foreign loans
O T H E R L O A N S
Hea l th , Educa t ion , a n d Welfare D e p a r t m e n t : H e a l t h Services and Mental H e a l t h Adminis t ra
t ion 9,830 Hous ing and U r b a n Deve lopmen t D e p a r t m e n t :
Hous ing for t h e elderly or hand icapped 8 457,373 L o w and modera te incorae sponsor fund 750 . Low-ren t publ ic housing fund 437 Rehabi l i ta t ion loan fund 82,933 Revolving fund, l iquidat ing programs 4,979
Foo tno tes a t end of table .
163, 641 684,599 60,121
22,827
59,705 .. 8 5,713,809
. 21,076,691
""6'5 7i3,'809'.
6,062, Oil
59,705 .
15,014, 680 5,753,707
9,830
3467,373 750 .
437 82,933
4,979
Digitized for FRASER http://fraser.stlouisfed.org/ Federal Reserve Bank of St. Louis
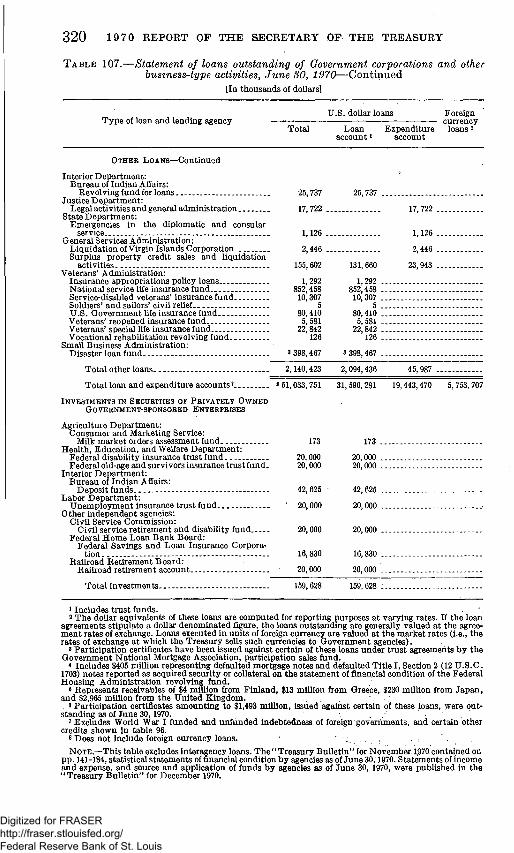
320 1970 REPORT OF THE SECRETARY OF THE TREASURY
TABLE 107.—Statement of loans outstanding of Government corporations and other business-type activities, June SO, 1970—Continued
[In thousands of dollars]
Type of loan and lending agency U.S. dollar loans Foreign
currency Total Loan Expenditure loans 2
account 1 account
OTHER LOANS—Continued
Interior Department: Bureau of Indian Affairs:
Revolving fund for loans Justice Department:
Legal activities and general administration State Department:
Emergencies in the diplomatic and consular service
General Services Adrainistration: Liquidation of Virgin Islands Corporation Surplus property credit sales and liquidation
activities.-Veterans' Administration:
Insurance appropriations policy loans National service life insurance fund Service-disabled veterans' insurance fund Soldiers' and sailors' civil relief U.S. Government hfe insurance fund Veterans' reopened insurance fund Veterans' special life insurance fund Vocational rehabUitation revolving fund
SmaU Business Administration: Disaster loan fund
25,737
17,722 ..
25,737
1,126
2,446
155, 602
1,292 852,468 10,307
6 80,410 5,581 22,842
126
131,660
1,292 852,458 10,307
5 80,410 5,581 22,842
126
17,722 .
1,126 .
2,446 .
23,943 .
3 398,467
2,140,423
3 398,467 ...
2,094,436 45,987 Total other loans.
Total loan and expenditure accounts 7 851,033,751 31,690,281 19,443,470 5,753,707
INVESTMENTS IN SECURITIES OF PRIVATELY OWNED GOVERNMENT-SPONSORED ENTERPRISES
Agriculture Department: Consumer and Marketing Service:
Milk raarket orders assessraent fund 173 Health, Education, and Welfare Departraent:
Federal disabUity insurance trust fund 20,000 Federal old-age and survivors insurance tmst fund. 20,000
Interior Department: Bureau of Indian Affahs:
Deposit funds 42,625 Labor Department:
Unemployment insurance tmst fund ' 20,000 Other independent agencies:
CivU Service Commission: CivU service retireraent and disabiUty fund 20,000
Federal Home Loan Bank Board: Federal Savings and Loan Insmance Corpora
t ion . . 16,830 Railroad Retheraent Board:
Railroad retireraent account 20,000
Total investments 169,628
173 .
20,000 . 20,000 .
42,625
20,000
20,000
16,830
20,000 .
159,628 .
1 Includes tmst funds. 2 The doUar equivalents of these loans are computed for reporting purposes at varying rates. If the loan
agreements stipulate a doUar denominated figure, the loans outstanding are generally valued at the agreement rates of exchange. Loans executed in units of foreign currency are valued at the market rates (i.e., the rates of exchange at which the Treasury seUs such currencies to Government agencies).
8 Participation certificates have been issued against certain of these loans under tmst agreements by the Government National Mortgage Association, participation sales fund.
4 Includes $405 miUion representing defaulted mortgage notes and defaulted Title I, Section 2 (12 U.S.C. 1703) notes reported as acquhed secmity or coUateral on the statement of flnancial condition of the Federal Housing Administration revolving fund.
8 Represents receivables of $4 milUon from FiiUand, $13 miUion from Greece, $230 millioh from Japan, and $2,965 miUion from the United Kingdom. . 8 Participation certificates amounting to $1,493 miUIon, issued against certain of these loans, were outstanding as of June 30,1970. . -
7 Excludes World War I funded and unfunded indebtedness of foreign governments, and certain other credits shown in table 96.
8 Does not include foreign cmrency loans. .. ,
NOTE.—This table excludes interagency loans. TheTreasury Bulletin" for November 1970contained on pp. 141-184, statistical statements of financial condition by agencies as of June 30,1970. Statements of income and expense, and source and application of funds by agencies as of June 30, 1970, were published in the "Treasury BuUetin" for December 1970.
Digitized for FRASER http://fraser.stlouisfed.org/ Federal Reserve Bank of St. Louis

STATISTICAL APPENDIX 3 2 1
TABLE 108.—Dividends, interest, and similar earnings received 'by the Treasury from Government corporations and other business-type activities, fiscal years 1969 and 1970
Amounts Agency and nature of eamings
1969 1970
Agency for International Development: D evelopment loan fund Uquidation account, earnings $10,689,674.12 Mutual defense program—economic assistance, interest on borrow
ings 11,250,25L99 $13,622,325.90 CivU Service Commission, investigations, earnings 73,827.36 Commerce Departraent:
Econoraic Developraent Assistance, econoraic developraent revolving fund, interest on loans _ 2,599,662.66 6.525,388.82
National Bureau of Standards, working capital fund, earnings 484,314.66 493,191.92 Commodity Credit Corporation:
Interest on capital stock 4,750,000.00 6.250,000.00 Interest on borrowings 206,507.858.66 333,160,638.94
Export-Import Bank of the United States: Regular activities:
Dividends 60,000,000.00 60,000,000. 00 Interest on borrowings 10,142,568.48 66,592.312.64
Farm Credit Adrainistration: i Banks for cooperatives, franchise tax.. 1,176,892.90 Federal interraediate credit banks, franchise tax 4,819.322.55
Farraers Home Admimstration: Rural housing direct loan account,2 interest on borrowings 9,442,622. 30 10,049,755.29 Rural housing insurance fund, interest on borrowings 2,502,552.20 2,570,719.65 Direct loan account,, interest on borrowings 3,760,219.04 Agricultural credit insurance fund, Interest on borrowings 12,930,764.66 18,044,916.95
Federal Housing Adnnnistration. general insurance fund, interest on borrowings 450,000.00 460,000.00
Federal National Mortgage Association: 3 Secondary market operations:
Dividends 4,961,877.35 Interest on borrowings 11,443,491.27
Federal Prison Industries, Inc., earnings 5,000,000.00 6.000,000. 00 General Services Adrainistration:
Autoraatic data processing fund 1,608.70 15,002.92 Federal telecoimnunications fund, earnings 251,648. 86 554,225. 06 General supply fund, earnings 12,283,970.47 4,077,48L89 Liquidation of Virgin Islands Corporation: 4
Interest on appropriations and paid-in capital _ 604,640.09 Interest on borrowings 11,967.21 _
Working capital fund, eamings 103,576.31 Government National Mortgage Association:
Manageraent and liquidating functions, interest on borrowings. 44,197,775.41 49.221,937.26 Special assistance functions, interest on borrowings 44,909,761.41 81,222,302.16
Government Printing Office, eamings _ 6,422,109. 03 8,834.956.22 Health, Education, and Welfare Departraent:
National Institutes of Health: Health professions education fund:
Interest on appropriated funds 557,404.28 733,810.56 Nurse training fund:
Interest on appropriated funds 103,088.93 349,555.13 Office of Education:
Higher education facUities loans fund: Interest on appropriated funds and capital _ 20,318,000.00
Interior Departraent: Bureau of Commercial Fisheries:
Fisheries loan fund, interest on loans 540,106. 96 Bureau of Reclamation:
Colorado River Dam fund. Boulder Canyon project, interest 2,458,569. 92 2,345,781.31 Upper Colorado River storage project, interest 14,151,507. 00 13,695,366. 00
Office of Econoraic Opportunity: Economic opportunity loan fund, interest on appropriations 3,657,757.89 3,645,696.27
Panama Canal Company, interest on net dhect investment of the Government 11,882,937.50 11,685,303.53
Rural Electrffication Admhiistration, interest on borrowings 96,858,857.03 102, 590,762.45 St. Lawrence Seaway Development CJorp., interest on borrowhigs 4,500,000.00 3,500,000.00 Secretary of Housing and Urban Development:
College housing loans, interest on borrowings 32,262,095.77 25,437,156.22 Low-rent public housing fund.s interest on borrowings 199,687.12 4,495,294.62 Public facility loans, interest on borro Whigs 6,818,238.36 7,413,023.33 Urban renewal fund, interest on borrowings 13,054,303. 69 16,970,015.96
Small Bushiess Admmistration, interest on appropriations 33,869,654.06 35,756,613.85
Footnotes at end of table.
Digitized for FRASER http://fraser.stlouisfed.org/ Federal Reserve Bank of St. Louis
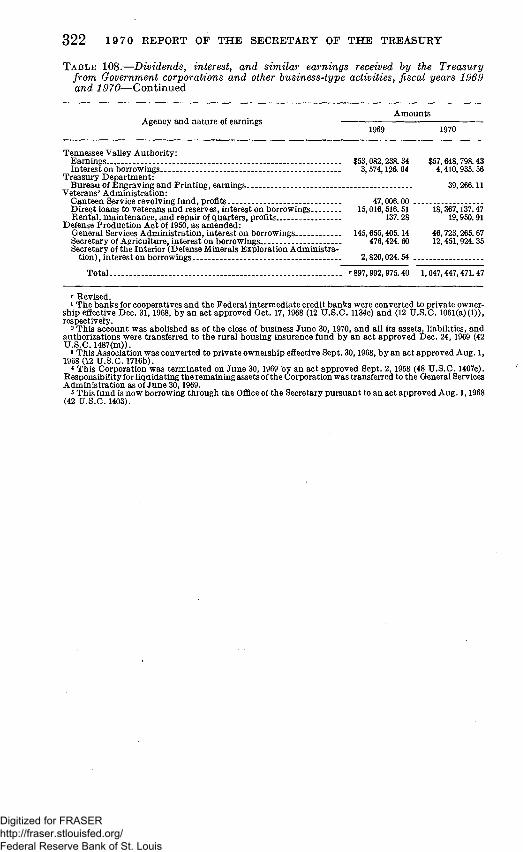
322 19 70 REPORT OF THE SECRETARY OF THE TREASURY
TABLE 108.—Dividends, interest, and similar earnings received by the Treasury from Government corporations and other business-type activities, fiscal years 1969 and 1970—Continued
Amounts Agency and natm-e of earnings
1969 1970
Tennessee VaUey Authority: Earnhigs $53,082,238.34 $57,648,798.43 Interest on borrowings. 3,574,126.04 4,410,935. 56
Treasury Department: Bureau of Engraving and Printing, earnhigs 39,266.11
Veterans' Administration: Canteen Service revolving fund, profits 47,006.00 Direct loahs to veterans and reserves, interest on borrowings 15,016,516. 51 18,367,137.47 Rental, maintenance, and repair of quarters, profits 137.28 19,950.91
Defense Production Act of 1950, as amended: General Services Administration, interest on borrowings 145,655,405.14 46,723,265. 67 Secretary of Agriculture, interest on borrowings 476,424. 60 12,451,924.35 Secretary of the Interior (Defense Minerals Exploration Administra
tion), interest on borrowings - 2,820,024.54
Total '•897,992,975.40 1,047,447,47L 47
^ Revised. 1 The banks for cooperatives and the Federal intermediate credit banks were converted to private owner
ship effective Dec. 31,1968, by an act approved Oct. 17,1968 (12 U.S.C. 1134e) and (12 U.S.C. 1061(a)(1)), respectively.
2 This account was abolished as of the close of business June 30, 1970, and all its assets, liabUities, and authorizations were transferred to the rural housing insurance fund by an act approved Dec. 24,1969 (42 U.S.C. 1487(m)).
3 This Association was converted to private ownership effective Sept. 30,1968, by an act approved Aug. 1, 1968 (12 U.S.C. 1716b).
4 This Corporation was termhiated on June 30,1969 by an act approved Sept. 2, 1958 (48 U.S.C. 1407c). Responsibility for liquidating the remaining assets of the Corporation was transferred to the General Services Admhiistration as of June 30,1969.
6 This fund is now borrowing through the Office of the Secretary pursuant to an act approved Aug. 1,1968 (42 U.S.C. 1403).
Digitized for FRASER http://fraser.stlouisfed.org/ Federal Reserve Bank of St. Louis

TABLE 109.—Direct sales and repurchases of loans, fiscal years 1963-70 and monthly 1970 [In miUions of doUars]
Fiscal year or month Total Export-import
Bank of the United States
J^'armers iiome Administration
Housing and Urban Development Department
Government National Mortgage
Association i
Office of Secretary 2
SmaU Business Administration
Veterans' Administration
Sales Repurchases
Sales Repurchases
Sales Repurchases
Repurchases
Repurchases
Sales Repurchases
Repm-chases
ZP
i HH .QQ
i 1963. 1964. 1965-1966.. 1967. 1968..
1970 ----1969—July
August September. October November. December..
1970—January February. . March.. .J. . April May June
1,275 . 1,160
936 . 696 . 964
1,070 1,337 2,116
103 105 123 183 198 301 220 476 129 92 49
137
92 213 428 842
67 49
280 46 79
128 21 33 19 27 44 49
336 436 124 63
163 91
379 406 26i' 1,
23 4 4 179 1 4 11
176 71 83 3 6
14 (*)
90
133 119 167 291 729 50 . 974 174 . 959 405 . 668 669 .
80 66 101 48 . 119 100 . 182 45 . 194 67 . 125 56 . 137 20 . 472 32 . 123 18 . 78 26 . 35 43 . 23 48 .
307 . 144 264 .
6 .
34 . 104 33 . 11 .
5 . 5
31 . 120 .
2 (*) (*)
(*)
2 15 6
(*)
460 342 327 . 106 .
71 2
(*)
14 24
1 This Association was created effective Sept. 30, 1968, by an act approved Aug. 1, 1968 (12 U.S.C. 1716b). It retained the assets and liabilities of the previously existing corporation accounted for under 12 U.S.C. 1720 and 1721 ana will continue to operate the functions authorized by these two sections. Excludes sales and purchases of the secondary market operations of the Federal National Mortgage Association which was
converted to private ownership effective Sept. 30,1968, by an act approved Aug. 1,1968 (12 U.S.C. 1716b).
2 Includes college housing, housing for the elderly, and public faciUty loans. •Less than $500,000.
CO to CO
Digitized for FRASER http://fraser.stlouisfed.org/ Federal Reserve Bank of St. Louis

324 19 70 REPORT OF THE SECRETARY OF THE TREASURY
Government Losses in Shipment
TABLE 110.—Government losses in shipment fund, June 30,1970 [Established July 8,1937, under authority of the Govemment Losses in Shipment Act (40 U.S.C. 721-725)]
SECTION I—STATUS OF FUND
Cumulative Cumulative Transactions through Juhe Fiscal year 1970 through June
30,1969 30,1970
Receipts: Appropriations. $2,017,000.00 '. $2,017,000.00 Transferred from securities fund pursuant to:
40 U.S.C. 723 91,803.13 91,803.13 Transferred from the account "Unclaimed partial pay
ments on U.S. savings bonds" pursuant to: Public Law 86-354 60,000.00 50,000.00 Public Law 86-661 100,000.00 100,000.00 Public Law 87-575 525,000.00 •. 525,000.00
Recoveries of pa3rments for losses 493,055.98 $1,080.67 494,136.65 Repayments to the fund 3,924.32 3,924.32
Totalreceipts 3,280,783.43 1,080.67 3,281,864.10
Expenditures: Payment for losses 3,113,688.06 167,748.08 3,281,436.14 Other pajmients (refunds, etc.) 92. 57 92. 57
Total expenditures 3,113,780.63 167,748.08 3,28L528.71
Balance in fund . . 167,002.80 -166,667.41 336.39
NOTE.—This stateraent excludes contingent liabUities for pending claims agahist the fund as of June 30, 1970, totaling $134,852.44.
SECTION I I . - A G R E E M E N T S OF INDEMNITY ISSUED BY THE DEPARTMENT OF
THE TREASURY
Agreements of Indemnity 1 •'•.;: Number Araount
Issued through June 30,1969 1,929 $4,637,028.47
Issued during fiscal year 1970 18 113,008.82 Totalissued . 1,947 4,750,037.29 Canceled through June 30, 1970 _ 32 1,066,192.03
Inforceasof June 30,1970... 1.915 3,693.845.26
1 The Govemment has not sustained any actual monetary loss in connection with its liability under these agreements of inderanity.
SECTION III—CLAIMS MADE AND SETTLED
Claims Number Amount
Received: Through June 30,1969 8,922 $10,206,638.46 During fiscal year 1970 and processed by:
Bureau of Accounts 226 265,18L 74 Bureau of the Public Debt 268 130,967.32
Total claims received through June 30,1970 9,416 10,602,787. 52
Settled: Through June 30,1969 8,762 9,926,874.22 During fiscal year 1970 and processed by:
Bureau of Accounts: For payment out of the fund 43 36,496. 97 For credit In appropriate accounts 270 444,386.60 Without payment or credit.. 2 652.47
Bureau of the PubUc Debt: For payment out of the fund:
U.S. savings bonds redemption cases
Total claims settled through June 30,19701 Unadjusted as of June 30,1970 .,.......
271 132,252.11
9,348 10, 638,661.37 68 64,126.16
Total - 9,416 10,602,787.62
Digitized for FRASER http://fraser.stlouisfed.org/ Federal Reserve Bank of St. Louis

STATISTICAL APPENDIX 325
Personnel T A B L E 111.—Number of employees in the departmental and field services of the
Department of the Treasury quarterly from J u n e SO, 1969, to J u n e 30, 1970 ^
Organizational unit
Increase, June 30, Sept. 30, Dec. 31, Mar. 31, June 30, or decrease
1969 1969 1969 1970 1970 ( - ) since June 30,
1969
Office of the Secretary 2 911 881 ComptroUer of the Currency, Office of 2,071 2,049 Customs, Bureau of 9,840 9,829 Engraving and Printing,, Bureau of 3,156 3,079 Fiscal Service:
Accounts, Bureau of 1,595 1,642 Public Debt, Bmeau of the 1,891 1,898 Treasurer of the United States, Office
ofthe 929 921 Internal Revenue Service. 64,607 65,323 Mhit, Bureau of t h e . . 1,748 1,712 U.S. Savings Bonds Division 545 512 U.S. Secret Service 1,386 1,498
Total employees. 88,679 89,244
892 L979 9,817 3,000
L523 1,910
924 66,058
L755 494
1,532
88,884
911 1,961
10,126 3,084
1,628 1,906
934 8 76, 590
1,774 488
1,583
100,986
948 2,021
11,157 3,269
1,698 1,963
935 66,630
1,772 497
1,741
92,521
37 - 5 0
1,317 113
3 62
6 2,123
24 - 4 8 355
3,942
1 Actual number of eraployees on the last day of the month and any intermittent employees who worked at any tirae during the month.
2 Includes Office of the Assistant Secretary for International Affairs. • 3 Includes seasonal employees.
O
Digitized for FRASER http://fraser.stlouisfed.org/ Federal Reserve Bank of St. Louis


