Arbeitsberichte Geographisches Institut, Humboldt-Universität zu Berlin Elmar Kulke, Christian Sonntag (eds.) “Science meets Business – Logistics and Retail of Fresh Fruit and Vegetables in Kenya and Tanzania” - Proceedings of the Workshop in Nairobi (October 2018) Heft 198 Berlin 2020
Transcript
Arbeitsberichte Geographisches Institut, Humboldt-Universität zu Berlin
Elmar Kulke, Christian Sonntag (eds.) “Science meets Business – Logistics and Retail of Fresh Fruit and Vegetables in Kenya and Tanzania” - Proceedings of the Workshop in Nairobi (October 2018)
Heft 198 Berlin 2020
2
Cover photo: Muthurwa Market in Nairobi (Christian Sonntag 2017)
3
Arbeitsberichte
Geographisches Institut Humboldt-Universität zu Berlin
Heft 198
Elmar Kulke, Christian Sonntag (eds.)
“Science meets Business – Logistics and Retail of Fresh
Fruit and Vegetables in Kenya and Tanzania”
Proceedings of the Workshop in Nairobi (October 2018)
Berlin 2020
ISSN 0947 - 0360
Geographisches Institut
Humboldt-Universität zu Berlin Seat: Rudower Chaussee 16
Unter den Linden 6 10099 Berlin
(http://www.geographie.hu-berlin.de)
4
5
Table of contents
Prologue and Greetings .................................................................................................................................7
Timetable – “Science meets Business – Logistics and Retail of Fresh Fruit and Vegetables in Kenya and Tanzania” ......................................................................................................... 10
Using a Socio-Ecological Model to Understand Fresh Fruit and Vegetables Supply Dynamics on the Windward Slopes of Mount Kenya ........................................................... 13
Mwangi Wambugu / Esther Maina / Gilbert Nduru
How do fresh fruit and vegetables get to supermarkets in Kenya and Tanzania? – The interrelation between the expansion of supermarkets and the establishment of delivery systems/intermediaries for fresh products ........................................ 27
Christian Sonntag
Food production and challenges – the case of Machakos county in Kenya ................................. 37
Parita Shah
Value chain concept of GIZ and practical examples from Kenya .................................................... 49
Dominik Fortenbacher
Business and Marketing Strategies in Smallholder Agriculture in Embu County .................... 53
Arne Rieber / Benson Nyaga
Contribution from the practice - Kabete Organic Gardens ............................................................... 59
Patrick Nzioka Onzore
Retailing of fruits and vegetables in Machakos County, Peri-urban area of Nairobi Metropolitan Region ..................................................................................................................... 61
Alice Oluoko-Odingo
Social-ecological resilience of agroindustrial food system in Northwest Mt. Kenya Region .................................................................................................................................................. 71
Stellah Mikalitsa Mukhovi
Contribution from the practice - Fig Tree Market, Nairobi .............................................................. 85
Salome Kaniu
6
7
Prologue and Greetings
We would like to thank all participants at the successful workshop "Science meets
Business – Logistics and Retail of Fresh Fruit and Vegetables in Kenya and Tanzania".
The two-day workshop was held in Nairobi on October 11th – 12th, 2018.
This exciting and productive workshop was part of the German Research Foundation
(DFG) funded research project "How do fresh fruit and vegetables (FFV) get to
supermarkets in Kenya and Tanzania? The interrelations between the expansion of
supermarkets and the establishment of delivery systems/intermediaries for fresh
products." The project is carried out at the Department of Geography (Economic
Geography) of the Humboldt-Universität zu Berlin.
The aim of the workshop was to share knowledge and information gained from research
projects with the knowledge of the various practitioners involved. Together all
participants discussed latest scientific insights from researchers and practical inputs
from involved actors/stakeholders like retailers, producers, intermediaries,
governmental institutions and NGOs.
Bringing together different actors within the agricultual value chain might help facing
the challenges within retail and logistics of fresh fruit and vegetables in Kenya and
Tanzania.
In the first part of the workshop scientists and actors involved followed by discussions
presented various inputs concerning the agricultural value chain. In the second part of
the workshop “Round Table discussions” helped to identify potentials and constraints of
the fresh product supply to supermarkets.
We hope the lectures and discussions were inspiring and helpful for all participants.
Kind regards.
Prof. Dr. Elmar Kulke, Christian Sonntag Department of Geography Economic Geography Humboldt-Universität zu Berlin
8
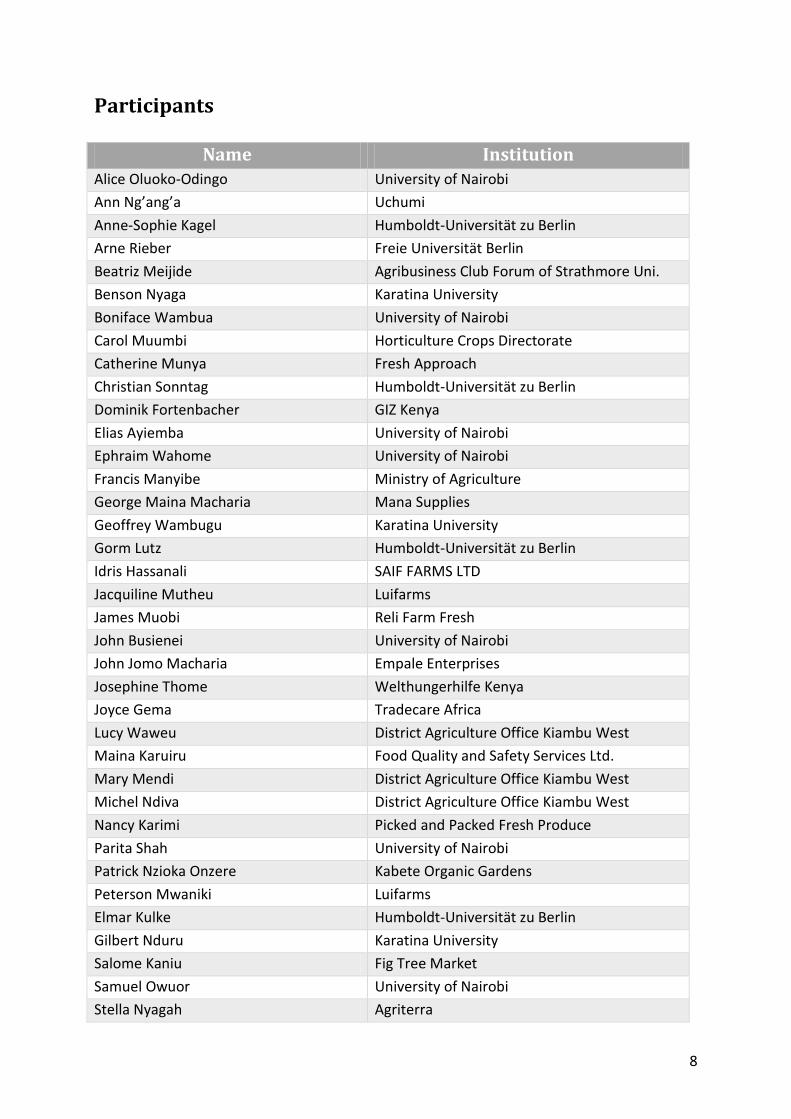
Participants
Name Institution Alice Oluoko-Odingo University of Nairobi Ann Ng’ang’a Uchumi Anne-Sophie Kagel Humboldt-Universität zu Berlin Arne Rieber Freie Universität Berlin Beatriz Meijide Agribusiness Club Forum of Strathmore Uni. Benson Nyaga Karatina University Boniface Wambua University of Nairobi Carol Muumbi Horticulture Crops Directorate Catherine Munya Fresh Approach Christian Sonntag Humboldt-Universität zu Berlin Dominik Fortenbacher GIZ Kenya Elias Ayiemba University of Nairobi Ephraim Wahome University of Nairobi Francis Manyibe Ministry of Agriculture George Maina Macharia Mana Supplies Geoffrey Wambugu Karatina University Gorm Lutz Humboldt-Universität zu Berlin Idris Hassanali SAIF FARMS LTD Jacquiline Mutheu Luifarms James Muobi Reli Farm Fresh John Busienei University of Nairobi John Jomo Macharia Empale Enterprises Josephine Thome Welthungerhilfe Kenya Joyce Gema Tradecare Africa Lucy Waweu District Agriculture Office Kiambu West Maina Karuiru Food Quality and Safety Services Ltd. Mary Mendi District Agriculture Office Kiambu West Michel Ndiva District Agriculture Office Kiambu West Nancy Karimi Picked and Packed Fresh Produce Parita Shah University of Nairobi Patrick Nzioka Onzere Kabete Organic Gardens Peterson Mwaniki Luifarms Elmar Kulke Humboldt-Universität zu Berlin Gilbert Nduru Karatina University Salome Kaniu Fig Tree Market Samuel Owuor University of Nairobi Stella Nyagah Agriterra
9
Stellah Mukhovi University of Nairobi Wambui Mbarire RETRAK Retail Trade Association of Kenya Watila Wanyonyi Frontier Consulting Yasin Juma Fundissa Cottage
Photo: “Science meets Business” Meeting in Nairobi, October 2018 (KAGEL 2018)
10
Timetable – “Science meets Business – Logistics and Retail of Fresh Fruit and Vegetables in Kenya and Tanzania”
Thursday, 11th October 2018
08.00 a.m. – Registration 09.30 a.m. – Opening by Ephraim Wahome (University of Nairobi), Gilbert Nduru
(Karatina University), Elmar Kulke (Humboldt-Universität zu Berlin) 09.45 a.m. – What are the Emerging Research Concerns in the Organization and
Management of Fresh Fruit and Vegetable Value Chains in Kenya? by Gilbert Nduru (Karatina University)
10.15 a.m. – The Urban Food System of Nairobi by Samuel Owuor (University of Narobi)
10.45 a.m. – Coffee Break 11.00 a.m. – Expansion of Supermarkets and Establishment of Delivery
Systems/Intermediaries for Fresh Fruit and Vegetables in Kenya and Tanzania by Christian Sonntag (Humboldt-Universität zu Berlin)
11.30 a.m. – RETRAK - Experiences in Regard to Fresh Fruit and Vegetables in Supermarkets by Wambui Mbarire (RETRAK)
12.00 p.m. – Logistics and Supply Actors of Fresh Fruits and Vegetables to Supermarkets and Green Grocers by Maina Karuiru (Food Quality and Safety Services)
12.30 p.m. – Lunch Break 01.30 p.m. – Application for Logistics of Fresh Fruits and Vegetables by Beatriz
Meijide (Agribusiness Club Forum) 02.00 p.m. – Blind in Plain Data-Sight: Using Data to Grow the Value Chain by Watila
Wanyonyi (Frontier Consulting) 02.30 p.m. – Food Production and Market Channels: Case of Machakos County,
Kenya by Parita Shah (University of Nairobi) 03.00 p.m. – Coffee Break 03.15 p.m. – Value chain concept of GIZ and practical examples from Kenya by
Dominik Fortenbacher (GIZ Kenya) 03.45 p.m. – Marketing and Business Strategies in Smallholder Agriculture in Embu
County by Arne Rieber (Freie Universität Berlin) & Benson Nyaga (Karatina University)
04.15 p.m. – Delivering Vegetables and Herbs to Supermarkets by Patrick Nzioka Onzere (Kabete Organic Gardens)
04.45 p.m. – Closing Remarks
11
Friday, 12th October 2018
09.00 a.m. – Retail of Fruits and Vegetables in Machakos County, Metropolitan
Region of Nairobi City, Kenya by Alice Oluoko-Odingo (UoN) 09.30 a.m. – Millions in the Kenyan Soil by Jacquiline Mutheu (Luifarm) 10.00 a.m. – Coffee Break 10.15 a.m. – Social-Ecological Resilience of Agro-Industrial Food System in Mount
Kenya Region by Stellah Mukhovi (UoN) 10.45 a.m. – Socio-Ecological Dimensions of Fresh Fruit and Vegetable Supply on
the Eastern and South-Western Slopes of Mount Kenya by Geoffrey Wambugu (Karatina U.)
11.15 a.m. – Coffee Break 11.30 a.m. – What are potentials and constraints in the fresh produce supply to
supermarkets? As Round Table Discussion 01.00 p.m. – Lunch Break 02.00 p.m. – Presentation of Round Table Discussions 05.15. p.m. – Closing Remarks and Outlook
12
13
We used a Socio-Ecological Framework to analyse the interrelationships between the
state of resources, resource users, public infrastructure providers, public infrastructure
and their implications on fresh fruit and vegetable supply in Karatina and Kathateni sub
locations in Nyeri and Meru Counties, Kenya, respectively. The Framework proposed by
ANDERIES et al. (2004) was used to analyse the robustness of socio-ecological systems
(SES) attributed to the supply of fresh fruit and vegetables in Karatina and Kathateni in
terms of: (a) the strength and weaknesses within the systems, (b) the potential
opportunities, (c) the potential constraints and (d) the state of environmental resources
in the face of Climate Change. Household data was collected qualitatively from 20 and 18
households in Karatina and Kathateni respectively. Results show that; despite
decreasing farm sizes, fruit and vegetable production is relatively stable due to
abundant rainfall, but there are major weaknesses in the supply chain attributed to the
state of infrastructure especially in Karatina. The presence of a university and a
construction company have diversified income sources and market for vegetables and
fruits in Karatina and Kathateni respectively, but have put a strain on the state of
infrastructure. There exists ready market for both fruit and vegetables, with the bulk of
the produce sold directly to the green grocers and open air markets while a few farmers
supply directly to supermarkets. There are major environmental constraints in both
Karatina and Kathateni, including crop invasion by wildlife, declining quantity and
quality of water in the rivers, changing climate (rainfall more erratic and unpredictable),
frequent disease outbreaks and frequent pest outbreaks. To make the systems more
effective, we propose the strengthening of the linkage between public infrastructure
providers and the resource users through active participation by the resource users in
decision making processes and financial monitoring.
Key Words: Socio-Ecological Model, Infrastructure, Fruit and Vegetable, Climate Change, Karatina, Kathateni
Using a Socio-Ecological Model to Understand Fresh Fruit and Vegetables Supply Dynamics on the Windward Slopes of Mount Kenya
MWANGI WAMBUGU / ESTHER MAINA / GILBERT NDURU
14
Introduction The supply of fresh fruit and vegetables in rural places is an important to the state of
health in a pupulation, with significant social and health inequalities attributable to
areas that have poor access to such commodities (CASPI et al. 2012; FENG et al. 2010;
FROST et al. 2010). Numerous studies have shown that adequate supply of fresh fruit and
vegetables is critical in provision of good nutrition to human populations (BURNS et al.
2011; BUYS & LOCHER 2015; HUNG et al. 2015; LEE & FRONGILLO 2001; SAHYOUN & BASIOTIS
2001; SHARKEY et al. 2010; WOLFE et al. 2003; WOLFE et al. 1996, 1998). However, few
studies have been conducted to show the linkage between the supply of fresh fruit and
vegetables-and their implications to the dietary contents of rural populations- and the
status of environmental resources. This study hypothesis that the availability of fresh
fruit and vegetables, and their accessibility is intricately linked not only to the material,
social, and spatial aspects of place (ANDRESS 2017), but also to the integrity of
environmental resources of the place in question. These linkages can be better
understood by application of theories that unite the concept of “place” as both a
geographic and social parameter (GALSTER 2012; HANDY et al. 2002; MARMOT & BELL 2009;
PUTRIK et al. 2014; YEN & SYME 1999). Places-defined as where we live, work and play-are
at the forefront of the social determinants (KAWACHI & BERKMAN 2003; KRIEGER et al.
2003; LARSON et al. 2009).
Numerous theories have been proposed in the fields of geography and anthropology that
attempt to explain the social construction of place where human experience becomes
embodied in material and spatial forms (LOW 1996, 2003). Researchers are using these
theories to explain the social configuration of “place” to the complex social, economic,
and political factors that result in material inequities that can exist between places
(HEYNEN et al. 2006). Places incorporate aspects of the built and natural environment
(NORTHRIDGE et al. 2003), where the latter encopmasses any component in the physical
environment that has been made by humans (roads, buildings, housing, infrastructure,
and parks); while the former describes any part of the physical environment that is not
created or modified by humans (NORTHRIDGE et al. 2003).
In this paper, we apply a socio-ecological framework adapted from ANDERIES et al. (2004)
to better undertstand the type, nature and configuration of pathways that affect the
supply of fresh fruit and vegetable supply in Mount Kenya region. This framework
15
attempts to identify several aspects of socio-ecological systems that make it robust.
These include the institutional arrangements as well as the underlying ecological
system. This framework is shown in Figure 1 below:
Figure 1: A conceptual model of a social-ecological system as proposed by Anderies et al. (2004). The robustness of a SES is dependent on the status of pathways that link institutions (resources, resource users, public infrastructure providers and public infrastructure). Examples of each of the links shown are (1) Availability of water when needed, (2) Recommending policies, (3) Building initial structure or ensuring regular maintenance, (4) Impact of infrastructure on the resource level, (5) Impact of infrastructure on the feedback structure of the resource harvest dynamics, (6) Coproduction of infrastructure itself, maintenance of works, monitoring and sanctioning, (7) Severe weather, earthquake, landslide, new roads, (8) Major changes in political system, migration, commodity prices, and regulation. (adapted from ANDERIES et al. 2004)
16
Methods
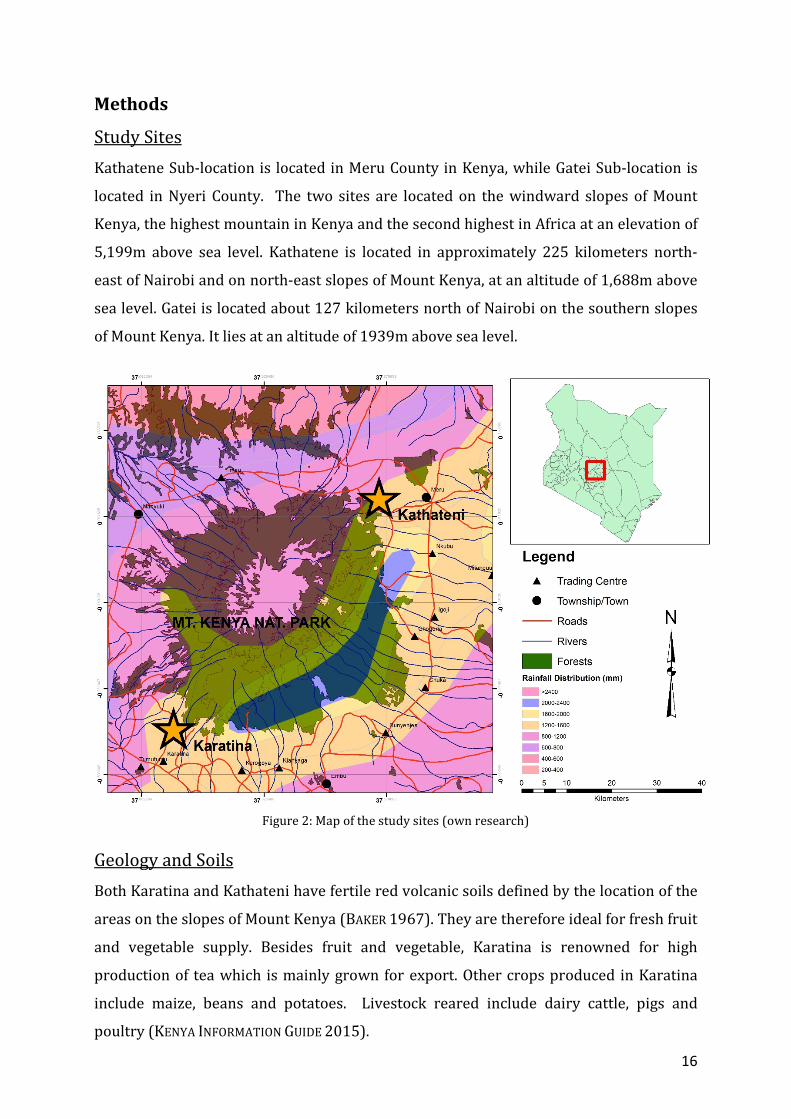
Study Sites Kathatene Sub-location is located in Meru County in Kenya, while Gatei Sub-location is
located in Nyeri County. The two sites are located on the windward slopes of Mount
Kenya, the highest mountain in Kenya and the second highest in Africa at an elevation of
5,199m above sea level. Kathatene is located in approximately 225 kilometers north-
east of Nairobi and on north-east slopes of Mount Kenya, at an altitude of 1,688m above
sea level. Gatei is located about 127 kilometers north of Nairobi on the southern slopes
of Mount Kenya. It lies at an altitude of 1939m above sea level.
Figure 2: Map of the study sites (own research)
Geology and Soils Both Karatina and Kathateni have fertile red volcanic soils defined by the location of the
areas on the slopes of Mount Kenya (BAKER 1967). They are therefore ideal for fresh fruit
and vegetable supply. Besides fruit and vegetable, Karatina is renowned for high
production of tea which is mainly grown for export. Other crops produced in Karatina
include maize, beans and potatoes. Livestock reared include dairy cattle, pigs and
poultry (KENYA INFORMATION GUIDE 2015).
17
In Kathateni, agriculture dominates as the main economic activity, with the sector
accounting for 80% of the area’s income and 90% of the population directly or indirectly
dependent on agriculture for their livelihood (OXFORD BUSINESS GROUP 2014). According
to World Bank, despite the rapid urbanization in Kenya, Meru’s rural population still
exceeds 80%. Most people engage in subsistence farming where they grow crops such as
maize, beans, sorghum, millet, cabbages and fruits. While most of the land is used for
crop farming, there is also some livestock rearing in some of the areas for animals such
as cattle, goats, sheep, pigs, poultry and some rabbits. Meru is also renowned for wide
scale growing of khat commonly referred to as miraa, a herbal plant which has turned
into a lucrative cash crop earning the locals millions of money from the export market as
it fetches up to Ksh.1000 per Kg. The agricultural landscape consists of mainly
smallholder farms. 98.6% of farms are small scale, not unusual for Kenya or indeed
African agricultural markets in general (MOA MERU COUNTY PROFILE 2013). The national
average farm size is two acres, but size varies according to population density where
more sparsely populated areas see farm sizes up to five acres while densely populated
areas have farms averaging one acre. Land redistribution and subsequent sub-divisions
following independence have resulted in land holdings of less than one hectare as the
norm (MCCORD et al. 2015).
Rainfall The rainfall regime is bimodal in both Karatina and Kathateni, with long rains between
March and May, while the short rains occur in the months of October through December
(BÖHME et al. 2016). Average rainfall in Meru ranges between 500-1500 mm per year
while in Karatina it ranges between 500mm-2600mm annually making both areas
conducive for agricultural activities. Temperature ranges between 16oC during the cold
season and 23oC during the warm season in Meru while in Karatina temperatures range
between 12oC during the cold season and 27oC during the warm season.
18
Demographics The human population in Meru County was 1,356,301 in an area of 6,933 square
kilometers translating to a density of 195.63 persons per square kilometer (NATIONAL
BUREAU OF STATISTICS 2013). Females were 685,645 accounting for 50.6% while males
were 670,656 accounting for 49.4%. Nyeri County had a population of 693,358 in an
area of 3,337 square kilometers translating to a density of 207.83 persons per square
kilometer. Females were 353,834 accounting for 51% while males were 339,724
accounting for 49%.
Study Design Data was collected in two phases. Phase one was conducted between 11th to 15th
December 2017, and involved a preliminary study which included literature review,
initial sites visits, a participatory and interactive discussions with the community key
leaders and local residents of the study areas mainly for the purpose of familiarization
with the areas, get insights on the research problem and identify likely population
elements to be selected for the interviews. Phase two involved actual interviews and
observations, and was conducted from 8th-23rd March, 2018. Interview guides were
used to obtain data on different variables with regard to various aspects of the study.
The interviews were conducted through farm visits on 55 respondents. The formulated
questions of interest were open-ended to enable the respondents remain anonymous
and honest in their responses as well as elicit more extensive discussions on some of the
issues raised.
Data was collected on respondents age, farm size, types of crops grown, livestock kept,
nature (positive or negative), type and frequency of human wildlife interactions among
other variables. General observations were also made on farmers’ fields and other
activities carried out in relation to fresh fruit and vegetable supply.
19
Results and Discussion
Participants demographics A total of 40 respondents participated in the study, with Karatina having 22 and
Kathateni having 18 respondents. In Karatina, a total of 10 were women and a total of
12 were men, while in Meru, a total of 5 women and 13 men participated. The mean age
of participants was 54 years, with the youngest being 27 years and the eldest over 100
years. Education level among respondents was generally higher in Karatina compared to
Kathateni, and it varied as follows. In Karatina, there was 45% respondents with tertiary
education, 23% with secondary level education and 32% with primary education.
Kathateni had 28% with tertiary education, 50% with secondary and 22% with primary
education.
Fruit and vegetables production and marketing in Karatina and Kathateni
There are at least 15 types of fruits produced in both Karatina and Kathateni. Bananas,
passion fruit and tree tomatoes are the most produced fruits as shown in Figure 2. The
diversity of fruits produced in Karatina is higher than Kathateni, which is attributable to
climatic condition that anable production of a wider variety of fruits.
Figure 3: Types of fruits produced in Karatina and Kathateni (own research)
0,0%
5,0%
10,0%
15,0%
20,0%
25,0%
30,0%
35,0%
40,0%
45,0%
50,0%
Kathateni Karatina
20
Vegetable production appears to vary with location, with the highest production in
Karatina being cabbages, kale and spinach (Figure 3). On the other hand, Kathateni
produces tomatoes, Kale and spinach in higher amounts. Farmers in Karatina appear to
have embraced production of more exotic vegetables and fruits (e.g. promeganate,
albino fruit, capsicum, amaranth and coriander) while farmers in Kathateni have
generally retained more traditional fruits and vegetables.
Figure 4: Types of vegetables produced in Karatina and Kathateni (own research)
Fruit and vegetables is sold to a variety of markets (Figure 4). Farmers in Kathateni have
a wider range of market sources, including local open air market, brokers, supermarkets,
nearby shops, neighbouring households and the international market through export. In
Karatina, thne market for fresh fruit and vegetables is narrower, with produce sold to
neighboring local market, brokers, nearby households and farmers cooperatives. İn both
areas, a substantial amount of fruit and vegetable is sold to brokers. This was seen to
have both advantages and disadvantages. Farmers can directly sell their produce to a
broker thereby eliminating the cost of storage and transport, as well as the logistics
0,0%
10,0%
20,0%
30,0%
40,0%
50,0%
60,0%
70,0%
80,0%
90,0%
Kathateni Karatina
21
required to take the produce to the market. It also saves labour and provides them with
more time to be productive in the farm which could have otherwise been spent
marketing the produce and waiting for customers. With brokers farmers can be
guaranteed of pay immediately compared to selling through other channels such as the
cooperatives where they have to wait for pay monthly. However, several respondents
reported that brokers can sometime take advantage of the farmer when they are less
aware of the market price which gives them a greater burgaining power making them
buy the produce at very low price compared to the price offered at the market. Brokers
also make more money with less efforts while farmers realize low profit margins despite
all logistics involved in growing the produce. In addition sometimes especially during
the rainy season farmers are at the mercy of brokers and turn to them as a last resort
because simililar commodities flock in the market and have to be sold fast before they go
bad.
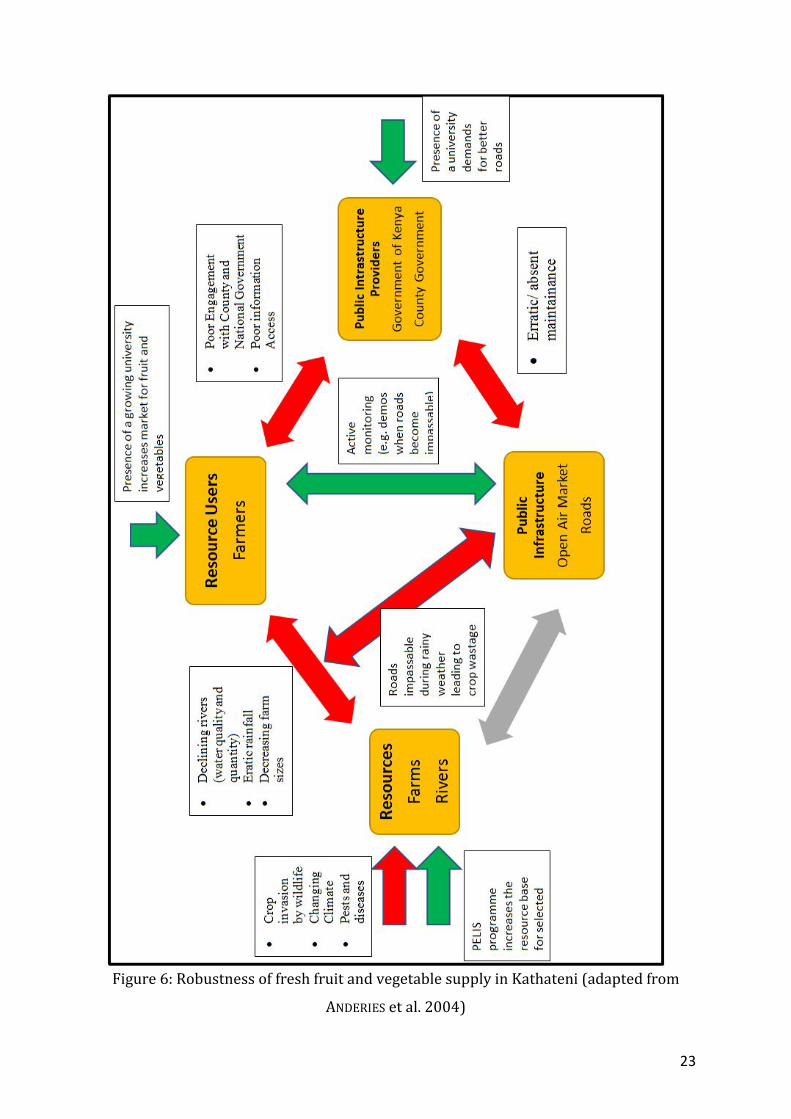
Figure 5: Dimensions of fruit and vegetable supply and the social ecological Framework (own research)
The socio-ecological parameters and their linkages in the fresh fruit and vegetable
production and supply in Karatina and kathateni are described in Figure 6 and Figure 7.
Results of this analysis demostrate that the robustness of fresh fruit and vegetation
supply systems in both Karatina and Kathateni are undergoing a transformation,
thereby subjecting the systems to a risk of failure. Both Karatina and Kathateni have
0,0%
10,0%
20,0%
30,0%
40,0%
50,0%
60,0%
70,0%
80,0%
Nearby localmarket
Brokers Supermarket Nearbyshops
Neighboringhouseholds
Farmers'cooperatives
Export
Kathateni Karatina
22
experienced tremendous population growth in the past 50 years leading to a reduction
in the average size of the farms, as it is the practice of the communities to sub-divide
their farms to the next generation of offspring. An increasing population has also
increased demand for more land for settlement, which leads to less land available for
cultivation. Our results indicate that the average farm size in Karatina and Kathateni are
1 acre and 2.7 acres respectively.
23
Figure 6: Robustness of fresh fruit and vegetable supply in Kathateni (adapted from
ANDERIES et al. 2004)
24
Acknowledgement The authors gratefully acknowledge EAGERLearn for allowing us undertake this
research, Karatina University for assistance and arrangements at the community level in
Kathatene and Gatei regions in the slopes of Mount Kenya and the communities for their
dedicated co-operation and contributions towards the study. We would also like to
thank various government departments for their enlightenment and provision of
information on several aspects of the study. The insightful comments of several
reviewers in the development of this paper are also greatly appreciated.
References ANDERIES, J. M., JANSSEN, M. A. & E. OSTROM (2004): A framework to analyze the robustness
of socialecological systems from an institutional perspective. Ecology and Society 9(1): 18. http://www.ecologyandsociety.org/vol9/iss1/art18
ANDRESS, L. (2017): Using a social ecological model to explore upstream and downstream solutions to rural food access for the elderly. In: Cogent Medicine, 4(1). https://doi.org/10.1080/2331205X.2017.1393849
BAKER, B. H. (1967): Degree Sheet 44 N.W QUARTER ISBIC Library Wageningen, Netherlands, (01), 1-90.
BÖHME, B., BECKER, M., DIEKKRÜGER, B. & G. FÖRCH (2016): How is water availability related to the land use and morphology of an inland valley wetland in Kenya? In: Physics and Chemistry of the Earth, Parts A/B/C 93, S. 84–95.
BURNS, C., BENTLEY, R., THORNTON, L. & A. KAVANAGH (2011): Reduced food access due to a lack of money, inability to lift and lack of access to a car for food shopping: A multilevel study in Melbourne, Victoria. Public Health Nutrition, 14(6), 1017–1023.
BUYS, D. R. & J. L. LOCHER (2015): What does the evidence reveal regarding home- and community-based nutrition services for older adults? Journal of Nutrition in Gerontology and Geriatrics, 34(2), 81–84. https://doi.org/10.1080/21551197.2015.1038457
CASPI, C. E., SORENSEN, G., SUBRAMANIAN, S.V. & I. KAWACHI (2012): The local food environment and diet: A Systematic Review. Health and Place, 18(5), 1172–1187.
FENG, J., GLASS, T. A., CURRIERO, F. C., STEWART, W. F. & B. S. SCHWARTZ (2010): The built environment and obesity: A systematic review of the epidemiologic evidence. Health & Place, 16(2), 175–190. https://doi.org/10.1016/j.healthplace.2009.09.008
FROST, S. S., GOINS, R. T., HUNTER, R. H., HOOKER, S. P., BRYANT, L. L., KRUGER, J. & D. PLUTO (2010): Effects of the built environment on physical activity of adults living in rural settings. American Journal of Health Promotion, 24(4), 267–283. https://doi.org/10.4278/ajhp.08040532
GALSTER, G. C. (2012): The mechanism (s) of neighbourhood effects: Theory, evidence, and policy implications. In Neighbourhood effects research: New Perspectives (pp. 23–56): Dordrecht: Springer. https://doi.org/10.1007/978-94-007-2309-2
HANDY, S. L., BOARNET, M. G., EWING, R. & R. E. KILLINGSWORTH (2002): How the built environment affects physical activity: Views from urban planning. American Journal of Preventive Medicine, 23(2), 64–73. https://doi.org/10.1016/S0749-3797(02)00475-0
HEYNEN, N., PERKINS, H. A. & P. ROY (2006): The political ecology of uneven urban green space the impact of political economy on race and ethnicity in producing environmental inequality in Milwaukee. Urban Affairs Review, 42(1), 3–25. https://doi.org/10.1177/1078087406290729
HUNG, S. L. L., FU, S. N., LAU, P. S. & S. WONG (2015): A qualitative study on why did the poorly-educated Chinese elderly fail to attend nurse-led case manager clinic and how to facilitate their attendance. International Journal for Equity in Health, 14(1), 10. https://doi.org/10.1186/ s12939-015-0137-3
KAWACHI, I., & L. F. BERKMAN (Eds.) (2003): Neighborhoods and health. Oxford University Press. https://doi.org/10.1093/ac prof:oso/9780195138382.001.0001
KENYA INFORMATION GUIDE (2015): About Nyeri County-Kenya. http://www.kenya-information-guide.com/nyeri-county.html
KENYA NATIONAL BUREAU OF STATISTICS (2013): https://www.knbs.or.ke/
KRIEGER, N., ZIERLER, S., HOGAN, J. W., WATERMAN, P., CHEN, J., LEMIEUX, K., & A. GJELSVIK (2003): Geocoding and measurement of neighborhood socioeconomic position: A US perspective. In: Neighborhoods and Health, 9, 147–178. https://doi.org/10.1093/acprof:oso/9780195138382.001.0001
LARSON, N., STORY, M. & M. NELSON (2009): Neighborhood environments: Disparities in access to healthy foods in the U.S. American Journal of Preventive Medicine, 36(1), 74–81. e10. https://doi.org/10.1016/j. amepre.2008.09.025
LEE, J. S., & E. A. FRONGILLO (2001): Factors associated with food insecurity among US elderly persons importance of functional impairments. The Journals of Gerontology Series B: Psychological Sciences and Social Sciences, 56(2), S94–S99. https://doi.org/10.1093/geronb/56.2.S94
LOW, S. M. (1996): Spatializing culture: The social production and social construction of public space in Costa Rica. American Ethnologist, 23(4), 861–879. https://doi.org/10.1525/ae.1996.23.4.02a00100
LOW, S. M. (2003): Embodied space (s) anthropological theories of body, space, and culture. Space and Culture, 6(1), 9–18. https://doi.org/10.1177/1206331202238959
MARMOT, M. G., & R. BELL (2009): Action on health disparities in the United States: Commission on social determinants of health. Journal of the American Medical Association, 301(11), 1169–1171. https://doi.org/10.1001/jama.2009.363
MCCORD, P., COX, M., SCHMITT-HARSH, M. & T. EVANS (2015): Crop diversification as a smallholder livelihood strategy within semi-arid agricultural systems near Mount Kenya. In: Land Use Policy 42, S. 738–750.
MOA MERU COUNTY MEDIA PROFILE (2013): meru.go.ke/file/20140114_meru_county_media_profile.pdf
NORTHRIDGE, M. E., SCLAR, E. D., & M. P. BISWAS (2003): Sorting out the connections between the built environment and health: A conceptual framework for navigating pathways and planning healthy cities. Journal of Urban Health, 80(4), 556–568. https://doi.org/10.1093/jurban/jtg064
OXFORD BUSINESS GROUP (2014): The Report, Kenya 2014. https://oxfordbusinessgroup.com/kenya-2014
PUTRIK, P., DE VRIES, N. K., MUJAKOVIC, S., VAN AMELSVOORT, L., KANT, I., KUNST, A. E. & M. JANSEN (2014): Living environment matters: Relationships between neighborhood characteristics and health of the residents in a dutch municipality. Journal of Community Health, 40(1), 47–56.
SAHYOUN, N. & P. P. BASIOTIS (2001): Food insufficiency and the nutritional status of the elderly population. Family Economics and Nutrition Review, 13(2), 58.
SHARKEY, J., JOHNSON, C., & W. DEAN (2010): Food access and perceptions of the community and household food environment as correlates of fruit and vegetable intake among rural seniors. BMC Geriatrics, 10, 790. https://doi.org/10.1186/1471-2318-10-32
WOLFE, W. S., FRONGILLO, E. A., & P. VALOIS (2003): Understanding the experience of food insecurity by elders suggests ways to improve its measurement. The Journal Of Nutrition, 133(9), 2762–2769.
WOLFE, W. S., OLSON, C. M., KENDALL, A. & E. A. FRONGILLO (1996): Understanding food insecurity in the elderly: A conceptual framework. Journal of Nutrition Education, 28(2), 92–100. https://doi.org/10.1016/S0022-3182(96)70034-1
WOLFE, W. S., OLSON, C. M., KENDALL, A., & E. A. FRONGILLO (1998): Hunger and food insecurity in the elderly its nature and measurement. Journal of Aging and Health, 10(3), 327– 350. https://doi.org/10.1177/089826439801000304
Community’) as well as ‘Internationalisation/Globalisation’ processes are helpful
(KULKE 2013). For Objectives 2 and 3 the ‘Global Value Chain’ approach (GEREFFI et al.
2005; COE et al. 2004), especially the considerations on “governance” structures,
meaning the way of the coordination/ organization between actors (market, hierarchy,
modular, relational, captive) and the ‘Global Production Network’ approach (COE et al.
2008; HENDERSON et al. 2002), which includes the horizontal network relations to
analyze competition and power relations, are relevant.
29
Methodology Both qualitative and quantitative research methods are used in this project. The focus is
on qualitative (expert) interviews with relevant stakeholders from the areas of
production, logistic and retail. This is done using the problem-centered interview
method. Furthermore, semi-structured surveys are conducted with representatives of
supermarkets and intermediaries (including price monitoring). It is important to
compare the same products in all case studies and supermarkets. For this purpose, the
following products were selected based on perishability and handling: sukuma wiki,
managu, potato, onion, nduma, tomato, banana, papaya, mango and imported orange. In
addition, the proven method of "Value Chain Mapping" is used. The supermarket chain
representatives are asked to name their current suppliers. In addition, a GIS analysis is
performed. Maps will be created for all case studies regarding the spatial-temporal
expansion patterns of supermarkets. This is done with the help of the open source
software QGIS for a sustainable use of the GIS data, especially after the project. The focus
is on eight cities, the four largest cities in each country regarding population. The
selection was made on the basis of the importance of these cities in relation to the
research topic (Figure 2).
Photo 2: Vegetable delivery to a supermarket in Nairobi (Christian Sonntag 2018)
Photo 3: Muthurwa Market (wholesale) in Nairobi (Christian Sonntag 2017)
30
Spatial-temporal expansion of supermarkets In Kenya, the expansion of supermarkets has been dominated for decades by domestic
retail chains (NEVEN & REARDON 2004; RETRAK 2018). In Tanzania, on the other hand,
some retailers from South Africa and later Kenya opened branches at the turn of the
millennium, but later had to close again (NANDONDE & KUADA 2018). Currently, we see
both expanding and struggling domestic supermarket chains in both countries as well as
multinational enterprises gaining a stronger foothold in Kenya and Tanzania in the last
years (Figure 5 and 6).
In addition to the few large supermarket chains, there are many small chains and over
100 owner-managed supermarkets in Kenya and Tanzania. All domestic supermarket
chains (headquarter in Kenya or Tanzania) with at least two branches are illustrated in
Figure 3. In addition to the domestic supermarkets, there are also multinational
0 20 40 60 80
NakumattTuskysNaivas
UchumiEastmatt
ChandaranaTumainiKhetias
MaathaiSociety Stores
G-MartQuickmartCleanshelf
MulleysGreenmart
BudgetKassmatt
Maguna AnduPowerstar
Samrat SMChieni SMWoolmatt
FairlaneFairmart
BidiiSuntecRikana
StagemattSelfridgeZucchini
Field Fresh VegetablesThe Corner ShopMboga Masters
Beyond FruitsShrijee´s
Village SMTSN
Shoppers
Figure 2: Case studies (own map) Figure 3: No. of branches of domestic supermarkets/ greengrocer with at least 2 branches (Data: own survey, as of May 2019)
Supermarkets in TZA
Green Grocer in KEN
Supermarkets in KEN
31
enterprises that have been opening branches in Kenya and Tanzania for several years
(see Figure 6).
There are first research findings on the spatial-temporal distribution patterns of
supermarkets. It becomes clear that in Kenya far more supermarkets already have been
opened than in Tanzania. This is due to different historical, economic and political
developments such as degree of informality in retail, market liberalization and foreign
direct investment. Figure 4 shows the current spread of supermarket chains with 5 or
more branches. Supermarket chains first establish themselves in the national
metropolises and urban centers, then expand into other major cities nearby before they
expand into the smaller cities and rural regions (see also DANNENBERG 2013; KULKE et al.
2014). In addition, so far supermarket chains have been opened branches mainly in the
CBD, along major transport routes and in areas with middle and high income (own
survey). The latter is due to the profit-oriented spatial logic of retail companies.
There is currently an ongoing transition in the retail market in East Africa. While former
Kenyan supermarket chain giants are currently facing problems (see Nakumatt and
Figure 4: Branches of supermarket & greengrocer chains with more than 5 stores in 2019 (own map)
32
Uchumi, Figure 5), multinational retailers are taking advantage of the gap and expanding
into Kenya and Tanzania (Figure 6). Nakumatt and Uchumi have had to shut down a
large number of their branches over the past two years, including all branches in
Tanzania. On the other side, multinational enterprises have opened more than 30 stores
in the last 5 years and plan to open many more in the short and medium term (Figure 6).
Organization of delivery systems between agricultural producers &
supermarkets Supermarkets created a third marketing system for fresh fruit and vegetables in Kenya
in the second half of the 1990s next to the “classical domestic system” and the “export
system” (NEVEN & REARDON 2004: 680). However, our research shows there is no single,
definable, universal system of fresh produce supply to supermarkets. The organization
of delivery systems of fresh fruit and vegetables to supermarkets is very complex and
still often flexible. Generally valid statements for the one system are difficult and make
little sense. Types of intermediaries should therefore be explained using various models
used by supermarkets. Based on the types, functions and upgrading dimensions of the
intermediaries can be explained. In this regard, 5 different models were identified and
defined (work in progress), which are shown in Table 1. Table 1 also shows what
supermarket uses what system and who are the intermediaries and actors involved.
There are centralized, decentralized and mixed models, there are completely new
models with specialized intermediaries and models that are more akin to the long-
standing ‘classical domestic system’ which includes different middlemen (brokers) and
0
10
20
30
40
50
60
70
Nakumatt Tuskys Naivas Uchumi
2012
2015
2017
2018
0
5
10
15
20
25
30
35
2014 2015 2016 2017 2018 2019
Shoprite (ZAF)
Food Lover's (ZAF)
Game (ZAF)
Carrefour (UAE)
Choppies (BWA)
Figure 6: No. of multinational supermarkets in KEN & TZA (Data: own survey)
Figure 5: Development of the (former) “Big 4” in Kenya (Data: KIMANI 2012; MASINDE 2016; own survey)
33
wholesale markets. Based on these models, the intermediaries involved can be typed
and examined.
Forms of organization of delivery systems between agricultural producers and supermarkets
Supermarkets & Greengrocers (examples)
Intermediaries and farmer/suppliers involved
3PL model (centralized, specialized)
Nakumatt, Tuskys, Chandarana, Shrijees, Homes
3 PL provider (Fresh an Juici, The Corner Shop); brokers, importer, exporter, (contract) farmers
Mixed model (centralized & decentralized)
Choppies, Village (contract) farmers, brokers, importer, exporter
Centralized model using collecting points (regional, e.g. Nairobi)
Field Fresh Vegetables, regional & smaller chains
farmers/supplier bring FFV direct to collection points; retailer distributes FFV with own vehicles; importer
Import model TSN, small chains, owner-managed supermarkets
importer (South Lemon, Mbezi Fresh), broker
As an example, the ‘3PL model’ is presented below (Figure 7). 3PL means third-party
logistics, an external logistics service provider. These specialized companies take over
functions such as washing, storing, sorting and transporting (with its own vehicles) of
fresh fruit and vegetables. But also the knowledge transfer plays a very important role.
Table 1: Models of delivery systems for fresh fruit and vegetables to supermarkets (own survey)
34
Various other actors, such as farmers, brokers, exporters and importers are integrated
into this model and deliver to a central company-owned logistics center. Sometimes
these companies have their own farm as well as their own retail and can thus control the
entire value chain. This ‘3PL model’ shows a trend towards specialized intermediaries in
the fruit and vegetable trade, which did not exist in the study area 10 years ago. These
companies use mobile technology, packaging houses, cooling infrastructure and
specialized transport vehicles. It should also be noted that this move towards
specialized intermediaries is taking place not only in rather formal supermarket retail
but also in the extremely important (informal) market and street selling of fresh fruit
and vegetables. An example is the B2B marketplace platform Twiga Foods, which
supplies market/street vendors (‘mama mbogas’) throughout Nairobi and is already the
"largest supplier of fresh fruit and vegetables in Nairobi" (SME FINANCE FORUM 2018).
Figure 7: 3PL model (own draft)
35
Conclusions
In summary, a dynamic phase of transition in the retail landscape in Kenya and Tanzania
is happening right now. There are some large domestic supermarket chains, as well as a
large number of small chains and owner-managed supermarkets, with a big difference
between Kenya and Tanzania regarding the prevalence and penetration of
supermarkets. In addition, multinational companies have been entering successfully the
supermarket landscape in Kenya and Tanzania. It will be interesting to see, who will
dominate the market in the near future.
Regarding the organization of delivery systems of fresh fruit and vegetables between
producers and supermarkets, it becomes clear that different delivery systems co-exist in
parallel (5 different models currently identified). Results also show that intermediaries
undertake different functions and that there is a trend towards specialized
intermediaries in the logistics of fruit and vegetables for supermarkets, who are using
mobile technology, logistic centers and own vehicles.
References ALTENBURG, T., HAMPEL-MILAGROSA, A., KULKE, E. & C. REEG (2016): Governing retail
modernization in developing countries - A development policy perspective. DIE Report Bonn.
COE, N., HESS, M. YEUNG, H., DICKEN, P. & J. HENDERSON (2004): „Globalizing“ regional development: a global productions network perspective. Transactions of the Institute of British Geographers, NS 29, 468-484.
COE, N., DICKEN, P. & M. HESS (2008): Global production networks: realizing the potential. Journal of Eonomic Geography 8 (3) 271-295.
DANNENBERG, P. (2013): The Rise of supermarkets and challenges for small farmers in South African food value chains. Economia agro-alimentare, n. 3-2013, 14-34.
DENZIN, N. (2006): Sociological Methods: A Sourcebook. Aldine Transaction.
FRANZ, M. & M. HASSLER 2011: Globalisierung durch Supermärkte – Transnationale Einzelhändler in der Türkei. Geographische Rundschau 63, (1), 28-34.
GEREFFI, G., HUMPHREY, J. & T. STURGEON (2005): The governance of global value chains. Review of International Political Economy 12, (1), 78-104.
HENDERSON, J., DICKEN, P., HESS, M., COE, N. & H. YEUNG (2002): Global production networks and the analysis of economic development. Review of International Political Economy 9, (3), 436-464.
KIMANI, M. (2012): The tale of Kenya’s three biggest chains of supermarkets. In: Daily Nation 2012, 11.05.2012 (online).
KULKE, E. (2013): Wirtschaftsgeographie. Paderborn.
36
KULKE, E., HOBELSBERGER, C., PAULUS, C., SUWALA, L. & M. VELTE (2014): The structure and socio-economic impact of retail liberalisation in developing countries. Report for the DIE and GIZ, Berlin.
MASINDE, J. (2016): The world’s retailers are eyeing East Africa’s growing middle class shoppers. Quartz Africa 2016-06-01 (online).
NANDONDE, F. & A. J. KUADA (2018): Perspectives of retailers and local food suppliers on the evolution of modern retail in Africa. British Food Journal, Vol. 120 Issue: 2, pp. 340-354.
NEVEN, D. & T. REARDON (2004): The Rise of Kenyan Supermarkets and the Evolution of their Horticulture Product Procurement Systems. Development Policy Review, 2004, 22 (6): 669-699.
REARDON, T., TIMMER, C. P. & J.A. BERDEGUÉ (2004): The rapid rise of supermarkets in developing countries: Induced organizational, institutional, and technological change in agrifood systems. Journal of Agricultural and Development Economics 1, (2), 168-183.
RETRAK (Retail Trade Association of Kenya) (2018): Supermarket Market Share. (unpublished).
SME FINANCE FORUM (2018): Grant Brooke. Co-Founder and CEO - Twiga Foods. <https://www.globalsmefinanceforum.org/Africa-2018/speaker/grant-brooke> (accessed: 2019-02-15).
37
Introduction Food production has always been a core of the past and present generations. The
Ancient Egyptians made sure that they grew enough food through irrigation to feed their
increasing population. Similarly on the lands of the Mohenjo Daro in India agriculture
was the green light to the success of the civilizations. Israel is one of the 20th century
countries which has converted itself from a desert to an oasis of food. The future
generations are also being driven towards food production by international mandates
whereby all countries through the United Nations (UN) are geared towards meeting the
Sustainable Development Goals (SDGs). The SDG Number 2 is specially geared towards
food production and its provision. It states “end hunger, achieve food security and
improved nutrition, and promote sustainable agriculture” (OSBORN et al. 2015). The sub-
sections of this goal are:
a. by 2030 end hunger b. by 2030 end all forms of malnutrition c. by 2030 double the agricultural productivity and the incomes of small-scale food
producers d. by 2030 ensure sustainable food production systems and implement resilient
agricultural practices e. by 2020 maintain genetic diversity of seeds, cultivated plants, farmed and
domesticated animals and their related wild species (Osborn et. al., 2015).
In spite of all efforts being geared towards successful food production, in many parts of
the developing world, food is a real problem as people either do not have access to food
as production levels are low or what is produced does not reach the market (UN 2018).
Furthermore, the projections by Food and Agricultural Organisation (FAO 2016)
indicate that the available arable land per person will decrease further by the Year 2050
and will be less by one-third of the land which was available in 1970. This decline is
unprecedented and will continue to occur due to factors like population growth, climate
change, reduction in water supplies, increase in drylands, overfishing, soil depletion and
Food production and challenges – the case of Machakos County in Kenya
PARITA SHAH
38
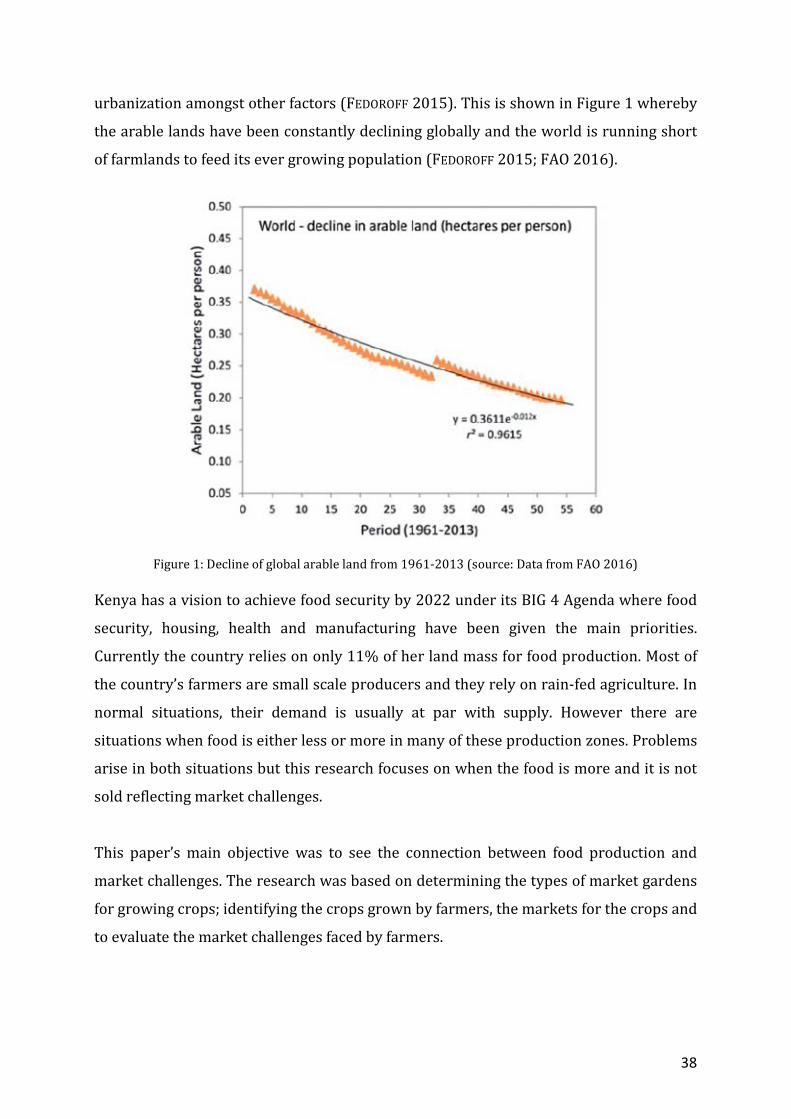
urbanization amongst other factors (FEDOROFF 2015). This is shown in Figure 1 whereby
the arable lands have been constantly declining globally and the world is running short
of farmlands to feed its ever growing population (FEDOROFF 2015; FAO 2016).
Figure 1: Decline of global arable land from 1961-2013 (source: Data from FAO 2016) Kenya has a vision to achieve food security by 2022 under its BIG 4 Agenda where food
security, housing, health and manufacturing have been given the main priorities.
Currently the country relies on only 11% of her land mass for food production. Most of
the country’s farmers are small scale producers and they rely on rain-fed agriculture. In
normal situations, their demand is usually at par with supply. However there are
situations when food is either less or more in many of these production zones. Problems
arise in both situations but this research focuses on when the food is more and it is not
sold reflecting market challenges.
This paper’s main objective was to see the connection between food production and
market challenges. The research was based on determining the types of market gardens
for growing crops; identifying the crops grown by farmers, the markets for the crops and
to evaluate the market challenges faced by farmers.
39
Food production and challenges Between the period of 1960 and 2015, food production increased globally due to Green
Revolution, changes in technology, sustainable utilization of resources, increase in the
conversion of land for agriculture and improved provision of water. In the same period,
globalization increased and food supply chains have increased from processing,
packaging and food preparation. This indicates that there is less wastage of food
(FAO 2016). However there is still a major sign of distress as since mid-1990s, the yields
of most crops has slowed down especially in the continent of Africa and some parts of
Asia (CASSMAN et al. 2010; ALSTON et al. 2010).
As most areas of the world move from rural to urban transition, food security has a key
role to play. This is because there is more focus on development than food security.
While small scale growers concentrate on food production, they face problems like the
size of land, droughts and climate change related problems, diseases, price fluctuation,
market changes, changing diets, transport, post harvest losses and changes in demand
(FAO 2017). Thus food security is defined as “a situation that exists when all people, at
all times, have physical and economic access to sufficient, safe and nutritious food to
meet their dietary needs and food preferences for an active and healthy life” (FAO
2009).
In most African countries, agriculture is the backbone of the economy. These countries
export a lot of horticultural products and at the same time earn good foreign exchange.
For example in 2005 Ethiopia’s horticultural exports rose from 13 million USD to 550
million USD in 2016 (African Development Bank Group [AFDB] 2016). In the case of
Kenya the horticultural exports rose from 21 billion Kenyan Shillings in 2000 to 97
billion Kenyan Shillings in 2015 (ibid). However these figures can be improved with
improvement in size of land, transport, better price information and facilitation of
markets (WORLD BANK 2017).
Studies carried out by ALEXANDRATOS & BRUINSMA (2012) and LI & SIDDIQUE (2018)
indicate that food security will face challenges in terms of scarcity of natural resources.
These natural resources will suffer from over-exploitation, unsustainable use and
environmental degradation leading to food insecurity. One example is in the livestock
sector where competition for good land and grass is forcing pastoralists to migrate from
40
one place to the other. Furthermore during times of drought or if early warning signs of
drought is given, many pastoralists fail to sell their cattle as they may not have transport
to supply the cattle where the market is or people may not have the purchasing power
to buy the livestock.
Background of case study: Kenya and Machakos County Kenya is in East Africa and borders Uganda to the West, Republic of Tanzania to the
South, Somalia and Indian Ocean to the East and South East, Ethiopia to the North and
South Sudan to the North West. The country’s population stands at 45 million (Kenya
National Bureau of Statistics [KNBS] 2017). Out of the country’s 582 646 km2 only 16%
of the country has agricultural potential. From the 16%, 31% is used for cropland, 30%
for grazing, 22% for forestry while the rest is used for settlement. The rest of the 84% is
arid and semi-arid land (ASALs) and mainly used for agro-pastoralism, pastoralism and
ranching (FAO 2018).
This research focuses on the food security and challenges in the County of Machakos.
This County is rich in terms of land, soil, minerals, forests and wildlife. However it is a
challenge to be consistent in terms of agricultural crops as the County is an ASAL so
water is a real problem. Most of the times the County’s agricultural demand exceeds
supply coupled with issues of climate change like drought, desertification and diseases.
Furthermore there is competition for water from industries, livestock as well as
domestic use. Machakos is also challenged in terms of food security through poor
farming methods, low adoption of drought tolerant crops, use of poor quality seeds and
poor access to farm inputs (GOK 2009; MWANGI AND MUNDIA 2014). In spite of all these,
the largest percentage of the county’s land is geared towards agriculture, followed by
barren land, forest land, built up area and water body. This is shown in Figure 2.
41
Figure 2: Machakos Land Use and Land Cover (source: MWANGI & MUNDIA 2014) Methodology Primary data was sourced using questionnaires, observations, informal interviews and
photographs. A total of 200 respondents were randomly selected using the hat method
from twelve locations namely Athi River, Mavoko, Kinanie, Kyumbi, Kathekakai, Ngelani,
Mutituni, Mumbuni, Kitanga, Kenya Meat Commission (KMC), Mugoti and Matatani. The
selection was done based on the total number of population from the data base of Kenya
National Bureau of Statistics (KNBS 2009) which indicated that Athi River had the
highest number of people thus the research selected 30% of the respondents from there,
followed by Kinanie, Mavoko, Kyumbi, KMC, Mathatani, Mutituni, Ngelani, Mumbuni,
Kitanga, Kathekakai and Mugoti.
The study used both descriptive and inferential statistics. The primary data comprised
of the nature of market gardens, type of crops one grew, value added to the crops before
being sold, market for the crops and challenges faced.
42
Results and Discussion The respondents comprised of 52.5% (105) males and 47.5% (95) females. The
respondents were asked on their farm size and the typology of the market gardens. The
results indicate that over 80% of the respondents had less than 3 acres of farmland.
From this 80%, the majority had between 0.5 to 1 acres of farmland. This is because
most of them have either sub-divided the land amongst their siblings or are too poor to
have big plots. A similar study was done by Ndiema in 2010 in two counties of Kenya
namely Kajiado and Narok whose results indicated that 54.6% of the farmers had small
scale farms of less than 5 hectares.
According to one lady respondent in Machakos County, her one acre plot hardly
sustained her family indicating that she had to source more food from elsewhere. The
statement according to her is as follows:
“I cultivate my one acre farm using traditional methods. I still have to balance farming
together with my other family chores which include caring for my children, fetching
water, cooking and taking children to school. I am forced to buy food occasionally as my
land doesn’t produce enough for my family because of increase in heat, less water,
diseases and I can’t afford fertilizers as my soils are poor. At times when I have extra
food, I don’t have buyers”.
In terms of the types of market gardens, there were seven categories namely home
gardens, public open space, storey gardens, tins and pots, institutional lands, road
reserves and own farms. The results indicate that majority (57%) had home gardens,
followed by those who used public spaces, others used institutional lands and road
reserves, some opted for growing food in tins and pots, others grew crops on their roof
tops and very few had their own farms (Figure 3).
43
Figure 3: Typology of market gardens in Machakos County (source: own survey) As the results in Figure 3 indicate, most people grow food in their own gardens. This
means most of the crops are grown for subsistence. In case there is surplus, then the
farmers would be in a position to sell. Furthermore, the results also indicate that over
25% grow crops in public land. This is not the right approach and anytime this land
could be fenced or trespassing it could become a problem resulting in farmers becoming
“landless farmers”. Other farmers have opted to carry out farming on road reserves
which is a very temporary solution as these areas will soon become roads and the
farmers will have to look for alternatives. In fact many farms on the road reserves have
been cleared. Plate 1A shows a farm on a road reserve in October 2017. In August 2018
the farm was no longer there as shown in Plate 1B.
Plate 1A: Food production on road reserve (Parita Shah 2017)
Plate 1B: Road reserve (formerly as shown in Plate 1A as farm) converted to road (Parita Shah 2017)
44
The respondents were also asked on the type of crops they grew. This is shown in Figure
4 which indicates that the staple crops like maize and beans are the commonly grown
crops by farmers. This is because they use them for their own subsistence and since this
is staple food, most of the extra crops are sold. Furthermore, a cross-tabulation was
done to see the typology of the farm and the crop grown. Results indicated that maize
and beans were grown by all irrespective of the type of market gardens. This is because
they use maize and beans as their daily food.
Figure 4: Crops grown by farmers in Machakos County (source: own survey)
45
The respondents were also asked if they sold their crops. From 200 respondents, only
45.5% (91) sold their crops while 54.5% (109) did not. This is shown in Figure 5.
Figure 5: Respondents’ manner of distributing food crops (source: own survey)
The results indicate that since most people are small scale farmers they hardly have the
opportunity to look for small markets. This is common throughout the country (OMACHE
2016; OCHIENG et. al. 2016). The farmers who had surplus were also asked if they sold
their crops by adding value or they just sold them in their raw form. Only 1.5% of the
respondents stated they added value to the crops before selling them. These 1.5% of the
respondents stated that they sun dried their crops before selling so that they would not
go bad.
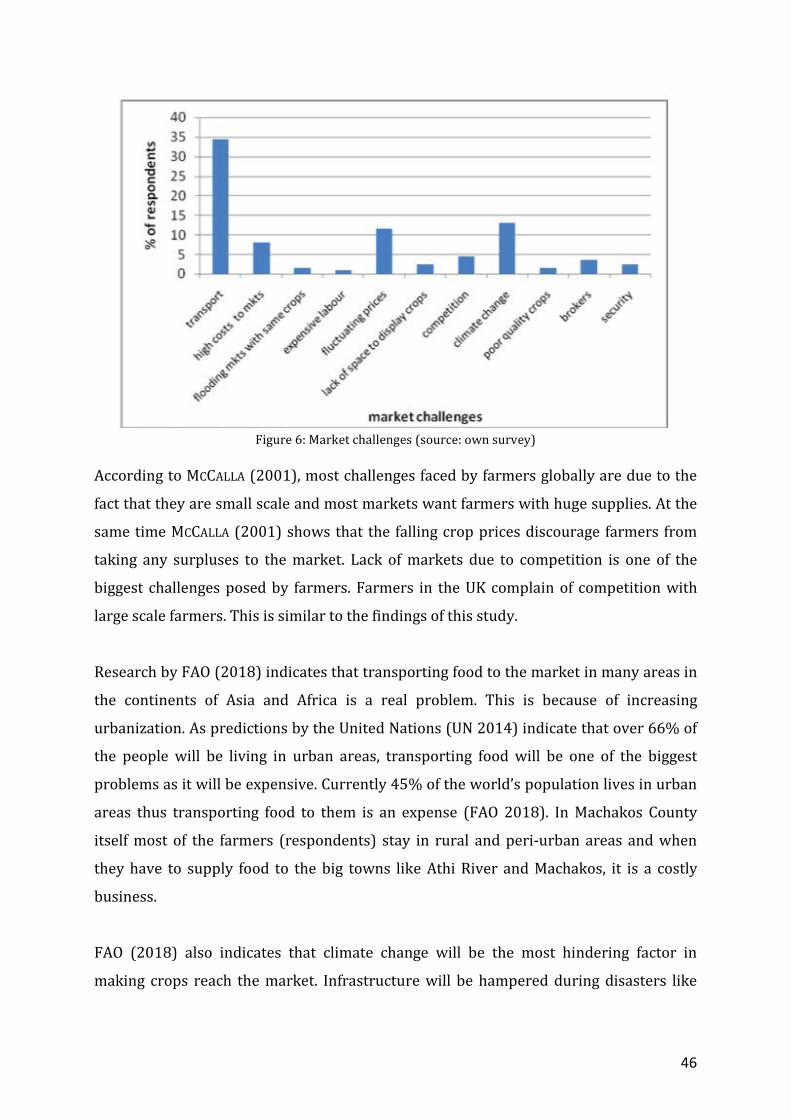
The farmers were also asked on the market challenges they faced. The challenges raised
by the farmers were transport, high costs of sending the crops to the markets, flooding
of the markets with the same crops, lack of customers, expensive labour, fluctuating
prices, lack of space to display crops, competition, climate change resulting in poor
roads associated with flooding and droughts, poor quality crops, brokers and security.
According to most respondents, transport was the main challenge followed by lack of or
insufficient markets. This is shown in Figure 6.
46
Figure 6: Market challenges (source: own survey)
According to MCCALLA (2001), most challenges faced by farmers globally are due to the
fact that they are small scale and most markets want farmers with huge supplies. At the
same time MCCALLA (2001) shows that the falling crop prices discourage farmers from
taking any surpluses to the market. Lack of markets due to competition is one of the
biggest challenges posed by farmers. Farmers in the UK complain of competition with
large scale farmers. This is similar to the findings of this study.
Research by FAO (2018) indicates that transporting food to the market in many areas in
the continents of Asia and Africa is a real problem. This is because of increasing
urbanization. As predictions by the United Nations (UN 2014) indicate that over 66% of
the people will be living in urban areas, transporting food will be one of the biggest
problems as it will be expensive. Currently 45% of the world’s population lives in urban
areas thus transporting food to them is an expense (FAO 2018). In Machakos County
itself most of the farmers (respondents) stay in rural and peri-urban areas and when
they have to supply food to the big towns like Athi River and Machakos, it is a costly
business.
FAO (2018) also indicates that climate change will be the most hindering factor in
making crops reach the market. Infrastructure will be hampered during disasters like
47
floods. The respondents of this research have already indicated that natural disasters
due to climate change are hampering efforts to transport food to towns and cities.
Recommendations and Conclusion Machakos County needs to be sufficient in terms of food production. The farmers must
produce enough so that the County can feed itself. The County Government should
encourage small scale farmers to at least have their own piece of land. Furthermore
these farmers should also be trained to use modern technology which would help them
produce more food within a short time and improve crop quality. The County
Agricultural Officers should also take the initiative to help farmers look for markets the
same way large scale farmers are helped. Challenges like transport, competition, poor
quality crops and security should be the responsibility of the County Government. They
should also look at the possibility of providing subsidized transport to farmers to take
their crops to the market. This would also help in removing brokers from the system and
encouraging farmers to generate more income. Machakos County having the potential to
supply the whole country with food should ensure that they are sustainable by
improving governance and boosting farmers’ perceptions. The County should also come
up with their own policy on agricultural production which could have similar strategies
like the European Union’s Common Agricultural Policy (CAP). Farmers who produce
excess should also be encouraged to develop value for their crops and improve on the
value chains. This would help the County meet the SDGs of no hunger, BIG 4 Agenda of
the Government and Vision 2030’s agenda of food for all. The Machakos County
Government should be getting and focusing on stakeholder investments in agriculture,
fishery and forestry and at the same time concentrating on research and development.
References AFDB (African Development Bank Group) (2016): Feed Africa Strategy for agricultural
transformation in Africa 2016-2025. Abidjan.
ALEXANDRATOS, N. & J. BRUINSMA (2012): World agriculture towards 2030/2050: The 2012 revision. ESA Working Paper No. 12–03. Rome, FAO.
ALSTON, J. M., BABCOCK, B. B. & P.G. PARDEY (2010): The Shifting patterns of agricultural production and productivity worldwide. Ames, I. A: The Midwest Agribusiness Trade Research and Information Center, Iowa State University.
CASSMAN, K., GRASSINI, P. & J. WART (2010): Crop yield potential, yield trends, and global food security in a changing climate. In: Hillel. D. and Rosenzweig. C. (Eds.):
48
Handbook of climate change and agroecosystems (Chapter 3). London: Imperial College Press.
FAO (Food and Agricultural Organization of the United Nations) (2018): Country programme evaluation series: Evaluation of FAO’s contribution to the Republic of Kenya. FAO.
FAO (2017): The future of food and agriculture. Trends and challenges. Rome.
FAO (2016): The state of food and agriculture 2016. Climate change, agriculture and food security. Rome.
FAO (2009): The state of food insecurity in the world 2009. FAO.
FEDOROFF, N. (2015): Food in a future of 10 billion. Agriculture and food security, 4, (1).
GOK., (2009). Machakos District Environmental Action Plan (DEAP). Government Printers, Nairobi.
KNBS (2017): Statistical abstract. Kenya National Bureau of Statistics, Nairobi.
KNBS (2009): Kenya National Bureau of Statistics. Kenya National Bureau of Statistics, Nairobi.
LI, X. & K. H. M. SIDDIQUE (2018): Future smart food - Rediscovering hidden treasures of neglected and underutilized species for Zero Hunger. FAO.
MCCALLA, A. (2001): Challenges to world agriculture in the 21st Century. Agricultural and resources economics. Spring, 4, (3): 1-4.
MWANGI, E. W. & C. N. MUNDIA (2014): Assessing and monitoring agriculture crop production for improved food security in Machakos County. Proceedings of 2014 International Conference on Sustainable Research and Innovation, Volume 5, 7th-9th May.
OCHIENG, J., KIRIMI, L. & M. MATHENGE (2016): Effects of climate variability and change on agricultural production: The case of small scale farmers in Kenya. NJAS - Wageningen Journal of Life Sciences 77: 71–78.
OMACHE, R. N., (2016): Factors influencing agricultural productivity in Kenya: A case of Nyathuna Ward in Kabete Sub-County, Kiambu County. MA Thesis, University of Nairobi.
OSBORN, D., CUTTER, A. & F. ULLAH (2015): Universal Sustainable Development Goals. Understanding the transformational challenge for developed countries report of a study by stakeholder forum, May. Stakeholder Forum.
UN (2018): Financing for development: Progress and prospects 2018. United Nations.
UN (2014): World urbanization prospects. https://esa.un.org/unpd/wup/publications/files/wup2014-highlights.pdf
WORLD BANK (2017): World development indicators (dataset). Accessed June 2018. http://data.worldbank.org/datacatalog/world-developmentindicators.
49
A value chain is the sequence of activities required to make a product or provide a
service. In itself, this is a simple idea: everyone know that ketchup started as a tomato
that had to be harvested, transported to a food-processing factory, smashed, refined,
bottled, labelled and sold to retail.
What not everyone may know are the numerous additional activities carried out along
the chain, for example: the certification from where the tomato comes from, the cooling
chain which needs to be considered for transport over long distances, the cross-border
inspection and quality control, etc.
The idea of a value chain becomes useful for analytical and policy purposes, especially in
development policy. The promotion of value chains is a fundamental concept of
development policy. Based on thorough Value Chain analyses, GIZ supports upgrading
strategies for particular industries, together with all relevant actors. Value Chain
development mobilises private and public investment funds. The main objective is to
ensure that economic growth generates broad-based and sustainable social benefits and
contributes to poverty alleviation. It should also lead to more efficient use of energy,
water and other resources.
GIZ bases its Value Chain strategy on growth opportunities, focusing attention on the
potential for alleviating poverty, creating employment and improving resource
efficiency. Women are often at the heart of the work in view of their important role in
Value Chain development.
Value chain concept of GIZ and practical examples from Kenya
DOMINIK FORTENBACHER
50
The implementation of Value Chain programmes is guided by the following principles:
1. Value chains are selected for promotion in accordance with economic, ecological and social criteria. These criteria are frequently embedded in national agricultural or industrial development policies.
2. GIZ collaborates with private companies, service providers and public institutions as our main partners in value chain promotion.
3. GIZ provides advice and facilitate technical and organisational innovations, which may include initial financial support. While GIZ cooperates closely with companies buying produce from partner countries and with local businesses, GIZ does not directly engage in the Value Chain business operations.
4. With a view to achieving long-term structural change, GIZ works to enhance the expertise and capacity of our private and public partners.
GIZ uses the ValueLinks methodology and instruments to shape its interventions and
services. ValueLinks is structured according to the project cycle and provides the
foundation for our services. These include:
1. Project design: GIZ develops and plan Value Chains programmes and projects on behalf of governments, foundations, industry organisations and private companies.
2. Selection of value chains: GIZ develops options for market development on the basis of criteria agreed with partners.
3. Value chain analyses: ValueLinks provides the methodological know-how for value chain mapping and for economic, social and environmental assessments of Value Chains, including gender analysis.
4. Advice on sustainable development strategies: GIZ provides advice on the formulation of appropriate Value Chain development strategies.
5. Facilitation of change processes: GIZ accompanies and advises on the implementation of Value Chain development measures agreed with partners.
6. Implementation of technical, business and institutional solutions: Important fields of upgrading include improving business models, promoting business linkages and contracting, engaging in horizontal cooperation, providing technical and financial services, establishing an appropriate regulatory framework, and agreeing quality and sustain-ability standards.
7. Impact monitoring and data management: Services include the collection and management of information.
51
Figure 1: Structure of ValueLinks (SPRINGER-HEINZE 2018: ValueLinks 2.0)
GIZ can draw on extensive expertise and a wide range of tools in each of these fields as
well as training materials and formats that can be flexibly applied and adapted to the
prevailing conditions in a specific value chain.
Value Chain development is often combined with territorial approaches to economic
development, such as rural development or local and regional economic development.
The Value Chain approach can also be used as a component in programmes on natural
resource management or private sector.
In Kenya, GIZ is working in the agricultural sector in different value chains, these
include: sweet potato, potato and dairy value chain.
In the Nutrition-sensitive Potato Partnership Project (NuSePPP), GIZ together with
partner from the public and private sector is following a value chain approach. NuSePPP
focuses its intervention on different stages in the potato value chain:
1. Ensuring the availability of inputs especially seed potatoes for farmers, by promotion of apical stem-cutting technology for decentralized seed multiplication and supporting seed multipliers through technical advice and financial support
52
2. Support of small scale farmers by providing them structured training and enhancing the Government Extension Service. The training is broken down in 15 modules focusing from land preparation to harvesting and business skills.
3. Strengthening of producer groups through farmer organization and capacity building on group governance, proper financial record keeping, quality control i.e. sorting and grading, facilitation of Contractual Agreements between producer groups and Processors
4. Advising off-takers, e.g. processors on business model development, investment strategies and raw material sourcing strategies
5. Awareness creation among consumers on nutritious food preparation, food storage and hygiene measures through community nutrition dialogues on village level
6. Establishment of an enabling framework by supporting the process of policy development, sector coordination and information exchange between stakeholders
Figure 2: Value Chain approach of the Nutrition-Sensitive Potato Partnership Project (NuSePPP)
(source: own draft)
References SPRINGER-HEINZE, A. (2018): ValueLinks 2.0. - Manual on Sustainable Value Chain
Development, GIZ Eschborn, 2 volumes.
53
Picture 1-4: Smallholder Farming in Embu County (Arne Rieber 2018)
Introduction Embu County is situated at the foot of Mt. Kenya. Due to the different altitudes, the
county has three different agro ecological zones: The upper zone, known as the Tea
zone, the middle zone or transitional zone and the Lower Zone. The zones create very
different farming opportunities due to different temperatures, rainfall and in the case of
the lower zone lower soil quality. Consequently the county is characterized by differing
farming systems, cash-crop oriented in the upper zone and subsistence focused in the
middle and lower zone. The here briefly presented study which was undertaken in 2018
was therefore narrowed down to one agri-ecological zone, the Middle Zone, which is
ranging from 1200masl. to 1400masl.
The study included a qualitative research, working closely with 30 households and a
quantitative household survey with a sample size of 104 households.
Business and Marketing Strategies in Smallholder Agriculture in Embu County
ARNE RIEBER / BENSON NYAGA
54
Business strategy Two underlying factors influence the business strategy in the middle zone; climate and
available land to a household. High population density and the division of land to the
next generation have resulted in an average farm size of 2 acres (less than one hectare)
in Embu County. The average owned land among the target households of the survey
was even lower at 1.425 acre (0.85 ha) per household. The average cultivated land
(=owned land + rented land + land borrowed – space required for housing and
livestock) is 1.66 acre. The stratification in land ownership between households is
strong. The median owned land is one acre with a median cultivated land of 1.5 acre
showing the significance of rented land or cultivation of relatives’ land in the area. The
Middle Zone shows characteristics of both the upper and the lower zone, hence the
name transition zone. The upper parts of the middle zone provide the opportunity to
farm coffee; however the role of coffee is decreasing. The farming system is focused on
subsistence farming, especially in terms of cultivated land. Maize and beans are the main
crops and have dominated the farming system in the area for decades and cover most of
the land, around 75%. Additionally farmers designate small areas for tubes, root crops,
vegetables and fruits. The variety of crops is high as the drought-resistant crops known
from the lower zone can also be cultivated in the middle zone. Under the FAO
classification the area’s farming system is a ‘Maize Mixed Farming System’ and “the
whole system is currently in crisis as input use has fallen sharply due to the shortage of
seed, fertiliser and agro-chemicals, plus the high price of fertiliser relative to the maize
price” (DIXON et al. 2001). 17 years after the FAO publication the maize crisis is ongoing
and adoption and coping strategies to the fall of the traditional maize system and market
play a major role in the livelihood strategies. Livestock keeping is also central to the
smallholder farming in the area, tethering of cows and goats is possible in most areas of
the middle zone while zero-grazing is more common. In recent years khat has become
one of the main income sources in the middle zone and has surpassed coffee as the cash-
crop of the area. The large range of farming opportunities is reflected in the following
typology of farm strategies in the middle zone which is divided in commercial and
subsistence farming. It is important to note that all farms in the region show an
integrated farming system, the following strategies have to be seen as a focus not the
sole venture.
55
Table 1: Farming Systems in Embu County (Data: Field Survey 2018)
Com
mer
cial
ized
live
stoc
k fa
rmin
g Co
mm
erci
aliz
ed c
rop
farm
ing
Stoc
kbre
edin
g Da
iry/
Egg
Farm
ing
Mon
o-Cr
oppi
ng
Dive
rsifi
ed fa
rmin
g
Cash
-cro
p fa
rmin
g
Mai
n in
com
e de
rive
s fro
m
lives
tock
rear
ing.
Cro
p fa
rmin
g se
rves
mai
nly
as
prov
ider
of f
odde
r and
for
subs
iste
nce
Mai
n in
com
e de
rive
s fr
om th
e re
gula
r sal
e of
milk
and
/or e
ggs.
Crop
farm
ing
serv
es
mai
nly
as p
rovi
der o
f fo
dder
and
for
subs
iste
nce
Relia
nce
on fe
w fo
od o
r fr
uit c
rops
. Usu
ally
Mai
ze
and
bean
s lo
w d
egre
e of
follo
win
g a
spec
ific
stra
tegy
Sale
of m
any
diffe
rent
cr
ops a
nd fr
uits
at l
ow
quan
titie
s, ke
epin
g liv
esto
ck fo
r bot
h su
bsis
tenc
e an
d oc
casi
onal
sale
of
lives
tock
Optio
n 1:
Str
ong
relia
nce
on co
ffee
or k
hat p
rodu
ctio
n.
Optio
n 2:
Com
mer
cial
ized
ho
rtic
ultu
re
Food
and
Fru
it Cr
ops m
ainl
y fo
r su
bsis
tenc
e. L
ives
tock
for
occa
sion
al sa
les a
nd a
s pro
vide
r of
man
ure
Subs
iste
nce
farm
ing
Dive
rsifi
ed su
bsis
tenc
e fa
rmin
g (F
ood
Secu
rity
) Re
lianc
e on
mai
ze&
bean
s as s
tapl
e fo
od
Farm
ing
aim
s pri
mar
ily a
t rai
sing
the
hous
ehol
d’s f
ood
secu
rity
and
div
ersi
fyin
g th
e ho
useh
old
diet
. Liv
esto
ck
is k
ept f
or h
ighe
r sup
ply
of m
anur
e an
d fo
r im
prov
emen
ts in
the
diet
as w
ell a
s ass
et in
case
of
emer
genc
y
Farm
ing
aim
s at s
ecur
ing
the
nece
ssar
y am
ount
of
mai
ze a
nd b
eans
for t
he h
ouse
hold
. Occ
asio
nal
surp
luse
s are
sold
. lo
w d
egre
e of
follo
win
g a
spec
ific s
trat
egy
56
In order to achieve a monetary income from the little land available the farmers are
forced to either seek for wage labour or engage in high-profit ventures that can be
undertaken on little land:
1. Dairy production and zero-grazing livestock keeping 2. Horticulture 3. Miraa/Khat
When looking at the three options the required investments differ strongly. Prices for
milk cows are high and for many smallholder farmers not affordable and risky due to
diseases. Commercial horticulture requires access to irrigation water. Water pumps,
wells or ponds require investment capital which is hard to obtain. Consequently khat is
increasingly popular among the smallholders. Around 60% of the respondents of the
survey are active in khat farming and dedicate around 15% of their land to the khat
bushes.
Miraa, or Khat, is a stimulant drug that is chewed and has light effects of euphoria. It is
illegal in many regions of the world, e.g. in neighbouring Tanzania. In Kenya both
cultivation and consumption is legal. The market for khat is dominated by middlemen
who ship the product from the khat-growing regions to large markets in Nairobi,
Mombasa, etc. As the productivity of the khat bush varies strongly with the rain seasons,
the general productivity and therefore the price has extreme highs and lows. In the rainy
season prices can drop to as low as 20KES per kg, in the dry season prices can go up to
1200KES per kg. Averages in the rainy season are between 100 to 200 KES and in the
dry season anywhere between 400 and 800. Relatively small plots provide a regular
income for the household which positively influences food security. When looking at the
total farm income of the households that participated in the survey khat contributed
63.74%. Among the 59 khat farming households the khat income makes up for 75.49%
of the farmincome and 52.47% of the total household income.
57
Picture 5: Duncan Chege on the farm's khat plot (Arne Rieber 2018)
It is not only the investment cost but also the overall profitability of khat that leads to
higher engagement in khat production instead of horticulture. The khat income was in
many cases used to reinvest in the khat farming, e.g. irrigation sources. Market access
for khat is provided through middlemen. Due to the high competition in the khat
business the farmers gain relatively strong negotiation power which leads to a balanced
market.
Marketing strategies of horticultural produce Smallholder farmers use different ways to market their products, very much depending
on the market price and access to markets. Most farmers lack means of own transport
and need to rely on motorbike taxis and public service vehicles to transport their
produce to the markets. As soon as the cost of transportation exceeds the higher price
that can be achieved by directly selling to market vendors, brokers or middlemen come
into play. Especially on the fruit market the price per bag is too low to transport it to the
market and still achieve a profit which is why mango, avocado, papaya and banana are
mainly sold to middlemen.
The vegetable marketing is more complex. First of all, sales at the farm gate to people in
the neighbourhood do play a role and provide occasional small profits directly from the
farm. As the sale of vegetable is more profitable many farmers take the product to local
or regional markets, depending on the demand by the vendors on the market.
58
Smallholder farmers usually do not personally sell on the market. The third way of
selling is to brokers that are active in the region.
Table 2: Point of Sale (Data: Field Survey 2018)
Point of sale combined for food crops, vegetables and fruits (n=104)
Number of households Percentage of households
Direct sale to customers 52 50.00%
Broker/Middlemen 64 61.54%
Local produce market 25 24.04%
Regional produce market 37 53.58%
Sale to school (maize or beans in
return for lower school fees)
5 4.81%
Conclusion Agro-ecological zone and land constraints influence the business strategies of
smallholder farmers in Embu County.
Smallholder farmer’s participation on the fruit market is very low; the fruit production
is aimed at subsistence. The return per acre from fruits is too low to designate the little
land available to that venture.
The participation of smallholder farmers on the vegetable market is certainly higher
compared to fruits. However high investment costs to set up a source of water for
irrigation is challenging to the often resource poor farmers. On top, the overall
profitability per acre is lower compared to the farming of khat and market access is
challenging.
Khat therefore takes up land which could be utilized for food crops and fruits, directly
influencing the supply of fruits and vegetables in the region. From a household
perspective khat is a profitable venture with a regular income, supporting food security
and in many cases supports the education of the children. Khat is the driver of an
evolution of the prevalent farming system under land constraints in Embu County.
References DIXON, J. A., GIBBON, D. P., GULLIVER, A., & M. HALL (2001): Farming systems and poverty:
improving farmers' livelihoods in a changing world. FAO.
59
Have learnt about farming at an early age, I grew up in a family that adored farming,
through the guidance of my mother and mentorship that I have achieved this art of
farming, however it's until three 3 years ago that I quit profession hustle in journalism
and jumped into the murky waters of full time farming; organic farming of vegetables,
herbs and spices.
Contribution from the practice - Kabete Organic Gardens
PATRICK NZIOKA ONZERE
Photos: Cultivation and products of Kabete Organic Gardens (Patrick Onzere 2018)
60
Kabete Organic Gardens – Continuation
Why organic farming because I wanted to be able to provide healthy, clean, nutritious
and sweet food free from chemicals and synthetics fertilisers to myself and urban
dwellers (Nairobi capital) thus bringing back the culture of clean and healthy eating
lifestyle.
Organic farming is best crops, it reduces cost but increases quality of food, while organic
vegetables are pricey, they provide numerous health benefits that make them worth the
cost. All our products are sold either at the local organic markets, supermarkets,
grocery's or on our facebook page Kabete Organic Gardens at a fair market price equal to
regular vegetables or sometimes at a cheaper rate, too. This is because most don't have
organic section in their fresh produce section. Hoping in the near future they will have
one.
With the right farming methods we can increase the produce and make land more
fertile. In our efforts to enhance the quality, quantity and food safety, we Kabete Organic
Gardens have inducted organic farming methods by teaching and training other farmers
and key players in this sector. Though it been lucrative it doesn't lack challenges like
funding of the training , availability of clean water, availbility of land to lease but if we
can get assist in any of this I am sure it will play a big role into transforming organic
farming.
61
Market Garden farming A market garden is a farm or garden used for the production of crops for sale into the
market. Farmers in Market Gardens produce for sale using a number of processes to
enhance the efficiency of farm produce delivery to consumers (LIVINGSTONE 1958,
WILLIAMS 1976). The market gardens provide small-scale urban and peri-urban farmers
with opportunity to act as the producer, processor, distributor and final retailer. In
cases where the market gardener cannot perform the four functions, there is the
possibility of middlemen to connect the market gardener with the retail market
(JASDANWALLA 1977). Once the produce reaches the market, the market farmer cum
retailer is not obliged to specialize (FRENCH 1958), but may transact several wares-
vegetables and fruits, cereals, fuel sources, clothing, and many others, mainly to
overcome the rigid market structure and diversify the income base. According to FAO
(2011), retailing is one of the important areas for development within developing world
to promote and increase demand for small-scale agro-processing and peri-urban
products as nearly two-thirds of the urban and peri-urban population engage in
agriculture. Thus, securing market outlets is one of the important areas for
development in urban and peri-urban food security. Despite the many drivers to peri-urban retailing, peri-urban market farmer also faces a
number of challenges (for instance, the producers and consumers often get a poor deal,
while the middle men control the market; there is massive in stage determination in
quality and frequent mismatch between demand and supply both spatially and
temporally; lack of efficient marketing system and appropriate infrastructure results in
large post-harvest loses (due to perishability of vegetables and fruits) ); as well as lack
of information about market demands, sudden shortages and prices (ROHIT et al. 2017),
which require frequent innovation for sustainability in food security in urban and peri-
urban areas.
Retailing of fruits and vegetables in Machakos County, Peri-urban area of Nairobi Metropolitan Region
ALICE OLUOKO-ODINGO
62
Methodology The main objective of the study was to examine the typologies of the various fruit and
vegetable markets, their characteristics and the role of farm income and time and
distance to market in influencing fruit and vegetables retiling in peri-urban areas of
Nairobi City. Specific objectives were to:
Identify the various market typologies and characteristics of such markets (the areas/regions producing such crops and their geographical dispersal in different locations as an approach to find out which one dominates the market, which could indicate the price and other benefits. For instance, is one market preferred more than the others (something that could indicate market inefficiency).
Map out the spatial location of markets and factors determining the location of such markets
Investigate the role of farm income in influencing the retailing of fruits and vegetables in the study area
Study Time and Distance differentials regarding retailing of fruits and vegetables in the area.
Results and Findings
Market Typologies, Characteristics and Crops Some of the marketing channels for urban and peri-urban products include:
neighborhood markets (door-to-door distribution and community sales points),
Institutional or commercial sales (products are sold to health and youth centres, schools,
supermarkets and hotels, based on producer-consumer agreements, with organized
fewer associations). Some of the interventions for securing markets include: stimulating
consumer demand by highlighting the quality of origin of produce as well as the health
benefits of diversified diet (including fruits and vegetables); developing opportunities
for processed goods and in full compliance with rules for hygiene and quality standards;
intervening at school level, with nutrition education in conjunction with school garden
programmes to promote healthy diet. Open-air markets in peri-urban areas of Kenya are
the most convenient sources for fruits and vegetables for many households (CHERONO &
OTIENO 2016). A personal communication with FAO Programe Officer for Machakos
County in 2017 emphasized that special focus should be paid to market-driven
production (market gardens). He further recommended that crops should be vegetables
and fruits that can be harvested throughout the year (for instance kales, spinach,
63
coriander, amaranthus and indigenous vegetables (most preferred by middle class)).
Figure 1 and 2 show the location of various markets in Machakos County. Since most
markets were located in Institutional Lands, it is important to ask ‘what are the factors
determining the location of market gardens?
Figure 1: Crops, Market Gardens and Retailing (source: Field data)
0 5 10 15 20 25 30
Cow pea
Green Grams
Pumpkin
Kales
Managu
Tomatoes
Corriander
Mangoes
Avocadoes
Bananas
Spinach
Melons
Spider plant
Crops, Market Gardens and Retailing
PUBLIC OPEN SPACE HOME GARDENS
64
Figure 2: Typologies of Market gardens (source: Author)
Cow peas, onions, spider plant and tomatoes, Terere and Managu (indigenous
vegetables) were also popular. Most vegetables traveled for less than 1km though for
these popular crops, the distance is not an issue. The fruits and vegetables are located in
market gardens mostly 10km to 20 km away and relatively few traders handle them.
The position of Spinach and kales as the leading vegetable being retailed is
interchangeable, followed by, then cabbage, cow peas, onions, spider plant and
tomatoes.
.
65
Fruits and Vegetables Retailing versus Distance and Time The fruits and vegetables travel/ retail at 0 to 20 km. A majority are within 2-5 Km and
more than 20Km. The journey lasted from less than 10 minutes to over 2 hours (120
minutes). The fee ranging from Ksh. 20 to more than Ksh. 500, for instance, 70 percent
of the retailers paid more than Ksh. 500 for transport. About 25 percent paid between
Ksh. 200 and Ksh. 500. Markets located in Institutional lands (like the Kenya Meat
Commission) were the most popular and retailers traveled from below 1 km to over
20Km.
Retailing, Crops, Time and Distance The relationships in the between the Markets, Crops, Time and Distance, have been
summarized by the Author in Figure 3 below as follows:
Figure 3: Relationship between Markets, Crops and Time and Distance Differentials in marketing
(source: OLUOKO-ODINGO 2018)
66
According to OLUOKO-ODINGO (2018):
Home gardens are the Primary retail contacts with peri-urban farmers due to their availability, accessibility and minimal time-Distance relationships;
The number of Marketable crops (fruits, vegetables and cereals) decrease with increase in distance and time from the farm;
The most popular/marketable crop travels the longest distance and to close proximity with the urban fringe market;
The most marketable crops are sold irrespective of time-distance differentials, and;
These time-distance relationships in crop marketing (fruits, vegetables and cereals) can be modeled in the algebraic equation: Y=a + bX, where Y represents time taken to reach the market, a is constant (4.44), b is regression coefficient (2.78) and X is the distance between the farm and the market.
These relationships are very important in the development of new crop varieties that
would remain relevant for various markets irrespective of location. The model is also
useful in management of post-harvest losses by determining appropriate/strategic
locations for storage facilities, among other benefits. According to time-distance
differentials, Kales was the most retailed crop, followed by spinach, then managu.
Tomatoes, onions and cow peas scored the same, with the majority of the retailers
having an income of less than Ksh. 25,000 per month. Retailing of fruits is less common
than that of the vegetables.
67
Effects of Farm Income/Price on Retailing of fruits and vegetables
Figure 4: Retail of Crops versus Income (source: Field data)
Figure 5: Retail Time Frequency (source: Field data)
68
Table 1: Success stories and lessons (source: Field data Interviews with Retailers)
Retailer Success Story Lesson
1 Has good customer relations, has the products needed by the clients, has permanent customers that can get credit and so the sales have been increasing
It is good to have good relationships with customers
2 Located next to a petrol station, and with good branding, the shop is visible. The need for fast foods is also high
It is important to have good customer services and make the working place visible. Also add more services like wifi, TV, etc
3 They have been able to open 9 new branches in different locations
The organization is popular
4 From a small shop, opened a bigger shop and then much bigger shop, bought a plot and now wants to buy own track for transport
Sale of produce is a good business and one needs to be patient and consistent
5 The farmer has been able to pay school
fees and sustain her family Selling produce is a profitable business
6 The trader has been able to furnish her
house with household items The business is paying
7 Being the only source of income, the business has provided for basic needs- food, clothing shelter and school fees
Purchase commodities when in plenty and store and the final returns are good
8 Started with 3 branches and now has 42 branches- has created employment. There is great increase in consumption of farm produce
The organization is popular, with great growth
9 The business is not as it used to be in the past when we had great profits. It is now bad due to political instability in the country
When politics is stable in the country, there is stability in business. Businesses collapse when there is no stability
10 The business has grown from small to a big store
Never despise your humble beginnings
11 The profit made has helped increase stock, feeding family, educating siblings in high school and colleges and universities. The business had enabled me lead a descent life
In business, one has to be optimistic. Apart from success sometimes one fails to reach his/her targets and this should not discourage one from pushing on.
69
Table 2: Constraints and Market Strategies (source: Field data Interviews with Retailers)
Summary of findings and Conclusions The study has shown that Market gardens in Machakos County include Public Open
space, Home gardens, Institutional markets, Tins and Pots and Own farm, some being
very small and require further study with respect to their profitability. Home gardens
play a major role in peri-urban fruits and vegetables production, hence retailing, thus
showing an important policy area. Location of markets is determined by time and
distance to market, income from retailing and consistency in the supply of produce by
market gardens. There is no specific specialization as many retailers tend to sell several
products as was observed by JASDANWALLA (1977). Fruits and vegetables are retailed
with other crops, mostly cereals in different markets, and this could be to allow: a)
Income sources diversification and b) To deal with complex rigid structure of the market
as observed by FRENCH (1958). The most retailed crops are affordable to both low and
high income consumers. It is therefore possible to conclude that market farmers take
Retailer Constraint Facing the Challenge
1 Few customers, returns are low, poor working conditions during bad weather-sunny/rainy, people buy from vendors near home and not market
Transport cost is high, expand market, discourage suppliers from retailing products to safeguard traders in the market
2 Packaging bags
Improve on quality to attract customers, engage somebody to guard the produce
3 Price variation, sales go down depending on the season
-More farmers to engage in greenhouse production - Good storage facilities for perishables, selling products that are in high demand - Have quality products, diversify products for sale, only stock what consumers demand
4 Low turn up of customers, Suppliers fail to supply, Low prices due to competition
Required inputs and water supply to farmers is necessary. Transport costs to be reduced. More use of greenhouses
5 Transport during the rainy season
Purchase a lot of produce during harvesting and sell during low supply
70
their produce to markets with best retail price. The selected crops are those that retail
and provide the best returns, and the resultant price accommodates all the farmers’
expenses within the best profit margin.
References CHERONO, I. & D. J. OTIENO (2016): Peri-urban food traders’ preferences for open-air
market design and management attributes in Nairobi, Kenya. Invited Paper presented at the 5th International Conference of the African Association of Agricultural Economists, September 23-26, 2016, Addis Ababa, Ethiopia.
FAO (Food and Agricultural Organization of the United Nations) (2011): The Place of Urban and Peri-urban Agriculture (UPA) in National Food Security Programmes. Rome. FAO.
FRENCH, B. C. (1958): Discussions: Implications to Agricultural Marketing. In: Journal of Farm Economics, 40,(5): 1058-1056.
JASDANWALLA, Z. T. (1977): Efficient Agricultural Marketing. In: Economic and Political Weekly, 112, (53): A133+A135-A140.
LIVINGSTONE, M. D. A. (1938): Agricultural Marketing in India. In: Journal of the Royal Society of Arts, 86, (4477): 1029-1044.
OLUOKO-ODINGO, A. A. (2018): Peri-urban marketing and its constraints on Food security in Kenya, forthcoming.
ROHIT, J., DUBEY, S. K., SINGH, P., SINGH, B. K. & N. V. KUMBARE (2017): An Assessment of Constraints faced by the Farmers in Peri-urban Vegetable cultivation. In: International Journal of Current Microbiology and Applied Sciences, 16, (10): 2245-2251.
WILLIAMS, A. F. (1976): Themes in Agricultural marketing. In: Area, 8, (2): 131-132.
71
Introduction Kenya is one of the Countries in Africa that suffers from severe climate change impacts
and associated disasters which have negative consequences to food systems and
economy in general (FAO 2015). As these impacts intensify availability of production
assets become increasingly difficult due population pressure, diminishing land
resources, land degradation and competition over food production resources (especially
land and water) by different actors (KITEME & WIESMANN 2015). As resources for food
production dwindle, competition becomes prevalent resulting in resource use conflicts
especially in Kenya (OPIYO et al. 2012). Both gradual/slow and rapid risks may affect the
stability of ecological and social systems limiting the capacity of food systems to provide
food security and wellbeing for those who depend on it as well as negatively affecting
exports from horticulture sector which is a major source of foreign exchange. Generally,
risks can be grouped into: natural disasters, resource scarcity and environmental
variability (water scarcity, declining water quality, climate variability); social change
(demographic change, migration, urbanization, health risks, economic crisis);
institutional change (change of policies and legal frameworks); economic change (price
fluctuation), political change (politically instigated conflicts) (PERZ et al. 2010; AUBIN et
Social-ecological resilience of agroindustrial food system in Northwest Mt. Kenya Region
STELLAH MIKALITSA MUKHOVI
72
According to COLONNA et al. (2013), food systems “are interdependent networks of
stakeholders (companies, financial institutions and public and private organizations),
localized in a given geographical area (region, state, multinational region) participating
directly or indirectly in the creation of flow of goods and services geared towards
satisfying the food needs of one or more group of consumers, both locally and outside
the area considered.” There are several subsystems that make up food systems namely;
political sub-system (institutions and laws both hard and soft that affect food
production), information sub-system (access to information, logistical services,
research, extension), operational sub-system (day to day activities that for example a
farmer engages in to produce food) and natural sub-system (soils, water and energy)
(ESNOUF et al. 2013; COLONNA et al. 2013; ROBERTO et al. 2014). In the study area,
participatory mapping identified there main food systems, an agroindustrial food
system based on horticulture mainly for export, a regional food system based on meat,
dairy, wheat and barley value chains and a local food system comprising of smallholders
producing mainly maize, beans and potatoes for subsistence and local markets. The
concept of food systems has become important in the recent past because it allows an
understanding of the complexity of food cycles as interaction between the biophysical
and socio-cultural environments. Unlike the value chain approach that looks at activities
(production, transportation, processing and consumption), a food system approach
includes governance, food security and sustainability as important aspects. In addition,
Category Examples
Natural hazards Droughts, volcano eruptions, tsunami, fires and tropical storms.
Natural resource scarcity and environmental variability
Land degradation, climate variability and climate change, water scarcity, declining water quality, desertification
Social change and development issues policy and institutional change, migration, infrastructural development, urban socio-spatial transformation, economic crisis and uncertainty, health risks, regional economic transformation
Table 1: Socio-ecological Stressors of Food Systems (source: Adapted from KECK & SAKDAPOLRAK 2013)
73
food system approaches help us to understand competing priorities of actors and
tradeoffs between food systems components (TENDAL et al. 2015).
Several studies have looked at factors that promote resilience against risks and
disasters. They include; community connectedness (THORNLEY et al. 2015; BATCH et al.
2010), infrastructure (THORNLEY et al. 2015; HALLEGATTE 2009), support from
government agencies (ADGER 2000a), governance (RIST et al. 2007), and social protection
systems (HOLMES & BHUVANENDRA 2013). Other studies have looked at effects of
globalization (WINKEL et al 2016), livelihood resilience (TANNER et al. 2015; IFEJIKA
SPERANZA et al. 2014) and food sovereignty (SAGE 2014). This study looked at three
dimensions of resilience namely buffer capacity, self-organisation and learning and
adaptation in the context of agroindustrial food system and how it compares with other
food systems in the same region. Although resilience has been well studied in natural
ecosystems such as coral reefs and forests (NYSTROM et al. 2000; CHAPIN 2004), it has not
been widely used in food systems. Agroecosystems are as dynamic as natural systems
hence the importance of resilience also as a way of cushioning actors against risks and
maintaining provision of supplies of food, fodder and fibre, as well as incomes of rural
communities.
The study employed the food system resilience action cycle (TENDALL et al. 2015)
(Figure 1). The Cycle considers the fact that resilience is not a onetime event to deal with
one time shock but rather a process that consists of reactive actions (absorb, react,
restore, and learn) and preventive actions (build robustness). Preventive actions help
build capacity of food systems to deal with future shocks while while reactive actions
are more short term actions geared towards coping against shocks. Each action is
enabled by a capacity of the food system to absorb, build robustness, restore and
learning (TENDALL et al. 2015). The framework shows that it is not possible for a food
system to reach an optimal or perfect state but rather there is continuous improvement
on the system and sometimes very robust food systems may also become vulnerable as
new threats emerge.
74
Figure 1: Resilience Framework (source: TENDALL et al. 2015)
Food systems in Kenya like many parts of the world are affected by a myriad of risks
that necessitate efforts to build resilience through accumulation of livelihood assets
(buffer capacity), self–organization, and learning and adaptation-often referred to as
resilience dimensions in the literature (IFEJIKA SPERANZA et al. 2014). Sustainable food
system (SFS) is a food system that delivers food security and nutrition for all in such a
way that the economic, social and environmental bases to generate food security and
nutrition for future generations are not compromised (FAO-UNEP 2014). Food systems
are sustainable if they withstand, cope with and recover quickly from risks and shocks,
but also contribute to food security and reduction of poverty and inequality, and
negative environmental impacts. In this research, social-ecological resilience is one of
five pillars of food sustainability. Others include; reduction of poverty and inequality,
food security, right to food and environmental performance (Figure 2). Social-ecological
resilience has become an important indicator for food sustainability due to increasing
susceptibility of the food systems to a myriad of risks including global environmental
change (ERICKSEN 2008; IPCC 2007; FAO 2011). In addition, a resilience approach allows
us to identify risks facing food systems, the complex interactions between ecological and
social systems hence we contribute necessary information for developing policies on
learning and adaptation (SAGE 2014).
75
Figure 2: Pillars of food sustainability (source: RIST et al. 2016)
The agroindustrial food system in Kenya produces vegetables for export mainly, runner
beans, tender stem broccoli, sugar snaps, garden peas, fine beans/French beans and
snow peas. The shocks that face this food system include water shortages, droughts,
climate variability and change, strict export market standards, pests and diseases, price
fluctuation associated with fluctuating currency values among others. This food system
comprises both commercial companies and smallholder outgrowers who are contracted
to produce vegetables for export. The outgrowers and independent smallholders
producing for export face a myriad of challenges including limited farm size limitation of
2-3 acres (URLICH 2014) within which they have different enterprises such as dairying,
cash crop, food crops cultivation, horticulture production and aquaculture) on small
holding. The outgrowers also face challenges in terms of technology, logistics (storage
facilities, parkhouses, transportation and general limited infrastructure. There are
challenges related to capacity to meet Minimum Residue Levels, frequent droughts, high
cost of labour and limited extension service.
76
Materials and Methods The study was carried out in Northwest Mt. Kenya region, which is located on 00
7’North and latitudes 370 40’ East. Groups of at different stages of food systems parts of
Laikipia and Meru were included in the study (Figure 3). All these areas are drained by
River Ewaso Ngiro North. Participatory mapping during reconnaissance identified three
food systems in Kenya; agroindustrial based on horticulture (K1), regional based on
milk, beef, wheat and barley (K2), local food system comprising smallholder farmers
(K3) (Table 2). The food systems were defined following COLONNA et al. (2013).
The rainfall patterns in the area under study in Kenya (Figure 2) is largely influenced by
its proximity to Mount Kenya where rainfall drastically reduces as one moves away from
the mountain. The rainfall is highly variable and ranges between 400mm-2500mm per
annum, its largely bimodal with long rains between March-May and short rains October
-December (NEMA 2013). The population density varies with agro-ecological zone from
42 persons (Laikipia County) per square kilometer to 320 persons per square kilometer
(Meru County).
Data was collected by interviewing 5 managers of horticultural farms, Key informant
interviews involving National and County government officials dealing with resilient
building and NGOs, Focus Group Discussion (FGD) was conducted with a women group
bordering a horticulture farm, Other data came from interviews with five managers of
horticultural farms More information through interviews was obtained from
transporters and supermarkets.
Figure 3: Map of the study area (source: own map)
77
Table 2: Food Systems (source: own research)
*The study was done in two countries Kenya and Bolivia hence K stands for Kenya and the results presented in this study is for the agroindustrial food system in Kenya
Food systems Characteristics
Agro-industrial (K1*) horticulture
Production of vegetables for export to European markets
Regional (K2) Beef, milk, wheat
Products sold beyond county boundaries Beef produced by ranches and pastoralists and
to a small extent smallholders Milk largely produced by smallholders Wheat largely produced by large scale farmers
and smallholders Local food system (K3) smallholders farmers and local markets
Smallholders (maize, potatoes and beans) Products consumed at household level and
surplus to local market
78
Results Figure 4 shows resilience indicators rated for three different food systems in Kenya
from 0 (null) to 4 (very high). The agroindustrial got high scores in functioning feedback
mechanisms, knowledge of threats and opportunities, interest groups and physical
capital. Lowest scores were obtained in diversity of crops, local consumption of food
products and use of local and indigenous knowledge.
Figure 4: Resilience indicators rated for three different food systems in Kenya
from 0 (null) to 4 (very high) (source: own research)
79
Figure 5: Buffer Capacity of agroindustrial food system compared with other food systems
(source: own research)
With regard to buffer capacity (Figure 5), agroindustrial food system had the highest
score of 2.9. The food system performed very well in financial capital although medium
scores were identified regarding wage levels which were relatively low (KES 6,780/USD
66 for skilled workers; KES 5,436/USD 53 for unskilled workers). However a study by
Urlich (2014) observed that although the wages in this food system were low, there was
significant contribution to livelihoods in a region where alternative employment
opportunities were limited. Accompanying study among smallholders showed that in
5% of the 600 local households interviewed, at least one household member had
worked on a horticultural farm in the previous 12 months; and in another 12% of
households, at least one household member had worked as an outgrower. Additionally,
only 32% of the profit from this food system was captured locally while the retailers in
the global North captured 68% of the profit generated along the value chain for
exported green beans (TEUSCHER 2017). Although the agroindustrial food system had
high access to land and water resources, it had the highest carbon footprint due to
80
intensive use of agrochemicals. Additionally intensive irrigation of vegetables
contributed o high water abstraction and the downstream dwellers often blamed this
food system and floriculture to low water supply.
Figure 6: Self organization of agroindustrial food system compared with other food systems
(source: own research)
Several indicators were used to measure self –organisation (Figure 6). According to the
level of interaction/cooperation among actors, we found that actors in the
agroindustrial food system were the most socially self-organised, while those of the local
food system were the least socially self-organised. The actors in horticulture have their
own network and label representing growers, exporters and service providers, the
Fresh Produce Exporters Association of Kenya (FPEAK) and subscribe to other
standards including GlobalGAP, Fair for Life, EurepGAP, or MPS (MAUSCHA et al. 2006).
These standards guarantees safe production of vegetables, help build consumer
confidence, safeguard the market, improve quality of products, enhance workers safety
and welfare, protect the environment and promote good agricultural practices (MINOT
AND NGIGI 2003). Additionally, agroindustrial food system performed well in
81
decentralization and independence since there was direct linkages between the food
system and supermarkets especially in Europe and the input sources were quite
diversified. The study observed that there was exchange of labour and technology
between the agroindustrial and local food systems. The majority of the workers in the
agroindustrial food system are smallholders within the region, but there are also
migrants from other parts of the country. The most important technology transferred
was greenhouse farming and drip irrigation. However poor performance (low scores)
were obtained in social capital related to bargaining power of farm workers and small-
scale outgrower farmers. Low scores were also seen in local consumption of vegetables
from agroindustrial food systems due to its focus on production of non-traditional crops
such as broccoli hence contribution to local food security low. On the other hand,
landscape diversity on horticultural farms was high, since relatively small spaces were
used intensively. The agroindustrial food system scored highly regarding interest
groups (JACOBI et al. 2018).
Figure 7: Capacity for learning and adaptation of agroindustrial food system compared with other food
systems (source: own research)
82
One of the most important indicators of resilience is the capacity to learn and adapt to
changes. According to OSBAHR (2007), successful adaptation is a learned process in
which there is some form of communication through which information is passed.
Actors in food systems may learn from past mistakes and make informed decisions to
deal with future risks (ADGER 2000b; BERKES et al. 2003). Learning means taking stock of
past, present and potential risks; getting the right information, reflecting and innovating
practices and making decisions that reduce potential harm of risks (TSCHEKERT AND
DIETRICH 2010). Actors learn indigenous/local knowledge through interaction with
elders who pass on a wide range of knowledge including farming methods, weather
dynamics, management of pests and diseases, food preservation and processing among
others. The other form of knowledge is scientific and often learned through mass media
(radio, television, print), internet and extension services. This kind of knowledge is more
technical and is applied using certain procedures for instance use of chemicals, seeds,
machinery among others. The agroindustrial food system got highest individual
indicator scores for knowledge of threats and opportunities and functioning feedback
mechanisms (Figure 7). Several workshops were organized especially with regard to use
of agrochemicals to wage workers. For senior staff there was continuous upgrading of
skills. The single lowest score in agroindustrial food system was lack of existence and
use of local-traditional knowledge (BERKES et al. 2000) and production of crops largely
for external markets. Reflective and shared learning was highest in agroindustrial food
system due to high numbers of workshops.
Conclusion The food system resilience approach has a high potential to help cope with the shocks
and uncertainty facing food systems through building system robustness (buffer
capacity), self-organisation among actors, diversification of food system landscapes,
products, inputs and markets, and continuous learning, The agroindustrial food system
will continue to face risks hence acquiring knowledge of current and emerging risks and
opportunities to build resilience is crucial to ensure sustainability. The results show that
the smallholder farmers producing vegetables for export were at higher risks due to
limited capacities in terms of technology and access to information. There is need to
provide incentives for learning and exchange of skills between the companies and
smallholders. Additionally the global value chain faces challenges due to price
fluctuation the need to diversify markets and products in order to take advantage of the
83
local supermarkets where the demand is growing within the major cities. There is need
to enhance the resilience of wage labourers by ensuring provision of livable wages and
putting in place infrastructure for self-organisation as a way of cushioning them against
risks. The high intensity and frequency of risks – especially those associated with
climate change requires innovation towards disaster risk reduction and scaling up of
adaptation strategies that are already being implemented.
Acknowledgements This work was carried out within the Swiss Programme for Global Issues on
Development (r4d programme) funded by the Swiss Agency for Development and
Cooperation (SDC) and the Swiss National Science Foundation (SNSF) [Grant number
400540_152033].
References ADGER, W. N. (2000a): Institutional Adaptation to Environmental Risk under the
Transition in Vietnam. In: Annals of the Association of American Geographers, 90, (4): 738-758.
ADGER, W. N. (2000b): Social and ecological resilience: are they related? In: Progress in Human Geography, September 24, (3): 347-364.
ANDERIES, J. M., WALKER, B. H. & A. P. KINZIG (2006): Fifteen weddings and a funeral: case studies and resilience-based management. Ecology and Society 11(1): 21.
BERKES, F., COLDING, J. & C. FOLKE (2000): Rediscovery of Traditional Ecological Knowledge as Adaptive Management. In: Ecological Applications, 10, (5): 1251–1262.
CABELL, J. F. & M. OELOFSE (2012): An indicator framework for assessing agro ecosystem resilience. In: Ecology and Society, 17, (1): 18.
ESNOUF, C., RUSSEL, M. & N. BRICAS (Eds.) (2013): Food Systems Sustainability: Insights from duALIne. Cambridge University Press.
COLONNA, P., FOURNIE, S. AND J. TAIZARD (2013): Food Systems. In: ESNOUF, C., RUSSEL, M. & N. BRICAS (Eds.) (2013): Food Systems Sustainability: Insights from duALIne. Cambridge: Cambridge University Press.
ERICKSEN, P. J. (2008): What is the vulnerability of a food system to global environmental change? In: Ecology and Society, 13, (2): 14.
FAO (Food and Agricultural Organization of the United Nations) (2011): Climate change and food systems resilience in Sub-Saharan Africa. Food and Agriculture Organization of the United Nations. Rome.
FAO (2015): The impact of natural hazards and disasters on agriculture and food security and nutrition. A call for action to build resilient livelihoods. Food and Agriculture Organization of the United Nations. Rome.
84
IFEJIKA SPERANZA, C., WIESMANN, U. & S. RIST (2014): An indicator framework for assessing livelihood resilience in the context of social–ecological dynamics. In: Global Environmental Change, 28: 109-119.
IPCC (2007): Climate Change 2007 - Impacts, Adaption and Vulnerability. Contribution of Working Group II to the Fourth Assessment Report of the IPCC.
IPES (2015): The New Science of Sustainable Food Systems: Overcoming Barriers to Food Systems Reform. International Panel of Experts on Sustainable Food systems.
KITEME, B. & U. WIESMANN (2015): Integrative Sustainable Development in the Mount Kenya Region. In: EHRENSPERGER, A., OTT, C. & U. WIESMANN (eds.): Eastern and Southern Africa Partnership Programme: Highlights from 15 Years of Joint Action for Sustainable Development. Bern, Switzerland: Centre for Development and Environment (CDE), University of Bern, with Bern Open Publishing (BOP): 123–126.
KECK, M. & P. SAKDAPOLRAK (2013): What is Social resilience Lessons learned and way forward. In: Erkunde, 6, (1): 5–19.
OPIYO, F. E. O., WASONGA, O. V., SCHILLING, P. & S. M. MUREITHI (2012): Resource-based conflicts in drought prone North western Kenya: The drivers and mitigation mechanisms. In: Wudpecker Journal of Agricultural Research, 1, (11):442-453.
RIGOLOT, C., DE VOIL, P., DOUXCHAMPS, S., PRESTWIDGE, D., VAN WIJK, M., THORNTON, P. K., RODRIGUEZ, D., HENDERSON, B., MEDINA, D. & M. HERRERO (2017): Interactions between intervention packages, climatic risk, climate change and food security in mixed crop–livestock systems in Burkina Faso. In: Agricultural System, 151: 217-224.
RIST, S., GOLAY, C., BÜRGI BONANOMI, E., DELGADO BURGOA, F. M., KITEME, B. P., HALLER, T. & C. IFEJIKA SPERANZA (2016): Towards Food Sustainability: Reshaping the coexistence of different food systems in South America and Africa. Working Paper No. 1. Bern, Switzerland: Centre for Development and Environment (CDE), University of Bern.
SAGE, C. (2014): The transition movement and food sovereignty: From local resilience to global engagement in food system transformation. Journal of Consumer Culture, 14: 254-275.
TENDALL, D., JOERIN J., KOPAINSKY B., EDWARDS, P., SHRECK, A., LE, Q. B., KRUETLI, P., GRANT, M. & J. SIX (2015): Food system resilience: Defining the concept. In: Global Food Security, 6: 17-23.
URLICH, A. (2014): Export-Oriented Horticultural Production in Laikipia, Kenya: Assessing the Implications for Rural Livelihoods. In: Sustainability, 6, (1): 336-347
85
I just want to introduce our market that is Fig Tree Market which is located at Ngara in
Nairobi. Fig Tree Market started in December 2004. It is an open air market which
consists of all kinds of fruits and vegetables from all over the world. We do have daily
supplies so we do sell all fresh and we concentrate on organic produces. We serve all
sorts of consumers like foreigners (Embassies, United Nation workers, Government
Officials) and local Kenyans. Some traders here rent their shops at 3000 KSh per month
and others own them. Some produce we buy straight from the farmers and others we
buy in a traders market called Marigiti or Wakulima market and Muthurwa market.
About imports we buy at Highridge straight from the import company.
Photo: Shop booth (Salome Kaniu 2018)
Contribution from the practice - Fig Tree Market, Nairobi
SALOME KANIU
86
87
ARBEITSBERICHTE Geographisches Institut, Humboldt-Universität zu Berlin
ISSN 0947-0360
Heft 182 Holger Wilcke Transnationale Träume. Wie Bilder aus Europa Migrationsprozesse aus Ghana beeinflussen. Berlin 2014
Heft 183 Takashi Kasagami, Charles Vacher, Elmar Kulke, Lech Suwala (Hrsg.)
Japan - Bericht zur Hauptexkursion 2013. Berlin 2014.
Heft 184 Lech Suwala, Elmar Kulke (Hrsg.)
Bolivien – Bericht zur Hauptexkursion 2014. Berlin 2014
Heft 185 Hilmar Schröder, Philipp Schmeling (Hrsg.)
Tansania / Malawi - Bericht zur Hauptexkursion 2015. Berlin 2015
Heft 186 Madlen Krone, Gilbert M. Nduru, Maria C. Velte (Hrsg.)
Horticulture in the Mt. Kenya Region - Dynamics and Challenges in the Context of Globalization. Experiences of an Intercultural Study Project. Berlin 2016
Heft 187 Eva Fraedrich, Rita Cyganski, Ingo Wolf, Barbara Lenz (Hrsg.)
User perspectives on Autonomous Driving. A Use-Case-Study in Germany. Berlin 2016
Heft 188 Ilse Helbrecht, Ulrike Mackrodt, Sebastian Schlüter
Nutzungskonflikte im öffentlichen Raum und planerische Mediationsverfahren in Berlin Friedrichshain-Kreuzberg. Wissenschaftliche Begleitforschung zum Projekt local leben. Netzwerk für Standortlösungen. Berlin 2016
Heft 189 Jan Hachmann, Reinhard Kleßen (Hrsg.)
Studentischer Exkursionsführer - Physische Geographie der Harzregion. Berlin 2016
Heft 190 Henning Füller, Ilse Helbrecht (Hrsg.)
Städtische Transitionen Athen und Thessaloniki – Empirie und Methodendiskussion im Rahmen der Hauptexkursion Griechenland 2016. Berlin 2016
Heft 191 Lech Suwala, Elmar Kulke (Hrsg.)
Hispaniola (Haiti, Dominikanische Republik) - Bericht zur Hauptexkursion 2015, Berlin 2016
Heft 192 Isabella Stingl, Simon A. Wieland (Hrsg.)
Die Governance von Rechten irregulärer Migrant_innen in der Stadt – Eine Analyse am Beispiel der medizinischen Versorgung in Berlin. Berlin 2017
Heft 193 Charlotte Räuchle, Isabella Stingl, Henning Nuissl
Migrantische Ökonomien als Potential für die Stadt- und Regionalentwicklung. Berlin 2017
Heft 194 Lech Suwala, Elmar Kulke (Hrsg.)
Südliches Afrika (Südafrika, Mosambik, Swasiland, Lesotho) – Bericht zur Hauptexkursion 2016. Berlin 2017
Heft 195 Lech Suwala, Elmar Kulke, Kay Gade (Hrsg.)
Zentralamerika (Nicaragua, Honduras, Guatemala, Belize) – Bericht zur Hauptexkursion 2017. Berlin 2018
Heft 196 Lech Suwala, Elmar Kulke, Juhl Jörgensen (Hrsg.)
Zentralasien (Kirgistan, Kasachstan, Tadschikistan, Usbekistan) – Bericht zur Hauptexkursion 2018. Berlin 2019.
Heft 197 Julia Fülling, Linda Hering (Hrsg.)
Markt – Quartier – Milieu Der Berliner Lebensmitteleinzelhandel aus interdisziplinärer Perspektive. Berlin 2020.