45
Arthropod Borne Viruses In Indonesia Fadel Muhammad Garishah, M.D.
| Date post: | 15-Apr-2017 |
| Category: |
Health & Medicine |
| Upload: | fadel-muhammad-garishah |
| View: | 108 times |
| Download: | 0 times |

ArthropodBorneVirusesInIndonesiaFadelMuhammadGarishah,M.D.

Arthropod-BorneViruses
¨ Comprises500differentviruses¨ Vectors
¤ Mosquitoes:Aedesaegyp*;A.albopictus¤ Ticks¤ Sandflies
¨ Lifecycleinvolvinghostbloodandvector’sgut¨ Transmissionfrominfectedpersontohealthypersonviavector
¨ Trans-ovarialtransmissionoccursinvectorslifecycle¨ Diseases:Fever,arthriJs,arthralgia,rash,hemorrhages,plasmaleakage,meningiJs,encephaliJs,meningoencephaliJs,

Iden3fiedARBOvirusesinIndonesia
¨ DengueVirus¨ ChikungunyaVirus¨ JapaneseEncephaliJsVirus¨ ZikaVirus

1.DengueVirusInfec3on
¨ ThemostspreadingArbovirusallovertheworld¨ 50millionsinfecJonsannuallywith2.5billionpeoplelivinginendemicarea
Chapter 1: Epidemiology, burden of disease and transmission
3
CH
APTER 1
CHAPTER 1. EPIDEMIOLOGY, BURDEN OF DISEASE AND TRANSMISSION
1.1 DENGUE EPIDEMIOLOGY
Dengue is the most rapidly spreading mosquito-borne viral disease in the world. In the last 50 years, incidence has increased 30-fold with increasing geographic expansion to new countries and, in the present decade, from urban to rural settings (Figure 1.1). An estimated 50 million dengue infections occur annually (Figure 1.2) and approximately 2.5 billion people live in dengue endemic countries (1). The 2002 World Health Assembly resolution WHA55.17 (2) urged greater commitment to dengue by WHO and its Member States. Of particular signifi cance is the 2005 World Health Assembly resolution WHA58.3 on the revision of the International Health Regulations (IHR) (3), which includes dengue as an example of a disease that may constitute a public health emergency of international concern with implications for health security due to disruption and rapid epidemic spread beyond national borders.
Figure 1.1 Countries/areas at risk of dengue transmission, 2008
Data Source: World Health Organization Map Production: Public Health Infrmation and Geographic Information Systems (GIS) World Health Organization
The boundaries and names shown and the designations used on this map do not imply the expression of any opinion whatsoever on the part of the World Health Organization concerning the legal status of any country, territory, city or area or of its authorities, or concerning the delimitation of its frontiers or boundaries. Dotted lines or maps represent approximate border lines for which there may not yest be fi ll agreement.
countries or areas at risk (As of 1 November 2008)
The contour lines of the January and July isotherms indicate the potential geographical limits of the northern and southern hemispheres for year-round survival of Adeas aegypti, the principal mosquito vector of dengue viruses.
July isotherm
10.C
January isotherm
10.C
© World Health Organization 2008

ClinicalManifesta3ons
Chapter 1: Epidemiology, burden of disease and transmission
11
CH
APTER 1
severe dengue cases which did not fulfi l the strict criteria of DHF, led to the request for the classifi cation to be reconsidered. Currently the classifi cation into DF/DHF/DSS continues to be widely used. (29) A WHO/TDR-supported prospective clinical multicentre study across dengue-endemic regions was set up to collect evidence about criteria for classifying dengue into levels of severity. The study fi ndings confi rmed that, by using a set of clinical and/or laboratory parameters, one sees a clear-cut difference between patients with severe dengue and those with non-severe dengue. However, for practical reasons it was desirable to split the large group of patients with non-severe dengue into two subgroups -- patients with warning signs and those without them. Criteria for diagnosing dengue (with or without warning signs) and severe dengue are presented in Figure 1.4. It must be kept in mind that even dengue patients without warning signs may develop severe dengue.
Expert consensus groups in Latin America (Havana, Cuba, 2007), South-East Asia (Kuala Lumpur, Malaysia, 2007), and at WHO headquarters in Geneva, Switzerland in 2008 agreed that:
“dengue is one disease entity with different clinical presentations and often with unpredictable clinical evolution and outcome”;
the classifi cation into levels of severity has a high potential for being of practical use in the clinicians’ decision as to where and how intensively the patient should be observed and treated (i.e. triage, which is particularly useful in outbreaks), in more consistent reporting in the national and international surveillance system, and as an end-point measure in dengue vaccine and drug trials.
Figure 1.4 Suggested dengue case classifi cation and levels of severity
Probable denguelive in /travel to dengue endemic area. Fever and 2 of the following criteria:
Laboratory-confi rmed dengue(important when no sign of plasma leakage)
Warning signs*
concurrent with rapid decrease in platelet count
*(requiring strict observation and medical intervention)
Severe plasma leakageleading to:
distress
Severe bleedingas evaluated by clinician
Severe organ involvement
CRITERIA FOR DENGUE ± WARNING SIGNS CRITERIA FOR SEVERE DENGUE
DENGUE ± WARNING SIGNS SEVERE DENGUE
1. Severe plasma leakage2. Severe haemorrhage3.Severe organ impairmentwithout
with warning signs
Virology
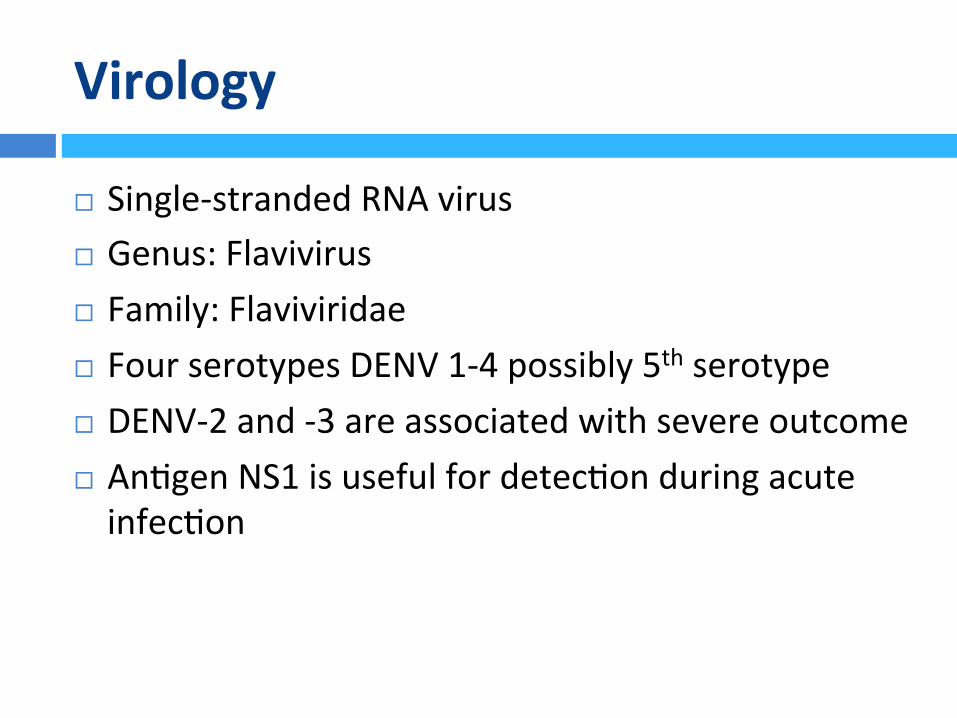
¨ Single-strandedRNAvirus¨ Genus:Flavivirus¨ Family:Flaviviridae¨ FourserotypesDENV1-4possibly5thserotype¨ DENV-2and-3areassociatedwithsevereoutcome¨ AnJgenNS1isusefulfordetecJonduringacuteinfecJon

VectorBiology
¨ Aedesaegyp*andAedesalbopictus¨ Breedingincleanwatersites¨ BloodhunJngmorning-day

Infec3ousDiseaseMedicine
¨ IncubaJon4-10days¨ Feverassociatedwithheadache,nausea,vomitus,abdominalpain,andrash(DengueFever)
¨ Thrombocytopeniaandleukopenia¨ PlateletfuncJonalteraJonsandcoagulaJonsystemdisordersleadingtobleeding;endothelialdisrupJoncausingplasmaleakage(DengueHemorrhagicFever)
¨ iffollowedbyhypotensiveleadingtodengueshocksyndrome
ClinicalCourse
25
Chapter 2: Clinical management and delivery of clinical services
CH
APTER 2
CHAPTER 2. CLINICAL MANAGEMENT AND DELIVERY OF CLINICAL SERVICES
2.1 OVERVIEW
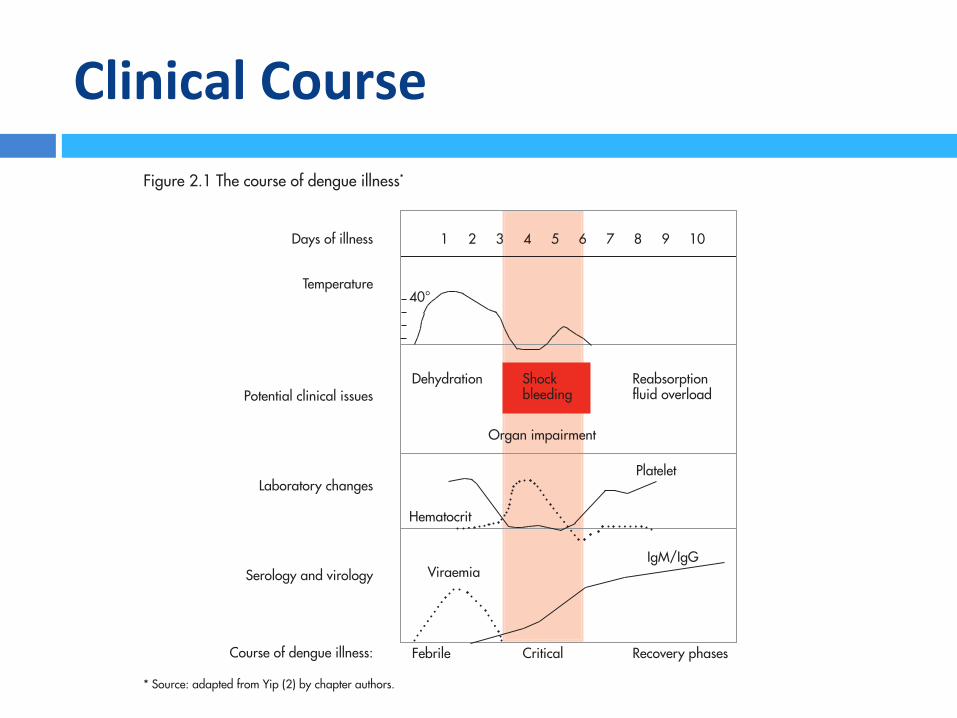
Dengue infection is a systemic and dynamic disease. It has a wide clinical spectrum that includes both severe and non-severe clinical manifestations (1). After the incubation period, the illness begins abruptly and is followed by the three phases -- febrile, critical and recovery (Figure 2.1).
For a disease that is complex in its manifestations, management is relatively simple, inexpensive and very effective in saving lives so long as correct and timely interventions are instituted. The key is early recognition and understanding of the clinical problems during the different phases of the disease, leading to a rational approach to case management and a good clinical outcome. An overview of good and bad clinical practices is given in Textbox A.
Activities (triage and management decisions) at the primary and secondary care levels (where patients are fi rst seen and evaluated) are critical in determining the clinical outcome of dengue. A well-managed front-line response not only reduces the number of unnecessary hospital admissions but also saves the lives of dengue patients. Early notifi cation of dengue cases seen in primary and secondary care is crucial for identifying outbreaks and initiating an early response (Chapter 5). Differential diagnosis needs to be considered (Textbox B).
Figure 2.1 The course of dengue illness*
Days of illness
Temperature
Potential clinical issues
Laboratory changes
Serology and virology
Dehydration Shock Reabsorption bleeding fl uid overload
1 2 3 4 5 6 7 8 9 10
Organ impairment
Hematocrit
Platelet
ViraemiaIgM/IgG
Febrile Critical Recovery phasesCourse of dengue illness:
40°
* Source: adapted from Yip (2) by chapter authors.

Pathobiology
¨ OriginalanJgenicsinleadstocytokinestormcausingplasmaleakage
¨ Non-neutralizinganJbody(fromperviousinfecJon)leadstoADE
¨ AnJbody-dependentenhancement(ADE)leadstomassiveviralreplicaJonandassociatedwithseveresymptoms
¨ ConsumpJveplatelet,alteraJonofplateletandcoagulaJonfactorsfuncJon,leadingtobleeding

NS1MediatesPlasmaLeakage(?)

Clinical
27
Chapter 2: Clinical management and delivery of clinical services
CH
APTER 2
these patients, changes in the full blood count should be used to guide the onset of the critical phase and plasma leakage.
Those who deteriorate will manifest with warning signs. This is called dengue with warning signs (Textbox C). Cases of dengue with warning signs will probably recover with early intravenous rehydration. Some cases will deteriorate to severe dengue (see below).
2.1.3 Recovery phase
If the patient survives the 24–48 hour critical phase, a gradual reabsorption of extravascular compartment fluid takes place in the following 48–72 hours. General well-being improves, appetite returns, gastrointestinal symptoms abate, haemodynamic status stabilizes and diuresis ensues. Some patients may have a rash of “isles of white in the sea of red” (9). Some may experience generalized pruritus. Bradycardia and electrocardiographic changes are common during this stage.
The haematocrit stabilizes or may be lower due to the dilutional effect of reabsorbed fluid. White blood cell count usually starts to rise soon after defervescence but the recovery of platelet count is typically later than that of white blood cell count.
Respiratory distress from massive pleural effusion and ascites will occur at any time if excessive intravenous fluids have been administered. During the critical and/or recovery phases, excessive fluid therapy is associated with pulmonary oedema or congestive heart failure.
The various clinical problems during the different phases of dengue can be summarized as in Table 2.1.
Table 2.1 Febrile, critical and recovery phases in dengue
1 Febrile phase Dehydration; high fever may cause neurological disturbances and febrile seizures in young children
2 Critical phase Shock from plasma leakage; severe haemorrhage; organ impairment
3 Recovery phase Hypervolaemia (only if intravenous fluid therapy has been excessive and/or has extended into this period)
2.1.4 Severe dengue
Severe dengue is defined by one or more of the following: (i) plasma leakage that may lead to shock (dengue shock) and/or fluid accumulation, with or without respiratory distress, and/or (ii) severe bleeding, and/or (iii) severe organ impairment.
As dengue vascular permeability progresses, hypovolaemia worsens and results in shock. It usually takes place around defervescence, usually on day 4 or 5 (range days 3–7) of illness, preceded by the warning signs. During the initial stage of shock, the compensatory mechanism which maintains a normal systolic blood pressure also produces tachycardia and peripheral vasoconstriction with reduced skin perfusion,

ApproachtoPa3entwithdengue
30
Dengue: Guidelines for diagnosis, treatment, prevention and control
Table 2.2 A stepwise approach to the management of dengue
Step I. Overall assessment
I.1 History, including information on symptoms, past medical and family history
I.2 Physical examination, including full physical and mental assessment
I.3 Investigation, including routine laboratory and dengue-specific laboratory
Step II. Diagnosis, assessment of disease phase and severity
Step III. Management
III.1 Disease notification
III.2 Management decisions. Depending on the clinical manifestations and other circumstances, patients may:
– be sent home (Group A);
– be referred for in-hospital management (Group B);
– require emergency treatment and urgent referral (Group C).
Section 2.3 gives treatment recommendations for the groups A–C.
2.2.3 Referral centres
Referral centres receiving severely ill dengue patients must be able to give prompt attention to referred cases. Beds should be made available to those patients who meet the admission criteria, even if elective cases have to be deferred. If possible, there should be a designated area to cohort dengue patients, and a high-dependency unit for closer monitoring of those with shock. These units should be staffed by doctors and nurses who are trained to recognize high-risk patients and to institute appropriate treatment and monitoring.
A number of criteria may be used to decide when to transfer a patient to a high-dependency unit. These include:
– early presentation with shock (on days 2 or 3 of illness); – severe plasma leakage and/or shock; – undetectable pulse and blood pressure; – severe bleeding; – fluid overload; – organ impairment (such as hepatic damage, cardiomyopathy, encephalopathy, encephalitis and other unusual complications).
2.2.4 Resources needed
In the detection and management of dengue, a range of resources is needed to deliver good clinical services at all levels. Resources include (10):
Human resources: The most important resource is trained doctors and nurses. Adequate health personnel should be allocated to the first level of care to help in triage and emergency management. If possible, dengue units staffed by

Diagnos3cs
¨ VirusdetecJon(SEM,PCR)¨ AnJgendetecJon(NS1ELISA/Rapidtest)¨ AnJbodydetecJon(HAI,ELISA,rapidtest)¨ Sonographyforascites¨ RLDCXRforpleuraleffusion(PEI>5%(+))
Nature Reviews | Microbiology
Direct methods Indirect methods
SerologyIgM
SerologyIgG
Genomedetection
Virusisolation
Antigendetection
OpportunitySpecificity
mortality. Recent developments in rapid detection technologies offer the promise of improved diagnostics for case manage-ment and the early detection of dengue outbreaks.
The characteristics of an ‘ideal’ dengue diagnostic test depend on the purpose for which the test will be used. BOX 1 shows some proposed product specifications for diagnostic tests that could be used for case management, surveillance and outbreak investigations, and vaccine trials5. The optimal window for diagnosing a dengue infection is roughly from the onset of fever to 10 days post-infection; however, as not all patients are diagnosed within this period, an ideal diagnostic test should be sensi-tive regardless of the stage of infection. Laboratory confirmation of dengue infec-tion relies on isolation of the virus in cell culture, the identification of viral nucleic acid or antigens, or the detection of virus-specific antibodies6. The relative merits of the different diagnostic tests and their optimal time frame for use are summarized in FIGS 1,2.
Direct virus detection could potentially be used for early, definitive and serotype-specific identification of dengue infections during the acute phase of the disease. Live virus or virus components (RNA or anti-gens) can be detected in serum, plasma, whole blood and infected tissues from 0–7 days following the onset of symptoms, which corresponds roughly to the duration of fever. Direct virus detection procedures are not routinely performed by laboratories, and few commercial kits that have been independently validated are available to aid in this area of dengue diagnosis.
Serological tests are more commonly used to diagnose dengue infections because of their ease of use compared to techniques such as cell culture or RNA detection. Different patterns of antibody responses are observed when patients experience a first (primary) or subsequent (secondary) dengue infection. In primary infections, immuno-globulin M (IgM) is detected 5 or more days after the onset of illness in the majority of infected individuals and immunoglobulin G (IgG) is detected from 10–15 days. In secondary infections, IgM appears earlier or in the same time frame but are usually at lower titres than in primary infection. IgG is present from the previous infection and the titre increases rapidly. Haemagglutination inhibition (HAI) antibody titres in primary infections peak at 1:640 whereas titres of 1:1280 or greater are common in secondary infections7.
Several rapid diagnostic tests are com-mercially available and many in-house assays have been developed but the performance characteristics of many of these tests have not been adequately evaluated. The need for a validated diagnostic test for dengue virus infection for clinical and epidemiological use was recommended by the International Expert Meetings on dengue diagnostics held at the WHO in Geneva in October 2004 and April 2005. The purpose of this guide is to establish best practice guidelines for how to design and conduct evaluations of dengue diagnostic tests for the management of acute infections, surveillance and monitoring of interventions.
I. CURRENT LABORATORY METHODS FOR DENGUE DIAGNOSISThe tests that are currently used in the labo-ratory diagnosis of dengue infections, and their advantages and limitations, are shown in TABLE 1.
1. Virus detectionDengue virus can be isolated by the inocula-tion of diagnostic samples into mosquitoes, cell culture (using mosquito cell lines, such as C6/36 and AP61 or mammalian cell lines, such as Vero and LLC-MK2 cells) or intra-cerebral inoculation of suckling mice. Whole blood, serum or plasma is collected from patients during the acute phase of the disease or from tissues in fatal cases (dengue virus has also been isolated from liver, spleen, lymph nodes and other tissues). There is evidence that the virus isolation rates from whole blood are considerably higher than the isolation rates from serum or plasma8. For virus serotype identification, immun-ofluorescent assays using serotype-specific monoclonal antibodies (mAbs) are used.
2. Viral RNA detectionDengue viral RNA can be detected using a nucleic acid amplification test (NAAT) on tissues, whole blood or sera taken from patients in the acute phase of the disease. Various protocols have been developed that identify dengue viruses using prim-ers directed to serotype-specific regions of the genome9–11. Nested PCR techniques improve the sensitivity of detection because the initial amplification product is used as the target for a second round of amplifica-tion. However, it is crucial that laboratories performing nested PCT take every precau-tion to prevent false-positive results that can occur as a result of contamination. In situ PCR can be carried out on tissue slides.
3. Antigen detection3.1. NS1-based assays. A simplified method of diagnosis during the acute stage of den-gue infection compared to viral isolation or nucleic acid detection is the detection of viral antigens in the bloodstream; however, antigen detection in the acute stage of sec-ondary infections can be compromised by pre-existing virus–IgG immunocomplexes.
New developments in enzyme-linked immunosorbent assay (ELISA) and rapid immunochromographic assays that target non-structural protein 1 (NS1) have shown that high concentrations of this antigen can be detected in patients with primary and secondary dengue infections up to 9 days after the onset of illness12. NS1 is synthe-sized by all flaviviruses and is secreted from infected mammalian cells. The presence of secreted NS1 (sNS1) in the bloodstream stimulates a strong humoral response. Many studies have investigated the utility of sNS1 detection as a diagnostic tool during the acute phase of a dengue infection.
Figure 1 | Comparative merits of direct and indirect laboratory methods for the diagnosis of dengue infections. Opportunity refers to the fact that antibody testing is usually the most practical diagnostic option available.
EVALUATING DIAGNOSTICS | DENGUE
NATURE REVIEWS | MICROBIOLOGY DECEMBER 2010 | S31
© 20 Macmillan Publishers Limited. All rights reserved10

37
Chapter 2: Clinical management and delivery of clinical services
CH
APTER 2
Figure 2.2 Algorithm for fluid management in compensated shock
Compensated shock (systolic pressure maintained but has signs of reduced perfusion)
Fluid resuscitation with isotonic crystalloid 5–10 ml/kg/hr over 1 hour
IV crystalloid 5–7 ml/kg/hr for 1–2 hours, then: reduce to 3–5 ml/kg/hr for 2–4 hours; reduce to 2–3 ml/kg/hr for 2–4 hours.
If patient continues to improve, fluid can be further reduced.
Monitor HCT 6–8 hourly.
If the patient is not stable, act according to HCT levels:if HCT increases, consider bolus fluid administration or increase fluid administration;if HCT decreases, consider transfusion with fresh whole transfusion.
Stop at 48 hours.
NO YES
HCT or high HCT
Administer 2nd bolus of fluid
10–20 ml/kg/hr for 1 hour
Consider significant occult/overt bleed
Initiate transfusion with fresh whole blood
NO YES
If patient improves, reduce to 7–10 ml/kg/hr for 1–2 hours
Then reduce further
Improvement
Check HCT
Improvement
HCT = haematocrit
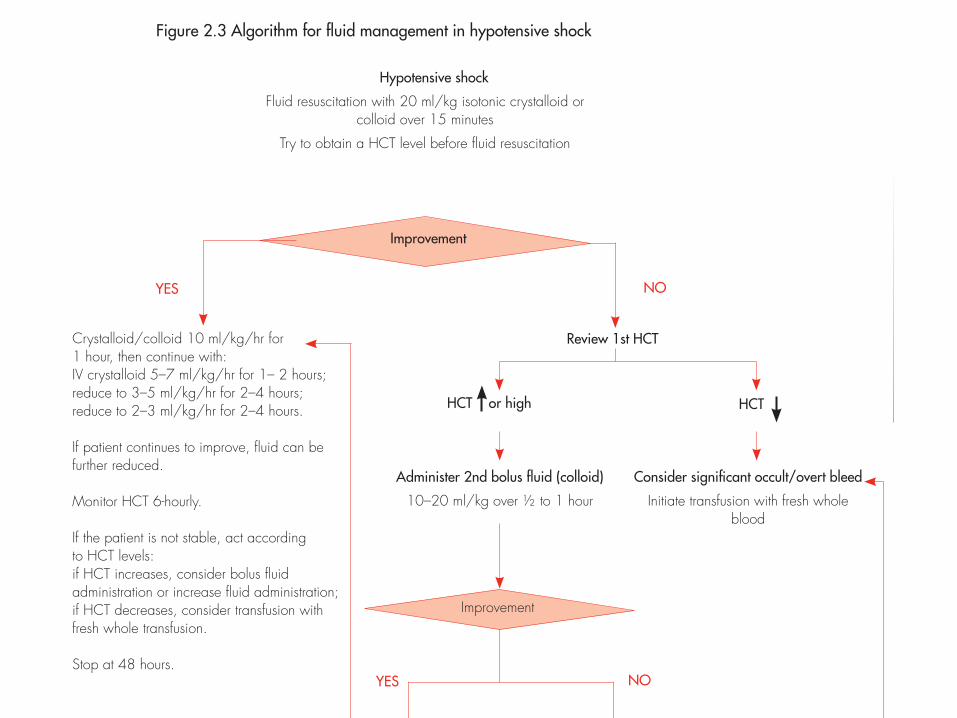
Patients with hypotensive shock should be managed more vigorously. The action plan for treating patients with hypotensive shock is as follows (Textboxes D and N, Figure 2.3):
available) at 20 ml/kg as a bolus given over 15 minutes to bring the patient out of shock as quickly as possible.
kg/hr for one hour. Then continue with crystalloid infusion and gradually reduce to 5–7 ml/kg/hr for 1–2 hours, then to 3–5 ml/kg/hr for 2–4 hours, and then
39
Chapter 2: Clinical management and delivery of clinical services
CH
APTER 2
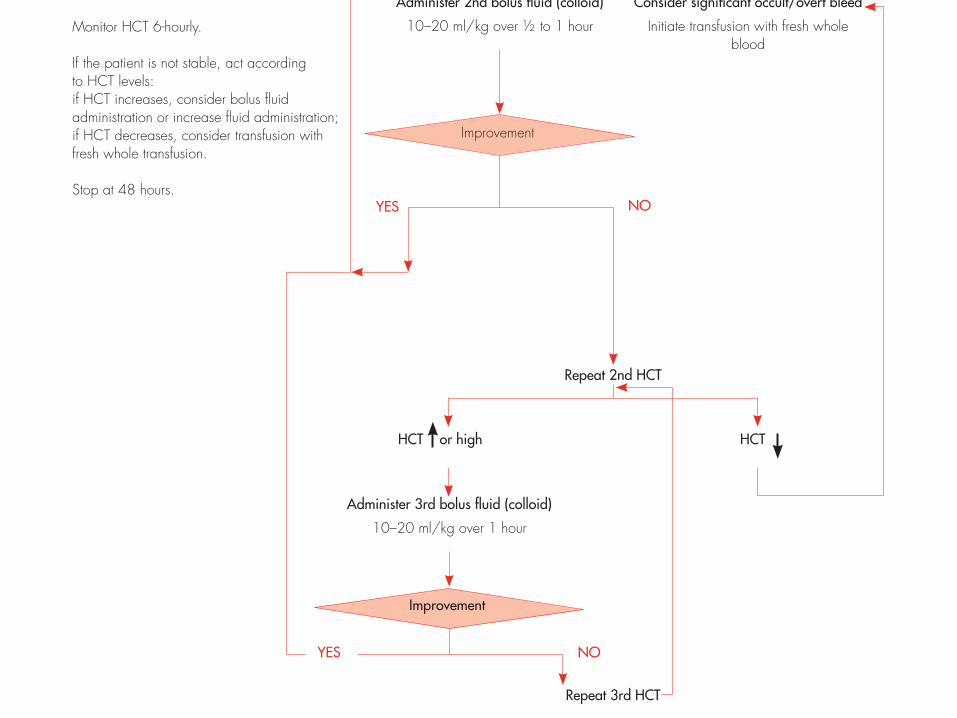
Figure 2.3 Algorithm for fluid management in hypotensive shock
Hypotensive shock
Fluid resuscitation with 20 ml/kg isotonic crystalloid or colloid over 15 minutes
Try to obtain a HCT level before fluid resuscitation
Crystalloid/colloid 10 ml/kg/hr for 1 hour, then continue with: IV crystalloid 5–7 ml/kg/hr for 1– 2 hours;reduce to 3–5 ml/kg/hr for 2–4 hours;reduce to 2–3 ml/kg/hr for 2–4 hours.
If patient continues to improve, fluid can be further reduced.
Monitor HCT 6-hourly.
If the patient is not stable, act according to HCT levels:if HCT increases, consider bolus fluid administration or increase fluid administration;if HCT decreases, consider transfusion with fresh whole transfusion.
Stop at 48 hours.
NO YES
HCT or high HCT
Administer 2nd bolus fluid (colloid)
10–20 ml/kg over ½ to 1 hour
Consider significant occult/overt bleed
Initiate transfusion with fresh whole blood
NO YES
Improvement
Review 1st HCT
Improvement
HCT or high HCT
Repeat 2nd HCT
Administer 3rd bolus fluid (colloid)
10–20 ml/kg over 1 hour
Improvement
NO YES
Repeat 3rd HCT
39
Chapter 2: Clinical management and delivery of clinical services
CH
APTER 2
Figure 2.3 Algorithm for fluid management in hypotensive shock
Hypotensive shock
Fluid resuscitation with 20 ml/kg isotonic crystalloid or colloid over 15 minutes
Try to obtain a HCT level before fluid resuscitation
Crystalloid/colloid 10 ml/kg/hr for 1 hour, then continue with: IV crystalloid 5–7 ml/kg/hr for 1– 2 hours;reduce to 3–5 ml/kg/hr for 2–4 hours;reduce to 2–3 ml/kg/hr for 2–4 hours.
If patient continues to improve, fluid can be further reduced.
Monitor HCT 6-hourly.
If the patient is not stable, act according to HCT levels:if HCT increases, consider bolus fluid administration or increase fluid administration;if HCT decreases, consider transfusion with fresh whole transfusion.
Stop at 48 hours.
NO YES
HCT or high HCT
Administer 2nd bolus fluid (colloid)
10–20 ml/kg over ½ to 1 hour
Consider significant occult/overt bleed
Initiate transfusion with fresh whole blood
NO YES
Improvement
Review 1st HCT
Improvement
HCT or high HCT
Repeat 2nd HCT
Administer 3rd bolus fluid (colloid)
10–20 ml/kg over 1 hour
Improvement
NO YES
Repeat 3rd HCT

Overfluidmanagements
¨ Furosemide0.1-0.5mg/kg/dose1-2Jmesaday
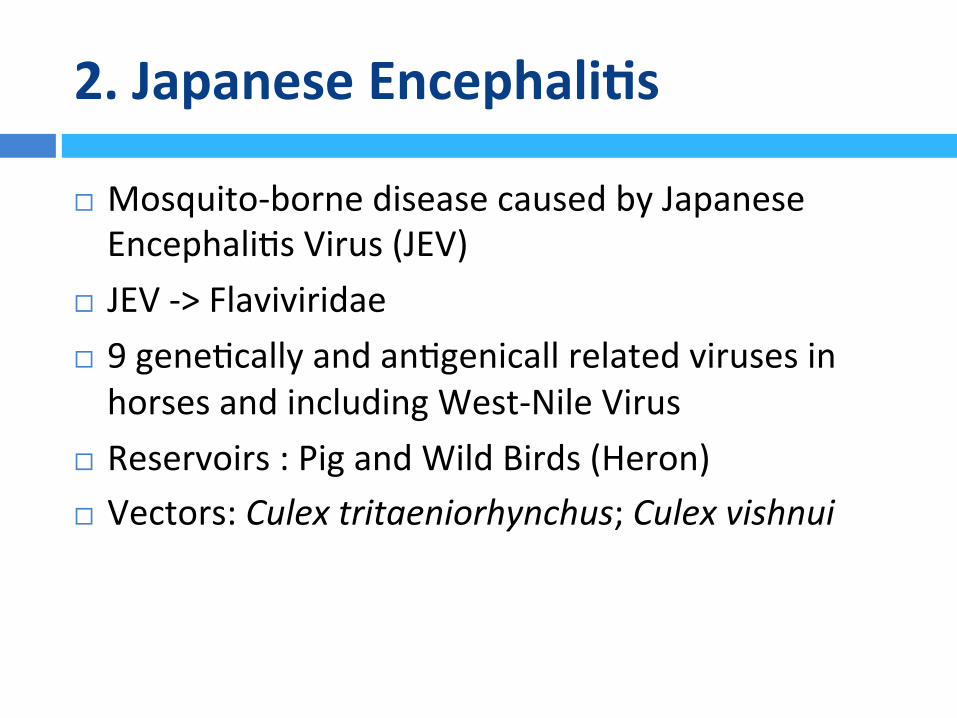
2.JapaneseEncephali3s
¨ Mosquito-bornediseasecausedbyJapaneseEncephaliJsVirus(JEV)
¨ JEV->Flaviviridae¨ 9geneJcallyandanJgenicallrelatedvirusesinhorsesandincludingWest-NileVirus
¨ Reservoirs:PigandWildBirds(Heron)¨ Vectors:Culextritaeniorhynchus;Culexvishnui
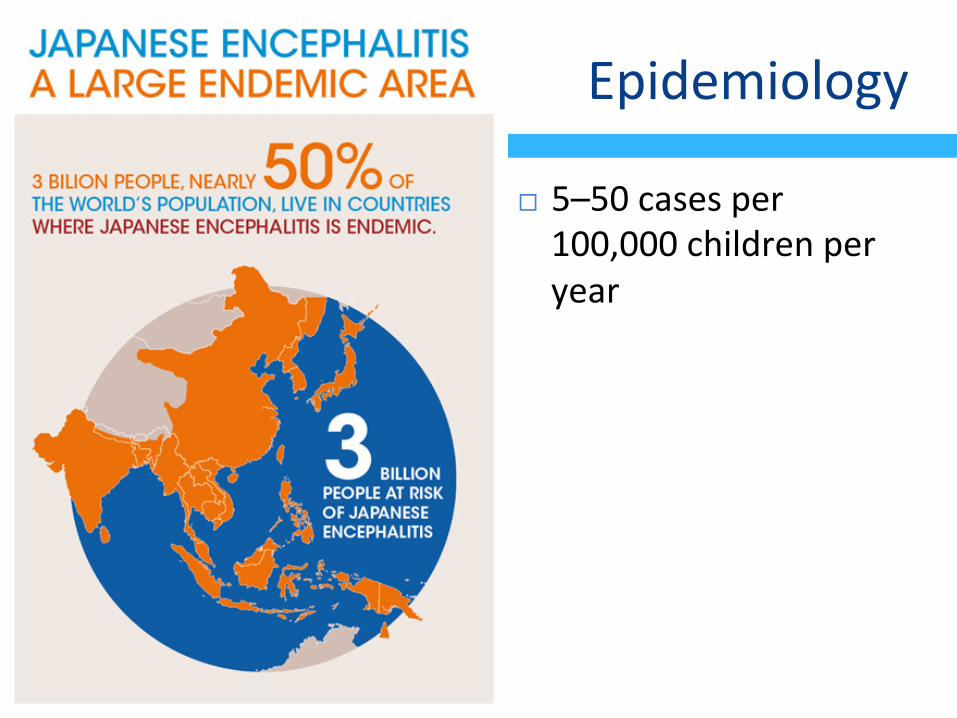
Epidemiology
¨ 5–50casesper100,000childrenperyear

Epidemiology
¨ CFR20%–30%.¨ 30%–50%Survivorshaveseriousneurologic,cogniJve,orpsychiatricsequelae.
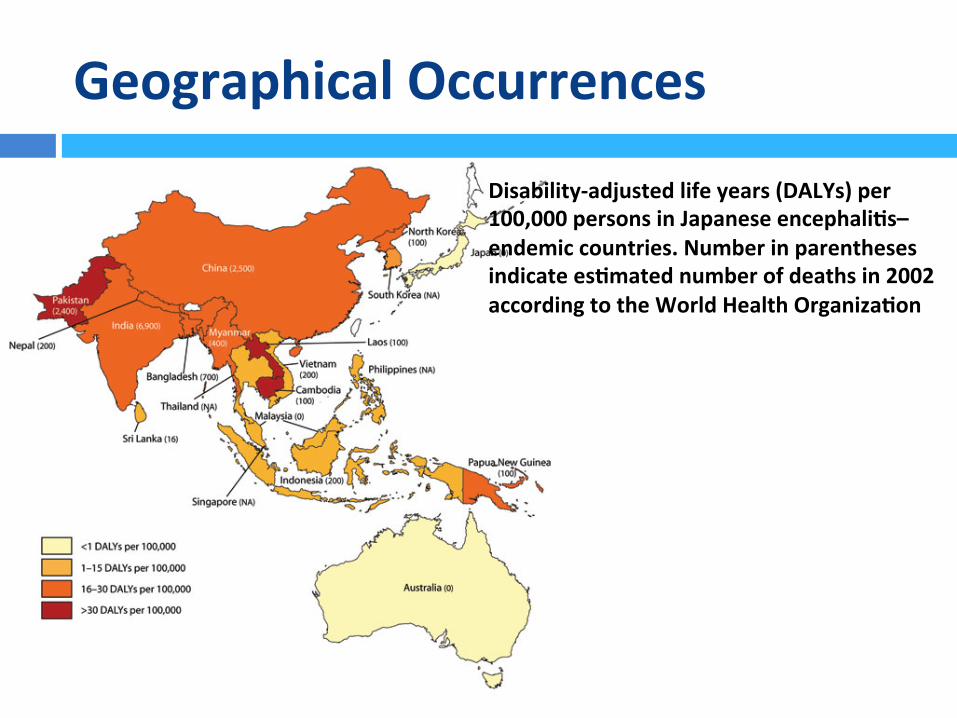
GeographicalOccurrences
Disability-adjustedlifeyears(DALYs)per100,000personsinJapaneseencephali3s–endemiccountries.Numberinparenthesesindicatees3matednumberofdeathsin2002accordingtotheWorldHealthOrganiza3on


Pathobiology


Clinical
¨ MostlyasymptomaJc¨ <1%clinicalJE¨ IncubaJon5-15days
¤ Fever¤ Headache¤ Nausea/Vomitus¤ MentalSt.Changes¤ Neurologicals¤ Weakness¤ Masklikefacies¤ Tremor¤ Cogwheelrigidity¤ Choreoathetoidmovements¤ AcuteFlaccidParalysis
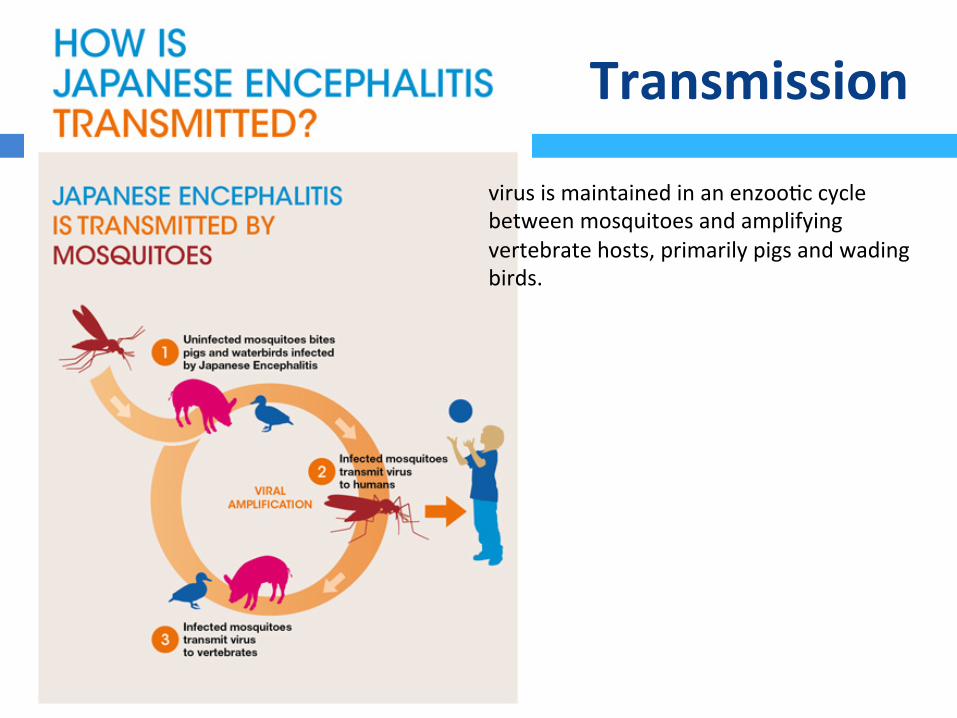
Transmission
virusismaintainedinanenzooJccyclebetweenmosquitoesandamplifyingvertebratehosts,primarilypigsandwadingbirds.
Diagnos3cs
¨ Evirus–specificIgM-captureELISAonCSForserum¤ Day4CSF¤ Day7Serum
¨ VirusisolaJonandnucleic-acidamplificaJontestsareinsensiJveindetecJngJEvirusorviralRNAinbloodorCSFandshouldnotbeusedforrulingoutadiagnosisofJE

Vaccines

3.ChikungunyaFever
¨ AviralillnesscausesbyChikungunyaVirus¨ AlphavirusgenusofTogaviridae¨ Single-strandedRNAvirus¨ Vector:Aedesaegyp*andAedesalbopictus¨ Reservoirs:monkeys,rodents,birds,vertebrates

Clinical
¨ FebrileillnesswithincubaJonof2-4days¨ Feverish¨ Arthralgia(worseinthemoring)¨ Backache¨ Headache

Clinical(2)
Guidelines on Clinical Management of Chikungunya Fever4
bending phenomenon was probably due to the lower limb and back involvementwhich forced the patient to stoop down and bend forward.
Other clinical features
Transient maculopapular rash is seen in up to 50 % patients. The maculopapulareruption persisted for more than 2 days in approx. 10% cases. Intertriginousaphthous-like ulcers and vesiculbullous eruptions were noticed in some. A fewpersons had angiomatous lesions and fewer had purpuras. Stomatitis wasobserved in 25% and oral ulcers in 15% of patients. Nasal blotchy erythemafollowed by photosensitive hyperpigmentation (20%) was observed morecommonly in the recent epidemic. Exfoliative dermatitis affecting limbs and
Figure 1: Joint manifestations in Chikungunya fever
Table 1: Clinical features in Chikungunya fever
Common Infrequent Rare in adults but seensometimes in children
Fever Rash Photophobia
Arthralgia Stomatitis Retro-orbital pain
Backache Oral ulcers Vomiting
Headache Hyperpigmentation Diarrhoea
Exfoliative dermatitis Meningeal syndrome
Acute encephalopathy

CaseDetec3on
¨ Possible(clinical)¨ Probable(clinicalandepidemiological)¨ Confirmed(labconfirmed)

Sequel
¨ JointsJffnessandpain¨ JointsJffness¨ TendiniJs¨ Neurological/emoJonal/dermatologicsequel
Diagnos3cs
¨ ViralisolaJon¨ RTPCR¨ IgManJbody(ELISAajer2weeks)¨ RisingJterofIgG(2-4weeks)

Differen3als
¨ Denguefever(PCR)¨ RheumaJcfever(ASTO)¨ Leptospirosis(MAT)¨ Malaria(RDT/Bloodsmear)¨ MeningiJs(CSFAnalysis)

AcuteManagement
¨ Coldcompress¨ AnJpyreJcs¨ Analgesics¨ CorJcosteroid(methylprednisolon)¨ Chloroquinphosphate300mg/d¨ Hydroxychloroquin200mg/d¨ Physiotherapy

4.ZikaVirusInfec3on
¨ Zikavirusisaflavivirus(familyflaviviridae)¨ Acutefebrileillness¨ Associatedwithzika-virusmicrocephalyifinfecJonoccursduringpregnancy

EpidemiologicalProgress
n en
gl j m
ed
nejm
.org
2
The n
ew
en
gl
an
d jo
ur
na
l of m
ed
icin
e
Mexico
Panama
El Salvador
Samoa
Tonga
French Polynesia
Cook IslandsEaster Island,
Chile
GuatemalaHonduras
Nicaragua
CuraçaoBonaire
Costa Rica
Jamaica
HaitiCuba
Dominican Republic
Bolivia
Colombia
Brazil
French Guiana
Suriname
Trinidad and Tobago
GuyanaEcuador
Paraguay
Nigeria
UgandaGabon
Cape VerdeThailand
Laos
Cambodia
Malaysia
PhilippinesMicronesia
Solomon
Marshall Islands
Vanuatu
Indonesia
New Caledonia
Fiji
MartiniqueDominica
Puerto RicoU.S. Virgin Islands
Saint Martin and Sint Maarten
Barbados
St. Vincent and the Grenadines
Guadeloupe
Maldives
February March2007–2009 2012–2014
State of Yap,Micronesia
Gabon
20152015
French GuianaHondurasMartiniquePanamaPuerto Rico
LaosNew CaledoniaSt. MaartenCubaDominica
2016 20162016
TongaBonaireMarshall IslandsSt. Vincent and the GrenadinesTrinidad and Tobago
January–October November December January2015
French PolynesiaNew CaledoniaEaster Island, ChileCook Islands
MalaysiaPhilippinesCambodiaIndonesiaThailand
BrazilVanuatuFijiColombia
Cape VerdeSamoaSolomon Islands
El SalvadorGuatemalaMexico
ParaguaySurinameVenezuela
BoliviaU.S. Virgin IslandsDominican
Republic
EcuadorGuyanaJamaicaCuraçaoMaldives
HaitiAmerican
Samoa
Costa RicaGuadeloupeSt. MartinNicaraguaBarbados
Figure 1. Areas in Which Zika Virus Infections in Humans Have Been Noted in the Past Decade (as of March 2016).
Only sporadic infections have occurred in Southeast Asia, the Philippines, and Indonesia.
The New
England Journal of Medicine
Dow
nloaded from nejm
.org by Fadel Muham
mad G
arishah on March 31, 2016. For personal use only. N
o other uses without perm
ission. C
opyright © 2016 M
assachusetts Medical Society. A
ll rights reserved.

Transmission
¨ Mosquito-bornedisease¨ AmnioJcfluid¨ Semen¨ Bloodtransfusion

ZikaAcuteFebrileIllness
¨ 82hoursajerinoculaJon¨ 4days–1week¨ Symptoms
¤ Fever¤ ConjuncJviJs¤ Rash¤ Arthralgia¤ Myalgia¤ Headache¤ Retroorbitalpain¤ Edema¤ Vomitus¤ Guillain-BarreSyndrome¤ MeningoencephaliJs,MyeliJs

SevereMicrocephaly
n engl j med nejm.org 6
T h e n e w e ngl a nd j o u r na l o f m e dic i n e
third trimester, with some adverse fetal out-comes noted in mothers who had seroconversion after gestational week 27.84 It is of particular concern that some infants without obvious ad-verse effects of congenital CMV infection at birth can have late-onset or progressive hearing loss that cannot be identified through screening of newborns.85 Other causes of microcephaly in-clude some genetic syndromes, vascular disrup-tion during brain development, nutritional defi-ciencies, and exposure to certain toxins, such as mercury.86
Microcephaly is a clinical finding of a small head size for gestational age and sex and is in-dicative of an underlying problem with the growth of the brain.87 The lack of consistent and standardized case definitions has challenged the accurate monitoring of microcephaly during the current Zika virus outbreak.39 Centers for Dis-ease Control and Prevention (CDC) guidance has recommended that microcephaly be defined as an occipitofrontal circumference below the third percentile for gestational age and sex.88 The prevalence of microcephaly in the United States averages approximately 6 cases per 10,000 live births, with a range of about 2 to 12 cases per 10,000 live births.89 Because similar prevalences are expected in other countries, these figures may be suitable benchmarks for regions lacking accurate historical data.
Microcephaly can occur as a result of fetal brain disruption sequence, a process in which,
after relatively normal brain development in early pregnancy, collapse of the fetal skull fol-lows the destruction of fetal brain tissue.90-92
Although previous case reports of maternal in-fection leading to fetal brain disruption sequence do not include information on the timing of ma-ternal infection, some evidence indicates that this damage can occur late during the second trimes-ter or even early in the third trimester.93 Initial case reports from Brazil have suggested that some of the infants with microcephaly related to Zika virus infection have a phenotype consistent with fetal brain disruption (Fig. 4).38,94,95
The findings of Zika virus RNA in the amni-otic fluid of fetuses with microcephaly40,52,54 and in the brain tissue of fetuses and infants with microcephaly,55,94,95 as well as the high rates of microcephaly among infants born to mothers with proven antecedent acute Zika virus infec-tion,69 provide strong evidence linking micro-cephaly to maternal Zika virus infection. The timing of the Zika virus and microcephaly epi-demics in Brazil96,97 and French Polynesia41 indi-cate that the greatest risk of microcephaly is in the first trimester. In case reports of micro-cephaly, documented maternal Zika virus infec-tion most often occurred between 7 and 13 weeks of gestation, but in some cases it occurred as late as at 18 weeks of gestation.40,52,54,69,94
A preliminary report from Brazil indicated that fetal abnormalities detected by ultrasonog-raphy were present in 29% of women with Zika
Figure 4. Infants with Moderate or Severe Microcephaly Associated with Maternal Zika Virus Infection, as Compared with a Typical Newborn.
Baby with TypicalHead Size
Baby with Moderate Microcephaly
Typical head size
Typical head size
Baby with Severe Microcephaly
The New England Journal of Medicine Downloaded from nejm.org by Fadel Muhammad Garishah on March 31, 2016. For personal use only. No other uses without permission.
Copyright © 2016 Massachusetts Medical Society. All rights reserved.
Neuropathology
¨ Sonography¤ Absentcorpuscallosum¤ Hydranencephaly¤ CerebralcalcificaJons¤ VentriculardilataJon¤ Brainatrophy¤ AbnormalgyraJon¤ Hydropsfetalis¤ Anhydramnions¤ IntrauterinegrowthretardaJon

Diagnos3cs
¨ RT-PCR(longerinurine)¨ IgMMAC-ELISA

TreatmentandVaccines
¨ Treatment¤ Notreatmentavailablesofar
¨ Vaccines¤ Novaccinesavailablesofar
¨ ControlMeasures¤ Avoidingmosquitobites¤ Vectorcontrol¤ Pendingpregnancyininfectedfuturemother¤ SelecJveaborJon(?)


