Archaeomagnetic data from three Punic sites in Tunisia Boutheina Fouzai a , Lluís Casas b, * , Nejia Laridhi Ouazaa a , Mounir Fantar c , Aureli Álvarez b a Université de Tunis El Manar, Faculté des Sciences, Département de Géologie, Campus Universitaire, 2092 Manar II, Tunisia b Universitat Autònoma de Barcelona, Facultat de Ciències, Departament de Geologia, Campus de la UAB, 08193 Bellaterra, Catalonia, Spain c Institut National du Patrimoine, 4, Place du Château Bab Menara, 1008 Tunis, Tunisia article info Article history: Received 10 August 2012 Received in revised form 19 November 2012 Accepted 2 December 2012 Keywords: Archaeomagnetism Dating Geomagnetic field modeling Tunisia Archaeodirection Archaeointensity Punic civilization abstract Archaeomagnetic analyses on bricks and slag fragments from kilns have been undertaken. Four new archaeomagnetic directions and two new archaeomagnetic intensities have been reported for three Punic sites in Tunisia. The SCHA.DIF.3K archaeomagnetic model gives the most consistent age estimates, in agreement with the archaeological ages for three of the four analyzed kilns. The archaeomagnetic models appeared to be surprisingly proficient both using archaeodirections and intensities for El Maklouba. The existence of kilns from different chronological archaeological phases (4the3th century BC and 2nde3rd century AD) has been confirmed for this site. The archaeological hypothesis that associates the kiln in El Gaala with the neighboring Punic necropolis is compatible with the archaeomagnetic data obtained from the kiln, though a modern use or remagnetisation of the kiln cannot be excluded. Ó 2012 Elsevier Ltd. All rights reserved. 1. Introduction Archaeomagnetic data can be retrieved from archaeological materials that were burnt or baked in the past. When any archae- ological material containing magnetic grains is heated above their magnetic transition temperatures it loses any previous remanent magnetization and as it cools down acquires a thermoremanent magnetization (TRM) that relates to the prevailing geomagnetic field, the TRM can be kept stored in the material unless it is reheated or chemically altered. If the archaeological age of the materials is well known, these stored data can be used to produce regional or global archaeomagnetic field models that describe the time and space evolution of the geomagnetic field. Accurate models can be used as dating tools, though the accuracy of the models rely on the availability and quality of experimental data near the area under study (Casas et al., 2008). The development of archaeomagnetism-related research is just starting in the northern Africa area. Until recently, only very few data were available in this area (Casas et al., 2008; Kovacheva, 1984; Najid, 1986; Thellier and Thellier, 1959). New data has been published for Tunisia (Fouzai et al., 2012; Gómez-Paccard et al., 2012). These recent research, along with the one presented here, should contribute to a better knowledge of the local behavior of the geomagnetic field and therefore to develop accurate archaeomagnetic dating tools for Tunisia. Tunisia has a rich cultural heritage covering a wide historical time range, previously published data deal with Roman (Fouzai et al., 2012) and Medieval (Gómez-Paccard et al., 2012) times. We focus here on the Punic era, we have applied archae- omagnetic techniques on kilns from three Punic sites of Tunisia: El Maklouba and El Gaala (Sahel region) and Kerkuane (Cap Bon) (see Fig. 1). 2. Historical and archaeological background of the studied sites 2.1. El Maklouba The site of El Maklouba consists of a broad mound 2 km to the north of Ksour Essef (42 km south from Monastir) in the Sahel region. Peacock et al. (1989) reports the features of the site and the product of its own prospections undertaken in 1985: the mound is a tell formed by the remains of what probably was a small town with an industrial zone along the south western edge. This edge was excavated during the sixties (20th century) and it was left partially open. Among the features of the site, there are the remains of 12 kilns of various sizes, cisterns and building walls. The 1985 prospection produced, among other materials, fragments of * Corresponding author. Tel.: þ34 935868365; fax: þ34 935811263. E-mail address: [email protected](L. Casas). Contents lists available at SciVerse ScienceDirect Journal of Archaeological Science journal homepage: http://www.elsevier.com/locate/jas 0305-4403/$ e see front matter Ó 2012 Elsevier Ltd. All rights reserved. http://dx.doi.org/10.1016/j.jas.2012.12.004 Journal of Archaeological Science 40 (2013) 1703e1714
Transcript
at SciVerse ScienceDirect
Journal of Archaeological Science 40 (2013) 1703e1714
Contents lists available
Journal of Archaeological Science
journal homepage: http : / /www.elsevier .com/locate/ jas
Archaeomagnetic data from three Punic sites in Tunisia
Boutheina Fouzai a, Lluís Casas b,*, Nejia Laridhi Ouazaa a, Mounir Fantar c, Aureli Álvarez b
aUniversité de Tunis El Manar, Faculté des Sciences, Département de Géologie, Campus Universitaire, 2092 Manar II, TunisiabUniversitat Autònoma de Barcelona, Facultat de Ciències, Departament de Geologia, Campus de la UAB, 08193 Bellaterra, Catalonia, Spainc Institut National du Patrimoine, 4, Place du Château Bab Menara, 1008 Tunis, Tunisia
a r t i c l e i n f o
Article history:Received 10 August 2012Received in revised form19 November 2012Accepted 2 December 2012
Keywords:ArchaeomagnetismDatingGeomagnetic field modelingTunisiaArchaeodirectionArchaeointensityPunic civilization
0305-4403/$ e see front matter � 2012 Elsevier Ltd.http://dx.doi.org/10.1016/j.jas.2012.12.004
a b s t r a c t
Archaeomagnetic analyses on bricks and slag fragments from kilns have been undertaken. Four newarchaeomagnetic directions and two new archaeomagnetic intensities have been reported for threePunic sites in Tunisia. The SCHA.DIF.3K archaeomagnetic model gives the most consistent age estimates,in agreement with the archaeological ages for three of the four analyzed kilns. The archaeomagneticmodels appeared to be surprisingly proficient both using archaeodirections and intensities for ElMaklouba. The existence of kilns from different chronological archaeological phases (4the3th century BCand 2nde3rd century AD) has been confirmed for this site. The archaeological hypothesis that associatesthe kiln in El Gaala with the neighboring Punic necropolis is compatible with the archaeomagnetic dataobtained from the kiln, though a modern use or remagnetisation of the kiln cannot be excluded.
� 2012 Elsevier Ltd. All rights reserved.
1. Introduction
Archaeomagnetic data can be retrieved from archaeologicalmaterials that were burnt or baked in the past. When any archae-ological material containing magnetic grains is heated above theirmagnetic transition temperatures it loses any previous remanentmagnetization and as it cools down acquires a thermoremanentmagnetization (TRM) that relates to the prevailing geomagneticfield, the TRM can be kept stored in the material unless it isreheated or chemically altered. If the archaeological age of thematerials is well known, these stored data can be used to produceregional or global archaeomagnetic field models that describe thetime and space evolution of the geomagnetic field. Accurate modelscan be used as dating tools, though the accuracy of the models relyon the availability and quality of experimental data near thearea under study (Casas et al., 2008). The development ofarchaeomagnetism-related research is just starting in the northernAfrica area. Until recently, only very few data were available in thisarea (Casas et al., 2008; Kovacheva, 1984; Najid, 1986; Thellier andThellier, 1959). New data has been published for Tunisia (Fouzaiet al., 2012; Gómez-Paccard et al., 2012). These recent research,along with the one presented here, should contribute to a better
þ34 935811263.
All rights reserved.
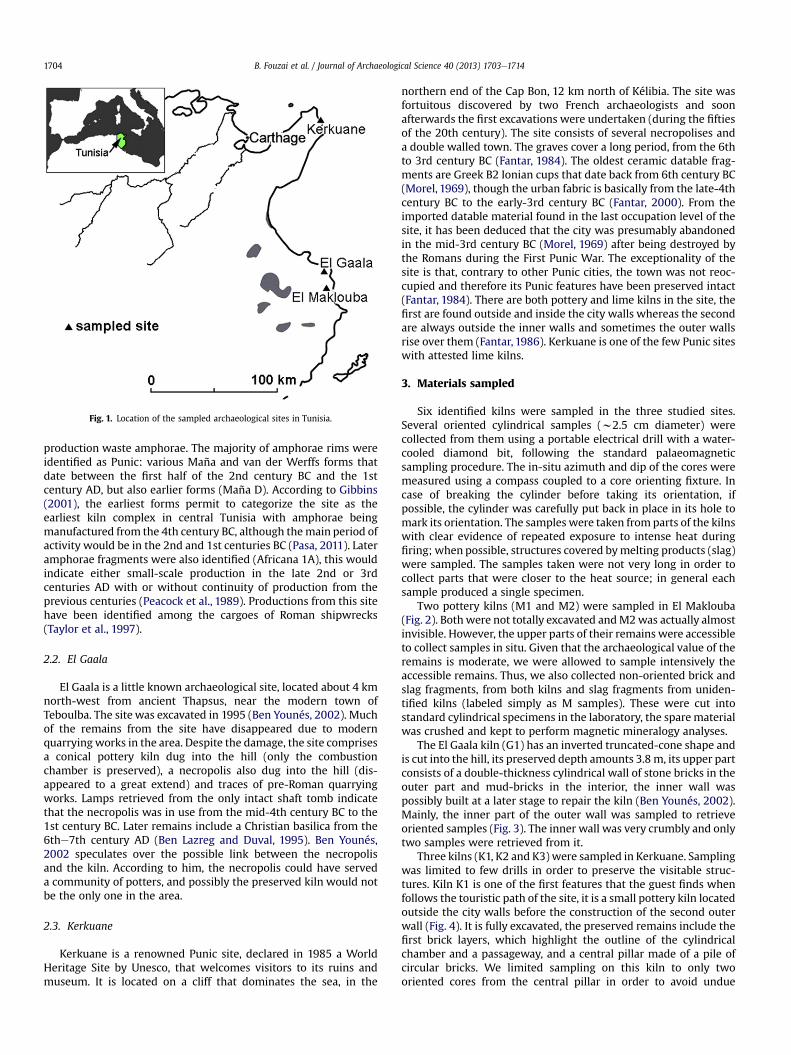
knowledge of the local behavior of the geomagnetic field andtherefore to develop accurate archaeomagnetic dating tools forTunisia. Tunisia has a rich cultural heritage covering a widehistorical time range, previously published data deal with Roman(Fouzai et al., 2012) and Medieval (Gómez-Paccard et al., 2012)times. We focus here on the Punic era, we have applied archae-omagnetic techniques on kilns from three Punic sites of Tunisia: ElMaklouba and El Gaala (Sahel region) and Kerkuane (Cap Bon) (seeFig. 1).
2. Historical and archaeological background of the studiedsites
2.1. El Maklouba
The site of El Maklouba consists of a broad mound 2 km to thenorth of Ksour Essef (42 km south from Monastir) in the Sahelregion. Peacock et al. (1989) reports the features of the site and theproduct of its own prospections undertaken in 1985: the mound isa tell formed by the remains of what probably was a small townwith an industrial zone along the south western edge. This edgewas excavated during the sixties (20th century) and it was leftpartially open. Among the features of the site, there are the remainsof 12 kilns of various sizes, cisterns and building walls. The 1985prospection produced, among other materials, fragments of
Fig. 1. Location of the sampled archaeological sites in Tunisia.
B. Fouzai et al. / Journal of Archaeological Science 40 (2013) 1703e17141704
production waste amphorae. The majority of amphorae rims wereidentified as Punic: various Maña and van der Werffs forms thatdate between the first half of the 2nd century BC and the 1stcentury AD, but also earlier forms (Maña D). According to Gibbins(2001), the earliest forms permit to categorize the site as theearliest kiln complex in central Tunisia with amphorae beingmanufactured from the 4th century BC, although themain period ofactivity would be in the 2nd and 1st centuries BC (Pasa, 2011). Lateramphorae fragments were also identified (Africana 1A), this wouldindicate either small-scale production in the late 2nd or 3rdcenturies AD with or without continuity of production from theprevious centuries (Peacock et al., 1989). Productions from this sitehave been identified among the cargoes of Roman shipwrecks(Taylor et al., 1997).
2.2. El Gaala
El Gaala is a little known archaeological site, located about 4 kmnorth-west from ancient Thapsus, near the modern town ofTeboulba. The site was excavated in 1995 (Ben Younés, 2002). Muchof the remains from the site have disappeared due to modernquarryingworks in the area. Despite the damage, the site comprisesa conical pottery kiln dug into the hill (only the combustionchamber is preserved), a necropolis also dug into the hill (dis-appeared to a great extend) and traces of pre-Roman quarryingworks. Lamps retrieved from the only intact shaft tomb indicatethat the necropolis was in use from the mid-4th century BC to the1st century BC. Later remains include a Christian basilica from the6the7th century AD (Ben Lazreg and Duval, 1995). Ben Younés,2002 speculates over the possible link between the necropolisand the kiln. According to him, the necropolis could have serveda community of potters, and possibly the preserved kiln would notbe the only one in the area.
2.3. Kerkuane
Kerkuane is a renowned Punic site, declared in 1985 a WorldHeritage Site by Unesco, that welcomes visitors to its ruins andmuseum. It is located on a cliff that dominates the sea, in the
northern end of the Cap Bon, 12 km north of Kélibia. The site wasfortuitous discovered by two French archaeologists and soonafterwards the first excavations were undertaken (during the fiftiesof the 20th century). The site consists of several necropolises anda double walled town. The graves cover a long period, from the 6thto 3rd century BC (Fantar, 1984). The oldest ceramic datable frag-ments are Greek B2 Ionian cups that date back from 6th century BC(Morel, 1969), though the urban fabric is basically from the late-4thcentury BC to the early-3rd century BC (Fantar, 2000). From theimported datable material found in the last occupation level of thesite, it has been deduced that the city was presumably abandonedin the mid-3rd century BC (Morel, 1969) after being destroyed bythe Romans during the First Punic War. The exceptionality of thesite is that, contrary to other Punic cities, the town was not reoc-cupied and therefore its Punic features have been preserved intact(Fantar, 1984). There are both pottery and lime kilns in the site, thefirst are found outside and inside the city walls whereas the secondare always outside the inner walls and sometimes the outer wallsrise over them (Fantar, 1986). Kerkuane is one of the few Punic siteswith attested lime kilns.
3. Materials sampled
Six identified kilns were sampled in the three studied sites.Several oriented cylindrical samples (w2.5 cm diameter) werecollected from them using a portable electrical drill with a water-cooled diamond bit, following the standard palaeomagneticsampling procedure. The in-situ azimuth and dip of the cores weremeasured using a compass coupled to a core orienting fixture. Incase of breaking the cylinder before taking its orientation, ifpossible, the cylinder was carefully put back in place in its hole tomark its orientation. The samples were taken from parts of the kilnswith clear evidence of repeated exposure to intense heat duringfiring; when possible, structures covered bymelting products (slag)were sampled. The samples taken were not very long in order tocollect parts that were closer to the heat source; in general eachsample produced a single specimen.
Two pottery kilns (M1 and M2) were sampled in El Maklouba(Fig. 2). Bothwere not totally excavated andM2was actually almostinvisible. However, the upper parts of their remains were accessibleto collect samples in situ. Given that the archaeological value of theremains is moderate, we were allowed to sample intensively theaccessible remains. Thus, we also collected non-oriented brick andslag fragments, from both kilns and slag fragments from uniden-tified kilns (labeled simply as M samples). These were cut intostandard cylindrical specimens in the laboratory, the sparematerialwas crushed and kept to perform magnetic mineralogy analyses.
The El Gaala kiln (G1) has an inverted truncated-cone shape andis cut into the hill, its preserved depth amounts 3.8 m, its upper partconsists of a double-thickness cylindrical wall of stone bricks in theouter part and mud-bricks in the interior, the inner wall waspossibly built at a later stage to repair the kiln (Ben Younés, 2002).Mainly, the inner part of the outer wall was sampled to retrieveoriented samples (Fig. 3). The inner wall was very crumbly and onlytwo samples were retrieved from it.
Three kilns (K1, K2 and K3)were sampled in Kerkuane. Samplingwas limited to few drills in order to preserve the visitable struc-tures. Kiln K1 is one of the first features that the guest finds whenfollows the touristic path of the site, it is a small pottery kiln locatedoutside the city walls before the construction of the second outerwall (Fig. 4). It is fully excavated, the preserved remains include thefirst brick layers, which highlight the outline of the cylindricalchamber and a passageway, and a central pillar made of a pile ofcircular bricks. We limited sampling on this kiln to only twooriented cores from the central pillar in order to avoid undue
Fig. 2. Plan of the previously excavated area in El Maklouba, adapted from Peacock et al. (1989), sampled kilns M1 and M2 are identified on it (top). Photographs and sketches of thesampled kilns (bottom).
B. Fouzai et al. / Journal of Archaeological Science 40 (2013) 1703e1714 1705
damage. Kiln K2 is a bigger andmuchmore damaged pottery kiln, itlocates near the southern gate (Fig. 4); four oriented samples wereretrieved from it. Finally, two more oriented cores were drilled inkiln K3, which is one of the circular lime kilns of the site. It is alsoquite damaged; it locates near the coastal cliff (Fig. 4) and corre-sponds to the described Four V in Fantar (1986). Extracted coreswere resent to the site person in charge to be replaced in its originalholes after reading its magnetic data.
To sum up, 65 specimens were obtained from three archeo-logical sites from Tunisia with presumed ages ranging from the 4thcentury BC to the 3rd century AD. Table 1 summarizes the details ofall the sites and samples.
4. Experimental methods and data analyses
The archaeomagnetic vector was studied using the facilitiesavailable at the paleomagnetic laboratory of Barcelona (SCT UB-CSIC). Directional measurements were applied to orientedsamples from all the studied sites following the equipment andmethods described in Fouzai et al. (2012) and applying the sameprocedure to represent the obtained data and the same selectioncriteria. When more than one specimen was available from an
independently oriented sample, the most reliable demagnetizationexperiment, in terms of maximum angular deviation (Kirschvink,1980) was always retained. Computation of mean directions foreach structure or sitewas achieved by using Fisher (1953) statistics;concentration parameter k and confidence factor a95 were alsoobtained.
Archaeointensity measurements were carried out on the non-oriented samples from El Maklouba. Their magnetic mineralogywas investigated using magnetic susceptibility equipment fromBartington, available at the Geology Department in the UniversitatAutònoma, in Barcelona (UAB), consisting of an MS3 magneticsusceptibilitymeter and two kinds of sensors (MS2B dual frequencyand MS2W water jacketed). Mössbauer spectra were also recordedat room temperature on several powdered samples using a trans-mission Mössbauer spectrometer with a 57Co/Rh source from theMaterial Science Institute in Barcelona (ICMAB-CSIC). Archae-ointensity was determined using the Coe variant method ofa Thellier-type experiment (Coe, 1967) with several alteration andreversibility tests as described in Fouzai et al. (2012). The externalfield for the required applied field steps was 50 mT. Taking intoaccount that our samples consist of slag fragments or brickscovered by melting products, we considered that the TRM
Fig. 3. Plan of the existing features in El Gaala, sampled kiln G1 is identified on it (left). Photograph and sketch of the sampled kiln (right). Inset on the left is a photograph of the kilnwall from the interior, inner and outer walls are clearly seen.
Fig. 4. Plan of the archaeological site of Kerkuane, sampled kilns K1, K2 and K3 are identified on it (left). Photographs of the sampled kilns (right).
B. Fouzai et al. / Journal of Archaeological Science 40 (2013) 1703e17141706
Table 1Coordinates of the sampled sites (Lat., latitude and Long., longitude) with indicationof their presumed ages according to archaeological evidence, sample labels andnumber of collected samples; n is the number of standard specimens obtained fromthe N collected samples; nu is the number of specimens used to compute archae-omagnetic directions or intensities.
Site Lat. (�N) Long. (�E) Presumed age Label Purpose n/N nu
El Maklouba 35.26 11.00 4th BCe3rd AD M1 Direction 11/10 8M1 Intensity 7/7 7M2 Direction 8/8 8M2 Intensity 7/7 4Ma Intensity 2/2 e
El Gaala 35.38 11.00 4th�1st BC G1 Direction 21/18 12Kerkuane 36.57 11.06 4th�3rd BC K1 Direction 2/2 2
K2 Direction 4/4 2K3 Direction 3/2 3
a Brick and slag from unidentified kiln/s.
B. Fouzai et al. / Journal of Archaeological Science 40 (2013) 1703e1714 1707
anisotropy effect upon archaeointensity estimates can be taken asinsignificant. For instance, Kovacheva et al. (2009) found that theanisotropy correction of intensity results for materials other thanpottery seems negligible and thus no correction of this effect hasbeen performed. In contrast, we performed a cooling rate testfollowing the procedure described in Chauvin et al. (2000), the testwas performed at 560 �C with a quick cooling (w95 min) for thefirst and third heating (TRM1 and TRM3) and a slow cooling (w12 h)for the second heating (TRM2). The effect of the cooling rate upon
Fig. 5. Representative Zijderveld plots depicting the orthogonal projection of the remanent mEl Maklouba, El Gaala and Kerkuane. Open (solid) symbols represent projections on vertica
the magnetizationwas calculated as the ratio: r1 ¼ (TRM2 � TRM1)/TRM1 and the changes in the TRM acquisition capacity as the ratio:r2 ¼ (TRM1� TRM3)/TRM1. Cooling rate correctionwas applied onlywhen the corresponding r2 was <5%. For each structure everysample-datumwas plotted as a Gaussian function and, to computean overall archaeointensity value, a Gaussian function was fitted tothe sum of all individual results.
The results were compared with model predictions usinga Matlab dating tool developed by Pavón-Carrasco et al. (2011).Three models were used: the regional model SCHA.DIF.3K (Pavón-Carrasco et al., 2009) and the global models CALS3K.3 (Korte et al.,2009) and CALS3K.4b (Korte and Constable, 2011). The SCHA.DIF.3Kmodel was obtained by least-sums of absolute deviation inversionof paleomagnetic data using spherical cap harmonics (SCHA) andprovides geomagnetic field vector values over the Europeancontinent, northern Africa and western Asia from 1000 BC to1900 AD. The CALS3K.3 model was generated using a compilationof archaeomagnetic and lake sediments data covering the past3000 years. Although CALS3K.3 is a global model, the distributionof data is strongly biased towards the northern hemisphere, andEurope in particular, thus the model provides reasonable fieldvalues especially for this area. CALS3K.4b model is the last availableupdate of CALS3K models where data additions, mainly fromsouth-east Asian, Alaskan and Siberian regions, have been done.Also, uncertainties estimates from bootstrap experiments havebeen included. The use of archaeomagnetic field models avoids the
agnetization vectors during progressive demagnetization for different specimens froml (horizontal) planes. Lines indicate the ChRM directions.
Fig. 6. Stereographic projection of the archaeomagnetic directions calculated for eachsample from (a) El Maklouba, solid (open) symbols belong to kiln M1 (M2); (b) ElGaala, open symbols correspond to samples from the inner wall; (c) Kerkuane, solid(open/crossed) circle symbols correspond to K1 (K2/K3) kilns. Mean directions and a95error circles for kilns M1, M2, G1 and the three kilns from Kerkuane (K1, K2 and K3)merged together are shown. N indicates the number of independently oriented sampletaken into account for the calculation of the mean; D and I stands for declination andinclination; a95 and k, 95% confidence cone of mean directions and precision param-eter from Fisher statistics.
Columns from left to right: name, name of the site (structure); Lat. and Long.,Latitude and Longitude of the site; N, number of samples taken into account in thecalculation of the mean site direction; D, archaeomagnetic declination; I, archae-omagnetic inclination; k and a95, precision parameter and 95% confidence limit ofcharacteristic remanent magnetization, from Fisher statistics.
B. Fouzai et al. / Journal of Archaeological Science 40 (2013) 1703e17141708
need for relocation of archaeomagnetic data to a central location,which is a procedure that involves inherently an error (Casas andIncoronato, 2007).
5. Results and discussion
5.1. Archaeodirectional results and discussion
Representative Zijderveld diagrams of specimens from ElMaklouba, El Gaala and Kerkuane are shown in Fig. 5. A total of 49specimens were analyzed. Three specimens fromM1were rejected,two of them due to inconsistent archaeomagnetic directionsattributable to a wrong replacement of a broken core and anotherone due to MAD>5. Seven specimens from G1 were rejected, againdue to the break of the core during sampling (two specimens) andMAD >5 (two specimens); two more specimens were rejectedbecause the maximum applied temperature (520 �C) hardlydemagnetized a very small percentage of the NRM though themeasured direction was consistent with ChRM directions obtainedfor the rest of G1 specimens. NRM direction measured on speci-mens from the pottery kilns from Kerkuane (K1 and K2) showeda quite erratic behavior, with the sole exception of K1-1 specimen(Fig. 5d). ChRM direction was often defined only after considerabledemagnetization, and in two cases demagnetization was not ach-ieved at all (Fig. 5e), these two specimens had to be rejected. Incontrast, archaeomagnetic directions measured on specimens fromthe lime kiln (K3) were far sharper, but unfortunately only twocores (three specimens) were available from it.
Fig. 6 shows the stereographic projection of the non-rejectedarchaeomagnetic directions calculated for each sample. Resultsfrom El Maklouba (Fig. 6a) indicate that archaeomagnetic direc-tions stored in the two analyzed kilns (M1 and M2) are distinctlydifferent. A single archaeomagnetic mean direction has been ob-tained for El Gaala (Fig. 6b), the two samples taken from the innerwall lie a bit far from the mean direction (open dots in Fig. 6) andwere finally removed from the calculation of the mean to avoidmixing data from two possibly different kiln heatings that areseparated by an undefined gap of time. The three sampled kilns inKerkuane have a similar archaeological setting as all of them arelocated on or outside the inner walls of the city. This fact, togetherwith the low number of samples from each kiln and the homoge-neity of the obtained archaeodirections has driven us to computea single mean value for the three sampled kilns of this site. It isworth to note that despite the relatively high quality of the meanarchaeodirection for Kerkuane, its estimation is based on only sixvalues. The ensemble of obtained archaeomagnetic directionalresults is summarized in Table 2.
Comparing the results with the SCHA.DIF.3K model we obtainedprobability density functions of possible dates for both declinationand inclination. The intersection of these functions produces themost probable dates (see Figs. 7 and 8). The two kilns sampled at ElMaklouba produce different results. For the M1 kiln (Fig. 7a), thecombined probability function indicates basically two solutions (BC417e17 or AD 1687e1852). The first solution is in agreement withthe main period of activity in the site as indicated by archaeologicalevidence, the second solution would indicate a heating of thestructure out of his archaeological context and would imply that itwas exposed uncovered during that period. For the M2 kiln(Fig. 7b), the SCHA.DIF.3K model points to a single solution (AD118e425), consistent with the progression of activity during theRoman times, as indicated by the presence of Africana 1A fragmentson the site (Peacock et al., 1989). The obtained solution for the kilnsampled at El Gaala (Fig. 8a) distributes basically in a 19the20thcentury AD peak and in three probability peaks within the BC68eAD 483 time interval with a distinct main peak pointing to year
24 BC, which matches well with the last use of tombs in the nearbynecropolis, and thus the result is compatible with the presumedcontemporaneity between the kiln and the necropolis (Ben Younés,2002). However, a significant part of the probability (the 19the20thcentury AD peak) would suggest a recent remagnetization of the
Fig. 7. Probability-of-age density functions obtained with the Matlab tool from Pavón-Carrasco et al. (2011) for El Maklouba kilns (a) M1 and (b) M2, using SCHA.DIF.3K model. Onthe bottom: location of the sites, experimental mean directions and intensities and both combined (declination and inclination) and combined (declination, inclination andintensity) probability functions.
B. Fouzai et al. / Journal of Archaeological Science 40 (2013) 1703e1714 1709
Fig. 8. Probability-of-age density functions obtained with the Matlab tool from Pavón-Carrasco et al. (2011) for (a) G1 kiln from El Gaala and (b) K1, K2 and K3 kilns from Kerkuane,using SCHA.DIF.3K model. On the right: location of the sites, experimental mean directions and combined (declination and inclination) probability functions.
B. Fouzai et al. / Journal of Archaeological Science 40 (2013) 1703e17141710
kiln. The mean archaeodirection for Kerkuane is based on only 6values and even from 3 different structures. Although the 6 valuesgroup very well, the statistical value could be meaningless and thusthe results must be considered preliminary. The results indicatethat the last firing of the kilns or its remains would have happenedwithin the first 5 centuries AD, and thus the archaeomagnetic doesnot agree at all with the likely archaeological age that points towardan abandonment of the city in the mid-3rd century BC (Morel,1969).
Apparently, the solutions yielded by the SCHA.DIF.3K model arecompatible with the archaeological evidence with the sole excep-tion of Kerkuane, although we note that the number of investigatedsamples is too low to consider that the result has statisticalmeaning. Using global models the results are less promising. BothCALS3K.3 and CALS3K.4b produced probability distributionsbroader than those using SCHA.DIF.3K (see Fig. 9 and Table 3). TheCALS3K distributions cover the presumed archaeological timeintervals but spread far outside them, covering most of the 3000years within which the models apply. Particularly, CALS3K.3exhibits complicated multipeak structures whereas the bootstrapaveraged CALS3K.4bmodel shows highly smoothed profiles (exceptfor the period middle 19th century onwards). Some tests were alsoperformed using the higher resolution CALS3K.4 model (Korte andConstable, 2011), but as uncertainties are not provided with this
model, the Matlab dating tool produced unnecessarily spikydistributions though, in essence, similar to those from CALS3K.3model.
5.2. Magnetic mineralogy and archaeointensity results from ElMaklouba
Archaeomagnetic dating of El Maklouba has been refined per-forming archaeointensity analysis for this site. However, thisanalysis requires a particular magnetic mineralogy: thermal alter-ation, multidomain grains and interactions among grains have to beabsolutely avoided (Carvallo et al., 2006). In order to betterunderstand the behavior of the specimens in the archaeointensityexperiments and to check their thermal stability, magneticsusceptibility and Mössbauer measurements were performed onpowdered sister samples of the cylindrical cores. From roomtemperature magnetic susceptibility measurements, performed attwo different frequencies (470 and 4700 Hz), the percentagefrequency dependent susceptibility (cFD) was calculated. Importantintrinsic variations were found for both M1 and M2 powders.Despite the variations, M2 powders exhibited statistically highervalues (10% � 7) compared to M1 powders (4% � 3). The super-paramagnetic content relates to the cFD values, indicating a rela-tively high superparamagnetic content for M2 samples (Dearing
Fig. 9. Combined (declination and inclination (a), (c), (e) and (f), and also intensity (b)and (d)) probability functions obtained with the Matlab tool from Pavón-Carrasco et al.(2011) for the sampled kilns, using (left) CALS3K.3 and (right) CALS3K.4b models.
Table 3Archaeomagnetic ages using SCHA.DIF.3K, CALS3K.3 and CALS3K.4b geomagneticmodels for kilns from El Maklouba (M1 and M2), El Gaala (G1) and Kerkouane(K ¼ K1 þ K2 þ K3). Main solutions and maxima refer to the obtained probabilitytime-distributions characterized by well-defined peaks if not otherwise specified.Presumed ages according to archaeological evidence are listed for comparison.
Kiln Model Main solutions Maxima Presumed archaeologicalage
M1 SCHA.DIF.3K BC 417e144 340 BC 4the1st BC or2nde3rd ADBC 96e17 62 BC
AD 1687e1852 1754 ADCALS3K.3 BC 690e255 434 BC
AD 1550e1831 1712 ADCALS3K.4b BC 747e45 354 BC
AD 1657e1836 1750 ADM2 SCHA.DIF.3K AD 118e425 316 AD
CALS3K.3 BC 227e585 152 ADAD 1099e1446 1355 ADAD 1934e1990 1990 AD
CALS3K.4b BC 97eAD 492 173 ADAD 1969e1985 1979 AD
G1 SCHA.DIF.3K BC 68eAD 132 23 BC Mid-4th BCe1st BCAD 170e268 219 ADAD 377e483 429 ADAD 1834e1900 1900 AD
CALS3K.3 BC 665e353 6 BCa
BC 335eAD 261 3 ADa
AD 289e479 399 ADAD 1786e1973 1873 AD
CALS3K.4b BC 669eAD 449 9 ADAD 1840e1900 Highly spiky
K SCHA.DIF.3K BC 60eAD 276 53 AD Late-4th BCe3rd BCAD 352e490 428 ADAD 1894e1990 1900 AD
CALS3K.3 BC 733eAD 649 44 BC, 408 ADa
AD 1923e1982 1952 ADCALS3K.4b BC 917eAD 587 73 BC
AD 1925e1972 1938 AD
a Multipeak distributions.
Fig. 10. Representative continuous susceptibility versus temperature curves for M1and M2 powders. Maximum applied temperature was 560 �C. Arrows indicate theheating and cooling paths.
B. Fouzai et al. / Journal of Archaeological Science 40 (2013) 1703e1714 1711
et al., 1996). Continuous susceptibility vs. temperature measure-ments revealed a relatively simple magnetic mineralogy for bothM1 and M2 powders with high transition temperatures. For M1powders, the susceptibility starts to decrease monotonously ataround 400 �C, in contrast M2 powders exhibit a slight increase ofsusceptibility up to 450 �C (compatible with antiferromagneticconfigurations) and then an abrupt decrease. Heating and cooling
paths are reasonably reversible for both kinds of powders (Fig. 10),indicating relatively high thermomagnetic stability and, therefore,that the samples can be used for Thellier-type archaeointensitydeterminations. Powdered slag fragments exhibited very lowmagnetic susceptibilities (specific mass susceptibility <2$10�8 m3/kg). Their corresponding Mössbauer spectra show differencesbetween grayish M1 and yellow/greenish M2 powders. The widerdoublet signal of M1 indicates Fe2þ whereas that of M2 indicates
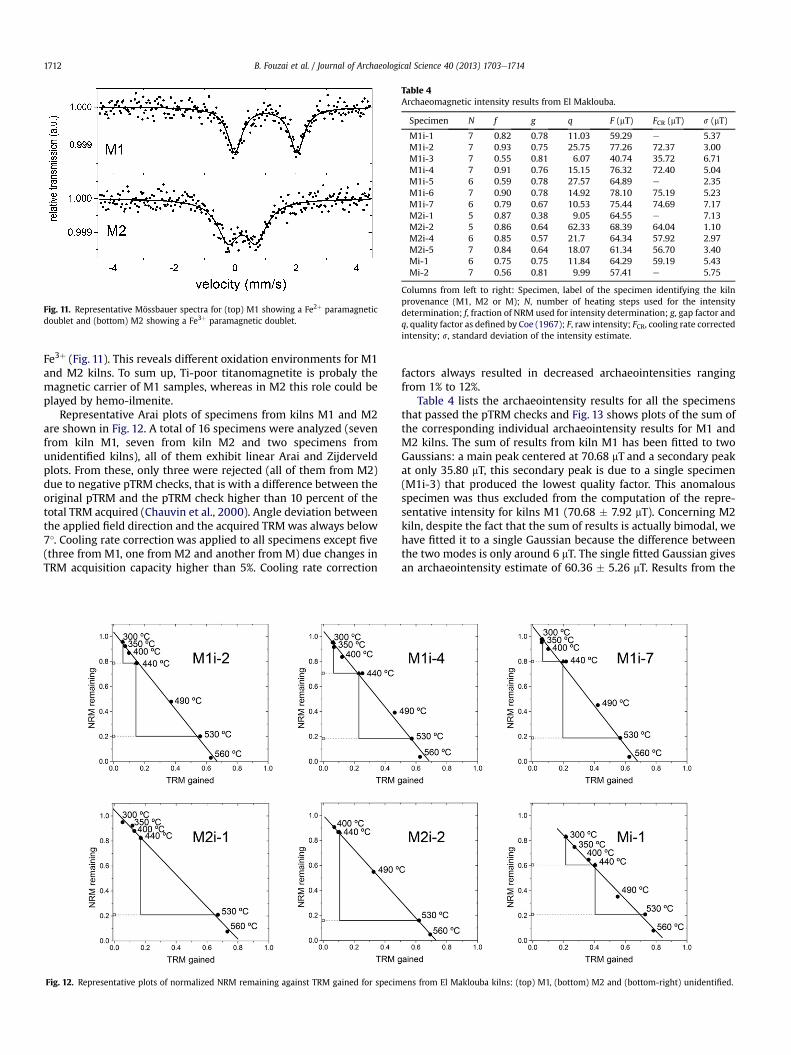
Fig. 11. Representative Mössbauer spectra for (top) M1 showing a Fe2þ paramagneticdoublet and (bottom) M2 showing a Fe3þ paramagnetic doublet.
Table 4Archaeomagnetic intensity results from El Maklouba.
Columns from left to right: Specimen, label of the specimen identifying the kilnprovenance (M1, M2 or M); N, number of heating steps used for the intensitydetermination; f, fraction of NRM used for intensity determination; g, gap factor andq, quality factor as defined by Coe (1967); F, raw intensity; FCR, cooling rate correctedintensity; s, standard deviation of the intensity estimate.
B. Fouzai et al. / Journal of Archaeological Science 40 (2013) 1703e17141712
Fe3þ (Fig. 11). This reveals different oxidation environments for M1and M2 kilns. To sum up, Ti-poor titanomagnetite is probaly themagnetic carrier of M1 samples, whereas in M2 this role could beplayed by hemo-ilmenite.
Representative Arai plots of specimens from kilns M1 and M2are shown in Fig. 12. A total of 16 specimens were analyzed (sevenfrom kiln M1, seven from kiln M2 and two specimens fromunidentified kilns), all of them exhibit linear Arai and Zijderveldplots. From these, only three were rejected (all of them from M2)due to negative pTRM checks, that is with a difference between theoriginal pTRM and the pTRM check higher than 10 percent of thetotal TRM acquired (Chauvin et al., 2000). Angle deviation betweenthe applied field direction and the acquired TRMwas always below7�. Cooling rate correction was applied to all specimens except five(three from M1, one from M2 and another from M) due changes inTRM acquisition capacity higher than 5%. Cooling rate correction
Fig. 12. Representative plots of normalized NRM remaining against TRM gained for specim
factors always resulted in decreased archaeointensities rangingfrom 1% to 12%.
Table 4 lists the archaeointensity results for all the specimensthat passed the pTRM checks and Fig. 13 shows plots of the sum ofthe corresponding individual archaeointensity results for M1 andM2 kilns. The sum of results from kiln M1 has been fitted to twoGaussians: a main peak centered at 70.68 mT and a secondary peakat only 35.80 mT, this secondary peak is due to a single specimen(M1i-3) that produced the lowest quality factor. This anomalousspecimen was thus excluded from the computation of the repre-sentative intensity for kilns M1 (70.68 � 7.92 mT). Concerning M2kiln, despite the fact that the sum of results is actually bimodal, wehave fitted it to a single Gaussian because the difference betweenthe two modes is only around 6 mT. The single fitted Gaussian givesan archaeointensity estimate of 60.36 � 5.26 mT. Results from the
ens from El Maklouba kilns: (top) M1, (bottom) M2 and (bottom-right) unidentified.
Fig. 13. Computation of mean archaeointensities for kilns from El Maklouba: (left) M1 and (right) M2. Dashed line is the sum of all accepted individual archaeointensity results forthe kiln and solid line is the fitting to those sums.
B. Fouzai et al. / Journal of Archaeological Science 40 (2013) 1703e1714 1713
two specimens of unidentified kilns produced 59.19 and 57.41 mT,thus close to the values obtained for kiln M2.
The obtained archaeointensity results were added to theexperimental archaeodirections and compared with the SCHA.-DIF.3K model obtaining a new probability distribution functionwith the most probable dates (see Fig. 7). One of the consequencesof adding the intensity to the computation is the narrowing of theprobable dates indicated by the distribution function, includingthe disappearance of the probability peak indicating ages withinthe 17th to 19th centuries. For the M1 kiln the new combinedprobability function indicates basically a single solution (BC 418e153). For the M2 kiln, the former time interval appears nowdivided in two (AD 102e185 and AD 243e422). It is worth tomention that the presented archaeointensities are not of very highquality because the number of single measurements is rather lowand it is difficult to define the representative intensity value andits uncertainty. Besides this, the SCHA.DIF.3K model possibly doesnot still describe very accurately the evolution of the archae-ointensity in the area under study. Despite these two drawbacks itis interesting to note that the mentioned effects of adding theintensity are almost invariably observed using the two testedCALS3K models (see Fig. 9b and d). This is a surprising result thatpoints to an applicability of the archaeointensity measurementshigher than expected from previous results (Fouzai et al., 2012) inthe area under study and confirms the existing difference in thearchaeomagnetic signature of the kilns M1 and M2. It is worth tonote that no cooling rate correction was applied by Fouzai et al.(2012).
6. Conclusions
New archaeomagnetic data have been reported for Tunisia (fournew archaeomagnetic directions and two new archaeomagneticintensities). From these, data from Kerkuane can be associated toa well-known archaeological age (late-4th BCe3rd BC), whereasdata from the other three sites would need a more constrained agedetermined from archaeological or non-magnetic archaeometricmethods.
Far from being perfect, the SCHA.DIF.3K archaeomagnetic modelindicates:
i) The last use of kiln M1 would have occurred within the BC418e153 time interval, which is consistent with the firstperiod of activity in the El Maklouba site as revealed byarchaeological evidence (4the1st century BC).
ii) The last use of kiln M2 would have occurred within the AD102e422 time interval, which is consistent with the secondperiod of activity in the El Maklouba site as revealed byarchaeological evidence (2nde3rd century AD).
iii) The last use of kiln G1 could have occurred within the BC 68eAD 136 time interval (maximum probability indicating year24 BC), which is consistent with the archaeological hypoth-esis that associates the kiln with the Punic necropolis of ElGaala site, which was in use until the 1st century BC.
In contrast, neither SCHA.DIF.3K nor any of the tested CALS3Kmodels produce solutions with time intervals within the knownarchaeological age of Kerkuane. We can outline three possiblereasons: i) the models are not at all proficient (which is apparentlyinconsistent with the obtained good results for the neighboringsites of El Maklouba and El Gaala), ii) a remagnetization of thestructures of the site occurred later than the occupation of the site(such remagnetization should have produced archaeologicalevidences not reported) and iii) the limited number of collecteddata in Kerkuane and its hybrid nature (samples were gatheredfrom three different kilns are analyzed together) produces theobserved disagreement. We opt for the latter, and future work willinclude resampling at Kerkuane to increase the number ofmeasurements. Data treatment should be done individually foreach kiln and should include intensity estimates. Given that Ker-kuane is a touristic and exceptional site, and from the acquiredexperience, the best candidates to perform resampling are the limekilns.
Archaeomagnetic dating techniques applied to two of the kilnsfrom El Maklouba have permitted to associate them to the differentchronological archaeological phases of a site that amounts at least12 kilns. This should be taken into account if a systematic excava-tion in the site was ever performed. If the suggested chronologywas confirmed by non-magnetic methods, the archaeointensitydistinction between the two periods (4the1st century BC and 2nde3rd century AD) would suggest that the high geomagnetic intensityrecorded in eastern Europe (Pavón-Carrasco et al., 2009) is alsoobserved in Tunisia.
From a wider point of view, the data presented here add to therecently published archaeomagnetic data from Tunisia increasingthe knowledge of the local geomagnetic field and emphasizing thepotential of Tunisia as a target country to carry out archae-omagnetic studies. This kind of studies should be encouraged andconsidered as a possible dating resource for archaeologists inter-ested in northern Africa. Combined archaeodirection and archae-ointensity studies similar to the one undertaken in El Maklouba
B. Fouzai et al. / Journal of Archaeological Science 40 (2013) 1703e17141714
should be extended, when possible, to other Tunisian and NorthAfrican sites.
Acknowledgments
We are grateful to Nejib Ben Lazreg and Habib Ben Younés fromthe Institut National du Patrimoine for authorizing sampling onthe studied sites. Jihene Nacef from the Institut Supérieur desÉtudes Appliquées en Humanités de Mahdia is also acknowledgedfor its support to access some of the sites. We thank Siwar Bakloutiand Marta Moreno for their support during field work. We alsowould like to acknowledge two anonymous reviewers for theirhelpful and insightful comments. This research is part of thecollaboration between the Unité de Recherche Pétrologie cristal-line et sédimentaire de l’Université Tunis El Manar and theGeology Department (Universitat Autònoma de Barcelona)through funds by the Spanish Ministerio de Ciencia e Innovación(project HAR2010-16953) and the Agencia Española de Cooper-ación Internacional para el Desarrollo (Spain-Tunisia bilateralproject A1/039844/11).
References
Ben Lazreg, N., Duval, N., 1995. Le baptistère de Bekalta. In: Paris-Musées (Ed.),Carthage, l’histoire, sa trace et son écho. Paris-Musées, Paris, pp. 304e306.
Ben Younés, H., 2002. El Gaala site périphérique de la Ville de Thapsus (Ras Dimas) àl’époque préromaine. Note préliminaire. In: Africa, Serie Reppal, vol. XII. InstitutNational du Patrimoine, pp. 9e15.
Carvallo, C., Roberts, A.P., Leonhardt, R., Laj, C., Kissel, C., Perrin, M., Camps, P., 2006.Increasing the efficiency of paleointensity analyses by selection of samplesusing first-order reversal curve diagrams. Journal of Geophysical Research 111,B12103. http://dx.doi.org/10.1029/2005JB004126.
Casas, L.L., Incoronato, A., 2007. Distribution analysis of errors due to relocation ofgeomagnetic data using the ‘Conversion via Pole’ (CVP) method: implicationson archaeomagnetic data. Geophysical Journal International 169, 448e454.
Casas, L.L., Briansó, J.L., Álvarez, A., Benzzi, K., Shaw, J., 2008. Archaeomagneticintensity data from the Saadien Tombs (Marrakech, Morocco), late 16th century.Physics and Chemistry of the Earth 33, 474e480. Parts A/B/C.
Chauvin, A., Garcia, Y., Lanos, P., Laubenheimer, F., 2000. Paleointensity of thegeomagnetic field recovered on archaeomagnetic sites from France. Physics ofthe Earth and Planetary Interiors 120, 111e136.
Coe, R.S., 1967. Paleo-intensities of Earth’s magnetic field determined from tertiaryand quaternary rocks. Journal of Geophysical Research 72, 3247e3262.
Dearing, J.A., Dann, R.J.L., Hay, K., Lees, J.A., Loveland, P.J., Maher, B.A., O’Grady, K.,1996. Frequency-dependent susceptibility measurements of environmentalmaterials. Geophysical Journal International 124, 228e240.
Fantar, M.H., 1984. Kerkouane cité punique du Cap Bon (Tunisie), tome I. InstitutNational d’Archéologie et d’Art, Tunis.
Fantar, M.H., 1986. Kerkouane cité punique du Cap Bon (Tunisie), tome III. InstitutNational d’Archéologie et d’Art, Tunis.
Fantar, M.H., 2000. L’urbanisme et l’architecture puniques, le cas de Kerkouane, pp.71e88.
Fisher, R., 1953. Dispersion on a Sphere. Proceedings of the Royal Society of London.Series A. Mathematical and Physical Sciences 217, 295e305.
Fouzai, B., Casas, Ll., Laridhi Ouazaa, N., Álvarez, A., 2012. Archaeomagnetic datafrom four Roman sites in Tunisia. Journal of Archaeological Science 39, 1871e1882.
Gibbins, D., 2001. A Roma shipwreck of c.AD200 at Plemmirio, Sicily: evidence fornorth African amphora production during the Severan period. World Archae-ology 32, 311e334.
Gomez-Paccard, M., McIntosh, G., Chauvin, A., Beamud, E., Pavon-Carrasco, F.J.,Thiriot, J., 2012. Archaeomagnetic and rock magnetic study of six kilns fromNorth Africa (Tunisia and Morocco). Geophysical Journal International 189,169e186.
Kirschvink, J.L., 1980. The least-squares line and plane and the analysis ofpaleomagnetic data. Geophysical Journal of the Royal Astronomical Society62, 699e718.
Korte, M., Donadini, F., Constable, C.G., 2009. Geomagnetic field for 0e3 ka: 2. Anew series of time-varying global models. Geochemistry, Geophysics, Geo-systems 10, Q06008.
Korte, M., Constable, C., 2011. Improving geomagnetic field reconstructions for 0e3 ka. Physics of the Earth and Planetary Interiors 188, 247e259.
Kovacheva, M.A., 1984. Some Archaeomagnetic Conclusions from 3 ArchaeologicalLocalities in Northwest Africa, vol. 37. Dokladi Na Bolgarskata Akademiya NaNaukite. 171e174.
Kovacheva, M., Chauvin, A., Jordanova, N., Lanos, Ph., Karloukovski, V., 2009.Remanence anisotropy effect on the palaeointensity results obtained fromvarious archaeological materials, excluding pottery. Earth Planets Space 61,711e732.
Morel, J., 1969. Kerkouane, ville punique du cap Bon: remarques archéologiques ethistoriques. Mélanges d’archéologie et d’histoire 81, 473e518.
Najid, D., 1986. Palaeomagnetic studies in Morocco, PhD thesis, University ofNewcastle upon Tyne.
Pasa, B., 2011. Recherches sur l’Africa vetus, de la destruction de Carthage auxinterventions césaro-augustéennes, PhD thesis, Université de Toulouse.
Pavón-Carrasco, F.J., Osete, M.L., Torta, M., Gaya-Piqué, L.R., 2009. A regionalarcheomagnetic model for Europe for the last 3000 years, SCHA.DIF.3K: appli-cations to archeomagnetic dating. Geochemistry Geophysics Geosystems 10,Q03013.
Pavón-Carrasco, F.J., Rodríguez-González, J., Osete, M.L., Torta, M., 2011. A Matlabtool for archaeomagnetic dating. Journal of Archaeological Science 38, 408e419.
Peacock, D.P.S., Bejaoui, F., Belazreg, N., 1989. Roman Amphora Production in theSahel Region of Tunisia, vol. 114. Publications de l’École française de Rome.179e222.
Taylor, R.J., Robinson, V.J., Gibbins, D.J.L., 1997. An investigation of the provenance ofthe Roman amphora cargo from the Plemmirio B shipwreck. Archaeometry 39,9e21.
Thellier, E., Thellier, O., 1959. Sur l’intensité du champ magnétique terrestre dans lepassé historique et géologique. Annales de Géophysique 15, 285e376.