31 Archeologia e Calcolatori 19, 2008, 31-43 MAPPING THE FOURTH DIMENSION: A TEN YEAR RETROSPECTIVE 1. Time and maps The limitations of the print medium have had a profound in�uence on the nature of mapping, and speci�cally on mapping in historical disciplines (including archaeology). Printed maps are static, and as a result maps are typically static representations of the status quo at a particular time (or more broadly, period or time range). A number of devices are used in printed maps to represent diachronic information, including time slices, symbology, difference maps and movement arrows (Johnson 1999, 10), but the bulk of temporal information is generally consigned to textual description. Some of the best examples of incorporation of temporal information in printed maps are to be found in the well-developed genre of historical atlases (e.g. Black et al. 2005). Atlas pages are often intended to convey a narra- tive addressing a speci�c theme within a particular geographic and temporal range, such as the development of early civilizations in Asia or the spread of agriculture. These pages are highly schematic generalizations of history and employ a range of devices embedded in a regional map to convey change and movement. The devices used include simultaneous display of non-contempo- raneous phenomena (archaeological sites, settlements, events, cultural regions, empires, etc.) distinguished by symbology and labeling; arrows indicating migration, military campaigns and spread of ideas; timelines of related events, people, dynasties, inventions, military campaigns and so forth; and extensive textual marginalia interpreting the story behind the map. 2. Time and GIS The synchronic nature of most printed maps is re�ected in much of the work in digital mapping and GIS (Geographic Information Systems). The �rst serious works on spatio-temporal GIS date to the early 1990s (e.g. Langren 1992; Peuquet 1994) with the issues �rst raised in Archaeology at a similar time (Castelford 1992), but mainstream GIS such as ESRI’s ArcGIS only introduced temporal functions as late as 2003, and then as an Extension rather than as a function of the core product. It is instructive to look at the genesis of the two main forms of GIS data (vector and raster) to understand why GIS have been so slow to take account of time: – Raster GIS owe their origins to array variables and the storage and manipu- lation of images in 2D arrays (particularly remote sensed images, which may
Transcript
31
Archeologia e Calcolatori19, 2008, 31-43
MAPPING THE FOURTH DIMENSION: A TEN YEAR RETROSPECTIVE
1. Time and maps
The limitations of the print medium have had a profound in�uence on the nature of mapping, and speci�cally on mapping in historical disciplines (including archaeology). Printed maps are static, and as a result maps are typically static representations of the status quo at a particular time (or more broadly, period or time range). A number of devices are used in printed maps to represent diachronic information, including time slices, symbology, difference maps and movement arrows (Johnson 1999, 10), but the bulk of temporal information is generally consigned to textual description.
Some of the best examples of incorporation of temporal information in printed maps are to be found in the well-developed genre of historical atlases (e.g. Black et al. 2005). Atlas pages are often intended to convey a narra-tive addressing a speci�c theme within a particular geographic and temporal range, such as the development of early civilizations in Asia or the spread of agriculture. These pages are highly schematic generalizations of history and employ a range of devices embedded in a regional map to convey change and movement. The devices used include simultaneous display of non-contempo-raneous phenomena (archaeological sites, settlements, events, cultural regions, empires, etc.) distinguished by symbology and labeling; arrows indicating migration, military campaigns and spread of ideas; timelines of related events, people, dynasties, inventions, military campaigns and so forth; and extensive textual marginalia interpreting the story behind the map.
2. Time and GIS
The synchronic nature of most printed maps is re�ected in much of the work in digital mapping and GIS (Geographic Information Systems). The �rst serious works on spatio-temporal GIS date to the early 1990s (e.g. Langren 1992; Peuquet 1994) with the issues �rst raised in Archaeology at a similar time (Castelford 1992), but mainstream GIS such as ESRI’s ArcGIS only introduced temporal functions as late as 2003, and then as an Extension rather than as a function of the core product. It is instructive to look at the genesis of the two main forms of GIS data (vector and raster) to understand why GIS have been so slow to take account of time:– Raster GIS owe their origins to array variables and the storage and manipu-lation of images in 2D arrays (particularly remote sensed images, which may
I. Johnson
32
occur as time series). Raster GIS slice up space and time into a regular grid and require an observation at every grid location (even if that observation is constructed as an absence due to lack of a positive observation, as in the case of site distributions). Even though arrays may be available in a time series, the time slices are �xed and are best suited to recording and analyzing spatially and temporally continuous distributions which can be systematically observed at any point (elevation, soil type, canopy height, temperature, etc.). They are less suitable for discrete objects (such as archaeological sites and settlements) which will typically appear, disappear and change in the gaps between time slices rather than at the times of observation, and which can only be represented as counts rather than through their precise locations and individual attributes. – Vector GIS owe their origins to databases and CAD/CAM tools which, by their nature, tend to deal with objects as they exist (or are intended to exist), not with change. However vector GIS are by nature much more suitable than raster GIS for dealing with temporal change of discrete objects (whether as tightly delimited as a portable artefact or as loosely delimited as a settlement or cultural area), as they can attach attributes to discrete objects which may move and change independent of �xed spatial and temporal divisions. How-ever the adequate modeling of temporal change in both the spatial geometry and attributes of objects is a challenging issue.
While temporal modeling has been an active and sophisticated �eld of database research for many years – since change through time is such an important part of many databases, from museum inventories to �nancial data – the work on temporal databases has been almost entirely aspatial. Similarly, while there is extensive work on spatial data modeling, notably in the GIS �eld, this work has been largely atemporal, except for the processing of time series observations such as vegetation indices derived from satellite images or aerial photography.
There are good reasons why the simultaneous treatment of the spatial and temporal dimensions has been slow to develop – it is a complex issue, as made clear in Langren’s work (Langren 1992). Entities can split, merge, and re-split in overlapping parts; they can change their spatial geometry (location and shape); they can change their attributes; and most of these changes oc-cur asynchronously and/or continuously rather than in discrete steps; �nally it is rarely possible to observe the critical moments in an entity’s trajectory through time and there is rarely enough information to model (rather than just interpolate) trajectories between observations.
3. Towards an “Electronic Cultural Atlas”
The Electronic Cultural Atlas Initiative (http://www.ecai.org/), founded in 1997 by Professor Lewis Lancaster at the University of California Berkley,
Mapping the fourth dimension: a ten year retrospective
33
was initially conceived in terms of digitally delivered atlases of cultural infor-mation in which maps were viewed as a graphical means of representation rather than as a GIS-based rendering of spatial data. Professor Larry Criss-man (Grif�th University, Australia) was in�uential in introducing ECAI to the idea of GIS and GIS datasets, and from 1998 onwards my team at the Archaeological Computing Laboratory (ACL) at the University of Sydney started development of a central ECAI metadata directory and the generation of interactive maps from distributed GIS datasets.
The concept of a GIS-based “electronic cultural atlas” �tted well with research we were doing at the time on the delivery of time-stamped cultural data recorded as vector GIS datasets. At the 1997 Computer Applications in Archaeology Conference (Johnson 1999) I presented a prototype Win-dows-based mapping application with time �ltering (“TimeMap”) and a set of proposals for recording historical entities as time-stamped objects in GIS datasets. The proposal was to develop a time-enabled mapping client which would assemble maps from datasets distributed anywhere on the Internet.
Thanks to initial funding by ECAI from 1998, we were able to develop this TimeMap prototype into a time-enabled webmapping application (ini-tially a desktop application but from 2002 a Java applet running in a web browser) with a central clearinghouse of metadata describing distributed datasets and a Java servlet providing web data and mapping services. The ECAI Clearinghouse (http://ecaimaps.berkeley.edu/clearinghouse/), which is still operational (but little changed in the last 5 years), allows spatial, tem-poral and textual query of the central database (Fig. 1) and the building of a new interactive TimeMap map from a selection of these datasets (Fig. 2). The TimeMap server accessed through the clearinghouse search will also deliver datasets as WMS (Web Map Service) and generate map animations as SWF �les using modi�ed WMS parameters.
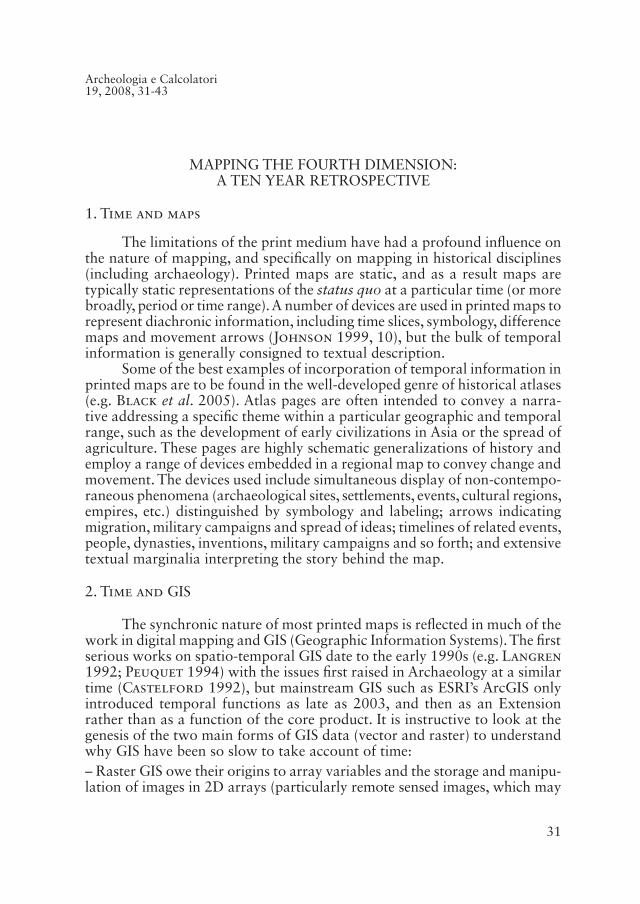
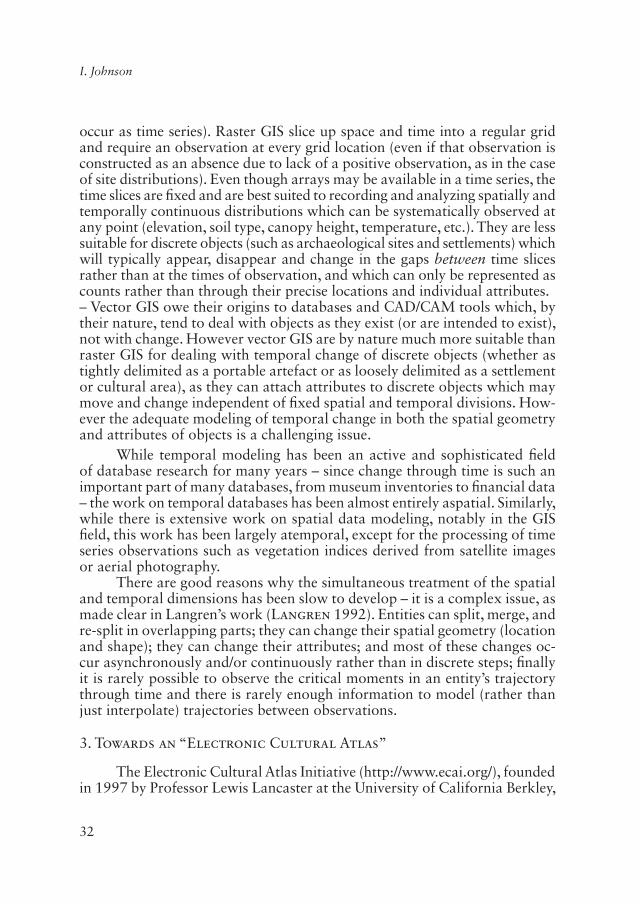
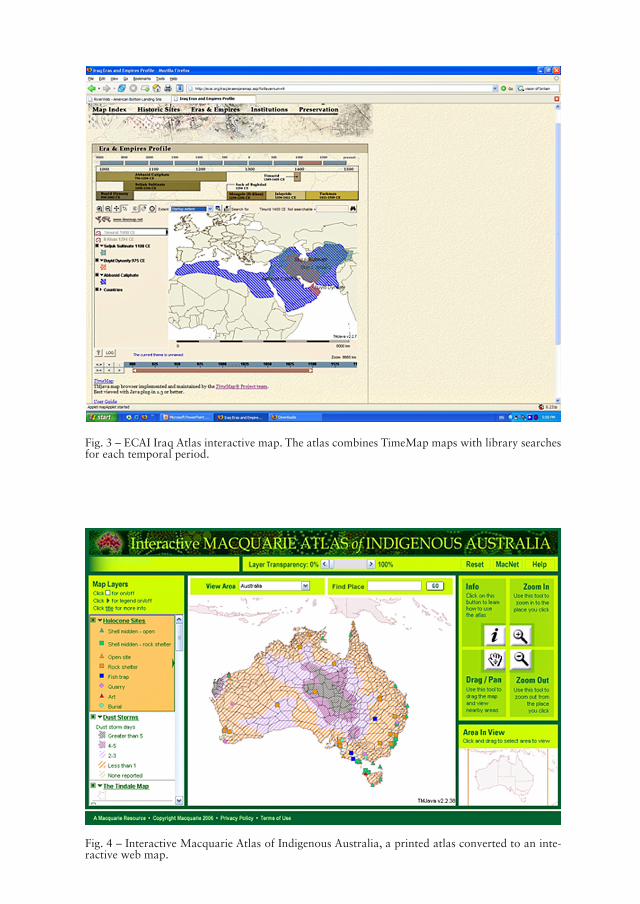
TimeMap and the ECAI Clearinghouse are still the core technology for a range of projects which can be found on the ECAI website, such as the ECAI Iraq Cultural Atlas project (Fig. 3). The ACL has used TimeMap in numer-ous special projects, including the Interactive Macquarie Atlas of Indigenous Australia (http://macquarienet.com.au/macnet/ia.html; Fig. 4) which integrates most of the maps from the printed volume as a single TimeMap-based web map (although created for the printed volume, the maps were developed from the start in ArcGIS with a view to moving beyond the print medium). The ability to run applets from a CD-ROM has been used to deliver maps where Internet connections were not reliably available (refugee resource mapping for Liberia by UNHCR), where there was sensitivity about making informa-tion available via the web (Parramatta Historical Archaeological Landscape Management Study; Fig. 5) and for inclusion in the back of printed volumes (Community Adversity and Resilience Report, Vinson 2004).
Fig. 2 – An interactive TimeMap of historical maps from the David Rumsey Map Library, built from an ECAI Clearinghouse search.
Fig. 3 – ECAI Iraq Atlas interactive map. The atlas combines TimeMap maps with library searches for each temporal period.
Fig. 4 – Interactive Macquarie Atlas of Indigenous Australia, a printed atlas converted to an inte-ractive web map.
I. Johnson
36
However ten years is a long time in the software lifecycle and in many ways the Java applet mapping approach has been overtaken by lightweight browser-based AJAX applications such as Google Maps, Yahoo Maps and OpenLayers. While these applications do not generally have the level of functionality of TimeMap and other applet-based mapping software, they are easily combined with free and community-generated sources of data and other functional components (such as timelines), and mashed up into composite web applications with broad appeal.
At the other end of the mapping spectrum, mainstream desktop GIS applications such as ArcGIS have increasingly developed the capability to connect to web-based spatial data services and include them in maps, and to publish interactive maps on the web using proprietary mapping services. These sophisticated desktop GIS will remain for some time as the tool for profes-sionals to carry out data preparation and analysis, but lightweight mashup webmapping requiring little infrastructure and often using free services, is
Fig. 5 – Interactive TimeMap of Archaeological Management Units for the City of Parramatta in western Sydney, delivered as a CD-ROM with hyperlinks to the NSW Heritage Register.
Mapping the fourth dimension: a ten year retrospective
37
rapidly becoming the tool of choice for delivery of spatial information on the web. This explosion in spatial delivery of information is riding the Web 2.0 wave, driven by free access to worldwide map and satellite data and the increasing ubiquity of GPS and georeferencing as a means of placing com-munity-generated content.
4. Webmapping and social data creation
The ECAI Clearinghouse was in many ways an early precursor of a Web 2.0 application. It allowed people to contribute data to a central mapping server by registering datasets through the Internet, browse data contributed by others, build maps from the data or download these data, and �nally to publish new maps back into the system (Fig. 6). It tracked usage, automated noti�cations and allowed some level of editorial supervision of unsuitable material.
On the other hand, the paradigm and the methodologies were, at that time, neither developed nor accepted, and no reward structures were built into the somewhat involved process of contributing data, so the clearinghouse
Fig. 6 – Structure of the ECAI cultural data collaboration based on the ECAI metadata Clearinghouse and TimeMap application.
I. Johnson
38
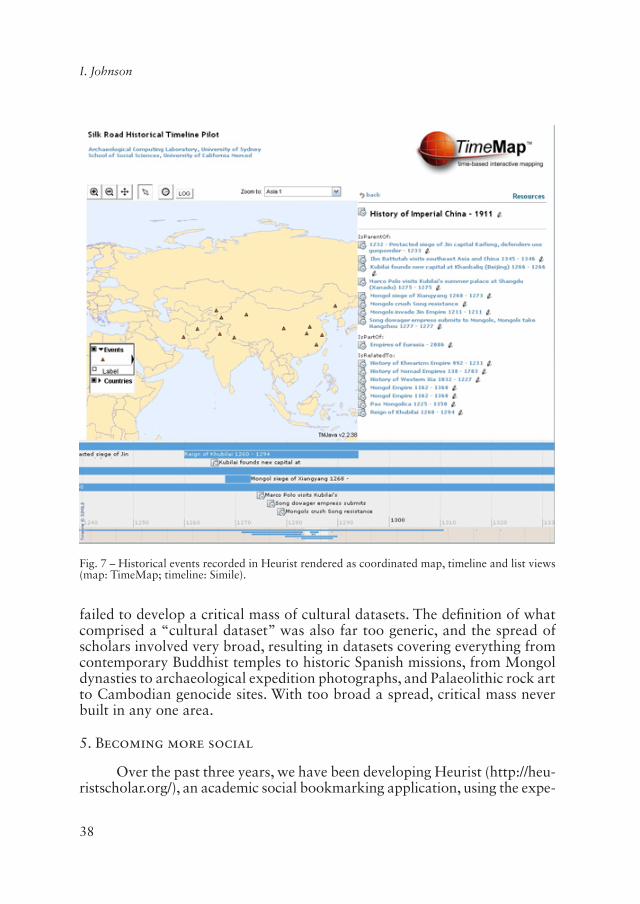
Fig. 7 – Historical events recorded in Heurist rendered as coordinated map, timeline and list views (map: TimeMap; timeline: Simile).
failed to develop a critical mass of cultural datasets. The de�nition of what comprised a “cultural dataset” was also far too generic, and the spread of scholars involved very broad, resulting in datasets covering everything from contemporary Buddhist temples to historic Spanish missions, from Mongol dynasties to archaeological expedition photographs, and Palaeolithic rock art to Cambodian genocide sites. With too broad a spread, critical mass never built in any one area.
5. Becoming more social
Over the past three years, we have been developing Heurist (http://heu-ristscholar.org/), an academic social bookmarking application, using the expe-
Mapping the fourth dimension: a ten year retrospective
39
Fig. 8 – A set of historical events in Heurist rendered using Google Maps and the Simile Timeline.
rience gained through development of the ECAI Clearinghouse and TimeMap. Unlike most social bookmarking applications, Heurist handles a full range of structured bibliographic records and provides a rich, expansible set of database record types, controlled data entry forms, record linking and a wide variety of search and output capabilities, including maps and timelines.
Building on Heurist as infrastructure – in particular using its unique ability to store a time-stamped link record between any two records in the database – we have built a number of applications which map networks of related entities, generally with a time component. We have found that the relationships between historical entities are as important as the entities themselves, and this has led to the development of applications where the user can navigate through a network of relationships, seeing the related entities in coordinated map and timeline views (Fig. 7). These applications have included mapping a European research network and the development of its internal connections; navigating through concepts and resources (photographs, people, places, etc.) in an important Australian historical ac-count (Strehlow 1978); and organizing, browsing and mapping historical information, events and multimedia for the Dictionary of Sydney (http://dic-tionaryofsydney.org/).
I. Johnson
40
Elements of the early proof-of-concept application shown in Fig. 7 have been incorporated in the standard Heurist interface, so that the results of any Heurist search can now be immediately rendered using Simile and Google Maps (Fig. 8) or Google Earth (Fig. 9). We are also developing a generic rela-tionship browser which renders related records (events, projects, institutions, sites or any other type of entity) in appropriate views – including maps and timelines – according to their characteristics.
6. Rethinking timelines
Out of these projects has come a more general methodology for handling networks of spatially and temporally located and interrelated entities. We have been funded by the Australian Research Council for four years (2007-2011) to develop these concepts to model historical events in Heurist, to develop new modes of visualization based on maps, timelines and other forms of visual metaphor, and to develop the pedagogy of these methods of social bookmark-ing and visualization for use in museums and the classroom.
Fig. 9 – The same set of historical events rendered in Google Earth.
Mapping the fourth dimension: a ten year retrospective
41
In Mostern, Johnson (2008) we develop the idea that historical gazetteers should be modeled as a database of naming events with attached geography rather than as a database of geographic locations with attached names, as in conventional gazetteers. We further argue that history can be modeled through historical events linked together by a network of relation-ships (IsCausedBy, IsDependantOn, IsPartOf, IsRelatedTo), from the parent of all events – the existence of the Universe – to the proverbial �ap of a butter�y’s wing. This approach to history raises signi�cant ontological and methodological problems, from the ontology of relationships to ways in which networks of related events can be recorded, �ltered to extract a coherent set, and visualized spatially, temporally and thematically.
While there is well-established methodology and a vast body of practice for representing spatial information in spatially accurate topographic maps, dating back to at least the 17th century in Europe, no such methodology or body of practice exists for representing temporal events as timelines. Of the hundreds, if not thousands, of timelines accessible on the web, the vast majority take a simple linear approach with events represented as points, bars, icons or images (or a combination) along a horizontal time axis, and events stacked vertically and divided into thematic groups (cultures, military campaigns, people, inventions, etc.). Until recently most timelines were static images and used simple scrolling to extend the time range, but the popularity of the Simile timeline component (http://simile.mit.edu/timeline/) has led to many timelines which, while dynamically generated and interactive, continue to adopt this simple linear timeline paradigm.
What is missing from this simple paradigm is any sense of the relatedness of events (other than through temporal co-occurrence) or any sort of granu-larity or scale of events equivalent to the varying level of detail represented in topographic maps at different scales through feature generalization (and also available in many interactive maps through layer replacement). While some pioneering projects have attempted to develop ways of representing the relatedness of events, such as Jensen’s SemTime project (2003) and Drucker and Nowviskie’s temporal modeling project (n.d. and forthcoming) – see André et al. 2007 for a useful review – most projects remain in the simple timeline paradigm. To the best of my knowledge no-one has attempted to develop a theory of temporal generalization of historical events which could lead to a practical implementation, although historians are keenly aware of these issues of temporal scale – see for example Christian’s (2005) “Maps of Time”, in which each chapter focuses on a small temporal section of the preceding one, or the Annales approach to temporal scales.
Another promising line of approach to visualizing historical events lies in the genre of coordinated views exempli�ed by the work of the GeoVista Center (http://www.geovista.psu.edu/), GapMinder (http://graphs.gapminder.
I. Johnson
42
org/world/) and InstantAtlas (http://www.instantatlas.com/). These applica-tions display data in an interactive environment which allows �ltering or selec-tion of items and simultaneous update of multiple views of the data including maps and timelines. They provide an exploratory approach to historical data which can be used in museum and teaching environments. However these applications are still limited to time �ltering, animation and the display of data along a timeline; the challenge will be to combine visualization of rela-tionships with this form of visualization.
7. Conclusion
In this brief review I have looked at the some approaches to spatio-temporal modeling and visualization developed over the last decade as part of the Electronic Cultural Atlas Initiative and the TimeMap project. Heurist and its related visualization tools inherit much of the work which went into the ECAI Clearinghouse and TimeMap, and move beyond them in modeling networks of relationships between events, providing a capable infrastructure for developing spatio-temporal visualizations of historical data.
The challenge is now to develop methods of visualization which com-bine the simple, intuitive nature of a timeline with the essential relatedness of historical events, while also representing their spatial location. Somehow we need to be able to accommodate at least three related views – a map, a timeline (or something like it) and a view of the relationships between the entities plotted. In addition we need to provide automatic methods of gener-alizing historical event data as such an interactive spatio-temporal-relational visualization is navigated. Finally, we need to �nd ways of incorporating such visualizations into a pedagogical approach to history so that they can be used to enrich museums and classroom teaching.
Ian JohnsonArchaeological Computing Laboratory
Digital Innovation Unit for the Humanities, Arts and Social Sciences – University of Sydney
REFERENCES
André P., Wilson M.L., Russell A., Smith D.A., Owens A., Schraefel M.C. 2007, Con-tinuum: designing timelines for hierarchies, relationships and scale. Proceedings of the 20th Annual ACM Symposium on User Interface Software and Technology, Newport, Rhode Island, USA, 101-110.
Black J. et al. (eds.) 2005, World History Atlas, London, Dorling Kindersley.Castleford J. 1992, Archaeology, GIS and the time dimension: an overview, in G. Lock,
J. Moffet (eds.), Computer Applications and Quantitative Methods in Archaeology 1991, BAR International Series S577, Oxford, 95-106.
Mapping the fourth dimension: a ten year retrospective
43
Chainey S., Ratcliffe J. 2005, GIS and Crime Mapping, Indianapolis, John Wiley Publish-ing.
Christian D. 2005, Maps of Time: An Introduction to Big History, Berkeley, University of California Press.
Drucker J., Nowviskie B. n.d., Temporal Modelling: Conceptualization and Visualization of Temporal Relations for Humanities Scholarship (http://www2.iath.virginia.edu/time/reports/infodesign.doc; accessed 14 August 2007).
Drucker J., Nowviskie B. forthcoming, Temporal Modelling: Visualization of Temporal Relations for Humanities Scholarship – Part I: Literature Review and Conceptualiza-tion; Temporal Modelling: Visualizing Temporal Relations for Humanities Scholarship – Part II: Composition Tool Design, «Information Design Journal» (http://www2.iath.virginia.edu/time/reports/infovis1.doc; accessed 14 August 2007).
Jensen M. 2003, Visualizing Complex Semantic Timelines (http://www.newsblip.com/tr/nbtr2003001.pdf; accessed 9 October 2008).
Johnson I. 1999, Mapping the Fourth Dimension: the TimeMap project, in L. Dingwall, S. Exon, V. Gaffney, S. Laflin, M. van Leusen (eds.), Archaeology in the Age of the Internet CAA97, BAR International Series 750, Oxford, 21.
Langren G. 1992, Time in Geographic Information Systems, London, Taylor and Francis.Mostern R., Johnson I. 2008, From named place to naming event: Creating gazetteers for
history, «International Journal of Geographical Information Science», 22, 10, 1091-1108.
Peuquet D.J. 1994, A conceptual framework for the representation of temporal dynamics in Geographic Information Systems, «Annals of the Association of American Geogra-phers», 84, 3, 441-461.
Strehlow T.G.H. 1978, Journey to Horseshoe Bend, Adelaide, Rigby.Vinson T. 2004, The distribution of social disadvantage in Victoria and New South Wales and
the mediating role of social cohesion, Jesuit Social Services, Richmond, Victoria.
ABSTRACT
This article reviews some approaches to spatio-temporal modeling and visualization techniques developed over the last decade as part of the Electronic Cultural Atlas Initiative (ECAI) and the TimeMap project. Heurist, an academic social bookmarking application de-veloped by the Archaeological Computing Laboratory (ACL) at the University of Sydney over the past three years, inherits much of this work, and moves beyond in modeling networks of relationships between events, providing a capable infrastructure for developing spatio-temporal visualizations of historical data. It handles a full range of structured bibliographic records and provides a rich, expansible set of database record types, controlled data entry forms, record linking and a wide variety of search and output capabilities, including maps and timelines. As for the future, the challenge is to develop methods of visualization which combine the simple, intuitive nature of a timeline with the essential relatedness of historical events, while also representing their spatial location. Incorporating such visualizations into a pedagogical approach to history can be used to enrich museums and classroom teaching.