18
Twin Cities Business Architecture Forum Cargill 18 November 2014 1
| Date post: | 02-Aug-2015 |
| Category: |
Documents |
| Upload: | warwick-alcock-mba-ba-hons-b-com |
| View: | 30 times |
| Download: | 0 times |

Twin CitiesBusiness Architecture Forum
Cargill18 November 2014
1

Architecting Core Business Operations1. Goals2. Results3. Start‐up4. Governance5. Business Model6. Value Stream7. Capability Maps8. Strategy Management9. Lessons Learned10. Innovation Drivers
Outline
2

Context• Mid‐sized company• Retail / Supply Chain business• Master Data / SOA initiative under way• Needed insight into business processes• Selected for process reengineering expertise• Evolved into a broader Bus. Arch. Approach
3
Enterprise Architecture
Business Architecture
Information Architecture
Application Architecture
Infrastructure Architecture
Solution Architecture
Conceptual Model

1. Initial Goals
Burning issues:• Understand business processes & constraints.• Improve business processes.• Prepare to replace old systems.
# BIZBOK Guide
3.4 Bus. Process Modeling & Mgmt.
Part 4 Bus. Arch. Scenarios
4

2. Results
• Cross‐functional transparency / integration• Business engagement & empowerment• Process‐based continuous improvement culture• Rational, coherent organization changes• Accelerator for “to be” development
5

3. Start‐up• Office• Team • Organization Diagram• Stakeholder Map• Floor plan• Tools
# BIZBOK Guide
2.3 Organization Map
3.8 Tooling Options
3.9 Maturity Model
Part 5 Knowledge Base
B. 2 Roles & Competencies
Key pointEmbedded with the business
6

4. GovernanceExecutive
Leadership Team
Business Architecture TeamBusiness Architect
Business Process SpecialistPrototyping Team
Process OwnersMiddle Mgmt.Supervisors
SMEs
• Direction• Prioritization• Signoff• Initiatives
• Research • Education • Modeling• Recommendations
• Direction / Vision• Prioritization• Signoff
• Ideation• Workshops• Reviews• Improvement
# BIZBOK Guide
3.2 Governance
• Crucial for:• Org. change mgmt.• Innovative change• Building trust
7

5. Business Model
# BIZBOK Guide
3.3 Business Model
• Start point: High‐level business description• Is ‘dynamic’ • Useful for innovation / add value• Useful for global expansion 8
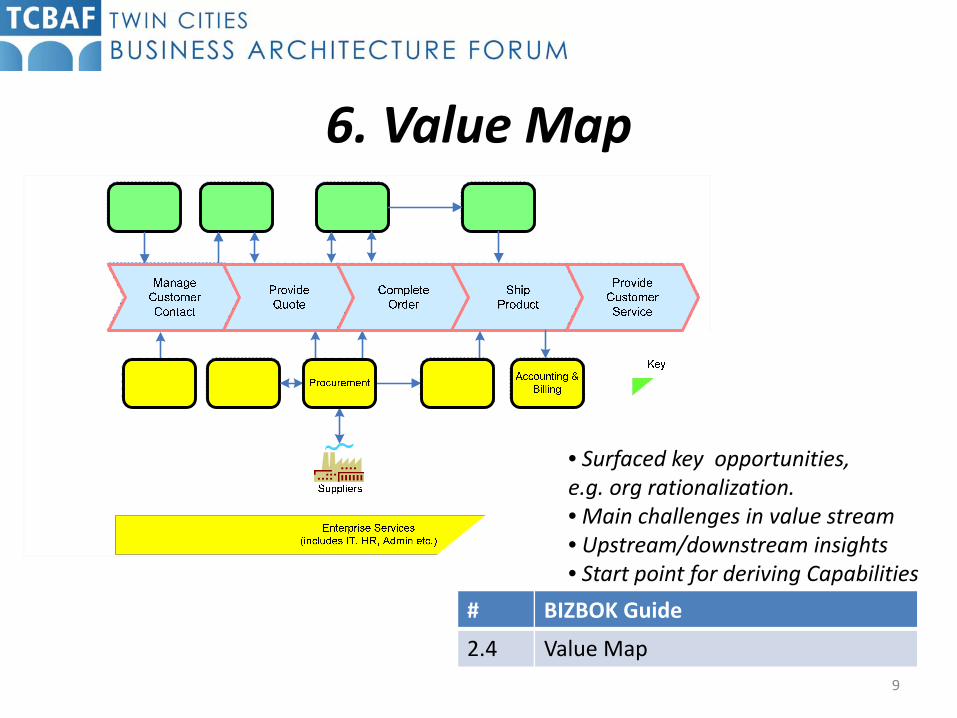
6. Value Map
# BIZBOK Guide
2.4 Value Map
• Surfaced key opportunities, e.g. org rationalization.• Main challenges in value stream• Upstream/downstream insights• Start point for deriving Capabilities
9
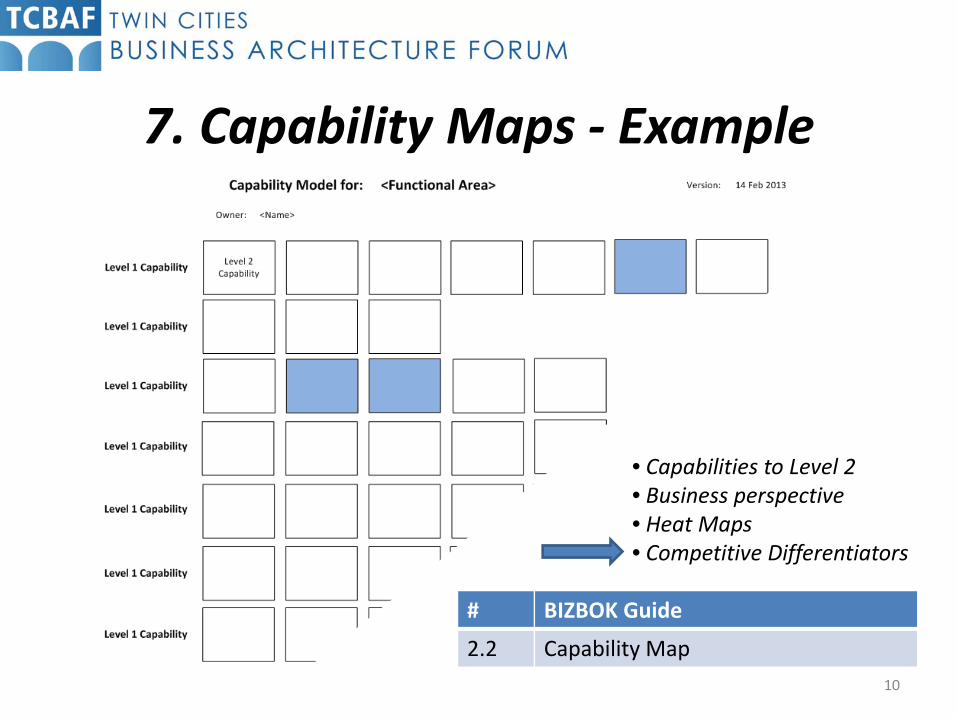
7. Capability Maps ‐ Example
# BIZBOK Guide
2.2 Capability Map
• Capabilities to Level 2 • Business perspective• Heat Maps• Competitive Differentiators
10

• 3+ year Roadmap. Tasks and Metrics by Quarter for first 2 years.• Business Vision is directional & unconstrained = projections, prototypes, etc.• Future State is constrained (e.g. by investment decisions & capacities)• Roadmap is directionally aligned with Business vision & projections• Provides context for holistically integrated organization change management
VISIONFuture State
x-Year Strategic RoadmapCurrent State
8. Strategy Roadmap
• ‘To‐Be’: Ensure capabilities are future‐oriented!• Design out constraints and incorporate innovative best practices.
11

SWOT Analysis
# BIZBOK Guide
2.1 Strategy Mapping
• Basic framework for strategic analysis prior to developing & prioritizing initiatives.• Input to Capability Gap Analysis & Heat Maps.
12
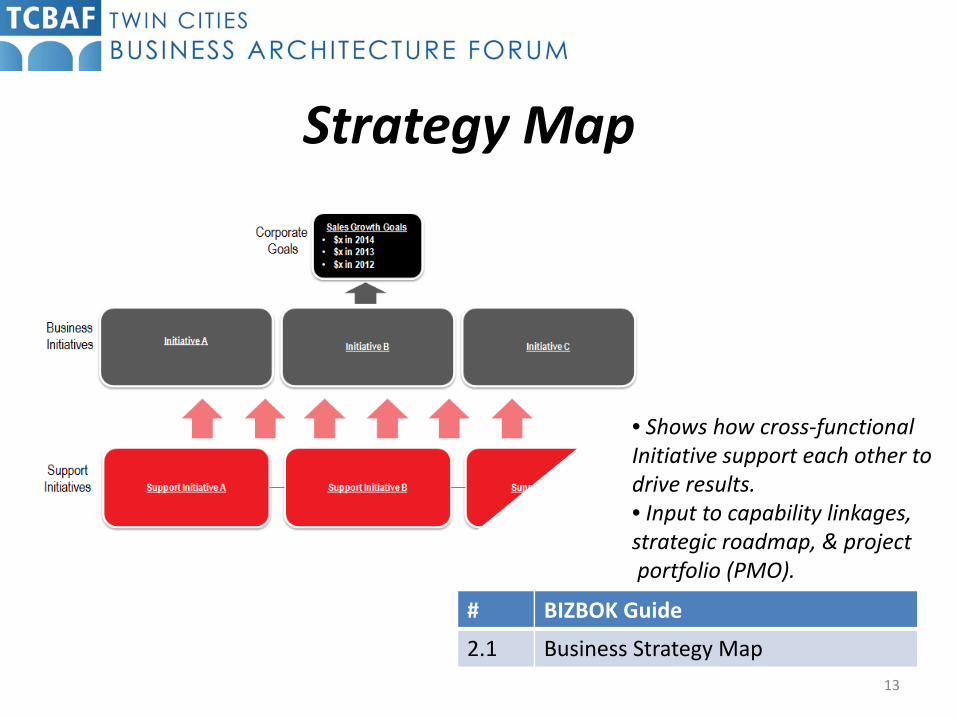
Strategy Map
# BIZBOK Guide
2.1 Business Strategy Map
• Shows how cross‐functional Initiative support each other to drive results. • Input to capability linkages,strategic roadmap, & projectportfolio (PMO).
13

Strategic Roadmap
• Strategic metrics (balanced scorecard)• Key initiatives (project portfolio management)• Shows what capabilities (or interim architectures) must be ready by when
• Strategy may be directive, emergent (innovative), or a blend.• Focus on outcomes, differentiators & ownership.
# BIZBOK Guide
2.1 Business Strategy Mapping
14

Capability: Receiving Dock – Pallet 1 Purpose / Critical Outcomes: Unload palletized product from Carriers and deliver it to Receiving.
2 Guiding Principles / Policies / Core Values : NA
Management Information
3 Key Performance Indicators: Number of pallets per day; All pallet product signed for must be staged for receiving same day.
4 Critical Reports & Report Frequency: Forecasting reports from logistics, Online tracking information from Carriers.
Process Information
5 Business Objects (Items being worked on): Palletized product; Freight Log; Freight bill;
6 Key Business Inputs: Palletized product; Expediting requests; Forecasts.
7 Sources or Suppliers of Inputs: Courier, Expediting department, Logistics
8 Process Roles (excl. Suppliers & Customers in 7, 14): Receiving Dock Assistant.
9 Key Tasks: Unload product from carriers; Inspect physical condition of packaging; Compare received product to Freight Bill; Update Freight Log; Forward copy of Freight Bill to AP (Accounts Payable); Sort for appropriate internal delivery; Deliver product to Receiving.
10 Procedures or work instructions: NA
11 Critical Business Rules: Sort product accurately and deliver in a timely manner to Receiving department. Document exceptions or damage.
12 Key Input/Output devices: PC (Personal Computer); Copier; Rollers; Receiving Baskets; Totes; Receiving Conveyer; Forklift; Carts
13 Key Business Outputs: Unloaded product delivered to Receiving; Freight Bill forwarded to AP, Production supplies distributed to appropriate people.
14 Recipients or Customers of Outputs: AP & Receiving departments
15 Critical constraints:In priority order
1. Space constraints: Difficult to keep associated pallets together that should be processed or expedited together; Delivery and receiving of pallets is done through the same door; Couriers use space inside the building for loading and unloading; Congestion results in workflow challenges.
2. Workload is variable, and backlogs build up on heavy days, requiring overtime work. 3. Backlog and congestion contributes to Accounts Payable missing discounts deadlines, resulting in wasted dollars. 4. Process is very manual – Needs automated scanning system. 5. Some suppliers do not provide advance notice of delivery.
16 Best practices to incorporate: Leverage EDI; Provide proactive end‐to‐end inbound pipeline visibility (Refer Inbound Pipeline prototype)
Process
Information
Applications
Infrastructure
Solution Design & Implementation
Summary• Line‐of‐sight to business context
# BIZBOK Guide
6 Bus. Arch. & IT Arch. Alignment15

9. Lessons LearnedChallenges• Maintenance overhead• Entrenched thinking• IT Bottleneck• Metrics• Legacy platform / “Tribal”• ERP Risks• Staff Turnover• Turf issues • Mgmt. firefighting • Near‐term Vision• Process focus (not holistic)
Insights• 80% of time on Future State• ‘Just enough’ principle• Tailor and adapt (e.g. org. lifecycle)• Exec. Sponsorship / Governance• Change Mgmt: Engage (ongoing)• Research • Innovation Team• Straw models / Wireframes / Prototypes• Lean workshops• Agile development• Link to pain points• Link to differentiators• Link to critical metrics• Deliver value fast (ongoing)
16

10. Innovation Drivers“Push factors” (Burning Platform)• Intolerable / Unacceptable Current State• Global tends (Global, mobile, social, data)• CompetitionProactive Innovation Strategy• Learning Organization (includes, but not limited to, ‘big‐data’)• Innovation Team (Prototyping team)• Customer complaints• Best Practice Gap Analysis (ERP Provider)• Research / Case Studies (e.g. HBR, Gartner, Gallup etc.)• Outside expertise for intractable problems• Improvement workshops with stretch goals (Kaizen events)• Rapid, trial‐&‐error experimentation (Marketing / Pace layers)
17