Page 1
Doctoral School of Earth Sciences
Architecture and Hydraulic Relevance of Brittle Fault Zones in the
Metamorphic Basement of the Pannonian Basin
Töréses vetőzónák szerkezete és hidraulikai jelentősége a Pannon-medence metamorf aljzatában
Ph.D. Thesis
Author:
László Molnár
Supervisors:
Dr. Tivadar M. Tóth
Dr. Félix Schubert
University of Szeged
Faculty of Science and Informatics
Department of Mineralogy, Petrology and Geochemistry
Szeged
2015
Page 2
1
Table of Contents
LIST OF FIGURES .......................................................................................................................................................... 2
LIST OF TABLES ............................................................................................................................................................ 5
CHAPTER I.: INTRODUCTION ................................................................................................................................... 6
I.2 CONCEPTUAL HYDRAULIC REGIMES IN THE FAULT ZONES .......................................................................................... 9 I.3 BASEMENT OF THE PANNONIAN BASIN .................................................................................................................... 10 I.4 AIMS AND STRUCTURE OF THE DISSERTATION........................................................................................................... 13
CHAPTER II.: STATISTICAL CHARACTERIZATION OF BRITTLE AND SEMI-BRITTLE FAULT ROCKS:
A CLAST GEOMETRY APPROACH .......................................................................................................................... 16
II.1 INTRODUCTION ....................................................................................................................................................... 18 II.1.1 Brittle fault zones and their flow properties .................................................................................................. 18 II.1.2 Classification of tectonites and the key problems .......................................................................................... 20 II.1.3 Main aim of the paper ................................................................................................................................... 22
II.2 APPLIED METHODS ................................................................................................................................................. 23 II.2.1 Description of Petrographic Image Analysis ................................................................................................. 23 II.2.2 Measured parameters .................................................................................................................................... 24 II.2.3 Multivariate statistical methods .................................................................................................................... 27
II.3 CASE-STUDY: CRYSTALLINE BASEMENT OF THE PANNONIAN BASIN ....................................................................... 27 II.4 RESULTS ................................................................................................................................................................. 30
II.4.1 Petrography ................................................................................................................................................... 30 II.4.2 Results of PIA ................................................................................................................................................ 32
II.5 DISCUSSION ............................................................................................................................................................ 36 II.5.1 Discrimination of tectonites based on geometric parameters ....................................................................... 36 II.5.2 Possible effects of clast geometry on hydraulic properties ............................................................................ 47
II.6 CONCLUSIONS ........................................................................................................................................................ 48
CHAPTER III.: INTEGRATED PETROGRAPHIC – ROCK MECHANIC BORECORE STUDY FROM THE
METAMORPHIC BASEMENT OF THE PANNONIAN BASIN, HUNGARY........................................................ 50
III.1 INTRODUCTION ..................................................................................................................................................... 52 III.2 GEOLOGICAL SETTING ........................................................................................................................................... 53 III.3 SAMPLES AND APPLIED METHODS.......................................................................................................................... 57
III.3.1 Available samples ......................................................................................................................................... 57 III.3.2 Petrographical and microstructural observations........................................................................................ 57 III.3.3 Description of Petrographic Image Analysis (PIA) ...................................................................................... 57 III.3.4 Statistical analysis of the fault rocks ............................................................................................................ 60 III.3.5 Rock mechanical tests .................................................................................................................................. 61
III.4 RESULTS ................................................................................................................................................................ 62 III.4.1 Petrographical and microstructural observations........................................................................................ 62 III.4.2 Clast geometric results ................................................................................................................................. 65 III.4.3 Rock mechanical tests .................................................................................................................................. 66
III.5 DISCUSSION .......................................................................................................................................................... 69 III.5.1 Interpretation of the microstructural data .................................................................................................... 69 III.5.2 Rock mechanical properties of the fault rocks .............................................................................................. 72 III.5.3 Architecture of the A-2 fault zone ................................................................................................................. 74
III.6 CONCLUSION ......................................................................................................................................................... 76
CHAPTER IV.: A FAULT-CONTROLLED FRACTURED METAMORPHIC RESERVOIR IN THE
PANNONIAN BASIN, SE HUNGARY ......................................................................................................................... 77
IV.1 INTRODUCTION ...................................................................................................................................................... 79 IV.2 GEOLOGICAL SETTING ........................................................................................................................................... 80 IV.3 SAMPLES ............................................................................................................................................................... 83 IV.4 METHODS .............................................................................................................................................................. 85 IV.5 RESULTS ................................................................................................................................................................ 87
IV.5.1 Petrography .................................................................................................................................................. 87 IV.5.2 Well-log data ................................................................................................................................................. 88
IV.6 SPATIAL EXTENSION OF PETROLOGICAL AND WELL-LOG DATA ............................................................................... 90 IV.6.1 Well-log properties of the lithologies ............................................................................................................ 90
Page 3
2
IV.6.2 Structural interpretation of the analyzed part of the SzD.............................................................................. 91 IV.6.3 Paleo-fluid regimes in the analyzed part of the SzD ..................................................................................... 98
IV.7 CONCLUSIONS ..................................................................................................................................................... 104
CHAPTER V.: CONCLUSIONS ................................................................................................................................. 106
V.1 SUMMARY OF THE RESULTS ................................................................................................................................... 106 V.2 OUTLOOK ............................................................................................................................................................. 110
SUMMARY ................................................................................................................................................................... 113
ÖSSZEFOGLALÁS ..................................................................................................................................................... 120
ACKNOWLEDGEMENT............................................................................................................................................ 127
REFERENCES ............................................................................................................................................................. 128
List of Figures
Figure I.1.: Fault sealing mechanisms by Moeller-Pedersen and Koestler (1997) and Fossen (2010). Diagenetic
processes were separated due to their distinct mechanical effects: cementation is often accompanied with fault
hardening, while the weathering and authegenic clay growth result fault softening. ......................................................... 8
Table I.1.: Summary of fault zones typical hydrodynamic behaviour, according to Caine et al. (1996), Evans et al.
(1997) and Manzocchi et al. (2010). ................................................................................................................................... 9
Figure I.2.: Elements of the petroleum system in the Pannonian Basin. The source rocks and the reservoir formations are
mainly Paleogene and Neogene in age, subordinate Mesozoic formations. In the course of the migration the Paleozoic
crystalline basement also takes part in the accumulation. After Horváth and Tari (1999). Legend: 1 –Paleozoic
formations, 2 – Mesozoic formations, 3 - Paleogene and Neogene formations, 4 - Quaternary formations, 5 – source
rocks, 6 – migration pathways of oil, 7 - migration pathways of gas, 8 – reservoirs in the basin, 9 – reservoirs in the
basement. .......................................................................................................................................................................... 11
Figure II.1: a: Core-sample from metamorphic basement of the Pannonian Basin. b: Scanned core photo. c: Clasts
selected for the measurements, drawn one-by-one in Adobe Photoshop. d: Separation of clasts from the matrix for the
measurements in ImageJ. Arrows indicate the long axis orientation of the core. ............................................................. 26
Figure II.2: Location of the Szeghalom Dome in the Pannonian Basin and their geological environment. The contoured
map indicates the depth to the basement in meters. The figure (d) marks the depth interval of the investigated samples in
a schematic north to south cross-section of the area. ........................................................................................................ 29
Figure II.3: a, b: Coarse fault breccia, containing rock (gneiss) fragments (a: in plane polarized light, b: in cross-
polarized light). c, d: Oriented, elongated ribbons of clasts in foliated cataclastic fabric (c: in plane polarized light,d: in
cross-polarized light). e,f: Layers of comminuted gouge contains mainly crushed mono-crystals (e: in plane polarized
light, f: in cross-polarized light). The scale bars are 500 micrometer. .............................................................................. 31
Figure II.4: Results of all geometric parameters. Samples are arranged in order of increasing disintegration. The degree
of disintegration was estimated from the microstructural observations. The results of figure (f) are separated into figure
(g) and (h), due to their strongly different values. ............................................................................................................ 33
Figure II.5: a: The PSD values of different lithologies show rock fragments→polycrystalline
quartz→feldspar→monocrystalline quartz order of fragmentation. Note: extreme grain sizes close to the lower and
upper limit are neglected, as these clasts misfit at the scale of observation. b.: Comparison of PSD values of meso- and
Page 4
3
micro-scale samples from similar depth–interval. The micro-scale samples show constantly stronger fragmentation.
Extreme grain sizes were also neglected in the measurement. ......................................................................................... 34
Figure II.6: Histograms of the analysed geometric parameters. ....................................................................................... 37
Figure II.7: Scatterplot matrix of the variable's data according to Table II.2. In the lower part of the matrix the
correlations of a variable with the other parameters are plotted against the similar data of other parameters. In the upper
part, these are displayed in the case of the covariation. In the diagonal plots, the correlations and the covariances were
plotted for each parameter................................................................................................................................................. 38
Figure II.8: a: Histograms of discriminant functions D(1,2), (2,3), (1,3). In D(1,2) group 3 is close to group 2, in D(2,3)
group 1 to group 2, while in D(1,3) group 2 to group 3. b: The plot of D1 and D2 discriminant functions, showing clear
separation of tectonite types, implying a proper classification of these groups by the combination of their geometric
parameters. c: The two dimensional projection of multidimensional-scaling. The vectors indicate the direction and
strength of the parameters in the multidimensional space. The groups of breccias and cataclasites reflect relatively
similar tendencies, meaning they are determined by the same geometric parameters. The fault gouges have significantly
different characteristics in their geometric properties. ...................................................................................................... 40
Figure II.9: Scree plot of the multidimensional-scaling. The plot of the stress values and the dimensions imply that the
addition of the first four dimension (with PSD, Angle, AR, and Circ parameters) add significantly to the model. ......... 45
Figure II.10: Possible evolution of different tectonites by their geometric parameters. Process 1: initial fragmentation of
the breccias, 2: onset of cataclastic flow and comminution, 3: gouge forming by chipping, abrasion and rounding of
particles and intensive grain size reduction. Numbers denote the extreme PSD values for each group. .......................... 46
Figure III.1: Topographic map of the Pre-Neogene basement of the eastern part of the Pannonian Basin and the
distribution of the basement highs (shaded). Isolines denote depth below the present surface in meters. Inset: Location
of the studied well in the Alpine–Carpathian–Pannonian System. A – Alps, BM – Bohemian Massif, C – Carpathians, D
– Dinarides, PB – Pannonian Basin .................................................................................................................................. 53
Figure III.2: a: Detailed sub-surface topography of Mezősas-Furta Dome. Dots mark the productive wells of the field,
while dashed line indicates the assumed location of the main hydrocarbon accumulation. Isolines denote depth below
the present surface in meters. b: Schematic vertical section of the investigated well and borecores evaluated in this
study. The grey rectangles indicate the location of the samples. ...................................................................................... 56
Figure III.3: Polished surface of a borecore from well A-2 (sample M1) and the clasts selected for the measurements,
drawn one-by-one in Adobe Photoshop. The diameter of the borecore is 6.5 centimeter. ................................................ 58
Figure III.4: Photomicrographs representing characteristic fault rock textures from the samples of A-2. a: Typical
cataclastic texture, which is the most frequent structure of the samples with fragmented and rotated particles (sample
M5). b: Strongly deformed domains between the centimeter-scale particles (sample M6). c: Planes of intensified
deformation denoted by strongly fragmented cataclastic texture among relatively less deformed coarse grains (sample
M4). d: Dilational domain with a weakly disaggregated texture, indicating a characteristic fault breccia texture (sample
M2). e: Strongly foliated fault gouge plane with restricted distribution. The foliation is defined by the phyllosilicate
flakes (sample M8). f: Granular fault gouge, which is regarded as the location of the largest fault displacement. Note the
extremely high matrix ratio, which indicate the comminution of the clasts (sample M10). The scale bars are 500 µm
long. .................................................................................................................................................................................. 63
Figure III.5: a: Illustrated plot of the uniaxial compressive strength and crack propagation stress level, which defined the
onset of stable fracture growth at the 83% of the longterm rock strength, which generally agree with 85% value of the
general ISRM (2006) suggestions. b: Plot of uniaxial compressive strength and Young modulus reveals a quite strong
increasing trend of the measured rock mechanical features, while only two of the samples (M4 and M5) do not fit to this
trend. c: The characteristic stress-stain curves from A-2. Sample M1 a strongly rigid nature with low uniaxial
compressive strength. M4 represent relatively higher σc and necessary work for the failure of the sample, indicating a
strain-hardening nature. In contrast, the stress-strain curve of M10 reveals its strongly plastic and inelastic nature. These
rock-mechanical features follow each other with increasing depth. d: Plot of measured Poisson rates versus the
brittleness indexes with the quite clear separation of the samples derived from distinct fault components: the damage
zone (M1-3), the transition zone (M4-6) and the fault core (M7-10). .............................................................................. 68
Figure III.6: Illustration of measured fault rock samples from well A-2 based on their calculated D1 – D2 values
(detailed in Chapter II.) with characteristic values for each fault component. The reference data of the classification
derived from the adjacent Szeghalom Dome are also displayed. ...................................................................................... 70
Page 5
4
Figure III.7: Characteristic grain size distributions from the three main petrographic zones. These domains reflect higher
PSD values with the stronger observed deformation. The coarse grained brecciated samples have relatively lower PSD
dimensions (< 1.3), while, following the transitional values of the cataclasites, samples from the fault gouge-rich zones
own the highest PSD dimensions (> 1.6). This latter group can be characterised with increasing comminution and
particle size reduction with intensive gouge formation and strain localization. ............................................................... 71
Figure III.8: Schematic composition of the fault zone according to the integrated results of the petrographic and rock-
mechanical investigations. For each fault components, their most characteristic features are displayed with the σc data.
Increasing σc data towards the undeformed wall rock is presumed due to their less deformed nature. Literature data on
the architecture of brittle fault zones suggest the downward continuation of the deformed horizons. Thicknesses of the
fault units are not to scale. ................................................................................................................................................ 74
Figure IV.1: a: Location of the Szeghalom Dome in the Pannonian Basin and its geological environment. b: Szeghalom
Dome in the eastern part of the Pannonian Basin with the adjacent sub-basins and elevated basement highs. c: Locations
of the sampled wells in the central part of the SzD. The contour map indicates the depth to the basement in meters. .... 81
Figure IV.2: a, b: Coarse fault breccia with gneissic origin (1N, +N) (well A-180). c, d: Crushed, slightly elongated
clasts in cataclastic fabric (1N, +N) (well A-180). e, f: Fault gouge clasts composed of crushed mono-crystals (1N, +N)
(well A-180). The scale bars are 500 µm long. ................................................................................................................. 83
Figure IV.3: a: Detailed lithologic composition of the fault zone in well A-180 with the calculated D(1-2) values. The
fault gouge-bearing intervals at 1917, 1922 and 1926 meters indicate the locations of the largest displacements. b:
Theoretical workflow for the determination of the lithologic architecture in the analyzed wells. Functions D(3) and D(4)
are applied only when D(1-2) defines the sample as a tectonite. c, d: Representative well-log sections for undeformed
(c) and deformed (d) depth intervals, which are verified with the borecore data. ............................................................ 85
Figure IV.4: a: Separation of the deformed and undeformed depth intervals using the scores of the calculated D(1-2)
function. The most important well-log parameters used to discriminate the intervals were the natural gamma, density
and resistivity values. b: Discrimination of different fault rock types with the calculated D3 – D4 functions, which are
mainly based on the compensated neutron porosity, resistivity, density and natural gamma log values. ......................... 90
Figure IV.5: Spatial variations of the most important well-log parameters for an idealized fault zone. The darker colors
indicate greater parameter values. According to this interpretation, the deformation is often associated with decreasing
density and resistivity towards the core zone. The most significant porosity enhancement develops in the weaker
fragmented and brecciated zones. ..................................................................................................................................... 91
Figure IV.6: The interpreted lithologic compositions of the analyzed wells. The dashed line indicates the observed low-
angle fault surfaces. The wells form two triplets, including a northern and a southern block. Along with the lithologic
composition, the calculated D(1-2) values are also illustrated along the 1D section of the wells. ................................... 92
Figure IV.7: Basement map of the Szeghalom High with the major interpreted structural elements. The contour map
indicates depth to the basement in meters. The Cretaceous nappe structures were overprinted by complex Neogene
normal faulting. Note that members of the AG group dominate at the top of the basement. For details of transect A-A',
see Figure IV.8. ................................................................................................................................................................. 96
Figure IV.8: West-northwest – east-southeast cross section of the Szeghalom Dome. The dashed lines indicate the
separate paleo-fluid systems based on previous fluid inclusion results (Schubert et al., 2007). The Late Cretaceous
nappe surfaces were cut by high angle Neogene normal faults. Significant storage capacity in the basement is
exclusively related to amphibolite bodies in the AG group. The composition of the basement is unknown below the well
A-22. The horizontal components of the cross section are not to scale. ........................................................................... 96
Figure IV.9: The permeability architecture of a thrust fault zone according to Evans et al. (1997). The highest
permeability values occur parallel to the fault plane and parallel to the slip direction (K(par1)), and the lowest
permeability values occur perpendicular to both the fault plane and the slip direction (K(per)). Transitional permeability
values occur parallel to the fault plane and perpendicular to the slip direction (K(par2)). These results indicate that the
fault zone has a significant (104) permeability anisotropy ratio. .................................................................................... 100
Figure IV.10: Schematic model of the geodynamic and hydrodynamic evolution of the Szeghalom Dome. 1: Coastal
conglomerate (Békés Formation), 2: Basal clay marl, which forms a local aquitard (Endrőd Formation), 3: Turbidite-
rich sediments (Szolnok Formation), 4: Delta front sediments (Algyő Formation), 5: Main brittle fault zones, 6:
Regional fluid flow system. a: Variscan multi-stage metamorphism of the lithologic groups at diverse pressure and
temperature conditions. b: Late Cretaceous nappe tectonics along low-angle thrust faults, which juxtaposed the AG, SG
Page 6
5
and OG lithologic groups. Deformation took place at shallow depths and with unknown overlying rocks. c: Middle
Miocene (Badenian) exhumation of the SzD with the formation of a series of high-angle normal faults and the
deposition of Pannonian clastic sediments. d: Recent hydraulic system of the SzD following Late Miocene subsidence
of the area with significant overpressure under the local aquitard (Endrőd Formation) and the evolution of the ―chimney
structure‖. The cross sections are not to scale. ............................................................................................................... 103
List of Tables
Table II.1: Classification of fault rock–series, adapted from Sibson (1977, 1986), Laznicka (1988), Tanaka (1992) and
Woodcock and Mort (2008). ............................................................................................................................................. 20
Table II.2: Covariance and correlation matrices of the analysed geometric parameters. .................................................. 37
Table II.3: Details of significance test for the discriminant functions with their roots (eigenvalues) and Wilks' lambdas
for the pairwise functions (a) and D1-2 (b). In D1-2 both of the functions add significantly to the classification. .......... 39
Table III.1: Published grain size distribution data of brittle fault rocks, based on the results of Sammis et al.(1987),
Blenkinsop (1991), Storti et al (2003), Keulen et al. (2007). ............................................................................................ 59
Table III.2: Measured clast-geometric data (a) and mechanical constants (b) of the investigated samples. ..................... 66
Table IV.1: The available borecores with their intervals, in meters below sea level. ........................................................ 85
Page 7
6
Chapter I.: Introduction
I.1 Brittle Fault Zones
Brittle fault zones are lithologically strongly heterogeneous structural elements, which
significantly affect the hydrogeological systems in the upper part of the Earth’s crust. Penetration
depth of the meteoric water can reach even 10–15 km (Caine et al., 1996) and faults, as a result of
their barrier, conduit, or mixed conduit/barrier nature strongly govern the local fluid flow from
microscale range up to reservoir-scale. Structural and hydraulic features of the fault zones may
reflect an intense temporal and spatial variation. While, for instance juvenile fault zones may have
permeable behavior, they later may become a barrier in their mature stage. The main fault
components, detailed by Caine (1996) or Evans (1997) are the ―fault core‖ and the associated
―damage zone‖.
Fault core can be defined as the structural, lithological, and morphological part of a fault
zone where most of the displacement is accommodated and the original texture of the protolith
might have completely erased. Fault cores may include tectonites with diverse degree of
disintegration e.g., slip surfaces (Caine et al., 1996), clay-rich gouge (Engelder, 1974) or locally
breccia and cataclasite zones (Chester et al., 1985). Nevertheless, these components usually act as
barriers to the fluid flow due to their significant permeability reduction (Storti et al., 2007).
In contrast, the damage zone suggests a structural transition from the fault core towards the
undeformed wall rock, but it may hydrodynamically reflect a considerable transmissibility
enhancement. Damage zone mainly comprises quite heterogeneous subsidiary components as
secondary faults, fractures, veins and in some cases, slightly fragmented, coarse breccias, which
result a quite anisotropic permeability structure (Caine et al., 1996).
Page 8
7
These components are always surrounded by the undeformed protolith, where fault-related
textures with their effect on the permeability are absent. Moreover, rheologic properties set back to
the original characteristics of the wall-rock. The transition between the damage zone and fault core
is usually sharp, contrary to the damage zone to protolith boundary, which is prevalently gradual
(Caine et al., 1996).
The width, spatial arrangement and the geometry of each unit are defined predominantly by
the lithology, tectonic setting and the stress conditions of the fault formation. From the aspect of the
lithology, it can be accepted as a general rule that ―the faults tend to increase permeability in non-
porous rocks, while they commonly reduce permeability in porous systems‖ (Fossen, 2010). Beside
the previously mentioned components of the theoretic faults, there are numerous factors that can
affect fluid flow in different ways. According to Moeller-Pedersen and Koestler (1997) or Fossen
(2010) the most important processes that control the fault zone permeability are the following (Fig.
I.1):
- Juxtaposed lithologies: The lithological contact relations along a fault are essential, their possible
effects were described in detail by Allan (1989). The scenario, where permeable (e.g. sandstone) is
completely juxtaposed against impermeable (e.g. shale) can be defined as ―juxtaposition seal‖, and
the fault is sealing, regardless of its properties. In the case, when sand is juxtaposed against sand,
the transmissibility of the fault is controlled by its physical properties and can be referred as ―self-
juxtaposed seal‖. If clay or shale (over 40% phyllosillicate content) smeared between the sand
layers can be regarded as ―shale smear seal‖.
- Diagenetic effects: Syn- or post-deformational diagenetic processes can strongly alter the
mechanical and petrophysical properties of the fault rock, which are notable reservoir problem at
temperatures above 90 °C (~ 3 km). Diagenetic processes can result fault hardening (e.g. quartz
cementation) or fault softening (e.g. growth of authigenic clay minerals), depending on the
Page 9
8
physical-chemical details of the reactions (Wintsch et al., 1995). The increasing surface of the
reactants in the fault zones, derived from fragmentation, easily enhance the fluid infiltration along
the fault zones and the fluid-rock interaction.
- Cataclasis or fault gouge formation: Cataclasis in the fault core reduces grain size and therefore
reduces porosity and permeability. This process is promoted by deep (>1 km) burial depths, low
phyllosilicate content (<15% clay or phyllosilicate proportion), well-sorted grains and low pore-
fluid pressure (Fossen et al., 2007). The fault gouge formation is a more advanced fragmentation
process, where fault rock loses its cohesion (Engelder, 1974) and a matrix-dominated micro-texture
evolves. Fossen (2010) showed that the thickness of the gouge zone of brittle faults increases
linearly with total slip. The evolution of these fault rocks is dominated by grain fracturing and
occurs in deformation bands, most frequently in the fault core. The fine-grained nature of clastic
sedimentary rocks results in the evolution of special fault rock types, for example the (framework)
phyllosilicate bands (with phyllosillicate content between 15-40%), which effectively stop fluid
flow or in contrast, the disaggregation zones (deformation bands in poorly consolidated lithologies
with phyllosillicate content below 15%) favor to form conduit zones (Fossen et al., 2007).
Figure I.1.: Fault sealing mechanisms by Moeller-Pedersen and Koestler (1997) and Fossen (2010).
Diagenetic processes were separated due to their distinct mechanical effects: cementation is often
Page 10
9
accompanied with fault hardening, while the weathering and authegenic clay growth result fault
softening.
I.2 Conceptual hydraulic regimes in the fault zones
The fundamental works of Caine et al. (1996), Evans et al. (1996), Storti et al. (2007),
Lonergan et al.(2007) or Manzocchi et al. (2010) defined four characteristic fault zone types, based
on their structure and permeability. The so-called ―localized conduit‖, ―distributed conduit‖,
―localized barrier‖ and ―combined conduit-barrier‖ are the typical fluid flow scenarios (Table I.1.),
where fault transmissibility is strongly influenced by the nature of the damage zone, but mostly by
the thickness, geometry and structure of the fault core. These presented fault zone types more or
less reflect an increasing degree of total displacement, as larger off-sets presume the evolution of
more complex fault architectures.
Table I.1.: Summary of fault zones typical hydrodynamic behaviour, according to Caine et al. (1996),
Evans et al. (1997) and Manzocchi et al. (2010).
The ―localized conduit‖ is a strongly localized fault zone type, where the displacement
occurs along a single surface. There is an absent or only a weakly developed fault core and only a
Page 11
10
few subsidiary structures occur in the damage zone. From modeling aspects, these planes can be
most properly represented as a separated, porous plane for the fluid flow in a discrete fracture
network.
The ―distributed conduit‖ member indicates deformational systems, where the displacement
accommodated in a series of slip surfaces or shear fractures, however, without the formation of a
distributed fault core. As these planes of the displacement own a conduit behavior for the fluid flow,
this fault type can be interpreted as equivalent porous media with estimated fracture permeability
for a given volume.
The ―localized barrier‖ type fault zones include a relatively well-developed fault core, where
the intense fragmentation and cataclasis is frequent, but there is only a thin damage zone. These
fault systems can be modeled with an aquitard (fault core) within an aquifer (undeformed protolith).
Finally, ―combined conduit-barrier‖ fault zones represent well-developed, but often
localized fault core with cataclasis and fault gouge formation, which is encompassed by the damage
zone components. In this sense, aquitard (fault core) developes closed between aquifers (damage
zones) with relatively high permeability parallel to the fault zone and low permeability
perpendicular to it, indicating strong permeability anisotropy. These fault zones can be modeled
most adequately as a dual porosity system and often contain a compartmentalized hydraulic regime,
due to the geometric continuity of the impermeable fault cores.
I.3 Basement of the Pannonian Basin
In the course of recent study, hydrogeologic effects of the fault zones are investigated on the
example of the metamorphic basement of the Pannonian Basin (PB), which is surrounded by the
Alpine-Carpathian-Dinaric orogenic belt. As a result of widespread subsidence during the late
Tertiary ages, the PB was filled up by thick layers of sediments (from 500 m to 7000 m) of middle
Page 12
11
Miocene synrift to the late Miocene-Pliocene postrift origin. According to Teleki et al. (1994), the
sandstones with Pannonian age are the reservoir rocks of most of the currently explored
hydrocarbon accumulations of the PB. Less, but still important reservoirs are the Paleogene clastic
sedimentary rocks (in Szolnok flysch trough or the North Hungarian Paleogene epicontinental
basin) or the Mesosoic fractured carbonates (Zala Basin, e.g., Nagylengyel field) with wide spectra
of age, lithology and possible source rocks (Horváth and Tari, 1999) (Fig. I.2).
Figure I.2.: Elements of the petroleum system in the Pannonian Basin. The source rocks and the reservoir
formations are mainly Paleogene and Neogene in age, subordinate Mesozoic formations. In the course of
the migration the Paleozoic crystalline basement also takes part in the accumulation. After Horváth and
Tari (1999). Legend: 1 –Paleozoic formations, 2 – Mesozoic formations, 3 - Paleogene and Neogene
formations, 4 - Quaternary formations, 5 – source rocks, 6 – migration pathways of oil, 7 - migration
pathways of gas, 8 – reservoirs in the basin, 9 – reservoirs in the basement.
As subdominant accumulations, Paleozoic crystalline rocks provided about 20 smaller fields
in the southern part of PB (Horváth and Tari, 1999), mainly as relatively uplifted basement
domains. The traditional and most frequent explanation for the formation of these pools is the
lateral migration of hydrocarbons out of the mature, Neogene source rocks into the fracture system
Page 13
12
of the metamorphic highs. It is also a long-standing statement that the Pannonian reservoirs usually
form curved arches over the relatively uplifted the basement highs (Dank, 1988). Békés Basin, the
deepest sub-basin of PB, is bordered to north by several Paleozoic highs, which contain significant
amount of accumulated petroleum (e.g., Dévaványa, Endrőd, Szeghalom, Mezősas-Furta,
Sarkadkeresztúr fields). These basement highs are rather heterogeneous mosaic of blocks
concerning their lithological composition and developed through a series of complicated tectonics
following the Variscan multi-phase metamorphism (e.g., Kovács et al., 2000). The pervasive
deformation with predominantly Alpine or Neogene ages at many places associated with notable
porosity enhancement, resulting in permeable intervals not exclusively on the widely known
weathered/altered surface of the basement, but also over hundred meter beneath the top of the basin
highs. All these findings with the recent results (M. Tóth, 2008, Czauner and Mádl-Szőnyi, 2013)
indicate hydrogeologic relevance of the brittle fault zones and the fractured metamorphic host rock
in the petroleum system of the basement.
However, the decipherment of these structures and the prediction of potential traps or
migration pathways within the basement are rather problematic due to numerous causes. The
Paleozoic basement of Tisza unit in the PB (Szederkényi et al., 1991) is predominantly covered by
sediments of a thickness of up to 6 000 metres, so their lithology and the structure can not be
investigated at outcrop scale, which increases the importance of the available drilling documents,
borecores, well-logs and seismic sections. This situation is often further complicated by the
outdated seismic imaging techniques which were applied at the exploration stage of these fields,
mostly in the 1970s and 1980s. As these seismic survey mainly focused on the Neogene clastic
sediments in the overlie or only to the weathered top of the basement, the interior of the Palaeozoic
basement remained essentially undiscovered, due to the sporadic and hardly interpretable reflectors.
Only few attempts were made to locally define its main structure elements via the usage of
sophisticated seismic methods, however, often quite high efficiency (Albu and Pápa, 1992, M. Tóth
et al., 2009). Nevertheless, these studies could not define the quite important subseismic fault or
Page 14
13
fracture generations (Ben-Zion and Sammis, 2003), which undoubtedly have a crucial role in the
flow attributes of the basement highs. In the absence of these data, the evaluation requires a
profound borecore, well-log or well-test analysis and correlation. Numerous, thoroughly explored
basement reservoir with similar properties can point out some possible methods for the evaluation
of the metamorphic highs in the PB (e.g. Gulf of Suez: Egypt, Salah and Alsharhan, 1997, La Paz
Field, Maracaibo Basin, Venezuela: Nelson, 2001, Travis Peak Field, East Texas basin, U.S.A.:
Becker et al. 2010, Sa'yun Masila Basin, Yemen: Murray and Montgomery, 2012, White Tiger field,
Vietnam: Cuong and Warren, 2009).
In recent study, the situation is similar, as described above: numerous wells were drilled on
the examined Szeghalom Dome (SzD) and the adjacent crystalline highs north to the Békés Basin,
however, the number of borecores and well logs are limited and there is no available seismic dataset
from the basement. Further valuable information is provided by industrial reports and well-test
interpretations. Lithological composition and metamorphic pressure-temperature-time pathway for
SzD were summarized by M. Tóth (2008), with the most characteristic lithologies (diverse types of
gneisses, amphibolite and micro-granite) and determined the conceptual lithological framework
model of the highs. The post-metamorphic fluid and fracture network evolution was described by
Juhász et al. (2002) and Schubert et al. (2007), which results comprise the possible date of the
petroleum migration and the details of hydraulic connection with the adjacent or overlying
sedimentary rocks. Although these studies revealed the importance of the brittle fault zones in the
juxtaposition of the diverse metamorphic blocks and subsequent fluid migration, definition of their
spatial arrangement have not been achieved, yet.
I.4 Aims and structure of the dissertation
The forthcoming sections are a selection of published and submitted papers about the brittle
Page 15
14
fault zones and their role in basement hydrocarbon reservoirs of PB. The main aim of this study was
to reveal the manners of the brittle deformation, at least in metamorphic lithology, to define the
main mechanisms and the internal structure of fault zones. In addition, the unraveling of rock
mechanical, rheologic properties of the tectonites was also a target of this work. Finally, the
relevance of the post-metamorphic brittle deformation will be introduced on a selected part of the
Szeghalom basement reservoir, which also comprises a possible method for the spatial extension of
the 1D lithologic data. These outcomes are possibly suitable for defining the most important
tectonic events of the area and explain their role in the fluid history or the recent petroleum system.
Following this brief introduction (Chapter I.), each part of the dissertation represents a
different stage of the research. Chapter II. presents a microstructural analysis of the tectonites on the
example of a fault zone with relatively high borecore recovery from the Szeghalom Dome. As a
part of this, measurement of the shape/size parameters of the particles derived from the brittle
deformation were achieved, both in borecore and thin section scale. The obtained huge database
made their statistical processing possible with purpose to separate the distinct fault rocks and to
reveal the prevalent brittle deformational mechanisms in diverse stages of fragmentation.
In Chapter III. an attempt was taken to define the rock mechanical attributes of the fault
rocks, as an opportunity were provided to analyze their behavior during series of uniaxial
compressive tests on the adjacent Mezősas-Furta Dome, in a similar lithological environment as
observed in the SzD. Furthermore, these new observations could be inserted to clast geometric
system defined in Chapter II., and revealed numerous, interrelation between the degree of
deformation, stress – strain curves and presumed reservoir properties of the fault rocks.
Chapter IV. presents an attempt to partly reconstruct the post-metamorphic structural
evolution of Szeghalom Dome, focusing on to observe the main fault zone systems of the study area
and to define their role in the past or recent petroleum system of the area. This chapter is strongly
based on integrated borecore and well-log interpretation with the findings formulated in the
previous chapters of the dissertation or earlier works on the area.
Page 16
15
Finally, in Chapter V. the summary and conclusions of the whole thesis will be presented,
with the possible direction of the further researches, both on the basement of the PB and the nature
of the fault rocks. An aggregated reference list can be found at the end of the dissertation.
Page 17
16
Chapter II.: Statistical characterization of brittle and semi-brittle fault rocks: a clast
geometry approach
Manuscript published in the Acta Geodaetica et Geophysica: 49/4, 527-550 p.
Doi number: 10.1007/s40438-014-0067-3
Authors:
László Molnár
Department of Mineralogy, Geochemistry and Petrology, University of Szeged, Hungary
Tivadar M. Tóth
Department of Mineralogy, Geochemistry and Petrology, University of Szeged, Hungary
Félix Schubert
Department of Mineralogy, Geochemistry and Petrology, University of Szeged, Hungary
Page 18
17
Statistical characterization of brittle and semi-brittle fault rocks: a clast geometry approach
Abstract
In the present approach, clast geometric parameters - Particle Size Distribution (PSD), Clast
Complexity (DR), Aspect Ratio (AR), Circularity (Circ), Convexity (Conv) and Clast Orientation
(Angle) - were examined in order to separate the diverse fault rock types (fault breccias, cataclasites
and fault gouges), which typically own extremely different hydraulic and petrophysical properties.
The available borecore samples were studied in a case of a thrust fault zone from the metamorphic
basement of the Pannonian Basin, Hungary. Multivariate statistical methods were applied in order
to find the geometric parameters that define the tectonites. The calculated discriminant functions
emphasized the importance of the PSD, Angle, AR, and Circ parameters, in descending order. We
defined proper combinations of geometric parameters which can clearly separate the fault rock
groups, both pair-wise and jointly for the three groups. The discriminant functions also pointed out
the relatively similar geometric features of fault breccias and cataclasites in contrast to the
significantly different characteristics of fault gouges. The multidimensional scaling demonstrated a
three-phase evolution of the analysed brittle tectonites, where the initial deformation is coupled with
chaotic fabric giving a weakly disaggregated fault breccia texture. The transitional stage can be
characterised by cataclastic flow, while in the most deformed fault gouge samples the strong
fragmentation, clast-rounding and oriented texture dominate. These results possible provide
constraints on the development and overall behaviour of the fault zone.
Keywords: Brittle tectonites, Fault rocks, Petrograhic Image Analysis, Tectonite discrimination,
Borecore data
Page 19
18
II.1 Introduction
II.1.1 Brittle fault zones and their flow properties
Intensively fractured basement reservoirs have an increasing role in water and hydrocarbon
production worldwide (P’an, 1982; Nelson, 2001; Petford and McCaffrey, 2003). In these fields,
brittle fault zones play an important part in the hydrodynamics of the whole rock masses (Caine at
el., 1996), as the upper crustal (down to 10-15 km depth) deformation structures can govern the
local hydrodynamic-systems, by their barrier, conduit or combined behaviour (Antonellini and
Aydin, 1995; Caine et al., 1996; Evans et al., 1997; Billi et al., 2003; Storti et al., 2003; Manzocchi
et al., 2010). In the past years, a large number of studies have realised the importance of these
structures and addressed numerous papers for understanding the role of fault zones in hard-rock
reservoirs.
The hydraulic character of a brittle fault zone – besides many other parameters (recent
stress-field, cementation, dissolution, depth and water saturation (Wibberley and Shimamoto, 2003;
Faulkner et al., 2010 among others)) – primarily depends on the consisting tectonites, which are
strongly affected by the interplay of their formation factors, like the protolith type, the degree of
deformation, physical constraints of the paleostress field, and many others (Caine et al., 1996;
Fossen et al., 2007; Manzocchi et al., 2010). The various types of fault rocks have extremely
different flow-properties, thus governing diverse hydraulic regimes, even in the reservoir-scale.
Numerous studies have revealed that brittle displacement zones can be divided into two
main structural elements (Caine et al., 1996; Lee and Kim, 2005; Ben-Zion and Sammis, 2003;
Hausegger et al.; 2010): first, the weakly disaggregated, densely fractured ―damage zone‖ generally
with highly elevated conductivity and permeability relative to the undeformed protolith; second is
the strongly deformed and crushed fault core, where the pre-existing rock fabrics are erased by the
fault development and replaced by fault rocks. This localised zone is the locus of the most of the
Page 20
19
accommodated displacement, coupled with a dramatic drop in the permeability, compared with the
damage zone.
Weakly fragmented and comminuted, coarse-grained fault breccias are often observable in
the fault core, adjacent to the damage zone. These have a slightly decreased permeability in
comparison with the densely fractured damage zone, but a much higher permeability than the
protolith and other parts of the fault core. For this reason, several authors regard these coarse
breccia surfaces as the ―boundary zone‖ (Wibberley and Shimamoto, 2003; Billi et al., 2003).
The most important fault rocks in the fault core are usually cataclasite and fault gouge,
which – due to the pervasive deformation – have suffered the strongest fragmentation (cataclastic
deformation: ―comminution‖, intensive clast rotation, ―abrasion‖ and ―chipping‖) (Sammis et al.,
1986, 1987; Blenkinsop, 1991; Storti and Balsamo, 2010), and the planes of the most considerable
displacements. Advanced failure can be observed in their well-developed internal microstructure,
decreasing amount of clasts against matrix, cement and pore space and the loss of original internal
cohesiveness, which also allows the classification between cataclasite and gouge. Generally,
increasingly localised slip-planes evolve coupled with a dramatic permeability decrease in the fault
core, as a result of a positive feedback between the intensive failure and fault-rock weakening. In
total, cataclasite and fault gouge zones can be regarded as local, hydrodynamic barrier bands in
reservoir-scale (Caine et al., 1996; Evans et al., 1997; Manzocchi et al., 2010).
The large-scale spatial interpretation of basement faults in the subsurface and their
hydrodynamic parameters is problematic, as their appropriate geophysical characterisation is quite
uncertain. As these tectonites resulted from the interplay of numerous, previously mentioned
factors, it is a difficult challenge to find some, generally applicable geophysical parameters for
identification of different segments of fault zones (Bistacchi et al., 2010; Jeppson et al., 2010).
Structural extension can be more problematic, as it is a challenge to define the place of the core
samples in the idealised fault zone in the lack of outcrop, and even more challenging to determine
their extension according to 1D data. These facts increase the role and value of the core-samples,
Page 21
20
but, on the other hand, raise the necessity of a proper petrographical classification system for brittle
fault rocks.
II.1.2 Classification of tectonites and the key problems
Aside from a few early attempts, the main petrographic classification systems of brittle
tectonites are based on specific textural and microstructural properties, described by numerous
studies (Sibson, 1977, 1986; Chester et al., 1985; Sammis et al., 1986; Laznicka, 1988; Tanaka,
1992; Woodcock and Mort, 2008). In these works, the following are the most frequent parameters:
the ratio of visible clasts to matrix, cement, and pore space (―ratio of porphyroclasts‖, mainly
volume per cent), the grain-size, and the ―cohesiveness‖ of the samples (Table II.1).
Table II.1: Classification of fault rock–series, adapted from Sibson (1977, 1986), Laznicka (1988), Tanaka
(1992) and Woodcock and Mort (2008).
The influential works of Sibson (1977, 1986) stated that, in the classification of the fault
rocks, clast ratio and size, cohesiveness and the development of foliations are the most important
properties. Generally, the increasing deformation – due to its mechanism (fragmentation, abrasion,
and comminution) results in a decrease in clast size and also in the ratio of clasts per area to matrix,
Page 22
21
pore-space, and cement. Woodcock and Mort (2008), according to the sedimentological usage,
determined 2 mm as the grain size limit between coarse- and fine-grained fault rocks, because if
30% of clasts are larger than 2 mm then the fault rock can be categorised as fault breccia, while the
cataclasites are below that limit. A fault gouge is identified where only a few isolated clasts occur in
the matrix (the optically visible amount of fragments is under 10%) (Passchier and Trouw, 2005).
However, the 2 mm clast size limit does not necessarily mean a change in the deformation
mechanism, strengthening the statement that grain size is only a descriptive category, and there may
be many more informative genetic factors, such as particle-size distribution (PSD) (Sammis et al.,
1986; Blenkinsop, 1991, Jébrak, 1997); in contrast, grain size is only a simple tool for field
interpretation of the fault rocks.
In numerous cases, the fault rocks may have retained some primary cohesion (Sibson, 1977),
for example as a result of the diffusive mass transfer and sub-critical fracture growth or obtained
through the post-faulting processes, due to the precipitation of cement-minerals from crustal fluids.
The primarily incohesive fault rocks – defined by Brodie et al. (2007) as capable of being broken
into component granules with finger – are mainly the result of shallow-depth deformation. However
this fabric is quite often overprinted by the above mentioned precipitation, resulting in secondarily
cemented structure (Woodcock and Mort, 2008) and causing some difficulty in the definition of
primary cohesion/incohesion. The proposed fault-rock scheme of Woodcock and Mort (2008) omits
the cohesion as an important criterion, qualifying all coarse-grained fault rock as fault breccia. The
only exception that can be regarded as incohesive is the fault gouge, although it is possible that
incohesive structure is related to the weathering of the fine-grained cohesive fault rocks (Woodcock
and Mort, 2008).
Fault rocks, which tend to form by brittle shearing, have long been regarded as having only
random fabric, without any structural indicators of the direction of the shear (Engelder, 1974;
Sibson, 1977; Tanaka, 1992). More recent papers (Chester et al., 1985; Cladouhos, 1999; Wibberley
and Shimamoto, 2003) have proven that there are also observable shear indicators in brittle
Page 23
22
tectonites; however, in the weaker disaggregated breccias, a lack of any orientation is rather
frequent, too.
Generally, the formation of cataclasites and fault gouges with foliations and asymmetric
structures represents pervasive deformation at both the mesoscopic and microscopic scales (Chester
et al., 1985), whose results resemble ductile shear and produce stretching lineations analogous to
mylonites (Lin, 1999), while the deformation is brittle. Numerous microstructural manners are able
to determine the sense of shear; the most frequent indicators are microfaults, shear planes, (grain)
shape-preferred orientation, inherited micas, and deformational bands (Passchier and Trouw, 2005).
Both granular and clay gouges usually show well-developed foliation in the surviving grains and the
surrounding clay-rich matrix (Cladouhos, 1999). However, care should be taken in the interpretation
of the deformation indicators (especially in linear structures) (Tanaka, 1992), as their fabric often
shows only the last stage of the displacement history. The mentioned pseudo-ductile shear in rocks
lacking cementation can dramatically lower the internal cohesiveness of strongly comminuted fault
rocks.
Although there are numerous textural and microstructural parameters for the classification of
brittle tectonites, in this study we attempt to analyse their geometric features and then compare the
results with the earlier data in the literature.
II.1.3 Main aim of the paper
Earlier studies (Sammis et al., 1986, 1987; Blenkinsop, 1991; Jébrak, 1997; Bérubé and
Jébrak, 1999; Clark and James, 2003; Billi et al., 2003; Storti et al., 2003; Billi and Storti, 2004;
Billi, 2007; Mort and Woodcock, 2008; Storti and Balsamo, 2010) demonstrated a connection
between some geometric parameters of fault rocks and their formation conditions, as different
degrees and types of fragmentation processes induce definite changes in the clast geometry.
In this case, our measurements are based on geometric parameters of the clasts resulting
Page 24
23
from deformation, as numerous studies have examined their development in both natural and
experimental conditions (Jébrak, 1997; Keulen et al., 2007, Stünitz et al., 2010 among others). A
wide set of these geometric parameters were analysed by the Petrographic Image Analysis (PIA)
approach, where digitalised two-dimensional images of the samples (core samples at meso-scale
and thin sections at micro-scale) are processed by a proper image analysis program.
This paper aims to define the most characteristic clast geometric parameters of different
fault rock types, which were previously qualitatively classified by their microstructural features. As
these tectonites have rather distinct hydraulic and petrophysical properties (porosity, permeability),
the understanding of the main deformational mechanisms may promote a proper hydrogeological
interpretation of the fault zones. The more accurate 1D extension of lithological information via the
core to log the calibration of wells can be a further benefit of this method, especially in the case of
re-evaluation of old wells (e.g. without borehole imaging).
Our classification attempt will be introduced through a case study on a basement fault zone
from the Pannonian Basin; however the main focus of the paper is to reveal the geometric aspects of
the distinct deformation mechanisms rather than to obtain some new results on the local geology.
II.2 Applied methods
II.2.1 Description of Petrographic Image Analysis
Beyond the traditional microstructural analysis of the samples, which included the definition
of the dominant fault rock types and lithologic composition of the clasts, digital image techniques
were applied to determine the geometric characteristics of the particles. The Petrographic Image
Analysis of meso- and micro-scale samples was used on their two dimensional pictures. Image
processing of the bore-core samples was performed on core-scanner pictures (Fig. II.1): samples
Page 25
24
with intact cylinder-shape could be scanned, resulting in photographs of their outstretched mantle.
The photographs were taken by the ImaGeo core scanner in the Hungarian Geological and
Geophysical Institute (Maros and Pásztor, 2001), with a high resolution digital camera, using the
highest possible quality (0.075 mm pixel size). The micro-scale analysis was achieved on micro-
photographs from selected, structurally representative parts of thin sections, with constant
magnification (×10). In this case, clasts could not be segmented by the usage of a specific threshold
tool as the matrix or cement was too heterogeneous, so the selection of edges was accomplished
manually, one by one, using Corel Draw Graphic Suite X3. The clast geometric measurements were
completed using the selected parameters in the open source ImageJ 1.48.
II.2.2 Measured parameters
II.2.2.1 Particle Size Distribution (PSD)
Many solutions have been proposed for describing brittle tectonite particle size distribution
(PSD). As a consequence, some earlier studies (Sammis et al., 1986, 1987; Turcotte, 1986)
demonstrated the fractal character of the cumulative PSD, with the following equation: N(s)~s-Ds
,
where N(s) is the number of particles smaller than a size s (square root of the area (Blenkinsop,
1991, Clark and James, 2003)), while DS can be determined as the slope of the best fit line on a ln
N(s) against ln s graph. Different DS values are expected for varying degrees of fragmentation
process.
II.2.2.2 Clast complexity (DR)
Several techniques can be used for the determination of clast complexity (structured walk,
box counting, dilation, Euclidean distance mapping, etc.), from which, according to Bérubé and
Jébrak (1999), the ―Fractal Dilation‖ is the most precious method.
The ―Fractal Dilation‖ macro of Image SXM uses a 1 pixel-wide outline of the clasts, which
Page 26
25
is later thickened by the macro, creating 2, 4, 8 and 16 pixel-width ribbons (Kaye, 1989; Clark and
James, 2003). The area of these ribbons is plotted against its thickness on log-log plot, resulting in a
line with an S slope, which is the indicator of clast-complexity fractal dimension (DR) using the 2-
S=DR
equation (Kaye 1989).
II.2.2.3 Aspect Ratio (AR)
The Aspect Ratio (AR) is the proportion of the long and short axes of the ellipse that fits
best to the clast's outline. The ellipse has the same area, long-axis orientation and centre as the
original grain, defined by ImageJ. AR is the degree of elongation of the clasts affected by the
tectonic deformation (Barnett, 2004; Heilbronner and Keulen, 2006).
II.2.2.4 Circularity (Circ)
The value of circularity can be expressed by the equation of 4π (AP/p2), where AP is the area
of the clast, and p is its perimeter (Barnett, 2004; Mort and Woodcock, 2008). This measures how
close the particle's shape is to a perfect circle. According to the above formula, the value of the Circ
varies between 0 and 1, where 0 is an immensely elongated ellipse, while 1 is a perfect circle.
II.2.2.5 Orientation Angle (Angle)
Shape preferred orientation (SPO), or grain shape preferred orientation (GSPO) (Passchier
and Trouw, 2005), of the brittle deformation-surviving grains (especially in the fault gouge) can
show a preferred orientation (Tanaka, 1992; Keulen et al., 2007). The numerical value of orientation
for a single clast is the angle between the long-axis of the clast's best-fit ellipse and the lateral (the
―X‖) axis of the image. In this case, our core samples were not oriented, so the possibly evolved
orientation is only observable in the lowering of the dispersion from the average Angle values of the
clasts, which is numerically manifested in the changes of relative standard deviation values.
Page 27
26
II.2.2.6 Convexity (Conv)
Convexity measures the surface roughness of a particle, calculated by dividing the convex
hull perimeter by the actual particle perimeter. Very smooth shapes have a Conv value close to 1,
while very spiky and irregular objects have a Conv value closer to 0.
Figure II.1: a: Core-sample from metamorphic basement of the Pannonian Basin. b: Scanned core photo.
c: Clasts selected for the measurements, drawn one-by-one in Adobe Photoshop. d: Separation of clasts
from the matrix for the measurements in ImageJ. Arrows indicate the long axis orientation of the core.
Page 28
27
II.2.3 Multivariate statistical methods
Multivariate statistical methods (discriminant function analysis and multidimensional-
scaling) were applied in order to answer the following questions: 1) how reliably can the fault rock
types be distinguished based on their geometric parameters, 2) which parameters are responsible for
characterisation of each group and 3) how do the different stages of deformation manifest in the
measured PIA parameters. Discriminant function analyses were performed to define which
parameters participate in the distinction of differ tectonite types, and to what level, both for pairwise
and for all three groups. Discriminant functions were calculated with the forward stepwise method
using Wilks’ lambda. The probability of F-to-enter was lower than 0.050, the probability of F-to-
remove was above 0.100 and the prior classification probabilities were equal for the lithologic
groups. Discriminant functions were cross-validated to test the efficiency of the prediction model.
The aim of multidimensional-scaling was to set the place of the samples in the theoretical six-
dimensional space of the measured parameters. This method can illustrate the evolution of the
particles from the aspect of geometric parameters and define which parameters can mark the
different stages of deformation. The scree test of the multidimensional-scaling was also computed:
the plot of the stress values against the different number of dimensions. The procedure is similar to
the method of Cattell (1966), which was proposed originally for the factor analysis. IBM SPSS 20.0
Statistics was applied for the statistical evaluation of the results.
II.3 Case-study: Crystalline basement of the Pannonian Basin
The above techniques and their application are introduced in a case study from a basement
fault zone in the Pannonian Basin. The Variscan metamorphic basement of the Pannonian Basin is
intensely fractured as a result of a complex post-metamorphic structural evolution and consists of
Page 29
28
numerous fractured hydrocarbon reservoirs, where the proper understanding of the fault zones is
essential. One of the most important of these basement reservoirs is the crystalline Szeghalom
Dome (Nelson, 2001), which is mainly composed of gneisses of various metamorphic histories.
Szeghalom Dome lies in the northern margin of the Békés Basin, the largest sub-basin in the
southern part of the Pannonian Basin, which is surrounded by elevated basement highs, such as the
studied area (Fig. II.2). The multi-stage tectonic evolution of the area resulted in a dense fracture
network of the host rock body. Following the Variscan metamorphism, the most essential tectonic
event was the Cretaceous compression of the Codru nappe system, which was proved by numerous
earlier papers in the whole basement of the Pannonian Basin (Tari et al., 1999, Posgay et al., 1995).
Moreover, the seismic interpretation on the Szeghalom Dome also indicated the presence of wide
thrust zones throughout the crystalline high (M. Tóth et al., 2009). As a result, metamorphic blocks
with rather distinct evolutions (M. Tóth, 2008) were juxtaposed along these thrust surfaces, with
amphibole gneiss on the hanging wall and sillimanite gneiss in the footwall.
Page 30
29
Figure II.2: Location of the Szeghalom Dome in the Pannonian Basin and their geological environment.
The contoured map indicates the depth to the basement in meters. The figure (d) marks the depth interval
of the investigated samples in a schematic north to south cross-section of the area.
One of these major fault zones was penetrated by a well (A-180), situated north of the central
and most elevated part of Szeghalom Dome, with close to 100% core recovery, making a detailed
petrological investigation possible: 7 borecore (meso-scale sample) and 24 thin section (micro-scale
sample) were involved in the evaluation. The examined section is approximately 20 m wide and
quite heterogeneous petrographically. As the sampled fault zone – according to the palaeo-fluid
investigations (Schubert et al., 2007) and the recent hydrocarbon production data – is the main
migrational pathway inside the studied crystalline basement high, the classification of fault rocks
Page 31
30
with significantly different hydraulic properties is crucial.
II.4 Results
II.4.1 Petrography
Internal structure of the shear zone reflects strong diversity from petrographic aspects,
consisting of different tectonites (breccia, cataclasite, foliated cataclasite, fault gouge). Most of the
analysed meso- and micro-samples were composed of coarse fault breccia, with weakly
disaggregated structures, and often with clast sizes over one mm-scale (Fig. II.3/a-b). Particles are
slightly or not rotated, moreover a local mosaic, ―jigsaw‖ texture can be observed, where the clasts
are relatively easy to fit together along their sharp, angular dilation edges. The lack of any
orientation and the random, chaotic structures are general in coarse fault breccia samples. These
samples are clast-dominant, where the clast ratio is mainly over 30%. Particles are dominantly
composed of rock-fragments, derived from the wallrock, with recognisable gneiss protolith. Mineral
fragments are subdominant in the coarse fault breccia samples.
On a few thin-sections, the manners of cataclastic deformation are observable (Fig. II.3/c-d).
These specimens are usually embedded in breccia regions. Cataclasis resulted in decreasing clast
size and increasing matrix/cement ratio. The possible appearance of local orientation is defined by
the long-axis of the elongated clast, often coupled with deformed phyllosilicate flakes. These rock
types reflect anastomising texture with local pseudo-ductile fabric as well. The protolith of the
strongly deformed particles is locally hard to observe, they are often composed of only a single
mineral phase (mainly quartz or feldspar).
Page 32
31
Figure II.3: a, b: Coarse fault breccia, containing rock (gneiss) fragments (a: in plane polarized light, b:
in cross-polarized light). c, d: Oriented, elongated ribbons of clasts in foliated cataclastic fabric (c: in
plane polarized light,d: in cross-polarized light). e,f: Layers of comminuted gouge contains mainly
crushed mono-crystals (e: in plane polarized light, f: in cross-polarized light). The scale bars are 500
micrometer.
Page 33
32
Incohesive, granular gouge structures are observable only in thin deformational bands (Fig.
II.3/e-f). These stages are the most crushed parts of the fault zone, which are mainly built up by
extremely deformed mono-crystalline clasts. These isolated clasts are surrounded by the totally
crushed parts of the protolith, also showing an anastomising structure, composing a ―flow-banded‖
fabric. Most of the particles are single mineral grains; only a few survivor rock-fragments are
observable. Gouge-bearing bands are always visible embedded in the foliated cataclasite bands.
These few cm wide zones can mark ―slip-zones‖ of the fault zones; these denote the places of the
largest displacements.
According to the studied samples, in the fault zone in question, three main rock types can be
distinguished based on their microstructural features:
- Coarse fault breccia (Group I)
- Cataclasite bands (Group II)
- Strongly deformed, thin gouge layers (Group III)
II.4.2 Results of PIA
The rather complex internal structure of the examined fault zone makes its geometric
parameters suitable for comparison by PIA. The measured values for different tectonite types are
summarised in Fig. II.4, where numbers of the samples indicate their order in the increasing
fragmentation estimated from the microstructural observations.
The PSD fractal dimensions reflect significant, constant increases, both in micro- and meso-
scale samples, as the texture becomes more disaggregated; this is in parallel with the
petrographically-defined increasing deformation, DS
dimensions also emerge (Fig. II.4/a). The
intensively comminuted gouge-bearing zones have the highest DS
results (>1.7) and only the values
of Group III samples exceed the theoretical value of ~1.6 for comminution and cataclasis (Biegel et
al., 1989).
Page 34
33
Figure II.4: Results of all geometric parameters. Samples are arranged in order of increasing
disintegration. The degree of disintegration was estimated from the microstructural observations. The
results of figure (f) are separated into figure (g) and (h), due to their strongly different values.
Page 35
34
Figure II.5: a: The PSD values of different lithologies show rock fragments→polycrystalline
quartz→feldspar→monocrystalline quartz order of fragmentation. Note: extreme grain sizes close to the
lower and upper limit are neglected, as these clasts misfit at the scale of observation. b.: Comparison of
PSD values of meso- and micro-scale samples from similar depth–interval. The micro-scale samples show
constantly stronger fragmentation. Extreme grain sizes were also neglected in the measurement.
From the aspect of clast material, the four main clast-lithology types (rock-fragments,
feldspar, poly- and monocrystalline quartz, respectively) follow different PSD values, in increasing
order of rock-fragments, polycrystalline quartz, feldspar and finally monocrystalline quartz (Fig
II.5/a). In the comparison of the meso- and micro-scale PSD data, it is clearly visible that the meso-
scale samples have constantly lower particle size distribution dimensions than the micro-scale
Page 36
35
values from the same depth interval below the surface (Fig. II.5/b). The transitional gap from the
upper size limit of micro-scale samples to the lower size limit of the meso-scale samples is always
observed in the grain size range between 0.4 mm2
and 0.7 mm2
(Fig. II.5/b).
Circ values show a moderate increase in the Group III samples: all of these samples fall
above 0.65 (Fig. II.4/b). The two less fragmented classes have smaller values without any other
trends; results in both classes are in a narrow interval (in 0.6-0.7 Circ values), although the Group II
samples reflect a slightly increased dispersion in their values.
There is no significant tendency in the values of AR parallel with the observed deformation;
only a moderate increase is visible in the results of Group II samples in comparison with other
classes: all but one Group II sample have AR values over 1.5 (Fig. II.4/c). In contrast, the Group I
and III tectonites usually have AR values lower than 1.5 (Fig. II.4/c). Meso-scale measurements of
AR cannot be applied, because of the geometric distortion derived from the scanned cylinder shape
samples mantle, resulting in false major/minor axis ratios.
No visible trend can be observed between the results of Conv and the different tectonites
(Fig. II.4/d). Mode of convexity values are between 0.8 and 0.9 for every sample, both at micro-
and meso-scales. The only remarkable characteristic is a relatively limited concentration of Group II
values around 0.86–0.88.
In contrast, there is a clear correlation between the degree of deformation and the clast
orientation. Relative standard deviation of Group III samples yields lower Angle values (~around
0.5) than the other two classes, suggesting a more orientated texture with lower fluctuation in the
direction of the clast's major axis (Fig. II.4/e). The SPO degree of core samples was not measured
because of the misleading results derived from their cylinder-shape.
From the aspect of clast-complexity values (Fig. II.4/f), there is a strong difference between
the core-sample and the thin section results. The first class has values that are constantly higher than
1.5 (Fig. II.4/g), while the latter group gives values that are always below 1.15 DR dimension (Fig.
II.4/h). A moderate reduction is visible in the DR
values parallel with the increasing observed
Page 37
36
deformation, especially in the Group III class.
II.5 Discussion
II.5.1 Discrimination of tectonites based on geometric parameters
Based on the results of the microstructural and PIA analysis of the samples multivariate
statistical methods (discriminant function analysis and multidimensional-scaling) were applied.
Only the micro-scale samples were involved into the evaluation, as this type of sample provided
results from each of measured geometric parameter with a sufficient amount of particle (at least 50
per sample), following the instructions of Jébrak (1997) or Clark and James (2003) on the clast
geometric analysis. The histograms of the frequency distributions for the variables revealed that the
parameter values are normally distributed despite of their minor deviations (Fig. II.6). The
correlation and covariance matrices in the Figure II.7 reflect relatively homogeneous dataset,
according to the results displayed in Table II.2, especially in the diagonal plots, where correlations
of the parameters were plotted against the covariances for each geometric feature.
Page 38
37
←Table II.2: Covariance and correlation matrices of the analysed geometric parameters.
Figure II.6: Histograms of the analysed geometric parameters.→
In the discriminant function analysis, first – accepting the petrographic classification – the
tectonite types were compared pairwise to each other in the 6-dimensional space of the measured
geometric factors to detach the distinct groups based on scores of the functions. The computation of
the pairwise discriminant functions was necessary in order to define the main differencies between
the microstructurally often strongly similar lithologic groups (fault breccias vs. cataclasites or
cataclasites vs. fault gouges) and to reveal the possible similarities of the ungrouped sampes to the
grouped samples via predictions. The groups (1: breccia, 2: cataclasite, 3: gouge) were separated by
the following discriminant functions:
D(1,2)=1.168*AR+0.996*PSD-0.858*Angle
D(2,3)=0.905*AR-0.705*Circ+0.642*Angle
Page 39
38
D(1,3)=0.698*PSD+0.684*Circ-0.506*Angle
Figure II.7: Scatterplot matrix of the variable's data according to Table II.2. In the lower part of the
matrix the correlations of a variable with the other parameters are plotted against the similar data of
other parameters. In the upper part, these are displayed in the case of the covariation. In the diagonal
plots, the correlations and the covariances were plotted for each parameter.
The significance tests of the discriminant functions are displayed in the Table II.3/a,b: all of the
pairwise functions are significant and have a quite good correlation (D1,2: 0.929 D2,3: 0.891, D1,3:
0.924). To test their efficiency, the classification functions were cross-validated and these resulted in
a relatively high accuracy (D1,2: 92.3 D2,3: 094.1, D1,3: 100% of the samples were clasified
correctly). In the pairs of groups, the following prediction can be made for the actually ungrouped
samples (Fig. II.8/a):
Page 40
39
D(1,2): gouge is mainly grouped as cataclasite
D(2,3): breccia is mainly grouped as cataclasite
D(1,3): cataclasite is mainly grouped as breccia
Table II.3: Details of significance test for the discriminant functions with their roots (eigenvalues) and
Wilks' lambdas for the pairwise functions (a) and D1-2 (b). In D1-2 both of the functions add significantly
to the classification.
Page 41
40
The significance tests of the discriminant functions are displayed in the Table II.3/a,b: all of the
pairwise functions are significant and have a quite good correlation (D1,2: 0.929 D2,3: 0.891, D1,3:
0.924). To test their efficiency, the classification functions were cross-validated and these resulted in
a relatively high accuracy (D1,2: 92.3 D2,3: 094.1, D1,3: 100% of the samples were clasified
correctly). In the pairs of groups, the following prediction can be made for the actually ungrouped
samples (Fig. II.8/a):
D(1,2): gouge is mainly grouped as cataclasite
D(2,3): breccia is mainly grouped as cataclasite
D(1,3): cataclasite is mainly grouped as breccia
Figure II.8: a: Histograms of discriminant functions D(1,2), (2,3), (1,3). In D(1,2) group 3 is close to
group 2, in D(2,3) group 1 to group 2, while in D(1,3) group 2 to group 3. b: The plot of D1 and D2
discriminant functions, showing clear separation of tectonite types, implying a proper classification of
Page 42
41
these groups by the combination of their geometric parameters. c: The two dimensional projection of
multidimensional-scaling. The vectors indicate the direction and strength of the parameters in the
multidimensional space. The groups of breccias and cataclasites reflect relatively similar tendencies,
meaning they are determined by the same geometric parameters. The fault gouges have significantly
different characteristics in their geometric properties.
These results indicate that cataclasites can be separated from the other two tectonite types
mainly by their AR values. In addition to this, the strong role of the Angle and PSD data in function
D(1,2) emphasise their importance in differentiation between breccias and cataclasites, while the
Circ values have high weight in the distinction of gouges from the other two groups. Angle data are
participating in all of three discriminant functions, indicating their importance in the separation of
tectonites with every degree of deformation. Beyond the obvious predictions of discriminant
functions D(1,2) and D(2,3) (gouges are grouped as cataclasites, instead of breccias and breccias are
grouped as cataclasites instead of gouges), the results of D(1,3) indicate that the cataclasites are
generally more similar to breccias than to gouges.
In the following, the three groups of tectonites were compared to each other by calculating
the following D1-D2 discriminant functions (Fig. II.8/b):
D1= 0.731*PSD-0.588*Angle+0.553*Circ
D2= 0.974*AR+0.94*PSD-0.271*Circ
According to the significance test of the D1-2 functions (Table II.3/c,d), both of the roots
(the eigenvalues of the functions) add significantly to the classification. The larger proportion of the
variance is related to D1 (82.7%, D2: 17.3%), and the functions have a fairly good canonical
correlation (D1: 0.917, D2: 0.725). High prediction accuracy was obtained from cross-validation of
the prediction model: 95.8 % of the cases were classified correctly. In the D1 function, the PSD has
Page 43
42
the highest weight, followed by Angle and Circ values. As the D1 values remarkably increase in
parallel with the petrographically observed deformation, this indicates that these parameters are the
markers of the degree of deformation, while the three other factors (DR, Conv, AR) have subordinate
roles. This also means that the measured PSD dimensions reflect a connection with the observed
deformation, in accordance with the results of earlier authors (Sammis et al., 1986, 1987,
Blenkinsop, 1991, Storti and Balsamo, 2010), who pointed out that the increasing deformation
manifests in an increasing number of relatively smaller particles, which results in a higher DS
dimension.
In connection with the role of PSD values, it is important to reveal the relationship between
the two measured scales. From the aspect of comparison of mechanical behaviour of the meso- and
micro-scale samples, there is a strong difference according to the fragmental properties by the PSD
values. The significantly lower DS values of core samples can be the result of the weaker
deformation, while the high values of micro-scale samples suggest strong fragmentation. The values
considering macro- and micro-scale representing the same depth interval show an abrupt change in
the tendency of PSD values, between grain sizes of 0.4 and 0.7 mm2, suggesting a mechanism
change. This could be in connection with the entrance of single-mineral phases, as the particle size
reduction reached the level of micro-scale clasts. The PSD values imply the mechanical strength of
the particles in the order of rock fragments→polycrystalline quartz→feldspar→monocrystalline
quartz. These results, with the abundance of monocrystalline quartz grains in the most deformed
fault gouge samples, coincide with the earlier studies regarding the strength of quartz particles
(Heilbronner and Keulen, 2006).
The parameter Circ also has a high weight with regard to D1 function, implying that its values
increase in parallel with the progressive deformation. The evolution of higher Circ values in the
intensely deformed samples can be the result of the gouge formation, which was strengthened by
numerous earlier papers (Engelder, 1974, Storti et al., 2007, Storti and Balsamo, 2010); chipping,
rounding and abrasion result in a more circular outline on the clasts in the fault gouges. All of these
Page 44
43
processes abrade the sharpest parts of the grain boundaries due to the intensive particle interactions.
The Angle values have strong negative weight in the D1 function. This implies that the
developing orientation (the decreasing relative standard deviation of the long-axis angle values)
evolves in parallel with the increasing deformation, as the previous, chaotic structure is replaced by
a more oriented fabric. This implies that the angles of particle's long axes have lower scattering, by
accepting the statement that the long axes reflects the orientation of a single clast, according to the
evolution Grain Shape-preferred Orientation (GSPO) (Cladouhos, 1999).
The discriminant function D2 is strongly determined by the AR and – just like in D1 – PSD
values, while the Circ has a lower role; in contrast, the other three (DR, Conv, Angle) parameters are
subordinate. As D2 function clearly separates cataclasites, this implies that the AR has a strong role
in their identification, together with the previously mentioned PSD data.
The strong role of AR values, especially in cataclasite samples, is probably connected to the
propagation of the shear-parallel fractures. This has previously been reported as a specific sign of
the evolving cataclastic texture, where the emerging orientation is usually marked by the direction
of the elongated grains, resulting in grain shape-preferred orientation (GSPO) (Tanaka, 1992). The
reduction of AR in the most deformed samples could be the result of the above mentioned rounding
related to the gouge generation (chipping, abrasion, fracture propagation perpendicular to the shear
plane), where wear of the clasts favours the formation of particles with a more isometric shape
(Storti et al., 2007). The parameters not mentioned (DR
and the Conv) have only limited roles in
both discriminant functions, which means that either they are not able to distinguish tectonites or
their role can be expressed more properly by the combination of other parameters. Aside from their
relatively weak role in the discrimination of different tectonites, it is necessary to detail their
possible tendencies in a few words.
According to the earlier studies (e.g. Jébrak, 1997), there is a good correlation between DR
dimensions and the intensity of the chemical alteration processes. In this case, from the micro-scale
samples – by the DR
results – the breccias suffered the strongest fluid-rock interaction, while the
Page 45
44
fault gouges – with the transitional values of cataclasites – show the lowest DR
dimensions. The
most intensely deformed fault gouge clasts, which are mainly composed of monocrystalline quartz,
seemingly do not favour strong fluid-rock interactions, which is in contrast to the less deformed
particles. The changes in Conv data do not/only slightly correlate with lithological types. These
results imply that the chemical resistivity of the clasts increases in parallel with the deformation.
The extremely different values of meso- and micro-scale DR
data raise the question about
their possibly distinct origin. According to Lalonde et al. (2010), these two, strongly dissonant
groups of DR
dimensions can be derived from the action of different reactions, namely, the diffusion
limited-regime and the kinetic regime, respectively. The diffusion limited-regime acts at a thin
section scale, while the scale kinetic regime is more characteristic in core sample clasts (Jébrak,
1997, Lalonde et al., 2010). The diffusion-limited regime is governed by the diffusion rate of the
reactants, and only the most exposed parts of the solid (such as the corners) are reached by these
reactants. This regime therefore leads to a relative smoothing of the external grain surfaces
(Lalonde et al., 2010), especially in thin section scale samples, where single mineral particles are
abundant. The kinetic regime is characterised by a consumption rate that is limited only by the
chemical reaction rate. The concentration of the reactants is the same everywhere and the external
surface of the solid is totally exposed to the reactants, leading to a progressive increase in the clast-
complexity (Lalonde et al., 2010); this is visible in the rock-fragment dominant meso-scale samples.
In the following, the relative positions of the samples in the theoretical six-dimensional
space of the measured geometric parameters were computed using the multidimensional-scaling
algorithm in order to reveal their possible relationships (Fig. II.8/c). The calculated two-
dimensional projection clearly illustrates the relative spatial position, as well as evolution trends of
the different tectonites. Both breccias and cataclasites reflect significant variability along the same
direction. This direction is defined by the projected axes of AR, PSD and Angle parameters, while
other parameters have close to constant values or reflect relatively low changes along this direction.
In contrast, fault gouge samples change along a direction almost perpendicular to the previous
Page 46
45
orientation, which is marked by the theoretical directions of PSD and Circ values. This implies that
the groups of breccias and cataclasites are defined by the same parameters, while the fault gouges
show characteristically different evolution, which is visible in their different determining
parameters.
Figure II.9: Scree plot of the multidimensional-scaling. The plot of the stress values and the dimensions
imply that the addition of the first four dimension (with PSD, Angle, AR, and Circ parameters) add
significantly to the model.
The scree plot resulting from the multidimensional-scaling is illustrated on Figure II.9.
Important feature of the plot is the steep decreasing in stress values during the addition of the first
four dimensions. The process is followed by shallowing of the slope, which indicates the four
dimensional solution of the multidimensional-scaling. This flat stage reveals that the effect of the
fifth and sixth dimension is negligible as these provide only minimal improvement to the validity of
the model (e.g. decreasing in the stress value). All these observations on the position and structure
of the axes point out that the relative position of the samples can be defined by their AR, PSD, Circ
and Angle values.
Page 47
46
By the statistical evaluation of the three tectonite groups and the marking of important
distinctive geometric parameters, the pathway of deformation and the related mechanisms can also
be identified (Fig. II.10). Directions of progressive fault rock evolution are inferred from the
microstructurally defined order in the degree of the fragmentation of micro-scale samples. The
initial deformation is marked by the progressive evolution of breccias, which is observable most
characteristically by the increasing AR values coupled with chaotic fabric giving a typical weakly
disaggregated, coarse fault breccia texture. This can mark the mechanism of the initial
fragmentation, which is primarily visible in their increasing elongation (along Process 1). The
slightly decreasing PSD values along the Process 1 imply that this parameter has only a subordinate
role in the evolution of fault breccias. The fragmentation – marked by the PSD – possibly becomes
an important factor in the advanced stages of deformation. The onset of comminution and
cataclastic deformation is marked by the appearance of increasing GSPO with clast elongation as a
result of shear-parallel fracture-propagation.
Figure II.10: Possible evolution of different tectonites by their geometric parameters. Process 1: initial
Page 48
47
fragmentation of the breccias, 2: onset of cataclastic flow and comminution, 3: gouge forming by
chipping, abrasion and rounding of particles and intensive grain size reduction. Numbers denote the
extreme PSD values for each group.
The result of multidimensional-scaling demonstrated that the increasing intensity of
cataclastic flow (comminution, clast rotation, micro-fracturing and sliding along these fracture
planes with locally anastomising texture (Hirono et al., 2008)) leads to a more oriented structure,
marked by a decrease of the Angle values. Prevailing surface abrasion, chipping and grinding in the
cataclasites tend to decrease the AR values as a result of the presence of fractures perpendicular to
the shear plane, which is visible in the parameter changes along Process 2. This process transforms
to fault gouge formation (Process 3) through the development of a strongly oriented structure with
progressively increasing PSD values, the dominantly rounded particles and the evolved GSPO. The
totally comminuted texture of fault gouges reflects a distinct group with regard to their geometric
parameters in comparison with the two earlier groups: according to the statistical evaluation of PIA
data, the breccias and the cataclasites have strong connection in the evolution of their geometric
properties (although there are parameters which are able to distinguish them), while fault gouges
follow clearly different trends in the clast geometric data.
II.5.2 Possible effects of clast geometry on hydraulic properties
The observed petrographic and clast geometric parameters indicate that there is presumably
a strong connection between particle size/shape and the fluid flow properties of fault zones.
Angular particles inhibit rolling and mainly deform by stick-slip motion, fragmentation, and
dilatation (Blenkinsop, 1991), resulting in weakly disaggregated angular rock-fragments. According
to Storti et al. (2007), the abundance of coarse, angular clasts may maintain enhanced
transmissibility by protecting the pore spaces between the fragments. In contrast, the rounded fault
Page 49
48
gouge particles resulting from comminution accommodate shear by the low-friction mechanism of
rolling (Hecht, 2000; Storti et al., 2007). This mechanism results in stable-sliding tendencies in
these localised zones, which implies a fault weakening behaviour and – via positive feedback
between the gouge generation and the strain localisation – an increasing concentration of
displacement.
From the perspective of reservoir properties, the fluid flow behaviour of the examined fault
zone is under the control of gouge-bearing fault core layers. The strain localisation can protect the
elevated porosity and permeability of the coarse breccia-bearing zones compared to the undeformed
protolith. In contrast, thin gouge layers usually have extremely weak fluid flow properties, which
can result in the compartmentalisation of the hydraulic regimes in the fault zone (Caine et al.,
1996).
II.6 Conclusions
According to the measured parameters (PSD, DR, AR, Circ, Conv, and Angle), their proper
usage is able to determine the typical geometric features of different tectonites. In order to
distinguish fault rocks based on their clast geometric attributes and to reveal the main mechanisms
of deformation, multivariate statistical methods were applied. The discriminant function analysis
defined the appropriate combination of parameters for the separation of different tectonites and
pointed out the relatively similar geometric features of fault breccias and cataclasites in contrast to
the significantly different characteristics of fault gouges. The multidimensional scaling
demonstrated a three-phase evolution of the analysed brittle and semi-brittle tectonites, reflecting
strongly distinct deformational pathways in each stage. The importance of parameters according to
their weight in the applied functions were the following, in descending order: PSD, Angle, AR, and
Circ. Application of the above methods separates the fault rocks with diverse petrophysical
Page 50
49
properties and also provides an opportunity to extend microstructural information gained at
borecore-scale to spatial data, which can provide answers on the overall behaviour of the fault zone.
Page 51
50
Chapter III.: Integrated petrographic – rock mechanic borecore study from the metamorphic
basement of the Pannonian Basin, Hungary
Manuscript accepted by the Open Geosciences on October 13, 2014
Authors:
László Molnár
Department of Mineralogy, Geochemistry and Petrology, University of Szeged, Hungary
Balázs Vásárhelyi
Department of Structural Engineering, Pollack Mihály Faculty of Engineering, University of Pécs,
Pécs, Hungary
Tivadar M. Tóth
Department of Mineralogy, Geochemistry and Petrology, University of Szeged, Hungary
Félix Schubert
Department of Mineralogy, Geochemistry and Petrology, University of Szeged, Hungary
Page 52
51
Integrated petrographic – rock mechanic borecore study from the metamorphic basement of
the Pannonian Basin, Hungary
Abstract
The integrated evaluation of borecores from the Mezősas-Furta fractured metamorphic
hydrocarbon reservoir suggests significantly distinct microstructural and rock mechanical features
within the analysed fault rock samples. The statistical evaluation of the clast geometries revealed
the dominantly cataclastic nature of the samples. Damage zone of the fault can be characterised by
an extremely brittle nature and low uniaxial compressive strength, coupled with a predominanate
coarse fault breccia composition. In contrast, the microstructural manners of the increasing
deformation coupled with higher uniaxial compressive strength, strain-hardening nature and low
brittleness indicate a transitional interval between the weakly fragmented damage zone and strongly
grinded fault core. Moreover, these attributes suggest this unit is mechanically the strongest part of
the fault zone. Gouge-rich cataclasites mark the core zone of the fault, with their widespread plastic
nature and locally pseudo-ductile microstructure. Strain localization tends to be strongly linked with
the existence of fault gouge ribbons. The whole fault zone with ~15 m total thickness can be
defined as a significant migration pathway inside the fractured crystalline reservoir. Moreover, as a
consequence of the distributed nature of the fault core, it may possibly have a key role in
compartmentalisation of the local hydraulic system.
Keywords: fractured metamorphic reservoir, rock mechanical parameters, fault rocks, brittle
deformation
Page 53
52
III.1 Introduction
Brittle fault zones of crystalline rock masses can serve as migration pathways or also as
sealing surfaces for fluid flow in the Earth's crust, so the understanding of their internal structure is
crucialfor interpreting hydraulic systems. Earlier studies (Caine et al., 1996, Evans et al., 1997) on
the architecture of fault zones defined two main structural elements: first, a weakly disaggregated,
densely fractured ―damage zone‖ and a strongly deformed and fragmented ―fault core‖, where the
pre-existing rock fabrics were erased by fault development. These elements can be characterised by
the formation of diverse tectonite types (fault breccias, cataclasites, fault gouges), which often also
possess quite heterogeneous rheological features. Consequently, the petrological, petrophysical and
rock mechanical properties may have an extremely heterogeneous spatial distribution in the fault
zones.
In addition, evaluation of tectonites from core samples always provide a serious challenge to
proper structural interpretation, particularly due to the small number of borecores and their quite
doubtful representativeness of the whole rock mass (Ben-Zion and Sammis, 2003). These
constraints raise the necessity of integrated analytical methods with that aim to gain as much
information from these samples as possible.
The main aim of this paper was to present the results of one such petrographic,
microstructure and rock mechanical analysis: we examined the lithological and rheological
attributes of a basement fault zone with a quite high rate of core recovery and abundant amount of
available samples, via the usage of these integrated methods. The combined petrographic
(microstructural and clast geometric) and rock mechanical evaluations were conducted partly to
clarify the role of main structural elements in the hydraulic system of both the fault zone and the
whole fractured rock mass.
Page 54
53
III.2 Geological setting
The locality of this study, the pre-Neogene basement of the Pannonian Basin (PB), which is
part of Alpine-Carpathian-Dinaric orogenic belt, and which consists of deep sub-basins separated by
subsurface topographic highs of metamorphic basement (e.g., Tari et al., 1999, M. Tóth, 2008). One
of the best-known elevated basement highs is the Mezősas-Furta Dome (MFD), which is part of the
series of metamorphic highs bordering the Békés Basin to the north (Fig. III.1).
Figure III.1: Topographic map of the Pre-Neogene basement of the eastern part of the Pannonian Basin
and the distribution of the basement highs (shaded). Isolines denote depth below the present surface in
meters. Inset: Location of the studied well in the Alpine–Carpathian–Pannonian System. A – Alps, BM –
Bohemian Massif, C – Carpathians, D – Dinarides, PB – Pannonian Basin
Page 55
54
Following the earliest studies on the area (e.g. Balázs et al., 1986 or Szili-Gyémánt, 1986),
detailed petrological investigations of M. Tóth and Zachar (2006) defined the metamorphic
evolution of the most typical lithologies of MFD and clarified their spatial arrangement through the
basement high. The constructed idealized rock column suggests the presence three lithological
blocks: at the uppermost structural level amphibolite and amphibole-biotite gneiss (AG group) with
medium grade metamorphism is common. This group structurally overlys high metamorphic grade
sillimanite and garnet bearing biotite gneiss that is often coupled with garnet-bearing amphibolite,
and is jointly is named as SG group. At the lowermost structural position orthogneiss is dominant,
derived from a medium-grade metamorphism of an igneous intrusion. The orthogneiss body is often
cross-cut by microgranite dykes. These lithologies are jointly named the OG group. The rather
different metamorphic evolutions of these groups and the presence of wide shear zones along the
group boundaries indicate these blocks were juxtaposed following their metamorphic pressure-
temperature peaks.
According to M. Tóth and Zachar (2006) in the central range of the dome the SG and AG
units dominate on top of the basement, while the northern slope of the MFD is mainly built up by
the OG unit. By the interpretation of these spatial data, the structure of the area can be explained as
overthrusted NW-SE oriented stripes of AG/SG/OG triplexes. The simplified framework of the
MFD can be described by parautochthonous OG unit with allochthonous AG/SG duplexes on the
top. Details of microstructural investigations indicate that AG/SG boundary formed during an
earlier compressional event and the two groups jointly overthrust the OG unit. These statements are
in good agreement with the results of numerous authors (Albu and Pápa, 1992, Tari et al., 1999), as
the structure of the basement was strongly affected by Upper Cretaceous nappe formation, as well
as sinistral transpression in the Middle Miocene period. This scenario was complicated on the
southeastern portion of MFD, where high-angle normal faulting related to the Neogene (Badenian)
extension of the area formed horst-graben structures.
Page 56
55
The multi-stage tectonic evolution of the area resulted in the presence of wide brittle fault
zones throughout the crystalline highs, which also act as fractured hydrocarbon reservoir in the
basement of the PB, with the MFD reservoir being one example. By the inferences of M. Tóth
(2008), these fractured horizons with their often-enhanced permeability, have a great impact on the
hydraulic system of the metamorphic highs, and in fact these shear zones probably serve as the
main migration pathways between the deep sedimentary basins and the fractured hard rock realm
(M. Tóth, 2008). A wide fault zone was penetrated by a well (A-2) in the northern, OG-dominated
part of MFD with a quite high core recovery (Fig. III.2). The well is situated north of the
hydrocarbon producing wells of the field in the most elevated parts of the metamorphic high
(unpublished industrial data). Although, well A-2 itself is non-productive due to its structural
position, the sampled fault zone may play a crucial role in the local petroleum system by linking the
source rocks of the adjacent sedimentary sub-basins and the metamorphic high. In the absence of
oriented borecores, high resolution seismic sections or nearby wells, the kinematic sense and the
spatial position of the approximately 10 meters wide fault zone are unclear. Nevertheless, the
examined section that consists of diverse fault rock samples gives an outstanding opportunity for an
integrated evaluation of the shear zone.
Page 57
56
Figure III.2: a: Detailed sub-surface topography of Mezősas-Furta Dome. Dots mark the productive wells of
the field, while dashed line indicates the assumed location of the main hydrocarbon accumulation. Isolines
denote depth below the present surface in meters. b: Schematic vertical section of the investigated well and
borecores evaluated in this study. The grey rectangles indicate the location of the samples.
Page 58
57
III.3 Samples and applied methods
III.3.1 Available samples
All 10 available borecores from the well A-2 were sampled in the depth interval between
3290 and 3297.85 meters below sea level with high core recovery (detailed in Fig. III.2/b). All of
the rock specimens were affected by various degrees of brittle deformation. The cores were not
oriented. For Petrographic Image Analysis of the fault rocks, 78-414 clasts were measured from
each sample.
III.3.2 Petrographical and microstructural observations
Following the preliminary macroscopic analysis, thin sections were evaluated from all 10
borecores for the petrographic investigations to define the microstructural characteristics of the
diverse fault rock types. The available thin sections were made perpendicular to the foliation and
parallel to lineation.
III.3.3 Description of Petrographic Image Analysis (PIA)
The PIA of samples was conducted with the aim of defining the geometric features of clasts
within the fault rocks. First, polished surfaces were cut parallel to the longitudinal axis of the
borecores, then 2D images were taken (Fig. III.3). Unfortunately, as some of the available thin
sections did not a provide statistically sufficient amount of observable particles (>50 clasts), the
micro-scale samples were omitted from the image analysis. The lower limit of the image analysis
was 100 pixel2 (0.16 mm
2), according to the suggestions of (Bérubé and Jébrak, 1999, Clark et al.,
Page 59
58
2006) on the methods of particle size/shape analysis, while the size of the largest measured clast
was 193960 pixel2 (293 mm
2). However, in this case the clasts could not be segmented by the use of
a colour threshold application as the matrix or cement was too heterogeneous, so the selection of
edges was accomplished manually, using the ―Magnetic Lasso‖ tool of Adobe Photoshop. The clast
geometric measurements were completed using the selected parameters in ImageJ. The applied
parameters are discussed below.
Figure III.3: Polished surface of a borecore from well A-2 (sample M1) and the clasts selected for the
measurements, drawn one-by-one in Adobe Photoshop. The diameter of the borecore is 6.5 centimeter.
III.3.3.1 Particle Size Distribution (PSD)
Earlier studies (Sammis et al., 1986, 1987, Blenkinsop, 1991) demonstrated the fractal
nature of the cumulative PSD of the fault rocks, with the following equation: N(s) ~ s-Ds
. The N(s)
is the number of particles smaller than a size s (square root of the area), while DS can be determined
as the slope of the best fit line on a log N(s) against log s graph. Different DS values are expected for
Page 60
59
varying degrees of the fragmentation process and different tectonic settings or rock types, according
to the data of Sammis et al. (1987), Blenkinsop (1991), Storti et al. (2003) and Keulen et al. (2007)
(Table III.1.).
Table III.1: Published grain size distribution data of brittle fault rocks, based on the results of Sammis et
al.(1987), Blenkinsop (1991), Storti et al. (2003), Keulen et al. (2007).
III.3.3.2 Clast complexity (DR)
Based on the results of Bérubé and Jébrak (1999), ―Fractal Dilation‖ is the most precise
method for the determination of clast complexity. The ―Fractal Dilation‖ macro of ImageJ uses a 1
pixel-wide outline of the clasts, which are thickened, creating 2, 4, 8 and 16 pixel-width ribbons.
The area of these ribbons is plotted against its thickness on log-log plot, where the slope of the best
fit line (S) is the indicator of clast-complexity fractal dimension (DR) using the 2-S=D
R equation.
III.3.3.3 Aspect Ratio (AR)
The Aspect Ratio (AR) is the proportion of the long and short axes of the ellipse that best fit
the outline of a clast. The ellipse has the same area, long-axis orientation and centre as the original
grain, defined by ImageJ.
III.3.3.4 Circularity (Circ)
The value of circularity can be expressed by the equation of 4π (AP/p2), where AP is the area
of the clast, and p is its perimeter (Mort and Woodcock, 2008). This measures how close the
Page 61
60
particle's shape is to a perfect circle. According to the above formula, the value of the Circ varies
between 0 and 1, where 0 is an immensely elongated ellipse, while 1 is a perfect circle.
III.3.3.5 Orientation Angle (Angle)
The numerical value of orientation for a single clast is the angle between the long-axis of the
clast's best-fit ellipse and the lateral (the ―X‖) axis of the image. The best-fit ellipse and the long-
axis angle are both computed by ImageJ. The degree of orientation is observable in the dispersion
from the average Angle values of the clasts, which is numerically manifested in the changes of
relative standard deviation values.
III.3.3.6 Convexity (Conv)
Convexity measures the surface roughness of a particle, calculated by dividing the convex
hull perimeter by the actual particle perimeter, so the smooth shapes have a Conv value close to 1,
while the spiky and irregular objects have a Conv value closer to 0.
III.3.4 Statistical analysis of the fault rocks
The brittle fault rock samples were classified by multivariate statistical analysis of their clast
geometric parameters (Table III.2/a). The method (detailed in Chapter II.) was developed and tested
on the fault rocks of the nearby Szeghalom basement high, which have a quite similar lithological
composition as MFD (M. Tóth, 2008). In this approach, statistically sufficient amount of samples (~
3000 clasts) were measured with the same PIA procedure and their datasets were analysed via
multivariate statistical methods (Klovan and Billings, 1976, Davis, 2002). Separation of the three
main fault rock types were achieved without any overlapby using two calculated discriminant
functions (D1, D2). The calculated discriminant functions were the following, with the weights of
the most important parameters:
Page 62
61
D1= 0.731*PSD-0.588*Angle+0.553*Circ
D2= 0.974*AR+0.94*PSD-0.271*Circ
III.3.5 Rock mechanical tests
In accordance with the suggestions of the International Society for Rock Mechanics (ISRM,
2006) regular cylindrical shapes were created with the standard 2:1 (axis: diameter) size and 50 mm
diameter. Only one sample was cut from each borecore due to their limited size. Rock mechanical
tests were carried out in the Rock Mechanics Laboratory at the Budapest University of Technology
and Economics.
Uniaxial compressive tests, widely used for defining rock mechanical properties, were
applied to study the mechanical properties of the samples. If the lateral surface of the sample is
traction-free, the experimental configuration can be characterised by the σ1 > 0, σ2 = σ3 = 0
equation. Accepting these statements, the uniaxial compressive strength (σc) (MPa) of the samples
is derived from the measured uniaxial strain (ε) and uniaxial stress (σ) values. The plot of σ against
ε defines the stress-strain curve, where the maximum stress value is the uniaxial compressive
strength (σc) (MPa). The Young or elastic modulus (E) (GPa) of the samples can be experimentally
determined from the slope of the stress-strain curve at 50% of the ultimate stress, by the advice of
ISRM (2006). The Poisson's rate value (ν) is the ratio of the axial and lateral strains at this point.
Several characteristic stress levels can be determined through laboratory tests that are
essential for understanding the failure (damage) process of brittle rocks during compression:
σcc is the crack closure stress level,
σci is the crack initiation stress level,
σcd is called the crack propagation stress level. This latter parameter is close to the
longterm rock strength (Martin, 1993, Cai, 2010).
Page 63
62
The above three stress levels, i.e., σcc, σci, and σcd, show important stages in the macroscopic
damage process of intact rocks. Crack initiation starts at stress levels of about 1/3 to 2/3 times the
peak uniaxial load (σf) for most brittle rocks (Bieniawski, 1967, Cai et al., 2004). The crack
propagation stress level (σcd) is the stress level at which the total volumetric strain is attained (Cai et
al., 2004). It can be calculated from the stress-volumetric strain curve. According to Hucka and Das
(1974), the coefficient of brittleness can be calculated as the ratio between the elastic work (We) and
the total or destruction work (Wt) during the loading of a specimen until failure. Destruction work
(Wt) can be calculated from the measured stress-strain curves, as it is defined by the area under the
measured stress-strain curve and reveals the amount of energy necessary for the failure of the
sample. The elastic work (We) is also derived from the measured stress-strain curve, but is instead
the amount of necessary energy in its elastic stage. The brittleness of samples (B) is the ratio of the
elastic and destruction work values (B= We / Wt).
III.4 Results
III.4.1 Petrographical and microstructural observations
The fault zone of A-2 is mainly composed of cataclasites (Fig. III.4/a), according to
microstructural properties of the samples. However, locally other fault rock types are also
observable: a coarse breccia without any preferred orientation and the sporadic fault-gouge ribbons
occur, which cross-cut the cataclasites.
The internal structure of the cataclasites shows a strongly disaggregated appearance with
angular clast geometry, even though macroscopically the external cohesiveness of the cataclasites is
more or less remained. The grain size is dominantly under millimeter-scale and the ratio of particles
over 2 mm is under 30%, the limit between the breccia/cataclasite series (Fig. III.4/b,c). Samples
Page 64
63
often have a strong microscopic grain-shape orientation (GSPO) (Passchier and Trouw, 2005):
clasts are elongated and their long-axes define the preferred direction. This direction of the GSPO is
generally subparallel to the supposed main shear direction. The phenomenon is usually coupled
with the manner of cataclastic deformation, namely intensive clast-rotation, comminution and
pervasive microfracture propagation (Fig. III.4/c). The particles have a recognizable gneissic
precursor with a quartz-feldspar-biotite dominated composition, which is derived from the
undeformed wall rock of the OG group. The clasts of cataclasites did not suffer significant chemical
alteration, only the largest particles have sporadic clay coating on their edges. The intense
deformation often manifests in an anastomising, flow-banded structure with the local appearance of
the S-C structures, indicating a semi-brittle style deformation.
Figure III.4: Photomicrographs representing characteristic fault rock textures from the samples of A-2. a:
Typical cataclastic texture, which is the most frequent structure of the samples with fragmented and
rotated particles (sample M5). b: Strongly deformed domains between the centimeter-scale particles
(sample M6). c: Planes of intensified deformation denoted by strongly fragmented cataclastic texture
among relatively less deformed coarse grains (sample M4). d: Dilational domain with a weakly
disaggregated texture, indicating a characteristic fault breccia texture (sample M2). e: Strongly foliated
fault gouge plane with restricted distribution. The foliation is defined by the phyllosilicate flakes (sample
M8). f: Granular fault gouge, which is regarded as the location of the largest fault displacement. Note the
extremely high matrix ratio, which indicate the comminution of the clasts (sample M10). The scale bars
are 500 µm long.→
Page 65
64
The rather subordinate fault breccia samples mainly consist of coarse grained, angular clasts
(often over centimeter-scale) (Fig. III.4/d). The coarse breccia structures are locally prevalent in the
samples M1, 2, 3. These samples typically have a chaotic texture often without any structural
manner of preferred orientation. The largest clasts often can be fitted along their sharp, dilational
edges indicating their mosaic, ―jigsaw‖ type structure (Mort and Woodcock, 2008). The gneissic
Page 66
65
origin of the fault breccia clasts is also recognizable.
In a few cases, the cohesive cataclastic texture is cross-cut by thin, clay-rich layers of
incohesive fault gouge, especially in samples M -5, -7,-8 and -10. According to the microscopic
investigations, the fault gouge ribbons have a very low clast/matrix ratio, indicating their strongly
deformed nature, which is strengthened by the totally fragmented architecture of the clasts (Fig.
III.4/e,f). The protolith of the fault gouges is not recognizable, as their particles are mainly
composed of mono-crystalline quartz. The comminuted clasts are always embedded in strongly
altered clay-rich matrix. Appearance of these planes is restricted to millimeter wide anastomising
planes with a sharp boundary towards the relatively less deformed cataclasites.
III.4.2 Clast geometric results
The clast geometric results with their mode values are summarized in the Table III.2/a.
Exceptions are the PSD and the Angle values, as the PSD was calculated from the slope of the grain
size curve's best fit line, while the Angle value represents the variation coefficient of the particle's
long axis direction in the actual sample.
Elongation of the clasts (AR) of the least deformed, brecciated samples is about 1.5 – 1.8,
while in the cataclasites slightly higher numbers are typical (~1.9). The highest AR values are
observable in the most deformed or gouge-bearing cataclasites, where elongation ratios over 2.0 are
frequent, especially in samples M5 and M9. Measurements of clast circularity (Circ) resulted in a
slightly decreasing trend from the 0.7 values of less deformed borecores (with M2 as a maximum:
0.75) to ~0.6 values in gouge-containing samples (with M10 as minimum: 0.61). Fractal dimensions
of particle size distributions (PSD) reflect a gradual, but constant increase towards the more
fragmented samples: the lowest value is in the M2 with 1.12 cumulative PSD dimension, and the
highest is in M10 with 1.72. In contrast, the numerical manifestation of the clast orientation, the
relative standard deviation of the long axis directions is strongly decreasing in harmony with the
Page 67
66
observed intensifying microstructural deformation. The maximum value was calculated for the M2
(0.74), while the minimum is in the M9 (0.42). The clast complexity values reflect rising dimension
with observed deformation from the 1.19 DR
values of M2 to the 1.48 of M8, while the convexity
values are generally around 0.85 – 0.9, with a lack of any tendency.
III.4.3 Rock mechanical tests
The results of the uniaxial compressive tests and their derived data are summarized in the
Table III.2/b.
In Figure III.5/a, the uniaxial compressive strength results (σc) were plotted against the crack
propagation stress levels (σcd). Our results (83%) are in harmony with literature data (ISRM, 2006),
which define the onset of crack propagation at ~ 85% of the uniaxial compressive strength. The
Young or elastic modulus (E) values reflect a good correlation with uniaxial compressive strength
results (σc) (R2
=0.93) (Fig. III.5/b), however, samples M4 and M5 were omitted from this plot, due
to their strongly characteristic stress-strain curves. From the aspect of the destruction work (Wt),
samples M4, M5 and M6 have an outstanding high necessary energy amount under the stress-strain
curves (90.34-188.57 kJ) in contrast with other samples, where 50.18 kJ was the maximum value
(M8) (Table III.2/b).
Table III.2: Measured clast-geometric data (a) and mechanical constants (b) of the investigated
samples.→
Page 69
68
Figure III.5: a: Illustrated plot of the uniaxial compressive strength and crack propagation stress level,
which defined the onset of stable fracture growth at the 83% of the longterm rock strength, which
generally agree with 85% value of the general ISRM (2006) suggestions. b: Plot of uniaxial compressive
strength and Young modulus reveals a quite strong increasing trend of the measured rock mechanical
features, while only two of the samples (M4 and M5) do not fit to this trend. c: The characteristic stress-
stain curves from A-2. Sample M1 a strongly rigid nature with low uniaxial compressive strength. M4
represent relatively higher σc and necessary work for the failure of the sample, indicating a strain-
hardening nature. In contrast, the stress-strain curve of M10 reveals its strongly plastic and inelastic
nature. These rock-mechanical features follow each other with increasing depth. d: Plot of measured
Poisson rates versus the brittleness indexes with the quite clear separation of the samples derived from
distinct fault components: the damage zone (M1-3), the transition zone (M4-6) and the fault core (M7-
10).
Page 70
69
The uniaxial compressive test results (σc) can be divided into three different stages
according to the depth of the samples (Fig. III.5/c). Down 3291.9 meters in depth the borecores
display a quite brittle nature with a very low uniaxial compressive strength (σc). Down to 3294
meters, the stress-strain curves indicate strongly characteristic rock mechanical properties with
extremely wide ductile and locally strain-hardening stages before their failure. The gradual
transition from the rigid upper part towards the relatively ductile depth intervals is observable in
samples M4, M5 and M6 with a ~10 MPa higher uniaxial compressive strength (σc) than the
borecores from shallower depth and the appearance of plasticity or even significant strain-
hardening.
A similar process is observable in the calculated brittleness (B) data of the samples, which is
the ratio of the elastic work (We) and the destruction work (Wt) (Table III.2/b and Fig. III.5/d).
Borecores M1, M2 and M3 have a high B value close to 1 (B=0.743-0.912), while samples below
3294 meter depth can be characterised with lower B values (0.500-0.538). In the case of samples
M4, M5 and M6 extremely low B ratios (between 0.189 and 0.418) were calculated.
III.5 Discussion
III.5.1 Interpretation of the microstructural data
The presence of the fragmented cataclasites indicates that the whole analysed section was
affected by a relatively strong deformation (Fig. III.4). In this sense, samples M1, -2 and -3, with
their local fault breccia structures can be interpreted as evidence for locally weaker disaggregation
compared to the dominant fault rocks. On the other hand, the sporadic fault gouge ribbons are
indicative of the most intense deformational stage of the whole rock mass (Hayman, 2006), despite
Page 71
70
these planes always having a subordinate occurrence, even in micro-scale (Fig. III.4/e,f). This
arrangement can possibly be explained by the appearance of the strain localization (Hayman, 2006),
which concentrates the progressive deformation into thin layers of clay-rich gouges via a positive
feedback process, similarly as the deformation bands develop in porous rocks (Aydin, 2000, Fossen
et al., 2007).
During the statistical examination of the Furta tectonites, their PIA data were plotted on the
graph D1-D2 discriminant functions and illustrated together with the reference data in Fig. III.6. As
shown, most of the analysed samples are in the cataclasite category, in agreement with the
microstructural observations. During the petrographic interpretation three samples displayed mixed
fault breccia - cataclasite structures (M1, 2 and 3) and according to the discriminant analysis, two of
them (M1 and M2) reflect a dominantly fault breccia-like clast geometry. In contrast, sample M3
was statistically classified as a cataclasite.
Figure III.6: Illustration of measured fault rock samples from well A-2 based on their calculated D1 – D2
values (detailed in Chapter II.) with characteristic values for each fault component. The reference data of
the classification derived from the adjacent Szeghalom Dome are also displayed.
Page 72
71
It is notable that none of the samples fall into the fault gouge category. This outcome
possibly relates to their limited appearance and to the previously mentioned very low clast/matrix
ratio compared to the adjacent cataclasites. As a consequence, this inevitably leads to the statistical
underrepresentation of these domains, even in the most fault gouge dominated samples (e.g. M8 or
M10).
In the light of these microstructural inferences and the possible arrangement of the fault
rocks, the weaker disaggregated breccias presumably mark the fragmented damage zone component
of the fault based on the interpretation of Caine et al. (1996) or Woodcock et al. (2007). In contrast,
the cataclasites often cross-cut by gouge surfaces must relate to the fault core, which is the scene of
the most considerable displacements (Storti et al., 2007).
Figure III.7: Characteristic grain size distributions from the three main petrographic zones. These
domains reflect higher PSD values with the stronger observed deformation. The coarse grained
Page 73
72
brecciated samples have relatively lower PSD dimensions (< 1.3), while, following the transitional values
of the cataclasites, samples from the fault gouge-rich zones own the highest PSD dimensions (> 1.6). This
latter group can be characterised with increasing comminution and particle size reduction with intensive
gouge formation and strain localization.
The representative grain size distribution diagrams from the three main petrographic zones
clearly illustrate the increasing PSD values with the observed increasing deformation (Fig. III.7):
this process is visible in the decreasing amount of relatively larger particles (i.e. over the 2 mm
limit) in agreement with the observations of Blenkinsop (1991) or Keulen et al. (2007).
Consequently, relatively lower PSD dimensions of the breccia dominated samples (< 1.3) also
indicate that this part of the fault zone can be defined as the damage zone, according to the results
of Storti et al. (2003). In contrast, the most deformed gouge-rich samples exceed the theoretical 1.6
PSD value of the gouge formation as it was described by Sammis et al. (1987) or Keulen et al.
(2007). According to their evaluations on both naturally and experimentally deformed fault rocks
the onset of fault gouge formation is always coupled with the process of shear localization and so,
the further particle comminution.
III.5.2 Rock mechanical properties of the fault rocks
The complex structure of the fault zone in well A-2 is also visible in light of the uniaxial
compressive test results. The petrographically defined fault breccia nature of M1 and M2 samples
can explain their low uniaxial compressive strength and brittle behaviour (Table III.2/b and Fig.
III.5/a). Moreover this tendency possibly continues in the sample M3, despite that it was
characterised as cataclasite. Their quite rigid nature possibly relates to the dominantly stick-slip
style frictional sliding as a typical feature of the coarse grained, ―immature‖ fault rocks (Storti et al.,
2007).
Page 74
73
The stress-strain curves of samples M4, M5 and M6 (Fig. III.5/c) strongly deviate from this
trend with their strongly inelastic nature and higher uniaxial compressive strength (Table III.2/b and
Fig. III.5/a). This phenomenon presumably relates to the formation of the clay-rich fault gouge
ribbons in this depth interval, which tend to accumulate the displacement through a stable sliding
style motion coupled with strain localization in these zones, as is characteristic of the ―mature‖ fault
rocks (Storti et al., 2007). Additionally,, the remained cohesiveness may be responsible for the
observed strain hardening processes in these samples, as inferred by the relatively high destruction
work (Wt) required for failure during testings.
Samples M7-10 display again an extremely strong ductile and inelastic nature, without any
observable trends in rock mechanical parameters with increasing depth (Table III.2/b and Fig.
III.5/a). The extremely wide plastic stage on the stress-strain curves (Fig. III.5/c) is a reflection of
the fault gouge appearance and strain localization, even in a more dominant form than in the
previous samples. In addition, the lower destruction work (Wt) values compared to M4, M5 and
M6, imply that the strain-hardening is a less important process at these depth intervals. These data
tend to emphasize that, though gouge surfaces microstructurally have only a secondary relevance,
their spatial density presumably control the rock mechanical properties of the fault rocks, which
manifest in the formation of strong plasticity and weak elasticity in the most mature fault rock
samples.
The plot of the Poisson ratio versus the calculated brittleness values (B) also indicate the
quite clear separation of the petrographically defined units based on their rock mechanical features
(Fig. III.5/d). On the other hand, this strong correlation between uniaxial test results points out the
validity of the microstructural classification as well.
Page 75
74
III.5.3 Architecture of the A-2 fault zone
According to the integrated petrographical and rock mechanical investigations, three
characteristic zones can be separated along the analyzed section of well A-2 (Fig. III.8):
- Brecciated damage zone (M1-3)
- Transition zone (M4-6)
- Fault gouge-rich fault core zone (M7-10)
Figure III.8: Schematic composition of the fault zone according to the integrated results of the
petrographic and rock-mechanical investigations. For each fault components, their most characteristic
features are displayed with the σc data. Increasing σc data towards the undeformed wall rock is presumed
due to their less deformed nature. Literature data on the architecture of brittle fault zones suggest the
downward continuation of the deformed horizons. Thicknesses of the fault units are not to scale.
Page 76
75
The uppermost zone – which was described as the damage zone of the fault – can be
characterised by an extremely brittle nature and low uniaxial compressive strength, coupled with a
dominantly coarse fault breccia composition. The microstructural characteristics of the increasing
deformation in samples of M4-6, coupled with higher uniaxial compressive strength, strain-
hardening nature and low brittleness indicate the semi-brittle feature of the suspected border
between the weakly fragmented damage zone and strongly ground fault core. Moreover, these
attributes suggest this transitional interval is the mechanically strongest part of the fault zone. From
the sample M7 downwards, gouge-rich cataclasites mark the core zone of the fault, with their
widespread plastic nature and locally pseudo-ductile microstructure. As a consequence, this
lowermost zone is presumably an indicator of main slip zones, where most of the displacement
accumulated. Generally, the strain localization tends to be strongly linked with the existence of fault
gouge ribbons in crystalline rocks (Fig. III.4/e,f), as implied by the results of Evans et al. (1997)
and Caine et al. (2010).
The structure of the fault zone further down in depth intervals without borecores – regarding
its width and distribution – can only be estimated with a limited reliability, due to the low number
of the available samples. However, based on the theoretical fault zone architecture defined by
earlier works (Caine et al., 1996, Evans et al., 1997., Storti et al., 2003), the deformed interval have
to continue downward toward the undeformed footwall with a symmetric geometry,and a fault zone
with ~ 15 meter of overall vertical thickness is possible (Fig.III.8.). This fault width can be
compared with the observed major basement shear zones in the adjacent Szeghalom (M. Tóth,
2008) and - similarly to those - can be interpreted as a main structural element of MFD (M. Tóth
and Zachar, 2006).
The analyzed fault zones in the nearby Szeghalom basement high include distributed
damage zones and play a crucial role in the hydrodynamics of the crystalline mass, especially in
fluid migration. According to the unpublished industrial data from the Szeghalom reservoir,
economic amounts of hydrocarbons were produced from these strongly brecciated intervals and the
Page 77
76
adjacent fractured wall-rock. This observation indicates that a shear zone with rather similar internal
structure and geometry of the A-2 well could also be associated with significant porosity and
permeability enhancement. Although the fault zone of A-2 is quite far from the main petroleum
accumulation in the MFD reservoir (Fig. III.2.), its shear zone can serve as an essential conduit zone
of the local hydrocarbon system. On the basis of the most likely scenario (M. Tóth, 2008),
hydrocarbons could migrate from the adjacent sedimentary sub-basins into the fracture network of
the metamorphic high through the intensely brecciated damage zones of these wide fault zones.
It is known from the Furta field that the 12 productive wells produce at least 7 hydrocarbon
fluids that are all different chemically (unpublished report) and these observations indicate that the
fractured hard rock reservoir is highly compartmentalized hydrodynamically. From this point of
view, the thicknesses of the damage zone and the fault core along the migration pathways are of key
importance. The weakly disaggregated damage zone presumably tends to form a connected fracture
network with relatively elevated permeability compared both to the undeformed wall rock and the
fault core. On the other hand, due to its clay-rich, ductile and thus impermeable behaviour, the core
could contribute to the hydrodynamically compartmentalized behaviour of the whole fractured mass
(Caine et al., 1996, Caine et al., 2010, Matonti et al., 2012).
III.6 Conclusion
The well A-2, in the Mezősas-Furta Dome (MFD) provided a large number of borecores
with different degrees of deformation. On the basis of an integrated investigation, the petrologically
defined fault units have remarkably different rock mechanical behaviours. We suggest that
brecciated damage zone may have the best reservoir characteristics, due to their weakly
disaggregated structure coupled with quite rigid rheological features. In contrast, the transition zone
and fault core with their plastic or strain-hardening nature presumably form barriers for the fluid
flow, which can compartmentalise the local hydraulic system.
Page 78
77
Chapter IV.: A fault-controlled fractured metamorphic reservoir in the Pannonian Basin, SE
Hungary
Manuscript submitted to the Geologica Croatica
Authors
László Molnár
Department of Mineralogy, Geochemistry and Petrology, University of Szeged, Hungary
Tivadar M. Tóth
Department of Mineralogy, Geochemistry and Petrology, University of Szeged, Hungary
Félix Schubert
Department of Mineralogy, Geochemistry and Petrology, University of Szeged, Hungary
Page 79
78
A fault-controlled fractured metamorphic reservoir in the Pannonian Basin, SE Hungary
Abstract
The basement of the Pannonian Basin contains several fractured metamorphic hydrocarbon
reservoirs that typically form structural highs between the Neogene sedimentary sub-basins. One of
the largest reservoirs, the Szeghalom Dome, is located on the northern margin of the Békés Basin
and is mainly composed of Variscan gneisses and amphibolites with different metamorphic
evolutions. These petrologically incompatible blocks were juxtaposed by post-metamorphic tectonic
activity that was accompanied by the formation of brittle fault zones with elevated
transmissibilities.
The aim of this study was to define the spatial arrangement of these fault zones and their
internal architecture by integrated evaluations of borecore and well-log data from a group of wells
in the central part of the field. Spatial correlations between the reconstructed 1D lithologic columns
revealed the main structural elements of the Szeghalom Dome. The low-angle (<15°) thrust faults
most likely developed due to north-northwest vergent Cretaceous nappe tectonics, which was
probably responsible for the juxtaposition of the different metamorphic blocks. A complex system
of normal faults throughout the basement high provides evidence of intense Miocene extensional
tectonic activity. This phase of the geodynamical evolution of the basin is believed to be responsible
for the horst-graben structure of the Szeghalom Dome.
The integration of the structural results with datasets of the paleo-fluid evolution, recent
production and fracture network geometry indicates the importance of these fault zones in both the
migration of hydrocarbons from the adjacent sub-basins to the overlying sediments and the
development of significant storage capacity within the strongly fractured rock masses (mainly the
amphibolite bodies). These observations of fluid flow also emphasized the impact of strong
permeability anisotropy of the faults throughout the fractured reservoir.
Page 80
79
Keywords: Fractured reservoir, Variscan basement, Fault zones, Well-log interpretation, Fault rock
analysis
IV.1 Introduction
Brittle fault zones have a key role in the hydrodynamics of fractured reservoirs (Nelson,
2001). They can behave as barriers, conduits or as a combination (Caine et al., 1996), so
understanding their internal structure is crucial. Previous studies (Caine et al., 1996; Evans et al.,
1997) on the make-up of fault zones defined two main structural elements: 1) the weakly
disaggregated, densely fractured ―damage zone‖, which is generally associated with higher
conductivity and permeability relative to the undeformed protolith; and 2) the strongly deformed
and fragmented fault core, where the pre-existing rock fabrics have been destroyed by the
development of the fault and have been replaced by fault rocks.
Several studies have revealed that the formation of the fault core is often coupled with a
significant decrease in permeability (Evans et al., 1997; Wibberly and Shimamoto, 2003, Storti et
al., 2007), which is mainly a result of cataclasis, clay smearing or clay gouge formation and
cementation (Moeller-Pedersen and Koestler, 1997, Manzocchi et al., 2010). The geometry of the
juxtaposed lithologies and their relative transmissibility are also important factors in the
conduit/barrier behavior of fault zones (Allan, 1989). The hydraulic character of the deformed
zones is further complicated by their strong permeability anisotropy (Evans et al., 1997); the highest
permeability evolves parallel to the fault plane and the slip vector, while the hydraulic conductivity
is one to four order of magnitudes lower parallel to fault plane and perpendicular to the slip vector
or perpendicular to the fault plane and the slip vector. This can result in many types of fault
behavior based on the proportion of distinct structural elements (localized conduits, localized
Page 81
80
barriers, distributed conduits, combined conduits-barriers) and depending on the widths of the
damage zone and the fault core with respect to the total width of the fault zone (Caine et al., 1996).
The large-scale spatial interpretation of fault zones in hydrodynamic systems can be
problematic, especially with a lack of borecores, because the main structural elements are often
below the limit of seismic resolution (Ben-Zion and Sammis, 2003). This phenomenon increases the
value of data available from borecores and well-logs and suggests the importance of their
integration and calibration.
This study focuses on the Pannonian Basin (PB), which is part of the Alpine-Carpathian-
Dinaric orogenic belt. Due to its complex Mesozoic-Neogene evolution (e.g., Tari et al., 1992,
Csontos and Nagymarosy, 1998), the PB consists of deep sub-basins that are separated by
metamorphic basement highs (e.g., Tari et al., 1999; M. Tóth et al., 2009). In many cases, these
blocks act as fractured water and hydrocarbon (HC) reservoirs in which the brittle fault zones play
important roles in fluid storage and migration. One of the best known basement highs is the
Szeghalom Dome (SzD), which is also one of the largest fractured basement HC reservoirs in the
PB (Nelson, 2001). Only a small portion of the accumulated hydrocarbons have been produced
because of the complex structural and lithologic architecture of SzD. In this study, we attempt to
clarify the post-metamorphic evolution of the study area and to correlate the paleo-fluid evolution
with the recent hydraulic features of the SzD to determine the role of fault zones in the reservoir.
IV.2 Geological setting
Due to its complex multistage tectonic history, the Pannonian Basin is a complicated mosaic
of structural blocks with different geologic evolutions. The crystalline basement of the PB is mainly
composed of Variscan metamorphic rocks with significantly different pressure-temperature-time
histories (Szederkényi et al., 1991). The SzD is one of the best known units and has a heterogeneous
Page 82
81
lithologic composition (M. Tóth, 2008; Fig. IV.1).
Figure IV.1: a: Location of the Szeghalom Dome in the Pannonian Basin and its geological environment.
b: Szeghalom Dome in the eastern part of the Pannonian Basin with the adjacent sub-basins and elevated
basement highs. c: Locations of the sampled wells in the central part of the SzD. The contour map
indicates the depth to the basement in meters.
The northern part of the SzD and the neighboring areas are mainly composed of orthogneiss
that is derived from the medium-grade metamorphism of an igneous intrusion. In some borecores,
undeformed microgranite dikes have no textural indications of metamorphism. These lithologies are
jointly called the OG group. In the central and southern parts of the SzD, two other types of
gneisses are dominant. The SG group is composed of high metamorphic grade sillimanite and
garnet-bearing biotite gneiss that is often coupled with garnet-bearing amphibolite. In contrast,
amphibolite and amphibole-biotite gneiss (AG group) with medium grade metamorphism is
common at the uppermost structural level. These metamorphic blocks with distinct evolutions (M.
Tóth, 2008) were juxtaposed as a result of post-Variscan structural movement.
Page 83
82
The most significant tectonic event after the Variscan metamorphism was the Eoalpine
compressional tectonic phase (Laramian, Austrian phases), which formed complicated nappe
systems throughout the basement of the Pannonian Basin. Several studies have demonstrated the
existence of nappe tectonics in the PB (Posgay et al., 1995; Tari et al., 1999), which resulted in the
widespread formation of subhorizontal, north-northwest-directed thrusts throughout the basement.
Later back-arc type extension during the middle Miocene resulted in the formation of metamorphic
core complexes coinciding with the exhumation of a series of crystalline domes along low-angle
normal faults (Horváth et al., 2006). These structures were further complicated by sinistral strike-
slip fault zones with significant horizontal displacements (Albu and Pápa, 1992). During the
Badenian, the intense extension formed horst-graben structures along north-south striking normal
faults (M. Tóth, 2008).
As a result of the complex post-metamorphic evolution of the SzD, a dense fracture network
with significant fluid storage capacity developed (M. Tóth, 2008). Previous analyses of the fracture
network (M. Tóth et al., 2004) and fracture-filling mineral assemblages (Juhász et al., 2002)
demonstrated the significant difference in rheological behaviors of the amphibolite and gneiss
bodies. This difference led to the development of a fracture network that is above the percolation
threshold of the amphibolites; in contrast, the fracture network in the gneisses is usually below this
limit and contains unconnected fracture systems (M. Tóth et al., 2004). The higher storage capacity
of amphibolites compared to the gneisses is also demonstrated by paleo-fluid reconstructions of the
SzD (Schubert, 2003; Schubert et al., 2007), which reported hydrocarbon-bearing fluid inclusions
exclusively from the amphibolite bodies and the damage zone of the faults.
The wide fault zones that separate blocks of different metamorphic evolutions within the
SzD may have a key role in the communication between the crystalline basement and the
neighboring sedimentary basins; because the flanks of the SzD are surrounded by relatively deep
sedimentary sub-basins with significant overpressures, the fractured basement can act as a
migration pathway from the juxtaposed sediments to the overlying sediments (Vass et al., 2009).
Page 84
83
These brittle fault structures can also link separate amphibolite bodies (M. Tóth, 2008; Vass et al.,
2009).
The aim of this study is to reconstruct the structural evolution of the SzD and determine the
role of the internal architecture of the fault zones in the local fluid flow regimes. The study area is
located north of the highest part of the SzD, where the top of the basement is composed of rocks of
the AG group. SG group rocks are located in the deeper parts of the basement and are separated
from the AG group rocks by wide brittle fault zones.
IV.3 Samples
The borecores used for the petrographic analysis are from wells A-11, -20, -22, -180: the
depth intervals of the samples are summarized in Table IV.1. The most important well (A-180) is
located north of the central, highest part of the SzD and intersects a major fault zone. Core recovery
from the fault zone is nearly 100%. The fault zone separates the lithologic units of the AG group in
the hanging wall and the SG group in the footwall. The examined section is approximately 20
meters wide and extends from a depth of 1913 meters to 1936 meters; it is primarily composed of
brittle fault rocks with different degrees of deformation (Fig. IV.2). Samples of both the undeformed
footwall and the hanging wall were analyzed to define their well-log properties.
Figure IV.2: a, b: Coarse fault breccia with gneissic origin (1N, +N) (well A-180). c, d: Crushed, slightly
elongated clasts in cataclastic fabric (1N, +N) (well A-180). e, f: Fault gouge clasts composed of crushed
mono-crystals (1N, +N) (well A-180). The scale bars are 500 µm long.→
Page 85
84
Well-log analysis was applied to the wells A-11, -20, -22, -36, -177, -178 and -180. The
well-log data were provided by the MOL Hungarian Oil and Gas Company. The well-log
measurements were recorded every 20 cm for the following parameters: spontaneous potential (SP),
caliper width (Cal), resistivity (Res), density (Den), compensated neutron porosity (CN), acoustic
velocity (AC) and natural gamma logs (GR).
Page 86
85
Table IV.1: The available borecores with their intervals, in meters below sea level.
IV.4 Methods
The available borecores were analyzed petrographically at both meso- and micro–scales.
The tectonites were classified according to their clast geometric parameters as described in the
Chapter II.
The well-log data were calibrated on the depth intervals that overlapped with the
petrographically analyzed cores. The data set was statistically evaluated using the IBM SPSS 20.0
statistics software. The discriminant function analysis method was used to separate the lithologic
groups based on their well-log properties (the forward stepwise method using Wilks’ lambda) (Fig.
IV.3/a).
Figure IV.3: a: Detailed lithologic composition of the fault zone in well A-180 with the calculated D(1-2)
values. The fault gouge-bearing intervals at 1917, 1922 and 1926 meters indicate the locations of the
largest displacements. b: Theoretical workflow for the determination of the lithologic architecture in the
analyzed wells. Functions D(3) and D(4) are applied only when D(1-2) defines the sample as a tectonite.
c, d: Representative well-log sections for undeformed (c) and deformed (d) depth intervals, which are
verified with the borecore data.→
Page 87
86
First, a discriminant function was computed to define the difference between the undeformed
wall rock (AG and SG together) and the tectonized depth intervals by calculating the proper linear
combination of the measured well-log data (Fig. IV.3/b). Discriminant functions were then
calculated to define the different types of fault rocks (fault breccia, cataclasite, fault gouge) within
the zones that were classified as tectonized in the previous step (Fig. 3/b). Both types of
discriminant functions were cross-validated to test the efficiency of the prediction model. The
computed functions were then applied on the depth intervals of the analyzed wells where the
lithology was unknown.
Page 88
87
IV.5 Results
IV.5.1 Petrography
The internal structure of the shear zone in well A-180 reflects the diversity of the petrographic
characteristics of the different types of tectonites (fault breccias, cataclasites and fault gouges) (Fig.
IV.2). Samples from A-11, -20 and -22 composed of strongly fractured and partly brecciated
gneisses from the AG lithologic group. Intact borecore from the SG group was available only from
one well (A-11:2007-2009 depth interval) with sillimantie-bearing biote gneissic compostion.
Most of the analyzed samples in A-180 were composed of coarse fault breccia that contained
weakly disaggregated structures and clast sizes that were typically greater than cm-scale (Fig.
IV.2/a-b). The particles in these samples are only weakly rotated and often fit together along their
sharp, angular dilatational edges, reflecting a typical jigsaw texture (Mort and Woodcock, 2006).
These weakly disaggregated fault breccia clasts usually have a chaotic structure and lack a preferred
orientation. The particles are dominantly composed of rock fragments that are derived from the wall
rock and have a recognizable gneiss precursor, while single mineral fragments are subordinate in
the fault breccias. A few samples of the breccias have similar internal structures; those with smaller
clasts are regarded as micro-breccias, and the coarse fault breccias are often embedded in greenish
chlorite or brownish iron-oxide cement. Precipitation of Fe phases is always visible on the margins
of the angular clasts.
Several samples show characteristic features of cataclastic deformation that resulted in a
decrease in clast size and an increase in the matrix ratio (Fig. IV.2/c-d). A preferred local orientation
is formed by the elongation of clasts; the direction is defined by their long axes and is often
accompanied by deformed phyllosilicate flakes. These samples have an anastomosing texture that
implies semi-brittle deformation. The fragmentation in the cataclasite samples makes the protolith
Page 89
88
of the crushed particles difficult to define because they are often monomineralic (composed mainly
of quartz or feldspar). Iron-oxide cement is also often present, in contrast to the missing chlorite
cement.
A third type of samples, the incohesive fault gouges, is present in thin deformational bands
(Fig. IV.2/e-f). These bands are mainly composed of strongly comminuted mono-crystalline (mainly
quartz) particles; only a few survivor rock fragments are observable. The isolated fragments are
surrounded by the completely crushed parts of the protolith. The anastomosing fabric of these
samples also indicates a semi-brittle style deformation. These fault gouge zones are usually a few
cm wide and presumably define the localized slip zones of the faults, which are probably the
locations of the most intensive displacements.
The fault zone in well A-180 is predominantly composed of weakly disaggregated, coarse
fault breccias. This intensely fractured host rock presumably forms the damage zone of the fault
zone. In contrast, the zones of cataclasite and fault gouge are up to one meter wide and are
considered as the fault cores; they are most clear at three distinct depth intervals (1917, 1922 and
1926 meters below sea level) (Fig. IV.3/a). These surfaces are structurally confined between
horizons of coarse fault breccia. As in previous studies (e.g., Evans et al., 1997), the fault cores are
typically meters thick; the fault cores imply the localization of strain within the fault zone and mark
the locations of most of the displacement.
IV.5.2 Well-log data
To extend the lithologic data from the borecores to the other intervals of wells, calibration
with well-log data was necessary. The proper combination of well-log data was calculated by
applying discriminant functions analysis to separate the distinct lithologies (Fig. IV.3/b).
The undeformed host rock (Fig. IV.3/c) and the tectonized samples (Fig. 3/d) were separated
using the following discriminant function:
Page 90
89
D(1-2)=1.1 * natural gamma (GR) – 0.5 * resistivity (Res) – 0.9 * density (Den)
The calculated function successfully discriminated the undeformed host rock and the
tectonized intervals without any overlap (Fig IV.4/a). To define the internal structure of the
tectonized zones, the lithologically-known fault rocks (fault breccia, cataclasite and fault gouge)
were then separated using two discriminant functions:
D3= 0.7 * compensated neutron porosity (CN) – 0.5 * resistivity (Res)
D4= 0.6 * density (Den) – 0.9 * natural gamma (GR)
These two discriminant functions clearly separated the different fault rocks, especially the
clay-rich fault gouge samples (Fig. IV.4/b). These functions were then applied to classify the
lithologically-unknown depth intervals of wells A-11, -20, -22, -36, -177, -178 and -180 to
determine their lithologic and structural compositions.
Page 91
90
←Figure IV.4: a: Separation of the deformed and undeformed depth intervals using the scores of the
calculated D (1-2) function. The most important well-log parameters used to discriminate the intervals
were the natural gamma, density and resistivity values. b: Discrimination of different fault rock types with
the calculated D3 – D4 functions, which are mainly based on the compensated neutron porosity,
resistivity, density and natural gamma log values.
IV.6 Spatial extension of petrological and well-log data
IV.6.1 Well-log properties of the lithologies
The weights of the parameters in discriminant function D (1-2) define the main geophysical
differences between the undeformed protolith and the tectonized zones (Fig. IV.4/a). The greatest
factor in the difference is the high natural gamma ray values, which implies an elevated amount of
clay minerals that is presumably caused by the intensely weathered and altered host rock in the fault
zone (Fig. IV.5). The relatively lower electrical resistivity of the tectonites reflects their strongly
fractured/fragmented characteristics, which results in stronger fluid infiltration into these zones. The
lower densities are probably related to the presence of the higher fracture density in the tectonized
zones, which is often coupled with porosity enhancement (Fig. IV.5).
Page 92
91
←Figure IV.5: Spatial variations of the most important well-log parameters for an idealized fault zone.
The darker colors indicate greater parameter values. According to this interpretation, the deformation is
often associated with decreasing density and resistivity towards the core zone. The most significant
porosity enhancement develops in the weaker fragmented and brecciated zones.
The petrographic and well-log properties of the different tectonite types are strongly
heterogeneous in both their petrographic and well-log properties (Fig. IV.4/b), which reflect the
internal structure of the fault zones. According to function D3, higher levels of deformation are
manifested in increases of the compensated neutron porosity values and further decreases of the
electric resistivity. In function D4, higher density and lower gamma-ray values are characteristic.
These suggest that the intensely deformed parts of the fault zones (cataclasites and fault gouges) can
be characterized by low densities and resistivities and that further elevated natural gamma activity
and compensated neutron porosity values mark the fault core, which is consistent with the
observations of Hung et al. (2007) and Jeppson et al. (2010). The density and resistivity logs imply
intensive fracturing, fragmentation and communition, while the natural gamma and neutron porosity
values indicate strong weathering and clay mineral formation with significant porosity reduction
(Fig. IV.5). In contrast, the interpreted damage zone with coarse fault breccias has higher density
and resistivity values and lower gamma and neutron porosity values (Fig. IV.5). These suggest that
the weaker disaggregated zones can maintain a significantly higher porosity than the comminuted
fault core.
IV.6.2 Structural interpretation of the analyzed part of the SzD
The application of the discriminant functions described above to the well-log data from wells
A-11, -20, -22, -36, -177, -178, and -180 provided an opportunity to determine the lithologies that
Page 93
92
were present in these wells and to understand the structural evolution of the SzD (Fig. IV.6). Based
on the available data, three groups of wells can be distinguished from the seven wells: two triplets
(A-180, -11, -20 and A-36, -177, -178) and a group containing one well (A-22).
The most important well was A-180 because the large number of core samples provided
useful information about the architecture of the SzD. The fault zone in well A-180 contains strong
structural heterogeneities between the depths of ~1915 and 1935 meters, where the three main
cataclasite and fault gouge-bearing zones are always embedded in coarse fault breccia members
(Fig IV.3/a). These comminuted planes – especially the clay-rich gouge zones – can act as the slip
zones of the fault zones, and their presence indicates strain localization. An interpretation of the
well-log from well A-20, which is the closest well to A-180, indicates that it also contains a
distributed fault zone with wide, gouge-bearing fault core between ~1990 and 2005 meters (Fig.
IV.6) and this implies that the two wide tectonized intervals in the neighboring wells are parts of the
same fault zone. Similar gouge-bearing, distributed fault zones with wide damage zones are present
in well A-11 at approximately the same depth interval (≈1985–2000 m) as in A-20 (Fig. IV.6).
These three occurrences of the interpreted shear zone define a low angle (13°) fault plane that dips
to the southeast. Other more weakly fragmented and thinner fault planes are also observed in these
wells but do not contain cataclasite gouge-bearing (slip) zones. These data suggest that the fault
cores were the locations of the largest displacements and can be considered a major fault zone (Fig.
IV.6).
Figure IV.6: The interpreted lithologic compositions of the analyzed wells. The dashed line indicates the
observed low-angle fault surfaces. The wells form two triplets, including a northern and a southern block.
Along with the lithologic composition, the calculated D(1-2) values are also illustrated along the 1D
section of the wells.→
Page 95
94
The most important well was A-180 because the large number of core samples provided
useful information about the architecture of the SzD. The fault zone in well A-180 contains strong
structural heterogeneities between the depths of ~1915 and 1935 meters, where the three main
cataclasite and fault gouge-bearing zones are always embedded in coarse fault breccia members
(Fig IV.3/a). These comminuted planes – especially the clay-rich gouge zones – can act as the slip
zones of the fault zones, and their presence indicates strain localization. An interpretation of the
well-log from well A-20, which is the closest well to A-180, indicates that it also contains a
distributed fault zone with wide, gouge-bearing fault core between ~1990 and 2005 meters (Fig.
IV.6) and this implies that the two wide tectonized intervals in the neighboring wells are parts of the
same fault zone. Similar gouge-bearing, distributed fault zones with wide damage zones are present
in well A-11 at approximately the same depth interval (≈1985–2000 m) as in A-20 (Fig. IV.6).
These three occurrences of the interpreted shear zone define a low angle (13°) fault plane that dips
to the southeast. Other more weakly fragmented and thinner fault planes are also observed in these
wells but do not contain cataclasite gouge-bearing (slip) zones. These data suggest that the fault
cores were the locations of the largest displacements and can be considered a major fault zone (Fig.
IV.6).
Wide tectonized zones that indicate relatively large displacements are present in well A-178 at
depths of ≈1925-1945 meters. Similar zones are also present at similar depths in wells A-177 and A-
36; however, the interval is slightly thinner interval in A-36 (A-177: ≈1955-1970 m, A-36: ≈1960-
1980) (Fig. IV.6). These depth intervals also include the gouge-bearing slip zones, which imply that
these intervals have a similar origin to the shear zone in wells A-11, -20, and -180. In this sense, the
fault zone in the southern group of wells (A-36, -177, and -178) is the continuation of the zone
found in the northern group with a slightly smaller dip angle (8°) but a similar south-southeast dip.
Although the small amount of available information only allows a rough estimate of the geometry
of the fault planes, and there is a slight difference in the dip angles and directions, the faults in these
groups of wells were likely affected by a similar deformational event.
Page 96
95
Based on the interpretation of several analogous examples from the crystalline basement (e.g.,
Pap, 1990, Tari et al., 1999), these fault zones can be interpreted as a low-angle thrust with a
northwest vergence. This explanation is consistent with the reinterpretation of 2D seismic profiles
from the metamorphic basement (M. Tóth et al., 2009). Because these old seismic surveys mainly
focused on the overlying clastic sediments, they provided only sporadic reflectors from the
crystalline basement. Using sophisticated seismic interpretation techniques, this study (M. Tóth et
al., 2009) defined the largest structural elements and characterized most of them as low-angle thrust
surfaces.
Earlier studies reported that the formation of these low angle (≈5-15°), northwest-vergent
thrust sequences throughout the basement of the Pannonian Basin are related to Eoalpine
compressional activity during the late Cretaceous nappe formation (Teleki et al., 1994; Tari et al.,
1999, Kovács et al., 2000). The AG and SG lithologic groups, with their distinct metamorphic
pathways, were juxtaposed by this Eoalpine nappe activity.
The repeated presence of the thrust surfaces and their spatial arrangement indicate post-
Cretaceous tectonic activity between the northern and the southern groups of wells, which cross-cut
the initially approximately uniform thrust surface (Figs. IV.6 and IV.7). The dip of the thrust and the
depth of the tectonized intervals indicate high angle extension with approximately 150 meters of
vertical displacement combined with tilting of the northern hanging wall block (Fig. IV.8). A similar
tectonic style is indicated in well A-22, which reached the basement surface approximately 200
meters deeper than in the adjacent wells and penetrated the only ~20 meters of basement rocks of
the AG group (Fig. IV.6). Because the AG group is in the highest structural locations in the SzD (M.
Tóth, 2008) (Fig. IV.7) and always forms the top of the basement, the significant vertical difference
between wells A-22 and A-180 is probably also the result of post-Cretaceous motion (Fig. IV.8).
Page 97
96
Figure IV.7: Basement map of the Szeghalom High with the major interpreted structural elements. The
contour map indicates depth to the basement in meters. The Cretaceous nappe structures were
overprinted by complex Neogene normal faulting. Note that members of the AG group dominate at the top
of the basement. For details of transect A-A', see Figure IV.8.
Figure IV.8: West-northwest – east-southeast cross section of the Szeghalom Dome. The dashed lines
indicate the separate paleo-fluid systems based on previous fluid inclusion results (Schubert et al., 2007).
The Late Cretaceous nappe surfaces were cut by high angle Neogene normal faults. Significant storage
capacity in the basement is exclusively related to amphibolite bodies in the AG group. The composition of
the basement is unknown below the well A-22. The horizontal components of the cross section are not to
scale.→
Page 99
98
Extensional tectonic activity has been widely reported in the SzD and can be related to the
formation of horst/graben structures during the syn-rift stage of the opening of the Pannonian Basin
during the Miocene (M. Tóth, 2008). As a result of the complex evolution of the PB, this type of
structure is most common in the central part of the basin; in contrast, the degree of extension at the
basin margins was high enough to form metamorphic core complexes (Horváth et al., 2006). This
phase of basin evolution culminated in the uplift and the exhumation of the SzD from a relatively
shallow depth (<10 km) and the subsidence of nearby sub-basins (e.g., Békés Basin) (Teleki et al.,
1994; M. Tóth, 2008).
IV.6.3 Paleo-fluid regimes in the analyzed part of the SzD
In this section, the new structural data is integrated with the results of previous studies,
particularly with respect to the hydrodynamic characteristics of the SzD (Fig. IV.8). M. Tóth et al.
(2004) found that the densely fractured amphibolite bodies in the AG group contain significant
storage capacity in the metamorphic blocks of the SzD.
The previously reconstructed paleo-fluid evolution was based on analyses of aqueous and
petroleum inclusions in the fracture-filling quartz crystals, primarily from the amphibolites and
subordinately from the damage zones of faults (Schubert, 2003; Schubert et al., 2007). The fact that
most of the analyzed fluid inclusions are present in the amphibolite zones, while they are totally
absent from the gneisses, strengthens the interpretation that the main storage capacity is related to
the intensely fractured amphibolite bodies. In this model, the damage zones of brittle faults served
as migration pathways towards the amphibolites, whose higher porosity was deduced from
petrographical observations (coarse angular clasts with preserved pore space; c.f. Fig. IV.2.).
The geochemical features and the degree of maturation indicate that the petroleum fluids
from wells A-180 and A-20 have similar characteristics, in contrast to well A-11, which contains
Page 100
99
significantly different (less mature and/or more intensely degraded) hydrocarbon fluids trapped in
petroleum inclusions. No fluid inclusion data are available from wells A-22, -36, -177, and -178.
The fluid inclusion data suggest that the rocks encountered in wells A-20 and A-180 form a
connected paleo-hydrodynamic regime, while the rocks in well A-11 represent a separate fluid
system, at least during the cementation of quartz in the fractures (Fig. IV.8). These data clearly
indicate that even though these three wells are close to each other and they are aligned along the
same, wide brittle shear zone (see Fig. IV.8), the rocks represent separate hydrodynamic regimes.
Several scenarios can explain the hydraulic compartmentalization of the SzD. An unlikely
but possible scenario is related to the significant temporal/spatial variability in the density and
porosity/permeability of the fracture network, which is probably caused by the cyclic cementation
and reopening of fractures. In this scenario, the petroleum inclusions represent the stage of the
evolution of the fracture network that was locally favorable for fluid inflow (after fracture
opening/reopening), which was followed by cementation, fracture sealing and fluid inclusion
entrapment. However, the spatial distribution of the open fractures at a particular time – and thus
the favorable conditions for fluid inflow – was heterogeneous across the fracture network. This
probably resulted in the local absence of entrapped hydrocarbon inclusions at a certain degree of
maturity during the process of migration within the basement. As a result, this model implies the
formation of temporarily separated hydraulic regimes, which provides a possible mechanism for the
isolated fluid systems of the SzD. However, the absence of pervasive fracture propagation in
diverse stress fields does not favor this theory.
Another possible scenario is compartmentalization due to the strong permeability anisotropy
of the fault zones, which has been discussed by numerous authors (Evans et al., 1997; Zhang et al.,
2001). Permeability anisotropy can be controlled by the shear displacement, effective stress, clay-
smearing along the fault plane or anisotropic microstructure (Géreaud et al., 2006). These papers
revealed distinct differences in permeability with anisotropy ratios as high as 104 (Evans et al.,
1997). The highest values are parallel to the fault plane and to the slip direction (K(par1)) (Fig. IV.9).
Page 101
100
Figure IV.9: The permeability architecture of a thrust fault zone according to Evans et al. (1997). The
highest permeability values occur parallel to the fault plane and parallel to the slip direction (K(par1)), and
the lowest permeability values occur perpendicular to both the fault plane and the slip direction (K(per)).
Transitional permeability values occur parallel to the fault plane and perpendicular to the slip direction
(K(par2)). These results indicate that the fault zone has a significant (104) permeability anisotropy ratio.
The lowest permeability values are perpendicular to both the fault plane and the slip direction
(K(per)), while transitional values were reported parallel to the fault plane and perpendicular to the
slip direction (K(par2)). This strong anisotropy can lead to hydraulic separation along the strike of the
major fault zone in the SzD, as is observed in the different paleo-fluid characteristics in the
neighboring A-11 and A-20 wells. Moreover, the maximum permeability along the dip of the fault
zone can explain the connected paleohydraulic system encountered in wells A-20 and A-180 (Fig.
IV.8).
The paleo-fluid regimes within the SzD could also have been fragmented due to the intense
multistage tectonic activity in the Neogene (Lőrincz, 1996). The interpreted structural architecture
of the SzD supports this hypothesis. The normal faults probably disturbed the hydrocarbon
migration in their vicinity (e.g., A-11, Fig. IV.7) and could have played a key role in the entrapment
of the fluid inclusions with diverse chemical features (A-11 vs. A-20 and -180). It is difficult to
determine whether these normal faults behaved as sealing faults or provided conduits for
Page 102
101
hydrocarbon migration towards the overlying clastic sediments. Nevertheless, the results of Juhász
et al. (2002) on the hydraulic connection between the basement and the overlying sediment support
the second hypothesis.
It is unclear if the paleo-fluid regime can be correlated with the recent hydrodynamic
regimes. According to Schubert (2003) and Schubert et al. (2007), the paleo-fluid migration
recorded by the HC-bearing fluid inclusions occurred between the Cretaceous and the Miocene. The
onset of migration into the basement has been determined by biological marker compounds in the
analyzed HC, whose source could not have been generated before the Cretaceous (Schubert, 2003).
The data of Juhász et al. (2002) and Schubert et al. (2007) indicate that the paleo-fluid migration
ended before the middle Miocene (Badenian) exhumation of the SzD.
In contrast, based on sedimentological and organic-geochemical evidence, the main sources
of the hydrocarbons that are currently produced from the Szeghalom Dome basement reservoir are
believed to be middle to upper Miocene shales (Teleki et al., 1994). Following the Badenian
exhumation, the SzD formed an island in the Late Miocene Pannonian Lake. The basal
conglomerate (Békés Formation) covered the coastal zones of the basement, while the local basinal
clay marl aquitard (Endrőd Formation) either overlaid the conglomerate or rested directly on the
metamorphic domes (Fig. IV.10). This marl grades upward into a thick succession of turbidite-rich
(Szolnok Formation) and delta front (Algyő Formation) sediments, which are thinner but coarser
grained above the basement highs (Mátyás, 1994) and represent a possible pathway for vertical
migration (Juhász et al., 2002) (Fig. IV.10). During the ―post-rift‖ phase of the basin evolution, the
exposed metamorphic highs subsided (―thermal subsidence‖; Horváth et al., 1988; M. Tóth, 2008)
to a depth of approximately 3 kilometers and provided pathways for fluid migration and/or storage
(Juhász et al., 2002) (Fig. IV.10). Based on industry data (Teleki et al., 1994), the recently produced
hydrocarbons of the SzD most likely originated from the adjacent overpressured sub-basins located
south of the SzD, such as the Békés Basin and the Vésztő Graben, and were generated after the
subsidence of the basin (Fig. IV.1). These data suggest some dissimilarity between the paleo- and
Page 103
102
the recent petroleum systems based on the possible source rocks.
In contrast, the results of the well-test data indicate several similarities between the paleo-
and recent fluid systems. In wells A-11 and A-36, the brecciated and intensely fractured damage
zones of the thrust faults and the fracture system of the AG group have produced a significant
amount of hydrocarbons (Fig. IV.6). Deeper water-producing intervals in A-180, A-20 and A-11 are
also related to these permeable units but are below the oil-water contact. However, a well-test of
well A-11 from the SG group did not show any inflow of fluid, indicating the impermeable nature
of this lithologic unit. This implies that the same structural elements participated both in the past
and current migration and entrapment processes. Because of the limited width and spatial
distribution of the low-angle thrust faults, these zones of elevated transmissibility can only act as
migration pathways within the reservoir. In contrast, the extensive amphibolite blocks of the AG
group in the hanging wall presumably form the main reservoir rock of the basement petroleum
system.
According to the model for the mechanism of the recent flow systems of Vass et al. (2009),
the SzD has a very strong hydraulic connection with the overlying and juxtaposed sediments
because the elevated blocks of metamorphic basement can drain the adjacent overpressured basins
below the local aquitard (Endrőd Formation) and have an important role in the compensation of
their pressure conditions (Fig. IV.10). Due to its dense fracture network and numerous wide fault
zones, the SzD behaves as a migration pathway towards the overlying clastic sediments (Szolnok
and Algyő Formations); the relatively thin but rapid and notable fluid flux may have resulted in a
so-called ―chimney effect‖ in the internal parts of the crystalline rock body (Vass et al., 2009). The
evaluation of the diagenetic history (Juhász et al., 2002) also demonstrated that the basement rocks
and the overlying sediments must have been hydraulic connected since the Middle Miocene. This
evidence underlines the importance of the intensely fractured parts of the AG group and the damage
zones of the major fault zones in both the paleo- (based on fluid inclusion data) and recent (based
on production data and modeling) hydrogeologic systems of the SzD despite the differences that
Page 104
103
were caused by the complex Neogene evolution of the SzD (Juhász et al., 2002; M. Tóth, 2008).
Figure IV.10: Schematic model of the geodynamic and hydrodynamic evolution of the Szeghalom Dome.
1: Coastal conglomerate (Békés Formation), 2: Basal clay marl, which forms a local aquitard (Endrőd
Formation), 3: Turbidite-rich sediments (Szolnok Formation), 4: Delta front sediments (Algyő
Formation), 5: Main brittle fault zones, 6: Regional fluid flow system. a: Variscan multi-stage
metamorphism of the lithologic groups at diverse pressure and temperature conditions. b: Late
Cretaceous nappe tectonics along low-angle thrust faults, which juxtaposed the AG, SG and OG lithologic
groups. Deformation took place at shallow depths and with unknown overlying rocks. c: Middle Miocene
(Badenian) exhumation of the SzD with the formation of a series of high-angle normal faults and the
deposition of Pannonian clastic sediments. d: Recent hydraulic system of the SzD following Late Miocene
subsidence of the area with significant overpressure under the local aquitard (Endrőd Formation) and the
evolution of the “chimney structure”. The cross sections are not to scale.
Page 105
104
IV.7 Conclusions
In this study, we identified the master fault zones of the Szeghalom Dome, which is one of
the largest fractured basement hydrocarbon reservoirs in the Pannonian Basin. According to
previous investigations, these wide fault zones are mainly related to post-metamorphic tectonic
events that juxtaposed incompatible lithologic types and possibly act as migration pathways because
of their higher porosity and permeability. Based on integrated evaluations of core and well-log data,
1D lithologic columns of wells were defined and correlated spatially. The tectonized intervals were
distinguished from the undeformed wallrock, and their internal lithologic structures (fault breccias,
cataclasites, fault gouges) were defined to determine the significant components of these zones
(damage zone versus fault core). We characterized the master faults as intervals consisting of
distributed fault gouge zones.
The spatial arrangement of the fault zones indicates the presence of low angle thrust faults;
based on the evolution of the Pannonian Basin, these faults were interpreted as indications of
Cretaceous nappe activity. The structure of the Szeghalom Dome was further complicated by
middle Miocene extension, which formed blocks in a horst-graben geometry and culminated in the
exhumation of the metamorphic high.
These data of the structural evolution of the Szeghalom basement high were integrated with
the results of previous investigations on the fracture network geometry, paleo-fluid evolution and
recent production data. The results suggest that the amphibolite bodies have the highest storage
capacity in the basement reservoir; the amphibolites are located exclusively within the AG
lithologic group in the structurally highest basement locations. The strong chemical dissimilarities
of the hydrocarbon-bearing fluid inclusions that are trapped in fracture-filling quartz veins can be
explained by several theories but probably developed due to the significant permeability anisotropy
Page 106
105
in the fault zones that was derived from their complex architecture coupled with the effect of the
Neogene structural evolution on the local flow systems.
A comparison of the paleo- and recent petroleum systems of the Szeghalom Dome revealed
that the main difference was caused by the different source rocks of the hydrocarbons. The fault
zones played a key role in the migration of the hydrocarbons from adjacent overpressured sub-
basins to both the amphibolite bodies with an interconnected fracture network and, since at least the
middle Miocene, to the overlying clastic sediments.
Page 107
106
Chapter V.: Conclusions
V.1 Summary of the results
The previous chapters of the dissertation revealed some connections between the
architecture and permeability structure of brittle fault zones, moreover, additional information
gained on the rock mechanics and petrophysical properties of the fault rocks. Following these
sections, the extension of the lithologic, petrophysical and rock-mechanical data emphasized the
importance of brittle structural elements on hydraulic behaviour of the Szeghalom Dome. These
results will be summarized in the next few pages.
In Chapter II the geometric aspects of the brittle deformation were defined on a thoroughly
analyzed fault zone, which was penetrated by an important well with very high core recovery. Main
deformational mechanisms were examined through the clast geometric features (Particle Size
Distribution - ―PSD‖, Complexity - ―DR‖, Aspect Ratio - ―AR‖, Circularity - ―Circ‖, Convexity
―Conv‖ and Orientation - ―Angle‖) of diverse, petrographically defined fault rock types, both in
micro (thin section) and meso (borecore) scale. For the better understanding of the deformational
processes, multivariate statistical methods were applied to reveal the connection between tectonites
and their geometric parameters in diverse deformational stages. Discriminant functions defined the
most characteristic geometric attributes of the tectonites and the classification pointed out relatively
similar geometric nature of the breccias and the cataclasites, in contrast to the fault gouge category.
Multidimensional scaling denoted a three-fold particle evolution scheme from the less deformed
samples towards the most fragmented ones. This statistical interpretation displayed the strongly
diverse attributes of the fault gouges in comparison to the other two groups.
In Chapter III, an attempt was taken to analyze the rock mechanical features of the borecores
from a petrographically heterogeneous fault zone developed in a gneiss-dominant lithologic
Page 108
107
environment. The main fault zone components were defined by the microstructural observations
and then these units were evaluated in a series of uniaxial compression tests. The damage zone was
characterized as a quite brittle domain with low uniaxial compressive strength, contrary to the
gouge-rich fault core, which reflects a strongly ductile nature and high uniaxial compressive
strength. In the core of the fault zone, strain localization was the dominant phenomenon, as it was
implied by the pervasive formation of fault gouge ribbons. Between the two main units of the shear
zone an interesting section was defined with the manners of significant strain-hardening, relatively
high uniaxial compressive strength and low brittleness. This transitional zone may suggest an
interplay of the brittle and ductile behaviors and presumably mark the rock-mechanically strongest
part of the fault zone. However, further works are required to decide whether it is a local or a
general phenomenon in the fault zones of the crystalline rocks. Clast geometric discrimination of
these fault rocks indicates the validity of the classification system introduced in Chapter II, at least
on the metamorphic lithologies, based on the coincidence of clast geometric features with the
petrographic observations.
In the first half of Chapter IV the available borecores were calibrated with their well-logs
and the dominant petrophysical attributes were defined. The most essential factors in the difference
between the undeformed wall rock and the tectonized zones are the high natural gamma values, the
relatively lower electrical resistivity and the lower densities in the tectonized zones. The
petrographic and well-log properties of different tectonite types defined the internal structure of the
fault zones. According to function D3, higher level of deformation manifests in the increasing of the
compensated neutron porosity values and further decreasing of the electric resistivity. In function
D4, higher density and lower gamma values are characteristic. These suggest that the intensely
deformed parts of the fault zones (cataclasites and fault gouges) can be characterized by the low
density and resistivity and that the further elevated natural gamma activity and compensated
neutron porosity values mark the fault core. In contrast, the interpreted damage zones with coarse
fault breccias have higher density and resistivity values with lower gamma and neutron porosity
Page 109
108
values.
In the second half of Chapter IV, these calculated results were extended to the 1D log
intervals of the same well without borecores and their correlation was attempted with seven
available wells from the Szeghalom field. It was known previously that the diverse metamorphic
blocks (the orthogneiss dominated OG group, the high grade SG group, and the amphibolite rich
AG group at the uppermost structural position) were juxtaposed via post-metamorphic tectonic
activity. Only the densely fractured amphibolite bodies in the AG group contain significant storage
capacity in the metamorphic blocks of the SzD, while fault zones are generally associated with
higher conductivity and permeability relative to the undeformed wall rocks and define the main
migrational pathways rhroughout the crystalline high. Spatial correlations between the
reconstructed 1D lithologic columns revealed the main structural elements of the Szeghalom Dome.
The comminuted planes defined by the well-log properties – especially the clay-rich gouge
zones – can act as the slip zones of the fault zones. Numerous weaker fragmented and thinner fault
planes were also observed in the wells but did not contain cataclasite or gouge-bearing (slip) zones.
These data suggest that the fault cores were the locations of the largest displacements and can be
considered as major fault zones. Although the small amount of available information only allows a
rough estimation on the geometry of the fault planes, and there is a slight difference in their dip
angle and direction, these faults were likely affected by a similar deformational event. Earlier
studies reported that the formation of these low angle (~ 5-15°), northwest-vergent thrust sequences
throughout the basement of the Pannonian Basin and the adjacent areas are related to the Eoalpine
compressional activity during the late Cretaceous nappe formation (Pap et al., 1990, Teleki et al.,
1994, Árkai et al., 1998, Tari et al., 1999, Kovács et al., 2000). According to this interpretation, AG
and SG lithologic groups, with their distinct metamorphic pathways, were juxtaposed due to this
Eoalpine compressional activity. The depth and exact age of the deformation is still unclear, as each
zircon fission track datum from the vicinity of Szeghalom Dome have Jurassic age (~ 187-160 Ma).
These result are in coincidence with the youngest dominant K/Ar and Ar/Ar ages of the area (K/Ar
Page 110
109
from feldspar: ~ 195-180 Ma, Ar/Ar from feldspar: ~157-145 Ma), which must be related to the
continental rifting of the Tisza Megaunit (Balogh et al., 2009). The lack of zircon fission track or
significant K/Ar, Ar/Ar ages following this heat event are an indirect evidence for shallow crustal
(or even near surface) level of the tectonism during the Cretaceous.
Assuming the above dip of the thrust zone, the depths of the tectonized intervals in
neighbouring wells indicate the presence of high angle normal faults with even 150 meters of
vertical displacement in some cases. Extensional tectonic activity has been widely reported in the
SzD and can be related to the formation of horst/graben structures during the syn-rift stage of the
opening of the Pannonian Basin during the Miocene period (M. Tóth, 2008).
The paleofluid evolution was reconstructed based on analyses of aqueous and petroleum
inclusions from the fracture-fillings of the amphibolites or the damage zones of faults (Schubert et
al., 2007) and unpublished industrial (well test) data. The fact that most of the analyzed fluid
inclusions are from the amphibolites and they are totally absent in the gneisses, indicate that the
main storage capacity is related to the former lithology, strengthening the results of M. Tóth et al.
(2004) on the fracture network geometry of SzD. The amphibolite-rich lithologies are dominant in
the structurally topmost metamorphic block of the basement. In this model, the damage zones of
faults with their limited width and spatial distribution served as migration pathways towards these
sporadic bodies. The quite permeable behavior of the fault zones is underlined by the rather
productive well-tests throughout the field.
The diverse fluid inclusion data (by the geochemical features and the degree of maturation
of the analyzed hydrocarbons) indicate the presence of a compartmentalized hydrodynamic regime,
at least during the cementation of the fractures. This separation can be explained most likely by the
combined effects of the intense multistage Neogene tectonic activity (M. Tóth et al., 2009) and the
strong permeability anisotropy of the fault zones (Evans et al., 1997).
There is dissimilarity between the paleo and recent petroleum systems of the SzD regarding
the possible source rocks: the earliest date of paleo-fluid migration recorded by the fluid inclusions
Page 111
110
was the Cretaceous according to their biomarkers, while the data of Schubert et al. (2007) indicate
that the migration ended before the Badenian exhumation of the SzD. In contrast, the currently
produced hydrocarbon originated from upper Miocene shales in the adjacent sub-basins south from
SzD (the Békés Basin or the Vésztő Graben, Teleki et al., 1994). In the light of the industrial data,
SzD has a very strong hydraulic connection with the overlying sediments as the metamorphic
basement can drain the adjacent over-pressured basins under regional aquitard (Endrőd Formation)
and behaves as a migration pathway towards the overlying clastic sediments (Szolnok and Algyő
Formation). Juhász et al. (2002) indicate the presence of the hydraulic connection between the
basement and the overlying sediment since the middle Miocene period and the results defined in
this work are in coincidence with the recent hydrodynamic observations.
V.2 Outlook
There are numerous still unanswered questions about the internal structure and the temporal
evolution of both the brittle fault zones and the Szeghalom Dome itself, which require further
detailed researches. Moreover, in the Pannonian Basin there are also several basement highs, where
a puzzle of unrelated metamorphic blocks constitutes the basement (e.g., Jánoshalma – Zachar and
M. Tóth 2004, Algyő – Lelkes-Felvári et al., 2003, Kiskunhalas – Fiser-Nagy et al., 2014) and these
blocks were presumably juxtaposed by post-metamorphic tectonic movements. However, only
limited information and data are available in publications and industrial reports for the
reconstruction of their evolution. Nevertheless, a detailed investigation of their shear zones – like in
the case of SzD – would provide essential information for the understanding their internal
architectures.
Another potential way of investigations is the evaluation of the relationship between the
observed deformational phases and their geochronological details. In Szeghalom, the age of the
Page 112
111
main events after the Variscan (Carboniferous) peak of the metamorphism (~ 330 Ma) were defined
by Balogh et al. (2009): this study separated a Permian metamorphism (K/Ar ages from biotite and
amphibole and Ar/Ar ages from amphibole) and a Jurassic continental rifting event (K/Ar and Ar/Ar
ages from feldspar and zircon fission track). The reason for total lack of younger, late Mesosoic or
Neogene ages requires a further analysis. For this purpose, especially age dating of the < 2 μm
fraction of the authogenic clay minerals of the fault rocks (e.g. K/Ar aging of the fault gouges)
would be important.
The post-metamorphic tectonic events on Szeghalom Dome have caused wide tectonic
zones and contributed to the development of the juxtaposed blocks with different metamorphic P-T
pathways. The role of these fault zones is quite various, since they theoretically may behave both as
permeable and impermeable zones and may also act as migration pathways and/or barrier bodies.
Hydrogeological interpretation of the unpublished borecore permeability measurements on the fault
rocks of SzD may also provide useful information, as these test series revealed the strong tectonite-
type controlled permeability structure of the brittle fault zones. The permeability measurements
were completed on cylindrical shaped samples in a flexible wall permeameter (DW 250 Wille
Geotechnik) with constant, 1.5 bar pressure. The fractured, brecciated damage zone samples own
much higher permeability values (100-150 millidarcy), than the cataclastic or fault gouge-rich core
zone, where the permeabilities vary between 1 and 5 millidarcy. These preliminary data prove the
widely known two-faced hydraulic structure of the fault zones (Caine et al., 1996, Evans et al.,
1997), where damage zone have a conduit feature, contrary to the fault core, which is usually a
barrier for the fluid flow. Construction of a coherent fluid-flow model with the consideration of the
defined lithologic structure of Szeghalom Dome may also offer a fruitful way of the further
researches and can be a possible next step in the more detailed interpretation of the hydrodynamic
behavior of the basement high.
Based on the unpublished industrial predictions, economically significant amount of still
unproduced hydrocarbon can be trapped in these fractured highs. Accumulations in these Paleozoic
Page 113
112
highs often related to the structural elements with relatively simple setting (e.g., on the flanks of the
basement highs adjacent to the Neogene sub-basins) (Bada and Tari, 2012), but past years
developments in the seismic imaging techniques may now allow to discover more complex
geometries within the basement. Additionally, the development of the seismic imaging techniques
(e.g., determination of trapping or migrational configurations of the fault zones) can also promote
the proper recognition of the role of fault zones in petroleum systems (Fossen, 2012).
All these possible ways of future work may largely contribute to a more sophisticated
interpretation of the brittle fault zones and, moreover, may also provide remarkable results on the
Szeghalom Dome or other basement highs in the Pannonian Basin.
Page 114
113
Summary
I. Introduction, objectives
Brittle fault zones are lithologically strongly heterogeneous structural elements and
significantly affect the hydrogeological systems in the upper part of the Earth’s crust. The structural
and hydraulic features of the fault zones may reflect extreme temporal and spatial variation.
Though, for instance, fault zones that are early in development may be permeable, they may
become a barrier to fluid flow when they are more mature. The main fault components, as detailed
by Caine et al. (1996) and Evans et al. (1997), are the fault core and the associated damage zone.
The basement of the Pannonian Basin contains several fractured metamorphic hydrocarbon
reservoirs where the brittle deformation and the fault zones have a key role in the local
hydrogeologic system. Békés Basin, the deepest sub-basin of the Pannonian Basin, is bordered by
several Paleozoic highs that contain significant amounts of accumulated petroleum (e.g., the
Dévaványa, Endrőd, Sarkadkeresztúr fields). One of the largest reservoirs the Szeghalom Dome is
located on the northern margin of the Békés Basin and is mainly composed of Variscan gneisses and
amphibolites with different metamorphic evolutions. These petrologically incompatible blocks were
juxtaposed by post-metamorphic tectonic activity with predominantly Alpine or Neogene ages. This
process was accompanied by the formation of brittle fault zones with notable porosity enhancement
and as a result these planes mainly act as migrational pathways in the hydraulic system of the
metamorphic highs.
Lithological composition for the Szeghalom Dome was summarized by M. Tóth (2008),
along with the most characteristic lithologies (diverse types of gneisses, amphibolite and micro-
granite) and these results determined the conceptual lithological framework model of the basement
high. Moreover, the post-metamorphic fluid and fracture network evolution was defined by Juhász
Page 115
114
et al. (2003) and Schubert et al. (2007) who described the possible timing of the petroleum
migration and the details of hydraulic connectivity with the adjacent or overlying sedimentary
rocks. Although these studies revealed the importance of the brittle fault zones in the juxtaposition
of the diverse metamorphic blocks and subsequent fluid migration, no definition of their spatial
arrangement has yet been achieved.
Aim of this study was to define the characteristics of the fault zones developed in
metamorphic lithology with a special emphasis on their microstructural clast geometric and rock
mechanical attributes. The throughout interpretation of the available borecores and well-log datasets
aimed the determination of fault zones of the study area which provided the opportunity for the
partial reconstruction of the post-metamorphic structural evolution of the Szeghalom Dome. Finally,
discussing the relevance of the main shear zones in the petroleum system of the basement high was
also a target of this work.
II. Methods applied
For the purpose of the classification of diverse fault rock samples from the fault zone of well
A-180 in Szeghalom Dome detailed petrographic, macro- and microstructural investigations were
carried out both on the available borecores and thin section.
The shape and size characteristics of the particles formed during brittle deformation were
measured with Petrographic Image Analysis (PIA) method both in borecore and at the thin section
scale. PIA of the borecore samples was performed on core-scanner pictures taken by the ImaGeo
core scanner in the Hungarian Geological and Geophysical Institute. The micro-scale analysis was
achieved on micro-photographs from selected, structurally representative parts of thin sections. The
clast geometric measurements were completed using the selected parameters in ImageJ: Particle
Size Distribution (PSD), Clast Complexity (DR), Aspect Ratio (AR), Circularity (Circ), Convexity
(Conv) and Clast Orientation (Angle).
Page 116
115
The resulted database allowed for statistical processing with the goal of distinguishing the
distinct fault rocks and revealing the prevalent brittle deformation mechanisms that operate during
different stages of fragmentation. IBM SPSS 20.0 Statistics software was applied for the statistical
evaluation of the results to answer the following questions:
1) how reliably can the lithologies be distinguished based on their geometric parameters?
2) which parameters are responsible for characterisation of each group?
3) how do the different stages of deformation manifest in the measured parameters?
Discriminant function analyses were performed to define which parameters participate in the
distinction of differ tectonite types, and to what level, both for pairwise and for all three groups. The
aim of multidimensional-scaling is to set the place of the samples in the theoretical six-dimensional
space of the measured parameters and illustrate the evolution of the particles from the aspect of
geometric parameters.
Rock mechanical attributes of the fault rocks were determined using a series of uniaxial
compressive tests according to the suggestions of the International Society for Rock Mechanics
(ISRM, 2006). Rock mechanical tests were carried out in the Rock Mechanics Laboratory at the
Budapest University of Technology and the Economics.
The well-log data were calibrated on the depth intervals of well A-180 that overlapped with
the core samples to define the lithologic composition of seven analyzed well from the central part of
the Szeghalom Dome. The data set was statistically evaluated using the IBM SPSS 20.0 statistics
software. The discriminant function analysis method was constructed to separate the lithologic
groups based on available potential, caliper, resistivity, density, compensated neutron porosity,
acoustic and natural gamma logs. First, a discriminant function was computed to define the
difference between the undeformed wall rock and the tectonized depth intervals by calculating the
proper linear combination of the measured well-log data. Discriminant functions were then
Page 117
116
calculated to define the different types of fault rocks (fault breccia, cataclasite, fault gouge) within
the zones that were classified as tectonized in the previous step. The computed functions were then
applied to construct the lithological column of the investigated wells. Spatial correlations between
the reconstructed 1D lithologic columns revealed the main structural elements of the Szeghalom
Dome.
III. New scientific results
1. In the fault zone of the well A-180 three dominant fault rock types can be classified: fault
breccias, cataclasites and fault gouges. Most of the analyzed samples were composed of coarse fault
breccia that contained weakly disaggregated structures and clast sizes that were typically greater
than cm-scale. Several samples show characteristic micro-scale features of cataclastic deformation
that resulted in a decrease in clast size an increase in the matrix ratio and the formation of preferred
orientation. A third type of samples, the incohesive fault gouges, is present in thin deformational
bands which probably define the localized slip zones of the faults.
2. The multivariate statistical processing of the clast geometric PIA results of the fault rocks
demonstrated the importance of PSD, Angle, AR, and Circ parameters in the classification of diverse
tectonite types. The calculated pair-wise and joint discriminant functions clearly separated the
diverse fault rocks by the combination of the above parameters in descending order of importance.
The discriminant functions also pointed out the relatively similar geometric features of fault
breccias and cataclasites in contrast to the significantly different characteristics of fault gouges.
3. Multidimensional scaling resulted in a three-fold particle evolution scheme from the less
deformed samples to the most fragmented ones. This statistical interpretation illuminated the
strongly diverse attributes of the fault gouge compared with the other two groups of breccias and
Page 118
117
cataclasites. The multidimensional scaling demonstrated the evolution of the analysed brittle
tectonites where the initial deformation is coupled with chaotic fabric giving a weakly
disaggregated fault breccia texture. The transitional stage can be characterised by cataclastic flow
while in the most deformed fault gouge samples the strong fragmentation, clast-rounding and
oriented texture dominate.
4. The main fault zone units, the damage zone and the fault core were separated based on their rock
mechanical features as a result of uniaxial compression tests series. Damage zone of the fault can be
characterised by an extremely brittle nature and low uniaxial compressive strength coupled with a
dominantly coarse fault breccia composition. In contrast, the gouge-rich fault core reflects a
widespread plastic and inelastic nature with locally pseudo-ductile microstructure. In the core of the
fault zone, strain localization was the dominant deformation phenomenon, as implied by the
pervasive formation of fault gouge ribbons.
5. Between the damage zone and fault core units of the shear zone a characteristic section was
observed based on the uniaxial compressive tests with significant strain hardening relatively high
uniaxial compressive strength and low brittleness. This transitional zone may suggest interplay
between the brittle and ductile behaviors and presumably marks the strongest part of the fault zone
based on rock mechanics.
6. The available borecores were calibrated with their well logs, and the dominant petrophysical
attributes of the tectonised depth intervals were defined. The most essential difference between the
undeformed wall rock and the tectonized zones in this metamorphic lithology are the high natural
gamma values, the relatively lower resistivity and densities in the tectonized zones. These results
suggest that the intensely deformed fault cores can be characterized by the low density and
resistivity with elevated natural gamma activity and compensated neutron porosity values. In
Page 119
118
contrast, the interpreted damage zones with coarse fault breccias have higher density and resistivity
values with lower gamma and neutron porosity values. The calculated results were extended to the
1D log intervals of the same well without borecores and their correlation was attempted on the
seven available wells from the Szeghalom field.
7. The estimated tectonic boundaries between the juxtaposed lithologic blocks of Szeghalom
reservoir were defined via the correlation of the constructed 1D lithologic columns. According to
their interpretation and to the structural evolution of the adjacent areas the spatial arrangement of
the deformed depth intervals indicates the presence of low angle (<15°) thrust fault planes. These
defined fault zones most likely developed due to north-northwest vergent Eoalpine (Late
Cretaceous) compressional tectonics which was probably responsible for the juxtaposition of the
different metamorphic blocks. The structure of the Szeghalom Dome was further complicated by
high angle normal faults with approximately 100-150 meter of vertical displacement which are
related to the middle Miocene extension. This phase of the geodynamical evolution of the basin is
believed to be responsible for the horst-graben structure of the Szeghalom Dome.
8. The integration of the structural results with datasets of the paleo-fluid evolution recent
production and fracture network geometry indicates the importance of these fault zones in both the
migration of hydrocarbons from the adjacent sub-basins to the overlying sediments and to the
strongly fractured amphibolite bodies within the basement. In this model, the damage zones of
faults, with their limited width and spatial distribution served as migration pathways towards these
sporadic bodies. The hydraulic compartmentalization of Szeghalom Dome can be explained most
likely by the combined effects of the intense multistage Neogene tectonic activity (M. Tóth et al.,
Page 120
119
2009) and the strong permeability anisotropy of the fault zones (Evans et al., 1997) throughout the
fractured reservoir.
Page 121
120
Összefoglalás
I. Bevezetés és célok
A töréses vetőzónák rendkívül heterogén szerkezeti egységek, melyek jelentős hatással
bírnak a felső kéreg hidrogeológiai rendszerére. Ezen zónák fő szerkezeti és hidraulikai vonása,
hogy rendkívül jelentős idő- és térbeli változékonyságot mutatnak: például egyes, fejlődésük korai
szakaszában permeábilis nyírási zónák, későbbi, „érett‖ fázisukban zárótestként viselkedhetnek. A
vetőzónák gyakran jól meghatározható belső szerkezettel rendelkeznek, melynek legfontosabb
részegységei elsősorban a Caine et al. (1996) és Evans et al. (1997) munkái alapján definiált
„magzóna‖ illetve a kapcsolódó „kárzóna‖.
A Pannon-medence kristályos aljzatában számos repedezett, metamorf szénhidrogén tározó
található, melyek hidrogeológiai rendszerében a töréses vetőzónák kulcsszerepet játszanak. A terület
legmélyebb süllyedékének, a Békés-medencének peremén számos ilyen repedezett aljzati tározó
található, melyekben jelentős mennyiségű szénhidrogén halmozódott fel (például Dévaványa,
Endrőd, Sarkadkeresztúr mezők). Közülük az egyik legjelentősebb a Szeghalom-dóm, mely a
medence északi peremén helyezkedik el és javarészt különböző metamorf fokú variszkuszi
gneiszekből és amfibolitokból épül fel. Ezen inkompatibilis kőzetblokkok a túlnyomórészt az alpi
és neogén szerkezeti hatások eredményeként kerültek szomszédos helyzetbe, mely folyamat együtt
járt széles töréses zónák kialakulásával. A gyakran jelentős porozitás növekedéssel járó folyamatnak
eredményeként ezen zónák a metamorf hátak hidraulikai rendszerében migrációs útvonalat
alkothatnak.
A Szeghalom-dóm felépítését M. Tóth (2008) összegezte, definiálva a terület
legjellegzetesebb litológiai típusait (különböző gneisz, amfibolit és gránit típusok) illetve a
kristályos-hát ideális kőzetoszlopát. Ezen túlmenően, Juhász et al. (2003) és Schubert et al. (2007)
Page 122
121
munkái összefoglalták a poszt-metamorf fluidum-evolúció főbb eseményeit, többek között
meghatározva a szénhidrogén-migráció szakaszait és részletezve az aljzat és a szomszédos üledékes
testek hidraulikai kapcsolatát. Mindazonáltal, bár ezen munkák kiemelték a töréses zónák
jelentősségét a terület szerkezeti alakulásában és fluidum-migrációjában, nem definiálták ezen síkok
pontos térbeli elrendeződését.
A dolgozat célja a metamorf kőzettestekben kialakult aljzati töréses zónák
jellegzetességeinek meghatározása, különös tekintettel a mikroszerkezeti, klasztgeometriai és
kőzetmechanikai tulajdonságokra. Ezeken túl, a rendelkezésre álló maganyag és lyukgeofizikai
adatsorok részletes elemzésének célja a vizsgált terület vetőzónáinak azonosítása volt, mely
lehetőséget teremtett a Szeghalom környéki aljzat kiemelkedés poszt-metamorf szerkezeti
fejlődésének részleges rekonstruálására. Végül, de nem utolsó sorban a dolgozat vizsgálja a főbb
nyírási zónák szerepét a kristályos aljzat szénhidrogén rendszerében.
II. Alkalmazott módszerek
A Szeghalom-dóm A-180-as fúrása által feltárt vetőzóna tektonit típusainak pontos
meghatározásához a rendelkezésre álló magminták és vékonycsiszolatok alapos petrográfiai, makro-
és mikroszerkezeti vizsgálatát végeztem el.
A töréses deformáció hatására kialakult klasztok geometriai jellemzőinek méréséhez
kőzettani képanalízist (Petrographic Image Analysis, PIA) alkalmaztam, mag és csiszolat léptékben
egyaránt. A magminták feldolgozása magszkenner felvételek alapján történt, melyek a Magyar
Földtani és Geofizikai Intézet Imageo magszkennerével készültek. A mikroléptékű elemzéshez a
vizsgált vékonycsiszolatok szerkezetileg reprezentatív részeiről készült felvételeket használtam fel.
A klasztgeometriai vizsgálatokhoz az ImageJ keretprogram alábbi paramétereit használtam fel:
szemcseméret-eloszlás (Particle Size Distribution, PSD), szemcse bonyolultság (Clast Complexity,
Page 123
122
DR), megnyúltság (Aspect Ratio, AR), cirkularitás (Circularity, Circ), konvexitás (Convexity, Conv)
és szemcse-irányítottság (Clast Orientation, Angle).
A szemcsegeometriai eredmények nagyméretű adatbázisa lehetővé tette az adatok
többváltozós statisztikai feldolgozását, melynek elsődleges célja a töréses deformáció során
domináns mechanizmusok meghatározása volt. Az adatok IBM SPSS 20.0 Statistics szoftverrel
történő elemzésével a következő kérdésekre igyekeztem választ keresni:
1) milyen biztonsággal különíthetőek el a tektonit típusok geometriai jellegzetességeik alapján?
2) mely paraméterek alkalmasak leginkább az egyes csoportok jellemzésére?
3) miként jelennek meg a különböző deformációs fázisok a paraméter értékek változásaiban?
Hogy megállapítást nyerjen, mely paraméterek és milyen mértékben vesznek részt a
különböző tektonitok elkülönítésében, diszkriminancia függvényeket generáltam, mind csoport
páronként, mind az összes csoportra együttesen. A többdimenziós skálázás célja a minták
elhelyezése a mért paraméterek elméleti, hat dimenziós terében és a szemcsék geometriai
fejlődésének ábrázolása volt.
A domináns kőzettípusok kőzetmechanikai jellegzetességeit egytengelyű töréstesztek
eredményei alapján vizsgáltam, mely tesztek összhangban álltak a Nemzetközi Kőzetmechanikai
Szövetség ajánlásaival (ISRM, 2006). A kísérletek a Budapesti Műszaki és Gazdaságtudományi
Egyetem Kőzetmechanikai Laboratóriumában zajlottak.
A rendelkezésre álló hét, Szeghalom-dóm központi részéről származó kút lyukgeofizikai
kalibrálása a maggal mintázott mélységintervallumok kőzettani értelmezése alapján történt,
melyben kulcsfontossággal bírt az aljzatot közel 100%-os magnyereséggel harántolt A-180-as fúrás.
A karotázs adatsorok statisztikai alapú feldolgozásához ismételten IBM SPSS 20.0 Statistics
szoftvert alkalmaztam. A diszkriminancia-függvény alapú litológiai elkülönítéshez a potenciál,
lyukátmérő, ellenállás, sűrűség, neutron porozitás, akusztikus és természetes gamma szelvényeket
Page 124
123
használtam fel. Ennek első lépéseként a mért lyukgeofizikai paraméterek megfelelő lineáris
kombinációjából számított függvényekkel elkülönítettem a deformálatlan falkőzet és deformált
testek mélységszakaszait. Ezt követően az előző lépésben deformáltnak minősített intervallumok
osztályozását végeztem el, különböző tektonitokhoz való hasonlóságuk alapján (breccsa, kataklázit,
vetőagyag), meghatározva töréses zónák belső szerkezetét. A számított függvények a vizsgált kutak
maggal nem ismert szakaszain történő alkalmazásával minden egyes kútra egy 1D-s litológiai
oszlopot kaptam. A kutak közötti térbeli korreláció alapján meghatározhatóvá váltak az Szeghalom-
dóm vizsgált területének fő szerkezeti elemei.
III. Új tudományos eredmények
1. A Szeghalom-dóm A-180-as fúrása által feltárt széles nyírási zónában alapvetően három uralkodó
tektonit típust különítettem el: vetőbreccsákat, kataklázitokat és vetőagyagokat. A minták jelentős
hányada durva vetőbreccsa volt, melyek kismértékű elmozdulásra utaló kevéssé zúzott szerkezettel
és uralkodóan centiméteres nagyságrendű szemcsemérettel rendelkeztek. Számos mintában a
kataklázos deformáció jellegzetes mikroléptékű nyomait lehetett felfedezni, mint például az
erőteljes szemcseméret csökkenés, a mátrixanyag arányának jelentős növekedése illetve a változó
mértékű nyírási irányítottság megjelenése. A leginkább tektonizált kőzettípust a vetőagyagok
alkották, melyek vékony szalagokként, elszórtan megjelenve a főbb elmozdulási síkokat alkotják.
2. A szemcsegeometriai PIA paraméterek többváltozós statisztikai feldolgozása rámutatott a
szemcseméret-eloszlás (PSD), szemcse-irányítottság (Angle), megnyúltság (AR), és cirkularitás
(Circ) paraméterek fontosságára az egyes tektonit típusok osztályozásában. A csoportokat az azokra
páronként és együttesen számított diszkriminancia függvények tisztán elkülönítették, mégpedig a
fenti paraméterek felhasználásával. A függvények mindezek mellett hangsúlyozták a vetőbreccsa és
Page 125
124
kataklázit minták viszonylagos geometriai hasonlóságát, szemben a vetőagyagoknak definiált
mintákkal.
3. A többdimenziós skálázás módszerével bizonyítottam, hogy a kevésbé deformált mintáktól a
leginkább zúzottakig egy háromosztatú klaszt-fejlődési pálya határozható meg. A statisztikai
módszer szintén rávilágított a vetőagyag minták egyedi morfológiai sajátosságaira. A vizsgálat első
fejlődési szakaszaként a kezdeti deformációt határozta meg, ahol a kaotikus, irányítatlan szöveti
képpel jellemezhető enyhén zúzott vetőbreccsák alakulnak ki. Az átmeneti fázisban a kataklázos
folyás folyamata az uralkodó, míg a fejlődési pálya a vetőagyag minták esetén csúcsosodik ki, ahol
az erős szemcseaprózódás, kerekítődés és az orientált szövet kialakulása jellemző.
4. A töréses vetőzónák fő szerkezeti elemeinek kőzetmechanikai tulajdonságait egytengelyű
töréstesztek eredményei alapján határoztam meg. Ezek szerint a kárzóna extrém rideg testként
jellemezhető az alacsony egytengelyű nyomószilárdság és breccsa-domináns összetétel mellett.
Ezzel szemben a vetőagyagban gazdag magzóna rendkívül plasztikusan viselkedik, melyhez
gyakran félképlékeny mikroszerkezeti bélyegek társulnak. Továbbá megállapítást nyert, hogy ebben
a zónában gyakori jelenség volt a deformáció diszkrét síkokon történő koncentrálódása is, melyet az
agyagos szalagok gyakori megjelenése is alátámaszt.
5. Az egytengelyű töréstesztek alapján egy jelentősen felkeményedő, magas nyomószilárdsággal és
alacsony ridegségi mutatóval jellemezhető egységet határoztam meg a magzóna és a kárzóna
határán. Ez az átmeneti szakasz feltehetően a töréses illetve képlékeny viselkedés kombinációjából
alakulhatott ki és ennek eredményeként a nyírási zóna kőzetmechanikailag legellenállóbb
zónájaként jellemezhető.
Page 126
125
6. A felhasználható magminták illetve azok mélységintervallumaihoz kapcsolódó lyukgeofizikai
paraméterek összehangolását követően meghatároztam a tektonizált szakaszok kőzetfizikai
tulajdonságait. A jelenleg vizsgált metamorf litológiai környezetben legjellegzetesebb eltérés a
deformálatlan mellékkőzet és töréses szakaszok között utóbbiak magas gamma illetve viszonylag
alacsonyabb ellenállás és sűrűség értékeiben mutatkozott meg. Az eredmények rámutattak, hogy a
legintenzívebben zúzott magzóna még alacsonyabb sűrűség és ellenállás, illetve magas természetes
gamma és neutron porozitás értékekkel jellemezhető. Ezzel szemben a kárzóna kevéssé zúzott
szakaszain magasabb sűrűség és ellenállás illetve alacsonyabb gamma és neutron porozitás értékek
dominálnak. Következő lépésben, a kapott eredményeket kiterjesztettem a magmintákkal le nem
fedett egydimenziós kútoszlopokra, a vizsgált kutak korrelációjának céljából.
7. A Szeghalom-dóm kőzettani blokkjait elválasztó tektonikus határok meghatározása a kutak 1D-s
litológiai oszlopainak korrelációja alapján történt. A szomszédos területek szerkezeti fejlődése és a
kialakított kőzetváz modell alapján a definiált vetősíkokat alacsony szögű (<15°) feltolódásokként
értelmeztem. Ezen töréses zónák kialakulása és így az eltérő metamorf fejlődéstörténetű blokkok
szomszédos pozícióba kerülése legnagyobb valószínűséggel a késő krétában lezajlott, észak-
északnyugati irányú, eoalpi kompressziós mozgásokhoz köthető. A Szeghalom környéki aljzat
kiemelkedés szerkezetét tovább bonyolította a 100-150 méteres vertikális elmozdulással
jellemezhető meredek normál vetők sorozata, melyek keletkezése feltehetően a középső-miocén
extenziós tektonikai rezsimhez kapcsolódik. A Pannon-medence geodinamikai fejlődésének ezen
szakasza okozhatta a vizsgált területen megfigyelhető árok-sasbérc szerkezetek kialakulását.
8. A szerkezetfejlődési eredmények illetve a rendelkezésre álló paleofluidum, termelési és
repedésgeometriai adatok együttes értékelése rámutatott a töréses vetők megkerülhetetlen szerepére
a szénhidrogén szomszédos mélymedencékből az aljzati háton keresztül a fedő üledékek felé
történő migrációjában. Ezen túlmenően a deformált zónák szintén jelentős súllyal bírnak a
Page 127
126
metamorf háton belüli jól repedezett, elsősorban amfibolit testekbe történő áramlásban. A vázolt
modell alapján, a vetők kárzónája korlátozott kiterjedése és térbeli előfordulása miatt elsősorban
migrációs útvonalként viselkedik a jól repedezett kőzettestek irányába, mintsem aljzaton belüli
tárolóként. A Szeghalom-dómon belüli szeparált hidrodinamikai alegységek kialakulása elsősorban
a többfázisú neogén szerkezetfejlődésre (M. Tóth et al., 2009) és a töréses zónák okozta jelentős
permeabilitás anizotrópiára (Evans et al., 1997) vezethető vissza.
Page 128
127
Acknowledgement
First of all, I would like express my gratitude for my supervisors, Tivadar M. Tóth and Félix
Schubert for their valuable advices, suggestions and expertise in every way.
I have to say thank for all my colleagues at the Department of Mineralogy, Geochemistry and
Petrology. MOL Hungarian Oil and Gas Company is thanked for providing the samples, datasets
and the financial support of this research. I acknowledge the Institute of Geography and Geology,
University of Szeged for their financial support granted through a pre-doctoral fellowship.
Balázs Kiss (MOL) is thanked for the fruitful discussions on the petroleum systems of the
metamorphic basement highs and mechanisms of Szeghalom reservoir. I am grateful to Balázs
Vásárhelyi for his support in the rock mechanical tests and advantageous suggestions on the
interpretation of the results. Gyula Maros (Hungarian Geological and Geophysical Institute) is also
thanked for his help in the use of ImaGeo corescanner.
Last, but not least, I am extremely grateful to Natália Szabó and my family for their
continuous support and patience, which was essential for this work.
Page 129
128
References
Albu, I., A. Pápa, 1992: Application of high-resolution seismics in studying reservoir characteristics
of hydrocarbon deposits in Hungary. Geophysics, 57, 8, 1068–1088.
Allan, U.S., 1989: Model for hydrocarbon migration and entrapment within faulted structures.
AAPG Bulletin, 73, 803-811.
Antonellini, M., Aydin, A., 1995: Effect of faulting on fluid flow in porous sandstones: geometry
and spatial distribution. AAPG Bulletin, 79, 642-671.
Árkai, P., Bérczi-Makk, A., Hajdu, D., 1998: Alpine prograde and retrograde metamorphisms in an
overthrusted part of the basement, Great Plain, Pannonian Basin, Eastern Hungary. Acta Geologica
Hungarica, 41, 179-210.
Aydin, A., 2000: Fractures, faults, and hydrocarbon entrapment, migration and flow. Marine and
Petroleum Geology, 17, 797-814
Bada, G.., Tari, G.., 2012: Hungary. Exploration country focus. AAPG-European Newsletter, 2012,
6, 5-8.
Balázs, E., Cserepes-Meszéna, B., Nusszer, A., Szili-Gyémánt, P., 1986: An attempt to correlate the
metamorphic formations of the Great Hungarian Plain and the Transylvanian Central Mountains
(Muntii Apuseni). Acta Geologica Hungarica, 29, 3-4, 317-320.
Page 130
129
Balogh, K., M. Tóth, T., Dunkl, I., Scherrer, N., 2009: Gechronology of the polymetamorphic
basement in the Szeghalom and Mezősas-Furta highs. In: M. Tóth, T. (ed.): Igneous and
metamorphic rocks of the Tisza Unit. Szeged, Geolitera press, 147-160. (In Hungarian with English
abstract)
Barnett, W., 2004: Subsidence breccias in kimberlite pipes—an application of fractal analysis.
Lithos, 76, 299–316.
Becker, S.P., Eichhubl, P., Laubach, S.E., Reed, R.M., Lander, R.H., Bodnar R.J., 2010: A 48 my
history of fracture opening, temperature, and fluid pressure: Cretaceous Travis Peak Formation,
East Texas basin. Geological Society of America Bulletin, 122, 7-8, 1081-1093.
Ben-Zion, Y., Sammis, C.G.., 2003: Characterization of fault zones. Pure and Applied Geophysics,
160, 677–715.
Bérubé, D., Jébrak, M., 1999: High precision boundary fractal analysis for shape characterization.
Computers & Geosciences, 25, 1059–1071.
Biegel, R.L., Sammis, C.G.., Dieterich, J.H., 1989: The frictional properties of a simulated gouge
having a fractal particle distribution. Journal of Structural Geology, 11, 827 – 846.
Bieniawski, Z.T., 1967: Mechanism of brittle fracture of rock, parts I, II and III. International
Journal of Rock Mechanics and Mining Sciences, 4, 395–430.
Billi, A., Salvini, F., Storti, F., 2003: The damage zone-fault core transition in carbonate rocks:
implication for fault growth, structure and permeability. Journal of Structural Geology, 25, 1779-
Page 131
130
1794.
Billi, A., Storti, F., 2004: Fractal distribution of particle size in carbonate rocks from the core of a
regional strike-slip fault zone. Tectonophysics, 384, 115-128.
Billi, A., 2007: On the extent of size range and power law scaling for particles on natural carbonate
fault cores. Journal of Structural Geology, 20, 1512-1521.
Bistacchi, A., Massironi, M., and Menegon, L., 2010: Three-dimensional characterization of a
crustal-scale fault zone: The Pusteria and Sprechenstein fault system (Eastern Alps). Journal of
Structural Geology, 32, 2022-2041.
Blenkinsop, T. G.., 1991: Cataclasis and processes of particle size reduction. Pure and Applied
Geophysics, 136, 59– 86.
Brodie, K., Fettes, D., Harte, B., 2007: Structural terms including fault rock terms. In: Metamorphic
rocks: a classification and glossary of terms, Cambridge University Press, 24-31.
Cai, M., Kaiser, P.,K., Tasaka, Y., Maejima, T., Morioka, H., Minami, M., 2004: Generalized crack
initiation and crack damage stress thresholds of brittle rock masses near underground excavations.
International Journal of Rock Mechanics and Mining Sciences, 41, 833–847.
Cai, M., 2010: Practical estimates of tensile strength and Hoek–Brown strength parameter of brittle
rocks. Rock Mechanics and Rock Engineering, 43, 2, 167-184.
Caine, J.S., Evans, J.P., Forster, C.B., 1996: Fault zone architecture and permeability structure.
Page 132
131
Geology, 24, 1025–1028.
Caine, J.S., Ronald, L., Bruhn, R.L., Forster, C.B., 2010: Internal structure, fault rocks, and
inferences regarding deformation, fluid flow, and mineralization in the seismogenic Stillwater
normal fault, Dixie Valley, Nevada. Journal of Structural Geology, 32, 1576–1589.
Cattell, R.B., 1966: The scree test for the number of factors. Multivariate Behavioral Research, 1,
245-276.
Chester, F.M., Friedman, M., Logan, J.M., 1985: Foliated cataclasites. Tectonophysics, 111, 139-
146.
Clark, C., James, P., 2003: Hydrothermal brecciation due to fluid pressure fluctuations: examples
from Olary Domain, Southwest Australia. Tectonophysics, 366, 187– 206.
Clark, C., Mumm, A.S., Collins, A.S., 2006: A coupled micro- and macrostructural approach to the
analysis of fluid induced brecciation, Curnamona Province, South Australia, Journal of Structural
Geology, 28, 745–761.
Cladouhos, T.T., 1999: Shape preferred orientations of survivor grains in fault gouge. Journal of
Structural Geology, 21, 419–436.
Csontos, L., Nagymarosy, A., 1998: The Mid-Hungarian line: a zone of repeated tectonic
inversions. Tectonophysics, 297, 51-71.
Cuong, T.X., Warren, J.K., 2009: Bach Ho field, a fractured granitic basement reservoir, Cuu Long
Page 133
132
Basin, SE Vietnam. Journal of Petroleum Geology, 32, 2, 129-156.
Czauner, B., Mádl-Szőnyi, J., 2013: Regional hydraulic behaviour of structural zones and
sedimentological heterogeneities in an overpressured sedimentary basin. Marine and Petroleum
Geology, 48, 260-274.
Dank, V., 1988: Petroleum geology of the Pannonian Basin, Hungary, an overview. In: Royden, L.
and Horváth, F. (eds.): The Pannonian Basin. A study in basin evolution. AAPG Memoir, 45, 319-
331.
Davis, J.C., 2002: Statistics and Data Analysis in Geology. Wiley, 638
Engelder, J.T., 1974: Cataclasis and the generation of fault gouge. Geological Society of America
Bulletin, 85, 1515-1522.
Evans, J.P., Forster, C.B., Goddard, J.V., 1997: Permeability of fault-related rocks and implications
for fault-zone hydraulic structure. Journal of Structural Geology, 19, 1393–1404.
Faulkner, D.R., Jackson, C.A.L., Lunn, R.J., Schlische, R.W., Shipton, Z.K., Wibberley, C.A.J.,
Withjack, M.O., 2010: A review of recent developments concerning the structure, mechanics and
fluid flow properties of fault zones. Journal of Structural Geology, 32,1557–1575.
Fiser-Nagy, Á., Varga-Tóth, I., M. Tóth, T., 2014: Lithology identification using open-hole well-log
data in the metamorphic Kiskunhalas-NE hydrocarbon reservoir, South Hungary. Acta Geodaetica
et Geophysica 49, 1, 57-78.
Page 134
133
Fossen, H., Schultz, R.A., Shipton, Z.K., Mair, K., 2007: Deformation bands in sandstone: a review.
Journal of the Geological Society, 164.
Fossen, H., 2010: Structural geology. Cambridge University Press, 463.
Géraud, Y., Diraison, M., Orellana, N., 2006: Fault zone geometry of a mature active normal fault:
A potential high permeability channel (Pirgaki fault, Corinth rift, Greece). Tectonophysics, 426, 61-
76.
Hausegger, S., Kurz, W., Rabitsch, R., Kiechl, E., Brosh, F. J., 2010: Analysis of the internal
structure of a carbonate damage zone: Implications for the mechanisms of fault breccia formation
and fluid flow. Journal of Structural Geology, 32, 1349-1362.
Hayman, N.,W., 2006: Shallow crustal fault rocks from the Black Mountain detachments, Death
Valley, CA. Journal of Structural Geology, 28, 1767-1784.
Hecht, C.A., 2000: Appolonian packing and shape of grains improving geomechanical properties in
engineering geology. Pure and Applied Geophysics, 157, 487–504.
Heilbronner, R., Keulen, N., 2006: Grain size and grain shape analysis of fault rocks.
Tectonophysics, 427, 199-216.
Hirono, T., Sakaguchi, M., Otsuki, K., Sone, H., Fujimoto, K., Mishima, T., Lin, W., Tanikawa, W.,
Tanimizu, M., Soh, W., Yeh, E., Song, S., 2008: Characterization of slip zone associated with the
1999 Taiwan Chi-Chi earthquake: X-ray CT image analyses and microstructural observations of the
Taiwan Chelungpu fault. Tectonophysics, 449, 63–84.
Page 135
134
Horváth, F., Dövényi, P., Szalay, Á., Royden, L.H., 1988: Subsidence, thermal and maturation
history of the Great Hungarian Plain. In: Royden, L. H., Horváth, F. (eds.): The Pannonian Basin: A
Study in Basin Evolution. AAPG Memoir, 43, 355-372.
Horváth, F., Tari, G.., 1999: IBS Pannonian Basin project: A review of the main results and their
bearings on hydrocarbon exploration. In: Durand, B.,Jolivet, L., Horváth, F. and Seranne, M. (eds.):
The Mediterranean basins: Tertiary extension within the Alpine orogen. Geological Society,
London, Special Publications, 156, 195-213.
Horváth, F., Bada, G.., Szafián, P., Tari, G.., Ádám, Á., Cloething, S., 2006: Formation and
deformation of the Pannonian basin: constraints from observational data. In: Gee, D.G..,
Stephenson, R.A. (eds.): European Lithosphere Dynamics. Geological Society, London, Memoirs,
32, 191–206.
Hucka,V., Das, B., 1974: Brittleness determination of rocks by different methods. International
Journal of Rock Mechanics and Mining Sciences, 11, 389–392.
Hung, J., Wu, Y., Yeh, E., Wu, J., 2007: Subsurface structure, physical properties, and fault zone
characteristics in the scientific drill holes of Taiwan, Chelungpu-Fault Drilling Project. Terrestrial
Atmospheric Oceanic Science, 18, 271-293.
ISRM, 2006: The complete ISRM suggested methods for rock characterization, testing and
monitoring. International Society for Rock Mechanics, 628.
Jébrak, M., 1997: Hydrothermal breccias in vein-type ore deposits: a review of mechanisms,
Page 136
135
morphology and size distribution. Ore Geology Reviews, 12, 111 –134.
Jeppson, T.N., Bradbury, K.K., Evans, J.P., 2010: Geophysical properties within the San Andreas
Fault Zone at the San Andreas Fault Observatory at Depth and their relationships to rock properties
and fault zone structure. Journal of Geophysical Research,115.
Juhász, A., M. Tóth, T., Ramseyer, K., Matter, A., 2002: Connected fluid evolution in fractured
crystalline basement and overlying sediments, Pannonian Basin, SE Hungary. Chemical Geology,
182, 91-120.
Kaye, B.H., 1989: A Random Walk Through Fractal Dimension. VCH Publishers.
Keulen, N., Heilbronner, R., Stünitz, H., Boullier, A.M., Ito, H., 2007: Grain size distributions of
fault rocks: a comparison between experimentally and naturally deformed granitoids. Journal of
Structural Geology, 29, 1282-1300.
Klovan, J.E., Billings, G..K., 1976: Classification of geological samples by discriminant function
analysis. Bulletin of Canadian Petroleum Geology, 15, 313-330.
Kovács, S., Szederkényi, T., Haas, J., Buda, Gy., Császár, G.., Nagymarosy, A., 2000:
Tectonostratigraphic terranes in the pre-Neogene basement of the Hungarian part of the Pannonian
area. Acta Geologica Hungarica, 43, 225-328.
Lalonde, M., Tremblay, G., Jébrak, M., 2010: A Cellular Automata Breccia Simulator (CABS) and
its application to rounding in hydrothermal breccias. Computers & Geosciences, 36, 827–838.
Page 137
136
Laznicka, P., 1988: Breccias and coarse fragmentites. Petrology, environments, associations, ores.
Developments in Economical Geology, 25.
Lee, H., Kim, H., 2005: Comparison of structural features of the fault zone developed at different
protoliths: crystalline rocks and mudrock. Journal of Structural Geology, 27, 2099–2112.
Lelkes-Felvári Gy., Frank W., Schuster R., 2003: Geochronological constraints of the Variscan,
Permian–Triassic and eo-Alpine (Cretaceous) evolution of the Great Hungarian Plain basement.
Geologica Carpathica, 54, 5, 299–315.
Lin, A., 1999: S-C cataclasite in granitic rock. Tectonophysics, 304, 257-273.
Lonergan, L., Jolly, R.J.H., Rawnsley, K., Sanderson, D.J. (eds), 2007: Fractured Reservoirs.
Geological Society, London, Special Publications, 270
Lőrincz, K.D., 1996: Determination of stress-field history on the basis of multiphase tectonism
identified in the seismic profiles, in the western part of the Szolnok flysch belt. Hungarian
Geophysics, 37, 228–246. (in Hungarian with English abstract)
M. Tóth, T., Hollós, Cs., Szűcs, É., Schubert, F., 2004: Conceptual fracture network model of the
crystalline basement of the Szeghalom Dome (Pannonian Basin, SE Hungary). Acta Geologica
Hungarica, 47, 19-34.
M. Tóth T., Zachar J., 2006: Petrology and deformation history of the metamorphic basement in the
Mezősas-Furta crystalline high (SE Hungary). Acta Geologica Hungarica, 49, 2, 165-188.
Page 138
137
M. Tóth, T., 2008: Repedezett, metamorf fluidumtárolók az Alföld aljzatában. DSc thesis. (In
Hungarian)
M. Tóth, T., Redlerné, T.M., Kummer, I., 2009: Structural evolution of Szeghalom Dome on the
basis of petrological and seismic data. Hungarian Geophysics, 29, 143-151. (In Hungarian with
English abstract)
Manzocchi, T., Childs, C., Walsh, J.J., 2010: Faults and fault properties in hydrocarbon flow
models. Geofluids,10, 94–113.
Maros, Gy., Pásztor, Sz., 2001: New and oriented core evaluation method: ImaGeo. European
Geologist, 12, 40–43.
Martin, C.,D.,1993: The strength of massive Lac du Bonnet granite around underground opening.
PhD thesis, 278.
Matonti, C., Lamarche, J., Guglielmi, Y., Marié, L., 2012: Structural and petrophysical
characterization of mixed conduit/seal fault zones in carbonates: Example from the Castellas fault
(SE France). Journal of Structural Geology, 39, 103-121.
Mátyás, J., 1994: Diagenesis and porosity evolution of Neogene reservoir sandstones in the
Pannonian Basin (southeast Hungary). PhD thesis , University of Bern, 196.
Moeller-Pedersen, P., Koestler, A.G.. (eds), 1997: Hydrocarbon Seals Importance for Exploration
and Production. Norwegian Petroleum Society, Special Publications, 7.
Page 139
138
Mort, K., Woodcock, N.H., 2008: Quantifying fault breccia geometry: Dent Fault, NW England.
Journal of Structural Geology, 30, 701-709.
Murray, A., Montgomery, D.W., 2012: Characterisation of highly fractured basement, Say’un
Masila Basin, Yemen. In: Spence, G.H., Redfern, J., Aguilera, R., Bevan, T.G.., Cosgrove, J.W.,
Couples, G.D., Daniel, J.M. (eds): Advances in the Study of Fractured Reservoirs. Geological
Society, London, Special Publications, 374.
Nelson, R.A., 2001: Geologic Analysis of Naturally Fractured Reservoirs. Gulf Publishing
Company Book Division.
P’an, C.H., 1982: Petroleum in basement rocks. AAPG Bulletin, 66, 1597-1643.
Pap, S., 1990: Thrust-faulted sequences in Transtisia. Special Publications of the Hungarian
Geological Survey; Budapest. (In Hungarian with English abstract)
Passchier, C.W., Trouw, R.A.J., 2005: Microtectonics, Springer.
Petford, N., McCaffrey, K.J.W., 2003: Hydrocarbons in Crystalline Rocks. Geological Society,
London, Special Publication, 214.
Posgay, K., Bodoky, T., Hegedűs, E., Kovácsvölgyi, S., Lenkey, L., Szafián, P., Takács, E., Timár,
Z., Varga, G.., 1995: Asthenospheric structure beneath a Neogene basin in southeast Hungary. In:
Cloetingh, S., D'Argenio, B., Catalano, R., Horváth, F., Sassi, W. (eds): Interplay of extension and
compression in basin formation. Tectonophysics, 252, 467-484.
Page 140
139
Salah, M.G., Alsharhan, A.S., 1996: Structural influence on hydrocarbon entrapment in the
northwestern Red Sea, Egypt. AAPG Bulletin, 80, 1, 101-118.
Sammis, C.G., Osborne, R.H., Anderson, J.L., Banerdt, M., White, P., 1986: Self-similar cataclasis
in the formation of fault gouge. Pure and Applied Geophysics, 124, 54-77.
Sammis, C.G.., King, G.., Biegel, R., 1987: The kinematics of gouge deformation. Pure and Applied
Geophysics, 125, 777– 812.
Schubert, F., 2003: Reconstruction of hydrocarbon-bearing fluid migration in the Szeghalom Dome
(SE Hungary). PhD thesis, University of Szeged, 158. (in Hungarian)
Schubert, F., Diamond, L.W., M. Tóth, T., 2007: Fluid-inclusion evidence of petroleum migration
through a buried metamorphic dome in the Pannonian Basin, Hungary. Chemical Geology , 244,
357–381.
Sibson, R.H., 1977: Fault rocks and fault mechanisms. Journal of the Geological Society, 133, 191-
213.
Sibson, R.H., 1986: Brecciation processes in fault zones: inferences from earthquake rupturing.
Pure and Applied Geophysics, 124, 159–174.
Storti, F., Billi, A., Salvini, F., 2003: Particle size distributions in natural carbonate fault rocks:
insights for non-self similar cataclasis. Earth and Planetary Science Letters, 206, 173–186.
Storti, F., Balsamo, F., Salvini, F., 2007: Particle shape evolution in natural carbonate granular wear
Page 141
140
material. Terra Nova, 19, 344-352.
Storti, F., Balsamo, F., 2010: Impact of ephemeral cataclastic fabrics on laser diffraction particle
size distribution analysis in loose carbonate fault breccia. Journal of Structural Geology, 32, 507–
522.
Stünitz, H., Keulen, N., Hirose, T., Heilbronner, R., 2010: Grain size distribution and
microstructures of experimentally sheared granitoid gouge at coseismic slip rates – Criteria to
distinguish seismic and aseismic faults? Journal of Structural Geology, 32, 59-69.
Szederkényi, T., Árkai, P., Lelkes-Felvári, Gy., 1991: Crystalline groundfloor of the Great
Hungarian Plain and South Transdanubia. In: Karamata, S. (ed.): Geodynamic evolution of the
Pannonian Basin, Beograd, 261-273.
Szili-Gyémánt, P., 1986: Metamorphic formations in Tiszántúl: The Körös-Berettyó and the
Álmosd Units. Acta Geologica Hungarica, 29, 305-316.
Tari, G.., Horváth, F., Rumpler, J., 1992: Styles of extension in the Pannonian Basin:
Tectonophysics, 208, 203-219.
Tari, G.., Dövényi, P., Dunkl, I., Horváth, F., Lenkey, L., Stefanescu, M., Szafián, P., Tóth, T., 1999:
Lithospheric structure of the Pannonian basin derived from seismic, gravity and geothermal data.
In: Durand, B., Jolivet, L., Horváth, F., Séranne, M. (eds.): The Mediterranean Basins: Tertiary
Extension within the Alpine Orogen. Geological Society, London, Special Publications, 156, 215-
250.
Page 142
141
Tanaka, H., 1992: Cataclastic lineations. Journal of Structural Geology, 14, 1239–1252.
Teleki, P.G., Mattick, R.E., Kókai, J. (eds.), 1994: Basin Analysis in Petroleum Exploration. A Case
Study from the Békés Basin, Hungary. Kluwer Academic Publishers.
Turcotte, D.L., 1986: Fractals and fragmentation. Journal of Geophysical Research, 91, 1921– 1926.
Vass, I., M. Tóth, T., Szanyi, J., Kovács, B., 2009: Water and heat flow through uplifted
metamorphic highs in the basement of the Pannonian Basin, In: M. Tóth, T. (ed.): Igneous and
metamorphic rocks of the Tisza Unit. Szeged, Geolitera press, 325-339 p. (In Hungarian with
English abstract)
Wibberley, C.A.J., Shimamoto, T., 2003: Internal structure and permeability of major strike-slip
fault zones: the Median Tectonic Line in Mie Prefecture, Southwest Japan. Journal of Structural
Geology, 25, 59– 78.
Wintsch, R.P., Christoffersen, R., Kronenberg A.K., 1995: Fluid-rock reaction weakening of fault
zones. Journal of Geophysical Research, 100, B7, 13021–13032.
Woodcock, N.H., Dickson, J.A.D., Tarasewicz, J.P.T. 2007: Transient permeability and reseal
hardening in fault zones: evidence from dilation breccia textures. In: Lonergan, L., Jolly, R.J.H.,
Rawnsley, K., Sanderson, D.J. (eds): Fractured Reservoirs. Geological Society, London, Special
Publications, 270, 43-53.
Woodcock, N.H., Mort, K., 2008: Classification of fault breccias and related fault rocks. Geological
Magazine, 145, 435-440.
Page 143
142
Zachar J., M. Tóth, T., 2004: Petrology of the metamorphic basement of the Tisza Block at the
Jánoshalma High, S Hungary. Acta Geologica Hungarica, 47, 4, 349-371.
Zhang, S., Tullis, T., Scruggs, V., 2001: Implication of permeability and its anisotropy in a mica
gouge for pore pressure in fault zones. Tectonophysics, 335, 37-50.


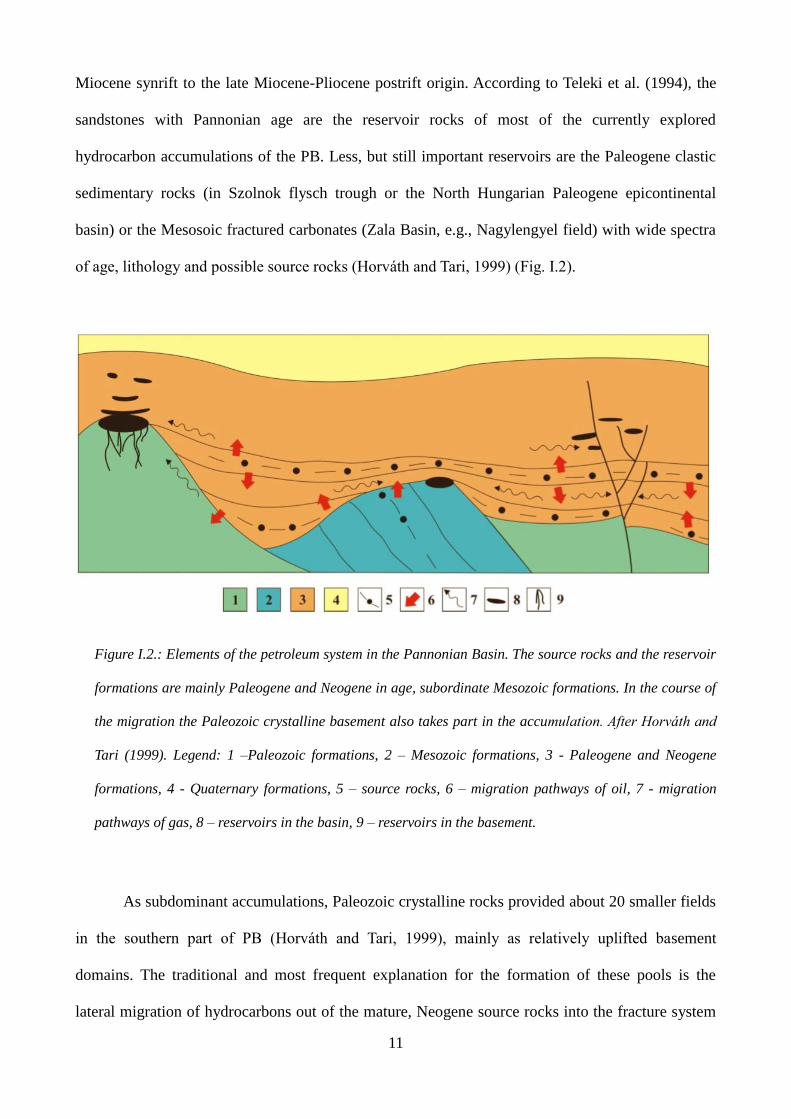


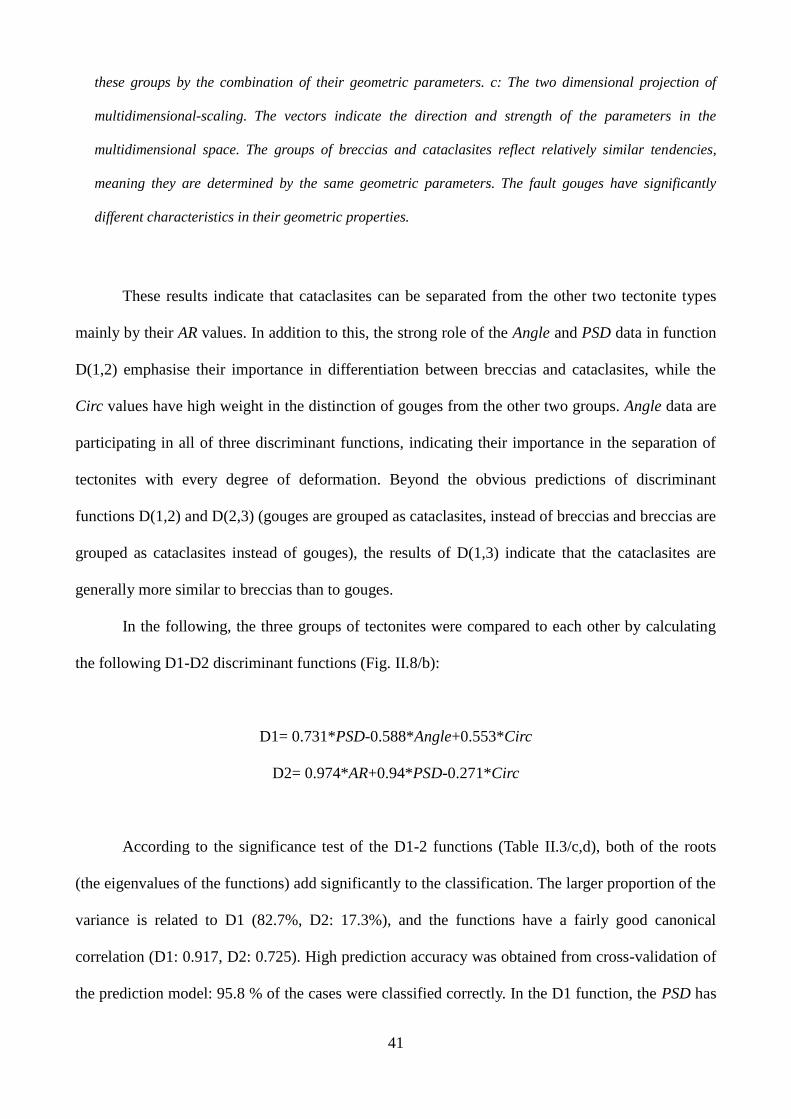


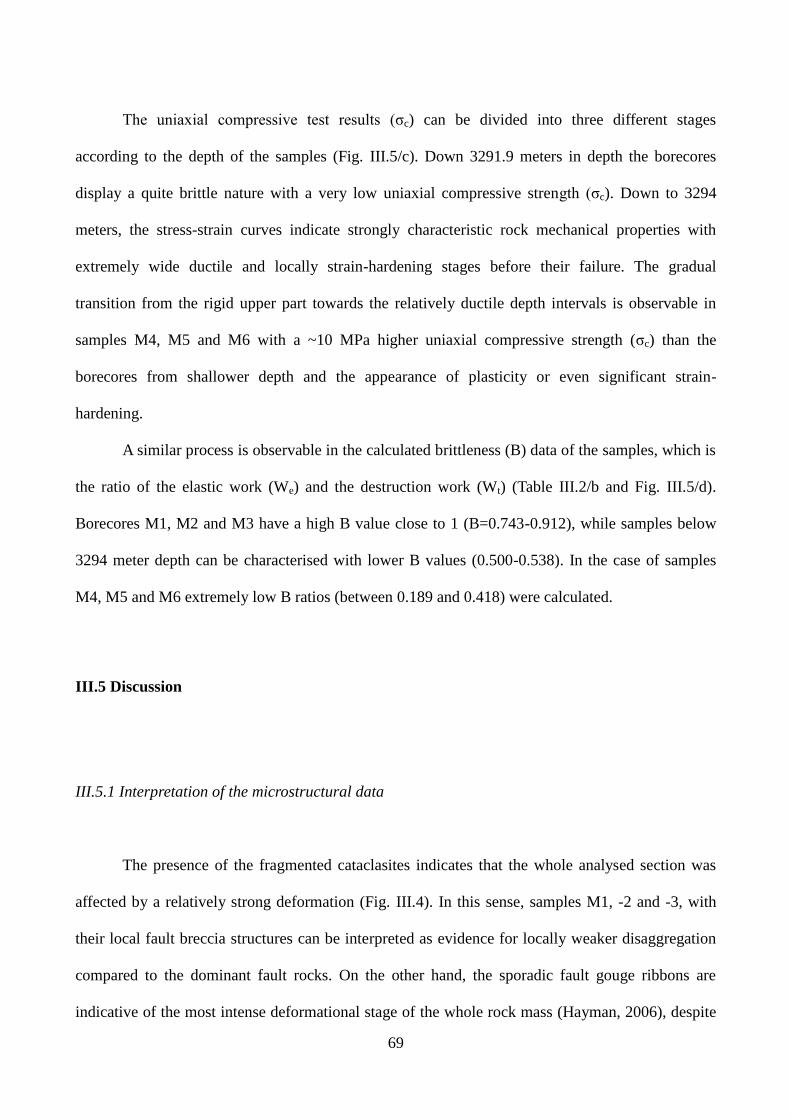


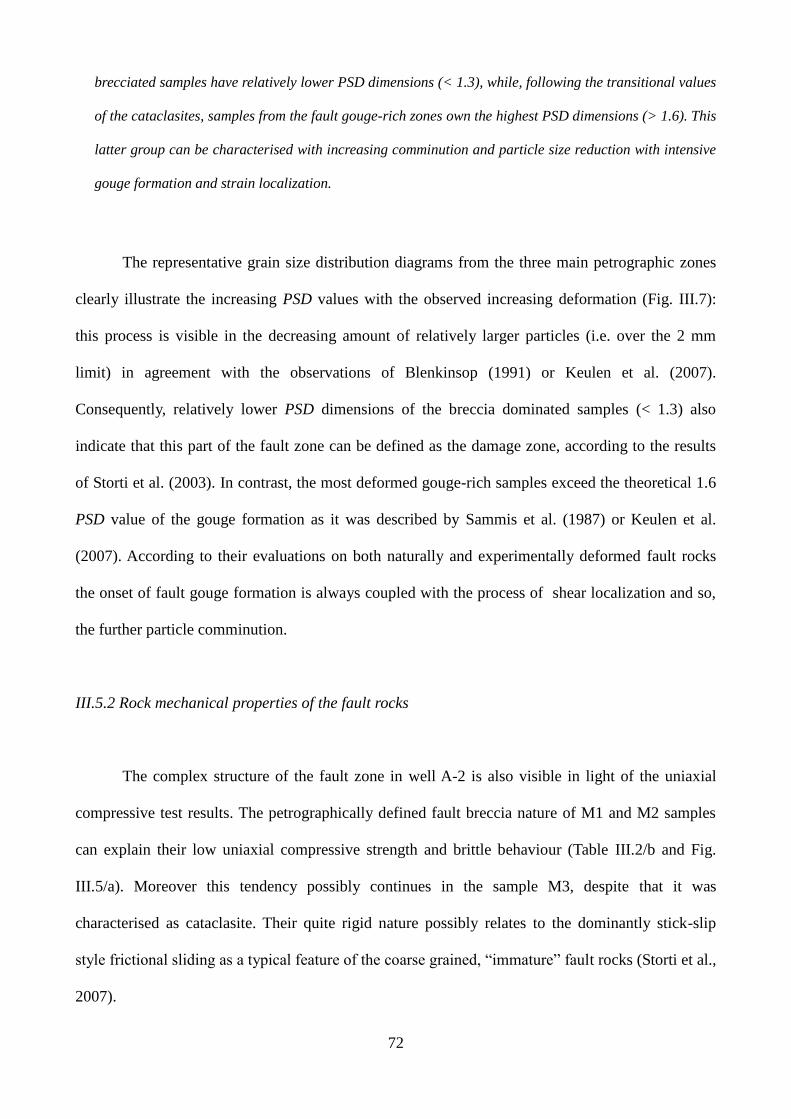
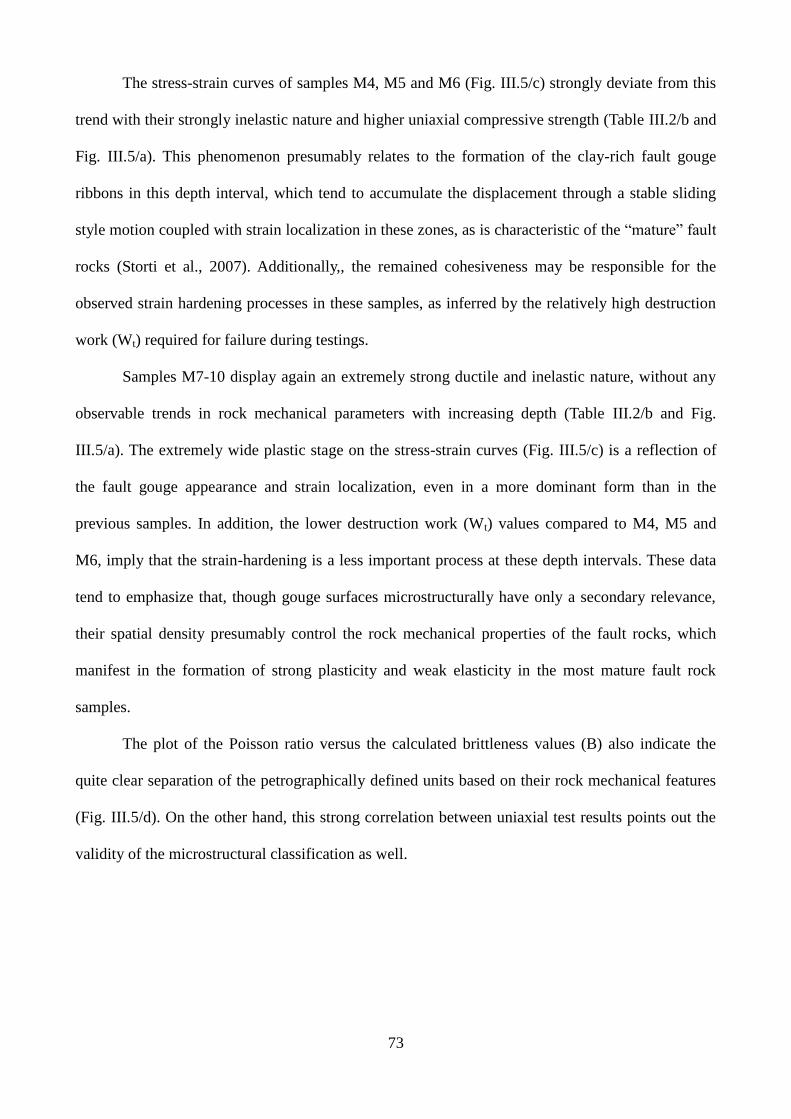
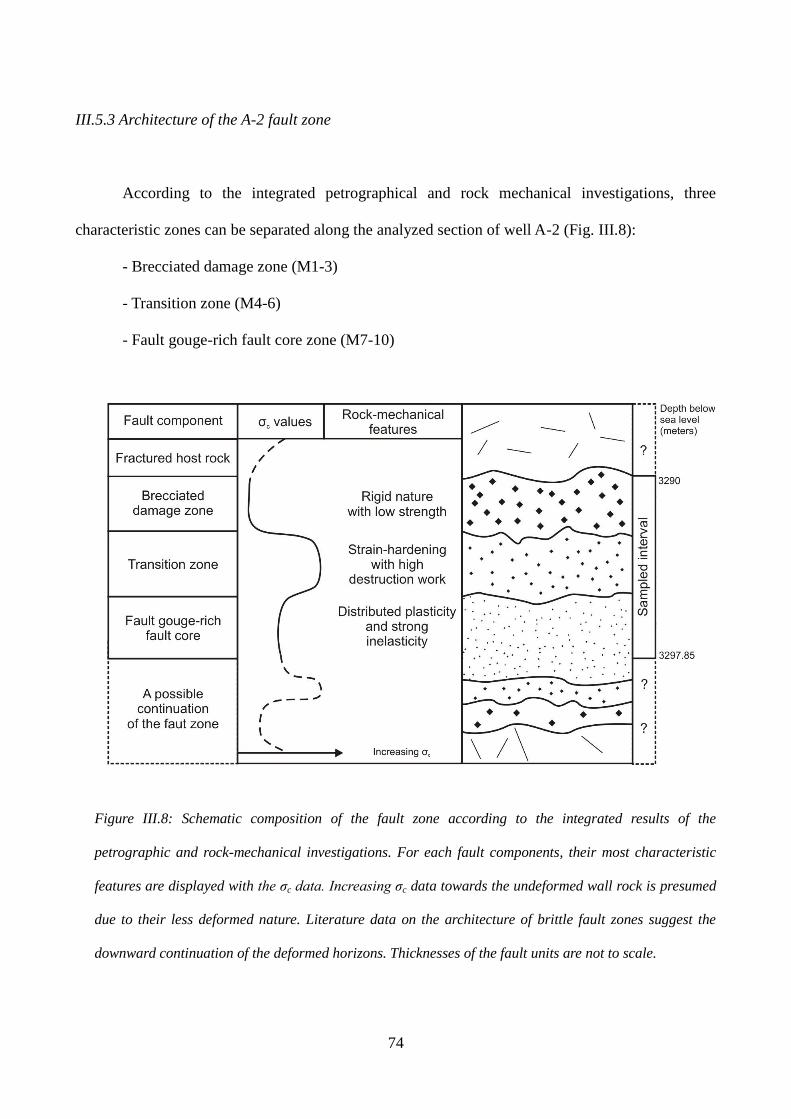


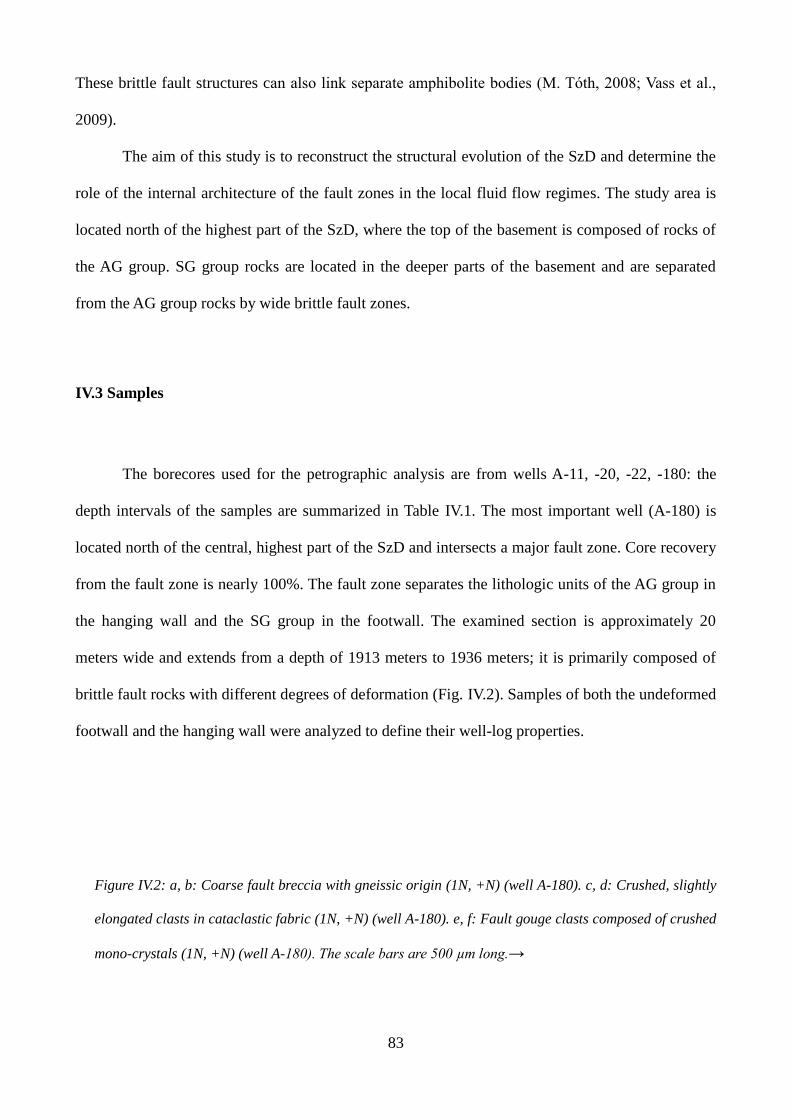


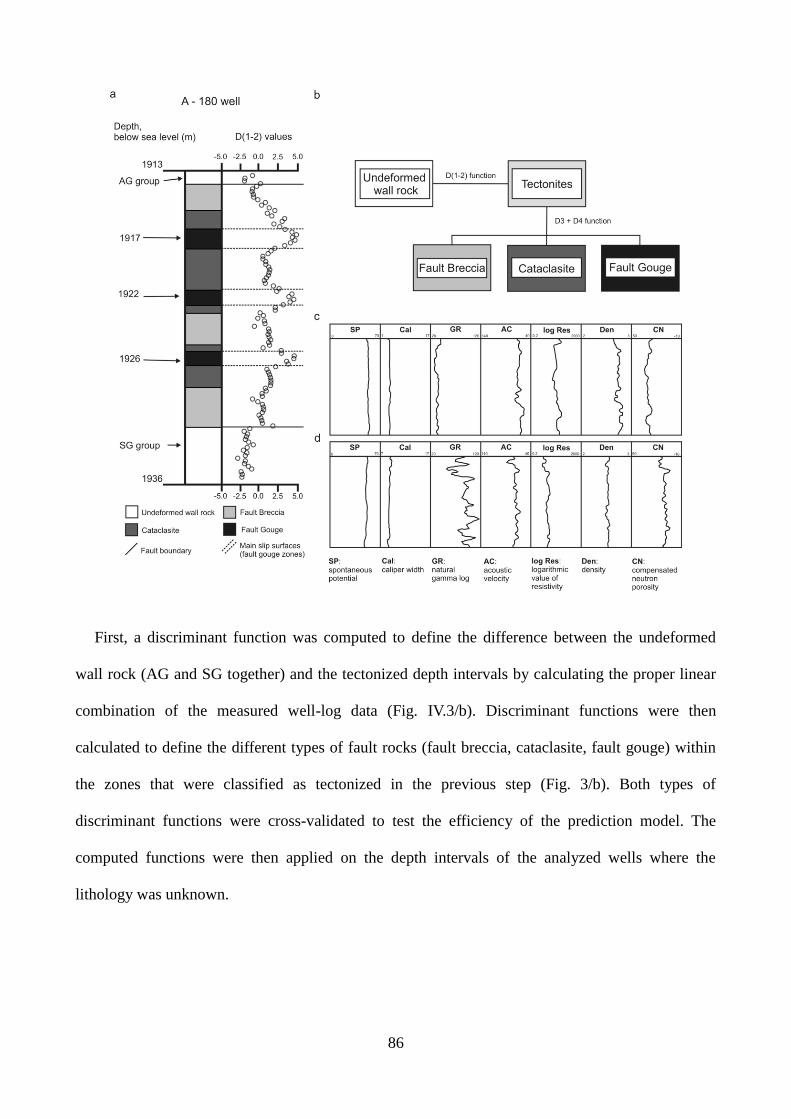


![MedicAlert - OMG...unlike the traditional tightly coupled technology architectures [MED] that are more brittle. " Business “Relevance”! “SOA is IT finally expressed to a level](https://static.documents.pub/doc/80x56/607af3d11e34e537b834b5c2/medicalert-omg-unlike-the-traditional-tightly-coupled-technology-architectures.jpg)


