32
Architectures to make Simple Visualisations Simple Systems Alan Dix Lancaster University and aQtive Russell Beale Birmingham University and aQtive Andy Wood aQtive
| Date post: | 27-Dec-2015 |
| Category: |
Documents |
| Upload: | tracy-morris-bradley |
| View: | 216 times |
| Download: | 0 times |

Architectures to makeSimple Visualisations
Simple Systems
Alan DixLancaster University and aQtive
Russell BealeBirmingham University and aQtive
Andy WoodaQtive

outline
simple visualisation and dancing histograms
onCue and appropriate intelligence
pieTrees
deeper inside onCue - Qbits
ree

dancinghistograms

simple visualisation
• AVI98 paper (Geoff Ellis & Alan Dix)
• key concept– familiar paper representations
(can be domain specific)
– add interactivity– surprisingly powerful

stacked histograms

dancing histogram

doing it
• applet version– histogram 1 day– axes - another day!!!
– load/save data– different file formats– etc. etc.
• full application ?

onCue
onCue
• context sensitive
• link to resources– on the web– on the desktop– on the intranet
• component based framework
• easily extensible
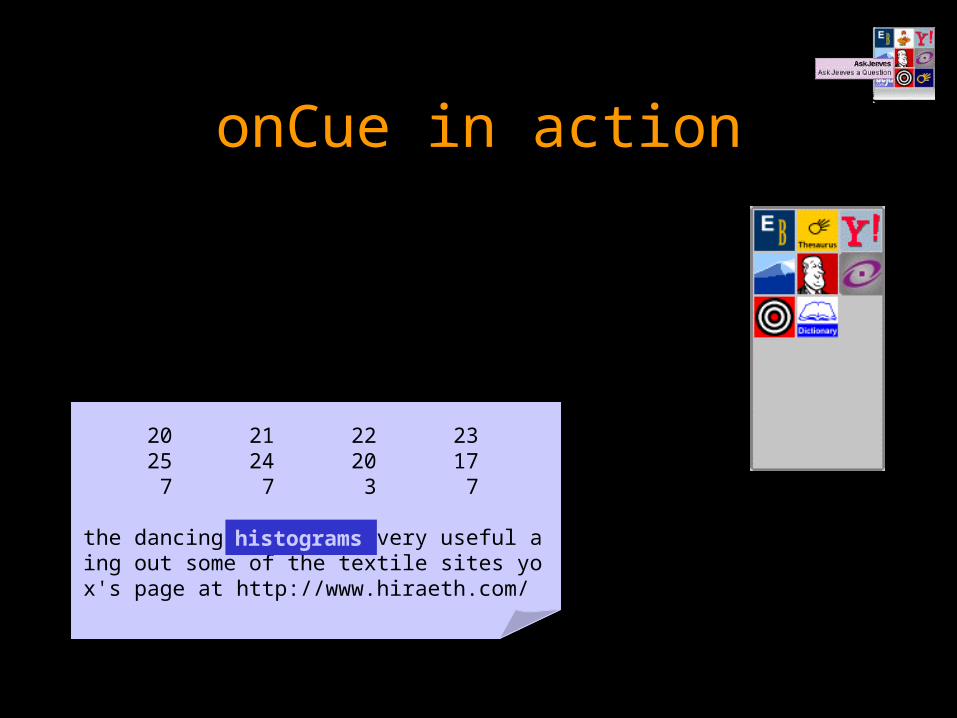
20 21 22 23 25 24 20 17 7 7 3 7
the dancing histograms very useful aing out some of the textile sites yox's page at http://www.hiraeth.com/
onCue in action
histograms
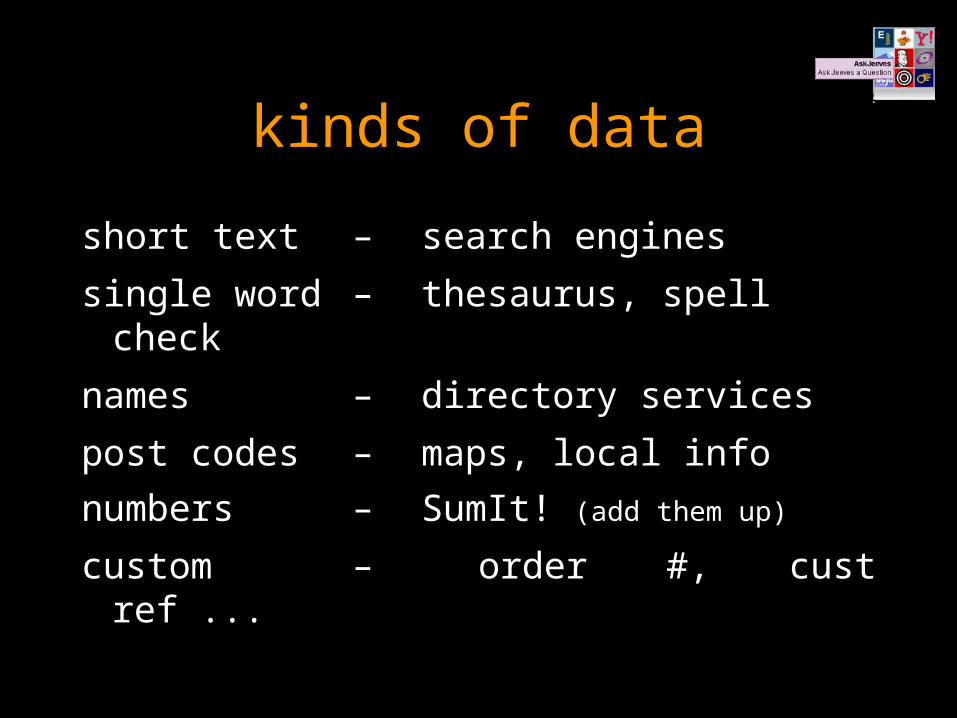
kinds of data
short text – search engines
single word – thesaurus, spell check
names – directory services
post codes – maps, local info
numbers – SumIt! (add them up)
custom – order #, cust ref ...

appropriate intelligence
(a) be useful when it is right
(b) be right often enough to be useful
(c) not cause problems when it is wrong

how it works

how it works

how it works

how it works

dancing histograms in onCue
• table recogniser (½ day initially)
• turn applet into onCue service (½ day)
usable Qbit in onCue
• later– improved recogniser (another day)
– MS Excel service using same recogniser

pieTree
reeree
ree

pieTree
• simple data – pie chart
• hierarchical data – exploding pie(info at leaves)
• info on nodes too ???• file space usage• web site log files
ree

web stats
• corporate/ 4000 [9000]– info.html 3000– press.html 2000
• community/ 3000 [8000]– user.html 2000– research.html 1000– developer.html 2000
• product/ 2000 [8000]– onCue/ 2000 [4000]
• online.html 1000• download.html 1000
– vfridge/ 1000
– support/ 1000
ree

top level - pie chart
• corporate/ 4000 [9000]• community/ 3000 [8000]• product/ 2000 [8000]
community
product
corporate
ree

drilling
• corporate/ 4000 [9000]• community/ 3000 [8000]• product/ 2000 [8000]
– onCue/ 2000 [4000]
– vfridge/ 1000
– support/ 1000
corporatecommunity
products
ree

deeper
• corporate/ 4000 [9000]• community/ 3000 [8000]• product/ 2000 [8000]
– onCue/ 2000 [4000]• online.html 1000• download.html 1000
– vfridge/ 1000
– support/ 1000
ree

root hits
• / 3000 [28000]
– corporate/ 4000 [9000]– community/ 3000 [8000]– product/ 2000 [8000]
ree
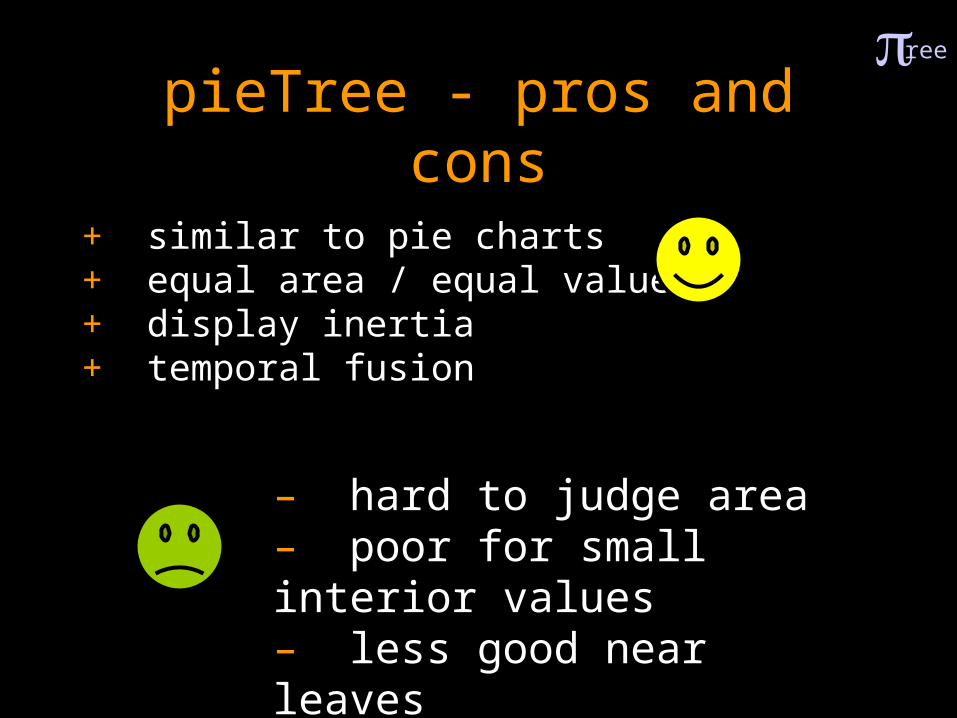
pieTree - pros and cons
+ similar to pie charts + equal area / equal value+ display inertia+ temporal fusion
– hard to judge area– poor for small interior values– less good near leaves
ree

recogniser heuristics
first element in each line a number (like du)
last number in each line a number (like web log)
some items prefixes of others(e.g. "/exercises" and "/exercises/images")
some lines indented more than others
• numbers for higher levels > lower levels
ree

deep inside
what happens inside
• aQtiveSpace– component framework
• Qbits– bit like beans, but different
• mixed initiative
• external and dynamic configuration

Qbit nodes
data flow initiative

advantages
• external linkage– neither Qbit needs to know about the other
• mixed initiative styles– data-driven - using set/listen– demand driven - using get/give

underlying theory
• status-event analysis
• scope – includes human and computer
• power– equal footing for status and event
phenomena
• implementation– understand status representation

more
• visualisationhttp://www.hiraeth.com/alan/topics/vis
• onCuehttp://www.aQtive.com
ree


