27
ARCHROCK PARTNERS MLPA INVESTOR CONFERENCE June 1, 2017

ARCHROCK PARTNERS
MLPA INVESTOR CONFERENCE
June 1, 2017

Forward Looking Statements
2
All statements in this presentation (and oral statements made regarding the subjects of this presentation) other than historical facts are forward-looking statements
within the meaning of the Private Securities Litigation Reform Act of 1995. These forward-looking statements rely on a number of assumptions concerning future
events and are subject to a number of uncertainties and factors that could cause actual results to differ materially from such statements, many of which are outside
the control of Archrock Partners, L.P. (“Archrock Partners” or “APLP”) and Archrock, Inc. (“Archrock” or “AROC”). Forward-looking information includes, but is not
limited to: the industry fundamentals, including the attractiveness of returns and valuation, stability of cash flows, demand dynamics and overall outlook, and
Archrock Partners’ ability to realize the benefits thereof; Archrock Partners’ expectations regarding future economic and market conditions and trends; Archrock
Partners’ operational and financial strategies, including growth activities, Archrock Partners’ ability to successfully effect those strategies and the expected results
therefrom; Archrock Partners’ financial and operational outlook and ability to fulfill that outlook; demand and growth opportunities for Archrock Partners’ services;
statements related to performance, profitability, structural and process improvement initiatives, the expected timing thereof, Archrock Partners’ ability to successfully
effect those initiatives and the expected results therefrom; the operational and financial synergies provided by Archrock’s and Archrock Partners’ size; and
statements about Archrock Partners’ distributions, the anticipated impact of the distribution rate on its business and the anticipated impact of Archrock Partners’
actions on its balance sheet, liquidity position and need for future capital.
While Archrock Partners and Archrock believe that the assumptions concerning future events are reasonable, they caution that there are inherent difficulties in
predicting certain important factors that could impact the future performance or results of their businesses. The factors that could cause results to differ materially
from those indicated by such forward-looking statements include, but are not limited to: actions by governmental and regulatory authorities; local, regional and
national economic and financial market conditions and the impact they may have on Archrock Partners and its customers; changes in tax laws that impact master
limited partnerships; conditions in the oil and gas industry, including a sustained decrease in the level of supply or demand for oil or natural gas or a sustained
decrease in the price of oil or natural gas; changes in economic conditions in key operating markets; the financial condition of Archrock Partners’ customers; the
failure of any customer to perform its contractual obligations; tax changes in safety, health, environmental, tax and other regulations.
These forward-looking statements are also affected by the risk factors, forward-looking statements and challenges and uncertainties described in Archrock
Partners’ Annual Report on Form 10-K for the year ended December 31, 2016, Archrock’s Annual Report on Form 10-K for the year ended December 31, 2016,
and those set forth from time to time in Archrock Partners’ and Archrock’s filings with the Securities and Exchange Commission, which are currently available at
www.archrock.com. Except as required by law, Archrock Partners and Archrock expressly disclaim any intention or obligation to revise or update any forward-
looking statements whether as a result of new information, future events or otherwise.
© 2017 Archrock Partners, L.P. All rights reserved.

Key Archrock Partners
Investment Highlights
1 Data from Bentek and EIA.2 As of March 31, 2017. 3 As of March 31, 2017, Archrock Inc. had undrawn capacity of $276.0 million under its revolving credit facility (including the pro forma effect of the $25.0 million received from a subsidiary of Exterran
Corporation (“Exterran”) on April 11, 2017, an amount equal to the Contingent Financing Payment (as defined in the separation agreement) with Exterran as a result of Exterran’s successful Qualified Capital
Raise (as defined in the separation agreement)). The Archrock Inc. credit agreement limits the Total Debt (as defined in the credit agreement) to EBITDA ratio (as defined in the credit agreement) to not greater
than 4.25 to 1.00. As a result of this limitation, $108.7 million of the $276.0 million of undrawn capacity under Archrock’s revolving credit facility was unavailable to Archrock for additional borrowings as of March
31, 2017. 4 As of March 31, 2017, Archrock Partners had undrawn capacity of $437.0 million under its revolving credit facility. The Archrock Partners credit agreement limits the Total Debt (as defined in the credit
agreement) to EBITDA ratio (as defined in the credit agreement) to not greater than 5.95 to 1.0; and the Senior Secured Debt (as defined in the credit agreement) to EBITDA ratio (as defined in the credit
agreement) to not greater than 3.50 to 1.00. As a result of this limitation, $143.8 million of the $437.0 million of undrawn capacity under our revolving credit facility was unavailable for additional borrowings as of
March 31, 2017. 5 As defined in the Archrock Partners credit agreement.
3
Visible
Long-Term
Growth
• U.S. natural gas demand is forecasted to increase to ~89 bcf/d by 2021 from ~75 bcf/d in 2016; an
approximate 19% increase1
• Business tied to long-term natural gas production
Relative Cash
Flow Stability
• Fee-based contracts for “must-run” production and midstream infrastructure assets
• Production, not drilling and completions, leveraged business model generates steady demand for services
and relatively stable cash flow
• Cash flow generation provides capital to fund investments in an upcycle and stability in a down-cycle
Largest Player
with Benefit of
Scale and
Market
Presence
• Largest fleet among outsourced compression services providers
• Fleet is deployed across all major U.S. producing basins
• Combined operating fleet of 3.1 mm HP2 with Archrock
Access to
Capital
• Free cash flow positive with liquidity of $167 million at AROC3 and $293 million at APLP4
• Total leverage covenant of 5.95x Debt to EBITDA5 through 2017
© 2017 Archrock Partners, L.P. All rights reserved.

• Long-term capital structure with attractive cost of debt
• $700 million of outstanding 6% Senior Notes at
Archrock Partners
• $1.1 billion credit facility at Archrock Partners
• $350 million credit facility at Archrock
• All Archrock Partners distributions are paid in cash
• Distributable cash flow coverage of 1.80x at Archrock
Partners for the first quarter of 20171
• Management team with experience managing maintenance
costs through full compressor life cycle
• Well maintained fleet with average age of 13 years
• Fleet diversified across horsepower ranges
• Archrock Partners has invested over $720 million in growth
capital expenditures over the past five years2
• 31% of the consolidated Archrock fleet is less than seven
years old
4
Full Cycle Compression Provider
Well Capitalized Full Cycle Maintenance Costs
Long-term Operating History
© 2017 Archrock Partners, L.P. All rights reserved.
4
1 See Addendum I regarding non-GAAP measures for information on Archrock Partners distributable cash flow & distributable cash flow coverage.2 Five years ended December 31, 2016.
1954South Coast Gas Compression Established
2000IPO of Universal Compression
2007Merger of Universal & Hanover to form Exterran
1997IPO of Hanover Compressor
2015Spin-off of International Services and Global Fabrication businesses
1990’s to 2000’sIndustry consolidation into companies that would become Universal & Hanover
PresentLargest pure-play provider of U.S. natural gas compression services

5
Archrock Partners’ Recent
Highlights
• Closed new five year $1.1 billion asset-based revolving credit facility
• First quarter results
– Highest quarterly level of new orders since the fourth quarter of 2014
– Revenue increase of 1% from the fourth quarter of 2016, driven by full quarter
impact of November 2016 drop-down
– Distributable cash flow coverage of 1.80x1
– Covenant Debt/EBITDA of 4.9x compared to 5.95x covenant
© 2017 Archrock Partners, L.P. All rights reserved.
First Quarter 2017
1 See Addendum I regarding non-GAAP measures for information on Archrock Partners distributable cash flow & distributable cash flow coverage.

• Operating HP ~2.8mm3
• Distributable Cash Flow Coverage of
1.80x for the quarter ended March 31,
20174
• GP and IDRs of APLP (2%)1
• 29 mm LP Units1
• Operating HP ~0.3mm3
• U.S. Aftermarket Services Business
Overview of Archrock Partners
Archrock Companies Structure and Asset Overview
AROC Assets
APLP Assets
(AROC)
$64 million Debt 2
(APLP)
~$1.3 billion Debt 3
GP 43% LP1
2% GP1
100% IDR
100%
Public
Unitholders
55%1
Public
Stockholders
Archrock Partners is a pure play U.S. provider of contract compression
6
1 Based on APLP units outstanding as of March 31, 2017. 2 As of March 31, 2017; Archrock deconsolidated debt presented pro forma for $25.0 million received from a subsidiary of Exterran on April 11, 2017, an amount equal to the Contingent Financing Payment
(as defined in the separation agreement with Exterran) as a result of Exterran’s successful Qualified Capital Raise (as defined in the separation agreement).3 As of March 31, 2017. 4 See Addendum I regarding non-GAAP measures for information on Archrock Partners distributable cash flow and distributable cash flow coverage.
© 2017 Archrock Partners, L.P. All rights reserved.

What Does Compression Do?
7
Suction
Pressure1
Inlet Sources
Discharge
Pressure1
Outlet Sources
Increases pressure from suction to discharge
• Wellhead
• GatheringSystem
50 PSI
• Gathering
System
• Pipeline
• Processing Plant
• Storage Facility
• Reservoir
1,200 PSI
1 Pressures based on an illustrative example from the Eagle Ford shale.
© 2017 Archrock Partners, L.P. All rights reserved.

Where is Compression Used?
8
ProcessingWellhead
Production
Power
Generation
Storage
Industrial
Residential
Exports - Pipelines
Gathering
System
LNG
Chemical
Feed-Stocks and
Fuels
Natu
ral G
as
Cru
de
Oil
Gas Lift
79% of Fleet1
21% of Fleet1 Enhanced Oil
Recovery
1 Based on operating horsepower of Archrock and Archrock Partners combined U.S. compression fleet as of March 31, 2017.
© 2017 Archrock Partners, L.P. All rights reserved.
Compression is an essential service utilized all along the production cycle to transport gas to the end user

Compression Applications &
Customers
Services Provided
Average
HP / Unit1,2 Units2 Overview
Customer
Types
Archrock
Focus
Wellhead 359 1,305
• Compression located at the well site
• Often smaller units that are compressing a single
well
• Upstream
E&P
Gathering 911 1,911
• Transports gas from multiple wells to a compressor
or compressor station
• Often larger units compared to wellhead
• Upstream
E&P
• Midstream
G&P
Gas Lift 328 2,001
• Use of gas to artificially lift oil or fluids from a well
• Unit size can vary based on the volume and
number of wells being lifted
• Upstream
E&P
Other 622 344• Includes plant compression, flash gas, residue plant
compression, CO2 injection and storage• Various
• More limited
opportunities
9
1 Horsepower reported as original equipment manufacturer (OEM) horsepower and unit data as of March 31, 2017.2 Data represents Archrock and Archrock Partners combined U.S. compression fleet as of March 31, 2017.
© 2017 Archrock Partners, L.P. All rights reserved.

Operating HP
at
Leader in U.S. Contract
Compression Services
U.S. Outsourced Compression Competitors1 Archrock Partners Highlights
1 SEC filings and management estimates: as of March 31, 2017.
• Archrock Partners is the
largest contract compression
provider in the U.S. with
approximately 2.8 million
operating horsepower1
• Archrock’s business size and
scale provide significant
operational and financial
synergies
• We are proud of the quality of
our service, delivering an
average runtime of over 99%
Operating HP
at
10
© 2017 Archrock Partners, L.P. All rights reserved.
Archrock Partners is the largest outsourced compression provider in the U.S.
2,826
253
3,079
1,428 1,400
853
510425
181100
0
600
1,200
1,800
2,400
3,000
3,600
Archrock USA
Compression
Energy
Transfer/
CDM
CSI
Compressco
J-W
Operating
Axip Natural Gas
Services
Natural Gas
Compression
Systems
Other
Op
era
tin
g H
P (
000
s)
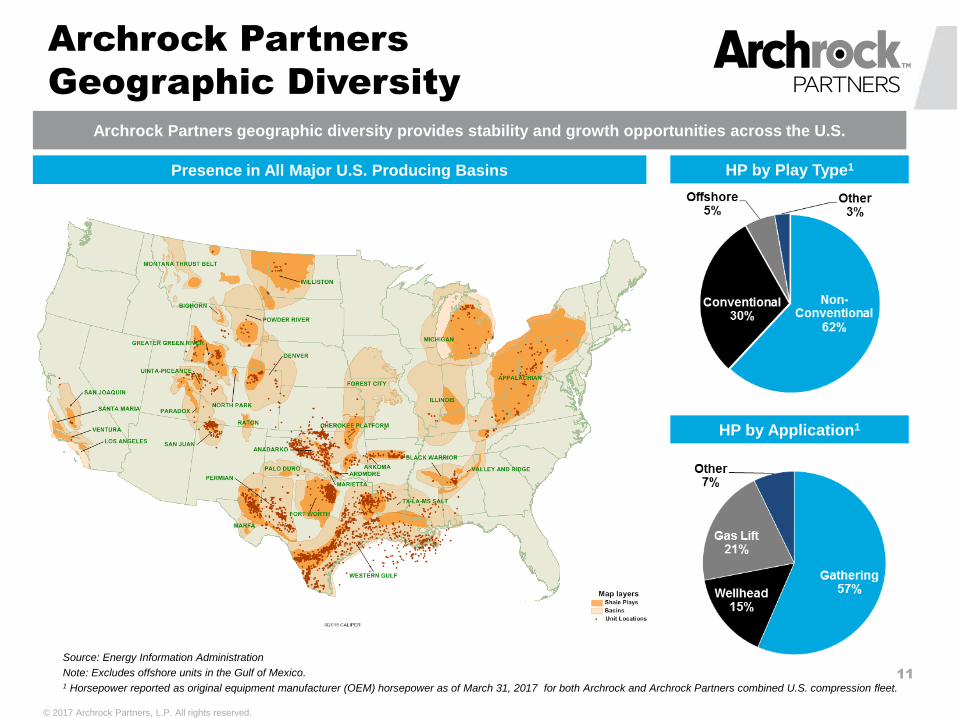
Archrock Partners
Geographic Diversity
Presence in All Major U.S. Producing Basins HP by Play Type1
Source: Energy Information Administration
Note: Excludes offshore units in the Gulf of Mexico.1 Horsepower reported as original equipment manufacturer (OEM) horsepower as of March 31, 2017 for both Archrock and Archrock Partners combined U.S. compression fleet.
HP by Application1
11
© 2017 Archrock Partners, L.P. All rights reserved.
Archrock Partners geographic diversity provides stability and growth opportunities across the U.S.

Stability of Business Model
Note: Historical data should not be relied upon as being indicative of future results.
1 Henry Hub indexed to $5.63 per million BTU at December 31, 2008; WTI indexed to $44.60 per barrel at December 31, 2008. Prices presented through May 1, 2017.
2 Data represents combined Archrock and Archrock Partners U.S. compression services revenue for the periods presented.
3 In December 2013, Archrock abandoned its contract water treatment business. All periods exclude results from Archrock’s contract water treatment business.
Fee-based compression services provide relatively stable cash flow
Consolidated Compression Services Revenue and Oil & Gas Prices1,2,3
12
© 2017 Archrock Partners, L.P. All rights reserved.

$10.53$10.75
$10.25 $9.95
$7.61$7.40
$8.10 $7.93
$8.43
$9.00$8.78
$9.75 $9.92
$11.13
$9.67 $9.84 $9.97
$10.57$10.58
$10.94
$10.89$10.85
$10.62
$10.65
$9.44
$0.00
$2.00
$4.00
$6.00
$8.00
$10.00
$12.00
1Q
-11
2Q
-11
3Q
-11
4Q
-11
1Q
-12
2Q
-12
3Q
-12
4Q
-12
1Q
-13
2Q
-13
3Q
-13
4Q
-13
1Q
-14
2Q
-14
3Q
-14
4Q
-14
1Q
-15
2Q
-15
3Q
-15
4Q
-15
1Q
-16
2Q
-16
3Q
-16
4Q
-16
1Q
-17
Contribution from operation of two processing plants Contribution from Sale of Two Processing Plants
Archrock Partners’
Profitability Trend
Note: Historical data should not be relied upon as being indicative of future results.1 See Addendum I regarding non-GAAP measures for information on gross margin and gross margin per horsepower.2 A customer’s exercise of purchase options on two natural gas processing plants increased gross margin per average operating horsepower per month by $0.97 in the second
quarter 2013.
Gross Margin per Horsepower per Month1
Archrock Partners’ gross margin per horsepower benefitted from profit improvement initiatives and fleet
high grading including the MidCon acquisitions
13
© 2017 Archrock Partners, L.P. All rights reserved.
2

Proven Track Record
Note: Historical data should not be relied upon as being indicative of future results.1 See Addendum I regarding non-GAAP measures for information on Archrock Partners EBITDA, as adjusted.
Archrock Partners Operating Horsepower Archrock Partners EBITDA, as adjusted1
Our financial results have benefitted from growth and performance improvement initiatives
14
© 2017 Archrock Partners, L.P. All rights reserved.
669
909
1,050
1,384
1,728
1,991
2,264
3,040 3,030
2,8742,826
0
400
800
1,200
1,600
2,000
2,400
2,800
3,200
(000's
)
$107
$156
$214
$266
$315
$278 $269$ 32
$ 25
$ 25
$ 14
$ 0
$ 50
$ 100
$ 150
$ 200
$ 250
$ 300
$ 350
2011 2012 2013 2014 2015 2016 LTM Q1-17
($ m
illio
ns
)
Cost Caps provided by AROC
EBITDA, as adjusted (without the benefit of cost caps)
$278
$315
$280
$239
$181
$140
$269
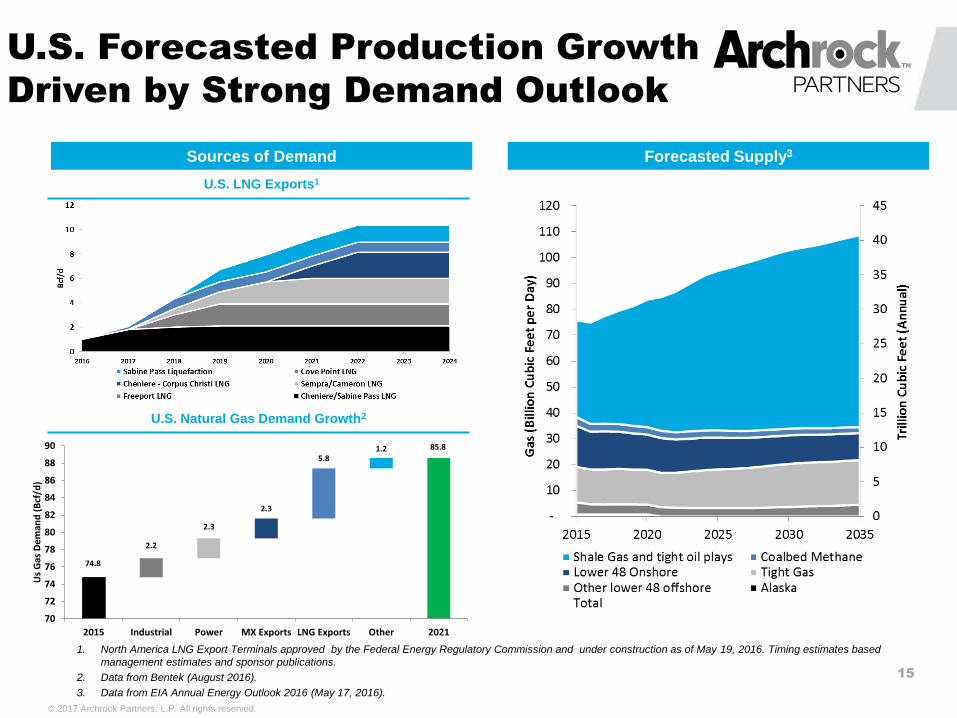
U.S. Forecasted Production Growth
Driven by Strong Demand Outlook
1. North America LNG Export Terminals approved by the Federal Energy Regulatory Commission and under construction as of May 19, 2016. Timing estimates based
management estimates and sponsor publications.
2. Data from Bentek (August 2016).
3. Data from EIA Annual Energy Outlook 2016 (May 17, 2016).
15
Sources of Demand Forecasted Supply3
U.S. LNG Exports1
U.S. Natural Gas Demand Growth2
© 2017 Archrock Partners, L.P. All rights reserved.
85.8
2.2
2.3
2.3
5.81.2
70
72
74
76
78
80
82
84
86
88
90
2015 Industrial Power MX Exports LNG Exports Other 2021
Us
Gas
De
man
d (
Bcf
/d)
74.8

Overview of Growth Strategies
Demonstrated track record of executing growth strategies
Organic Growth
and Operational
Enhancements
Drop Down
Growth
Third Party
Acquisitions
Growth
16
© 2017 Archrock Partners, L.P. All rights reserved.
Demonstrated ability to source and execute
deals with MidCon acquisitions
Opportunity to source from customers and
competitors
Dual currency structure provides cost of capital
and execution advantages
Successfully executed a drop down of contract compression assets in
2015 & 2016
Strategy to leverage our market position, service capability, and existing fleet and capital
strength
Secular growth drivers expected to increase natural gas production and compression
demand
~1.2 million HP of new units added to combined AROC/APLP fleet in last ~5 years1
Continued focus on improving field operations, operating costs, and competitiveness and
profitability of fleet
1 Five years ended December 31, 2016; includes units added through third party acquisitions.

1.17x
2.51x
2.67x
2.50x
2.16x
1.80x
1.22x
1.29x
1.36x
1.22x 1.26x1.31x
1.51x
1.42x
1.24x
1.14x
0.00x
0.50x
1.00x
1.50x
2.00x
2.50x
2011 2012 2013 1Q14 2Q14 3Q14 4Q14 1Q15 2Q15 3Q15 4Q15 1Q16 2Q16 3Q16 4Q16 1Q17
Excluding Cost Caps Including Cost Caps
$5 $6 $9 $15
$21
$1 $2
$70
$85
$104
$122
$134
$71 $75
$74
$92
$113
$137
$154
$76
$0
$20
$40
$60
$80
$100
$120
$140
$160
2011 2012 2013 2014 2015 2016 1Q 2017Annualized
($ i
n m
illi
on
s)
GP Interest LP Interest
$72
Archrock Partners’
Distributions & Coverage
Note: Historical data should not be relied upon as being indicative of future results.1 See Addendum I regarding non-GAAP measures for information on distributable cash flow and distributable cash flow coverage.2 Distribution levels with respect to future quarters have not been declared and will be determined by the board of the managing general partner of APLP.3 Q1-14 pro forma for acquisition of compression assets from MidCon Compression LLC closed April 10, 2014.4 Archrock Partners cash distribution of $0.285 per limited partner unit for the first-quarter of 2016 through the first-quarter of 2017 is approximately 50 percent lower than the fourth-
quarter 2015 distribution.
Distributable Cash Flow Coverage1,2,4
17
© 2017 Archrock Partners, L.P. All rights reserved.
3
Total Distributions Declared 2,4
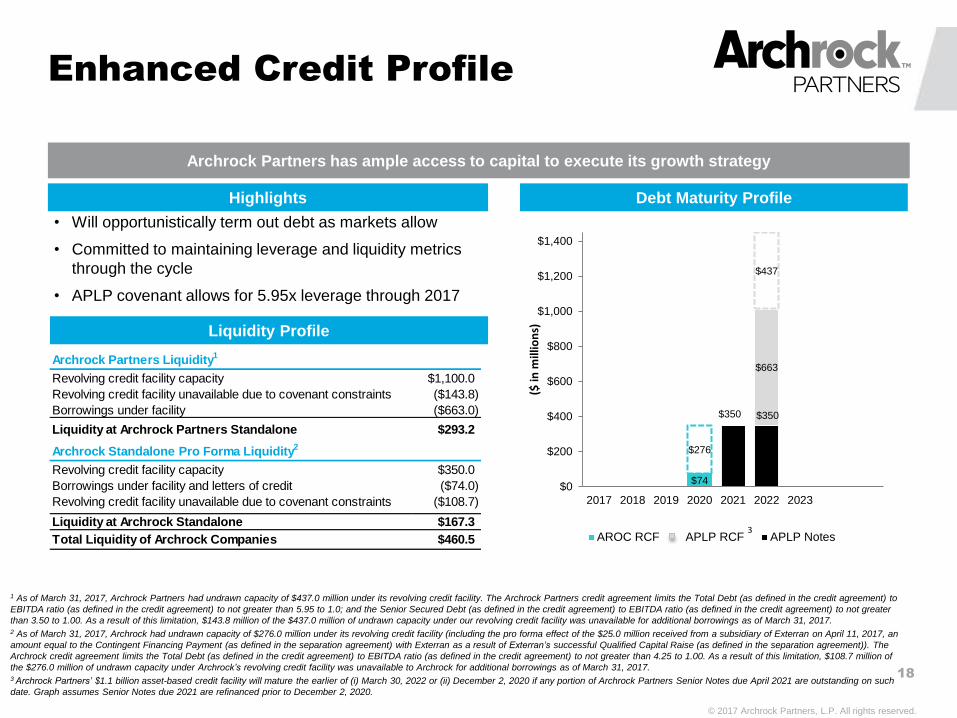
$663
$437
$74
$276
$350 $350
$0
$200
$400
$600
$800
$1,000
$1,200
$1,400
2017 2018 2019 2020 2021 2022 2023
($ in
mill
ion
s)
$0
AROC RCF APLP RCF APLP Notes
Enhanced Credit Profile
Liquidity Profile
Debt Maturity Profile
• Will opportunistically term out debt as markets allow
• Committed to maintaining leverage and liquidity metrics
through the cycle
• APLP covenant allows for 5.95x leverage through 2017
Highlights
18
© 2017 Archrock Partners, L.P. All rights reserved.
3
1 As of March 31, 2017, Archrock Partners had undrawn capacity of $437.0 million under its revolving credit facility. The Archrock Partners credit agreement limits the Total Debt (as defined in the credit agreement) to
EBITDA ratio (as defined in the credit agreement) to not greater than 5.95 to 1.0; and the Senior Secured Debt (as defined in the credit agreement) to EBITDA ratio (as defined in the credit agreement) to not greater
than 3.50 to 1.00. As a result of this limitation, $143.8 million of the $437.0 million of undrawn capacity under our revolving credit facility was unavailable for additional borrowings as of March 31, 2017.2 As of March 31, 2017, Archrock had undrawn capacity of $276.0 million under its revolving credit facility (including the pro forma effect of the $25.0 million received from a subsidiary of Exterran on April 11, 2017, an
amount equal to the Contingent Financing Payment (as defined in the separation agreement) with Exterran as a result of Exterran’s successful Qualified Capital Raise (as defined in the separation agreement)). The
Archrock credit agreement limits the Total Debt (as defined in the credit agreement) to EBITDA ratio (as defined in the credit agreement) to not greater than 4.25 to 1.00. As a result of this limitation, $108.7 million of
the $276.0 million of undrawn capacity under Archrock’s revolving credit facility was unavailable to Archrock for additional borrowings as of March 31, 2017. 3 Archrock Partners’ $1.1 billion asset-based credit facility will mature the earlier of (i) March 30, 2022 or (ii) December 2, 2020 if any portion of Archrock Partners Senior Notes due April 2021 are outstanding on such
date. Graph assumes Senior Notes due 2021 are refinanced prior to December 2, 2020.
Archrock Partners has ample access to capital to execute its growth strategy
Archrock Partners Liquidity1
Revolving credit facility capacity $1,100.0
Revolving credit facility unavailable due to covenant constraints ($143.8)
Borrowings under facility ($663.0)
Liquidity at Archrock Partners Standalone $293.2
Archrock Standalone Pro Forma Liquidity2
Revolving credit facility capacity $350.0
Borrowings under facility and letters of credit ($74.0)
Revolving credit facility unavailable due to covenant constraints ($108.7)
Liquidity at Archrock Standalone $167.3
Total Liquidity of Archrock Companies $460.5

Current Yield
191 Source: Barclays Capital - Energy Infrastructure Weekly May 22, 2017; Price data as of May 22, 2017.
MLP Industry Yields
May 22, 20171
© 2017 Archrock Partners, L.P. All rights reserved.
5.0%
6.2%
7.2%7.7%
0.0%
1.0%
2.0%
3.0%
4.0%
5.0%
6.0%
7.0%
8.0%
9.0%
Natural Gas Pipelinesand Storage
MLP Gathering andProcessing (Fee Based)
APLP Large Cap DiversifiedMLPs

Key Archrock Partners
Investment Highlights
Available
Liquidity
Largest Fleet
Deployed to
Major Basins
Relative
Stability
Optimized
Structure for
Growth
Long-term
Growth
Opportunities
20
© 2017 Archrock Partners, L.P. All rights reserved.
Full Cycle
Outsourced
Provider

Addendum I: Non-GAAP Financial Measures
21
© 2017 Archrock Partners, L.P. All rights reserved.
Non-GAAP Financial Measures
Archrock Partners, L.P. (Exterran Partners, L.P. pre-spin):
EBITDA, as adjusted, a non-GAAP measure, is defined as net income (loss) (a) excluding income taxes, interest expense, depreciation and amortization
expense, impairment charges, restructuring charges, expensed acquisition costs, debt extinguishment costs, other items and non-cash selling, general and
administrative (“SG&A”) costs (b) plus the amounts reimbursed to Archrock Partners by Archrock as a result of caps on cost of sales and SG&A costs provided
in the omnibus agreement to which Archrock and Archrock Partners are parties (the “Omnibus Agreement”), which amounts are treated as capital contributions
from Archrock for accounting purposes. Under the Omnibus Agreement, the caps on cost of sales and SG&A costs terminated effective January 1, 2015.
EBITDA, as adjusted (without the benefit of the cost caps) is defined as EBITDA, as further adjusted, less the amounts reimbursed to Archrock Partners by
Archrock as a result of caps on cost of sales and SG&A costs provided in the Omnibus Agreement.
Distributable cash flow, a non-GAAP measure, is defined as net income (loss) (a) plus depreciation and amortization expense, impairment charges,
restructuring charges, expensed acquisition costs, non-cash SG&A costs, debt extinguishment costs, interest expense and any amounts reimbursed to
Archrock Partners by Archrock as a result of the caps on cost of sales and SG&A costs provided in the Omnibus Agreement, which amounts are treated as
capital contributions from Archrock for accounting purposes, (b) less cash interest expense (excluding amortization of deferred financing fees, amortization of
debt discount and non-cash transactions related to interest rate swaps) and maintenance capital expenditures, and (c) excluding gains or losses on asset sales
and other items. Under the Omnibus Agreement, the caps on cost of sales and SG&A costs terminated effective January 1, 2015.
Distributable cash flow (without the benefit of cost caps) is defined as distributable cash flow less the amounts reimbursed to Archrock Partners by Archrock as
a result of caps on cost of sales and SG&A costs provided in the Omnibus Agreement.
Gross margin, a non-GAAP measure, is defined as total revenue less cost of sales (excluding depreciation and amortization expense). Gross margin
percentage is defined as gross margin divided by revenue.
Addendum I-A
22
© 2017 Archrock Partners, L.P. All rights reserved.

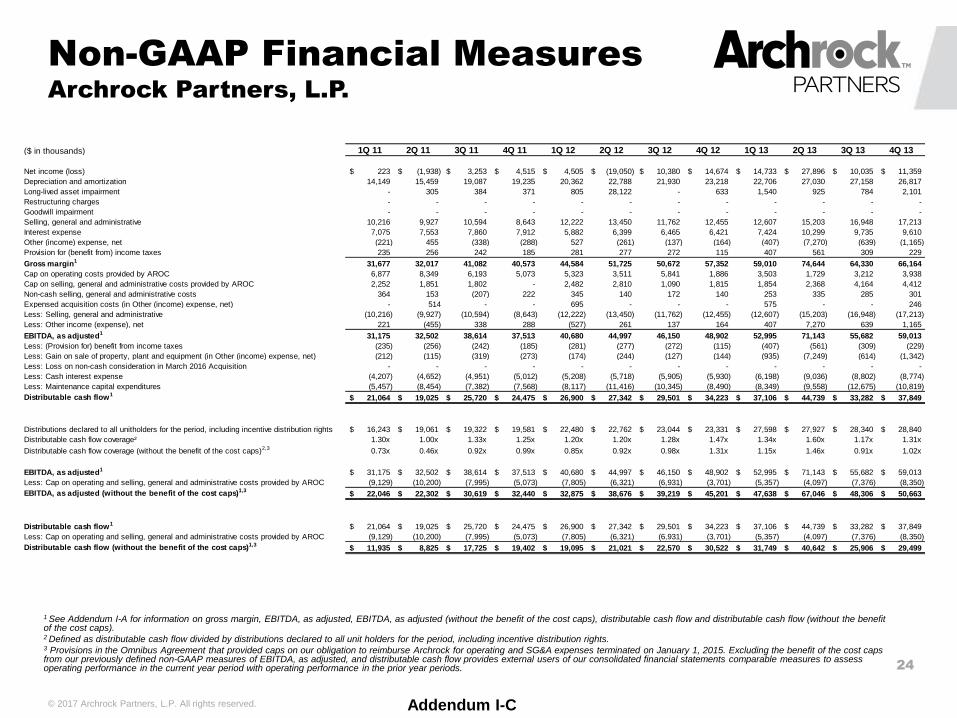
Non-GAAP Financial Measures
Archrock Partners, L.P.
1 See Addendum I-A for information on gross margin, EBITDA, as adjusted, EBITDA, as adjusted (without the benefit of the cost caps), distributable cash flow and distributable cash flow (without the benefit of the cost caps).2 Consists of a cash reimbursement from Archrock of non-cash merger-related expenses incurred by Archrock Partners.3 Defined as distributable cash flow divided by distributions declared to all unit holders for the period, including incentive distributions rights.4 Provisions in the Omnibus Agreement that provided caps on our obligation to reimburse Archrock for operating and SG&A expenses terminated on January 1, 2015. Excluding the benefit of the cost caps from our previously defined non-GAAP measures of EBITDA, as adjusted, and distributable cash flow provides external users of our consolidated financial statements comparable measures to assess operating performance in the current year period with operating performance in the prior year periods.
23
Addendum I-B© 2017 Archrock Partners, L.P. All rights reserved.
($ in thousands) 2007 2008 2009 2010 2011 2012 2013 2014 2015 2016
Net income (loss) 19,401$ 29,847$ 14,784$ (23,333)$ 6,053$ 10,509$ 64,023$ 61,719$ (84,025)$ (10,757)$
Depreciation and amortization 16,570 27,053 36,452 52,518 67,930 88,298 103,711 128,196 155,786 153,741
Long-lived asset impairment - - 3,151 24,976 1,060 29,560 5,350 12,810 38,987 46,258
Restructuring charges - - - - - - - 702 - 7,309
Goodwill impairment - - - - - - - - 127,757 -
Selling, general and administrative 13,730 16,085 24,226 34,830 39,380 49,889 61,971 80,521 85,586 79,717
Interest expense 11,658 18,039 20,303 24,037 30,400 25,167 37,068 57,811 74,581 77,863
Other income, net (22) (1,430) (1,208) (314) (392) (35) (9,481) (74) (1,391) (2,594)
Provision for income taxes 272 555 541 680 918 945 1,506 1,313 1,035 1,412
Gross margin1 61,609 90,149 98,249 113,394 145,349 204,333 264,148 342,998 398,316 352,949
Cap on operating costs provided by AROC 8,618 12,480 7,246 21,404 26,492 16,562 12,382 2,536 - -
Cap on selling, general and administrative costs provided by AROC 283 120 552 3,316 5,905 8,196 12,798 11,314 - -
Non-cash selling, general and administrative costs 3,184 (2,090) 811 1,209 532 797 1,174 1,376 1,059 1,203
Expensed acquisition costs (in Other (income) expense, net) - - 803 356 514 695 821 2,471 302 523
Plus: Non-recurring cash selling, general and administrative reimbursement2 (848) - - - - - - - - -
Less: Selling, general and administrative (13,730) (16,085) (24,226) (34,830) (39,380) (49,889) (61,971) (80,521) (85,586) (79,717)
Less: Other income, net 22 1,430 1,208 314 392 35 9,481 74 1,391 2,594
EBITDA, as adjusted1 59,138 86,004 84,643 105,163 139,804 180,729 238,833 280,248 315,482 277,552
Less: Provision for income taxes (272) (555) (541) (680) (918) (945) (1,506) (1,313) (1,035) (1,412)
Less: Gain on sale of property, plant and equipment (in Other income, net) - (1,435) (2,011) (667) (919) (689) (10,140) (2,466) (1,747) (3,585)
Less: loss on non-cash consideration in March 2016 acquisition 635
Less: Cash interest expense (11,258) (17,567) (19,697) (21,087) (18,822) (22,761) (32,810) (53,525) (70,181) (73,594)
Less: Maintenance capital expenditures (7,079) (9,451) (12,585) (15,898) (28,861) (38,368) (41,401) (45,316) (51,829) (23,900)
Distributable cash flow140,529$ 56,996$ 49,809$ 66,831$ 90,284$ 117,966$ 152,976$ 177,628$ 190,690$ 175,696$
Distributions declared to all unitholders for the period, including incentive
distribution rights 24,575$ 34,164$ 39,404$ 54,913$ 74,214$ 91,617$ 112,705$ 136,829$ 154,349$ 71,646$
Distributable cash flow coverage3 1.65x 1.67x 1.26x 1.22x 1.22x 1.29x 1.36x 1.30x 1.24x 2.45x
Distributable cash flow coverage (without the benefit of the cost caps)3,4 1.29x 1.30x 1.07x 0.77x 0.78x 1.02x 1.13x 1.20x 1.24x 2.45x
EBITDA, as adjusted1 59,138$ 86,004$ 84,643$ 105,163$ 139,804$ 180,729$ 238,833$ 280,248$ 315,482$ 277,552$
Less: Cap on operating and selling, general and administrative costs provided by
AROC (8,901) (12,600) (7,798) (24,720) (32,397) (24,758) (25,180) (13,850) - -
EBITDA, as adjusted (without the benefit of the cost caps)1,450,237$ 73,404$ 76,845$ 80,443$ 107,407$ 155,971$ 213,653$ 266,398$ 315,482$ 277,552$
Distributable cash flow1 40,529$ 56,996$ 49,809$ 66,831$ 90,284$ 117,966$ 152,976$ 177,628$ 190,690$ 175,696$
Less: Cap on operating and selling, general and administrative costs provided by
AROC (8,901) (12,600) (7,798) (24,720) (32,397) (24,758) (25,180) (13,850) - -
Distributable cash flow (without the benefit of the cost caps)1,431,628$ 44,396$ 42,011$ 42,111$ 57,887$ 93,208$ 127,796$ 163,778$ 190,690$ 175,696$
Non-GAAP Financial Measures
Archrock Partners, L.P.
1 See Addendum I-A for information on gross margin, EBITDA, as adjusted, EBITDA, as adjusted (without the benefit of the cost caps), distributable cash flow and distributable cash flow (without the benefit of the cost caps).2 Defined as distributable cash flow divided by distributions declared to all unit holders for the period, including incentive distribution rights. 3 Provisions in the Omnibus Agreement that provided caps on our obligation to reimburse Archrock for operating and SG&A expenses terminated on January 1, 2015. Excluding the benefit of the cost caps from our previously defined non-GAAP measures of EBITDA, as adjusted, and distributable cash flow provides external users of our consolidated financial statements comparable measures to assess operating performance in the current year period with operating performance in the prior year periods. 24
Addendum I-C© 2017 Archrock Partners, L.P. All rights reserved.
($ in thousands) 1Q 11 2Q 11 3Q 11 4Q 11 1Q 12 2Q 12 3Q 12 4Q 12 1Q 13 2Q 13 3Q 13 4Q 13
Net income (loss) 223$ (1,938)$ 3,253$ 4,515$ 4,505$ (19,050)$ 10,380$ 14,674$ 14,733$ 27,896$ 10,035$ 11,359$
Depreciation and amortization 14,149 15,459 19,087 19,235 20,362 22,788 21,930 23,218 22,706 27,030 27,158 26,817
Long-lived asset impairment - 305 384 371 805 28,122 - 633 1,540 925 784 2,101
Restructuring charges - - - - - - - - - - - -
Goodwill impairment - - - - - - - - - - - -
Selling, general and administrative 10,216 9,927 10,594 8,643 12,222 13,450 11,762 12,455 12,607 15,203 16,948 17,213
Interest expense 7,075 7,553 7,860 7,912 5,882 6,399 6,465 6,421 7,424 10,299 9,735 9,610
Other (income) expense, net (221) 455 (338) (288) 527 (261) (137) (164) (407) (7,270) (639) (1,165)
Provision for (benefit from) income taxes 235 256 242 185 281 277 272 115 407 561 309 229
Gross margin1 31,677 32,017 41,082 40,573 44,584 51,725 50,672 57,352 59,010 74,644 64,330 66,164
Cap on operating costs provided by AROC 6,877 8,349 6,193 5,073 5,323 3,511 5,841 1,886 3,503 1,729 3,212 3,938
Cap on selling, general and administrative costs provided by AROC 2,252 1,851 1,802 - 2,482 2,810 1,090 1,815 1,854 2,368 4,164 4,412
Non-cash selling, general and administrative costs 364 153 (207) 222 345 140 172 140 253 335 285 301
Expensed acquisition costs (in Other (income) expense, net) - 514 - - 695 - - - 575 - - 246
Less: Selling, general and administrative (10,216) (9,927) (10,594) (8,643) (12,222) (13,450) (11,762) (12,455) (12,607) (15,203) (16,948) (17,213)
Less: Other income (expense), net 221 (455) 338 288 (527) 261 137 164 407 7,270 639 1,165
EBITDA, as adjusted1 31,175 32,502 38,614 37,513 40,680 44,997 46,150 48,902 52,995 71,143 55,682 59,013
Less: (Provision for) benefit from income taxes (235) (256) (242) (185) (281) (277) (272) (115) (407) (561) (309) (229)
Less: Gain on sale of property, plant and equipment (in Other (income) expense, net) (212) (115) (319) (273) (174) (244) (127) (144) (935) (7,249) (614) (1,342)
Less: Loss on non-cash consideration in March 2016 Acquisition - - - - - - - - - - - -
Less: Cash interest expense (4,207) (4,652) (4,951) (5,012) (5,208) (5,718) (5,905) (5,930) (6,198) (9,036) (8,802) (8,774)
Less: Maintenance capital expenditures (5,457) (8,454) (7,382) (7,568) (8,117) (11,416) (10,345) (8,490) (8,349) (9,558) (12,675) (10,819)
Distributable cash flow121,064$ 19,025$ 25,720$ 24,475$ 26,900$ 27,342$ 29,501$ 34,223$ 37,106$ 44,739$ 33,282$ 37,849$
Distributions declared to all unitholders for the period, including incentive distribution rights 16,243$ 19,061$ 19,322$ 19,581$ 22,480$ 22,762$ 23,044$ 23,331$ 27,598$ 27,927$ 28,340$ 28,840$
Distributable cash flow coverage² 1.30x 1.00x 1.33x 1.25x 1.20x 1.20x 1.28x 1.47x 1.34x 1.60x 1.17x 1.31x
Distributable cash flow coverage (without the benefit of the cost caps)2,3 0.73x 0.46x 0.92x 0.99x 0.85x 0.92x 0.98x 1.31x 1.15x 1.46x 0.91x 1.02x
EBITDA, as adjusted1 31,175$ 32,502$ 38,614$ 37,513$ 40,680$ 44,997$ 46,150$ 48,902$ 52,995$ 71,143$ 55,682$ 59,013$
Less: Cap on operating and selling, general and administrative costs provided by AROC (9,129) (10,200) (7,995) (5,073) (7,805) (6,321) (6,931) (3,701) (5,357) (4,097) (7,376) (8,350)
EBITDA, as adjusted (without the benefit of the cost caps)1,322,046$ 22,302$ 30,619$ 32,440$ 32,875$ 38,676$ 39,219$ 45,201$ 47,638$ 67,046$ 48,306$ 50,663$
Distributable cash flow1 21,064$ 19,025$ 25,720$ 24,475$ 26,900$ 27,342$ 29,501$ 34,223$ 37,106$ 44,739$ 33,282$ 37,849$
Less: Cap on operating and selling, general and administrative costs provided by AROC (9,129) (10,200) (7,995) (5,073) (7,805) (6,321) (6,931) (3,701) (5,357) (4,097) (7,376) (8,350)
Distributable cash flow (without the benefit of the cost caps)1,311,935$ 8,825$ 17,725$ 19,402$ 19,095$ 21,021$ 22,570$ 30,522$ 31,749$ 40,642$ 25,906$ 29,499$

Non-GAAP Financial Measures
Archrock Partners, L.P.
1 See Addendum I-A for information on gross margin, EBITDA, as adjusted, EBITDA, as adjusted (without the benefit of the cost caps), distributable cash flow and distributable cash flow (without the benefit of the cost caps).2 Defined as distributable cash flow divided by distributions declared to all unit holders for the period, including incentive distribution rights. 3 Provisions in the Omnibus Agreement that provided caps on our obligation to reimburse Archrock for operating and SG&A expenses terminated on January 1, 2015. Excluding the benefit of the cost caps from our previously defined non-GAAP measures of EBITDA, as adjusted, and distributable cash flow provides external users of our consolidated financial statements comparable measures to assess operating performance in the current year period with operating performance in the prior year periods. 25
Addendum I-C Continued© 2017 Archrock Partners, L.P. All rights reserved.
($ in thousands) 1Q 14 2Q 14 3Q 14 4Q 14 1Q 15 2Q 15 3Q 15 4Q 15 1Q 16 2Q 16 Q3 16 Q4 16
Net income (loss) 6,939$ 17,752$ 18,103$ 18,925$ 20,085$ 22,327$ 11,498$ (137,935)$ 520$ 3,311$ (567)$ (14,021)$
Depreciation and amortization 27,921 31,708 33,598 34,969 36,105 39,487 40,262 39,932 39,237 38,627 38,087 37,790
Long-lived asset impairment 2,486 1,991 3,558 4,775 3,484 1,826 7,163 26,514 6,315 8,283 7,909 23,751
Restructuring charges 379 198 125 - - - - - 4,139 1,208 1,946 16
Goodwill impairment - - - - - - - 127,757 - - - -
Selling, general and administrative 19,376 19,047 20,734 21,364 21,169 20,721 20,729 22,967 23,679 19,741 17,917 18,380
Interest expense 9,689 14,756 16,141 17,225 17,832 19,082 19,048 18,619 18,742 19,313 20,034 19,774
Other (income) expense, net 871 (134) (649) (162) (191) (1,512) 585 (273) 838 72 (890) (2,614)
Provision for (benefit from) income taxes 182 541 (299) 889 643 (72) 131 333 94 187 188 943
Gross margin1 67,843 85,859 91,311 97,985 99,127 101,859 99,416 97,914 93,564 90,742 84,624 84,019
Cap on operating costs provided by AROC 2,536 - - - - - - - - - - -
Cap on selling, general and administrative costs provided by AROC 3,620 1,399 2,685 3,610 - - - - 199 - - -
Non-cash selling, general and administrative costs 756 218 348 54 592 247 98 122 - 281 323 400
Expensed acquisition costs (in Other (income) expense, net) 1,544 - 866 61 - 302 - - 172 - - 351
Less: Selling, general and administrative (19,376) (19,047) (20,734) (21,364) (21,169) (20,721) (20,729) (22,967) (23,679) (19,741) (17,917) (18,380)
Less: Other income (expense), net (871) 134 649 162 191 1,512 (585) 273 (838) (72) 890 2,614
EBITDA, as adjusted1 56,052 68,563 75,125 80,508 78,741 83,199 78,200 75,342 69,418 71,210 67,920 69,004
Less: (Provision for) benefit from income taxes (182) (541) 299 (889) (643) 72 (131) (333) (94) (187) (188) (943)
Less: Gain on sale of property, plant and equipment (in Other (income) expense, net) (673) (170) (1,414) (209) (280) (1,782) 566 (251) 53 103 (795) (2,946)
Less: Loss on non-cash consideration in March 2016 Acquisition - - - - - - - - 635 - - -
Less: Cash interest expense (8,838) (13,563) (14,962) (16,162) (16,768) (17,893) (17,780) (17,740) (18,018) (18,527) (18,449) (18,600)
Less: Maintenance capital expenditures (10,216) (11,896) (13,366) (9,838) (10,079) (15,294) (15,691) (10,765) (8,047) (5,878) (4,785) (5,190)
Distributable cash flow136,143$ 42,393$ 45,682$ 53,410$ 50,971$ 48,302$ 45,164$ 46,254$ 43,947$ 46,721$ 43,703$ 41,325$
Distributions declared to all unitholders for the period, including incentive distribution rights 33,093$ 33,649$ 34,764$ 35,323$ 35,903$ 39,084$ 39,682$ 39,680$ 17,517$ 17,513$ 17,513$ 19,107$
Distributable cash flow coverage² 1.09x 1.26x 1.31x 1.51x 1.42x 1.24x 1.14x 1.17x 2.51x 2.67x 2.50x 2.16x
Distributable cash flow coverage (without the benefit of the cost caps)2,3 0.91x 1.22x 1.24x 1.41x 1.42x 1.24x 1.14x 1.17x 2.51x 2.67x 2.50x 2.16x
EBITDA, as adjusted1 56,052$ 68,563$ 75,125$ 80,508$ 78,741$ 83,199$ 78,200$ 75,343$ 69,418$ 71,210$ 67,920$ 69,004$
Less: Cap on operating and selling, general and administrative costs provided by AROC (6,156) (1,399) (2,685) (3,610) - - - - - - - -
EBITDA, as adjusted (without the benefit of the cost caps)1,349,896$ 67,164$ 72,440$ 76,898$ 78,741$ 83,199$ 78,200$ 75,342$ 69,418$ 71,210$ 67,920$ 69,004$
Distributable cash flow1 36,143$ 42,393$ 45,682$ 53,410$ 50,971$ 48,302$ 45,164$ 46,253$ 43,947$ 46,721$ 43,703$ 41,325$
Less: Cap on operating and selling, general and administrative costs provided by AROC (6,156) (1,399) (2,685) (3,610) - - - - - - - -
Distributable cash flow (without the benefit of the cost caps)1,329,987$ 40,994$ 42,997$ 49,800$ 50,971$ 48,302$ 45,164$ 46,253$ 43,947$ 46,721$ 43,703$ 41,325$

Non-GAAP Financial Measures
Archrock Partners, L.P.
1 See Addendum I-A for information on gross margin, EBITDA, as adjusted, EBITDA, as adjusted (without the benefit of the cost caps), distributable cash flow and distributable cash flow (without the benefit of the cost caps).2 Defined as distributable cash flow divided by distributions declared to all unit holders for the period, including incentive distribution rights. 3 Provisions in the Omnibus Agreement that provided caps on our obligation to reimburse Archrock for operating and SG&A expenses terminated on January 1, 2015. Excluding the benefit of the cost caps from our previously defined non-GAAP measures of EBITDA, as adjusted, and distributable cash flow provides external users of our consolidated financial statements comparable measures to assess operating performance in the current year period with operating performance in the prior year periods. 26
Addendum I-C Continued© 2017 Archrock Partners, L.P. All rights reserved.
($ in thousands) 1Q 17
Net income (loss) (4,316)$
Depreciation and amortization 36,885
Long-lived asset impairment 6,210
Restructuring charges -
Goodwill impairment -
Selling, general and administrative 20,311
Interest expense 20,223
Debt extinguishment costs 291
Other (income) expense, net 112
Provision for (benefit from) income taxes 1,302
Gross margin1 81,018
Cap on operating costs provided by AROC -
Cap on selling, general and administrative costs provided by AROC -
Non-cash selling, general and administrative costs 520
Expensed acquisition costs (in Other (income) expense, net) -
Less: Selling, general and administrative (20,311)
Less: Other income (expense), net (112)
EBITDA, as adjusted1 61,115
Less: (Provision for) benefit from income taxes (1,302)
Less: Gain on sale of property, plant and equipment (in Other (income) expense, net) 148
Less: Loss on non-cash consideration in March 2016 Acquisition -
Less: Cash interest expense (18,254)
Less: Maintenance capital expenditures (7,275)
Distributable cash flow134,432$
Distributions declared to all unitholders for the period, including incentive distribution rights 19,101$
Distributable cash flow coverage² 1.80x
Distributable cash flow coverage (without the benefit of the cost caps)2,3 1.80x
EBITDA, as adjusted1 61,115$
Less: Cap on operating and selling, general and administrative costs provided by AROC -
EBITDA, as adjusted (without the benefit of the cost caps)1,361,115$
Distributable cash flow1 34,432$
Less: Cap on operating and selling, general and administrative costs provided by AROC -
Distributable cash flow (without the benefit of the cost caps)1,334,432$

Non-GAAP Financial Measures
Archrock Partners, L.P.
27
Addendum I-D© 2017 Archrock Partners, L.P. All rights reserved.
1 See Addendum I-A for information on gross margin and gross margin percentage.
(in thousands) 1Q 11 2Q 11 3Q 11 4Q 11 1Q 12 2Q 12 3Q 12 4Q 12 1Q 13 2Q 13 3Q 13 4Q 13
Revenue 68,729$ 71,841$ 84,437$ 83,267$ 88,697$ 97,171$ 99,324$ 102,301$ 106,062$ 125,453$ 115,808$ 118,870$
Gross margin1 31,677$ 32,017$ 41,082$ 40,573$ 44,584$ 51,725$ 50,672$ 57,352$ 59,010$ 74,644$ 64,330$ 66,164$
Gross margin percentage 1 46% 45% 49% 49% 50% 53% 51% 56% 56% 59% 56% 56%
Average Operating Horsepower 1,387 1,442 1,691 1,706 1,763 1,916 1,924 1,960 1,982 2,236 2,217 2,242
Gross margin per Horsepower per Quarter 22.84$ 22.20$ 24.29$ 23.78$ 25.29$ 27.00$ 26.34$ 29.26$ 29.77$ 33.38$ 29.02$ 29.51$
Gross margin per Horsepower per Month 7.61$ 7.40$ 8.10$ 7.93$ 8.43$ 9.00$ 8.78$ 9.75$ 9.92$ 11.13$ 9.67$ 9.84$
1Q 14 2Q 14 3Q 14 4Q 14 1Q 15 2Q 15 3Q 15 4Q 15 1Q 16 2Q 16 3Q 16 4Q 16
Revenue 121,046$ 145,694$ 153,163$ 161,133$ 164,295$ 167,801$ 163,293$ 161,419$ 151,424$ 140,052$ 135,478$ 135,406$
Gross margin1 67,843$ 85,859$ 91,311$ 97,985$ 99,127$ 101,859$ 99,416$ 97,914$ 93,564$ 90,742$ 84,624$ 84,019$
Gross margin percentage 1 56% 59% 60% 61% 60% 61% 61% 61% 62% 65% 62% 62%
Average Operating Horsepower 2,269 2,708 2,877 2,985 3,034 3,128 3,119 3,065 2,961 2,815 2,751 2,816
Gross margin per Horsepower per Quarter 29.90$ 31.71$ 31.74$ 32.83$ 32.67$ 32.56$ 31.87$ 31.95$ 31.60$ 32.24$ 30.76$ 29.84$
Gross margin per Horsepower per Month 9.97$ 10.57$ 10.58$ 10.94$ 10.89$ 10.85$ 10.62$ 10.65$ 10.53$ 10.75$ 10.25$ 9.95$
1Q 17
Revenue 137,295$
Gross margin1 81,018$
Gross margin percentage 1 59%
Average Operating Horsepower 2,861
Gross margin per Horsepower per Quarter 28.32$
Gross margin per Horsepower per Month 9.44$


