Page 1
NASA Technical Memorandum 104647
Arctic and Antarctic Sea Ice Concentrations
from Multichannel Passive-Microwave
Satellite Data Sets:
October 1978- September 1995
User's Guide
Donald J. Cavalieri, Claire L. Parkinson, Per Gloersen, and H. Jay Zwally
National Aeronautics andSpace Administration
Goddard Space Flight CenterGreenbelt, Maryland1997
https://ntrs.nasa.gov/search.jsp?R=19980076134 2019-11-21T16:02:39+00:00Z
Page 2
NASA Technical Memorandum 104647
Arctic and Antarctic Sea Ice Concentrations
from Multichannel Passive-Microwave
Satellite Data Sets:
October 1978- September 1995
User's Guide
Donald J. Cavalieri
Claire L. Parkinson
Per Gloersen
H. Jay Zwally
Goddard Space Flight Center
Greenbelt, Maryland
National Aeronautics andSpace Administration
Goddard Space Flight CenterGreenbelt, Maryland1997
Page 3
I
This publication is available from the NASA Center for AeroSpace Information, ]
800 Elkridge Landing Road, Linthicum Heights, MD 21090-2934, 301-621-0390. I
Page 4
NASA Technical Memorandum 104647
TABLE OF CONTENTS
1.0 Introduction ............................................................................................................ 3
2.0 Multichannel Passive-Microwave Satellite Data Sets ............................................ 4
2.1 Nimbus 7 SMMR ........................................................................................ 4
2.2 DMSP F8 and Fll SSMI ............................................................................ 5
3.0 Data Processing ...................................................................................................... 5
3.1 Calculation of Sea Ice Concentrations ........................................................ 5
3.2 Land-to-Ocean Spillover and Residual
Weather-Related Effects ......................................................................... 7
3.3 Filling Data Gaps ........................................................................................ 9
4.0 References ............................................................................................................ 10
5.0 Tables and Figures ............................................................................................... 12
ooo
lll
Page 6
NASA Technical Memorandum 104647
1.0 Introduction
Satellite multichannel passive-microwave sensors have provided global radiance measure-
ments with which to map, monitor, and study the Arctic and Antarctic polar sea ice covers. The
data span over 18 years (as of April 1997), starting with the launch of the Scanning Multichan-
nel Microwave Radiometer (SMMR) on NASA's SeaSat A and Nimbus 7 in 1978 and continuing
with the Defense Meteorological Satellite Program (DMSP) Special Sensor Microwave/Imager
(SSMI) series beginning in 1987. It is anticipated that the DMSP SSMI series will continue into
the 21st century. The SSMI series will be augmented by new, improved sensors to be flown on
Japanese and U.S. space platforms.
This User's Guide provides a description of a new sea ice concentration data set generated
from observations made by three of these multichannel sensors. The data set includes gridded
daily ice concentrations (every-other-day for the SMMR data) for both the north and south polar
regions from October 26, 1978 through September 30, 1995 with the one exception of a 6-week
data gap from December 3, 1987 through January 12, 1988. The data have been placed on two
CD-ROMs that include a ReadMeCD file (Fiegles and Gloersen, 1997) giving the technical
details on the file format, file headers, north and south polar grids, ancillary data sets, and direc-
tory structure of the CD-ROM.
The goal in the creation of the data set was to produce a long term, consistent set which
would serve as a baseline for future measurements. This User's Guide summarizes the problems
encountered when working with radiances from sensors having different frequencies, different
footprint sizes, different visit times, and different calibrations. A major obstacle to resolving
these differences was the lack of sufficient overlapping data from sequential sensors. The tech-
niques we employed to solve these problems or at least reduce their impacts are also presented.
In the following sections, we discuss the mapping of the sensor data onto a common grid, the
application of a new landmask, instrument drift, adjustment for land-ocean spillover, replacement
of bad data, and intersensor corrections made to reduce remaining measurement differences.
3
Page 7
Cavalieri, Parkinson, Gloersen, and Zwally
2.0 Multichannel Passive-Microwave Satellite Data Sets
The three satellite data sets employed and the periods for which the data are usable are: the
Nimbus 7 SMMR from October 26, 1978 through August 20, 1987, the DMSP SSMI F8 from
July 9, 1987 through December 18, 1991 (with the exception of the data gap from December 3,
1987 through January 12, 1988), and the DMSP SSMI Fll from December 3, 1991 through
September 30, 1995. A single-channel and two other multichannel passive-microwave satellite
imagers flown in the 1970s, but not included here, are the Nimbus 5 ESMR, the Nimbus 6 ESMR
and the SeaSat SMMR respectively. The Nimbus 5 ESMR was not used because of the lack of
overlap data with the Nimbus 7 SMMR, while the Nimbus 6 ESMR was omitted because of the
poor quality of the data. The SeaSat SMMR was omitted because of not providing adequate
coverage of the polar regions. For the purpose of providing a consistent long-term data set, data
from each of the three sensors used were mapped onto the SSMI north and south polar grids
(NSIDC, 1992) and a common land mask, recently updated for the SSMI grids (Martino et al.,
1995), was applied.
2.1 Nimbus 7 SMMR
Descriptions of the SMMR instrument design, the operating characteristics, and the proce-
dures used to obtain calibrated brightness temperatures and sea ice concentrations are given by
Gloersen et al. (1992). The algorithm to obtain sea ice concentration employs three of the ten
channels of the SMMR instrument: vertically and horizontally polarized radiances at 18 GHz and
vertically polarized radiances at 37 GHz. Before computing sea ice concentrations, isolated
missing brightness temperature pixels on the daily brightness temperature maps were filled by
spatial interpolation. Larger areas of missing data were filled later by temporal interpolation of
the sea ice concentrations.
Gloersen et al. (1992) also describe the corrections used for a long-term drift in the SMMR
data and for errors related to ecliptic-angle that were observed in the 8.8-year data set. These and
other errors had been accommodated in the sea ice concentration data set used in the Gloersen et
al. (1992) monthly averages without also correcting the gridded radiances. Since the publication
of Gloersen et al. (1992), some additional errors have been identified in the gridded brightness
temperature data set. The nature of these errors fall into four categories. These are: full orbits of
bad data, individual scans of bad data, misplaced scans from the opposite node, and misplaced
scans from unknown origin. These were identified by checking each daily image from both the
Page 8
NASATechnicalMemorandum104647
ascendingnodedataandthedescendingnodedata. All of theerrorsidentifiedandconsideredto
besufficientlyseriousto warrantexclusionwereremovedin theascendinganddescendingnode
datasetsseparatelybeforeaveragingthedatafrom thetwonodesto providedaily brightness
temperaturematrices.Finally,additionalcorrectionswereappliedto thethreechannels(18GHz
H & V,37 GHzV) of previouslycorrecteddatausedin theseaicealgorithm(Gloersenet al.,
1992),following aproceduresimilar to thatdescribedin Gloersenet al. (1992),butwith higher
precision.The8.8-yeardrifts in thesechannelswerereducedto valueswell below theinstrument
noisevaluesgivenin GloersenandBarath(1977)andlower thanin thepreviouslycorrecteddata.
2.2DMSPF8 andF11SSMI
TheDMSPF8 andF11 SSMIdatawereobtainedfromtheNational SnowandIceData
Center(NSIDC) in Boulder,Colorado. TheF8 dataweredistributedby NSIDCon CD-ROMs
for theperiodJuly 1987throughDecember1991andtheF11datafor theperiodDecember1991
throughSeptember1995. Dataacquisition,filtering baddata,handlinggeolocationerrors,
implementationof anantennapatterncorrection,andfinally theswath-to-gridconversionareall
describedin theNSIDC'sUser'sGuide(1992).
The4.5-yearF8 19-37GHzdatawerefoundto be freeof orbit-dependent(eclipticangle)
brightnesstemperaturevariationsusingatechniquesimilar to whatwasusedfor the SMMRdata
(Gloersenet al., 1992). At thetime of theanalysis,theFll datasetwastoo shortto warranta
similaranalysis,but basedontheF8 experience,theF11SSMIwaspresumedalsoto be freeof
thisdefect. Thedrift determinedby themethodusedfor theSMMR dataoverthe7-yearSSMI
periodresultedin brightnesstemperaturechangesbelowor atthe instrumentnoiselevel for the
SSMI (seeTable1.4in Hollinger,1989),andwasthereforeconsideredto haveno significant
impactonthecomputedseaiceconcentrations(lessthan0.5%)eitherfor consolidatedseaiceor
atthe iceedge,andsowereignored.
3.0 Data Processing
3.1 Calculation of Sea Ice Concentrations
Comparisons of sea ice concentrations calculated for each of the sensors during overlap
periods using published algorithm tie-points reveal significant differences. These differences
may result from differences in sensor and orbital characteristics, differences in observation times
5
Page 9
Cavalieri,Parkinson,Gloersen,andZwally
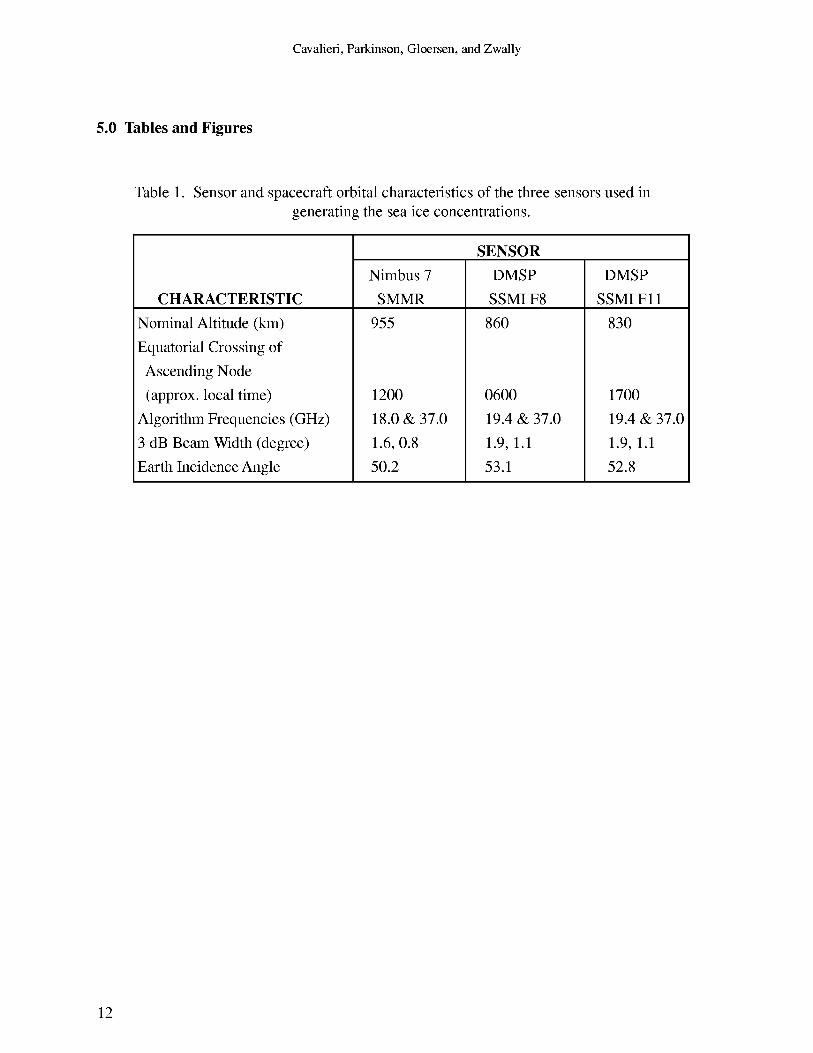
(andthereforetidal effects),anddifferencesin algorithmcoefficients.Sensorandorbitalcharac-
teristicdifferencesfor theNimbus7 SMMR andDMSPSSMIF8 includeantennabeamwidth,
channelfrequency,spacecraftaltitude,ascendingnodetime,andangleof incidence.In addition,
theseaicealgorithmtie-pointsaresignificantlydifferent. TheSSMIF8 andF11 sensorsalso
differ in ascendingnodetime,altitude,andangleof incidence.Becausethevisit timesof the
threesatellitesoccurduringdifferentphasesof thediurnalcycle,tidal effectsmayresultin
differencesin the icedistribution.Wearepresumingthat anysucheffectsaremitigatedby thecorrectionschemedescribedbelow. Table1summarizesthesensorandorbitalcharacteristic
differences.Thesedifferencesareaccommodatedfor eachpair of sensorsby employingaself-
consistentsetof algorithmtie-pointsdeterminedthroughlinearrelationshipsbetweentheob-
servedbrightnesstemperaturesduringthe overlapperiods.
Nimbus 7 SMMR/DMSP SSMI F8
Daily brightness temperature maps from the Nimbus 7 SMMR and from the DMSP SSMI F8
during their period of overlap, July 9-August 20, 1987, were compared for both the Arctic and
Antarctic. Unfortunately, there were only 22 days of common coverage. A linear least squares
best fit of the cumulative data was obtained for each of the corresponding channels. For the
purpose of eliminating spurious brightness temperatures resulting from residual land spillover
effects, an Arctic land mask expanded 3 to 4 pixels out from the original land mask was used in
the determination of the best fit between the two data sets. The eliminated pixels represent only
a very small fraction of the total number of ice concentration pixels, but eliminating them helps
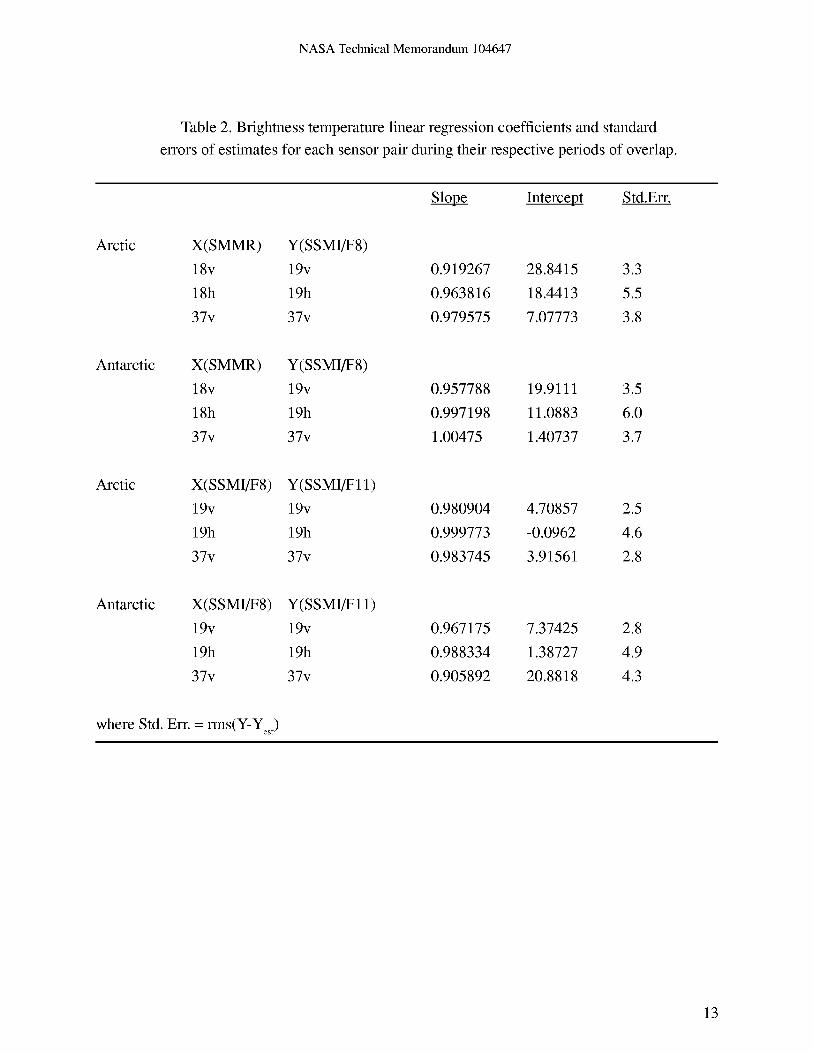
considerably in reducing the outliers on the scatter plots. The linear regression equations ob-
tained and the standard error of estimates for the corresponding channels are given in Table 2.
These linear relationships were used to generate a set of SSMI tie-points that are consistent with
the original SMMR sea ice algorithm tie-points (Gloersen et al., 1992). The published SSMI F8
tie-points (Cavalieri et al., 1992) were not used. In addition to using these transformations, the
SSMI F8 open water tie-points were subjectively tuned to help minimize the differences between
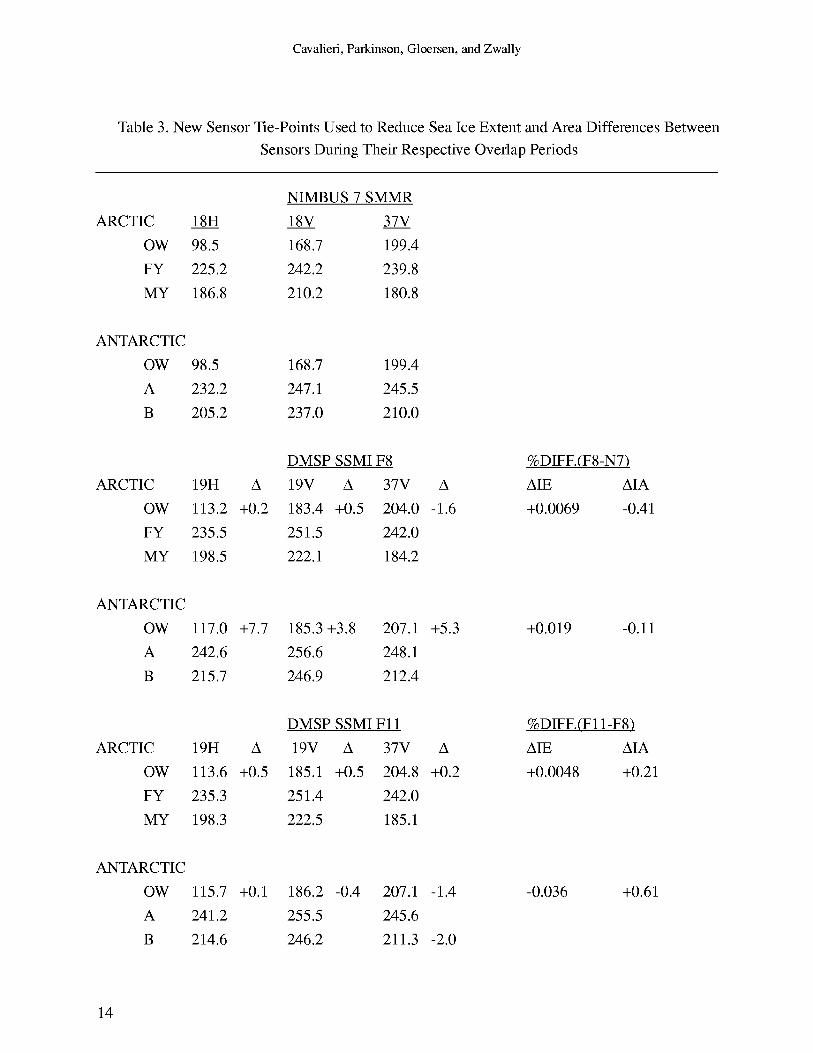
the SMMR and SSMI F8 sea ice extent and area during the overlap period. The SMMR set of
tie-points, the tuned SSMI F8 set, and the resulting percent differences in ice extent and area
given during the period of overlap are given in Table 3. The amount of tuning is also indicated
for the open water tie-points. In all cases except for the Antarctic F8 values, the tuned amount is
within one standard error of estimate. We suspect the reason for the larger tuned values results
from greater weather effects during the overlap period.
Page 10
NASA Technical Memorandum 104647
SSMI F8/SSMI F11
The period of overlap for F8 and F11 is even shorter than that for Nimbus 7 and SSMI F8,
with only 16 days of overlap of good data, from December 3-18, 1991. The linear regression
equations obtained from these plots and the standard error of estimates for the corresponding
channels are given in Table 2. The SSMI F11 open water tie-points were also tuned to help
reduce differences in ice extent and area as was done with the SSMI F8 values. A further adjust-
ment to the Antarctic 37V ice type-B F11 tie-point was also made to reduce the ice area differ-
ence. The tie-points, the amount of tuning, the ice extent and area percent differences are all
given in Table 3. In this case, the amount of tuning needed to reduce the ice extent and area
differences between the F8 and F11 values is well within one standard error of estimate (Table
2).
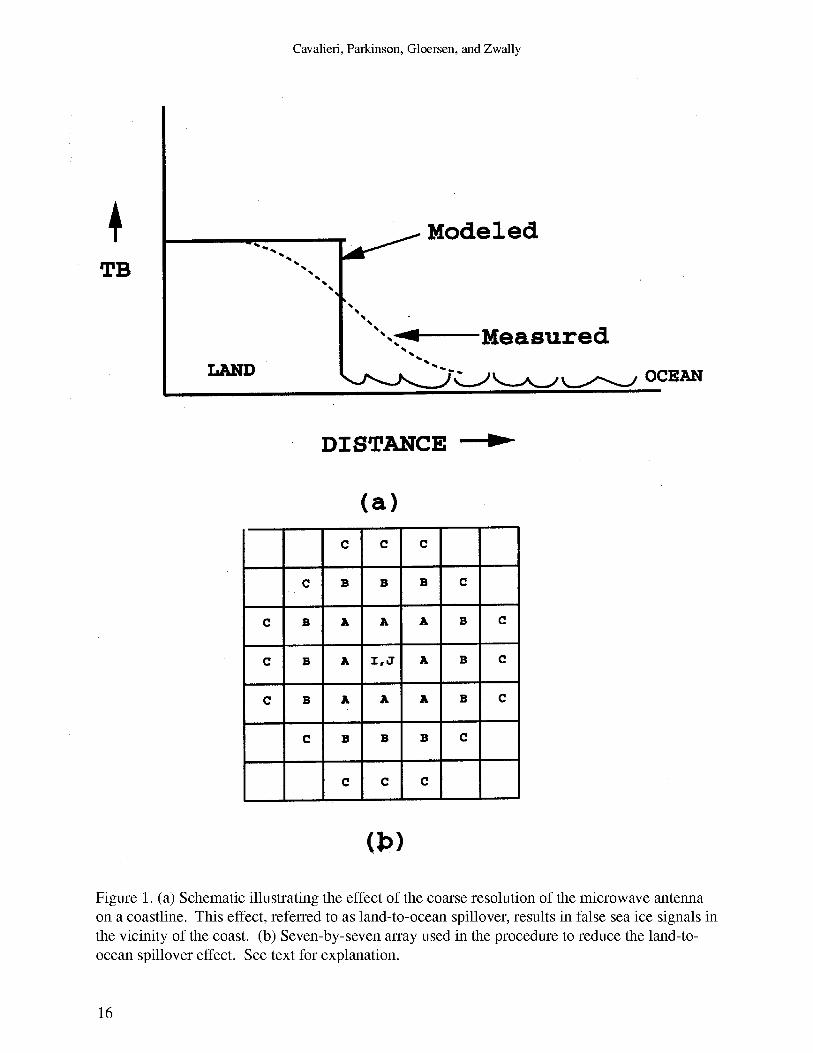
3.2 Land-to-Ocean Spillover and Residual Weather-Related Effects
The next step in preparing the data sets was the correction for land-to-ocean spillover (often
referred to as "land contamination") and residual weather-related effects. Land-to-ocean
spillover refers to the problem of blurting sharp contrasts in brightness temperature, such as exist
between land and ocean, by the relatively coarse width of the sensor antenna pattern (Figure la).
This problem is of concern here because it results in false sea ice signals along coastlines. The
method used to reduce the spillover is an extension of the method employed for the single-
channel Nimbus 5 Electrically Scanning Microwave Radiometer (ESMR) data in Parkinson et al.
(1987). The rationale behind the approach is that a minimum observed (generally in late sum-
mer) sea ice concentration in the vicinity of coastlines where no ice remains offshore is probably
the result of land spillover and is thus subtracted from the image. To reduce the error of subtract-
ing ice in areas of ice cover, the technique searches for and requires the presence of open water in
the vicinity of the image pixel to be corrected.
Land-to-ocean spillover was reduced by the following three-step procedure:
(1) A matrix M was created covering the entire grid and identifying each pixel as land,
shore, near-shore, off-shore, or non-coastal ocean. The identification of land pixels was straight-
forward, obtained from the land/sea mask. The identification of shore, near-shore, and off-shore
pixels was based on the scheme plotted in Figure lb, where the pixel to be identified is labeled
I,J. This pixel is considered a "shore" pixel if any pixel adjacent to it (the A pixels in Figure lb)
is land, a "near-shore" pixel if none of the A pixels is land but at least one of the B pixels is land,
7
Page 11
Cavalieri, Parkinson, Gloersen, and Zwally
and an "off-shore" pixel if none of the A or B pixels is land but at least one of the C pixels is
land. All other ocean pixels are considered "non-coastal ocean". This matrix M is created once
and then used throughout the data set.
(2) A matrix CMIN, to represent minimum ice concentrations on a pixel-by-pixel basis
throughout the entire grid, was created for each instrument type. CMIN was created by first
constructing a matrix P containing the minimum monthly average ice concentrations throughout
a given year, then adjusting that matrix at off-shore, near-shore, and shore pixels. In the case of
SMMR, 1984 monthly data were used, whereas in the case of SSMI, 1992 monthly data were
used. In both cases, the adjustments were as follows: (a) at off-shore pixels, any P values exceed-
ing 20% were reduced to 20%; (b) at near-shore pixels, any P values exceeding 40% were re-
duced to 40%; and (c) at shore pixels, any P values exceeding 60% were reduced to 60%. The
CMIN matrix was created once for SMMR and once for SSMI, then used throughout the data
sets.
(3) The daily ice-concentration matrices for all three data sets were adjusted at any off-
shore, near-shore, and shore pixels in the vicinity of open water. Specifically, the "neighborhood"
of an off-shore pixel was defined as containing the 8 other pixels in the 3 x 3 box centered on the
off-shore pixel; the "neighborhood" of a near-shore pixel was defined as containing the 24 other
pixels in the 5 x 5 box centered on the near-shore pixel; and the "neighborhood" of a shore pixel
was defined as containing the 48 other pixels in the 7 x 7 box centered on the shore pixel. At any
time when the neighborhood of an off-shore, near-shore, or shore pixel contains three or more
open-water pixels (i.e., ice concentration less than 15%), then the calculated ice concentration at
the off-shore, near-shore, or shore pixel is reduced by the value for that pixel in the matrix
CMIN. Wherever the subtraction leads to negative ice concentrations, the concentrations are set
to 0%. This land-spillover-correction algorithm is clearly a rough approximation, as the contami-
nated amount does not stay constant over time; but the scheme has been found to reduce substan-
tially the spurious ice concentrations on the grids.
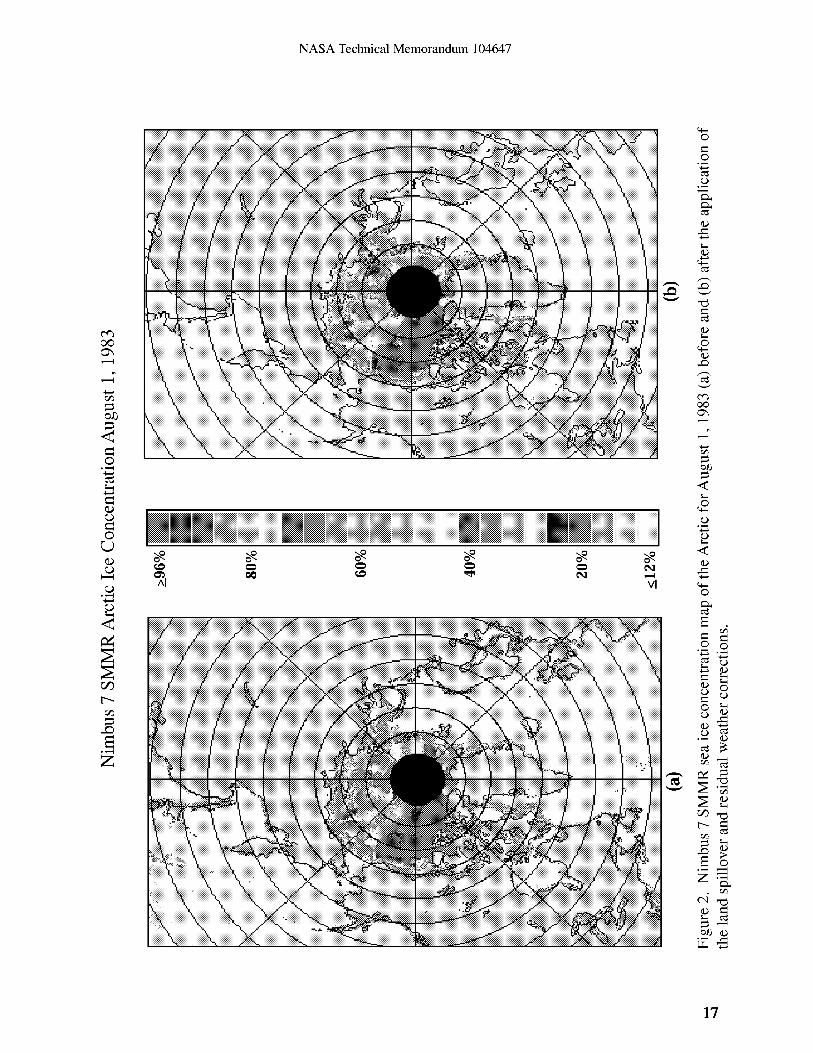
A correction for residual weather effects was made based on monthly climatological sea
surface temperatures (SSTs) from the NOAA Ocean Atlas (Levitus and Boyer, 1994). These
data, originally on a 2 ° by 2 ° grid, were remapped onto the SSMI grid. Because the SST data did
not extend to the SSMI coastline, the data were extrapolated to the coastline once regridded onto
the SSMI grid. The SST maps were used as follows: In the Northern Hemisphere, in any pixel
where the monthly SST is greater than 278 K, the ice concentration is set to zero throughout the
Page 12
NASATechnicalMemorandum104647
month;in theSouthernHemisphere,whereverthemonthly SSTis greaterthan275 K, the ice
concentrationis setto zerothroughoutthemonth. ThehigherthresholdSSTvaluewasneededin
theNorthernHemispherebecausethe275K isothermusedin theSouthwastoocloseto theice
edgein theNorth. In afewinstances,correctionsto theregriddedSSTdatawereneeded,be-
causeotherwisewewerelosingactualseaice. An exampleof theapplicationof the land-ocean
spilloverandresidualweathereffectcorrectionsis providedin Figure2.
3.3Filling DataGaps
In eachof thedatasets,thereareinstancesof missingdata. In somecaseswholedays(or
weeksormonths)aremissing. In othercases,largeswathsor wedgesof missingdataexist
within animage,alongwith scatteredpixelsof missingdatathroughoutthegrid.Thescattered
pixelsof missingdata,resultinggenerallyfrom mappingthe orbitalradiancedatato theSSMI
grid,werefilled by applyingaspatiallinearinterpolationschemeonthebrightnesstemperature
maps.Thelargerareasof missingdata,resultingfrom gapsbetweenorbitalswaths(generallyat
low latitudesondaily maps)or from partial coverageormissingdays,werefilled by temporal
interpolationon theice concentrationmaps.No dataat all wereavailablefor theperiodfrom
December2, 1987throughJanuary12,1988.This gapwasnot filled by temporallinearinterpo-
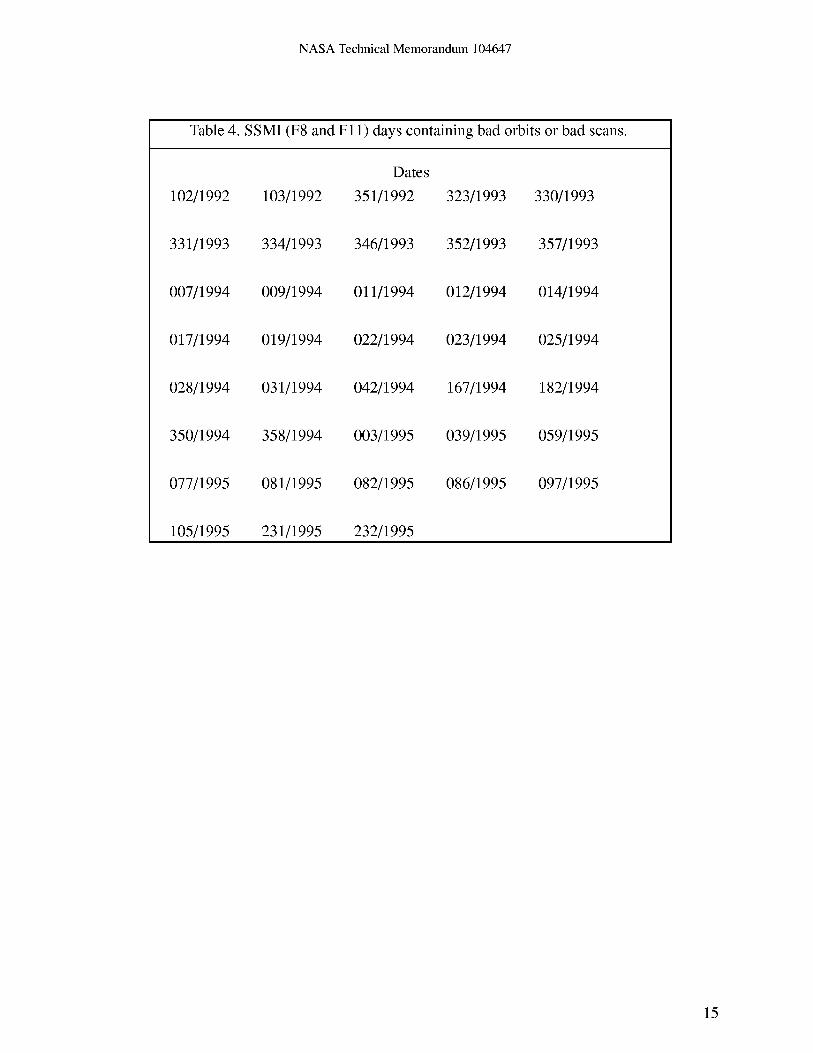
lation,insteadbeingleft asmissingdata.Table4 lists the SSMIdatescontainingbaddata,which
weresubsequentlycorrectedthroughinterpolation.
Acknowledgments
Wegratefullyacknowledgethehelp of S.Fiegles,M. Martino,andJ.Salehfrom HughesSTX
Corp.with variousaspectsof thisproject. TheSSMIdatawereobtainedonCD-ROMfrom the
NationalSnowandIce DataCenter,Boulder,CO.
9
Page 13
Cavalieri,Parkinson,Gloersen,andZwally
4.0References
Cavalieri, D. J., J. Crawford, M. Drinkwater, W. J. Emery, D. T. Eppler, L. D. Farmer, M.
Goodberlet, R. Jentz, A. Milman, C. Morris, R. Onstott, A. Schweiger, R. Shuchman, K.
Steffen, C. T. Swift, C. Wackerman and R. L. Weaver, NASA Sea Ice Validation Program
for the DMSP SSM/I: Final Report, NASA Technical Memorandum 104559, National
Aeronautics and Space Administration, Washington, D. C., pp. 126, 1992.
Fiegles, S. and E Gloersen, "README file on CDROM," Arctic Sea Ice: 1978-1995, National
Aeronautics and Space Administration, Washington, D.C., 1997.
Gloersen, E, W. J. Campbell, D. J. Cavalieri, J. C. Comiso, C. L. Parkinson, H. J. Zwally,
Arctic and Antarctic Sea Ice,1978-1987: Satellite Passive Microwave Observations and
Analysis, National Aeronautics and Space Administration, Special Publication 511, Wash
ington, D.C., pp.290, 1992.
Gloersen, E and Barath, E T., "A Scanning Multichannel Microwave Radiometer for Nimbus-G
and SeaSat-A," IEEE Journal of Oceanic Engineering, OE-2,172-178, 1977.
Hollinger, J. E, DMSP Special Sensor Microwave/Imager Calibration�Validation, Final Report
Volume 1, Space Sensing Branch, Naval Research Laboratory, Washington, DC 20375-
5000, 20 July 1989.
Levitus, S. and Boyer, T. P., World Ocean Atlas 1994, Volume 4: Temperature, NOAA National
Oceanographic Data Center, Ocean Climate Laboratory, U.S. Department of Commerce,
Washington, D.C., 1994.
Martino, M., D. J. Cavalieri, E Gloersen, and H. J. Zwally, An Improved Land Mask for the
SSM/I Grid, NASA Technical Memorandum 104625, pp.9, December 1995.
NSIDC, DMSP SSM/I Brightness Temperatures and Sea Ice Concentration Grids for the Polar
Regions on CD-ROM User's Guide, National Snow and Ice Data Center, Special Report-1,
Cooperative Institute for Research in Environmental Sciences, University of Colorado,
Boulder, CO, January 1992.
10
Page 14
NASA Technical Memorandum 104647
Parkinson, C. L., J. Comiso, H. J. Zwally, D. J. Cavalieri, E Gloersen, W. J. Campbell, Arctic Sea
Ice, 1973-1976." Satellite Passive Microwave Observations, National Aeronautics and
Space Administration, Special Publication 489, Washington, D.C., 296 pp., 1987.
11
Page 15
Cavalieri, Parkinson, Gloersen, and Zwally
5.0 Tables and Figures
Table 1. Sensor and spacecraft orbital characteristics of the three sensors used in
generating the sea ice concentrations.
CHARACTERISTIC
Nominal Altitude (kin)
Equatorial Crossing of
Ascending Node
(approx. local time)
Algorithm Frequencies (GHz)
3 dB Beam Width (degree)
Earth Incidence Angle
Nimbus 7
SMMR
955
SENSOR
DMSP
SSMI F8
860
1200
18.0 & 37.0
1.6,0.8
50.2
0600
19.4 & 37.0
1.9, 1.1
53.1
DMSP
SSMI Fll
830
1700
19.4 & 37.0
1.9, 1.1
52.8
12
Page 16
NASA Technical Memorandum 104647
Table 2. Brightness temperature linear regression coefficients and standard
errors of estimates for each sensor pair during their respective periods of overlap.
Slop_e_ Intercept Std.Err.
Arctic X(SMMR) Y(SSMI]F8)
18v 19v 0.919267 28.8415 3.3
18h 19h 0.963816 18.4413 5.5
37v 37v 0.979575 7.07773 3.8
Antarctic X(SMMR) Y(SSMI]F8)
18v 19v 0.957788 19.9111 3.5
18h 19h 0.997198 11.0883 6.0
37v 37v 1.00475 1.40737 3.7
Arctic X(SSMI/F8) Y(SSMI/F11)
19v 19v 0.980904 4.70857 2.5
19h 19h 0.999773 -0.0962 4.6
37v 37v 0.983745 3.91561 2.8
Antarctic X(SSMI/F8) Y(SSMI/F11)
19v 19v 0.967175 7.37425 2.8
19h 19h 0.988334 1.38727 4.9
37v 37v 0.905892 20.8818 4.3
where Std. Err. = rms(g-Yest)
13
Page 17
Cavalieri, Parkinson, Gloersen, and Zwally
Table 3. New Sensor Tie-Points Used to Reduce Sea Ice Extent and Area Differences Between
Sensors During Their Respective Overlap Periods
NIMBUS 7 SMMR
ARCTIC 18H 18V 37V
OW 98.5 168.7 199.4
FY 225.2 242.2 239.8
MY 186.8 210.2 180.8
ANTARCTIC
OW 98.5 168.7 199.4
A 232.2 247.1 245.5
B 205.2 237.0 210.0
DMSP SSMI F8
ARCTIC 19H A 19V
OW 113.2 +0.2 183.4
FY 235.5 251.5
MY 198.5 222.1
A
+0.5
37V
204.0
242.0
184.2
%DIFF.(F8-N7)
AIE AIA
+0.0069 -0.41
ANTARCTIC
OW 117.0 +7.7 185.3 +3.8 207.1
A 242.6 256.6 248.1
B 215.7 246.9 212.4
+5.3 +0.019 -0.11
DMSP SSMI F11
ARCTIC 19H A 19V
OW 113.6 +0.5 185.1
FY 235.3 251.4
MY 198.3 222.5
A
+0.5
37V
204.8
242.0
185.1
A
+0.2
%DIFF.(F1 l-F8)
AlE MA
+0.0048 +0.21
ANTARCTIC
OW 115.7 +0.1 186.2
A 241.2 255.5
B 214.6 246.2
-0.4 207.1
245.6
211.3
-0.036 +0.61
14
Page 18
NASA Technical Memorandum 104647
Table 4. SSMI (F8 and F11) days containing bad orbits or bad scans.
Dates
102/1992 103/1992 351/1992 323/1993 330/1993
331/1993 334/1993 346/1993 352/1993 357/1993
007/1994 009/1994 011/1994 01211994 01411994
017/1994 019/1994 022/1994 023/1994 025/1994
028/1994 031/1994 04211994 167/1994 18211994
350/1994 358/1994 003/1995 039/1995 059/1995
077/1995 081/1995 082/1995 086/1995 097/1995
105/1995 231/1995 232/1995
15
Page 19
Cavalieri, Parkinson, Gloersen, and Zwally
TB
LAND
Modeled
%%%
Measured
DISTANCE
(a)
c C c
C B B B C
C B A A A B C
C B A I,J A B C
C B A A A B C
J
C B B B C
C C C
Figure 1. (a) Schematic illustrating the effect of the coarse resolution of the microwave antenna
on a coastline. This effect, referred to as land-to-ocean spillover, results in false sea ice signals in
the vicinity of the coast. (b) Seven-by-seven array used in the procedure to reduce the land-to-
ocean spillover effect. See text for explanation.
16
Page 20
NASA Technical Memorandum 104647
<
©
_D
©L)
_iiiiiiiiiiiiiiiiiiiiii _iiiiiiiiiiiii_iiiiiiiiiiiiiiiiiiiiiiiiiiiiiiiiiiiiiiiiiiiiii_iiiiiiiiiiiiiiiiiiiiii iiiiiiiiiiiiiiiiiiiiiiiiiiiiiiiiiiiiiiiiiiiii
©
©o_
o_
o_
°_
°_
Z
^I vl©
© ©
©
o_
•_ d.)
©o_
o_
o_
17
Page 21
Form ApprovedREPORT DOCUMENTATION PAGEOMB No. 0704-0188
Public reporting burden for this collection of information is estimated to average 1 hour per response, including the time for reviewing instructions, searching existing data sources,
gathering and maintaining the data needed, and completing and reviewing the collection of information. Send comments regarding this burden estimate or any other aspect of this
collection of information, including suggestions for reducing this burden, to Washington Headquarters Services, Directorate for Information Operations and Reports, 1215 Jefferson
Davis Highway, Suite 1204, Arlington, VA 22202-4302, and to the Office of Management and Budget, Paperwork Reduction Project (0704-0188), Washington, DC 20503.
1. AGENCY USE ONLY (Leave blank) 2. REPORT DATE 3. REPORT TYPE AND DATES COVEREDMay 1997 Technical Memorandum
4. TITLE AND SUBTITLE 5. FUNDING NUMBERS
Arctic and Antarctic Sea Ice Concentrations from Multichannel
Passive-Microwave Satellite Data Sets: Oct. 1978 - Sept. 1995
6. AUTHOR(S)
D. J. Cavalieri, C. L. Parkinson, R Gloersen, and H. Jay Zwally
7. PERFORMING ORGANIZATION NAME(S) AND ADDRESS (ES)
Laboratory for Hydrospheric Processes
Goddard Space Flight Center
Greenbelt, Maryland 20771
9. SPONSORING / MONITORING AGENCY NAME(S) AND ADDRESS (ES)
National Aeronautics and Space Administration
Washington, DC 20546-0001
Code 971
8. PEFORMING ORGANIZATIONREPORT NUMBER
97B00054
10. SPONSORING / MONITORINGAGENCY REPORT NUMBER
TM-104647
11. SUPPLEMENTARY NOTES
12a. DISTRIBUTION / AVAILABILITY STATEMENT 12b. DISTRIBUTION CODE
Unclassified - Unlimited
Subject Category: 43
This report is available from the NASA Center for AeroSpace Information
800 Elkrid_e Landin_ Road, Linthicum Heights, MD 21090;301-621-039013. ABSTRACT (Maximum 200 words)
Satellite multichannel passive-microwave sensors have provided global radiance measurements with which to map,
monitor and study the Arctic and Antarctic polar sea ice covers. The data span over 18 years (as of April 1997), starting
with the launch of the Scanning Multichannel Microwave Radiometer (SMMR) on NASA's SeaSat A and Nimbus 7 in
1978 and continuing with the Defense Meteorological Satellite Program (DMSP) Special Sensor Microwave/Imager
(SSMI) series beginning in 1987. It is anticipated that the DMSP SSMI series will continue into the 21st century. The
SSMI series will be augmented by new, improved sensors to be flown on Japanese and U.S. space platforms.
This User's Guide provides a description of a new sea ice concentration data set generated from observations made by
three of these multichannel sensors. The data set includes gridded daily ice concentrations (every-other-day for the
SMMR data) for both the north and south polar regions from October 26, 1978 through September 30, 1995, with the
one exception of a 6-week data gap from December 3, 1987 through January 12, 1988. The data have been placed on two
CD-ROMs that include a ReadMeCD file giving the technical details on the file format, file headers, north and south
polar grids, ancillary data sets, and directory structure of the CD-ROM. The CD-ROMS will be distributed by the
National Snow and Ice Data Center in Boulder, CO.
14. SUBJECT TERMS
sea ice concentration, satellite passive microwave radiometers,
Arctic sea ice, Antarctic sea ice
17. SECURITY CLASSIFICATIONOF REPORT
Unclassified
18. SECURITY CLASSIFICATIONOF THIS PAGE
Unclassified
19. SECURITY CLASSIFICATIONOF ABSTRACT
Unclassified
15. NUMBER OF PAGES
1716. PRICE CODE
20. LIMITATION OF ABSTRACT
LTL
NSN 7540-01-280-5500 Standard Form 298 (Rev. 2-89)Prescribed by ANSI Std. Z39.18
298-102