ARD Test Handbook Confidential Project P387A Prediction & Kinetic Control of Acid Mine Drainage Ian Wark Research Institute Environmental Geochemistry International Pty Ltd AMIRA International Limited ACN 004 448 266 ABN 60 176 687 975 Level 2, 271 William Street Melbourne 3000 Australia Phone: +61 3 8636 9999 Facsimile: +61 3 8636 9900 email: [email protected]Website www.amira.com.au May 2002
Transcript
ARD Test Handbook Confidential
Project P387A Prediction & Kinetic Control of Acid Mine Drainage
Ian Wark Research Institute Environmental Geochemistry International Pty Ltd
AMIRA International Limited ACN 004 448 266 ABN 60 176 687 975 Level 2, 271 William Street Melbourne 3000 Australia Phone: +61 3 8636 9999 Facsimile: +61 3 8636 9900 email: [email protected] Website www.amira.com.au
May 2002
Ian Wark Research Institute
ARD TEST HANDBOOK April 2002 Prepared for: Mr. N. Currey, Placer Pacific Ltd. Dr. R.W. Shaw, Rio Tinto Ltd. Dr. R.C. Dunne, Newcrest Australia Ltd. Mr.A. Neale, PT Freeport Indonesia Ltd. Mr. R.A. McGill, NT Dept. of Mines and Energy Prepared by: Ian Wark Research Institute Prof. Roger Smart Dr. Bill Skinner Mr. George Levay Assoc. Prof. Andrea Gerson Dr. Joan Thomas Ms. Helena Sobieraj Dr. Russell Schumann Mr. Christopher Weisener Mr. Paul Weber Environmental Geochemistry International Pty Ltd Dr. Stuart Miller Mr. Warwick Stewart
Date of Issue: May 2002
Distribution: Clients Professor H.W. Nesbitt (University of Western Ontario, Canada) Associate Professor J. Metson and Dr. M. Hyland (University of Auckland, New Zealand)
ARD Test Handbook May 2002
Project P387A Prediction & Kinetic Control of Acid Mine Drainage
AMIRA P387A Project ARD Test Handbook
ARD Test Handbook
Disclaimer & Indemnity None of AMIRA International Limited, The University of South Australia/ Ian Wark Research Institute, Environmental Geochemistry International Pty Ltd nor any of the authors of this handbook nor any researcher engaged in AMIRA Research Project P387A makes any representation as to the accuracy, reliability or suitability for any purpose of the information contained therein. Persons or bodies accessing the handbook or using the information do so at their own risk in all respects and are deemed to do so on the basis of both their acceptance of the above disclaimer and their agreement to indemnify and hold harmless the persons and bodies listed above against all claims, costs, damages and liability arising in any circumstances from access or use by them or by any person or body obtaining access through them to the handbook or any information contained therein.
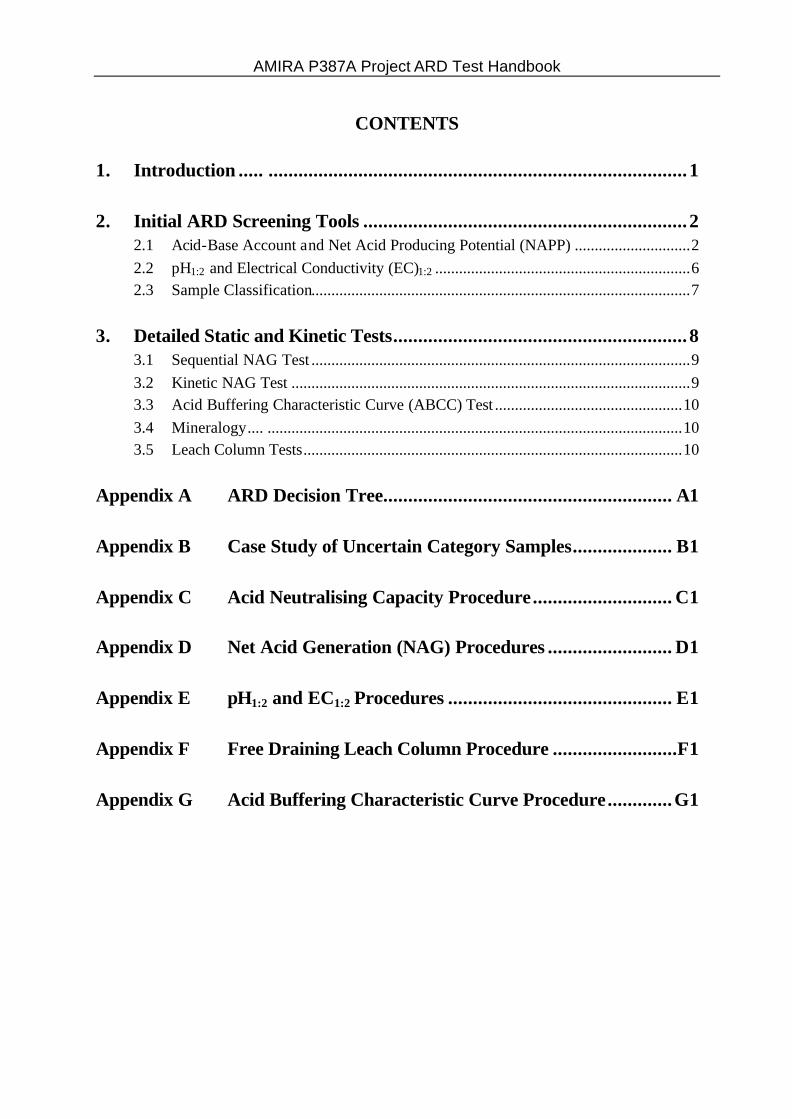
3. Detailed Static and Kinetic Tests........................................................... 8 3.1 Sequential NAG Test ...............................................................................................9 3.2 Kinetic NAG Test ....................................................................................................9 3.3 Acid Buffering Characteristic Curve (ABCC) Test ...............................................10 3.4 Mineralogy.... ........................................................................................................10 3.5 Leach Column Tests...............................................................................................10
Appendix A ARD Decision Tree.......................................................... A1 Appendix B Case Study of Uncertain Category Samples.................... B1 Appendix C Acid Neutralising Capacity Procedure............................ C1 Appendix D Net Acid Generation (NAG) Procedures ......................... D1 Appendix E pH1:2 and EC1:2 Procedures ............................................. E1 Appendix F Free Draining Leach Column Procedure .........................F1 Appendix G Acid Buffering Characteristic Curve Procedure.............G1
AMIRA P387A Project ARD Test Handbook
Ian Wark Research Institute Page A- 1 Environmental Geochemistry International Pty Ltd
Protocol Booklet for Assessment of the Acid Forming Potential of Mine Waste Materials
1.0 Introduction Acid rock drainage (ARD) is produced by the exposure of sulphide minerals such as pyrite to atmospheric oxygen and water. The ability to identify in advance any mine materials that could potentially produce ARD is essential for timely implementation of mine waste management strategies for ARD control. A number of procedures have been developed to determine the acid forming characteristics of mine waste materials. The most widely used assessment methods for ARD characterisation are the Acid-Base Account (ABA) and the Net Acid Generation (NAG) test. These methods are referred to as static procedures because each involves a single measurement in time. Kinetic test procedures involve a number of measurements over time, and are used to assess a range of ARD issues including sulphide reactivity, oxidation kinetics, metal solubility and the leaching behaviour of test materials. Kinetic NAG and Leach column tests are examples of kinetic procedures. For a given sample set a number of ARD test approaches are possible depending on the nature of the test materials, the information required, the urgency of the information and the budget. The following testing scheme is a suggested approach that will suit most situations:
Stage 1: Screening - samples are screened and categorised using relatively rapid and inexpensive static tests;
Stage 2: Follow up testing - to obtain more information on acid forming capacities and resolve samples with uncertain classifications. A variety of static test methods and kinetic NAG tests would be carried out at this stage; and
Stage 3: Leach Column testing - longer term kinetic column testing to provide data on reaction rates and leachate chemistry.
AMIRA P387A Project ARD Test Handbook
Ian Wark Research Institute Page A- 2 Environmental Geochemistry International Pty Ltd
2.0 Initial ARD Screening Tools ARD screening tools are used in categorising the relative acid forming potential of a sample. The recommended basic screening test set is as follows:
• pH1:2 and Electrical Conductivity (EC) 1:2 test
• Total Sulphur (Leco) determination
• Acid Neutralising Capacity (ANC) test
• Net Acid Producing Potential (NAPP) calculation (based on S and ANC)
• Single Addition Net Acid Generation (NAG) test
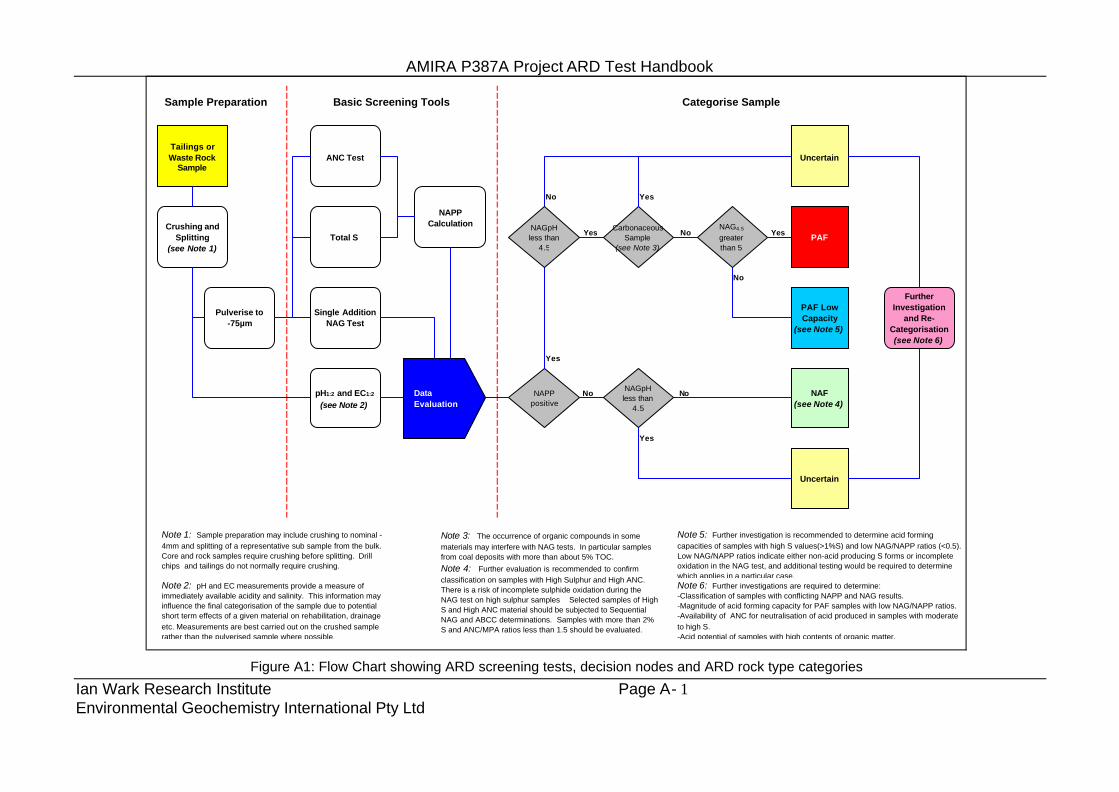
A representative sub-sample from the bulk should be split and pulverised to –75µm for testing. Methods for pH1:2/EC1:2, NAG (including kinetic NAG and sequential NAG) and ANC are appended for reference. The manner in which each test is used to categorise a sample is presented as a flow chart in Figure A1 (Appendix A). Note that individually, each test method has limitations in how reliably it can predict acid forming potential. In combination these test methods result in better definition of acid forming potential and highlight samples that require further investigation. The risks of misclassifying NAF material as PAF (Type 1 error) and PAF material as NAF (Type 2 error) are substantially reduced by conducting both NAPP and NAG tests. Each of the basic ARD screening tools are described in more detail in the following sub-sections. 2.1 Acid-Base Account and Net Acid Producing Potential (NAPP) The acid-base account involves static laboratory procedures that evaluate the balance between acid generation processes (oxidation of sulphide minerals) and acid neutralising processes (dissolution of alkaline carbonates, displacement of exchangeable bases, and weathering of silicates). The values arising from the acid-base account are referred to as the maximum potential acidity (MPA) and the acid neutralising capacity (ANC), respectively. The difference between the MPA and ANC is referred to as the net acid producing potential (NAPP). The chemical and theoretical basis of the acid-base account are discussed below.
AMIRA P387A Project ARD Test Handbook
Ian Wark Research Institute Page A- 3 Environmental Geochemistry International Pty Ltd
Maximum Potential Acidity The MPA that can be generated by a sample is determined from the sample sulphur content. The total sulphur content of a sample is commonly determined by the high temperature combustion methods. The calculation assumes that the measured sulphur content occurs as pyrite (FeS2) and that pyrite reacts under oxidising conditions to generate acid according to the reaction:
FeS2 + 15/4 O2 + 7/2 H2O => Fe(OH)3 + 2 H2SO4 According to this reaction, the MPA of a sample containing 1 %S as pyrite is 30.6 kilograms of H2SO4 per tonne of material (i.e. kg H2SO4/t). Hence the MPA of a sample is calculated from the total sulphur content using the following formula:
MPA (kg H2SO4/t) = (Total %S) * 30.6 The use of the total sulphur assay to estimate the MPA is a conservative approach because some sulphur may occur in forms other than pyrite. Sulphate-sulphur and native sulphur, for example, are non-acid generating sulphur forms. Also, some sulphur may occur as other metal sulphides (e.g. covellite, chalcocite, sphalerite, galena) which yield less acidity than pyrite when oxidised or, in some cases, may be non-acid generating or acid consuming. The total sulphur content is commonly used to assess MPA because of the difficulty and costs involved in routinely determining the speciation of sulphur forms within samples and determining reactive sulphide-sulphur contents. However, if the sulphide mineral forms are known then allowance can be made for non- and lesser acid generating sulphur forms to provide a better estimate of the MPA. Acid Neutralising Capacity The acid formed from pyrite oxidation will to some extent react with acid neutralising minerals contained within the sample. This inherent acid buffering is quantified in terms of the ANC. The ANC is commonly determined by a modified Sobek1 method. This method involves the addition of a known amount of standardised hydrochloric acid (HCl) to an accurately weighed sample, allowing the sample time to react (with heating), then back-titrating the mixture with standardised sodium hydroxide (NaOH) to determine the amount of unreacted HCl. The amount of acid consumed by reaction with the sample is then calculated and expressed in the same units as the MPA, that is kg H2SO4/t.
1 Sobek, A.A., Schuller, W.A., Freeman, J.R., and Smith, R.M., 1978. Field and Laboratory Methods Applicable to
Overburdens and Minesoils., EPA-600/2-78-054, p.p. 47-50.
AMIRA P387A Project ARD Test Handbook
Ian Wark Research Institute Page A- 4 Environmental Geochemistry International Pty Ltd
Net Acid Producing Potential (NAPP) This is a theoretical calculation commonly used to indicate if a material has potential to generate ARD. It represents the balance between the capacity of a sample to generate acid (MPA) and its capacity to neutralise acid (ANC). The NAPP is also expressed in units of kg H2SO4/t and is calculated as follows:
NAPP = MPA - ANC If the MPA is less than the ANC then the NAPP is negative, which indicates that the sample may have sufficient ANC to prevent acid generation. Conversely, if the MPA exceeds the ANC then the NAPP is positive, which indicates that the material may be acid generating. ANC/MPA Ratio The ANC/MPA ratio is frequently used as a means of assessing the risk of acid generation from mine waste materials. The ANC/MPA ratio is another way of looking at the acid base account. A positive NAPP is equivalent to an ANC/MPA ratio less than 1, and a negative NAPP is equivalent to an ANC/MPA ratio greater than 1. A NAPP of zero is equivalent to an ANC/MPA ratio of 1. The purpose of the ANC/MPA ratio is to provide an indication of the relative margin of safety (or lack thereof) within a material. Various ANC/MPA values are reported in the literature for indicating safe values for prevention of acid generation. These values typically range from 1 to 3. As a general rule, an ANC/MPA ratio of 2 or more generally signifies that there is a high probability that the material will remain circum-neutral in pH. This rule does not apply to mixed or blended materials (such as limestone blended waste rock), which must be assessed independently. Acid-Base Account Plot Sulphur and ANC data are often presented graphically in a format similar to that shown in Figure 1. This figure includes a line indicating the division between NAPP positive samples from NAPP negative samples. Also shown are lines corresponding to ANC/MPA ratios of 2 and 3.
AMIRA P387A Project ARD Test Handbook
Ian Wark Research Institute Page A- 5 Environmental Geochemistry International Pty Ltd
0
50
100
150
0 1 2 3 4 5
Total S (%)
ANC/MPA=3 ANC/MPA=2
+ve NAPP
-ve NAPP
NAPP=0
Figure 1. Acid-base account (ABA) plot
Single Addition NAG Test The single addition NAG test is used in association with the NAPP to classify the acid generating potential of a sample. The NAG test involves reaction of a sample with hydrogen peroxide to rapidly oxidise any sulphide minerals contained within a sample. During the NAG test, acid generation and acid neutralisation reactions can occur simultaneously. Therefore, the end result represents a direct measurement of the net amount of acid generated by the sample. This value is commonly referred to as the NAG capacity and is expressed in the same units as NAPP, that is kg H2SO4/t. Several variations of the NAG test have been developed to accommodate the wide geochemical variability of mine waste materials. The three main NAG test procedures are the single addition NAG test, the sequential NAG test, and the kinetic NAG test. The single addition NAG test involves the addition of 250 mL of 15% hydrogen peroxide to 2.5 gm of sample. The peroxide is allowed to react with the sample overnight and the following day the sample is gently heated to accelerate the oxidation of any remaining sulphides, then vigorously boiled for several minutes to decompose residual peroxide. When cool, the pH and acidity of the NAG liquor are measured. The acidity of the liquor is then used to estimate the net amount of acid produced per unit weight of sample. An indication of the form of the acidity is provided by initially titrating the NAG liquor to pH 4.5, then continuing the titration up to pH 7. The titration va lue at pH 4.5 includes acidity due to free acid (i.e. H2SO4) as well as soluble iron and aluminium. The titration value at pH 7 also includes metallic ions that precipitate as hydroxides at pH’s between 4.5 and 7. Investigations as part of the P387A project show that samples with pyritic-S contents of <1% were completely oxidised in the single addition NAG test, but those above 1% S were not. This
AMIRA P387A Project ARD Test Handbook
Ian Wark Research Institute Page A- 6 Environmental Geochemistry International Pty Ltd
may lead to some underestimation of acid forming potentials in high S samples, and low NAG4.5/NAPP ratios (<0.5). This effect is caused by catalytic breakdown of the hydrogen peroxide due to reactions with sulphide surfaces and oxidation products before it has had a chance to oxidise all of the sulphides in a sample. To overcome this limitation, a sequential NAG test is often carried out. The single addition NAG test may not reliably reflect the acid forming potential of sulphidic samples (>1% S) with high contents of readily available neutralising minerals. Since sulphide oxidation may only be partial in these samples (see paragraph above), any acid released would react quickly with the readily available neutralising capacity to produce pH neutral to alkaline NAG solutions. A number of NAG stages may be required before the neutralising component is consumed (see sequential NAG Test). High organic matter contents (>5-7% TOC) may also interfere with the NAG test, due to the reaction of hydrogen peroxide with organic matter to produce organic acids. In samples with low sulphide-S contents (<1%S), organic matter acidity may give a false measure of the sulphidic acid potential. In pyritic samples with high organic matter content, the oxidation of pyrite appears to occur preferentially to organic matter oxidation, and the acid produced is a better reflection of the ARD potential. Note that organic acidity produced in the NAG test does not occur under atmospheric oxidation. Measurement and comparison of SO4 and total organic carbon (TOC) in the NAG solution can help resolve the relative contribution of sulphide verses organic matter derived acid to the total NAG acidity measured. 2.2 pH1:2 and Electrical Conductivity (EC)1:2 The pH1:2 and electrical conductivity (EC)1:2 of a sample is determined by equilibrating the sample in deionised water for 12 –16 hours (or overnight), at a solid to water ratio of 1:2 (w/w). This gives an indication of the inherent acidity and salinity of the waste material when initially exposed in a waste emplacement area. A material categorised non acid forming (NAF) may still have existing acidity and salinity risks that make it unsuitable for surface or uncontrolled placement due to potential effects on drainage and vegetation.
AMIRA P387A Project ARD Test Handbook
Ian Wark Research Institute Page A- 7 Environmental Geochemistry International Pty Ltd
2.3 Sample Classification Figure A1 (Appendix A) shows how the acid forming potential of a sample is classified on the basis of the S, ANC, NAPP and NAG test results into one of the following categories:
Figure 2 shows the format of the classification plot that is typically used for presentation of geochemical data. Marked on this plot are the quadrants representing the NAF, PAF and UC classifications.
1
2
3
4
5
6
7
8
9
10
11
12
-200 -150 -100 -50 0 50 100 150 200
NAPP kg H2SO4/t
NAF
PAFUC
UC
Figure 2 Geochemical classification plot
Non-acid forming (NAF) A sample classified as NAF may, or may not, have a significant sulphur content but the availability of ANC within the sample is more than adequate to neutralise all the acid that theoretically could be produced by any contained sulphide minerals. As such, material classified as NAF is considered unlikely to be a source of acidic drainage. A sample is usually defined as NAF when it has a negative NAPP negative and the final NAG pH = 4.5. Where there is significant total S (>1%), more detailed investigation may be required to confirm that the ANC measured is available at the same rates as acid production through sulphide oxidation.
AMIRA P387A Project ARD Test Handbook
Ian Wark Research Institute Page A- 8 Environmental Geochemistry International Pty Ltd
Potentially acid forming (PAF) A sample classified as PAF always has a significant sulphur content, the acid generating potential of which exceeds the inherent acid neutralising capacity of the material. This means there is a high risk that such a material, even if pH circum-neutral when freshly mined or processed, could oxidise and generate acidic drainage when exposed to atmospheric conditions. A sample is usually defined as PAF when it has a positive NAPP and a final NAGpH < 4.5. Uncertain (UC) An uncertain classification is used when there is an apparent conflict between the NAPP and NAG results (i.e. when the NAPP is positive and NAGpH > 4.5, or when the NAPP is negative and NAGpH = 4.5). As mentioned previously, by using both NAPP and NAG tests the risk of misclassification is significantly reduced and samples with an uncertain classification are highlighted. Uncertain samples are generally given a tentative classification that is shown in brackets e.g. UC(NAF). Sample with high organic material contents are also classified uncertain since NAG solution acidity may reflect organic acidity, rather than sulphide derived acidity. Uncertain samples require more detailed investigation to determine the acid potential.
3.0 Detailed Static and Kinetic Tests Follow up testing is used to provide better definition of the ARD characteristics of samples and also to resolve issues of uncertainty identified in ARD screening tests. Detailed geochemical tests commonly used are as follows:
• Sequential NAG
• Kinetic NAG
• Acid Buffering Characteristic Curve (ABCC)
• Mineralogy
• Free Draining Leach Column
These tests may be used in various combinations depending on the nature of the sample material and what information is required. Each of these tests are described below and their application discussed. Methods for sequential NAG, kinetic NAG, ABCC and free draining leach column tests are appended for reference.
AMIRA P387A Project ARD Test Handbook
Ian Wark Research Institute Page A- 9 Environmental Geochemistry International Pty Ltd
3.1 Sequential NAG Test When testing samples with high sulphide content it is not uncommon for oxidation to be incomplete in the single addition NAG test. This can sometimes occur when there is catalytic breakdown of the hydrogen peroxide before it has had a chance to oxidise all of the sulphides in a sample. To overcome this limitation, a multi-stage sequential NAG test is often carried out. This test may also be used to assess the relative geochemical lag of PAF samples with high ANC. The sequential NAG test is a multi-stage procedure involving a series of single addition NAG tests on the one sample (i.e. 2.5 g of sample is reacted two or more times with 250 mL aliquots of 15% hydrogen peroxide). At the end of each stage, the sample is filtered and the solution is used for measurement of NAGpH and NAG capacity. The NAG test is then repeated on the solid residue. The cycle is repeated until such time that there is no further catalytic decomposition of the peroxide, or when the NAGpH is greater than pH 4.5. The overall NAG capacity of the sample is then determined by summing the individual acid capacities from each stage. The number of stages required before a sample turns acid provides a guide to the length of geochemical lag. This test is recommended in situations where the single addition NAG/NAPP ratio is low (<0.5), to obtain a total acidity once most sulphide has been oxidised. Analysis of sulphate in the NAG solutions is a useful way to check that all or most contained S has been oxidised and released into solution. In such a case if the total sequential NAG/NAPP ratio is still low, and all S has been accounted for, it indicates the presence of non-acid forming sulphur species (such as primary sulphates, organic S, elemental S, and non-acid forming sulphides) or different reaction mechanisms. Sequential NAG is also used where better definition of the total acid forming potential is required. Organic material may interfere with the sequential NAG test in the same way as the single addition NAG test. The total sequential NAG acidity of a sample with high organic material content may include a significant contribution of organic acid in addition to sulphide derived acid. Measurement and comparison of SO4 and total organic carbon (TOC) in the sequential NAG solution can help resolve the relative contribution of sulphide verses organic matter derived acid to the total NAG acidity measured. 3.2 Kinetic NAG Test The kinetic NAG test is the same as the single addition NAG test except that the temperature, pH and sometimes EC of the liquor are recorded. Variations in these parameters during the test provide an indication of the kine tics of sulphide oxidation and acid generation during the test. This, in turn, can provide an insight into the behaviour of the material field under field conditions. For example, the pH trend gives an estimate of relative reactivity and may be related to prediction of lag times and oxidation rates similar to those measured in leach columns. Also, sulphidic samples commonly produce a temperature excursion during the NAG test due to the decomposition of the peroxide solution, catalysed by sulphide surfaces and/or oxidation products.
AMIRA P387A Project ARD Test Handbook
Ian Wark Research Institute Page A- 10 Environmental Geochemistry International Pty Ltd
Again, caution must be exercised with samples high in organic material content, since organic acid production in the NAG test will interfere with the sulphide oxidation kinetic signature. 3.3 Acid Buffering Characteristic Curve (ABCC) Test The Acid Buffering Characteristic Curve (ABCC) test involves slow titration of a sample with acid while continuously monitoring pH. This data provides an indication of the portion of ANC within a sample that is readily available for acid neutralisation. This test is useful in assessing whether a sulphidic sample with NAPP <0 and NAGpH = 4.5 has enough readily available carbonate to render it non acid producing. 3.4 Mineralogy Mineralogy can provide details on the species and crystal habit of S bearing and neutralising minerals indicated by other test methods. For example, the presence of significant framboidal or fine grained pyrite in a sample would imply rapid pyrite oxidation and acid production rates from materials represented by this sample. Not all sulphide species produce acid (e.g. galena, sphalerite, covellite, bornite and chalcocite do not release aid when oxidised), and determining the relative proportion of these sulphides in a sample would provide more detail on the acid potential. Identification of the neutralising species in a sample would help to assess the availability of the ANC measured. Mineralogy may also identify the existence of passivating rims that inhibit sulphide oxidation. Mineralogical techniques commonly used include optical mineralogy, scanning electron microscopy (SEM), micro-probe, automated micro-probe point counting techniques (such as QEM*SEM), x-ray diffraction (XRD), and bulk elemental/oxide determinations (such as ICP or XRF). 3.5 Leach Column Tests Leach columns are used to compliment the other geochemical investigations described above. Leach columns are normally loaded with 2-3 kg of crushed (not pulverised) waste rock or tailings, and subjected to wetting and drying cycles to encourage oxidation and flushing of oxidation products. Water flushed through the column sample is collected and analysed for a variety of parameters to provide information on a range of issues including sulphide reactivity, oxidation kinetics, metal solubility and the leaching behaviour of the test materials. Sub-samples of leached solids may also be geochemically and mineralogically tested to track changes in mineral constituents with time. The leach column test period varies depending on material characteristics and the investigation needs, usually the results are reviewed on a 6 monthly basis. The free draining leach column test is the most commonly used, although variations may be required for specific purposes. Because leach columns are time consuming and expensive on a sample to sample basis, the other
AMIRA P387A Project ARD Test Handbook
Ian Wark Research Institute Page A- 11 Environmental Geochemistry International Pty Ltd
geochemical test methods described above are normally carried out first to identify those samples most suitable for more detailed testing. Leach columns are run under the assumption that oxygen is freely available throughout the sample. Results of leachate analysis therefore give a measure of the relative reactivity of a given sample under atmospheric oxygen concentrations. If a column sample is too wet, then the assumption that oxygen is freely available is not valid. If a sample is too dry, secondary mineral solubility comes into effect, so that leachate collected will significantly underestimate sulphide reaction rates. The leach column operation is designed to achieve a weekly wet-dry cycle and a monthly flushing cycle. The sample is wetted by applying water to the surface of the column and leachate is collected through the funnel at the base of the column. Heat lamps are used to ensure drying of the sample between water applications. Water is applied each week in four weekly cycles. In the first 3 weeks of each cycle, water is applied at a rate of 100ml/kg. In the 4th and final week of the cycle a higher flushing rate of 400ml/kg is used. The flushing regime adopted is a compromise between operating dry to ensure oxidation takes place in the column, and operating wet to allow subsequent flushing of oxidised products into the leachate collection vessel.
AMIRA P387A Project ARD Test Handbook
Ian Wark Research Institute Page A- 1 Environmental Geochemistry International Pty Ltd
Figure A1: Flow Chart showing ARD screening tests, decision nodes and ARD rock type categories
Tailings or Waste Rock
Sample
Crushing and Splitting
(see Note 1)
Pulverise to -75µm
Total S
ANC Test
Single Addition NAG Test
NAPP Calculation
Sample Preparation Basic Screening Tools
pH1:2 and EC1:2
(see Note 2)
Categorise Sample
NAF(see Note 4)
Uncertain
Note 6: Further investigations are required to determine:-Classification of samples with conflicting NAPP and NAG results.-Magnitude of acid forming capacity for PAF samples with low NAG/NAPP ratios.-Availability of ANC for neutralisation of acid produced in samples with moderate to high S.-Acid potential of samples with high contents of organic matter.
NAPP positive
PAF Low Capacity
(see Note 5)
Uncertain
No
NAGpH less than
4.5
Yes
Further Investigation
and Re-Categorisation(see Note 6)
Yes
NAGpH less than
4.5
Yes
No
Note 2: pH and EC measurements provide a measure of immediately available acidity and salinity. This information may influence the final categorisation of the sample due to potential short term effects of a given material on rehabilitation, drainage etc. Measurements are best carried out on the crushed sample rather than the pulverised sample where possible.
PAF
Data Evaluation
Carbonaceous Sample
(see Note 3)
Note 3: The occurrence of organic compounds in some materials may interfere with NAG tests. In particular samples from coal deposits with more than about 5% TOC.
Note 4: Further evaluation is recommended to confirm classification on samples with High Sulphur and High ANC. There is a risk of incomplete sulphide oxidation during the NAG test on high sulphur samples Selected samples of High S and High ANC material should be subjected to Sequential NAG and ABCC determinations. Samples with more than 2% S and ANC/MPA ratios less than 1.5 should be evaluated.
NoNAG4.5
greaterthan 5
Yes
YesNo
No
Note 1: Sample preparation may include crushing to nominal -4mm and splitting of a representative sub sample from the bulk. Core and rock samples require crushing before splitting. Drill chips and tailings do not normally require crushing.
Note 5: Further investigation is recommended to determine acid forming capacities of samples with high S values(>1%S) and low NAG/NAPP ratios (<0.5). Low NAG/NAPP ratios indicate either non-acid producing S forms or incomplete oxidation in the NAG test, and additional testing would be required to determine which applies in a particular case.
AMIRA P387A Project ARD Test Handbook – Appendix B
Ian Wark Research Institute Page: B - 1 EGi Pty Ltd
Appendix B
Geochemical Classification of Uncertain Category Samples –
A Case Study This appendix outlines how the procedures described in this booklet may be used to better categorise waste rock samples into a geochemical classification when the initial basic screening tools lead to uncertain classification. This is done by means of 3 examples which were part of the case studies examined during the P387A project. These examples demonstrate the use of techniques such as kinetic and sequential NAG tests, column leach tests, kinetic path modelling and a detailed analysis of the mineralogy to give more precise definition to a particular waste rock sample’s behaviour under oxidative conditions. The 3 samples used in these examples were waste rock obtained from either drill core sampling or air blast drilling. The results from the basic screening tests (see Figure A1 Appendix A) for the 3 samples are shown in Tables B1 and B2. Samples A and B are examples of materials with high S content resulting in significantly positive NAPP values. However, both samples display a NAGpH value from the single addition NAG test significantly above 4.5. These appear to be conflicting results and the samples are classified as uncertain when only the basic screening tests are used. Further investigation is required to properly categorise these samples (see Figure A1 Appendix A). Sample C is an example of material which has a positive NAPP and a NAGpH less than 4.5. However, the NAG4.5 value for sample C is not greater than 5 kg/t H2SO4 and so the sample is classified as PAF Low Capacity. The NAG/NAPP ratio for this sample is 0.4 and so further testing is warranted to confirm the acid forming capacity of this material (see Figure A1 Appendix A).
Table B1
Sample Total S (%)
MPA (kg/t H2SO4)
ANC (kg/t H2SO4)
NAPP (kg/t H2SO4)
NAGpH Geochem Class
A 14.7 450 205 243 7.3 UC
B 6.6 202 124 78 6.3 UC
AMIRA P387A Project ARD Test Handbook – Appendix B
Ian Wark Research Institute Page: B - 2 EGi Pty Ltd
Table B2
Sample Total S (%)
MPA (kg/t
H2SO4)
ANC (kg/t
H2SO4)
NAPP (kg/t
H2SO4) NAGpH
NAG4.5 (kg/t
H2SO4) NAG/NAPP Geochem
Class
C 0.8 24 11 13 4.0 0.4 0.03
PAF – LC
Further testing
required
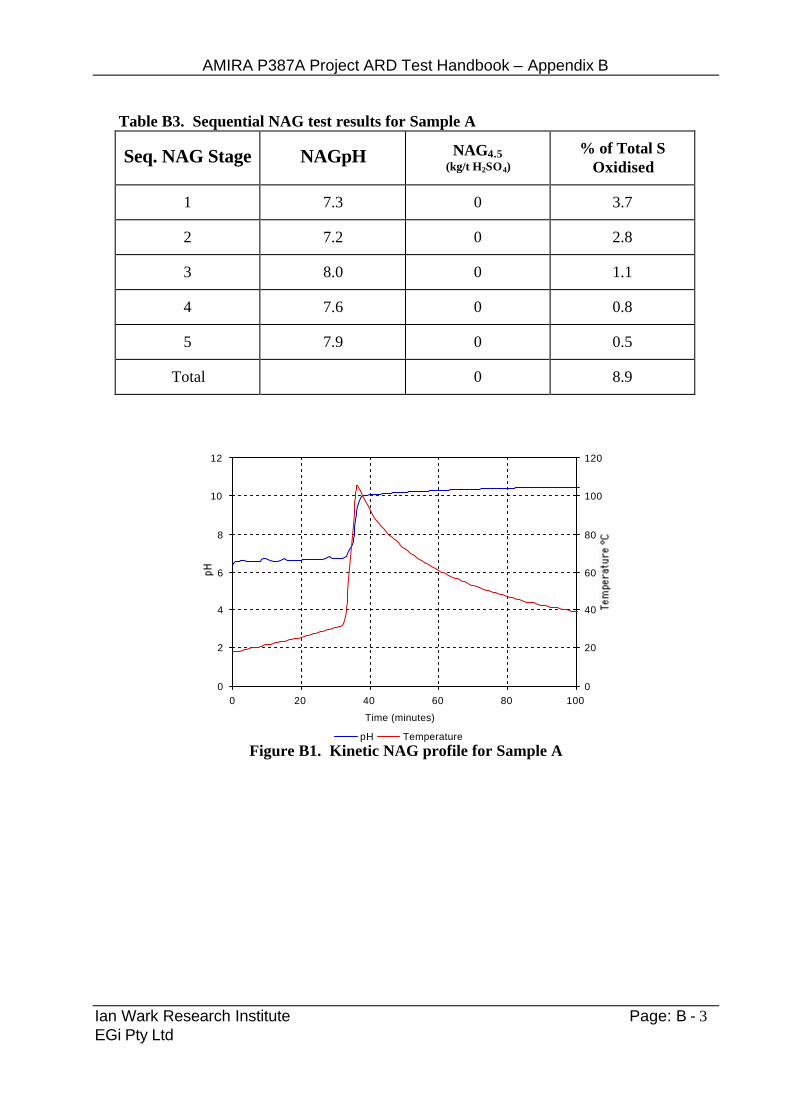
Sample A Further testing was carried out on Sample A because of the conflicting NAG and NAPP results. Included in this testing were sequential and kinetic NAG tests (see Appendix D Sections 4.2 and 4.3), the results of which are shown in Table B3 and Figure B1. The sequential NAG test shows that for all 5 stages of peroxide addition the NAG pH is well above 4.5. Monitoring of the sulphate in the NAG test solution shows that very little of the total sulphur in the sample has been oxidised under the accelerated oxidative conditions of the NAG test. The kinetic NAG test indicates that some oxidation is occurring resulting in metal dissolution and subsequent decomposition of the peroxide as evidenced by the large temperature increase. This temperature increase is accompanied by a significant rise in pH, indicative of accelerated dissolution of neutralising mineral(s) due to acid release. These results suggest that sample A contains reactive neutralising material which is available for neutralisation at a rate comparable to the rate of acid production (from sulphide oxidation), thus maintaining the high pH. The slowing of sulphate release with each sequential NAG stage indicates a slowing of sulphide reactivity, which in turn implies a very long lag time under atmospheric oxidative conditions before the ANC is consumed and acidic conditions develop. These test results do not allow definitive classification of the sample as NAF or PAF, but do suggest a very long delay before acidic drainage occurs if PAF. Column leach test results (see Figures B2 and B3) confirm the results from the sequential and kinetic NAG tests. Analysis of the column leachate shows a high pH is maintained over nearly 200 weeks and that this is a result of comparable sulphate release and CaCO3 consumption rates. Column leachate test results also show that sulphide oxidation is very slow, with only 1.4% of the sulphur oxidised after nearly 200 weeks. The slow rate of sulphide oxidation and carbonate consumption in the column test indicates decades (+100 years?) before potential formation of acid conditions. Continuing the column test until a definitive PAF or NAF classification is obtained is clearly impractical.
AMIRA P387A Project ARD Test Handbook – Appendix B
Ian Wark Research Institute Page: B - 3 EGi Pty Ltd
Table B3. Sequential NAG test results for Sample A
Seq. NAG Stage NAGpH NAG4.5 (kg/t H2SO4)
% of Total S Oxidised
1 7.3 0 3.7
2 7.2 0 2.8
3 8.0 0 1.1
4 7.6 0 0.8
5 7.9 0 0.5
Total 0 8.9
0
2
4
6
8
10
12
0 20 40 60 80 100
Time (minutes)
0
20
40
60
80
100
120
pH Temperature Figure B1. Kinetic NAG profile for Sample A
AMIRA P387A Project ARD Test Handbook – Appendix B
Ian Wark Research Institute Page: B - 4 EGi Pty Ltd
1.0
3.0
5.0
7.0
9.0
0 50 100 150 200
Time (weeks)
pH
Figure B2. Column leachate pH profile for Sample A
0
30
60
90
120
150
0 50 100 150 200Time (weeks)
SO
4/C
aCO
3 (m
g/kg
/wk)
SO4 Release Rate
CaCO3 (equiv) Consumption Rate
Figure B3. Column leachate dissolution profiles for Sample A Results from sequential and kinetic NAG tests and column leach testing indicated that the conflicting NAG and NAPP results arise from incomplete oxidation of the sulphide during NAG and column testing. The NAPP value assumes that all sulphur is pyritic and complete oxidation occurs. However, both the NAG and column tests do not give anything like complete sulphide oxidation and therefore will not give a good estimate of the potential acid generating capacity of the sample. In order to further understand the conflicting NAPP and NAG results, a detailed investigation of the mineralogy of sample A was undertaken. The mineralogy derived from XRD and XRF analyses is shown in Table B4. These data show that the majority of sulphide is present as pyrite with minor galena and sphalerite phases. This suggests that the MPA value based on total S (assuming all S is pyrite) will give a reasonable estimate of acid generation and that if the ANC
AMIRA P387A Project ARD Test Handbook – Appendix B
Ian Wark Research Institute Page: B - 5 EGi Pty Ltd
measurement gives a good estimate of available neutralising capacity, then the NAPP value will be reliable. The data in Table B4 also shows the presence of calcite, which will contribute about 140 kg/t of ANC out of a measured 205 kg/t. Therefore, there are insufficient carbonates to neutralise all the acid generated from complete oxidation of the pyrite in this sample. This is confirmed by kinetic path modelling, which indicates that after all the calcite has been consumed, only 45% of the pyrite will have been oxidised and subsequent oxidation will result in significant acid generation.
Table B4 Mineralogy for Sample A
Mineral Weight %
Pyrite 26
Sphalerite 5
Galena 2
Quartz 25
Illite 27
Pigeonite 1
Calcite 14
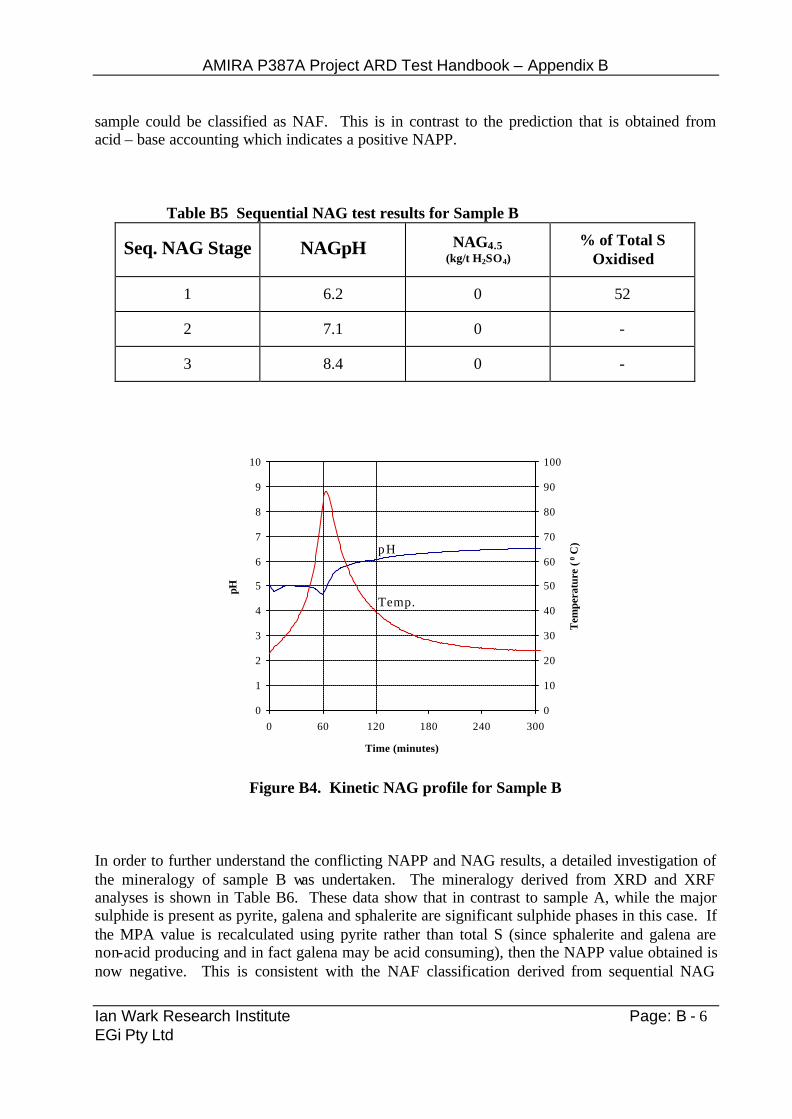
In conclusion, the application of kinetic and sequential NAG tests in conjunction with column leach tests, mineralogical analysis and kinetic path modelling has resolved the uncertain classification of sample A. These procedures indicate that the sample can be re-classified as PAF with a long lag to the on set of acidic drainage. Sample B Further testing was carried out on Sample B because of the conflicting NAG and NAPP results. Included in this testing were sequential and kinetic NAG tests (see Appendix D Sections 4.2 and 4.3), the results of which are shown in Table B5 and Figure B4. Unlike sample A, analysis of the sequential NAG solutions from sample B indicates significant sulphide oxidation (52% S oxidised in Stage 1), and yet the NAGpH remains high through 3 stages of testing. Once again, the temperature spike in the kinetic NAG indicates significant metal dissolution indicative of oxidation. These results suggest that in the case of sample B, the NAG test is giving a reasonable estimate of the acid generating capacity of the material and the
AMIRA P387A Project ARD Test Handbook – Appendix B
Ian Wark Research Institute Page: B - 6 EGi Pty Ltd
sample could be classified as NAF. This is in contrast to the prediction that is obtained from acid – base accounting which indicates a positive NAPP.
Table B5 Sequential NAG test results for Sample B
Seq. NAG Stage NAGpH NAG4.5 (kg/t H2SO4)
% of Total S Oxidised
1 6.2 0 52
2 7.1 0 -
3 8.4 0 -
0
1
2
3
4
5
6
7
8
9
10
0 60 120 180 240 300
Time (minutes)
pH
0
10
20
30
40
50
60
70
80
90
100
Tem
pera
ture
(0
C)
Temp.
pH
Figure B4. Kinetic NAG profile for Sample B
In order to further understand the conflicting NAPP and NAG results, a detailed investigation of the mineralogy of sample B was undertaken. The mineralogy derived from XRD and XRF analyses is shown in Table B6. These data show that in contrast to sample A, while the major sulphide is present as pyrite, galena and sphalerite are significant sulphide phases in this case. If the MPA value is recalculated using pyrite rather than total S (since sphalerite and galena are non-acid producing and in fact galena may be acid consuming), then the NAPP value obtained is now negative. This is consistent with the NAF classification derived from sequential NAG
AMIRA P387A Project ARD Test Handbook – Appendix B
Ian Wark Research Institute Page: B - 7 EGi Pty Ltd
testing and resolves the apparent conflict between NAG and NAPP values obtained using the basic screening tests only.
Table B6 Mineralogy for Sample B
Mineral Weight %
Pyrite 9
Sphalerite 6
Galena 2
Quartz 28
Hematite 7
Mica 39
Dolomite 3
Others 17
In conclusion, the application of kinetic and sequential NAG tests in conjunction with mineralogical analysis has resolved the uncertain classification of sample A. These procedures indicate that the sample can be re-classified as NAF. Sample C Sample C is an example of material which is classified as PAF Low Capacity. The NAG/NAPP ratio for this sample is 0.03 and so further testing is warranted to confirm the acid forming capacity of this material. As was the case for samples A and B, sample C was subjected to sequential and kinetic NAG tests to obtain a better understanding of the oxidative behaviour of this material. The results for these tests are shown in Table B7 and Figure B5. The sequential NAG results show that most acidity was released in Stage 2, indicating a signifcant lag in acid production. After 7 stages only 74% of the sulphur is oxidised, indicating that either pyrite oxidation had been inhibited, or that the total S measured was partly present as non-pyritic forms. The total sequential NAG acidity was 5 kg H2SO4/t, suggesting the NAPP value may overestimate the acid generating capacity of this sample.
AMIRA P387A Project ARD Test Handbook – Appendix B
Ian Wark Research Institute Page: B - 8 EGi Pty Ltd
The kinetic NAG data shown in Figure B5 shows a lag time of 400 minutes for a unit drop in the pH. Based on the NAG to column correlation that has been established, this suggests it will take more than 10 years for the leach column effluent to become acidic. The initial column leach data shown in Figure B6 supports the long lag to acid generating conditions for sample C. As was shown for sample A, analysis of the column leachate indicates that dissolution of carbonate at a rate similar to sulphide oxidation (Figure B7) is the reason for the non-acidic nature of the water drained from this column.
Table B7. Sequential NAG test results for Sample C
Seq. NAG Stage NAGpH NAG4.5 (kg/t H2SO4)
% of Total S Oxidised
1 4.0 0.35 37
2 3.0 3.0 22
3 3.4 1.0 10
4 4.1 0.20 3
5 4.1 0.20 1.5
6 4.4 0.10 0.4
7 4.5 0 0
Total 5 74
0
1
2
3
4
5
6
7
8
9
10
0 60 120 180 240 300 360 420 480 540 600 660
Time (minutes)
pH
0
10
20
30
40
50
60
70
80
90
100
Tem
pera
ture
(0 C
)
Temp.
pH
AMIRA P387A Project ARD Test Handbook – Appendix B
Ian Wark Research Institute Page: B - 9 EGi Pty Ltd
Figure B5. Kinetic NAG profile for Sample C
0.0
2.0
4.0
6.0
8.0
0 15 30 45 60
Time (weeks)
pH
Figure B6. Column leachate pH profile for Sample C
0
4
8
12
16
20
0 5 10 15 20 25 30 35 40
Time (months)
Rel
ease
Rat
e (m
g/kg
/wk)
SO4 Release Rate
CaCO3 (equiv)Release Rate
Figure B7. Column leachate dissolution profiles for Sample C
The mineralogy of sample C was also investigated in some detail. The results showed that both pyrite and chalcopyrite were present as the major sulphides in this material. Since chalcopyrite does not appear to oxidise through to sulphate to the same extent as pyrite, there is less acid generated from samples containing chalcopyrite. As a result, the sequential NAG4.5 value is lower than if all the sulphide had been pyrite, and so the NAG/NAPP ratio is lower than would be expected for samples containing pyrite only. In conclusion, the application of kinetic and sequential NAG tests in conjunction with mineralogical analysis and column leach testing has resolved the low NAG/NAPP ratio for sample C and confirmed the PAF – low capacity classification. These procedures indicate a long lag time prior to acid formation during oxidation of material of the type represented by sample C.
AMIRA P387A Project ARD Test Handbook – Appendix C
Ian Wark Research Institute Page: C - 1 EGi Pty Ltd
Appendix C
Acid Neutralising Capacity
Test Method Revision April 2000 The Acid Neutralising Capacity (ANC) of mine waste material is a measure of the buffering capacity or inherent neutralising ability of the material (often due to the presence of carbonate minerals). This is determined by the addition of a known amount of standardised hydrochloric acid (HCl) to an accurately weighed sample, allowing the sample time to react (with heating), then back-titrating the mixture with standardised sodium hydroxide (NaOH) to determine the amount of HCl consumed by reaction with the sample. The method presented below is adapted from Sobek, A.A., Schuller, W.A., Freeman, J.R., and Smith, R.M., 1978. Field and Laboratory Methods Applicable to Overburdens and Minesoils. p.p. 47-50. U.S. Environmental Protection Agency, Cincinati, Ohio, 45268. EPA-600/2-78-054. Determination of Acid Neutralising Capacity Step 1
To determine the amount and concentration of acid to be used in the analysis, the sample is given a "Fizz Rating". This is achieved by placing a small amount of pulverised sample (approximately 0.5 g) on a ceramic plate. One or two drops of 1:3 HCl (approximately 8% HCl) is then added to the sample. The presence of CaCO3 is indicated by a bubbling or audible "fizz" (effervescence). A rating is then given to the scale of reaction obtained as indicated in Table C1.
Table C1: "Fizz Ratings" and Associated Acid Quantities and Concentrations to be used in the ANC Determination.
Reaction Fizz HCl NaOH Rating Molarity Vol. Molarity (M) (ml) (M) No Reaction 0 0.5 4 0.1 Slight Reaction 1 0.5 8 0.1 Moderate Reaction 2 0.5 20 0.5 Strong Reaction 3 0.5 40 0.5 Very strong reaction 4 1.0 40 0.5 5* 1.0 60 0.5 *5 is used for very high ANC material (> 400 kgH2SO4/t) e.g. limestone
AMIRA P387A Project ARD Test Handbook – Appendix C
Ian Wark Research Institute Page: C - 2 EGi Pty Ltd
Step 2
Weigh 2.00 grams of air dried pulverised sample into a clean, dry 250 ml Erlenmeyer flask or beaker. Carefully pipette the required amount of HCl (as indicated in Table C1) into the beaker and add approximately 20 ml of deionised (or distilled) water. Also prepare blanks (in duplicate) by pipetting the same volume and concentration of acid into clean beakers containing no sample and add approximately 20 ml of deionised water. Blanks must be run for each volume and/or concentration of acid used (i.e for each Fizz Rating used).
Step 3
Place beakers (covered by a watchglass) in a water bath (or hot plate) and heat to 80 to 90 oC, swirling the beaker occasionally for 1 to 2 hours or until reaction is complete. Note: Reaction is complete when no gas evolution is evident and the particles settle evenly over the bottom of the flask. DO NOT LET THE FLASKS EVAPORATE TO DRYNESS.
Step 4
Allow the beaker to cool to room temperature. Then add deionised water to give a total volume of approximately 125 ml and measure the pH of the mixture. If the pH is in the range 0.8 to 1.5, then proceed with the titration (Step 5). If the pH is higher than 1.5, then additional acid is required (except when the test is being run at a fizz rating of 0). For all other fizz ratings (i.e. 1 through 5), if the pH is greater than 1.5 then either additional acid needs to be added to the sample so that the total amount added is equivalent to the next highest fizz rating or the test needs to be re-started on a new sub-sample using the next highest fizz rating. If the pH of the mixture is less than pH 0.8, then too much acid may have been added, except when the test is being run at a fizz rating of 5. In such cases it recommended to repeat the test using the next lowest fizz rating. REFER TO NOTE at the end of the method for further information on acid concentration and volume to use.
Step 5
Titrate against standardised Sodium Hydroxide (NaOH) solution (using molarity of NaOH listed in Table C1) with constant mixing. Interrupt the titration near pH 5 and add 2 drops of 30% H2O2 to oxidise any dissolved ferrous ion. Continue titration to pH 7.0 and record volume of NaOH added. Titrate the "blank" using NaOH as indicated in Table C1. Run duplicates on every fifth sample.
AMIRA P387A Project ARD Test Handbook – Appendix C
Ian Wark Research Institute Page: C - 3 EGi Pty Ltd
Calculation of ANC ANC = [Y x MHCl / wt] x C. Where: Y = (Vol. of HCl added) - (Vol. of NaOH titrated x B) B = (Vol. of HCI in blank) / (Vol. of NaOH titrated in blank) MHCl = Molarity of HCl wt = Sample weight in grams C = Conversion factor C = 49.0 (to calculate kg H2SO4/t) C = 5.0 (to calculate % CaCO3 equivalent) NOTE: The recommended use of upper and low pH limits will provide a guide to correct fizz rating selection at an early stage in the ANC determination. As such, this should reduce the number of samples that may need to be repeated. However, as a further check on whether the correct amount of acid has been added to the sample, the following is recommended. At the end of the titration, check whether the ANC result for the sample is within the limits shown on Table C2.
Table C2: Recommended ANC Ranges for Each Fizz Rating
Fizz Rating 0 1 2 3 4 5
Lower limit for ANC - 10 40 100 200 400
Upper Limit for ANC 10 40 100 200 400 - If the ANC result for a sample is within the specified range for that fizz rating at which the test was conducted then it is likely that the correct amount of acid has been added. If the result is outside of the range, then it is recommended that the analysis is repeated at a different fizz rating. If the assay result is below the specified range then it is likely that too much acid was added in the original test and the error associated with the result could be unacceptably high. Therefore, the assay should be repeated at a lower fizz rating. If the assay result is above the specified range then too little acid may have been added in the original test and therefore the ANC may have been under-estimated. In this case the assay should be repeated at a higher fizz rating.
AMIRA P387A Project ARD Test Handbook – Appendix D
Ian Wark Research Institute Page: D - 1 EGi Pty Ltd
Appendix D
Net Acid Generation (NAG) Test Procedures
(February 2002)
1.0 Introduction Environmental Geochemistry International (EGi) has been actively involved in the development of the net acid generation (NAG) test procedure since 1986. Updates and refinements to the procedure are on-going as the findings of current research and experience with different rock types, mine sites and mineralogy are obtained. The NAG test involves the addition of a solution of hydrogen peroxide to a prepared sample of mine rock or process residue to oxidise contained reactive sulphides. This is followed by measurement of the pH of the reaction solution and titration of any net acidity produced by the acid generation and neutralisation reactions occurring in the sample. Variations of the static NAG test procedure are appropriate for laboratory and field use to provide the level of detail required for a particular site or situation. This can range from a detailed waste rock classification program to routine operational monitoring for simply identifying potentially acid forming (PAF) and non-acid forming (NAF) material types. The NAG test is a simple and rapid procedure suitable for field use and operational monitoring. It is one of several tests available to help in the evaluation of the acid potential of a mine rock or mineral processing residue. The NAG test should only be used as a stand-alone test after it has been calibrated for a particular site. As a minimum, the net acid producing potential (NAPP) should be calculated and the sulphide and carbonate mineralogy should be understood. This document addresses procedures for single addition, kinetic and sequential NAG tests. 2.0 Sample Preparation NAG tests can be carried out on samples of drill-core (both diamond and percussion) bulk rock samples and blast hole cuttings. Large particle sized samples should initially be crushed to nominal 4 mm then a representative sub-sample taken. The sub-sample should then be pulverised to approximately 200 Mesh (<75µm). For routine field monitoring, the sample preparation requirements may be simplified depending on site specific mineralogical characteristics. The sample preparation procedure should be clearly described on the result report.
AMIRA P387A Project ARD Test Handbook – Appendix D
Ian Wark Research Institute Page: D - 2 EGi Pty Ltd
3.0 Reagents Sodium Hydroxide (NaOH) - 0.10 M and 0.50 M Standardised Solutions Hydrogen Peroxide (H2O2) - 'Analar' Analytical Reagent 30% w/v (100 V), or equivalent,
diluted 1:1 with deionised water to 15%. NOTE: The pH of hydrogen peroxide can vary widely due to the presence of stabilising
agents (e.g. phosphoric acid) in some brands. These agents can seriously affect the NAG test result.
The pH of the 15% hydrogen peroxide solution should be checked prior to use to
ensure it is greater than or equal to pH 4.5. If the pH is less than 4.5 then add dilute NaOH until the pH is greater than 4.5. To adjust the pH use a NaOH solution made up by adding 1 g NaOH to 100 ml of deionised water. Aim for a pH of 4.5 and not greater than 6.0. Record the pH of the H2O2 reagent for each batch.
4.0 NAG Test Methods 4.1 Single Addition NAG The single addition NAG test is suitable for samples with total sulphide sulphur contents less than about 1.5%S and with low concentrations of metals such as copper which can catalyse the decomposition of hydrogen peroxide. The single addition NAG test is also suitable for field operational monitoring provided it has been calibrated with NAPP and Sequential NAG test procedures (see sections 4.2 and 4.3). Single Addition NAG Procedure follows:
a) Accurately weigh approximately 2.5 gram of pulverised sample into a 500 ml conical beaker.
b) Use a 250 ml graduated cylinder to measure 250 ml of a solution of 15% H2O2
(30% H2O2 diluted 1:1 with deionised or distilled water) and carefully add the hydrogen peroxide to the conical flask.
Note: The hydrogen peroxide should be at room temperature before commencing
the test.
c) Place a watchglass on top of the beaker and place the beaker in a fume hood or well ventilated area.
d) Allow the sample to react until 'boiling' or effervescence ceases. This may require
the sample to be left overnight, at longest.
AMIRA P387A Project ARD Test Handbook – Appendix D
Ian Wark Research Institute Page: D - 3 EGi Pty Ltd
Note: The NAG reaction can be vigorous and NAG solutions can “boil-over” if the
reaction is too rapid. e) After the reaction, place the beaker on a hot plate and gently heat the sample until
effervescence stops or for a minimum of 2 hours. Note: Do not allow the sample to boil dry. Add deionised water as required to
maintain the volume approximately constant. f) Allow the sample to cool to room temperature. g) Rinse any sample that has adhered to sides of flask down into the solution using
deionised water. Add deionised water to give a final volume of 250 mL. h) Record the pH of the solution. This pH measurement is referred to as the NAGpH. i) Titrate the solution to pH 4.5 and 7.0, while stirring, with the appropriate NaOH
conc. based on NAGpH as follows:
when NAGpH is > 2 Titrate with 0.10 M NaOH when NAGpH is = 2 Titrate with 0.50 M NaOH Note: Titration to both pH 4.5 and 7.0 is recommended to assist with the
interpretation of results. Titration to pH 4.5 accounts for acidity due to Fe, Al and most of the hydrogen ion. Any additional acidity accounted for in titration between pH 4.5 and pH 7 is usually indicative of soluble metals such as Cu and Zn.
4.2 Kinetic NAG Test To obtain information on the acid generation rate of a sample, the pH and temperature of the NAG liquor is monitored and logged during the single addition NAG test. The reaction kinetics are influenced by the starting temperature of reagents. It is therefore recommended that the starting temperature of the hydrogen peroxide is 20 oC ± 2 oC when carrying out a kinetic NAG test. The kinetic NAG test procedure has not been standardised as yet and the interpretation of results with respect to predicting the lag period, must be carried out by an experienced person. 4.3 Sequential NAG The sequential NAG test is used to obtain the maximum NAG value and may need to be used if the single addition NAG to NAPP ratio is low. This procedure is time consuming and not suitable for routine use but is recommended for investigation of selected samples during initial characterisation work and as part of any site calibration work. The procedure is as follows:
a) Accurately weigh approximately 2.5 gram of pulverised sample into a 500 ml conical beaker.
AMIRA P387A Project ARD Test Handbook – Appendix D
Ian Wark Research Institute Page: D - 4 EGi Pty Ltd
b) Use a 250 ml graduated cylinder to measure 250 ml of a solution of 15% H2O2 (30% H2O2 diluted 1:1 with deionised or distilled water) and carefully add the hydrogen peroxide to the conical flask
Note: The hydrogen peroxide should be at room temperature before commencing
the test. c) Place a watch glass on top of the beaker and place the beaker in a fume hood or well
ventilated area. c) Allow the sample to react for approximately 2 hours or until 'boiling' or
effervescence ceases. Note: The NAG reaction can be vigorous and NAG solutions can “boil-over” if the reaction is too rapid.
e) After the reaction, place the beaker on a hot plate and gently heat the sample until
effervescence stops or for approximately 1.5 hours. The hotplate temperature should be between 150 to 200oC.
Note: Do not allow the sample to boil dry. Add deionised water as required to
maintain the volume approximately constant. f) Allow the sample to cool to room temperature. g) Measure the pH and EC of the sample, then filter the sample. Retain the resulting
NAG liquor, which is to be used in the titration step. h) Rinse the solid residue with deionised water to remove any excess, unreacted H2O2,
then filter the sample and discard the liquor.
i) Titrate (with continuous stirring) the NAG liquor to pH 4.5 and 7.0, with the appropriate NaOH conc. based on NAGpH as follows:
when NAGpH is > 2 Titrate with 0.10 M NaOH when NAGpH is = 2 Titrate with 0.50 M NaOH Stage 1 of the test has now been completed.
j) The test is then repeated using the solid residue from the first stage (i.e. repeat steps
b through to i). This is called Stage 2. Subsequent repeats will be called Stage 3, Stage 4 and so on.
k) Repeat Steps b) to j) until no further reaction is observed AND the filtered NAG
liquor has a pH greater than 4.5.
AMIRA P387A Project ARD Test Handbook – Appendix D
Ian Wark Research Institute Page: D - 5 EGi Pty Ltd
5.0 Calculation of NAG
The Net Acid Generation value is calculated by:
NAG = (49 x V x M) / W Where: NAG = net acid generation (kg H2SO4/tonne) V = volume of NaOH used in titration (ml) M = concentration of NaOH used in titration (moles/litre) W = weight of sample reacted (g)
If NAG value exceeds 25 kg H2SO4 per tonne, then the procedure may need to be repeated using a lower sample weight (i.e. 1.0 g sample). 6.0 Interpretation of Results An indication of the acid potential of a sample can be obtained from the NAGpH and NAG results as follows:
NAGpH NAG Acid Potential of Sample (kg H2SO4/t) ------------------------------------------------------------------------------------------------- = 4.5 0 Non-acid forming (NAF)
< 4.5 > 5* Potentially acid forming (PAF) *Note: the NAG criteria used to specify PAF-LC materials may vary from site to site. The PAF-LC classification is used to describe materials that may be amenable to treatment with lime or blending with NAF or acid consuming material. If the purpose of the test is to give a preliminary indication of the potential for acid generation or if the procedure has been fully calibrated for a particular mine site, it may not be necessary to carryout the titration step. Interpretation of the NAG values to pH 4.5 and 7.0 will depend on site specific factors and should be initially provided by a suitably qualified person.
AMIRA P387A Project ARD Test Handbook – Appendix E
Ian Wark Research Institute Page: E - 1 EGi Pty Ltd
Appendix E
pH1:2 and EC1:2 Test Procedures
(February 2002) 1.0 Introduction The paste pH/EC determined by equilibrating the sample in deionised water for approximately 12 hours at a solid to water ratio of 1:2 (w/w) and then measuring the pH and EC. This gives an indication of the inherent acidity and salinity of the waste material when initially exposed in a waste emplacement area. 2.0 Procedure
• To prepare the slurry, place 25g of pulverised (<75µm) sample into a beaker and slowly add 50 g of distilled water while continuously stirring.
• Allow the slurry to stand for at least 12 hours (or overnight).
• Measure the pH and electrical conductivity (EC) directly on the slurry.
AMIRA P387A Project ARD Test Handbook – Appendix F
Ian Wark Research Institute Page: F - 1 EGi Pty Ltd
Appendix F
Free Draining Leach Column Test Procedures
(Revised January 2002)
Introduction Leach columns are used to compliment environmental geochemical investigations on mine rock and waste materials. The leach columns provide information on a range of issues including sulphide reactivity, oxidation kinetics, metal solubility and the leaching behaviour of the test materials. The leach column test period varies depending on material characteristics and the investigation needs, usually the results are reviewed on a 6 monthly basis. The free draining leach column test is the most commonly used and provides information on sulphide reactivity, oxidation kinetics, and the leaching behaviour of materials under optimum oxidising conditions. The standard procedures for free draining leach column tests are provided below. Variations to these procedures are sometimes required in order to accommodate specific investigation or site condition needs. Concept The free draining leach column test utilises a plastic Buchner Funnel with an internal dimension of 175 mm in diameter and 100 mm high, giving a capacity of about 2.5 litres. Typically, this size funnel will hold about 2 to 2.5 kg of crushed rock, tailings or sediment. For larger sample sizes larger Buchner Funnels or drums can be used. Plate F1 shows an example of the conventiona l Buchner Funnel set-up and Figure F1 shows a typical configuration of the test set-up. The free draining leach column operation is designed to achieve a weekly wet-dry cycle and a monthly leaching cycle. The sample is wetted by applying the test solution, (usually deionised water), to the surface and leachate is collected through the funnel at the base. Heat lamps are used to ensure drying of the sample between test solution applications. Typically, the test solution is applied weekly and the leachates are collected monthly, however, sometimes this regime requires modification depending on materials characteristics and analytical requirements.
AMIRA P387A Project ARD Test Handbook – Appendix F
Ian Wark Research Institute Page: F - 2 EGi Pty Ltd
Sample Requirements The free draining leach column test can be used for most mine rock and waste materials. For the conventional Buchner Funnel set-up mine rock samples are usually crushed to –4 mm to allow sufficient material surface exposure. However, if coarser grained materials are to be included in the test larger funnels/drums will be required. Tailings can either be loaded dry or as a slurry with no preparation required. Some materials such as fine-grind tailings and materials with high clay content may not free drain and therefore are not suited to the free draining leach column test. Material Requirements
d) Buchner Funnels – Polypropylene, 2100mL capacity e) Filter paper – Coarse, 160 mm diameter f) Collection containers – 1 L g) Heat lamps – 150W Floodlight h) Shelving i) Power – AC j) Test solution (deionised water)
Method Set-up The conventional free draining leach column set-up is designed to suspend the columns over a collection vessel allowing leachate to freely drain through the test material. Heat lamps can also be installed above the leach columns to maintain a surface temperature of 30 to 35°C. The recommended column set-up is shown on Figure F1, however modifications to this design may be required based on the materials and space available. Features that must be incorporated into the design are as follows: 4. Allow easy access to the top and bottom shelves for watering and leachate collection. 5. Heat lamps are required to ensure that the columns dry-out between watering. As a guide, a
maximum of four 150W heat lamps is required for every ten leach columns (see Figure F1). 6. The minimum distance between shelves should be 270 mm and the maximum should be
320 mm.
AMIRA P387A Project ARD Test Handbook – Appendix F
Ian Wark Research Institute Page: F - 3 EGi Pty Ltd
7. The minimum distance between the upper shelf and the heat lamps should be 350 mm and the maximum should be 400 mm (this will vary depending on lamp wattage and room temperature).
8. The shelves should be designed to carry the weight of columns based on each column
having a maximum weight of 3 kg. 9. The diameter of holes to hold the columns should be between 120 - 130 mm. 10. The minimum horizontal distance between columns should be 200 mm. Column Loading • Place filter paper over the perforations at the base of the column. • Record weight of column with filter paper. • Load sample (usually 2.0 kg) into column and record weight. Care should be taken to
ensure that the sample does not lodge (or flow) between base of column and the filter paper. • For slurry samples, allow column to drain until all free water has been removed before
commencing water application. Heat Lamp Operation • Heat lamps are operated on a weekly cycle.
Day 1 to 5 - Switch heat lamps ON during daylight hours (approx. 8 to 10 hours) Day 6 to 7– Switch heat lamps OFF
• Switch heat lamps off at least 3 hours prior to water application to reduce surface
evaporation effects. • The heat lamps should maintain an operational temperature of 30 to 35 °C on the surface of
the columns. Test Solution Application • The test soultion is applied to the surface of the columns on weekly and monthly cycles
according to the application rates shown on the table below.
Weekly – Apply test solution on Day 5, after ‘Heat Lamp ON Phase’ Monthy – Apply test solution on Day 5 of Week 4, after ‘Heat Lamp ON Phase’
AMIRA P387A Project ARD Test Handbook – Appendix F
Ian Wark Research Institute Page: F - 4 EGi Pty Ltd
Test Solution Application
Week of Monthly Cycle
Rate
(per kg sample)
Total Volume
(2kg sample) 1
2
3
4
100 mL
100 mL
100 mL
400 mL
200 mL
200 mL
200 mL
800 mL
Leachate Collection and Analysis • Collect leachates on Day 1 (weekly cycle) of Week 1 (monthly cycle), before ‘Heat lamp
ON Phase’. • Record volume of leachate collected. • Routine leachate analyses should include pH, EC and Alkalinity/Acidity. • If elemental analyses are required a split of the leachate should be filtered (< 0.45 µm) and
preserved (acidified to pH < 2) prior to analysis.
AMIRA P387A Project ARD Test Handbook – Appendix F
Ian Wark Research Institute Page: F - 5 EGi Pty Ltd
Plate F1: Free draining leach column test set-up using Buchner Funnels.
AMIRA P387A Project ARD Test Handbook – Appendix F
Ian Wark Research Institute Page: F - 6 EGi Pty Ltd
Figure F1: Schematic diagram of a typical free draining leach column set-up using conventional Buchner
Funnels.
AMIRA P387A Project ARD Test Handbook – Appendix G
Ian Wark Research Institute Page: G - 1 EGi Pty Ltd
Appendix G
Acid Buffering Characteristic Curve (ABCC) Test
(February 2002)
1.0 Introduction The ABCC test involves slow titration of a sample with acid while continuously monitoring pH. This data provides an indication of what portion of the acid neutralising capacity (ANC) measured in a sample is readily available for acid neutralisation. 2.0 Procedure
• Accurately weigh 2.0g of pulverised (<75µm) sample and place in a 250ml conical flask and add 100ml of deionised water.
• Titrate sample to pH 2.5 with incremental additions of hydrochloric acid (see below for appropriate strength and increment of acid) while stirring continuously.
Suggested incremental additions and concentrations of HCl:
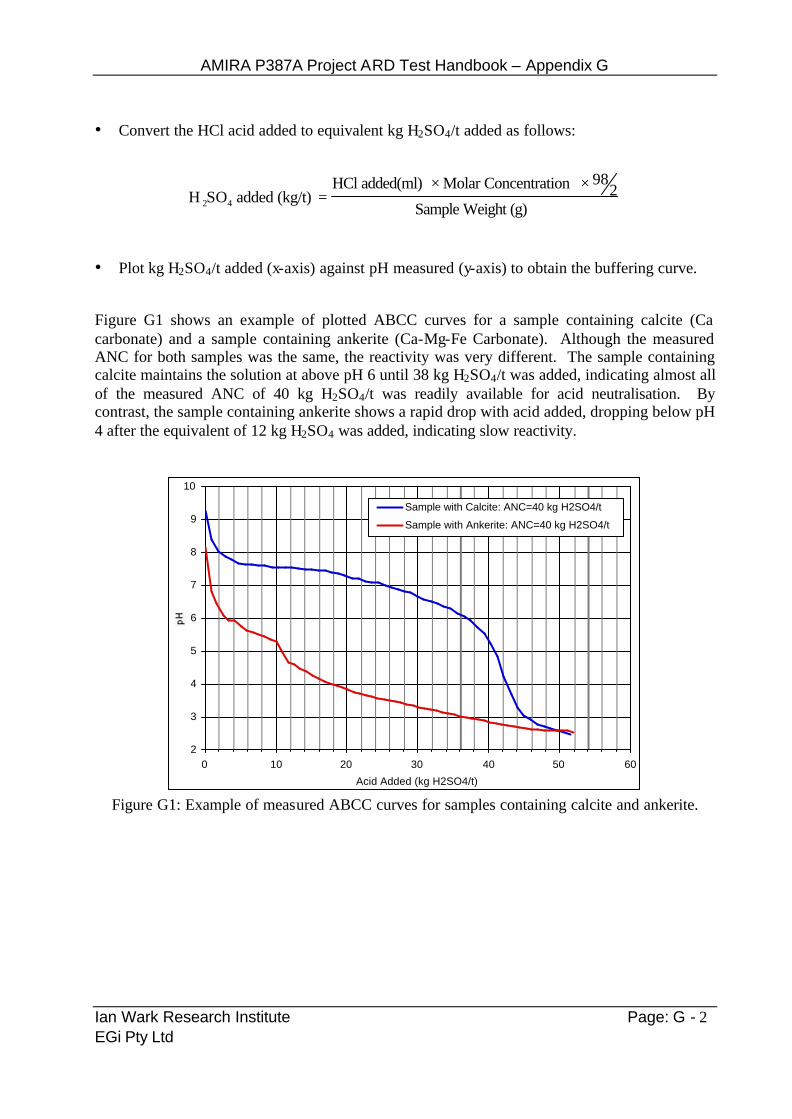
• Plot kg H2SO4/t added (x-axis) against pH measured (y-axis) to obtain the buffering curve.
Figure G1 shows an example of plotted ABCC curves for a sample containing calcite (Ca carbonate) and a sample containing ankerite (Ca-Mg-Fe Carbonate). Although the measured ANC for both samples was the same, the reactivity was very different. The sample containing calcite maintains the solution at above pH 6 until 38 kg H2SO4/t was added, indicating almost all of the measured ANC of 40 kg H2SO4/t was readily available for acid neutralisation. By contrast, the sample containing ankerite shows a rapid drop with acid added, dropping below pH 4 after the equivalent of 12 kg H2SO4 was added, indicating slow reactivity.
2
3
4
5
6
7
8
9
10
0 10 20 30 40 50 60
Acid Added (kg H2SO4/t)
Sample with Calcite: ANC=40 kg H2SO4/t
Sample with Ankerite: ANC=40 kg H2SO4/t
Figure G1: Example of measured ABCC curves for samples containing calcite and ankerite.