810 Available Online at www.ijscia.com | Volume 2 | Issue 5 | Sep-Oct 2021 Arduino based control of the Food and Water Conveyance Systems of a Refractance Window Dryer Raymonds Mutumba 1 , Julia Kigozi 1* , Peter Tumutegyereize 1 , Shaffic Ssenyimba 1 and John Muyonga 2 1 Department of Agricultural and Biosystems Engineering, Makerere University, Kampala, Uganda 2 Department of Food Technology and Nutrition, Makerere University, Kampala, Uganda *Corresponding author details: Julia Kigozi; [email protected]ABSTRACT A refractance window dryer with a 14.5kg/hr throughput capacity was developed to effectively dry food product of 3mm on the conveyor belt. For efficient dryer performance an automated system for the conveyor belt movement and water conveyance system was designed. The automated system comprised of an ARDUINO centered control system, an arrangement of sensors, water pump and the conveyor motor. A computer program was written in Arduino environment, successfully compiled and uploaded on to the controller board to process all commands. The system was first simulated successfully in ISIS Proteus environment and connected onto a bread board for testing before attaching the motor onto the main circuit board. Performance tests done at 85°C revealed that there was no movement of the belt as temperature built steadily from 31.19°C until it reached a temperature of 92.0°C in the boiler. The maximum recorded water temperature was 98.06°C and the system had an operating range of 95±3°C. Achieving this led to an automated food conveyance system that was reliable and ensured high product quality. The Arduino based system worked well and is recommended for the refractance window dryer and can be up scaled to a bigger similar machine. Keywords: dryer; automation; Arduino; food conveyance; water conveyance INTRODUCTION Food drying is one of the most important processes in the food industry, and it demands various levels of energy, to produce commercially dried food products of high quality (Mujumdar, 2007). To address the challenge of heat sensitive fruits, non-thermal technologies have been used which include ultrasound, pulsed electric fields and ultraviolet radiation which do not generate heat within the product (Raso and Barbosa, 2003) hence avoiding case hardening. Such technologies though, have a high capital cost of design and operation attached to them (Onwude et al., 2017) as compared to the refractance window dryer (RWD). In the design of an RWD, the food products are dried over a bed of hot water and conveyed over the hot water using a mylar conveyor belt. The food conveyance system comprises of all mechanisms and components of the dryer responsible for moving food product from the dryer inlet to the outlet. It is mainly comprised of the conveyor belt onto which food is placed, a conveyor motor that drives the belt and an idler conveyor pulley around which the belt goes. Automation the technology by which a process or procedure is accomplished without significant human assistance (Groover, 2008), is applied to equipment for increased efficient performance. To automate a process, power is required both to drive the process itself and to operate the program and control the system. Automation of the food conveyance system of the RWD dryer would require the development of a central controller system through which all signals and commands that operate the system are passed (Nurus, 2017). The controller receives signals from the food detection mechanism comprising an arrangement of infrared sensors that sense the presence or absence of food on the belt and sends a response to the controller board. The length and speed of the conveyor mechanism determines both the residence time and moisture content of the final product (Shirinbakhsh, 2017). The reliability, safety factor and increased efficiency of automated food conveyance systems make them more preferred in both small- and large-scale industrial applications. An effective food conveyance system would need to have a quick response to commands and every machine designed is required to have its own system depending of the unique operating parameters. MATERIALS AND METHODS The RWD synchronized conveyor belt and water pump systems. The RWD food conveyance system comprised of a temperature sensor which reads water temperature in the reservoir and sends signals to the controller that triggers the variable frequency drive as illustrated in FIGURE 1. The VFD is responsible for controlling the conveyor motor speed to any speed required during operation. International Journal of Scientific Advances ISSN: 2708-7972 Volume: 2 | Issue: 5 | Sep - Oct 2021 Available Online: www.ijscia.com DOI: 10.51542/ijscia.v2i5.25
Transcript
810 Available Online at www.ijscia.com | Volume 2 | Issue 5 | Sep-Oct 2021
Arduino based control of the Food and Water Conveyance Systems of a Refractance Window Dryer
Raymonds Mutumba1, Julia Kigozi1*, Peter Tumutegyereize1, Shaffic Ssenyimba1 and John Muyonga2
1Department of Agricultural and Biosystems Engineering,
Makerere University, Kampala, Uganda
2Department of Food Technology and Nutrition, Makerere University, Kampala, Uganda
ABSTRACT A refractance window dryer with a 14.5kg/hr throughput capacity was developed to effectively dry food product of 3mm on the conveyor belt. For efficient dryer performance an automated system for the conveyor belt movement and water conveyance system was designed. The automated system comprised of an ARDUINO centered control system, an arrangement of sensors, water pump and the conveyor motor. A computer program was written in Arduino environment, successfully compiled and uploaded on to the controller board to process all commands. The system was first simulated successfully in ISIS Proteus environment and connected onto a bread board for testing before attaching the motor onto the main circuit board. Performance tests done at 85°C revealed that there was no movement of the belt as temperature built steadily from 31.19°C until it reached a temperature of 92.0°C in the boiler. The maximum recorded water temperature was 98.06°C and the system had an operating range of 95±3°C. Achieving this led to an automated food conveyance system that was reliable and ensured high product quality. The Arduino based system worked well and is recommended for the refractance window dryer and can be up scaled to a bigger similar machine. Keywords: dryer; automation; Arduino; food conveyance; water conveyance INTRODUCTION Food drying is one of the most important processes in the food industry, and it demands various levels of energy, to produce commercially dried food products of high quality (Mujumdar, 2007). To address the challenge of heat sensitive fruits, non-thermal technologies have been used which include ultrasound, pulsed electric fields and ultraviolet radiation which do not generate heat within the product (Raso and Barbosa, 2003) hence avoiding case hardening. Such technologies though, have a high capital cost of design and operation attached to them (Onwude et al., 2017) as compared to the refractance window dryer (RWD). In the design of an RWD, the food products are dried over a bed of hot water and conveyed over the hot water using a mylar conveyor belt. The food conveyance system comprises of all mechanisms and components of the dryer responsible for moving food product from the dryer inlet to the outlet. It is mainly comprised of the conveyor belt onto which food is placed, a conveyor motor that drives the belt and an idler conveyor pulley around which the belt goes. Automation the technology by which a process or procedure is accomplished without significant human assistance (Groover, 2008), is applied to equipment for increased efficient performance. To automate a process, power is required both to drive the process itself and to operate the program and control the system. Automation of the food conveyance system of the RWD dryer would require
the development of a central controller system through which all signals and commands that operate the system are passed (Nurus, 2017). The controller receives signals from the food detection mechanism comprising an arrangement of infrared sensors that sense the presence or absence of food on the belt and sends a response to the controller board. The length and speed of the conveyor mechanism determines both the residence time and moisture content of the final product (Shirinbakhsh, 2017). The reliability, safety factor and increased efficiency of automated food conveyance systems make them more preferred in both small- and large-scale industrial applications. An effective food conveyance system would need to have a quick response to commands and every machine designed is required to have its own system depending of the unique operating parameters. MATERIALS AND METHODS The RWD synchronized conveyor belt and water pump systems. The RWD food conveyance system comprised of a temperature sensor which reads water temperature in the reservoir and sends signals to the controller that triggers the variable frequency drive as illustrated in FIGURE 1. The VFD is responsible for controlling the conveyor motor speed to any speed required during operation.
International Journal of Scientific Advances
ISSN: 2708-7972
Volume: 2 | Issue: 5 | Sep - Oct 2021 Available Online: www.ijscia.com
811 Available Online at www.ijscia.com | Volume 2 | Issue 5 | Sep-Oct 2021
International Journal of Scientific Advances ISSN: 2708-7972
FIGURE 1: The food conveyance system components The DS18B20 immersible temperature sensor was selected because of its high degree of accuracy, tolerance to high temperatures, and quick response to temperature variations. The 16X2 LCD and the Arduino Uno controller board were selected because they easier to program and are readily available in the local market. Compared to other programming boards like Raspberry Pi, Orange prime and OdroidXU4, Arduino boards are easier to interface with sensors and can provide on board storage which makes them preferable for this project. The food conveyor belt was programmed to move when the temperature in the boiler reaches the desired ranges.
Design of the DS18B20 temperature sensor circuit The sensor circuit was designed as shown in FIGURE 2. The temperature sensor measuring water temperature is connected to the controller board. The sensor is designed to be powered with 5V connection pin from a standard Arduino controller board with the VDD terminal connected to an external supply of +5V. A liquid crystal display (LCD) was embedded in the circuit to allow for display of the measured parameters.
FIGURE 2: DS18B20 temperature sensor circuit connections The following circuit diagram shows how the LCD was connected with the Arduino module. From the circuit diagram in FIGURE 3, the RS pin of the LCD was connected to pin 12 of the Arduino and the R/W pin of the LCD was connected to the ground. Pin 11 of the Arduino was connected to enable signal pin of LCD module. The LCD module and Arduino module were interfaced with the 4-bit mode hence there were four input lines; DB4 DB5 DB6 and DB7 of the LCD.
This circuit required fewer connection cables and utilized the most potential of the LCD module (Circuits Today, 2020). A 10K potentiometer was used to adjust the contrast of the display, 560Ω resistor R1 limits the current through the back-light LED and the LCD was powered through the +5V pin provided on the board. A computer program for the LCD to display LM35 temperature was written using Arduino software and uploaded on the board.
812 Available Online at www.ijscia.com | Volume 2 | Issue 5 | Sep-Oct 2021
International Journal of Scientific Advances ISSN: 2708-7972
FIGURE 3: 16x2 Liquid crystal display pin arrangement with Arduino
The Variable Frequency Drive_ VFD circuit design Selection criteria for the VFD included compatibility with 230/240V single phase power source and ability to drive up to 3HP AC motors. The drive was designed with a range of 0-50Hz for min-max speed operation. The VFD main external circuit was wired as illustrated in FIGURE 3 where R, S, T were VFD input terminals from the main power supply and U, V, W were VFD output terminals to the motor. The VFD was powered from an AC 230V/ 240V to through pins RLI and SL2 and earthed at E. A Brake Resistor
and Brake Unit was used on the VFD to reduce the deceleration time of the motor. A magnetic contactor (MC) was embedded in the power input wiring to cut off power quickly and reduce malfunction when activating the protection function of AC variable frequency drives. The screws of the main circuit terminals were fastened to prevent sparks that can be caused by the loose screws due to vibration. To permanently reverse the direction of motor rotation, any of the two motor leads could be switched over.
FIGURE 4: Variable frequency drive main circuit connection The frame and mounting of the VFD were designed in such a way that it allowed for enough airflow through the VFD to avoid over heating of the device by leaving a clearance large enough for air circulation. The total volume requirement of the mounting was calculated from Equation 1
= (2𝐶 + 𝑊) × (2𝐾 + 𝐻) × 𝐿 Where W is the width of the variable frequency drive, H is the height of the variable frequency drive and L is the breadth of the mounting. K and C are clearances horizontally and vertically between the VFD and mounting all-round respectively. The VFD frame was made out of aluminum since it is able to withstand the high temperatures. A wooden backboard was made onto which the VFD mounting will be secured by use of screws that run through the VFD holes into the back board. The VFD was mounted vertically on a flat vertical surface (mounting) by screws, other directions were not allowed.
The VFD generated heat during operation hence a clearance of 50 mm minimum was allowed around the unit for heat dissipation since heat sink temperature may rise to 90°C when running (Delta Electronics, 2008) Design of the water circulation system The RWD water conveyance system comprised of a relay module which was triggered by the controller board to switch the motor on or off. The relay module is powered by an adaptor which send an electric field that magnetizes the cores of the relay. The water pump was connected to the output cable and the relay as shown in FIGURE 5. Automation of this system was done to ensure that the water pump pumps boiling water only when it has reached the desired 95°C. The red power wire was identified in the cord leading to the water pump and a cut was made. The wire side leading to the water pump was connected to the NC terminal of the relay and the side leading to the plug connected to the COM(C) terminal hence the relay was on the hot side and the current from the plug was switched before it reaches the water pump.
813 Available Online at www.ijscia.com | Volume 2 | Issue 5 | Sep-Oct 2021
International Journal of Scientific Advances ISSN: 2708-7972
FIGURE 5: The water conveyance system circuit diagram The relay module could be powered by an independent +5V adaptor but in this case, it was powered by the Arduino board pin2. The Vcc terminal on the relay module was connected to the +5V on the Arduino board and the ground terminal of the relay connected to the GND on the Arduino. The signal terminal of the relay module was connected directly to pin7 on the Arduino board to receive signals and to trigger the relay to flip. Computer program design for the food and water conveyance system The flow diagram in Figure 6 shows a logical flow of information and a guidance as to how the computer program was written.
The program was written using Arduino software and uploaded on to the Arduino board via USB drive. A program script was written to receive the analog signal from the microcontroller and respond by switching on the VFD when temperatures reach the desired value. A separate program script was written for the LCD to display the different temperature values as read by the sensor. A program script was written to receive the analog signal (analogRead) from the DS18B20 temperature sensor and convert it into digital signal to be read by the microcontroller. The microcontroller has been programmed to command the relay to close and switch on the conveyor belt only if the water temperature has raised to more than 95°C (Temp>95°C)
FIGURE 6: A data flow diagram for the water pump and motor control computer program
814 Available Online at www.ijscia.com | Volume 2 | Issue 5 | Sep-Oct 2021
International Journal of Scientific Advances ISSN: 2708-7972
A separate code was written and uploaded to the Arduino board for the LCD to display the different temperature values as read by the DS18B20 sensor. Performance testing of the synchronized water and food circulation system. The objective of the testing was to evaluate the dryer performance in terms of drying time, power consumption, temperature along the belt and product moisture content. The system comprising a conveyor motor, water pump, temperature sensor and the IR sensors all connected to the controller board was set up. The Controller board was connected to the computer through a USB cable to enable communication and information flowing from the control board to be read by the computer. The set up comprised of PLX-DAQ computer software was used to convert the ARDUINO software performance results into Excel results that could be tabulated and analyzed. The system was switched on the temperatures in the boiler recorded as well as the desired temperature set by the knob, water pump discharge and conveyor belt speed. According to the system calibration, the dryer is able to dry different food products but mango slices were used for this specific performance test. The drying residence time was calculated as the difference between the beginning of drying and the time at the end of drying.
The optimum drying temperature for the selected product is 95°C but the performance testing was done at 85°C in the tray due to the several temperature loses in the system. When the temperature desired temperature was reached, the timer was started and the product surface temperature for three different random slices was recorded using an infrared temperature gun every after 10 minutes. The ambient temperature and relative humidity inside the dryer were also read using a humidity reader as shown in FIGURE 7 and tabulated. Mango slicing was successfully done and the 3mm thickness was maintained by measuring the thickness of every slice using a ruler and loaded to ensure that slices are evenly spread across the breadth of the belt for effective drying. For effective water temperature monitoring, the DS18B20 temperature sensor was moved from the boiler to the drying bed to detect temperature changes. This was done because it of the large temperature difference between the temperature of water in the boiler and that in the drying bed. Temperature changes along the conveyor belt during drying were also analysed to understand the heat distribution during drying. Using an LCD digital thermometer with probe, the water temperatures along the conveyor belt were recorded at intervals of 1m from the product application side of the tray. This was done at different intervals of time and recorded.
FIGURE 7: Recording of product surface temperature and Humidity during drying • Determining product moisture content The moisture content of the mango samples was determined by the oven drying method described by Chaudhary (2016). Three samples were selected every after 10 minutes, whose moisture content would be analysed. The weight of empty dishes was recorded before loading the fresh sample.
Samples were the weighed before and after drying in the oven using a digital weighing scale as shown in FIGURE 8. The samples were dried for 16 hours at 50⁰С and results tabulated. The oven drying method for moisture content calculation proved to be effective since all the 27 samples selected could be tested at once hence reducing space for errors.
815 Available Online at www.ijscia.com | Volume 2 | Issue 5 | Sep-Oct 2021
International Journal of Scientific Advances ISSN: 2708-7972
FIGURE 8: (A) Weighing of samples. (B) Samples placed in the oven for moisture content calculation
The moisture content was calculated accordingly from Equation 2
𝑀𝑠 = (W1−W2)
(W1−W3) 𝑋 100% Equation 2
Where 𝑀𝑔 = Moisture content of the grains, W1 = Sum of weight of wet sample and that of the dish, W2 = Sum of weight of the dry sample and that of dish and 𝑊3= Weight of the tray
System simulation using Proteus (ISIS) The system was simulated using ISIS software to verify system design and simulate them in real-time environment which reduced the design time and cost. Proteus is a simulation and design software used to create schematics and electronic prints for manufacturing printed circuit boards and simulate the circuits in real time.
Selection of the simulation software was based on the ease with which the software is compatible with Arduino since it requires a simple drag and drop of the written code to run the simulation environment. After assembly, the system was then RUN to view functionality and possible errors. All the circuit designs described in the preceding chapters were first simulated in the ISIS environment before connecting them on the bread board and finally to the PCB boards for testing. RESULTS AND DISCUSSIONS Results for system simulation The computer program written and uploaded ISIS simulation software was able to run successfully as shown in FIGURE 9. The simulation environment showed that whenever temperatures were increased beyond the desired temperature, the water pump and conveyor belt were switched on by the system.
FIGURE 9: System simulation using Proteus (ISIS) software
In the simulation, there was a delay of 3 seconds between the time when the pump and the conveyor motor were turned on by the system. This delay is because of the delay line include in the void loop section of the program that is uploaded on to the controller board. This was to ensure that the water pump replaced the cool water in the tray
with hot water to avoid semi dried product at the delivery end of the belt. In the simulation results, an LM35 temperature sensor was use instead of the DS18B20 to adjust temperatures. This is because the LM35 was more compatible with the controller board in terms of sending commands, the results could have been similar if with the use of the DS18B20 simulation sensor as well.
816 Available Online at www.ijscia.com | Volume 2 | Issue 5 | Sep-Oct 2021
International Journal of Scientific Advances ISSN: 2708-7972
The conveyor belt circuit results Results from the system simulation were used to verify the computer program that was written and the system circuit design before assembly. Basing on the simulation circuit design, the controller board and LCD were interfaced and the circuit illustrated in Figure 10 was connected.
The computer power through the USB cable was found sufficient to power the control board during testing but an adapter was soldered directly onto the board for powering onto the dryer.
FIGURE 10: Connection of the LCD on the circuit board
FIGURE 11 shows the drier into which the controller box marked “A” was installed. Signal lights of different colours were installed onto the box that indicated whether a specific device was ON/OFF. Output devices monitored include blower, cooling and system water pump, washing
unit, conveyor belt, boiler, controller board and overall dryer ON. To enhance further air circulation, a fan was mounted onto the control box to avoid accumulation of heat inside the box which would affect the motor drives and other components installed therein.
FIGURE 11: control board installed onto the dryer for testing The food conveyance system results were the graph in FIGURE 12 was extracted. The belt state was programmed to indicate and match the minimum belt speed when the belt was off and the maximum belt speed when the belt was turned on. Results showed that the there was no movement of the conveyor belt (LOW) as temperature built steadily from point A at 31.19°C until it reached a temperature of 92.0°C in the boiler indicated by point B. At 92.1°C, the conveyor belt was turned on moving at a linear speed of 5 m/hr. At point C, the boiler temperature drastically dropped from 95.75°C to 63.81°C which prompted the conveyor belt to momentarily stop until the temperature built back to 92.1°C. However, this is an anomaly caused by a malfunction in the sensor communication with the controller board.
When the temperatures momentarily drop below the desired temperature, the conveyor belt is supposed to continue moving. This is seen at point E when another anomaly of sudden drop in temperature from 95.75°C to 63.81°C was recorded by the system but in this case, the conveyor belt continued to move regardless of the low temperatures recorded. The water temperature reached a maximum recorded temperature of 98.06°C indicated s point D on the graph and at this point, the temperature started to gradually drop. The drop-in water temperature after point D is attributed to the programing of the system which is designed to maintain the temperature within the desired range by switching off the water heater hence the drop in the temperature.
817 Available Online at www.ijscia.com | Volume 2 | Issue 5 | Sep-Oct 2021
International Journal of Scientific Advances ISSN: 2708-7972
FIGURE 12: Relationship between boiler temperature variation and conveyor belt state
The conveyor belt did not move before the temperatures reached the desired set temperature of 95°C to avoid loss of product as semidried product. If the belt had moved before desired temperature was reached, there would have been product at the delivery end at a lower moisture content than what is required hence product loss. The conveyor belt was turned on by the system at a temperature of 92.1°C, this is because it had reached the desired set temperature of 95°C with an allowable range of ±3°C. This means that temperatures anywhere between 95°C and 98°C would trigger the belt to go on.
The variable frequency drive was connected in the mounting and tested as illustrated shown in FIGURE 13. A 2.5hp Altivar 31 variable frequency drive was selected to run the 2hp conveyor belt motor and an Allen Bradley 1.5hp labeled “B” was selected to control speeds for the washing unit motor. Both drives were able to convert power from single phase to 3phase drive since these were the motors selected for these dryer units. The mounting volume was calculated from Equation 1 was found to be 0.018m3. The clearance C of the mounting was 50mm on either side of the drive to allow for sufficient air circulation around the drive for effective cooling. The motor drive was able to detect the Out-of-Phase-Fault and Short-Circuit-Faults, and displayed them during testing.
FIGURE 13: (B) VFD testing (C) Altivar31 motor drive displaying the short circuit error during testing The water conveyance system For the design, two relay modules were used; HF3FA/012-ZTF Hongfa relay module and a AFEBRD-SS-112LM 12VDC 15A relay. The food conveyance system was operated, results generated and the graph in FIGURE 14. extracted. The water pump state indicated the minimum value (0m3/hr) when the water pump was off and the maximum value (3m3/hr) when the water pump was turned on. Results showed that the water pump was off during the time when the boiler temperature built steadily from point A at 31.19°C until it reached the set desired temperature of 92.0°C in the boiler marked as point B on the graph. At 92.1°C just after point B, the water pump was turned on. This is because the desired set temperature range was 95±3°C and a temperature of 92.095±3°C falls within the acceptable operation range. The water conveyance system was programmed to switch on the water pump only when
temperatures reached the desired set temperature because otherwise, the system would pump water at a lower temperature hence delivering product at a moisture content lower than the required leading to product loss from semidried product. The boiler temperature in FIGURE 14. indicates a drop from 95.75°C to 63.81°C seen at point C which again occurred at point E. The sudden drop in the boiler temperature can be attributed to a temporary malfunction in the DS18B20 temperature sensor communication with led to this anomaly. However, the two anomalies never affected the operation of the system since the pump continued to circulate water throughout the dryer. This response shows a high robustness of the automation system to sudden changes which increase its stability. The minimum and maximum temperatures recorded by the system were 31.19°C and 98.06°C respectively.
818 Available Online at www.ijscia.com | Volume 2 | Issue 5 | Sep-Oct 2021
International Journal of Scientific Advances ISSN: 2708-7972
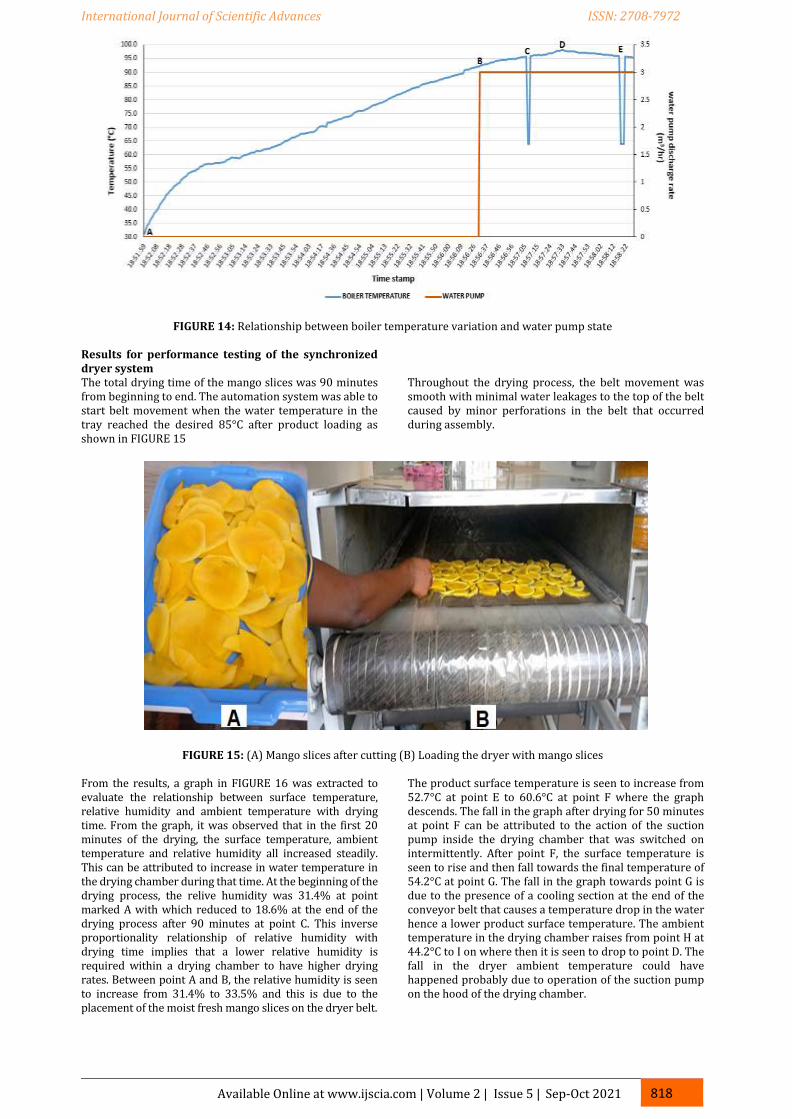
FIGURE 14: Relationship between boiler temperature variation and water pump state Results for performance testing of the synchronized dryer system The total drying time of the mango slices was 90 minutes from beginning to end. The automation system was able to start belt movement when the water temperature in the tray reached the desired 85°C after product loading as shown in FIGURE 15
Throughout the drying process, the belt movement was smooth with minimal water leakages to the top of the belt caused by minor perforations in the belt that occurred during assembly.
FIGURE 15: (A) Mango slices after cutting (B) Loading the dryer with mango slices
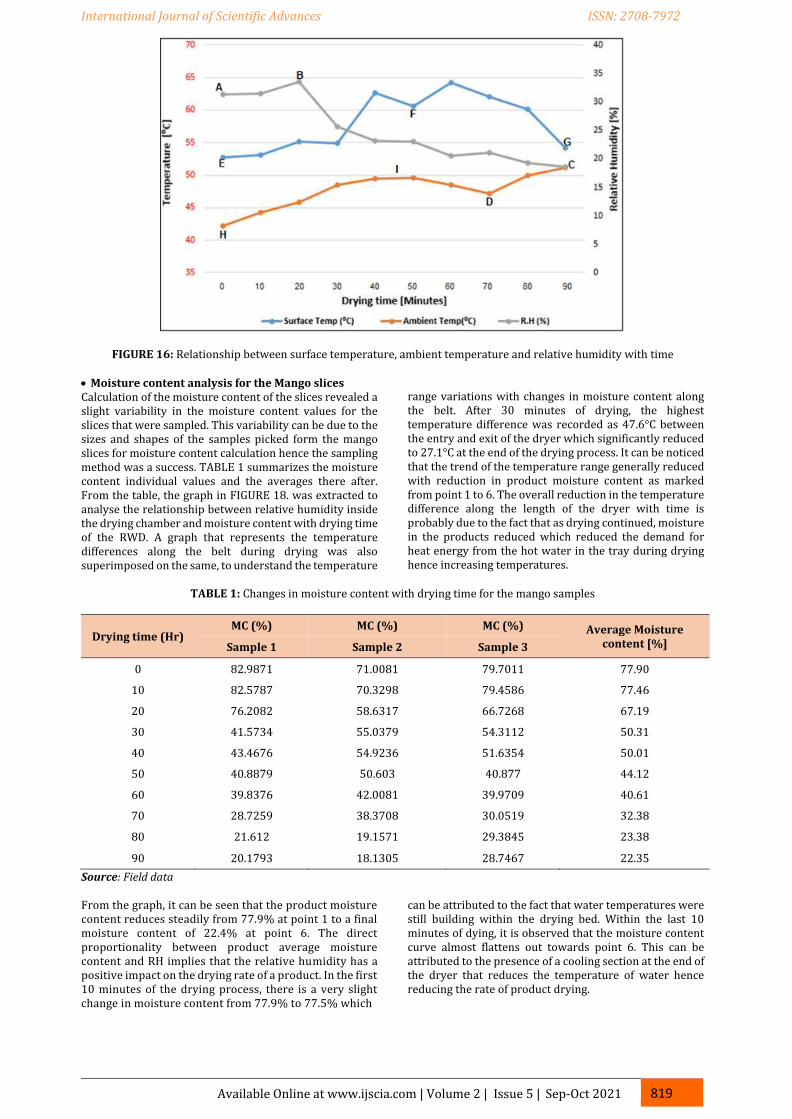
From the results, a graph in FIGURE 16 was extracted to evaluate the relationship between surface temperature, relative humidity and ambient temperature with drying time. From the graph, it was observed that in the first 20 minutes of the drying, the surface temperature, ambient temperature and relative humidity all increased steadily. This can be attributed to increase in water temperature in the drying chamber during that time. At the beginning of the drying process, the relive humidity was 31.4% at point marked A with which reduced to 18.6% at the end of the drying process after 90 minutes at point C. This inverse proportionality relationship of relative humidity with drying time implies that a lower relative humidity is required within a drying chamber to have higher drying rates. Between point A and B, the relative humidity is seen to increase from 31.4% to 33.5% and this is due to the placement of the moist fresh mango slices on the dryer belt.
The product surface temperature is seen to increase from 52.7°C at point E to 60.6°C at point F where the graph descends. The fall in the graph after drying for 50 minutes at point F can be attributed to the action of the suction pump inside the drying chamber that was switched on intermittently. After point F, the surface temperature is seen to rise and then fall towards the final temperature of 54.2°C at point G. The fall in the graph towards point G is due to the presence of a cooling section at the end of the conveyor belt that causes a temperature drop in the water hence a lower product surface temperature. The ambient temperature in the drying chamber raises from point H at 44.2°C to I on where then it is seen to drop to point D. The fall in the dryer ambient temperature could have happened probably due to operation of the suction pump on the hood of the drying chamber.
819 Available Online at www.ijscia.com | Volume 2 | Issue 5 | Sep-Oct 2021
International Journal of Scientific Advances ISSN: 2708-7972
FIGURE 16: Relationship between surface temperature, ambient temperature and relative humidity with time
• Moisture content analysis for the Mango slices Calculation of the moisture content of the slices revealed a slight variability in the moisture content values for the slices that were sampled. This variability can be due to the sizes and shapes of the samples picked form the mango slices for moisture content calculation hence the sampling method was a success. TABLE 1 summarizes the moisture content individual values and the averages there after. From the table, the graph in FIGURE 18. was extracted to analyse the relationship between relative humidity inside the drying chamber and moisture content with drying time of the RWD. A graph that represents the temperature differences along the belt during drying was also superimposed on the same, to understand the temperature
range variations with changes in moisture content along the belt. After 30 minutes of drying, the highest temperature difference was recorded as 47.6°C between the entry and exit of the dryer which significantly reduced to 27.1°C at the end of the drying process. It can be noticed that the trend of the temperature range generally reduced with reduction in product moisture content as marked from point 1 to 6. The overall reduction in the temperature difference along the length of the dryer with time is probably due to the fact that as drying continued, moisture in the products reduced which reduced the demand for heat energy from the hot water in the tray during drying hence increasing temperatures.
TABLE 1: Changes in moisture content with drying time for the mango samples
Drying time (Hr) MC (%) MC (%) MC (%) Average Moisture
content [%] Sample 1 Sample 2 Sample 3
0 82.9871 71.0081 79.7011 77.90
10 82.5787 70.3298 79.4586 77.46
20 76.2082 58.6317 66.7268 67.19
30 41.5734 55.0379 54.3112 50.31
40 43.4676 54.9236 51.6354 50.01
50 40.8879 50.603 40.877 44.12
60 39.8376 42.0081 39.9709 40.61
70 28.7259 38.3708 30.0519 32.38
80 21.612 19.1571 29.3845 23.38
90 20.1793 18.1305 28.7467 22.35
Source: Field data From the graph, it can be seen that the product moisture content reduces steadily from 77.9% at point 1 to a final moisture content of 22.4% at point 6. The direct proportionality between product average moisture content and RH implies that the relative humidity has a positive impact on the drying rate of a product. In the first 10 minutes of the drying process, there is a very slight change in moisture content from 77.9% to 77.5% which
can be attributed to the fact that water temperatures were still building within the drying bed. Within the last 10 minutes of dying, it is observed that the moisture content curve almost flattens out towards point 6. This can be attributed to the presence of a cooling section at the end of the dryer that reduces the temperature of water hence reducing the rate of product drying.
820 Available Online at www.ijscia.com | Volume 2 | Issue 5 | Sep-Oct 2021
International Journal of Scientific Advances ISSN: 2708-7972
FIGURE 18: Relative humidity changes with moisture content and drying time Temperature profile along the conveyor belt The water temperature changes along the conveyor belt were studied to understand temperature distribution at different points of the belt with time. The system was able to switch on the conveyor motor when the temperatures in the drying bed reached the desired 85°C and this was 22 minutes from the time food was placed on the belt. This was possible because the water temperature was then within the acceptable programmed desirable ranges of 85°C ±3. At this point, the water pump was turned on to start pumping hot water throughout the drying bed. The recorded temperature changes along the drying bed were tabulated and the graph in FIGURE 19. extracted.
According to the graph, it is seen that the minimum water temperature recorded in the system was 31.1 °C at point E and this was drying after 20 minutes which was 6 m from the food application side of the dryer. This is because the water temperature had not picked up enough heat to distribute it throughout the drying bed. It can be noted that the average temperature distribution along the conveyor belt was such that temperatures kept falling at every recorded drying time from the food application side at point A towards the product removal side of the dryer at point C. This is possibly because hot water was entering from one end of the tray and leaving through an exit pipe which established a constant temperature gradient along the drying bed.
FIGURE 19: Temperature changes along the belt during drying The temperature variations can possibly be reduced by placing water heater at uninform intervals along the belt which spreads heat rather than having only one entry of hot water on the drying bed. Lagging the hood and the drying bed could also probably reduce the temperature variations since it reduced heat losses during drying. The maximum temperature attained by the system was 89.9°C after 50 minutes of drying marked by point B on the graph which falls outside the desired temperature range of 85°C ±3. The system was able to reach this temperature probably because of the significant distance between the boiler and the entry of the drying bed. This factored in a significant lag between the time when the upper value of the desired temperature range was reached and execution
of the command to stop rising temperatures in the boiler. This lag could possibly be reduced by eliminating the stand-alone water boiler and inserting heaters directly within the drying bed. The designed scraper was not able to easily remove the dried product from the belt after drying since it was too stuck onto the belt after cooling hence hand scrapers were used. After several experiments with the hybrid RWD, it was noticed that it is easier to remove the product from the belt before cooling hence the cooling section on the RWD can be eliminated from the design. The dried mango slices were weighed before and after drying and results were 775g and 100g respectively. After drying, the mango slices were able to retain their original aroma and color which attests to the ability of the
821 Available Online at www.ijscia.com | Volume 2 | Issue 5 | Sep-Oct 2021
International Journal of Scientific Advances ISSN: 2708-7972
dryer to retain the original quality attributes of a product after drying. The total drying time of mango slices at 3mm was 90 minutes to attain a final moisture content of 22.4%. This time can be significantly reduced by reducing the heat losses in the dryer through design modification. CONCLUSIONS From the product performance test done at 85°C, the conveyor belt of the food conveyance mechanism was able to move food only when the temperatures reached the desired temperature range of 85±3°C. This ensured that food was delivered at the required moisture content which in turn reduces product loss in the dryer. The lowest recorded temperature was 31.1°C and the highest temperature was 89.9°C after 50 minutes. The system showed results outside the desired range probably because of the time lag between the switching off the heater and temperatures stabilizing in the drying bed. This lag can possibly be reduced by eliminating the boiler and relocating the heater in the drying bed. A maximum temperature difference of 47.6°C was recorded along the drying bed between the beginning and end of the tray which reduced with reduction in product moisture content. The reduction in the temperature difference is possibly due to the reduction in demand of heat energy from the hot water hence increase in water temperatures as drying continued. The dried mango slices were successfully removed from the belt after drying but this could probably be made easier by eliminating the cooling section of the dryer. The overall cost and selection of design materials would promote up scaling and mass production of the system and hence, it can be installed and substituted for the manually operated drying system. Arduino programing software and hardware was found to work effectively in automating the dryer without overheating and glitching hence is recommended for further automation designs of the dryer. CONFLICTS OF INTEREST The authors declare that there is no conflict of interest. ACKNOWLEDGEMENT This research was funded by the Bioresources Innovations Network for Eastern Africa Development Programme (BioInnovate Africa) - Grant#: BA/C1/2017-01_ MAK
REFERENCES [1] Delta Electronics. (2008). VFD EL USER MANUAL,
1.02(August).
[2] Deshmukh, A., Nagane, M., & Awatade, V. (2013). Design & Development of Automatic Conveyor Controlling System for Sorting of Component on Color basis. Nternational Journal of Science and Research (IJSR). Retrieved from http://docplayer.net/52886802-Design-development-of-automatic-conveyor-controlling-system-for-sorting-of-component-on-color-basis.html
[3] Groover, M. (2008). Automation, production systems,
and computer integrated manufacturing.
[4] Mujumdar, A. S. (2007). An overview of innovation in industrial drying: Current status and R&D needs. Transport in Porous Media, 66(1–2), 3–18. https://doi.org/10.1007/s11242-006-9018-y
[5] Naphade, A. K., & Deshmukh, P. M. J. (2017). “
Improved Automated Conveyor With Auto Separation System For Oil Packaging Industry .” International Research Journal of Engineering and Technology(IRJET), 4(5), 1245–1251. Retrieved from https://www.irjet.net/archives/V4/i5/IRJET-V4I5243.pdf
[6] Nurus, S. Yogesh, B. (2017). Research Papers
Microcontroller Based Automation of Conveyor Belt, 5(1), 11–16.
[7] Onwude, D. I., Hashim, N., Janius, R., Abdan, K., Chen,
G., & Oladejo, A. O. (2017). Non-thermal hybrid drying of fruits and vegetables: A review of current technologies. Innovative Food Science and Emerging Technologies, 43(November), 223–238. https://doi.org/10.1016/j.ifset.2017.08.010
[8] Raso, J., & Barbosa-Cánovas, G. V. (2003). Nonthermal
Preservation of Foods Using Combined Processing Techniques. Critical Reviews in Food Science and Nutrition, 43(3), 265–285. https://doi.org/10.1080/10408690390826527
[9] Shirinbakhsh, M. (2017). Design and optimization of