P OLICY R ESEARCH WORKING P APER 4282 Are Cash Transfers Made to Women Spent Like Other Sources of Income? Norbert Schady José Rosero The World Bank Development Research Group Human Development and Public Services Team July 2007 I MPACT E VALUATION S ERIES NO. 17 WPS4282 Public Disclosure Authorized Public Disclosure Authorized Public Disclosure Authorized Public Disclosure Authorized Public Disclosure Authorized Public Disclosure Authorized Public Disclosure Authorized Public Disclosure Authorized
Transcript
Policy ReseaRch WoRking PaPeR 4282
Are Cash Transfers Made to Women Spent Like Other Sources of Income?
Norbert SchadyJosé Rosero
The World BankDevelopment Research GroupHuman Development and Public Services TeamJuly 2007
imPact evaluation seRies no. 17
WPS4282P
ublic
Dis
clos
ure
Aut
horiz
edP
ublic
Dis
clos
ure
Aut
horiz
edP
ublic
Dis
clos
ure
Aut
horiz
edP
ublic
Dis
clos
ure
Aut
horiz
edP
ublic
Dis
clos
ure
Aut
horiz
edP
ublic
Dis
clos
ure
Aut
horiz
edP
ublic
Dis
clos
ure
Aut
horiz
edP
ublic
Dis
clos
ure
Aut
horiz
ed
Produced by the Research Support Team
Abstract
The Impact Evaluation Series has been established in recognition of the importance of impact evaluation studies for World Bank operations and for development in general. The series serves as a vehicle for the dissemination of findings of those studies. Papers in this series are part of the Bank’s Policy Research Working Paper Series. The papers carry the names of the authors and should be cited accordingly. The findings, interpretations, and conclusions expressed in this paper are entirely those of the authors. They do not necessarily represent the views of the International Bank for Reconstruction and Development/World Bank and its affiliated organizations, or those of the Executive Directors of the World Bank or the governments they represent.
Policy ReseaRch WoRking PaPeR 4282
How cash transfers made to women are used has important implications for models of household behavior and for the design of social programs. In this paper, the authors use the randomized introduction of an unconditional cash transfer to poor women in rural Ecuador to analyze the effect of transfers on the food Engel curve. There are two main findings. First, the authors show that households randomly assigned to receive Bono de Desarrollo Humano (BDH) transfers have a significantly higher food share in expenditures than those that were randomly assigned to the control group. Second, they show that the rising food share
This paper—a product of the Public Services Team, Development Research Group—is part of a larger effort in the group to evaluate the impact of social programs. Copies of the paper are available free from the World Bank, 1818 H Street NW, Washington, DC 20433. Please contact Imran Hafiz, room MC3-311, telephone 202-473-7851, fax 202-522-1154, email address [email protected]. Policy Research Working Papers are also posted on the Web at http://econ.worldbank.org. The authors may be contacted at [email protected]. July 2007. ( 28 pages)
among BDH beneficiaries is found among households that have both adult males and females, but not among households that only have adult females. Bargaining power between men and women is likely to be important in mixed-adult households, but not among female-only households, where there are no men to bargain with. Finally, the authors show that within mixed-adult households, program effects are only significant in households in which the initial bargaining capacity of women was likely to be weak. This pattern of results is consistent with an increase in the bargaining power of women in households that received BDH transfers.
Are Cash Transfers Made to Women Spent Like Other Sources of Income?♣
Secretaría Técnica del Frente Social Quito, Ecuador
JEL Codes: I32, I38
♣ We thank Harold Alderman, Caridad Araujo, Orazio Attanasio, Kathleen Beegle, Angus Deaton, Eric Edmonds, Francisco Ferreira, Deon Filmer, Sebastian Galiani, John Hoddinott, Elizabeth King, Peter Lanjouw, David McKenzie, Christina Paxson, and Martin Ravallion for their comments. Any remaining errors are our own. The findings in this paper do not necessarily represent the views of the World Bank or the Government of Ecuador.
1. Introduction
Cash transfer programs have become increasingly popular in developing countries. This
paper analyzes the effect of a cash transfer program in rural areas in Ecuador, the Bono de Desarrollo
Humano (BDH), on the food Engel curve. The BDH makes US $15 monthly cash transfers to poor
women. During the roll-out of the BDH program, a group of eligible households was randomly
assigned into a “treatment” group eligible for transfers and a “control” group that was ineligible for
the study period. Data on both groups were collected at baseline, before households started receiving
transfers, and at follow-up, approximately 18 months later. This experimental design allows us to
analyze whether transfers made by the BDH are spent like other sources of income.
In the textbook example, all household members maximize a join utility function (Becker
1981). A cash transfer shifts out the household budget constraint. The composition of expenditures
then changes as households move along the Engel curve that relates expenditures on a particular item
or group of items to total expenditures. Neither the source of the additional income nor who within
the household receives the transfer matters.
In practice, there are a variety of reasons why cash transfers like those made by the BDH may
be used differently from other sources of income. If transfer income is seen as more temporary or
uncertain than other sources of income, a higher fraction of it might be saved or invested—for
example, by purchasing productive assets. Indeed, the permanent income hypothesis suggests that all
of the additional “windfall” income would be saved.
Even though transfers made by the BDH came with no strings attached, it was marketed as a
“social program”. During the roll-out of the program, a brief advertising campaign was launched,
including informational spots on national television and in local radio stations. These spots stressed
that the BDH was a program that was meant to benefit poor children. The advertising campaign may
have led households to spend transfers in a way that took account of the goals of the program. Recent
research in psychology and economics shows that considerations such as “fairness” and “reciprocity”
may be important determinants of decision-making, and that individuals keep “mental accounts” in
their expenditures (see, in particular Thaler 1999, as well as the review papers by Fehr and Gachter
2000, Fehr and Schmidt 2007, and the edited volume by Kahneman and Tversky 2000). In the United
States, studies of food stamp “cashouts” show that families spend more of their food stamp income on
food than is the case for other sources of income (Fraker, Martini, and Ohls 1995; Currie 1998).
Kooreman (2000) finds that spending on children’s clothing out of child benefit income in the
Netherlands is much larger than out of other income. Jacoby (2002) argues that there are also
“flypaper effects” associated with a school feeding program in the Philippines. On the other hand,
Edmonds (2002) fails to reject the null that child benefit income is used like other income in
1
Slovenia. Case and Deaton (1998) conclude that pension income is spent in the same way as other
sources of income in South Africa, so that “a rand is always a rand”.
The gender of recipients of cash transfers like those made by the BDH may also be important
in determining how transfer income is used. If pooling of resources within the household is
incomplete, as predicted by a variety of non-unitary household models (for example, Chiappori 1988;
1992; Bourguignon et al. 1993), cash transfers to women may increase their bargaining capacity
within the household and result in a pattern of expenditures that better reflects their preferences. A
handful of papers provide evidence that women have different preferences over expenditures from
men. Thomas (1990) uses data for urban Brazil to show that the effect of non-earned maternal
income on nutrient demand is between four and seven times larger than the corresponding effect of
non-earned paternal income. Hoddinott and Haddad (1995) argue that the share of income controlled
by women is positively correlated with food shares in Cote d’Ivoire. Doss (2005) shows that the
share of assets and the share of land owned by women are positively associated with higher food
expenditures among rural households in Ghana. Lundberg, Pollack, and Wales (1997) exploit a
sudden, unanticipated policy reform in the United Kingdom. In this reform, a universal child benefit,
which had primarily consisted of reductions in taxes withheld from the paycheck of a child’s father,
was replaced by a direct cash payment made to the child’s mother. Lundberg, Pollack, and Wales
argue that this reform led to a substantial increase in expenditures on women’s clothing and children’s
clothing relative to men’s clothing—see also Ward-Batts (2003) for another paper that reaches similar
conclusions with the same data. On the other hand, Hotchkiss (2005) shows that childless couples,
who were unaffected by the reform, also had large increases in expenditures on women’s clothing,
which casts doubts on the Lundberg, Pollack and Wales identification strategy.
There are also a handful of papers that analyze the effect of “conditional cash transfer”
programs in Latin America. In these programs, women receive transfers only if they comply with a
number of conditions—women with pre-school-aged children must make regular visits to health
centers, where children receive growth monitoring and food supplements, if necessary, and women
with school-aged children must ensure that they are enrolled in school and attend regularly. The best
known of these programs is the PROGRESA program in Mexico (now called Oportunidades).
A number of papers analyze the impact of PROGRESA on expenditures, and arrive at
different conclusions. Hoddinott and Skoufias (2004) use the random assignment of PROGRESA to
poor communities to show that households eligible for transfers consumed more food than non-
eligible households; however, Hoddinott and Skoufias do not analyze changes in the food share, so it
is not clear whether the increase in food expenditures is a result of higher incomes or changes in
consumption patterns. Attanasio and Lechene (2002) explicitly focus on the shares of expenditures
2
on different goods, including food. Their analysis leads them to reject the income pooling hypothesis.
Using a variety of instrumental-variables techniques that exploit the randomized introduction of the
program, they conclude that households that received PROGRESA transfers had significantly higher
food shares in expenditures. Rubalcava, Teruel, and Thomas (2004) also analyze the impact of
PROGRESA on the composition of expenditures, and conclude that transfers were more likely to be
invested, and were more likely to be spent on goods that benefited children, than other sources of
income. Moreover, they show that changes in the composition of expenditures among PROGRESA
beneficiaries were absent in single-parent households, which could be consistent with a bargaining
power explanation. Unlike Attanasio and Lechene, however, Rubalcava, Teruel, and Thomas
conclude that PROGRESA beneficiaries had lower (rather than higher) food shares in expenditures
after the program.
Turning to other conditional cash transfer programs in Latin America, Attanasio and Mesnard
(2005) use non-experimental methods to analyze the impact of the Colombian Familias en Acción
program; they show that the program increased food expenditures by the same fraction as total
expenditures—the Engel curves remained unchanged. Finally, Maluccio and Flores (2004) exploit
the random assignment of benefits in the Red de Protección Social program in Nicaragua. They show
that households that were eligible for transfers had significantly higher food shares in expenditures.
How conditional cash transfers are used by households is an important policy question.
However, analysis of conditional cash transfers does not in and of itself provide a straightforward test
of the pooling hypothesis. This is because the conditions attached to transfers are likely to affect the
pattern of expenditures—see, in particular, the discussion in Attanasio and Lechene (2002). The fact
that the BDH did not require women to comply with any “conditions” to receive transfers arguably
provides a cleaner test of whether the simple textbook model of the household is an accurate
approximation to reality.
In this paper we focus on differences in the share of expenditures devoted to food between
households randomly assigned to receive BDH transfers—lottery winners—and households randomly
assigned to the control group—lottery losers. The main findings of the paper are two. We first show
that BDH lottery winners have a significantly higher food share in expenditures than lottery losers.
As is discussed above, this is in principle consistent with a variety of explanations. We then show
that the pattern of program effects is generally consistent with an increase in the bargaining capacity
of women.
To analyze whether the gender of recipients was important, we split the sample into
households that have both adult men and women, and those that have adult women only. If the rising
food share among BDH beneficiaries were a result of the increasing bargaining power of women, we
3
would expect to see increases in the food Engel curve among mixed-adult households, where
bargaining is an issue, but not among female-only households, where there are no men to bargain
with. This is in fact the pattern of program effects we find. We might also expect that the BDH
would have the largest effects in mixed-adult households in which the initial control of women over
resources was weak. Although there is no direct measure of bargaining capacity within the household
in our data, the relative education of men and women is likely to be a reasonable proxy—see
Frankenberg and Thomas (2003) for a general discussion, and Beegle, Frankenberg, and Thomas
(2001) for an application. We show that, among mixed-adult households, BDH program effects are
larger when women have less schooling than men.
The rest of the paper proceeds as follows. In section 2, we describe the data and the BDH
evaluation experiment. Section 3 discusses our methodology and presents results. We conclude in
section 4.
2. Program design, evaluation, and data1
A. The BDH program
Ecuador has had a nationwide cash transfer program in place for approximately a decade.
The first of these programs, the Bono Solidario, was created in 1998. Its goal was to make transfers
to poor households as Ecuador recovered from an economic crisis. (GDP per capita contracted by 7.7
percent between 1998 and 1999.) As originally envisioned, transfers made by the Bono Solidario
were meant to be temporary. In practice, however, the program continued well after recovery from
the crisis.
Individual payments made by the Bono Solidario program were small—$15 per month per
eligible family—but the scope of the program was large: In 2002, it accounted for approximately 0.75
percentage points of GDP. (Ecuador adopted the US dollar as national currency in January 2000.)
Payments were intended to be made to poor households. However, because there were no clear
selection criteria, households essentially signed up on a first-come, first-served basis. As a result,
many poor households did not receive transfers, and a substantial fraction of transfers were received
by non-poor households. In 1999, 49.8 percent of families in the poorest quintile received transfers,
and 27.4 percent of families in the top two wealthiest quintiles received transfers. (These statistics are
based on calculations from household survey data using the nationally representative 1999 Ecuador
Encuesta de Condiciones de Vida, the multi-purpose household survey intermittently conducted in
Ecuador.)
1 This section borrows considerably from the descriptions in Schady and Araujo (2006) and Paxson and Schady (2007).
4
Beginning in mid-2003, the Bono Solidario was gradually replaced with a new program, the
Bono de Desarrollo Humano (BDH). The BDH differs from the Bono Solidario in that it is means-
tested. Starting in 2001, the government of Ecuador invested significant effort into developing a
family means-test. Fully 85 percent of families in rural areas and poorer urban areas of Ecuador were
surveyed and assigned a poverty index (called the Selben index). This index is used to assess
eligibility for the BDH—only families in the first two quintiles of the Selben index are eligible for
transfers of $15 per month.2 BDH transfers are relatively small in magnitude—in our sample, they
account for approximately 8.9 percent of expenditures of the median household. Transfers are made
through the banking system. The program rules state that transfers must be made to women if there
are any adult women in the household, and women must physically go to a nearby bank to receive
cash.3 (There is a much smaller version of the program that covers the elderly, regardless whether
they are men or women; these households are not included in our sample.)
Earlier work on the BDH program has focused on its impact on overall consumption,
schooling, and child health and development. A joint document by the World Bank and the
Secretaría Técnica del Frente Social (2006) in Ecuador shows that households that received BDH
transfers did not have significantly higher overall per capita consumption. This is surprising, but can
be explained, in an accounting sense, by large reductions in child labor among households that
received transfers. This same analysis finds no evidence of changes in adult labor market
participation. Schady and Araujo (2006) show that the BDH program had a large, positive effect on
school enrollment. Finally, Paxson and Schady (2007) show that BDH transfers resulted in
improvements in measures of nutritional status, motor development, cognitive development, and
psycho-emotional development among children of pre-school age in rural areas, especially among the
poorest households. There is no earlier work on the effect of BDH transfers on the composition of
household expenditures.
B. The experiment
In a similar fashion to the roll-out of PROGRESA, an evaluation design was explicitly
incorporated into the BDH. The sample for this evaluation was drawn from the Selben rosters of four
of the 22 provinces in the country: Carchi, Imbabura, Cotopaxi, and Tungurahua. All four provinces
are in the sierra (or highlands) region of the country. The sampling framework followed a two-stage
2 In January 2007, the administration of newly-elected President Rafael Correa announced that transfers to all eligible households would be doubled from $15 per month to $30 per month. However, this reform falls well after the time period considered in our study. 3 There are only 4 households in our sample that receive BDH transfers in spite of the fact that there are no adult women in the household.
5
process. Within the provinces in the evaluation, parishes were randomly drawn and, within these
parishes, a sample of 1,488 households was randomly selected. (Parishes are the lowest geographic
unit in Ecuador, roughly equivalent to counties in the United States.) Households that had previously
received transfers from the Bono Solidario were excluded from the sample, as were households
whose Selben score made them ineligible fir the BDH. One-half of households in the sample were
randomly assigned to a treatment group, and the other half to the control group. We refer to the first
group as “lottery winners” and the second group as “lottery losers”. Lottery losers were taken off the
roster of households that could be activated for BDH transfers. Note that households in the two
groups lived in the same neighborhoods or villages—unlike the evaluation of PROGRESA and most
other cash transfer programs in Latin America, where random assignment took place at the
community level.
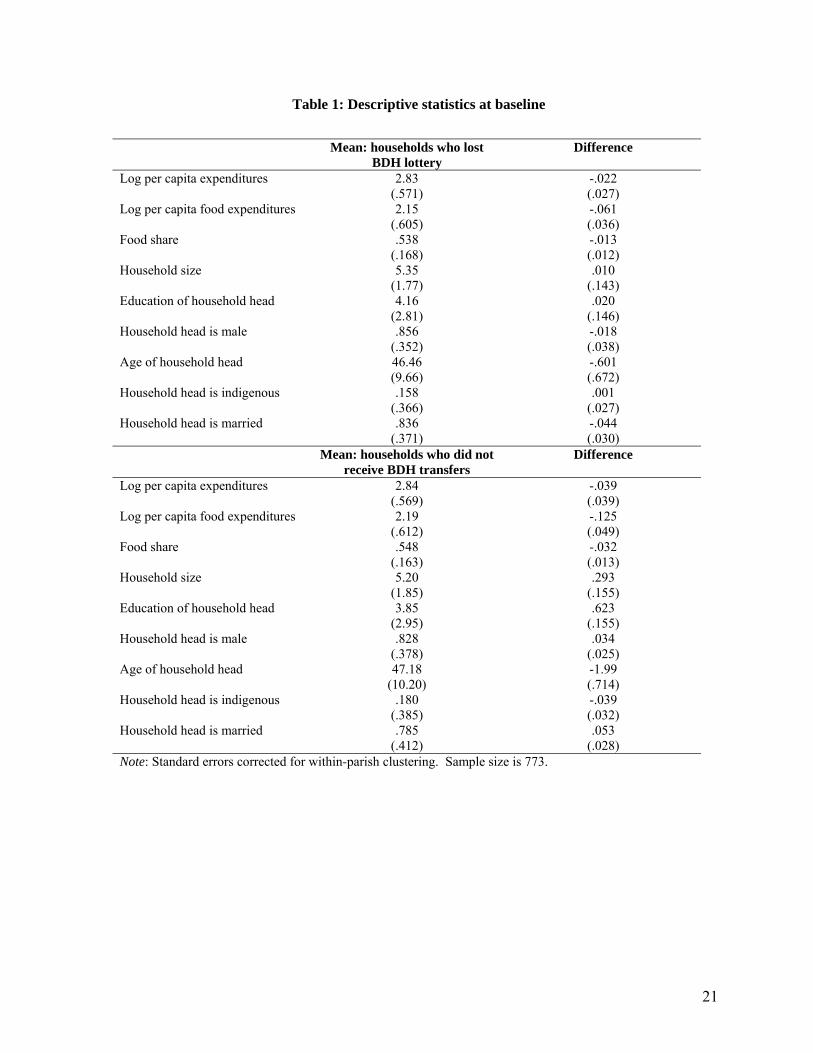
Table 1 uses data from the baseline survey to compare the characteristics of households that
were randomly assigned to treatment and control groups (upper panel), and those that received and
did not receive BDH transfers (lower panel). The upper panel of the table shows that random
assignment was successful: Differences between lottery winners and lottery losers at baseline in a
number of characteristics—including expenditure patterns, the food share, household size, and the
characteristics of the household head—are small, and are not significant at conventional levels.
Although random assignment was successful, there is unfortunately a very imperfect match
between assignment to a study group and receipt of BDH transfers. Program take-up among lottery
winners was 78 percent; lack of information, the cost of traveling to a bank, and stigma may all have
discouraged some households from receiving transfers. More worryingly, 42 percent of households
assigned to the control group received transfers. The precise reasons for this substantial
contamination are unclear. Conversations with BDH administrators suggest that the list of
households that had been randomized out was not passed on in time to operational staff activating
households for transfers. This situation was corrected after a few weeks, but withholding transfers
from households that had already begun to receive them was judged to be politically imprudent (see
Schady and Araujo 2006).
The lower panel of Table 1 shows that there are clear baseline differences between
households that received BDH transfers and those that did not. Households that received transfers
had lower food expenditures and lower food shares; they tended to be larger; the heads of households
that received transfers had an average of two-thirds of a year of more education, are approximately
two years younger, and are somewhat more likely to be male. Many of these differences are
significant. Table 1 clearly suggests that the likelihood of receiving BDH cannot be treated as
random, and that it is important to use estimation methods that take this into account.
6
How do households in our sample compare with other households in Ecuador? Because of
the criteria for selection into the BDH evaluation, households in the study sample tend to be poorer.
Table 2 reports the means and standard deviations for selected characteristics of households in the
study sample at baseline, for all households in the country, and for all households in the parishes
included in this study. The samples for these calculations are limited to households with children
ages 6-17. National averages are based on the 1999 Encuesta de Condiciones de Vida, and averages
for the parishes in the study sample are based on the 2001 Population Census. Table 2 shows that
households in the sample have more members and fewer rooms than other households, are less likely
to have access to piped water or a toilet, and are more likely to have a dirt floor in their home. Mean
years of schooling of household heads in the study sample are more than two-and-a-half years lower
than those of other households. These patterns are apparent both in comparison with other
households in these same parishes, as well as in comparison with national averages.
C. Data
The main sources of data used in this paper are the baseline and follow-up surveys designed
for the BDH evaluation. Both surveys were carried out by an independent firm that had no
association with the BDH program, the Pontificia Universidad Católica del Ecuador. The baseline
survey was collected between June and August 2003, and the follow-up survey was collected between
January and March 2005. The analysis in this paper is limited to households living in rural areas.
The survey instrument included a roster of household members and, inter alia, information on
the level of schooling attained, marital status, and languages spoken by all adults; school enrollment,
grade progression, and work of all children ages 6-17; an extensive module on household
expenditures, which closely followed the structure of the 1999 Encuesta de Condiciones de Vida; and
a module on dwelling conditions, ownership of durable goods, and access to public services. We
aggregated expenditures into a total consumption aggregate, and food expenditures into a food
consumption aggregate. Food consumption includes both actual expenditures (including food
consumed outside the home), as well as home production in the two weeks prior to the survey. Other
expenditures include modules on schooling, health, entertainment, items for personal hygiene,
clothing, shoes, transportation, services, and expenditures on durables. The items asked in the
expenditure module, and the recall periods for each item, are exactly the same in the two surveys. We
deflated prices across provinces using data on the prices of a basket of food items collected at the
time of the baseline survey, and used the Consumer Price Index (CPI) to make the prices comparable
between the two surveys.
7
There are 773 households in rural areas in the BDH evaluation surveys that were visited in
both the baseline and follow-up surveys. Attrition over the study period was low: 94.1 percent of
households were re-interviewed. Among households who attrited, most had moved and could not be
found (4.2 percent), with smaller numbers where the household was located but no qualified
respondent was available despite repeated visits (1.0 percent), or the respondent refused to participate
in the survey (0.5 percent). There is no relation between assignment to the study groups and attrition,
and baseline differences between attrited and other households in per capita expenditures, food
expenditures, assets, and the education of adult males and females are small and insignificant.
Attrition is most likely to introduce biases in estimation when there are large differences between
attrited and other households (Fitzgerald, Gottschalk and Moffitt 1998), or when attrition is correlated
with treatment status (Angrist 1997; Angrist et al. 2002), and there is no evidence that this is the case
in our data.
3. Results
A. Nonparametric results
We begin our analysis with non-parametric regressions of the food share on the log of per
capita expenditures at baseline and follow-up for households assigned to the treatment group—lottery
winners—and households assigned to the control group—lottery losers. These results are presented
in Figure 1. Note that this analysis only makes use of the random assignment into treatment and
control groups, and not of the likely endogenous program take-up.
The food Engel curves in Figure 1 generally present the typical downward-sloping pattern
observed elsewhere. With the exception of the poorest households, households with higher overall
expenditures generally have lower food shares—Engel’s Law (Engel 1857). The positive slope in the
food Engel curve observed at the lowest expenditure levels is not uncommon (Thomas 1986), and has
been documented before for Ecuador (Lanjouw and Lanjouw 1997). One explanation that is
consistent with this pattern is measurement error in food expenditures: If households buy some food
items infrequently, for example because they buy in bulk, some households will not have purchased
these items during the recall period considered in the surveys (the last two weeks). These households
will appear to have low overall expenditures and particularly low food expenditures (Lanjouw and
Lanjouw 1997).
By virtue of random assignment, we would expect that the food Engel curves at baseline for
lottery winners and losers would be very close to each other. The upper panel of Figure 1 shows that
this is generally the case above the 25th percentile of the distribution of log per capita expenditures.
However, despite random assignment, the food Engel curve for the poorest lottery winners is below
8
that of the poorest lottery losers—on average, the difference in food shares between the two groups
for households in the lowest quartile is 2.8 percentage points. We return to this point below.
If BDH transfers were treated like other sources of income, households might move along
their Engel curves in response to the program, although the fact that the program did not have an
effect on total expenditures suggests that movement along the curves would be small. Under this
scenario, the curves for lottery winners and lottery losers at follow-up would look very similar to
those at baseline. The lower panel of Figure 1 shows that this is not the case. Instead, the curves for
both lottery winners and lottery losers have shifted down over the two-year period. However, the
shift for lottery winners is noticeably smaller.
The downward shift in the food Engel curves over time is surprising, although it has been
observed elsewhere—see Deaton and Dreze (2007) for a long time-series in India, and Maluccio and
Flores (2004) in their analysis of the effect of the Red de Protección Social program in Nicaragua. To
gain a better understanding of this change, we make use of the 1999 and 2006 Ecuador Encuestas de
Condiciones de Vida. We limited the sample to households in the rural sierra, to make the coverage
of the surveys comparable to that in the evaluation data, and calculated nonparametric regressions of
the food share on log per capita expenditures. On average, the food Engel curve using the Encuestas
de Condiciones de Vida in 2006 is 3.9 percentage points below that in 1999. Reassuringly, the
downward shift in the food Engel curves in rural areas of the sierra in Ecuador we observe in the
BDH evaluation sample is also apparent in other data sources.
We briefly discuss some possible reasons for the downward shift in the food Engel curves in
Ecuador over time. First, there may have been changes in relative prices—for example, a change in
the price of food, relative to other items in the household budget. Both the BDH evaluation surveys
and the Encuestas de Condiciones de Vida collect village-level information on a basket of food items,
which are then used to deflate expenditures spatially. However, neither survey collects information
on the prices of non-food items, so it is not possible to use these data to assess changes in relative
prices.
Seasonal patterns could also explain the decline in the food Engel curve—recall that the
baseline evaluation survey was collected between June and August, while the follow-up survey was
collected between January and March. The 2006 Encuesta de Condiciones de Vida collected data in
every month of the year. The average food share in rural areas in the sierra is 0.473 in January-March
period and 0.475 in the June-August period. Thus, it does not appear that seasonal effects are
important.
Finally, measurement error also seems an unlikely candidate to explain the falling food Engel
curve in the evaluation surveys, since the expenditure modules and recall periods were identical
9
across surveys, the same procedure was used to deflate expenditures spatially, and overall price levels
were stable over this period—the national currency in Ecuador at the time of both surveys was the US
dollar. We therefore do not have a satisfactory explanation for the secular downward shift in the
Engel curve in our evaluation sample or in the rural sierra in general.
More importantly for our analysis, however, the lower panel of Figure 1 shows that the food
Engel curve for lottery winners at follow-up is everywhere above that for lottery losers. Note that this
is a very different pattern of what we find at baseline. Figure 1 thus suggests that BDH transfers led
households to shift expenditures towards food.
B. Parametric results
We next turn to two parametric specifications of the data. In the first of these, we use only
data from the follow-up survey:
(1) Wht= Zhδ + f(ln(x/n))ht + Xhtβ + ψc + εht,
where Wht is the food share at the time of the follow-up survey; Zh is a dummy variable that takes on
the value of one if a family was a lottery winner; f(ln(x/n))ht is a flexible formulation of per capita
expenditures. In practice, we use a quadratic in expenditures—we consistently fail to find evidence
that higher-order terms are important (see Attanasio and Lechene 2002, and Blundell, Banks, and
Lewbell 1997 for a similar parametrization of total expenditures in Engel curve analysis); Xht is a
vector of demographic controls, including the log of household size, and indicator variables for the
number of family members in 5 age ranges (0 to 5, 6 to 17, 18 to 44, 45 to 64, and 65 or older)
interacted with gender; ψc is a vector of 45 canton fixed effects; εht, finally, is the regression error
term. Standard errors are corrected for within-parish correlation. The parameter of interest is δ,
which tests for differences in the food Engel curve between lottery winners and lottery losers. Note
that this is a “lottery effect” that is exogenous as it relies only on the random assignment.
There are a number of considerations that require discussion in this specification. The first of
these is that estimation of (1) above allows the BDH to have an effect on the intercept but not the
slope of the Engel curve. In practice we consistently fail to find evidence of BDH effects on the slope
of the Engel curve, and therefore use this more parsimonious specification. A second concern is
measurement error. Measurement error in per capita expenditures would bias the linear and quadratic
terms in ln(x/n)ht above, and could also bias estimates of the program effect on the Engel curve if per
capita expenditures at follow-up are not orthogonal with participation in the BDH program. We
therefore also present estimates in which total per capita expenditures (and its square) are
instrumented with per capita non-food expenditures (and its square).
10
Another consideration is pre-existing differences between lottery winners and lottery losers
that remain despite random assignment. As Figure 1 shows, there is some evidence that the food
share at baseline was lower among lottery winners than among lottery losers. We therefore also run a
specification in first-differences:
(2) ΔWh = Zhδ + Δf(ln(x/n))h + ΔXhβ + ψc + Δεh,
where Δ represents changes between baseline and follow-up. This approach sweeps out all time-
invariant differences between lottery winners and lottery losers, including differences in the baseline
food share.
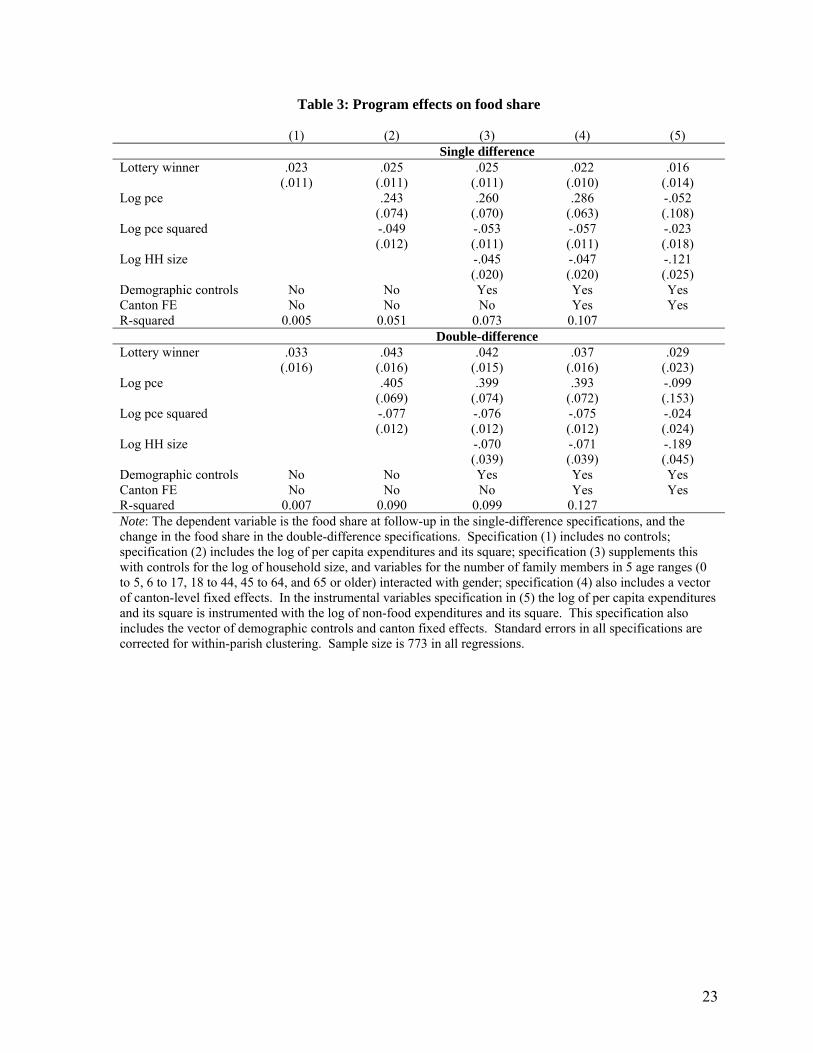
Results from these calculations are presented in Table 3. The first four specifications are
OLS. The first of these includes no controls; this specification therefore ignores any effect that BDH
transfers may have had on total expenditures. The second specification includes linear and quadratic
terms in the log of per capita expenditures. The third specification supplements this with the vector
of demographic controls. The fourth specification also includes 45 canton fixed effects. In the fifth
specification, finally, the log per capita expenditures (and its square) are instrumented with the log of
nonfood expenditures (and its square).4 The upper panel in the table presents results based on the
single-difference specification, while results from the double-difference specification are reported in
the lower panel.
The single-difference estimates suggest that the food share at follow-up is between 1.7 and
2.5 percentage points higher among lottery winners than among lottery losers. All of the program
effects estimated by OLS are significant at the 5 percent level or better. When per capita
expenditures is instrumented, the coefficient on lottery winners falls somewhat, and the standard error
increases; as a result, these estimates are no longer significant at conventional levels. However, the
point estimate in the IV specification is close to and well within the confidence interval of the OLS
estimates. The log of per capita expenditures has the concave profile apparent in Figure 1 in the OLS
specifications; once expenditures are instrumented, the food share falls monotonically with
expenditures, as predicted by Engel’s Law.
The double-difference estimates in the lower panel of the table are noticeably larger, as one
would expect given the lower food share among lottery winners at baseline. These estimates suggest
that the food share among lottery winners is between 2.9 and 4.0 percentage points higher than among
lottery losers. As before, the coefficient on households randomly assigned to receive BDH transfers
4 Non-food expenditures are highly correlated with total expenditures. In a regression of the log of total expenditures on the log of nonfood expenditures, including the demographic controls and the canton fixed effects, the coefficient on non-food expenditures is 0.459 (with a standard error of 0.011); in a comparable regression in first differences, the coefficient is 0.395 (with a standard error of 0.014).
11
is significant in all OLS specifications; in the IV specification the point estimate is smaller, and the
standard errors are larger.
How large are these effects of the BDH on the food share? As is discussed above, there was
unfortunately substantial contamination of the control group in the BDH experiment. This will tend
to dampen any effect the program may have had on food shares estimated in (1) and (2). The
coefficient δ can therefore best be understood as a lower bound of the underlying program effect. As
an alternative, it is possible to use the randomized assignment into study groups as an instrument for
actual receipt of BDH transfers (Imbens and Angrist 1994). For this purpose, we obtained data from
Banred, the consortium of banks that pay BDH benefits, on total transfers collected by every
household in the sample between January 2004 and July 2005. (Results are very similar when,
instead of the banking data, we use the responses provided in the follow-up survey about receipt of
BDH transfers.) As is well known, these regressions estimate Local Average Treatment Effects
(LATE). These are estimates of the effect of BDH transfers on the food share for households whose
probability of receiving transfers was affected by the lottery—“compliers”, in the language of
Angrist, Imbens, and Rubin (1996). In these regressions, the coefficient on instrumented receipt of
BDH transfers implies an effect on the food share of between 6.4 and 7.4 percentage points in the
single-difference estimates, and of between 10.5 and 12.6 percentage points in the double-difference
regressions.5
We present two additional pieces of evidence that are consistent with an increase in
expenditures on food by BDH lottery winners. First, we reproduce a result from the paper by Paxson
and Schady (2007) on the impact of the BDH on child health and development. The follow-up survey
used by Paxson and Schady asked BDH beneficiaries, all of whom were women, what they used
BDH transfers for. Table 4, reproduced from their paper, shows that nearly half (49.2 percent)
reported that they spent all or most of the transfer on food, with much smaller fractions reporting that
they spent all or most of the transfer on clothing (11.4 percent), education (10.7 percent), and health
care (7.9 percent). The survey also asked mothers who in the household (the mother, her partner or
husband, or both) decided whether the transfers should be spent on food, clothing, etc. For each type
of expenditure, fewer than 2 percent of women reported that her husband or partner alone made
decisions on how to spend the BDH transfer, and the majority indicated that they made spending
decisions alone. Second, we note that Paxson and Schady find that the BDH program resulted in
5 The first stage is highly significant: In a regression of the dummy for households that received transfers on a dummy for lottery winners and the full set of controls, the coefficient on lottery winners is 0.347, with a standard error of 0.048.
12
substantial improvements in the hemoglobin status of children and their mothers, which is consistent
with increased consumption of some foodstuffs, such as red meat and some fruits and vegetables.
C. Differences by the gender composition of households
As is discussed in the introduction, there are a variety of reasons why BDH transfers could
have resulted in higher food shares, including uncertainty about how long transfers would be
available, “mental accounting” that would take account of program goals, and the gender of transfer
recipients. We cannot formally test all of these possible explanations. However, we present two
pieces of evidence that suggest that the fact that BDH transfers were made to women was important.
We first focus on comparisons between households that have both adult males and females
(mixed-adult households), and those that only have adult females (female-only households), where
adults are defined as household members aged 18 or older. If women have preferences for food, and
the increase in the food share reflects the increasing bargaining power of women over the budget, we
would expect to see higher food shares among BDH recipients in mixed-adult households, where
bargaining is an issue, but not among female-only households, where there are no men to bargain
with. As we show, this is the pattern we find.
Second, if the rising food share in mixed-adult households reflects the increasing bargaining
power of women, we would expect changes to be larger in households where the bargaining capacity
of women was initially weak. We do not have a direct measure of the bargaining capacity of men and
women in the household. However, the relative education of men and women in the household is
likely to be a reasonable proxy. We therefore generate a variable for the mean years of schooling of
adult men and (separately) adult women in the household, and divide the sample into two groups: the
first group corresponds to households in which the average education of men was higher than that of
women, and the second group to households in which the average education of women was equal to
or higher than that of men. We then estimate BDH program effects separately in these two samples.
If greater relative schooling leads to a higher bargaining capacity, as seems likely, we would expect to
see larger program effects on the food share among households where women initially had
(relatively) less education than in those where women had more education than men. Once again, this
is the pattern of program effects we find.
As a way of motivating these results, we first run a regression of the food share at baseline on
the full set of controls and a dummy variable for female-only households. In this regression, the
coefficient on the female-only dummy is 0.060, with a standard error of 0.028. This coefficient has to
be treated with some caution because of the possible endogeneity of household formation, and
13
because adult women and men may have different caloric requirements. Nevertheless, the result is
consistent with women having preferences for food.
We next turn to regressions of BDH program effects on the food share for the various
breakdowns of the data described above. These regressions are based on the double-difference
specification, which is least likely to be biased. Also, we do not run the regressions that include
canton fixed effects because of the small number of observations for some breakdowns of the data—
for example, there are only 52 households that have only adult females at baseline and follow-up.
The regressions that analyze BDH effects by the relative education of men and women all include a
set of 13 dummy variables for the mean years of schooling of adults in the household (in integers).
This is important, as mean schooling could be correlated with differences in relative schooling levels,
and this could introduce biases. Finally, note that differences in caloric requirements are less likely to
be a source of concern for the results in Table 5 than for the baseline regressions: The comparisons in
Table 5 are between lottery winners and lottery losers—conditional on being a female-only or a
mixed-adult household, or conditional on educational levels of men and women in mixed-adult
households. Moreover, as is discussed above, there is no evidence that the BDH transfers affected the
labor market participation of adult men or women.
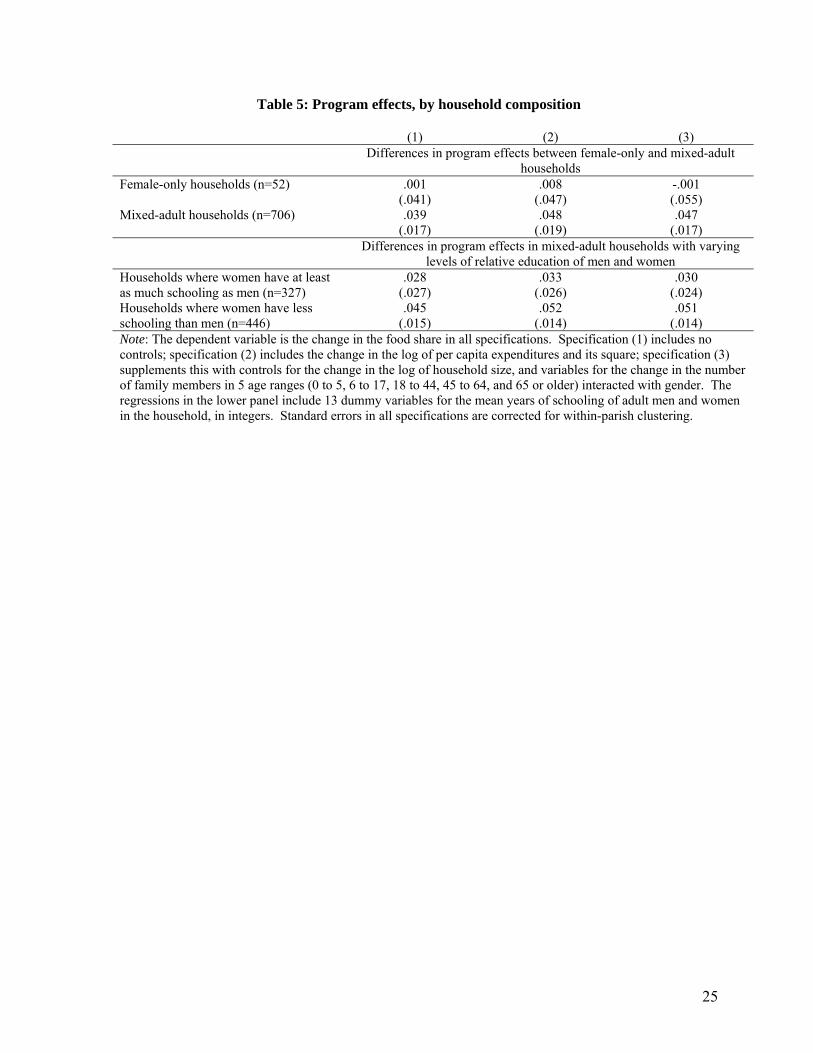
The results from these calculations are summarized in Table 5. The top panel in the table
presents the results from regressions for female-only and mixed-adult households. The first row
shows that the program effects in female-only households are very close to zero, while the second
row shows large and significant effects on the food share among mixed-adult households. The
bottom panel presents the results for mixed-adult households with different amounts of relative
schooling of men and women. These regressions show that program effects on the food share are
only significant in households in which the average schooling of women was lower than that of men.
On average, the point estimates for the sample of households in which the schooling of women was
lower are about 50 percent higher than those for the sample in which the education of women was as
high as or higher than that of men.
The results in Table 5 are not conclusive. The standard errors are too large for the differences
in program effects across categories to be significant. Also, one would ideally want to have an
experimental design in which transfers were randomly allocated to women in some households and to
men in others. Keeping these caveats in mind, however, Table 5 suggests that the upward shift in the
food Engel curve observed among BDH lottery winners is at least in part a result of female
preferences for food, as has been argued elsewhere (Thomas 1990; Hoddinot and Haddad 1995; Doss
2005), and a greater control of women over household resources after the program was implemented,
especially in households where the bargaining capacity of women was initially weak.
14
4. Conclusion
In the textbook model of the household, a dollar in the household budget is always a dollar,
no matter where it comes from, or who within the household receives it. There are a variety of
reasons why this simple model may not hold. One possibility is that the gender of recipient of cash
transfers matters because women have different preferences from men, and household resources are
not pooled completely.
There are a number of papers that test the unitary model of the household by comparing how
resources controlled by men and women are used (for example, Thomas 1990 and 1994; Lundberg,
Pollack, and Wales 1997). A key concern in this literature, and one which is discussed in these
papers, is the possible endogeneity of income controlled by men and women. In this paper, we use
random assignment of a cash transfer program to women in rural areas in Ecuador to analyze changes
in the food Engel curve. This experimental design limits concerns with endogeneity.
The basic finding of the paper is that households that were randomly assigned to receive cash
transfers have significantly higher food shares after the program. These program effects on the food
share are only found among mixed-adult households, and not among female-only households. When
the sample is limited to mixed-adult households, significant program effects are only found among
households where the bargaining capacity of women was initially likely to be weaker. Taken
together, these results are hard to reconcile with the unitary model of the household, in which all
resources are pooled. Rather, they suggest that the bargaining position of women improved after they
received transfers, and that women were then better able to influence the pattern of expenditures.
The food share has been used as a measure of household welfare ever since Engel’s own
pioneering study showed that the share of food in the budget decreases as income rises (Engel 1857).
“Engel’s Law” is an empirical regularity and, as Figure 1 shows, it holds in Ecuador as well. There
are, however, numerous reasons why the food share is a poor welfare measure (see, in particular, the
discussion in Deaton 1997). In Ecuador, households that received cash transfers, and who
presumably were better off as a result, have a higher food share, which clearly raises doubts about the
usefulness of the food share as a welfare measure. Moreover, the food Engel curves in rural Ecuador
show significant downward drift. This raises questions about a variety of applications which rely on a
stable food share as a critical assumption. For example, Costa (2001) uses data on the food and
recreation shares in the United States over time to correct for bias in the consumer price index.
Obviously, rural Ecuador and the United States are likely to differ in a large number of ways, but the
results in this (and other recent) papers that show a shifting food Engel curve point to the risks
inherent in assuming that the Engel curve is stable.
15
The findings in this paper also have operational implications. Conditional cash transfers in
Latin America have received considerable attention, and with good reason. For example,
PROGRESA has been shown to have positive effects on school enrollment (Schultz 2004; Behrman,
Sengupta, and Todd 2005) and child health (Gertler 2004; Behrman and Hoddinott 2005; Rivera et al.
2004). It is generally assumed that conditional cash transfers work through some combination of an
income effect and the change in relative prices associated with the condition. The analysis in this
paper shows that another characteristic of these programs—the fact that transfers are made to
women—may also be important. Compelling households to comply with conditions is costly both for
households and for the programs that are charged with monitoring compliance, so a better
understanding of what features of conditional cash transfer programs affect outcomes clearly has
operational implications. More generally, the results in this paper show that the gender of participants
is important for program design. To date, this has received considerable attention in some areas in
development, in particular in analysis of micro-finance schemes (for example, Pitt and Khandker
1998; Morduch 1999), but less in others. It is a fruitful area for additional experimentation and
research.
16
References
Angrist, J. 1997. “Conditional Independence in Sample Selection Models.” Economics Letters 54(2): 103-12.
Angrist, J., G. Imbens, and D. Rubin. 1996. “Identification of Casual Effects Using Instrumental Variables.” Journal of the American Statistical Association 91(434): 444-55.
Angrist, J., E. Bettinger, E. Bloom, E. King, and M. Kremer. 2002. “Vouchers for Private Schooling in Colombia: Evidence from a Randomized Natural Experiment.” American Economic Review 92(5): 1535-58.
Attanasio, O., and V. Lechene. 2002. “Tests of Income Pooling in Household Decisions.” Review of Economic Dynamics 5(4): 720-48.
Attanasio, O., and A. Mesnard. 2005. “The Impact of a Conditional Cash Transfer Programme on Consumption in Colombia.” Unpublished manuscript, The Institute for Fiscal Studies, London.
Becker, G. 1981. A Treatise on the Family. Cambridge: Harvard University Press.
Beegle, K., Frankenberg, E., and D. Thomas. 2001. “Bargaining Power within Couples and Reproductive Health Care Use in Indonesia.” Studies in Family Planning 32(2): 130-46.
Behrman, J., and J. Hoddinott. 2005. “Programme Evaluation with Unobserved Heterogeneity and Selective Implementation: The Mexican PROGRESA Impact on Child Nutrition.” Oxford Bulletin of Economics and Statistics 67(4): 547-69.
Behrman, J., P. Sengupta, and P. Todd. 2005. “Progressing through Progresa: An Impact Assessment of a School Subsidy Experiment in Mexico.” Economic Development and Cultural Change 54(1): 237-75.
Bourguignon, F., M. Browning, P. A. Chiappori, and V. Lechene. 1993. “Intra-Household Allocation of Consumption: A model and some Evidence from French Data.” Annales d’ Economie et de Statistique 29: 137-56.
Blundell, R., J. Banks, and A. Lewbell. 1997. “Quadratic Engel Curves and Consumer Demand.” Review of Economics and Statistics 79(4): 527-39.
Case, A., and A. Deaton. 1998. “Large Cash Transfers to the Elderly in South Africa.” Economic Journal 108(450): 1330-1361.
Chiappori, P. A. 1988. “Rational Household Labor Supply.” Econometrica 56(1): 63-89.
Chiappori, P. A. 1992. “Collective Labor Supply and Welfare.” Journal of Political Economy 100(3): 437-67.
Costa, D. 2001. “Estimating Real Income in the US from 1888 to 1994: Correcting CPI Bias using Engel Curves.” Journal of Political Economy 109(6): 1288-1310.
Deaton, A. 1997. The Analysis of Household Surveys: A Microeconometric Approach to Development Policy. Baltimore and London: Johns Hopkins University Press.
Deaton, A., and J. Dreze. 2007. “Indian Food Puzzles: Growth, Poverty, and (mal)nutrition.” Unpublished manuscript, Princeton University.
Doss, C. 2005. “The Effects of Intrahousehold Property Ownership on Expenditure Patterns in Ghana.” Journal of African Economies 15(1): 149-80.
Edmonds, E. 2002. “Reconsidering the Labeling Effect for Child Benefits: Evidence from a Transition Economy.” Economics Letters 76(3): 303-09.
17
Engel, E. 1857. “Die Productions- und consumtionsverhaeltnisse des Koenigreichs Sachsen.” In E. Engel, Die Lebenskosten belgischer arbeiter-familien. C. Heinrich: Dresden.
Fehr, E., and S. Gachter. 2000. “Fairness and Retaliation—The Economics of Reciprocity.” Journal of Economic Perspectives 14: 159-81.
Fehr, E., and K. Schmidt. 2007. “The Economics of Fairness, Reciprocity, and Altrusim.” In Handbook of Altrusim, Gift Giving and Reciprocity. North Holland: Amsterdam.
Fitzgerald, J., P. Gottschalk, and R. Moffitt. 1998. “An Analysis of Sample Attrition in Panel Data: The Michigan Panel Study of Income Dynamics.” The Journal of Human Resources 33(2): 251-99.
Frankenberg, E., and D. Thomas. 2003. “Household Decisions, Gender and Development: Measuring Power.” In A. Quisumbing., Ed., Household Decisions, Gender and Development: A Synthesis of Recent Research, International Food Policy Research Institute, Washington, D.C.
Gertler, P. 2004. “Do Conditional Cash Transfers Improve Child Health? Evidence from PROGRESA's Controlled Randomized Experiment.” American Economic Review 94(2): 331-336.
Hoddinott, J., and E. Skoufias. 2004. “The Impact of PROGRESA on Food Consumption.” Economic Development and Cultural Change 53(1): 37-61.
Hotchkiss, J.L. 2005. “Do Husbands and Wives Pool their Resources? Further Evidence.” Journal of Human Resources 40(2): 519-31.
Imbens, G., and J. Angrist. 1994. “Identification and Estimation of Local Average Treatment Effects.” Econometrica 62(2): 467-75.
Kahneman, D., and Tversky, A., eds. 2000. Choices, Values, and Frames. Cambridge University Press and the Russell Sage Foundation.
Kooreman, P. 2000. “The Labeling Effect of a Child Benefit System.” American Economic Review 90(3): 571-83.
Lanjouw, J., and Lanjouw, P. 1997. “Poverty Comparisons with Noncompatible Data: Theory and Illustrations.” World Bank Policy Research Working Paper 1709, Washington, D.C.
Lundberg, S., R. A. Pollack, T. J. Wales. 1997. “Do Husbands and Wives Pool their Resources? Evidence from the United Kingdom Child Benefit.” Journal of Human Resources 32(3): 463-80.
Maluccio, J., and R. Flores. 2004. “Impact Evaluation of a Conditional Cash Transfer Program: The Nicaraguan Red de Protección Social.” FCND Discussion Paper 184, International Food Policy Research Institute, Washington, D.C.
Morduch J. 1999. “The Microfinance Promise.” Journal of Economic Literature 37(4): 1569–1614.
Paxson, C., and N. Schady. 2007. “Does Money Matter? The Effects of Cash Transfers on Child Health and Development in Rural Ecuador.” World Bank Policy Research Working Paper 4226.
Pittm M. M. and S. Khandker. 1998. “The Impact of Group-Based Credit Programs on Poor Households in Bangladesh: Does the Gender of Participants Matter?” Journal of Political Economy 106(5): 958–96.
Rivera, J. A., D. Sotres-Alvarez, J. P. Habicht, T. Shamah and S. Villalpando. 2004. “Impact of the Mexican Program for Education, Health, and Nutrition (Progresa) on Rates of Growth and
18
Anemia in Infants and Young Children: a Randomized Effectiveness Study.” Journal of the American Medical Association 291(21): 2563-70.
Rubalcava, L., G. Teruel, and D. Thomas. 2005. “Spending, Savings, and Transfers Paid to Women.” Unpublished manuscript, University of California at Los Angeles.
Schady, N., and C. Araujo. 2006. “Cash Transfers, Conditions, and School Enrollment in Ecuador.” Unpublished manuscript, The World Bank.
Schultz, T. 2004. “School Subsidies for the Poor: Evaluating the Mexican Progresa Poverty Program.” Journal of Development Economics 74: 199-250.
Thaler, R. H. 1999. “Mental Accounting Matters.” Journal of Behavioral Decision Making 12: 183-206.
Thomas, D. 1986. “The Food Share as a Welfare Measure.” Ph.D. dissertation, Department of Economics, Princeton University.
Thomas, D. 1990. “Intra-household Resource Allocation: An Inferential Approach.” Journal of Human Resources 25(4): 635-64.
Thomas, D. 1994. “Like Father, Like Son, Like Mother, Like Daughter: Parental Resources and Child Height.” Journal of Human Resources 29(4): 950-88.
Ward-Batts. J. 2003. “Out of the Wallet and into the Purse: Using Micro Data to Test Income Pooling.” Unpublished manuscript, Department of Economics, Claremont McKenna College.
World Bank, and Secretaría Técnica del Frente Social. 2006. “Evaluación de impacto del Bono de Desarrollo Humano.” Presentation made at the Central Bank of Ecuador.
19
Figure 1: Non-parametric food Engel curves
A. Baseline
.5.4
5.5
5Fo
od s
hare
.4.3
5
1.5 2 2.5 3 3.5 4Log of per capita expenditures
Lottery losers Lottery winners
B. Follow-up
.5.4
5.5
5Fo
od s
hare
.4.3
5
1.5 2 2.5 3 3.5 4Log of per capita expenditures
Lottery losers Lottery winners
20
Table 1: Descriptive statistics at baseline
Mean: households who lost
BDH lottery Difference
Log per capita expenditures 2.83 (.571)
-.022 (.027)
Log per capita food expenditures 2.15 (.605)
-.061 (.036)
Food share .538 (.168)
-.013 (.012)
Household size 5.35 (1.77)
.010 (.143)
Education of household head 4.16 (2.81)
.020 (.146)
Household head is male .856 (.352)
-.018 (.038)
Age of household head 46.46 (9.66)
-.601 (.672)
Household head is indigenous .158 (.366)
.001 (.027)
Household head is married .836 (.371)
-.044 (.030)
Mean: households who did not receive BDH transfers
Difference
Log per capita expenditures 2.84 (.569)
-.039 (.039)
Log per capita food expenditures 2.19 (.612)
-.125 (.049)
Food share .548 (.163)
-.032 (.013)
Household size 5.20 (1.85)
.293 (.155)
Education of household head 3.85 (2.95)
.623 (.155)
Household head is male .828 (.378)
.034 (.025)
Age of household head 47.18 (10.20)
-1.99 (.714)
Household head is indigenous .180 (.385)
-.039 (.032)
Household head is married .785 (.412)
.053 (.028)
Note: Standard errors corrected for within-parish clustering. Sample size is 773.
21
Table 2: Comparison of the evaluation sample with national and parish-level averages
Impact evaluation sample at baseline
1998/99 LSMS 2001 Census
Household size
5.77 (1.84)
5.65 (2.12)
4.19 (1.51)
Number of rooms in house
2.61 (1.20)
3.00 (1.50)
3.31 (2.32)
Water from network
0.45 (0.50)
0.78 (0.42)
0.78 (0.41)
Has toilet
0.24 (0.43)
0.78 (0.44)
0.72 (0.45)
Has dirt floor
0.28 (0.45)
0.13 (0.35)
0.18 (0.39)
Age of head of household
44.96 (9.33)
44.11 (12.59)
42.70 (12.94)
Education of household head
4.47 (2.77)
7.14 (4.81)
7.03 (5.02)
Household head is male
0.85 (0.36)
0.81 (0.39)
0.77 (0.42)
Household head is literate
0.83 (0.38)
0.87 (0.34)
0.91 (0.29)
Household head is indigenous
0.16 (0.36)
0.08 (0.28)
0.17 (0.38)
Note: The table presents means and standard deviations. Calculations from the 1998/99 LSMS and the 2001 Census are limited to households with children ages 6-17; calculations from the census refer only to parishes included in the impact evaluation sample. Source: Schady and Araujo (2006)
22
Table 3: Program effects on food share (1) (2) (3) (4) (5) Single difference Lottery winner .023
(.011) .025
(.011) .025
(.011) .022
(.010) .016
(.014) Log pce .243
(.074) .260
(.070) .286
(.063) -.052 (.108)
Log pce squared -.049 (.012)
-.053 (.011)
-.057 (.011)
-.023 (.018)
Log HH size -.045 (.020)
-.047 (.020)
-.121 (.025)
Demographic controls No No Yes Yes Yes Canton FE No No No Yes Yes R-squared 0.005 0.051 0.073 0.107 Double-difference Lottery winner .033
(.016) .043
(.016) .042
(.015) .037
(.016) .029
(.023) Log pce .405
(.069) .399
(.074) .393
(.072) -.099 (.153)
Log pce squared -.077 (.012)
-.076 (.012)
-.075 (.012)
-.024 (.024)
Log HH size -.070 (.039)
-.071 (.039)
-.189 (.045)
Demographic controls No No Yes Yes Yes Canton FE No No No Yes Yes R-squared 0.007 0.090 0.099 0.127 Note: The dependent variable is the food share at follow-up in the single-difference specifications, and the change in the food share in the double-difference specifications. Specification (1) includes no controls; specification (2) includes the log of per capita expenditures and its square; specification (3) supplements this with controls for the log of household size, and variables for the number of family members in 5 age ranges (0 to 5, 6 to 17, 18 to 44, 45 to 64, and 65 or older) interacted with gender; specification (4) also includes a vector of canton-level fixed effects. In the instrumental variables specification in (5) the log of per capita expenditures and its square is instrumented with the log of non-food expenditures and its square. This specification also includes the vector of demographic controls and canton fixed effects. Standard errors in all specifications are corrected for within-parish clustering. Sample size is 773 in all regressions.
23
Table 4: Respondent’s report of what BDH transfers were spent on All Most A little None
Food 19.21 30.02 30.19 20.58 Health 3.04 4.83 24.51 67.62 Housing 0.90 1.26 4.33 93.50 Education 4.29 6.44 23.79 65.47 Transportation --- 0.72 38.81 60.47 Clothes 4.51 6.86 22.74 65.88 Goods for husband -- -- 1.65 98.35 Note: Mothers were asked “How much of the bono was spent on [item listed in first column]?” Each row of the table shows the distribution of mothers’ responses to these questions. The sample consists of all mothers of children in the analysis sample who reported receiving BDH transfers. Source: Paxson and Schady (2007)
24
Table 5: Program effects, by household composition
(1) (2) (3) Differences in program effects between female-only and mixed-adult
households Female-only households (n=52) .001
(.041) .008
(.047) -.001 (.055)
Mixed-adult households (n=706) .039 (.017)
.048 (.019)
.047 (.017)
Differences in program effects in mixed-adult households with varying levels of relative education of men and women
Households where women have at least as much schooling as men (n=327)
.028 (.027)
.033 (.026)
.030 (.024)
Households where women have less schooling than men (n=446)
.045 (.015)
.052 (.014)
.051 (.014)
Note: The dependent variable is the change in the food share in all specifications. Specification (1) includes no controls; specification (2) includes the change in the log of per capita expenditures and its square; specification (3) supplements this with controls for the change in the log of household size, and variables for the change in the number of family members in 5 age ranges (0 to 5, 6 to 17, 18 to 44, 45 to 64, and 65 or older) interacted with gender. The regressions in the lower panel include 13 dummy variables for the mean years of schooling of adult men and women in the household, in integers. Standard errors in all specifications are corrected for within-parish clustering.