ARE CEOS REWARDED FOR LUCK? THE ONESWITHOUT PRINCIPALS ARE*
MARIANNE BERTRAND AND SENDHIL MULLAINATHAN
The contracting view of CEO pay assumes that pay is used by shareholders tosolve an agency problem. Simple models of the contracting view predict that payshould not be tied to luck, where luck is defined as observable shocks to perfor-mance beyond the CEO’s control. Using several measures of luck, we find thatCEO pay in fact responds as much to a lucky dollar as to a general dollar. Askimming model, where the CEO has captured the pay-setting process, is consis-tent with this fact. Because some complications to the contracting view could alsogenerate pay for luck, we test for skimming directly by examining the effect ofgovernance. Consistent with skimming, we find that better governed firms paytheir CEO less for luck.
I. INTRODUCTION
CEO pay is usually viewed through the lens of principalagent models. Under this contracting view, pay is used to reducethe moral hazard problem that arises because CEOs often ownvery little of the firms they control. Shareholders (perhaps actingthrough the board or the compensation committee) optimallydesign the pay package in order to increase the CEO’s incentive tomaximize firm value.1 Simple models of the contracting viewgenerate one important prediction. Shareholders will not rewardCEOs for observable luck. By luck, we mean changes in firmperformance that are beyond the CEO’s control. Tying pay to
* The results in this paper were previously circulated as part of a largerworking paper entitled “Do CEOs Set Their Own Pay? The Ones Without Princi-pals Do.” We are extremely grateful to Daron Acemoglu, Rajesh Aggarwal, GeorgeBaker, Patrick Bolton, Peter Diamond, Robert Gibbons, Denis Gromb, Brian Hall,Bengt Holmstrom, Caroline Hoxby, Glenn Hubbard, Lawrence Katz, Jorn-SteffenPischke, Nancy Rose, David Scharfstein, Robert Shimer, Andrei Shleifer, RichardThaler, and seminar participants at the University of California at Berkeley,Columbia University, the University of Chicago, Harvard University, the Mas-sachusetts Institute of Technology, Princeton University, and the National Bu-reau of Economic Research Corporate Finance Summer Institute 1999 for veryhelpful comments. We thank Kenneth Ayotte and Michael Mitton for excellentresearch assistance, Michael Haid for giving us access to his data set of oilcompanies, and David Yermack for giving us access to his data on executivecompensation. Financial support was provided by the Russell Sage Foundation,the Princeton Industrial Relations Section, and the Princeton Center for EconomicPolicy Studies. e-mail: [email protected]; [email protected].
1. Murphy [1985, 1986] is a forerunner of the vast empirical literature on thecontracting view. Murphy [1999] and Abowd and Kaplan [1999] summarize theCEO pay literature. Formal tests of the contracting view can be found in Gibbonsand Murphy [1990, 1992], Garen [1994], Hubbard and Palia [1994], Bertrand andMullainathan [1999], and Aggarwal and Samwick [1999a, 1999b].
luck, therefore, cannot provide better incentives and will onlymake the contract riskier [Holmstrom 1979].2
This paper starts by examining whether or not CEOs are infact paid for luck using three measures of luck.3 First, we performa case study of the oil industry where large movements in oilprices tend to affect firm performance on a regular basis. Second,we use changes in industry-specific exchange rate for firms in thetraded goods sector. Third, we use year-to-year differences inmean industry performance to proxy for the overall economicfortune of a sector.4 For all three measures, we find that CEO payresponds significantly to luck. In fact, we find that CEO pay is assensitive to a lucky dollar as to a general dollar. Moreover, theseresults hold as well for discretionary components of pay—salaryand bonus—as they do for options grants.
These results are inconsistent with a simple contractingview. Motivated by practitioners such as Crystal [1991], we pro-pose an alternative, skimming, which can explain these results[Bertrand and Mullainathan 2000a]. The skimming view alsobegins with the separation of ownership and control, but it arguesthat this separation allows CEOs to gain effective control of thepay-setting process itself. Both because of entrenchment, such aspacking the board with supporters, and because of the complexityof the pay process, many CEOs de facto set their own pay withlittle oversight from shareholders. Their pay level then becomesconstrained by an unwillingness to draw shareholders’ attention.Pay for performance arises in the skimming view because goodperformance may ease these constraints, in essence creating
2. Note our emphasis on observable luck. In any model, given the random-ness of the world, CEOs (and almost everybody else) will end up being rewardedfor unobservable luck. Note also our emphasis on the fact that this predictionholds in simple agency models. As we will discuss shortly, complications to theagency model can in principle alter this result.
3. Blanchard, Lopez-de-Silanes, and Shleifer [1994] present suggestive evi-dence on pay for luck by showing that windfall gains from court rulings raise thepay of CEOs. It is only suggestive since court rulings may not be luck but rathera result of the CEO’s work. In other domains, Shea [1999] independently performsan exercise similar to ours for baseball players.
4. This last test very much resembles the approach followed in the relativeperformance evaluation (RPE) literature [Gibbons and Murphy 1990; Janakira-man, Lambert, and Larcker 1992; Aggarwal and Samwick 1999a]. Problems canarise with RPE as a special case of luck. Filtering this specific kind of luck may notbe optimal from an agency theoretical point of view. As Gibbons and Murphy[1990] note, relative performance evaluation can distort CEO incentives if theycan “take actions that affect the average output of the reference group.” Aggarwaland Samwick [1999b] develop a formal model along these lines. By using othershocks to performance that are even more objectively beyond managerial influ-ence, we circumvent these problems.
slack for the CEO. In other words, when the firm is doing well,shareholders are less likely to notice a large pay package. To theextent that lucky dollars create slack as readily as general dol-lars, pay for luck arises.
Finding pay for luck, however, does not necessarily single outthe skimming model. Complications to the agency model canmake it such that paying for luck is in fact optimal. For example,suppose that the value of a CEO’s human capital rises and fallswith industry fortunes. One would then find that pay correlateswith luck because the CEO’s outside wage moves with luck.Another possibility is that boards may tie pay to luck in order tomotivate CEOs to forecast or respond to luck shocks. SubsectionII.D discusses whether arguments such as these can really ex-plain the pay for luck relationship.
To further differentiate skimming from these explanations,we empirically examine a direct implication of the skimmingmodel. Skimming should be less prevalent in better governedfirms. Well-governed firms, such as those with a large share-holder present on the board, limit the CEO’s ability to capture thepay process. We test this hypothesis using several measures ofgovernance: presence of large shareholders (on the board andoverall), CEO tenure (interacted with the presence of large share-holders to better proxy for entrenchment), board size, and frac-tion of directors that are insiders. Consistent with skimming, wegenerally find that the better governed firms pay less for luck.5
These effects are strongest for the presence of large shareholderson the board. An additional large shareholder on the board re-duces pay for luck by between 23 and 33 percent. Large share-holders are especially important as CEO tenure increases, con-sistent with the idea that unchecked CEOs can entrenchthemselves over time. If pay for luck were optimal, we would haveexpected well-governed firms to pay for luck as much as (if notmore than) poorly governed firms. For example, whether or not alarge shareholder is present, the CEO would have to be rewardedfor a rise in the value of his human capital. These findingssuggest that at least some of the pay for luck in poorly governedfirms is due to skimming by CEOs.
5. Whenever we refer to “less pay for luck” we mean that there is less pay forluck relative to the amount of pay for performance. Thus, these results would notbe driven by well-governed firms simply giving less overall pay for performance.In fact, we find that governance correlates very little with pay for performance,only with pay for luck.
A simple theoretical model will make more precise whatagency theory says about the reward for observable luck. Con-sider a standard agency setup where risk-neutral shareholderstry to induce a risk-averse top manager to maximize firm perfor-mance. Since the actions of the CEO can be hard to observe,shareholders will be unable to sign a contract that specifies theseactions. Instead, shareholders will offer a contract to the CEOwhere her compensation level is made to depend on the firm’sperformance. Let p represent firm performance and a the CEO’sactions, which by assumption are unobservable to the sharehold-ers. Firm performance depends on the actions of the CEO and onrandom factors. We split the random factors into two components:those that can be observed by shareholders and those that cannot.For an oil firm, the price of crude oil would be an observablerandom factor. Letting o be the observable factor and u be theunobservable noise term, we assume that performance can bewritten as p 5 a 1 do 1 u.
Under some technical conditions (CARA utility and Brown-ian motion for the performance process), Holmstrom and Milgrom[1987] calculate the optimal incentive scheme for this model. Lets denote this incentive scheme. Since shareholders can only ob-serve two variables, p and o, the incentive scheme could at mostdepend on these two variables. In fact, shareholders will onlyreward CEOs for performance net of the observable factor:
(1) s 5 a 1 b~ p 2 do! 5 a 1 b~a 1 u!.
In other words, the optimal incentive scheme filters the ob-servable luck from performance. This is because leaving o in theincentive scheme provides no added benefit to the principal as, bydefinition, the agent has no control over o. Motivating her on ohas no incentive effects. Beyond providing no benefit, tying pay toluck actually costs the principal because the variance of theincentive scheme is higher, and the principal must increase meanpay to compensate the risk-averse CEO.
In practice, explicit incentive contracts, such as options,rarely filter. For example, options are rarely if ever indexedagainst market performance. This need not be inconsistent witha lack of filtering, however. It may be that the discretionarycomponents of pay, such as salary and bonus, are the ones used to
filter. In theory, these other components could adjust enough toundo the effect of the options value fluctuating with luck. Suchadjustment may happen if a board were to monitor luck and altereach year’s salary, bonus, and number of new options granted sothat the CEO’s overall pay package remains free of luck.
II.B. Empirical Methodology
Within the agency framework, most of the empirical litera-ture on CEO pay estimates an equation of the form,
(2) yit 5 b p perfit 1 gi 1 xt 1 aX p Xit 1 eit,where yit is total CEO compensation in firm i at time t, perfit isa performance measure, gi are firm fixed effects, xt are time fixedeffects, and Xit are firm- and CEO-specific variables such as firmsize and tenure. The coefficient b captures the strength of the payfor performance relationship.
Performance is typically measured either as changes in ac-counting returns or stock market returns, and we will use bothmeasures.6 In measuring compensation yit, much of the literaturefocuses on the flow of new compensation. Ideally, the compensa-tion in a given year would also include changes in the value ofunexercised options granted in previous years [Hall and Liebman1998]. Such a calculation requires data on the accumulated stockof options held by the CEO each year, whereas existing data sets,including ours, contain only information on new options grantedeach year. Consequently, our compensation measure excludesthis component of the change in wealth. For our purposes, how-ever, this exclusion does not pose much of a problem. The changein wealth due to changing option values is mechanically tied toluck since options are not indexed. Thus, even if these data wereavailable, focusing on the subjective components of pay wouldstill be a natural strategy. We discuss this issue at greater lengthin subsection II.D.
To estimate the general sensitivity of pay to performance, wewill follow the literature and estimate equation (2) using a stan-dard Ordinary Least Squares (OLS) model. To estimate the sen-sitivity of pay to luck, we need to use a two-stage procedure. Inthe first stage, we will predict performance using luck in order toisolate changes in performance that are caused by luck. In the
6. These are flow measures. In practice, given the firm fixed effects, we willuse market value and level of accounting returns as measures of perfit.
second stage, we will see how sensitive pay is to these predictablechanges in performance. This two-stage procedure is essentiallyan Instrumental Variables (IV) estimation where the luck vari-able is the instrument for performance.7
Letting o be luck, the first equation we estimate is
perfit 5 b p oit 1 gi 1 ct 1 aX p Xit 1 eit,where oit represents the luck measure (oil price, for example).From this equation we predict a firm’s performance using onlyinformation about luck. Call this predicted value perfit. We thenask how pay responds to these predictable changes in perfor-mance due to luck:
yit 5 bLuck p perfit 1 gi 1 xt 1 aX p Xit 1 eit.The estimated coefficient bLuck indicates how sensitive pay is tochanges in performance that come from luck. Since such changesshould be filtered, basic agency theory predicts that bLuck shouldequal 0.
II.C. Oil Industry Study
We now turn to the oil industry as a case study of pay forluck. As Figures I and II show, the price of crude oil has fluctu-ated dramatically over the last 25 years. These large fluctuationshave caused large movements in industry profits. Moreover, theselarge fluctuations in crude oil prices are likely to have beenbeyond the control of a single American CEO. For example, thesharp decline in crude oil price at the end of 1985 was caused bySaudi Arabia’s decision to reform its petroleum policy and toincrease production, an action hardly attributable (and neverattributed) to the CEOs of American oil firms. Similarly, the largeoil price increase between 1979 and 1981 is usually attributed toan internal policy change by OPEC. Oil price movements there-fore provide an ideal place to test for pay for luck: they affect
7. One might wonder why we should use this procedure rather than simplyinclude o directly into the pay for performance equation (2) and run OLS toestimate
yit 5 b p perfit 1 f p o 1 gi 1 xt 1 ax p Xit 1 eit.
This equation is hard to interpret, however. Even if there is no pay for luck, thecoefficient f will not equal 2b but rather 2bd, as we can see from equation (1).Since we do not estimate d, the estimated coefficient f can be small either becausethere is pay for luck or simply because d is small. The first equation in the IVprocedure circumvents this problem by scaling the effect of luck on performance.
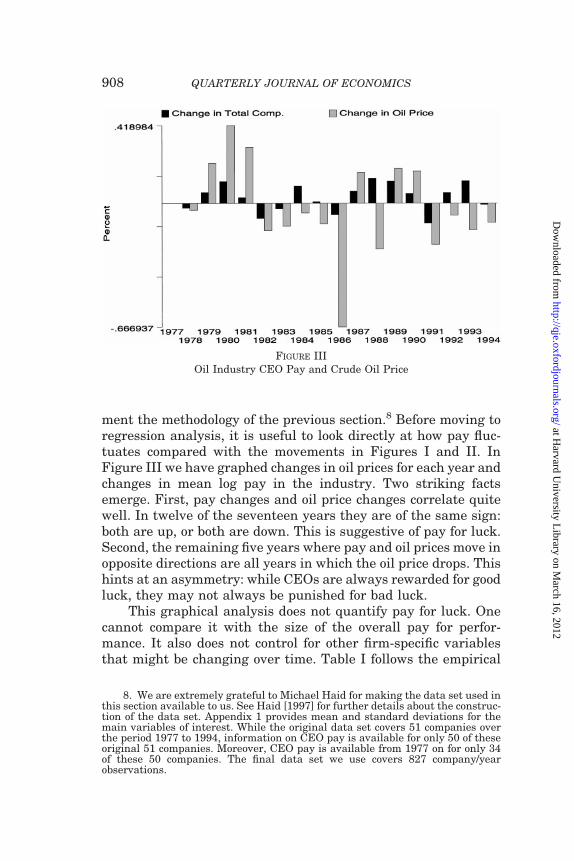
ment the methodology of the previous section.8 Before moving toregression analysis, it is useful to look directly at how pay fluc-tuates compared with the movements in Figures I and II. InFigure III we have graphed changes in oil prices for each year andchanges in mean log pay in the industry. Two striking factsemerge. First, pay changes and oil price changes correlate quitewell. In twelve of the seventeen years they are of the same sign:both are up, or both are down. This is suggestive of pay for luck.Second, the remaining five years where pay and oil prices move inopposite directions are all years in which the oil price drops. Thishints at an asymmetry: while CEOs are always rewarded for goodluck, they may not always be punished for bad luck.
This graphical analysis does not quantify pay for luck. Onecannot compare it with the size of the overall pay for perfor-mance. It also does not control for other firm-specific variablesthat might be changing over time. Table I follows the empirical
8. We are extremely grateful to Michael Haid for making the data set used inthis section available to us. See Haid [1997] for further details about the construc-tion of the data set. Appendix 1 provides mean and standard deviations for themain variables of interest. While the original data set covers 51 companies overthe period 1977 to 1994, information on CEO pay is available for only 50 of theseoriginal 51 companies. Moreover, CEO pay is available from 1977 on for only 34of these 50 companies. The final data set we use covers 827 company/yearobservations.
FIGURE IIIOil Industry CEO Pay and Crude Oil Price
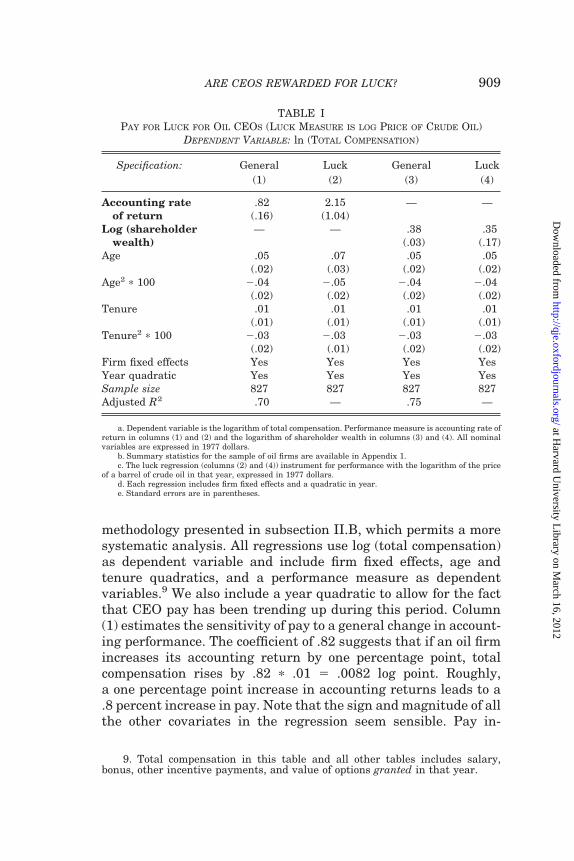
methodology presented in subsection II.B, which permits a moresystematic analysis. All regressions use log (total compensation)as dependent variable and include firm fixed effects, age andtenure quadratics, and a performance measure as dependentvariables.9 We also include a year quadratic to allow for the factthat CEO pay has been trending up during this period. Column(1) estimates the sensitivity of pay to a general change in account-ing performance. The coefficient of .82 suggests that if an oil firmincreases its accounting return by one percentage point, totalcompensation rises by .82 p .01 5 .0082 log point. Roughly,a one percentage point increase in accounting returns leads to a.8 percent increase in pay. Note that the sign and magnitude of allthe other covariates in the regression seem sensible. Pay in-
9. Total compensation in this table and all other tables includes salary,bonus, other incentive payments, and value of options granted in that year.
TABLE IPAY FOR LUCK FOR OIL CEOS (LUCK MEASURE IS LOG PRICE OF CRUDE OIL)
DEPENDENT VARIABLE: ln (TOTAL COMPENSATION)
Specification: General Luck General Luck(1) (2) (3) (4)
Accounting rateof return
.82 2.15 — —(.16) (1.04)
Log (shareholderwealth)
— — .38 .35(.03) (.17)
Age .05 .07 .05 .05(.02) (.03) (.02) (.02)
Age2 p 100 2.04 2.05 2.04 2.04(.02) (.02) (.02) (.02)
Tenure .01 .01 .01 .01(.01) (.01) (.01) (.01)
Tenure2 p 100 2.03 2.03 2.03 2.03(.02) (.01) (.02) (.02)
a. Dependent variable is the logarithm of total compensation. Performance measure is accounting rate ofreturn in columns (1) and (2) and the logarithm of shareholder wealth in columns (3) and (4). All nominalvariables are expressed in 1977 dollars.
b. Summary statistics for the sample of oil firms are available in Appendix 1.c. The luck regression (columns (2) and (4)) instrument for performance with the logarithm of the price
of a barrel of crude oil in that year, expressed in 1977 dollars.d. Each regression includes firm fixed effects and a quadratic in year.e. Standard errors are in parentheses.
creases with age and to a lesser extent with tenure. Both the ageand tenure profile are concave (the negative coefficient on thequadratic term).
Column (2) estimates the sensitivity of pay to luck. As de-scribed above, we instrument for performance with the log of oilprice.10 The coefficient in column (2) now rises to 2.15. Thissuggests that a one percentage point rise in accounting returnsdue to luck raises pay by 2.15 percent. Given the large standarderrors, one cannot reject that the pay for luck coefficient and payfor general performance coefficient are the same. One can, how-ever, strictly reject the hypothesis of complete filtering: oil CEOsare paid for luck that comes from oil price movements.
Columns (3) and (4) perform the same exercise for a marketmeasure of performance, shareholder wealth. The coefficient of.38 on column (3) suggests that a 1 percent increase in share-holder wealth leads to roughly a .38 percent increase in CEO pay.In column (4) we find that a 1 percent increase in shareholderwealth due to luck leads to .35 percent increase in CEO pay.Again, pay for luck matches pay for general performance.
II.D. More General Tests
The oil industry case study, while instructive, raises thequestion of how generalizable these results are. In this subsectionwe will examine luck shocks that affect a broader set of firms. Wefocus on two measures of luck: movements in exchange rates andmean industry performance. By affecting the extent of importpenetration and hence foreign competition, exchange rate move-ments can strongly affect a firm’s profitability.11 Movements inmean industry performance also proxy for luck to the extent thata CEO does not influence how the rest of her industry performs.As we mentioned before, this last instrument is more question-able. In practice, however, we find that mean industry move-ments operate exactly like exchange rate or oil price movements.
To implement these tests, we use compensation data on 792large corporations over the 1984–1991 period. The data set wasgraciously made available to us by David Yermack and AndreiShleifer. It is extensively described in Yermack [1995]. Compen-
10. This table does not report the first-stage regressions of performance on oilprice. But as one would expect from Figures I and II, these regressions show verysignificant coefficients on oil price ( p , .001).
11. Revenga [1992] uses exchange rates as an instrument for import pene-tration. Bertrand [1999] shows its effects on firm profitability.
sation data were collected from the corporations’ SEC Proxy,10-K, and 8-K fillings. Other data were transcribed from theForbes magazine annual survey of CEO compensation as well asfrom SEC Registration statements, firms’ Annual Reports, directcorrespondence with firms, press reports of CEO hires and depar-tures, and stock prices published by Standard & Poor’s. Firmswere selected into the sample on the basis of their Forbes rank-ings. Forbes magazine publishes annual rankings of the top 500firms on four dimensions: sales, profits, assets and market value.To qualify for the sample, a corporation must appear in one ofthese Forbes 500 rankings at least four times between 1984 and1991. In addition, the corporation must have been publicly tradedfor four consecutive years between 1984 and 1991.
Yermack’s data are attractive in that they provide both gov-ernance variables and information on options granted, not justinformation on options exercised. But they do not include changesin the value of options held, which we must therefore excludefrom our compensation measure. If anything, this biases us to-ward understanding the amount of pay for luck. Since options arenot indexed, changes in the value of options held will covaryperfectly with luck. Including these changes in the compensationmeasure would only increase the measured pay for luck. Thisdata limitation, therefore, is less of a concern for our purposes.
Table II presents summary statistics for the main variablesof interest in the full Yermack data.12 All nominal variables areexpressed in 1991 dollars. The average CEO earns $900,000 insalary and bonus. His total compensation is nearly twice thatamount at $1,600,000. The difference indicates the large fractionof a CEO’s pay that is due to options grants. The average CEO isroughly 57 years old and has been CEO of the firm for nine years.As far as governance goes, the average firm in our sample has1.12 large shareholders, of which less than a fourth are sitting onthe board. There are on average thirteen directors on a board.Forty-two percent of them are insiders.13
12. In practice, depending on the required regressors, the various tests in thefollowing sections will be performed on various subsamples of the original data.None of these main variables of interest significantly differ in any of thesesubsamples.
13. Technically, we define insiders to be both inside and gray directors. Aninside director is defined as a director who is a current or former officer of thecompany. A gray director is a relative of a corporate officer, or someone who hassubstantial business relationships with the company outside the course of regularbusiness.
Our first general measure of luck focuses on exchange ratemovements. We exploit the fact that exchange rates between theU. S. dollar and other country currencies fluctuate greatly overtime. We also exploit the fact that different industries are affectedby different countries’ exchange rates. For example, since the toyindustry may be more affected by Japanese imports while thelumber industry may be more affected by Bolivia, these twoindustries may experience very different shocks in the same year.This allows us to construct industry-specific exchange rate move-ments which are arguably beyond a specific CEO’s control sincethey are primarily determined by macroeconomic variables. Theexchange rate shock measure is based on the weighted average ofthe log real exchange rates for importing countries by industry.The weights are the share of each foreign country’s import in totalindustry imports in a base year (1981–1982). Real exchange ratesare nominal exchange rates (expressed in foreign currency perdollar) multiplied by U. S. CPI and divided by the foreign countryCPI. Nominal exchange rates and foreign CPIs are from theInternational Financial Statistics of the International MonetaryFund.
TABLE IISUMMARY STATISTICS: FULL YERMACK CEO SAMPLE
Mean S. D.
Age of CEO 57.42 6.84Tenure of CEO 9.10 8.08Salary and bonus 901.69 795.15ln (Salary and bonus) 6.62 .60Total compensation 1595.85 3488.32ln (Total compensation) 6.98 .81Number of large shareholders (All) 1.12 1.42Number of large shareholders on board .24 .74Board size 13.45 4.54Fraction of insiders on board .42 .19
a. Sample period is 1984–1991.b. All nominal variables are expressed in thousands of 1991 dollars.c. Column 1 is the mean for each variable, while column 2 is the standard deviation.d. A large shareholder is defined as someone who owns more than 5 percent of the common shares in
the company, excluding the CEO. Insiders here denote directors who are current or former officers of thecompany, relatives of corporate officers, or anyone who has a substantial business relationship withthe company. Relationships arising in the normal course of business would not be called an insider. Ourinsider definition corresponds to insider 1 gray in the original Yermack data.
e. Total compensation equals salary plus bonus plus total value of options grants plus othercompensation.
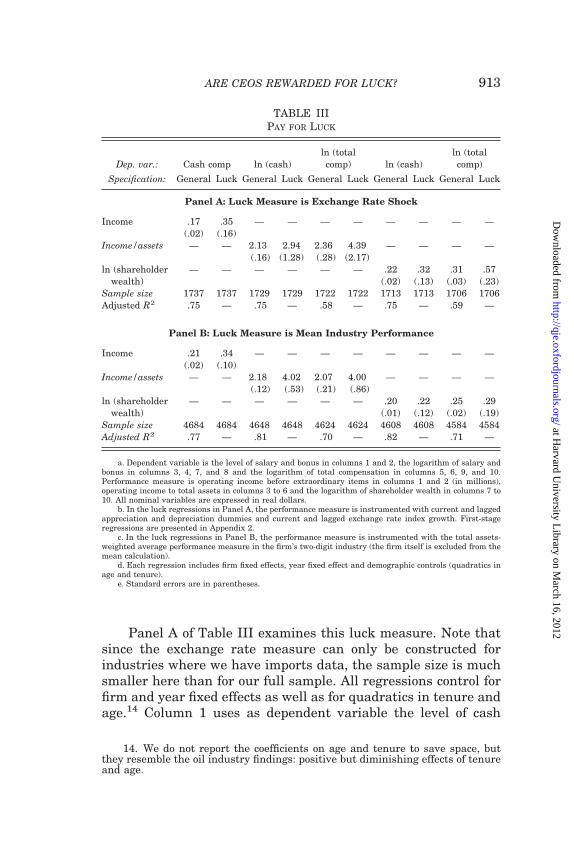
Panel A of Table III examines this luck measure. Note thatsince the exchange rate measure can only be constructed forindustries where we have imports data, the sample size is muchsmaller here than for our full sample. All regressions control forfirm and year fixed effects as well as for quadratics in tenure andage.14 Column 1 uses as dependent variable the level of cash
14. We do not report the coefficients on age and tenure to save space, butthey resemble the oil industry findings: positive but diminishing effects of tenureand age.
a. Dependent variable is the level of salary and bonus in columns 1 and 2, the logarithm of salary andbonus in columns 3, 4, 7, and 8 and the logarithm of total compensation in columns 5, 6, 9, and 10.Performance measure is operating income before extraordinary items in columns 1 and 2 (in millions),operating income to total assets in columns 3 to 6 and the logarithm of shareholder wealth in columns 7 to10. All nominal variables are expressed in real dollars.
b. In the luck regressions in Panel A, the performance measure is instrumented with current and laggedappreciation and depreciation dummies and current and lagged exchange rate index growth. First-stageregressions are presented in Appendix 2.
c. In the luck regressions in Panel B, the performance measure is instrumented with the total assets-weighted average performance measure in the firm’s two-digit industry (the firm itself is excluded from themean calculation).
d. Each regression includes firm fixed effects, year fixed effect and demographic controls (quadratics inage and tenure).
compensation. Thus, relative to our standard specification, we donot run this regression in logs and do not include value of optionsgranted. Since profits are reported in millions and pay is reportedin thousands, the coefficient of .17 in column 1 suggests that$1000 increase in profits leads to a 17 cent increase in perfor-mance. Column 2 performs the same exercise for pay for luck: weinstrument for performance using the exchange rate shocks.15 Asin the oil case, we find a pay for luck coefficient that is of the sameorder of magnitude as the pay for general performance coefficient.
Columns 3 through 6 run the more standard regressionwhere we use the logarithm of pay and an accounting measure ofperformance (operating income divided by total assets). In col-umns 3 and 4 we use only cash compensation, while in columns 5and 6 we use total compensation. In both cases, we find thesensitivity of pay to luck to be about the same as the sensitivity ofpay to general performance. When accounting performance risesby one percentage point, compensation (either total or cash) risesby about 2 percent, whether that rise was due to luck—exchangerate movements—or not.
Columns 7 through 9 replicate these four columns for marketmeasures of performance. Again, we find pay for luck thatmatches the pay sensitivity to a general shock. A 1 percentincrease in shareholder wealth raises pay (again either total orcash) of about .3 percent, irrespective of whether this rise wascaused by luck or not.
Two important points should be taken away from this panel.First, the average firm rewards its CEO as much for luck as itdoes for a general movement in performance. There seems to bevery little if any filtering at all. Since we use a totally differentshock, these findings address theoretical concerns about the useof mean industry shocks (such as those raised in Gibbons andMurphy [1990] and Aggarwal and Samwick [1999b]) and showthat the lack of filtering observed in RPE findings generalizes toother sources of luck.
Second, there is as much pay for luck on discretionary com-ponents of pay (salary and bonus) as there is on other components
15. First-stage regressions are reported in Appendix 2. In practice, we use asinstruments continuous variables for exchange rate appreciation (current andlagged) as well as dummies to allow for nonlinear effects of appreciation (alsocurrent and lagged). The dummies are formed at the 2 and 4 percent cutoffs bothfor appreciation and depreciation. The instruments are jointly highly significant,with first-stage p-values of less than 1 percent in all cases.
such as options granted. This rules out the notion that pay forluck mechanically arises because firms commit (implicitly or ex-plicitly) to multiyear stock option plans where the number ofoptions grants is fixed ahead of time. Under such plans, as firmvalue rises, so does the value of precommitted options grants[Hall 1999]. Because salary and bonus are the most subjectivecomponents of pay, finding pay for luck on these variables is verysuggestive. Boards are rewarding CEOs for luck even when theycould filter it.
In Panel B of Table III, we replicate Panel A except that ourmeasure of luck becomes mean performance of the industry,which is meant to capture external shocks that are experiencedby all the firms in the industry. More specifically, as an instru-ment for firm-level rate of accounting return in a given year, weuse the weighted average rate of accounting return in that year inthe two-digit industry that firm belongs to, excluding the firmitself from the calculation.16 The weight of a given firm in a givenyear is the share of its total assets in the aggregate “total assets”of the two-digit industry the firm belongs to. Similarly, as aninstrument for firm-level logarithm of shareholder wealth in agiven year, we use the weighted average of the log values ofshareholder wealth in the two-digit industry in that year, againexcluding the firm itself from the calculation and using totalassets to weight each individual firm.17
As in Panel A, all regressions include firm fixed effects andyear fixed effects. We also control for a quadratic in CEO age anda quadratic in CEO tenure. The regressions include more thantwice the data points of Panel A because we can now use all firms,not only those in the traded goods sector. Panel B shows a patternquite similar to Panel A. The pay for luck relationship in allspecifications again roughly matches the pay for general perfor-mance. Besides reinforcing the findings of Panel A, these latestfindings suggest that previous RPE results arose probably notbecause of mismeasurement of the reference industry or of theindustry shock but because of true pay for luck.
16. We also investigated the use of one-digit and three-digit industry meansas instruments and found qualitatively similar results.
17. These mean industry performance measures are constructed fromCOMPUSTAT. To maximize consistency of the performance measures betweenYermack’s firms and the rest of industry, we also compute shareholder wealth andincome to assets ratios from COMPUSTAT for the firms in Yermack’s. Becausenot all firms in Yermack’s data are present in COMPUSTAT in every year, we loseabout 800 firm-year observations.
The results so far clearly establish pay for luck. There areseveral reactions possible to this evidence. First, one could take itas evidence of skimming. To understand how the skimming modelpredicts pay for luck, consider a CEO who has captured the payprocess. His primary worry in setting pay will be that outrageousskimming may cause otherwise passive investors to stand up andnotice. Good performance, however, provides the CEO with extraslack. For example, shareholders may scrutinize a firm moreclosely during bad times. This allows higher pay when perfor-mance is good and produces a positive link between pay andperformance, but for different reasons than in the contractingview. If good performance creates slack irrespective of whether itwas lucky, pay for luck will result.18
Alternatively, one could argue that pay for luck is in factoptimal and that the evidence so far is consistent with the con-tracting view. One reason why pay for luck might be optimal isthat the CEO’s outside option may in fact depend on luck. Whenthe oil industry enjoys a good fortune, the human capital of oilCEOs may simply become more valuable. Firms then pay their oilCEOs more simply to match their increased outside options.Thus, pay for luck is optimal here not as an incentive device, butmerely because the optimal level of pay increases with luck.19
Objections can be raised against this view. First, our sugges-tive evidence of asymmetry in pay for luck may be hard to recon-cile with this view. Average CEO compensation in the oil industryalways goes up when the price of crude oil goes up but does notalways go down when the price of crude oil goes down. In our fullsample, we performed a similar test using the industry luckshock. For accounting measures, we again found that pay re-sponds more to positive industry shocks than to negative ones(with no asymmetry on general pay for performance). For market
18. The scrutiny of otherwise passive investors may be triggered by absoluteperformance for several reasons. The very nature of deciding where to pay atten-tion requires focusing on variables immediately at hand. Passive investors mayuse accounting returns, earnings growth, or stock return in deciding when to acton a firm and all these variables are clearly not prefiltered. The idea that outra-geous pay actually produces political intervention of some form has been pointedout in Jensen and Murphy [1990]. Empirical work on this can be found in Joskow,Rose, and Wolfram [1996].
19. While the argument made here is rather imprecise, Himmelberg andHubbard [2000] provide a formal model as well as empirical results that interpretpay for luck in this light.
measures, we could not reject symmetry. Second, it is unclearwhy a CEO’s human capital should become more valuable asindustry fortunes rise. In fact, it may be exactly in bad times thathaving the right CEO is most valuable. A priori, either relation-ship seems plausible. To test this assumption, we examined turn-over in the CEO market. We found no statistically significantrelationship between a CEO’s turnover and industry returns(after controlling for the firm’s returns) and a point estimate thatwas negative. This suggests that, if anything, turnover is coun-tercyclical. Third, we tested the effect of the industry’s averageCEO turnover rate on pay for luck. If pay for luck were caused bymarket competition for CEOs, then industries with higher turn-over should exhibit the greatest pay for luck. For accountingmeasures, we found that industries with the highest turnover infact showed the least pay for luck. For market measures of per-formance, we found no relationship between industry turnoverand pay for luck. Of course, for the last two findings, one couldalways argue that competitive pressures operate through thethreat of turnover rather than through actual turnover. As awhole, though, we have been unable to find positive evidence thatoutside bidding up of CEO wages could explain our results.
Another reason why pay for luck may be optimal is that onemay want to provide incentives to the CEO to forecast or respondto luck.20 This kind of argument can be most readily evaluated inour oil industry application. Suppose that a particularly talentedCEO in the oil industry understood the political subtleties of theArab countries and forecast the coming of the positive oil shock atthe beginning of the 1980s. By increasing output from existing oilwells, increasing inventories, or intensifying search for new wells,he could have increased his firm’s profits when the shock didcome. Shouldn’t shareholders reward this farsighted CEO? Theimportant point here is that those CEOs who were exceptional inhaving forecast should indeed be rewarded. But this is not whatwe test for. We use none of the between firm variation in responseto the oil shock. We merely test whether the average firm expe-riences a rise (or fall, for the negative shocks) in pay. Put another
20. An argument similar to hedging has been made by Diamond [1998].Tying pay to luck may generate incentives for the CEO to change his correlationwith the luck variable. In practice, diversification seems to be more in the interestof management than shareholders. Tufano [1996], for example, demonstrates thatmanagerial characteristics, such as share or option ownership, are quite predic-tive of risk management in a sample of gold firms.
way, our results suggest that a CEO who responds to the shockexactly the same way as every other oil CEO is rewarded. Thiscannot be a reward for having forecast well. Again, one maywant to reward CEOs for exceptional responsiveness to shocks,but there is little reason to reward them for just averageresponsiveness.
A final set of responses to pay for luck would be to abandonthe literal contracting view and argue that filtering out luck issimply impossible. This might be because of cognitive complexityin understanding what is luck and what is not luck. Part of thiscognitive complexity may be a pure information issue if there arenot enough data available to figure out the appropriate effect ofluck. For example, estimating the coefficient d in equation (1) maysimply not be possible. Part of the cognitive complexity may bepsychological as in the evidence on the fundamental attributionerror [Durell 1999].21 None of the evidence so far directly refutesthis argument.
III.A. The Effect of Governance
While we have argued against some of the various extensionsof the simple agency model, in the end we still believe that theymerit serious consideration. They suggest to us that the pay forluck finding does not per se rule out agency models. The resultsare also consistent with the idea that filtering out luck is just notfeasible. Therefore, we now turn to testing a specific prediction ofthe skimming view rather than arguing against the other views.Since the skimming view emphasizes the CEO’s ability to gaincontrol of the pay process, corporate governance should play animportant role in skimming. It is exactly in the poorly governedfirms where we expect CEOs to most easily gain control of the payprocess. This suggests that we should expect more pay for luck inthe poorly governed firms.22
21. Another possibility is that luck is not contractible. In practice, we do notbelieve this is important for most of our findings. First, it is difficult to believe thatnoncontracting issues can explain our results in the oil industry case study: theprice of crude oil can easily be measured and written into a contract. Second, evenin the presence of noncontractibility, subjective performance evaluation shouldeffectively filter (see Baker, Gibbons, and Murphy [1994]).
22. Would the alternative explanations above predict an effect of governance?First, one might argue that better governance increases the efficacy of monitoringmechanisms and hence reduces the need to pay for performance. This argumentwould predict a change in the overall level of pay for performance, not only in payfor luck. We circumvent this problem by looking at the change in pay for luckrelative to the change in general pay for performance. As an aside, general pay for
To examine how pay for luck differs between well-governedand poorly governed firms, we estimate two equations. First, inorder to provide a baseline, we ask how pay for general perfor-mance (not luck) differs between well-governed and poorly gov-erned firms. We estimate an OLS equation similar to equation (2)except that we allow the pay for performance coefficient to dependon governance:
(3) yit 5 b p perfit 1 u p ~Govit p perfit!
1 gi 1 xt 1 aX p Xit 1 aG p Govit 1 eit,where Govit is a measure of governance. To understand thisequation, differentiate both sides with respect to performance toget ] yit /]perfit 5 b 1 u p Govit. In words, this specificationallows the pay for performance sensitivity to be a function of thegovernance variable. A positive value for u would imply thatbetter governed firms show greater pay for performance.
Equation (3) of course tells us nothing about pay for luck,merely about pay for performance. To get at pay for luck, wereestimate this equation using our two-stage instrumental vari-ables procedure.23 We then compute an estimate of the effect ofgovernance on pay for general performance, u and an estimate ofthe effect of governance on pay for luck, uLuck.
Our test then consists in comparing u and uLuck. We willspeak of more pay for luck in poorly governed firms when poorlygoverned firms display more pay for luck relative to pay forgeneral performance. If poorly governed firms simply gave morepay for performance and pay for luck rose as a consequence, wewould not refer to this as more pay for luck. In practice, we willsee that it is pay for luck that changes with governance, while payfor performance hardly changes. We will also verify that these
performance does not systematically correlate with governance. Second, for the-ories that rely on changes in the value of the CEO’s human capital, it is unclearwhy these changes would happen more in the poorly governed firms. Finally, thepresumption that filtering is somehow cognitively impossible would clearly berefuted if some firms could filter.
23. An extremely important caveat here: our approach allows for the possi-bility that better governed firms may have a different responsiveness of perfor-mance to luck. So, for example, if well-governed firms were merely less responsivein their performance (not their pay) to luck, this would not create a spurious payfor luck difference between well-governed and poorly governed firms. Technically,performance perfit, the endogenous variable we need to instrument, appears bothdirectly and indirectly (the term Govit p perfit) in this equation. When weinstrument, we perform two first stages, one for the direct effect perfit and one forthe interaction term Govit p perfit. This procedure is crucial because it allows theeffect of luck on performance to depend on governance.
results are robust to allowing pay for luck to vary by firm size.Otherwise, one might simply worry that governance is a proxy forsize.24
In Table IV, we implement this framework for the case oflarge shareholders. We ask whether the presence of large share-holders affects pay for luck. Shleifer and Vishny [1986], amongothers, argue that large shareholders improve governance in afirm. A single investor who holds a large block of shares in a firm
24. One must also be careful in interpreting the results from this exercise.They are merely suggestive of the cross-sectional relationship between gover-nance and the extent of skimming. They do not necessarily imply that a policy ofchanging a specific governance variable will necessarily lead to a change in theextent of skimming. To make strong policy suggestions such as this, one wouldneed more exogenous variation in governance and see its effects on CEO pay, suchas in Bertrand and Mullainathan [1999]. The governance results here are usefulbecause they demonstrate the relevance of the skimming view and not becausethey isolate policy mechanisms to reduce skimming.
TABLE IVLARGE SHAREHOLDERS AND PAY FOR LUCK (LUCK MEASURE IS MEAN INDUSTRY
a. Dependent variable is the logarithm of total compensation. performance measure is operating incometo total assets. All nominal variables are expressed in real dollars.
b. In all the luck regressions, both the performance measure and the interaction of the performancemeasure with the governance measure are instrumented. The instruments are the asset-weighted averageperformance in the two-digit industry and the interactions of the industry performance with that governancemeasure.
c. “Large shareholders” indicates the number of blocks of at least 5 percent of the firm’s common shares,whether the block holder is or is not a director. “Large shareholders on board” indicates the number of blocksof at least 5 percent of the firm’s common shares that are held by directors of the board.
d. Each regression includes firm fixed effects, year fixed effects, a quadratic in age, and a quadratic intenure.
will have greater incentives to watch over the firm than a dis-persed group of small shareholders.25 In our context, the idea oflarge shareholders fits most naturally as this matches the intui-tion of “having a principal around.” Yermack data contain avariable that counts the number of individuals who own blocks ofat least 5 percent of the firm’s common shares. When the CEOhappens to own such a block, we exclude this block from thecount. We further know whether these large shareholders are onthe board or not. A priori, one might expect that large sharehold-ers on the board have the greatest impact. They can exert theircontrol not just through implicit pressure or voting, but also witha direct voice on the board. Since the information is available, wewill consider the effect both of all large shareholders and of onlythose on the board.
The first four columns of Table IV use all large shareholdersas our measure of governance. All regressions include the usualcontrols. Column (1) estimates how the sensitivity of pay to per-formance depends on governance for accounting measures of per-formance. The first row tells us that a firm with no large share-holders shows a sensitivity of log compensation to accountingreturn of 2.18. An increase in accounting return of one percentagepoint leads to an increase in pay of about 2 percent. The secondrow tells us that adding a large shareholder only weakly de-creases the sensitivity of pay to general performance, and thiseffect is not statistically significant. For example, a one percent-age point increase in accounting return now leads to a 2.09percent increase in pay when the firm has one large shareholder(compared with 2.18 in the absence of any large shareholder).Column (2) estimates how large shareholders affect pay forluck.26 As before, the first row tells us that there is significant payfor luck. The second row here, however, tells us that this pay forluck diminishes significantly in the presence of a large share-holder. A one percentage point increase in accounting returns dueto luck leads to roughly a 4.6 percent increase in pay when thereis no large shareholder but only a 4.2 percent increase in pay
25. They also point out a possible opposing effect: very large shareholdersmay have a greater ability to expropriate rents for themselves. This effect is likelyto be greatest in other countries where investor protection is weakest. Empiricalevidence on the efficacy of large shareholders can be found in Zeckhauser andPound [1990], Shivdasani [1993], and Denis and Serrano [1996].
26. In all that follows, we will use mean industry performance as our mea-sure of luck since this produces the most powerful first stages in the IVframework.
when there is one more large shareholder. Each additional largeshareholder decreases this effect by .4 percent. This is a 10percent drop in the pay for luck coefficient for each additionallarge shareholder.27
Columns (3) and (4) estimate the same regressions usingmarket measures of performance. In this case, the pay for generalperformance does not depend at all on the existence of a largeshareholder (a coefficient of .001 with a standard error of .007).We again find, however, that pay for luck diminishes with thepresence of a large shareholder. While the result is only signifi-cant at the 10 percent level, the economic magnitude is larger.The pay for luck coefficient now drops .066/.383 ' 17 percent foreach large shareholder.
In columns (5) through (8) we repeat the above exercise butalter the governance measure. We now focus only on large share-holders on the board. Comparing columns (6) and (2), we see thatthe governance effect strengthens significantly with respect tothe filtering of accounting performance. We see that the pay forluck drops by 33 percent for each additional large shareholder.The results are very statistically significant. On market perfor-mance measures, we find the effect also rises but less dramati-cally. In column (8) the pay for luck drops 23 percent with eachlarge shareholder on the board. Moreover, this last result isinsignificant. In summary, our findings in Table IV highlight howlarge shareholders (especially those on the board) affect the ex-tent of pay for luck. Firms with more large shareholders show forless pay for luck.
The results in Table IV simply compare firms with largeshareholders with firms without. This ignores the effects of CEOtenure, another important determinant of governance. A commonbelief is that CEOs who have been with the firm longer have hada chance to become entrenched, perhaps by appointing friends onthe board. In this case, we would expect high tenure CEOs to
27. One may recall from subsection II.D that we are excluding the cumulatedoptions from our measure of compensation as these will mechanically covary withstock price and, hence luck. However, if firms with large shareholders providedmore options, they may effectively provide more pay for luck because a biggerfraction of compensation (and hence for pay for luck) comes from the mechanicalportion. To test at least this presumption, we compared the fraction of totalcompensation that were options grants between well-governed and poorly gov-erned firms. We found no consistent economically or statistically significant dif-ference for our governance measures.
show the greatest pay for luck. Moreover, we would expect thiseffect to be strongest in those firms where governance is weak andthere is no large shareholder present to limit the increased en-trenchment. Hence, in the absence of large shareholders, weexpect fairly strong governance early in a CEO’s tenure, but thisgovernance should weaken over time as he entrenches himself. Inthe presence of large shareholders, we not only expect strongergovernance but also that this stronger governance should lastthroughout the CEO’s tenure. It is harder for a CEO to beginstacking the board when there is a large shareholder around.Thus, we expect a rise in pay for luck with tenure in the absenceof a large shareholder, but less of a rise (or even no rise) in thepresence of a large shareholder.
Table V tests this idea. We first sort firms into two groupsbased on whether they have a large shareholder present on the
TABLE VTENURE, LARGE SHAREHOLDERS, AND PAY FOR LUCK (LUCK MEASURE IS MEAN
INDUSTRY PERFORMANCE) DEPENDENT VARIABLE: ln (TOTAL COMPENSATION)
a. Dependent variable is the logarithm of total compensation. All nominal variables are expressed in realdollars.
b. In all the luck regressions, both the performance measure and the interaction of the performancemeasure with the CEO tenure are instrumented. The instruments are the asset-weighted average perfor-mance in the two-digit industry and the interactions of the industry performance with the CEO tenure.
c. Sample in columns (1), (2), (5), and (6) is the set of firm-year observations for which there is no largeshareholder sitting on the board of directors; sample in columns (3), (4), (7), and (8) is the set of firm-yearobservations for which there is at least one large shareholder sitting on the board of directors.
d. Each regression includes firm fixed effects, year fixed effects, a quadratic in age, and a quadratic intenure.
board.28 This produces 740 or so data points for firms with largeshareholders and 3880 or so data points for firms without largeshareholders. For each set, we now separately estimate regression3 for these two groups with tenure as our governance measure.
Columns (1) and (2) focus on accounting measures of perfor-mance in firms without a large shareholder. The second row tellsus that while tenure does not affect pay for performance, itgreatly increases pay for luck. In fact, a CEO with (roughly) themedian tenure of nine years shows about .13 p 9/3.35 ' 35percent greater pay for luck than one who just began at the firm.Let us contrast this with columns (3) and (4) which estimate thesame effect for firms with a large shareholder present. Here wefind that tenure does not affect pay for luck at all, while, ifanything, it seems to raise pay for performance slightly [Gibbonsand Murphy 1992]. Thus, pay for luck increases with tenure inthe absence of a large shareholder but does not change withtenure in the presence of a large shareholder.
Columns (5) through (8) repeat the tests of columns (1)through (4) for market measures of performance. Here the resultsare less stark but still very suggestive. Comparing columns (6)and (5), we see that both pay for performance and pay for luck risewith tenure, but pay for luck rises three times as fast (.003 versus.009). The coefficient on the pay for luck, however, is only signifi-cant at the 10 percent level. The economic significance, however,stays large as a CEO with a tenure of nine years shows anincrease in pay for luck of .009 p 9/.26 ' 31 percent, but a rise inpay for performance of only 10 percent. In columns (8) and (7) wesee that, if anything, pay for luck and pay for performance bothdiminish with tenure.
While large shareholders correspond most closely to the ideaof a principal, other governance measures could also be used. Ourdata contain two variables that were shown to be importantgovernance measures in the past: the size of the board and thefraction of board members who are insiders in the firm. Smallboards are thought to be more effective at governing firms. Yer-mack [1996], for example, shows that smaller boards correlatewith larger q values for firms. Insiders on the board are generally
28. We focus only on large shareholders on the board because these providedthe strongest results in Table IV. We have used all large shareholders and foundsimilar, although statistically weaker, results.
thought to weaken governance.29 The first four columns in TableVI estimate the effect of board size on pay for luck. Columns (1) and(2) show that, for accounting measures, the direction of the effect isthe opposite of what we postulated but the coefficient is statisticallyinsignificant. Note that the actual size of the coefficient is tiny: evena huge increase in board size of ten board members leads only to a2 percent drop in pay for luck. Columns (3) and (4), however, showthat there are significant effects for market measures of perfor-mance and these are of the expected sign. Consider the differencebetween two boards, one of which has ten board members and one ofwhich has six. The big board firm shows a pay for performancecoefficient of .240 and a pay for luck coefficient of .229. The smallerboard continues to show a pay for performance coefficient of .228.But, it shows a pay for luck coefficient of .177. This represents a dropof (.229 2 .177)/.177 ' 30 percent in the pay for luck coefficient.
The other measure we examine is a measure of insider presence onthe board. This variable is measured as fraction of board members whoare firm insiders or gray directors. Columns (5) and (6) show that onaccounting measures, insider presence dramatically increases the payfor luck coefficient (significant at the 10 percent level). In a board withten directors, turning one of the outside directors from an outsider to aninsider increases pay for luck by 4.51 p .1/2.27 ' 20 percent. The effecton pay for performance is negative and small. Columns (7) and (8) showthat on market performance measures, insider board presence againincreases pay for luck, but while the coefficient continues to be eco-nomically large, it is statistically quite insignificant.
We turn to our last governance measure in columns (9)through (12), where we construct an index that aggregates all thegovernance measures used so far: number of large shareholders,number of large shareholders on the board, board size, and in-sider presence on board.30 To form the index, we demean each of
29. Empirical evidence on the effect of insiders on the board can be found inBaysinger and Butler [1985], Weisbach [1988], Rosenstein and Wyatt [1990],Hermalin and Weisbach [1991], Byrd and Hickman [1992], and Brickley, Colesand Terry [1994]. We have also examined CEO ownership and whether thefounder is present. We do not report these for space reasons but both producegenerally significant effects. Founders and CEOs with high insider ownershipboth show greater pay for luck.
30. Market valuation of a firm may provide another index of governance. Wehave examined how a market-to-book measure correlates with the extent ofskimming on accounting returns. We found, using a procedure identical to the oneused for the governance variables, that firms with higher market-to-book showedlower levels of pay for luck on accounting returns. Clearly it would be conceptuallyawkward to do a similar exercise for market returns.
the four governance variables, divide it by its standard deviation,and then take the sum of these standardized variables. For boardsize, we use negative of board size in this procedure. For fraction
TABLE VICORPORATE GOVERNANCE AND PAY FOR LUCK (LUCK MEASURE IS MEAN INDUSTRY
a. Dependent variable is the logarithm of total compensation. All nominal variables are deflated. Eachregression includes firm fixed effects, year fixed effects, a quadratic in age, and a quadratic in tenure.Standard errors are in parentheses.
b. “Board size” indicates the number of members of the board of directors, as listed in the proxy statementnear the start of the fiscal year. “Fraction insiders” is the fraction of inside and “gray” directors on the boardof directors. “Governance index” is the unweighted average of four standardized governance variables(number of large shareholders, number of large shareholders on board, minus board size, and one minusfraction insiders).
c. In all the luck regressions, both the performance measure and the interaction of the performance measurewith the governance measure are instrumented. The instruments are the asset-weighted average performance inthe two-digit industry and the interactions of the industry performance with that governance measure.
of insiders on the board, we use one minus that fraction. Thisguarantees that the resulting governance index has larger valueswhenever the firm is better governed.31
For accounting measures of performance (columns (9) and(10)), we again find that pay for luck diminishes with the gover-nance, while pay for performance does not change. The coeffi-cient, however, is only significant at the 10 percent level. Togauge the magnitude of these effects, consider a one-standard-deviation increase in the governance index, about 2. Such anincrease leads to a 2.216 p 2/4.23 ' 10 percent fall in the pay forluck coefficient. When we use market measures (columns (11) and(12)), increases in the governance index greatly reduce pay forluck but hardly affect pay for performance. In this case, thecoefficients are significant at the 5 percent level. Moreover, theirmagnitude is bigger. A one-standard-deviation increase in gover-nance decreases pay for luck by 26 percent.
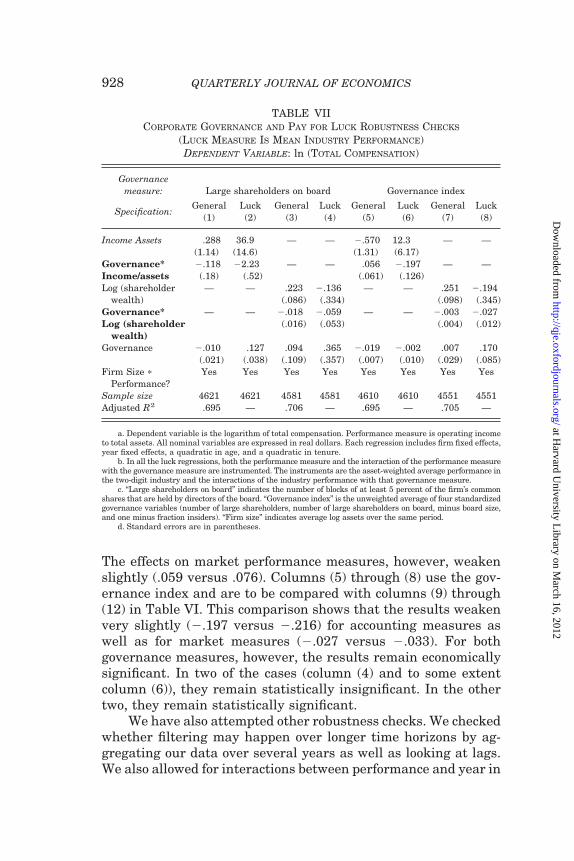
Finally, we investigate the robustness of our findings. Theprimary concern one might have is that we have not adequatelycontrolled for firm size. One might worry that large firms havequite different pay for performance sensitivities than small firms[Baker and Hall 1999]. If this also translates into different pay forluck sensitivities, the estimates above might confuse this sizeeffect for a governance “effect.”
In Table VII we address this problem by controlling for sizeinteracted with performance. We reestimate equation (3) but thistime include a term Size p perfit. Our measure of size in theseregressions is average log real assets of the firm over the period.We report the results for two governance measures, large share-holders on the board and the governance index, although we havereestimated all the previous tables with these controls and foundsimilar results. Columns (1) through (4) are to be compared withcolumns (5) through (8) of Table IV. We see that the effect ofgovernance on the filtering of accounting rates of return in factstrengthens when these controls are added (22.23 versus 21.48).
31. This particular way of proceeding will tend to count large shareholders onthe board twice, once as on the board and once as general large shareholders. Thisis a crude way of incorporating our prior belief (supported by the findings in TableIV) that large shareholders on the board matter more. When we use eithermeasure in the index alone, we find qualitatively similar results. We have alsoestimated a regression in which we include all four governance measures (andtheir interactions) together. These regressions showed all the governance mea-sures entering with the same sign and only the large shareholder variables beingstatistically significant.
The effects on market performance measures, however, weakenslightly (.059 versus .076). Columns (5) through (8) use the gov-ernance index and are to be compared with columns (9) through(12) in Table VI. This comparison shows that the results weakenvery slightly (2.197 versus 2.216) for accounting measures aswell as for market measures (2.027 versus 2.033). For bothgovernance measures, however, the results remain economicallysignificant. In two of the cases (column (4) and to some extentcolumn (6)), they remain statistically insignificant. In the othertwo, they remain statistically significant.
We have also attempted other robustness checks. We checkedwhether filtering may happen over longer time horizons by ag-gregating our data over several years as well as looking at lags.We also allowed for interactions between performance and year in
TABLE VIICORPORATE GOVERNANCE AND PAY FOR LUCK ROBUSTNESS CHECKS
(LUCK MEASURE IS MEAN INDUSTRY PERFORMANCE)DEPENDENT VARIABLE: ln (TOTAL COMPENSATION)
Governancemeasure: Large shareholders on board Governance index
a. Dependent variable is the logarithm of total compensation. Performance measure is operating incometo total assets. All nominal variables are expressed in real dollars. Each regression includes firm fixed effects,year fixed effects, a quadratic in age, and a quadratic in tenure.
b. In all the luck regressions, both the performance measure and the interaction of the performance measurewith the governance measure are instrumented. The instruments are the asset-weighted average performance inthe two-digit industry and the interactions of the industry performance with that governance measure.
c. “Large shareholders on board” indicates the number of blocks of at least 5 percent of the firm’s commonshares that are held by directors of the board. “Governance index” is the unweighted average of four standardizedgovernance variables (number of large shareholders, number of large shareholders on board, minus board size,and one minus fraction insiders). “Firm size” indicates average log assets over the same period.
our regressions since there are known to be changes in the pay forperformance sensitivity over this time period. These modifica-tions did not alter our qualitative findings.
IV. CONCLUSION
CEOs are rewarded for luck. Moreover, pay for luck is as largeas pay for general pay for performance. Pay for luck also appears onthe most discretionary components of compensation, salary andbonus. Looking closer, we found that pay for luck is strongest amongpoorly governed firms. Adding a large shareholder on the board, forexample, decreased the pay for luck by 23 to 33 percent. This findingweakens two prominent explanations of pay for luck: “Paying forluck is optimal” and “Filtering out luck is impossible.”
More broadly, these results encourage a revision of our viewson CEO pay. Poorly governed firms fit the predictions of theskimming view. Well-governed firms fit the predictions of thecontracting view better. They are to remove some luck in settingpay. This suggests that both views hold some sway. Other empiri-cal facts support this idea. In Bertrand and Mullainathan [2000b]we showed that well-governed firms charged CEOs more for theoptions they were granted. Options contain a gift componentbecause even if the CEO does nothing they have value from theintrinsic volatility of the stock (their Black-Scholes value). Weshow that firms with large shareholders, smaller boards, and soon, are better able to charge their CEOs and better able to removethis gift component by reducing the other components of pay. Inother words, principal agent models work best when there are infact individuals around to act as principals.
Several unanswered questions remain. First, it is unclearwhat effects the reward for luck has on overall CEO utility. Doescompetition in the market for CEOs force the mean level of pay atinitial hire to adjust so that there are no ex ante rents to be had?Or is the hiring process sufficiently closed or captured by insidersthat such adjustments are small? Second, while formal models ofthe contracting view abound, there is no careful analysis of theskimming model. Without such an analysis, our understanding ofskimming will necessarily remain vague. What are the exactmechanisms by which skimming is constrained? How specificallydoes better governance translate into better pay packages? Theresults in this paper suggest that more energy should be devotedto clarifying the skimming alternative.
APPENDIX 1: SUMMARY STATISTICS—50 LARGEST U. S. OIL COMPANIES CEOS
Mean S. D.
Age of CEO 58.562 7.892Tenure of CEO 10.181 9.781Total compensation 608.269 597.194ln (Total Compensation) 6.125 .722
a. Data set is 50 of the 51 largest U. S. oil companies over the period 1977–1994.b. Total Compensation is defined as the sum of salary and bonus (cash and stock bonus), company
contributions to thrift plans, other annual income, and the value of the options granted to the CEO duringthat year, in thousands of 1977 dollars.
a. Dependent variable is the level of income in column (1), the ratio of operating income to total assetsin column (2) and the log value of shareholder wealth in column (3). Income and shareholder wealth areexpressed in millions of 1977 dollars. 2% , Appr. , 4% is dummy variable that equals 1 if the industry-specific exchange rate index appreciated by more than 2% and less than 4% since the previous year. All theother appreciation and depreciation dummies are defined in a similar way.
b. Each regression includes firm fixed effects and year fixed effects. All regressions also include aquadratic in CEO age and a quadratic in CEO tenure.
c. The 3 regressions are the first-stage regressions associated with columns (2), (4), and (8) in Panel A ofTable 3.
PRINCETON UNIVERSITY, NATIONAL BUREAU OF ECONOMIC RESEARCH, AND CENTER
FOR ECONOMIC POLICY RESEARCH
MASSACHUSETTS INSTITUTE OF TECHNOLOGY AND NATIONAL BUREAU OF ECONOMIC
RESEARCH
REFERENCES
Abowd, John M., and David S. Kaplan, “Executive Compensation; Six Questions ThatNeed Answering,” Journal of Economic Perspectives, XIII (1999), 145–168.
Aggarwal, Rajesh K., and Andrew A. Samwick, “The Other Side of the Trade-Off:The Impact of Risk on Executive Compensation,” Journal of Political Econ-omy, CVII (1999a), 65–105.
Aggarwal, Rajesh K., and Andrew A. Samwick, “Executive Compensation, Stra-tegic Competition, and Relative Performance Evaluation: Theory and Evi-dence,” Journal of Finance, LIV (1999b), 1999–2043.
Baker, George, Robert Gibbons, and Kevin J. Murphy, “Subjective PerformanceMeasures in Optimal Incentive Contracts,” Quarterly Journal of Economics,CIX (1994), 1125–1156.
Baker, George, and Brian Hall, “Understanding Top Management Incentives:Firm Size, Risk and CEO Effort,” Harvard Business School, 1998.
Baysinger, Robert D., and Henry N. Butler, “Corporate Governance and the Boardof Directors: Performance Effects of Changes in Board Composition,” Journalof Law, Economics and Organization, I (1985), 101–124.
Bertrand, Marianne, “From the Invisible Handshake to the Invisible Hand? HowImport Competition Changes the Employment Relationship,” National Bu-reau of Economic Research Working Paper No. 6900, 1999.
Bertrand, Marianne, and Sendhil Mullainathan, “Corporate Governance and Ex-ecutive Compensation: Evidence from Takeover Legislation,” Princeton Uni-versity, 1999.
Bertrand, Marianne, and Sendhil Mullainathan, “Agents with and without Prin-cipals,” American Economic Review, XC (2000a), 203–208.
Bertrand, Marianne, and Sendhil Mullainathan, “Do CEOs Set Their Own Pay?The Ones without Principals Do,” National Bureau of Economic ResearchWorking Paper No. 7604, 2000b.
Blanchard, Olivier J., Florencio Lopez-de-Silanes, and Andrei Shleifer, “What DoFirms Do with Cash Windfalls?” Journal of Financial Economics, XXXVI(1994), 337–360.
Brickley, James A., Jeffrey L. Coles, and Rory L. Terry, “Outside Directors and theAdoption of Poison Pills,” Journal of Financial Economics, XXXV (1994), 371–390.
Byrd, John W., and Kent A. Hickman, “Do Outside Directors Monitor Managers?”Journal of Financial Economics, XXXII (1992), 195–221.
Crystal, Graef, In Search of Excess: The Overcompensation of American Executives(New York, NY: W.W. Norton Co., 1991).
Denis, David, and Jan Serrano, “Active Investors and Management TurnoverFollowing Unsuccessful Control Contests,” Journal of Financial Economics,XL (1996), 239–266.
Diamond, Peter, “Managerial Incentives: On the Near Linearity of Optimal Com-pensation,” Journal of Political Economy, CVI (1998), 931–957.
Durell, Alan, “Attribution in Performance Evaluation,” Dartmouth College, 1999.Garen, John E., “Executive Compensation and Principal-Agent Theory,” Journal
of Political Economy, CII (1994), 1175–1199.Gibbons, Robert, and Kevin J. Murphy, “Relative Performance Evaluation for
Chief Executive Officers,” Industrial and Labor Relations Review, XLIII(1990), S30–S51.
Gibbons, Robert, and Kevin J. Murphy, “Optimal Incentives in the Presence ofCareer Concerns: Theory and Evidence,” Journal of Political Economy, C(1992), 468–505.
Haid, Michael, Incentive Compensation and the Market for Corporate Control:Substitutive Forces to Discipline Management of Publicly Held Organizationsin the U. S.: Empirical Evidence From the Oil Industry 1977–1994 (Bern,Switzerland: Haupt, 1997).
Hall, Brian J., “The Design of Multi-Year Stock Option Plans,” Journal of AppliedCorporate Finance, XII (1999), 97–106.
Hall, Brian J., and Jeffrey B. Liebman, “Are CEOs Really Paid Like Bureaucrats?”Quarterly Journal of Economics, CXIII (1998), 653–691.
Hermalin, Benjamin, and Michael Weisbach, “The Effects of Board Compositionand Direct Incentives on Firm Performance,” Financial Management, XX(1991), 101–112.
Himmelberg, Charles, and R. Glenn Hubbard, “Incentive Pay and the Market forCEOs: An Analysis of Pay-For-Performance Sensitivity,” Columbia Univer-sity, 2000.
Holmstrom, Bengt, “Moral Hazard and Observability,” Bell Journal of Economics,X (1979), 74–91.
Holmstrom, Bengt, and Paul Milgrom, “Aggregation and Linearity in the Provi-sion of Intertemporal Incentives,” Econometrica, LV (1987), 303–328.
Hubbard, R. Glenn, and Darius Palia, “Executive Pay and Performance: Evidencefrom the U. S. Banking Industry,” Journal of Financial Economics, XXXIX(1994), 105–130.
Janakiraman, Surya N., Richard A. Lambert, and David F. Larcker, “An Em-pirical Investigation of the Relative Performance Evaluation Hypothesis,”Journal of Accounting Research, XXX (1992), 53–69.
Jensen, Michael, and Kevin J. Murphy, “Performance Pay and Top-ManagementIncentives,” Journal of Political Economy, XCVIII (1990), 225–264.
Joskow, Paul L., Nancy L. Rose, and Catherine D. Wolfram, “Political Constraintson Executive Compensation: Evidence from the Electric Utility Industry,”Rand Journal of Economics, XXVII (1996), 165–182.
——, “Corporate Performance and Managerial Remuneration: An Empirical In-vestigation of Managerial Labor Contracts,” Rand Journal of Economics,XVII (1986), 59–76.
——, “Executive Compensation,” Handbook of Labor Economics, O. Ashenfelterand D. Card, eds. (Amsterdam, The Netherlands: North-Holland, 1999).
Revenga, Ana L., “Exporting Jobs? The Impact of Import Competition on Employ-ment and Wages in U. S. Manufacturing,” Quarterly Journal of Economics,CVII (1992), 255–284.
Rosenstein, Stuart, and Jeffrey G. Wyatt, “Outside Directors, Board Indepen-dence, and Shareholder Wealth,” Journal of Financial Economics, XXVI(1990), 175–191.
Shea, John, “Nominal Illusion: Evidence from Major League Baseball,” Universityof Maryland, 1999.
Shivdasani, Anil, “Board Composition, Ownership Structure, and Hostile Take-overs,” Journal of Accounting and Economics, XVI (1993), 167–198.
Shleifer, Andrei, and Robert Vishny, “Large Shareholders and Corporate Control,”Journal of Political Economy, XCIV (1986), 461–488.
Tufano, Peter, “Who Manages Risk? An Empirical Examination of Risk Manage-ment Practices in the Gold Mining Industry,” Journal of Finance, LI (1996),1097–1137.
Weisbach, Michael, “Outside Directors and CEO Turnover,” Journal of FinancialEconomics, XX (1988), 431–460.
——, “Higher Market Valuation of Companies with a Small Board of Directors,”Journal of Financial Economics, XL (1996), 185–211.
Zeckhauser, Richard J., and John Pound, “Are Large Shareholders EffectiveMonitors? An Investigation of Share Ownership and Corporate Performance,”Asymmetric Information, Corporate Finance and Investment, R. Glenn Hub-bard, ed. (Chicago, IL: University of Chicago Press, 1990).


![ARE CEOS REWARDED FOR LUCK? THE ONES … · luck, therefore, cannot provide better incentives and will only make the contract riskier [Holmstrom 1979].2 This paper starts by examining](https://static.documents.pub/doc/80x56/5b33d66c7f8b9a8b4b8b7383/are-ceos-rewarded-for-luck-the-ones-luck-therefore-cannot-provide-better.jpg)


