30
Smaranda Pantea, Federico Biagi and Anna Sabadash 2014 Digital Economy Working Paper 2014/07 Are ICT Displacing Workers? Evidence from Seven European Countries

Smaranda Pantea, Federico Biagi
and Anna Sabadash
2014
Digital Economy Working Paper 2014/07
Are ICT Displacing Workers? Evidence from Seven European Countries

European Commission
Joint Research Centre
Institute for Prospective Technological Studies
Contact information
Address: Edificio Expo. c/ Inca Garcilaso, 3. E-41092 Seville (Spain)
E-mail: [email protected]
Tel.: +34 954488318
Fax: +34 954488300
JRC Science Hub
https://ec.europa.eu/jrc
This publication is a Working Paper by the Joint Research Centre of the European Commission. It results from the Digital
Economy Research Programme at the JRC Institute for Prospective Technological Studies, which carries out economic
research on information society and EU Digital Agenda policy issues, with a focus on growth, jobs and innovation in the
Single Market. The Digital Economy Research Programme is co-financed by the Directorate General Communications
Networks, Content and Technology.
Legal Notice
This publication is a Technical Report by the Joint Research Centre, the European Commission’s in-house science service.
It aims to provide evidence-based scientific support to the European policy-making process. The scientific output
expressed does not imply a policy position of the European Commission. Neither the European Commission nor any person
acting on behalf of the Commission is responsible for the use which might be made of this publication.
All images © European Union 2014
JRC91122
ISSN 1831-9408 (online)
Spain: European Commission, Joint Research Centre, 2014
© European Union, 2014
Reproduction is authorised provided the source is acknowledged.
Abstract
This paper examines whether ICT substitute labour and reduce the demand for labour. We used firm-level comparable
data separately for firms in manufacturing, services and ICT-producing sectors from seven European countries. We
adopted a common methodology and applied it to a unique dataset provided by the ESSLait Project on Linking Microdata.
We controlled for unobservable time-invariant firm-specific effects and we found no evidence of a negative relationship
between intensity of ICT use and employment growth. We read this as an indication that ICT use is not reducing
employment among ICT using firms.

1
Abstract:
This paper examines whether ICT substitute labour and reduce the demand for labour. We used
firm-level comparable data separately for firms in manufacturing, services and ICT-producing
sectors from seven European countries. We adopted a common methodology and applied it to a
unique dataset provided by the ESSLait Project on Linking Microdata. We controlled for
unobservable time-invariant firm-specific effects and we found no evidence of a negative
relationship between intensity of ICT use and employment growth. We read this as an indication
that ICT use is not reducing employment among ICT using firms.
JEL codes: J23, J24, O33, L86
Keywords: Labour Demand, Technology Change, ICT.

2
Non-Technical Summary
The impact of Information and Communication Technologies (ICT) on employment is an intensely
controversial subject. On the one hand, ICT adoption and diffusion, across all sectors of society,
can create employment opportunities, directly for individuals endowed with skills that complement
ICT and indirectly in those sectors and firms that, because of ICT use, are more innovative and/or
more productive. On the other hand, the adoption and diffusion of ICT can increase the automation
of many tasks and result in the substitution of workers involved in those tasks. This has negative
consequences on employment, especially for individuals with low and medium-level skills
(Brynjolfsson and McAfee, 2011 and 2014). These negative “substitution” effects of ICT –and more
generally of technological progress- on employment have been the focus of recent academic and
policy debates, and are summarized and discussed in Sabadash (2013). She concludes that the
evidence on the relationship between employment and ICT-driven innovation is mixed. This result,
which reflects the ambiguous predictions of theory, is due partly to the different methodological
approaches (including different specifications) followed by the empirical literature and partly to the
variety of indicators used to measure ICT (some of which are, in fact, general measures of
technology or innovation). In fact, there are only a very few studies which analyse the relationship
between ICT utilization and employment using direct and precise measures of ICT.1
The purpose of this paper is to improve upon the existing literature and identify and estimate the
“substitution” effect of ICT utilization on employment growth among ICT-using firms. For this we
use firm-level data, separately for manufacturing, and services, from seven European countries
during a recent period (2007-2010). Our data come from a unique dataset of harmonised and
linked micro data compiled by National Statistical Offices, containing data comparable across
countries based on the production statistics linked with the ICT /e-commerce survey. To the best of
our knowledge, this is one of the very few studies that examine the relationship between the
intensity of ICT use and employment using specific ICT measures, and it is the first one that uses a
longitudinal dataset containing comprehensive and representative data from a large number of EU
countries.
Holding firm output and capital constant and controlling for time-invariant unobservable firm
characteristics, we find a non-significant relationship between employment growth and ICT
intensive use across firms. Our estimates mainly capture the “substitution” effects of ICT on
employment (i.e. those due to ICT substituting for some types of labour and to ICT increasing
1 The lack of studies using direct measures of ICT use is due to the fact that only recently have these
measures become available, in such a way that they can be linked to firms’ performance.

3
productivity and hence reducing demand for inputs, for constant values of output), and our results
indicate that these effects are statistically insignificant.
This finding should not be interpreted as evidence to support the hypothesis that ICT are irrelevant
for employment. In fact, we expect that the insignificant constant-output employment effect of ICT
intensity coexists with the positive effect of increased firm competitiveness due to improved
productivity or output quality. This, however, is not the focus of this paper. In summary, we read our
results as an indication that, on average, increased intensity of ICT use has at least a non-negative
effect on employment growth at firm level.
At the same time, we are conscious that our average firm-level estimates do not take into
consideration the effects due to firms exiting and entering the market or business-stealing effects.
Nor do we examine whether intensive ICT use has different effects on different skills groups. We
intend to address these issues in further research, by using specifications that allow us to capture
separately these different effects of ICT on employment. We will also consider higher levels of
aggregation (i.e. with meso and macro level data).

4
1. Introduction
The impact of Information and Communication Technologies (ICT) on employment is an intensely
controversial subject. On the one hand, ICT adoption and diffusion, across all sectors of society,
can create employment opportunities directly for individuals endowed with skills that complement
ICT and indirectly in those sectors and firms that, because of ICT use, are more innovative and/or
more productive and hence more likely to increase employment. On the other hand, the adoption
and diffusion of ICT can increase the automation of many tasks and hence induce machine-labour
substitution, with negative consequences for employment, especially for individuals with low and
medium-level skills (Brynjolfsson and McAfee, 2011 and 2014).
While there are many assessments of the effect of ICT on the composition of employment by
skill/education in the literature (among others see Michaels et al., 2014; Firpo et al., 2011), there
are only a few studies that examine the relationship between ICT and employment using precise
ICT indicators (see Falk, 2001; Bloom et al., 2011). However, there is a large body of literature on
the effects of technological and organizational innovations on total employment, which, perhaps
not surprisingly, is characterized by mixed and contradictory results. This can be explained partly by
the ambiguous predictions of theory and partly by the different methodological approaches
followed in the empirical analyses (see Vivarelli 2012, 2007). Moreover, while some studies are
based on aggregate country-level data, others use sector-level data (some of them only on
manufacturing) and others focus on firm-level data. These studies use different measures of
technology (the most frequently used being R&D intensity, product and process innovation and
patents), and differ in terms of econometric techniques.2 Only a few studies use internationally
comparable firm-level data (see Evangelista and Vezzani 2011, and Dachs and Peters 2014 for
exceptions).
This paper examines the effect on employment of intensive ICT use separately for firms in
manufacturing, services, and ICT producing sectors in seven European countries (Finland, France,
the Netherlands, Norway, Sweden, Poland, and the United Kingdom) from 2007 to 2010. We
estimate the relationship between firms' labour demand and the intensity of their ICT use,
conditional on their output and other determinants of labour demand. The data used in this study
come from a unique set of harmonised and linked micro data compiled by National Statistical
Offices in three consecutive projects on linking micro data on ICT usage. This dataset contains data
on firms’ ICT usage and on a range of other firms’ characteristics comparable across countries,
2 Including how they account for the possible heterogeneous effects of ICT in different institutional and
technological settings and how they control for other factors that might affect labour demand while being correlated with a firm’s technology.

5
based on the production statistics linked with the ICT /e-commerce survey for each country and
sector.
To the best of our knowledge, our paper is the first to explicitly estimate the substitution effect of
ICT on employment, using longitudinal and firm-level data comparable across countries from
official sources that provide detailed and high-quality information on the actual use of ICT within
the firm. In addition, it covers a very recent period, which includes the economic crisis.
The paper is organized as follows. Section 2 reviews the related literature. Section 3 describes the
empirical specification, while Section 4 describes the data used in our paper. Section 5 discusses
the results of the estimation. Section 6 offers conclusions.
2. Related Literature
ICT diffusion is one of the most important technology-related characteristics of the recent
experience of developed (and developing) countries. Digitalization is a widespread phenomenon
affecting almost every sector and profession: from e-Government to the media, the automotive
and the health industries, to name just a few.
A number of authors have stressed the negative impact of ICT on employment (often referred to as
'end-of-work' literature, see Rifkin,1995, and, more recently, Brynjolfsson and McAfee, 2011 and
2014) based on the hypothesis that ICT substitute human activities that are no longer needed.3
Others, however, have argued that ICT, in light of their positive effects on productivity and
innovativeness, can be an important source of job creation. They can increase employment not only
in firms/sectors that directly benefit from the productivity increase and from innovation,4 but also
across the whole economy, through the general equilibrium effects of increased consumption and
investment.
Given the relevance of the issue and the conflicting perspectives, it is not surprising that the
consequences of the ICT revolution for employment are attracting growing attention from
policymakers and others. In this paper, we look at this relationship with firm-level data.
At the firm level, increased use of ICT may affect total employment in several ways.5 First, as tasks
are automated, ICT may directly substitute workers assigned to those tasks. Second, by increasing
3 Due, for instance, to the widespread diffusion of computers, numerically-controlled machines,
computerized inventory control, voice recognition and online commerce. On the ability of machines to substitute humans, see also Levy and Murnane (1995).
4 ICT-driven productivity increases become manifest first in the ICT producing sector and then trickle down to all the sectors that use ICT. As for ICT-driven innovation, its effects are by no means limited to the ICT producing sector.
5 For a detailed review discussion on the relationship between innovation and employment, see Vivarelli and Pianta (2000).

6
firm productivity (as documented by a large body of literature, recently reviewed by Van Reenen et
al., 2010, and Biagi, 2013), ICT enable firms to produce the same level of output with fewer inputs,
including less labour. For a given level of output, such an increase in firm productivity implies that
the (conditional) demand for labour falls. These two possible effects are often referred to in the
literature as "substitution" effects. Third, if ICT use increases a firm’s productivity, it also leads to a
decrease in prices and an increase in demand for the firm’s products, which, under certain
circumstances,6 would induce an outward shift of the (unconditional) labour demand. This effect is
often referred to in the literature as the "compensation effect". The combined result of the
substitution and compensation effects is unclear and needs to be examined empirically.
In addition to these direct effects, ICT diffusion may generate indirect employment effects in firms
other than those using ICT, such as their competitors (probably a negative effect due to business
stealing) and suppliers (probably a positive effect, due to increased demand), with potential
additional general equilibrium macroeconomic effects due to increased consumption and
investment.7
In this paper, which we regard as a first step in the context of a broader research project on the
labour market impacts of ICT, we examine the effect of ICT use on firm-level employment, and this
is reflected in our literature review.
To the best of our knowledge, ours is one of the very few studies that examine the effect of ICT on
firm employment using specific indicators of ICT use. Falk (2001) looks at the employment effects
of ICT and organizational change using data from the 1995 and 1997 waves of the Mannheim
Service Innovation (MIP) panel and finds that ICT have a positive indirect effect on employment
growth, through organizational change. However, once the latter has been controlled for, the direct
effects of ICT tend to be not significant.
In a different context,8 Bloom et al. (2011) estimate a conditional labour demand function where
employment growth is regressed, among other variables, on measures of 5 year lagged ICT
intensity.9 Their results indicate that ICT intensity has a positive long-term overall effect on
employment growth.
Our paper is closely related to the empirical literature on the effect of technology and innovation -
especially process innovation- on total employment. This literature, recently reviewed by Vivarelli
6 See Vivarelli and Pianta (2000) for discussions on the factors that may affect this effect. 7 These would be generated by ICT-induced increases in productivity that raise incentives to invest in
human capital and investment. 8 They explore the impact of imports from China on innovation, IT and productivity among 12 European
countries. 9 Alternative measures used are the number of personal computers, the use of Enterprise Resource
Planning, Databases and Software.

7
(2012, 2007), is very heterogeneous in terms of measurement of technology and innovation,
methodological approaches, country and sector coverage. This, together with the ambiguous
predictions of economic theory, is reflected in its mixed findings. However, some regularities
emerge, and results tend to differ systematically with the measure of innovation/technology used:
product innovation tends to be robustly and positively related to employment and employment
growth, whereas for process innovation, the relationship is not robust. For instance, when looking at
process innovation and employment or employment growth, some authors10 find small or
insignificant effects, some11 find positive effects, and some12 document a negative relationship.
It should also be noted that most of the existing firm-level studies only cover the manufacturing
sector. The few studies that also cover the service sector typically do not allow for cross-sector
differences in the effects of innovation variables. Important exceptions are Harrison et al. (2008),
Evangelista and Vezzani (2011), and Dachs and Peters (2014), who estimate different effects for
services and manufacturing.
In conclusion, in spite of the tremendous relevance of the questions on the table, we have to
conclude that –so far- the literature has not provided a fully satisfying set of answers. More
specifically, there is a lack of firm-level empirical evidence on the effect of ICT use on firm
employment and the existing empirical evidence on ICT-related innovation/technology measures is
mixed.
3. Empirical specification
To estimate the effect of the intensity of ICT use on employment, we adopt a standard log-linear
conditional labour demand framework, commonly used in the empirical literature on the
determinants of labour demand (Hammermesh, 1993; Van Reenen, 1997; Amiti and Wei, 2006;
Hijzen and Swaim, 2007; Falk and Wolfmayr, 2008). We assume that a profit maximizing firm
chooses its inputs in order to minimize the production costs, conditional on a given level of output.
The production costs are a function of factor prices, output and demand shifters, which include
intensity of ICT use in the firm. We consider labour as homogenous13 and we follow Berman et al.
(1994) in treating capital as a quasi-fixed input, which is a reasonable assumption in the short-
term and avoids possible problems in measuring the user cost of capital.
10 See Van Reenen (1997), Peters (2004), Hall et al. (2008), Harrison et al. (2008) for manufacturing firms in
Spain; Evangelista and Vezzani (2011), Giuliodori and Stucchi (2012), Dachs and Peters (2014), for service firms.
11 Blanchflower and Burgess (1998), Smolny (1998), Greenan and Guellec (2000), Lachenmaier and Rottmann (2011).
12 Dachs and Peters (2014), for manufacturing firms; Harrison et al. (2008) for manufacturing firms in Germany.
13 We do not consider the compositional effects of ICT use.

8
The relationship between ICT use and employment cannot be identified from the variation in
intensity of ICT use and employment across firms since both variables could be correlated with
unobserved firm characteristics, such as offshoring/outsourcing (which is greatly facilitated by ICT),
the technology used in the firm, and its management and organization characteristics. To avoid an
omitted-variable bias we eliminate time-invariant firm-specific characteristics, and we estimate a
conditional labour demand in first differences, which takes the following form:
ΔlnEijt = δwΔlnWijt + δkΔlnKijt + δyΔlnYijt + δictΔICTijt + δxΔXijt + αt + αj +υijt (1)
where Δ denotes the difference between year t and year t-1.
The indicators for the intensity of ICT use (ICTijt) are: i) the share of broadband internet-enabled
workers; ii) the share of mobile internet-enabled workers; iii) the share of sales due to e-commerce
activities14
in total sales.
Firm-level employment (Eijt) is measured by full-time equivalents (FTE) in Finland, Poland and
Sweden, while it is measured using head-counts 15
in France, Netherlands, Norway and the United
Kingdom, where data on FTE are not available.16
Real average wage (Wijt) in firm i in industry j at time t is measured as the real total wage17
bill in
national currency per unit of employment in the firm.
Kijt represents the real capital stock (Kijt) and it is included (instead of the cost of capital) because
we assume that capital is a quasi-fixed input.18
Real output (Yijt), or turnover, represents firms’ sales from all products, goods, materials and
services, including price subsidies, consumption tax and excise duties (excluding value added taxes),
deflated by industry price indexes. It also includes the purchase value of goods resold, as well as
indirect services.
Equation (1) includes controls for several other firm-specific characteristics (Xijt) that may influence
its employment dynamics, such as the firm's age and size, whether it is a multinational and its
14 Two types of e-commerce are considered: sales through the firm's web-site and through Electronic Data
Interchange (EDI). 15 For a discussion see Airaksinen et al. (2013). 16 Across-country variation in the measurement of employment is likely not to be a major problem here,
since each country is analysed separately and –for each country- our measure is consistent through time. 17 Real wages are equal to nominal wages deflated by the output price index. 18 Data on the real capital stock are typically not directly available from the Structural Business Statistics
and the ESSlait project solution was to estimate them using book value or replacement value of assets or depreciation in monetary terms (see Airaksinen et al., 2013). As a result, real capital is computed differently across countries. However, this is not likely to distort significantly our estimates as long as, for each country, the same method is used consistently across-time. The use of a logarithmic form is also likely to reduce measurement errors. For a discussion see Hagsten and Sabadash (2014).

9
export status. In fact, a large body of literature on firm employment growth discusses the different
growth patterns of small vs. large and young vs. old firms. Similarly, multinationals and exporting
firms are more likely to be subject to competitive forces and are therefore more likely to
experience higher productivity and, possibly, higher employment.
To capture firm's age we use five categories: less than 3 years old, between 3 and 6 years old,
between 6 and 9 years old, between 9 and 12 years old, between 12 and 15 years old and older
than 15 years. As for firm's size, we generate the following classes: less than 10 employees, from
10 to 19 employees, from 20 to 49 employees, from 50 to 199 employees, from 100 to 249
employees, from 250 to 499 employees, and above 500 employees. A firm is considered
multinational if it has a foreign subsidiary and/or is part of group with headquarters abroad and is
considered domestic otherwise. A firm is considered to be an exporter if exports any goods and/or
services and a non-exporter otherwise.19
Additionally, we include sector (αj) and year (αt) fixed effects. These are meant to control for
unobservable factors that can influence firms’ employment, including the prices of intermediate
goods or energy. Sector dummies are based on two-digit NACE rev.1.1 classification. In some cases,
some two-digit sectors are combined. The reference industry for manufacturing regressions is the
combination of sectors 36 and 37 (manufacturing n.e.c. and recycling), while it is sector 73
(research and development) for the service regressions.
We would expect that, other things being equal, a rise in the average wage would increase labour
costs and reduce labour demand. We would also expect that, ceteris paribus, Kijt and Yijt would
increase the quantity of labour demanded. As for our main variable (ICTijt), since we control for firm
output and capital,20 we would expect it to enter with a non-positive coefficient,21 which would be
negative if the job substitution hypothesis put forward by Brynjolfsson and McAfee (2011, 2014) is
correct. Moreover, given our specification, we reckon that our estimates of the coefficient on ICTijt
should be considered as lower-bound values for the effect of ICT use on the conditional labour
demand.
19 Primary data sources for this indicator vary across countries and include Structural Business Statistics,
Foreign Trade Statistics and the Statistics on International Trade in Services. 20 Intensive ICT use might have positive effects on sales and capital and, indirectly, on labour demand. In our
specification, these effects will be captured by the coefficients on output and capital. 21 The coefficient would capture the pure substitution effects of ICT.
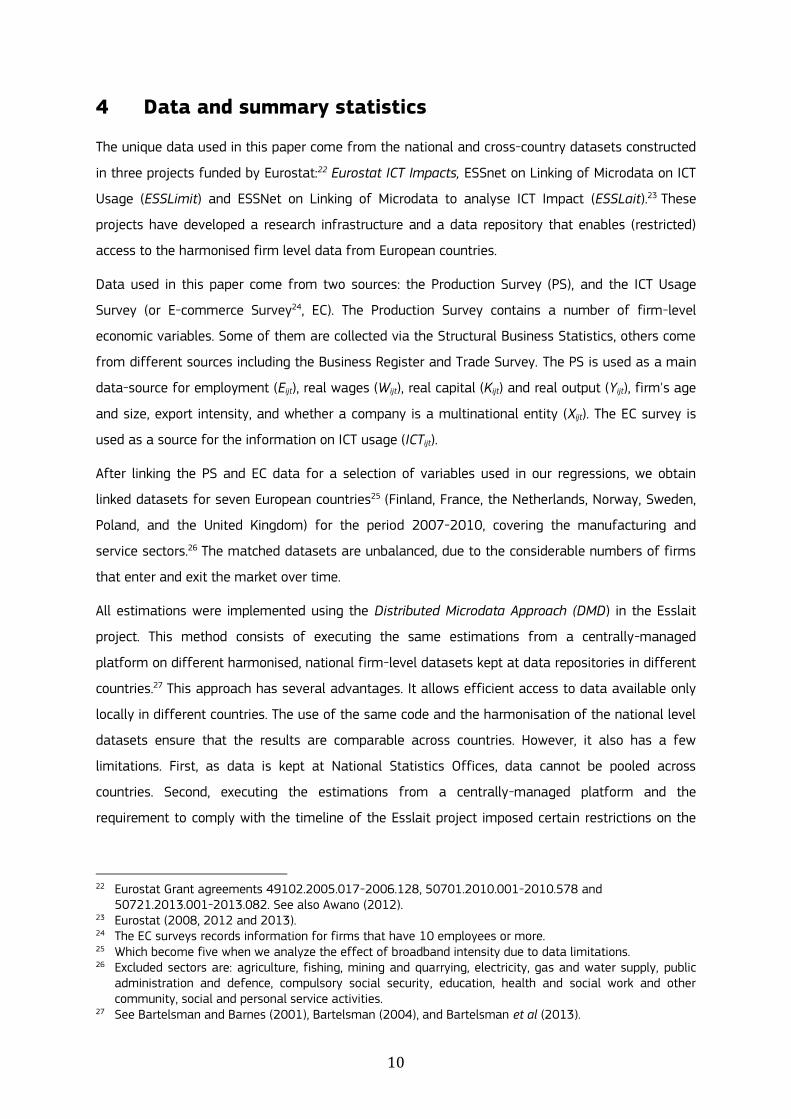
10
4 Data and summary statistics
The unique data used in this paper come from the national and cross-country datasets constructed
in three projects funded by Eurostat:22 Eurostat ICT Impacts, ESSnet on Linking of Microdata on ICT
Usage (ESSLimit) and ESSNet on Linking of Microdata to analyse ICT Impact (ESSLait).23 These
projects have developed a research infrastructure and a data repository that enables (restricted)
access to the harmonised firm level data from European countries.
Data used in this paper come from two sources: the Production Survey (PS), and the ICT Usage
Survey (or E-commerce Survey24, EC). The Production Survey contains a number of firm-level
economic variables. Some of them are collected via the Structural Business Statistics, others come
from different sources including the Business Register and Trade Survey. The PS is used as a main
data-source for employment (Eijt), real wages (Wijt), real capital (Kijt) and real output (Yijt), firm's age
and size, export intensity, and whether a company is a multinational entity (Xijt). The EC survey is
used as a source for the information on ICT usage (ICTijt).
After linking the PS and EC data for a selection of variables used in our regressions, we obtain
linked datasets for seven European countries25 (Finland, France, the Netherlands, Norway, Sweden,
Poland, and the United Kingdom) for the period 2007-2010, covering the manufacturing and
service sectors.26 The matched datasets are unbalanced, due to the considerable numbers of firms
that enter and exit the market over time.
All estimations were implemented using the Distributed Microdata Approach (DMD) in the Esslait
project. This method consists of executing the same estimations from a centrally-managed
platform on different harmonised, national firm-level datasets kept at data repositories in different
countries.27 This approach has several advantages. It allows efficient access to data available only
locally in different countries. The use of the same code and the harmonisation of the national level
datasets ensure that the results are comparable across countries. However, it also has a few
limitations. First, as data is kept at National Statistics Offices, data cannot be pooled across
countries. Second, executing the estimations from a centrally-managed platform and the
requirement to comply with the timeline of the Esslait project imposed certain restrictions on the
22 Eurostat Grant agreements 49102.2005.017-2006.128, 50701.2010.001-2010.578 and
50721.2013.001-2013.082. See also Awano (2012). 23 Eurostat (2008, 2012 and 2013). 24 The EC surveys records information for firms that have 10 employees or more. 25 Which become five when we analyze the effect of broadband intensity due to data limitations. 26 Excluded sectors are: agriculture, fishing, mining and quarrying, electricity, gas and water supply, public
administration and defence, compulsory social security, education, health and social work and other community, social and personal service activities.
27 See Bartelsman and Barnes (2001), Bartelsman (2004), and Bartelsman et al (2013).

11
number of specifications and type of empirical methods that could be executed. In the case of this
study, these restrictions limited the econometric specifications and the robustness checks.
Employment (joint) coverage in the Business Register, the Production Survey and the E-commerce
Survey in 2010 is reported in Table , while firm coverage is described in Table 2. Both firm and
employment coverage varies considerably by country, however, employment coverage is higher
than firm coverage. When focusing on employment (see Table 1), coverage of the joint Business
Register-Production Survey sample is about 50% in the Netherlands and in the UK, while it is close
to 100% in the other five countries studied (Finland, France, Poland, Norway and Sweden). Linking
the Business Register, the Production Survey and the E-commerce Survey reduces considerably
employment coverage. The resulting samples represent between 19.5% and 78% of the total
employment captured by the Business Register. Firm coverage by the joint Business Register,
Production Survey and E-commerce Survey, is generally much smaller, ranging from 0.3% in France
to 18% in Poland (see Table 2). The sample used in the empirical analysis is further reduced by
eliminating the firms that did not provide information on all variables of interest.
Table 3 reports descriptive statistics on the main variables of interest: intensity of ICT use (ICTijt)
and firm employment (Eijt). For each indicator, the table reports the country-sector specific means,
both at the beginning and at the end of the period studied (2007-2010), including their changes.
Between 2007 and 2010, the average intensity of ICT use by firms increased in all countries, in
both manufacturing and service (with the exception of France). On average, the largest increases
took place in the share of employees using mobile internet, followed by the share of employees
with access to broadband (the lowest took place in e-sales). The evolution of the e-sales indicator
suggests large differences across countries and sectors: while the share of e-sales in total sales
increased significantly in the Netherlands and the UK, this share was small or even negative in
other countries. During the same period, average employment by firms decreased in most countries
and sectors (however, employment increased considerably in the UK across all service sectors, as it
also did in France and Norway).
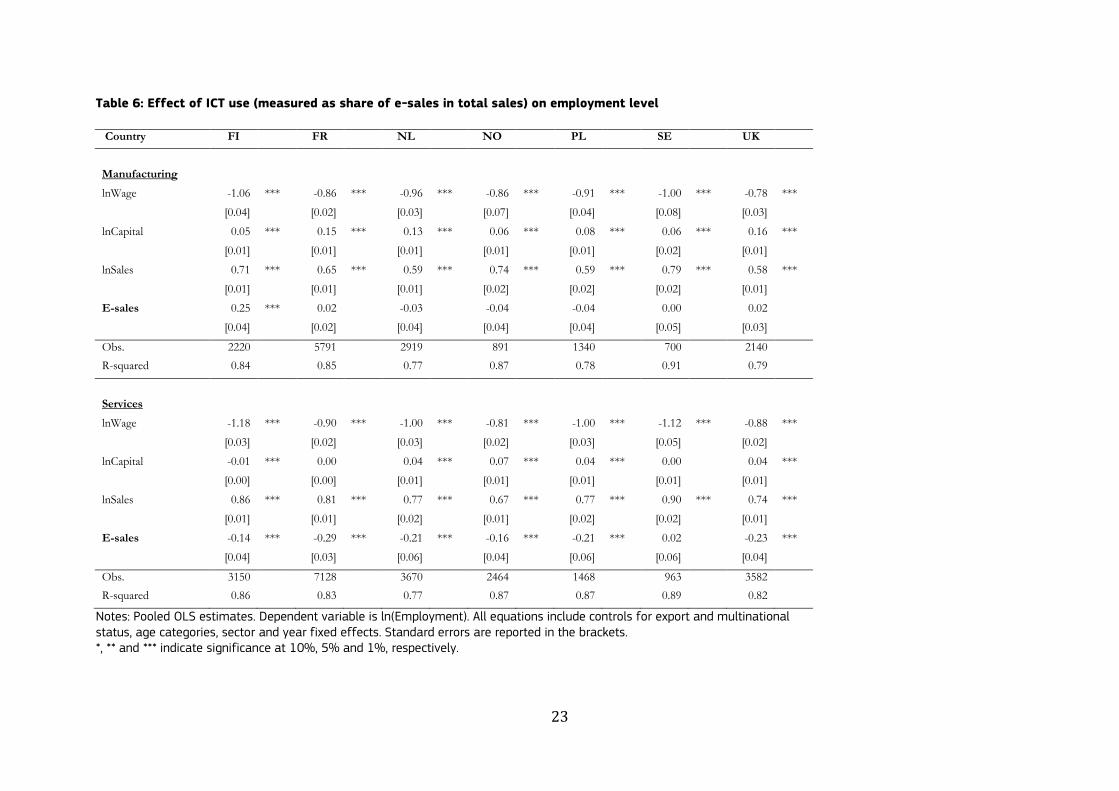
To explore further the relationship between ICT intensity and employment, we ran exploratory OLS
regressions of basic firm conditional labour demand augmented with ICT demand shifters. The
results for each measure of ICT use, country and sector are reported in Table 4 and Table 6. For
most country and sector combinations, the results show that, keeping output and capital constant,
firms that use ICT more intensively tend to have lower employment levels. This suggests that more
ICT-intensive firms have higher labour productivity, as they are able to produce the same level of
output with fewer employees.

12
To summarize, there is some descriptive evidence suggesting a negative association between firm
employment and ICT use. However, basic OLS regressions like those presented in Table 4 to Table 6
do not control for other relevant firm-specific characteristics, which may lead to spurious
correlations, due to omitted variable bias. The econometric analysis in the following section will
isolate the effect of ICT on firm employment by including additional controls and eliminating time-
invariant firm-specific characteristics.
5. Estimation results
Eq (1) is estimated using OLS28
separately for manufacturing and services29 in each country. This
allows the parameters of the labour demand equation and the effects of the main variables of
interest to differ by country and by macro-sector.
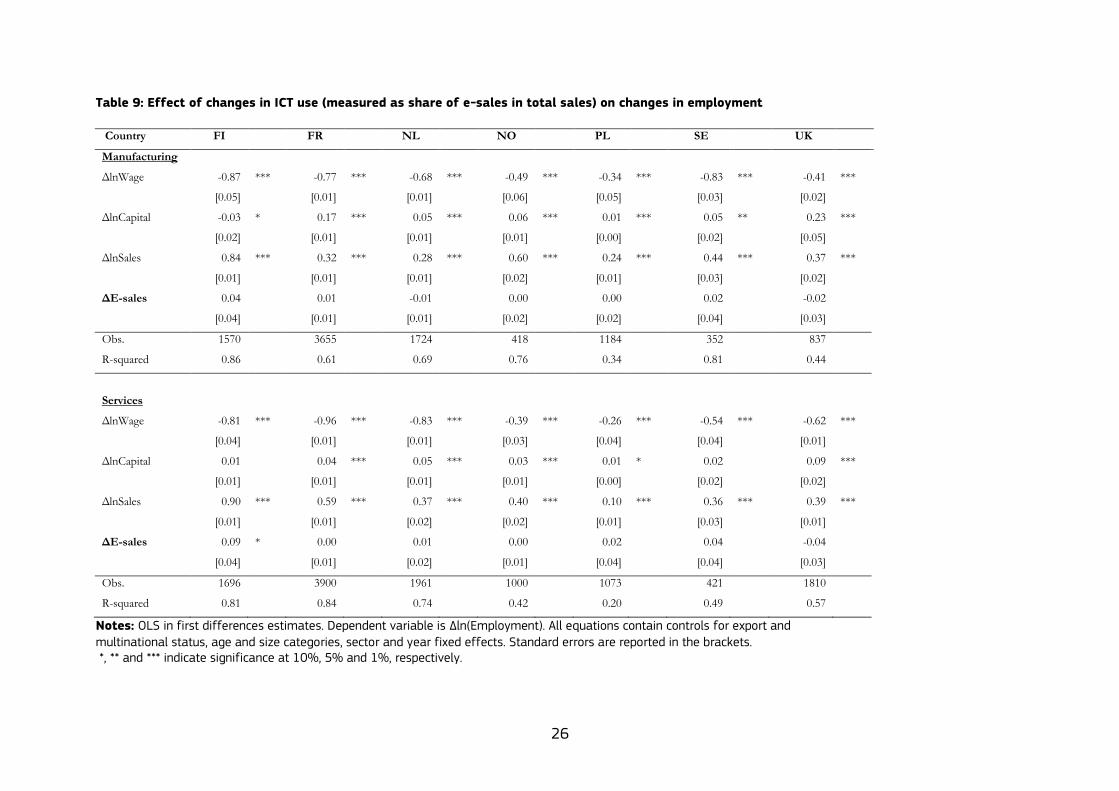
Tables 7 to 9 show the results of the estimation of (1). Results are reported separately for each
measure of intensity of ICT use, sector and country. Specifically, Table 7 shows results for the
share of employees with access to broadband, Table 8 the share of employees with access to
mobile internet, and Table 9 the share of e-sales in total sales. Each table contains two panels. The
upper-panel reports the results for firms in the manufacturing sector, while the lower-panel reports
the results for firms in the service sector. Each column reports the results for a different country.
The number of countries differs across measures of ICT use intensity, as some measures are not
available for all countries. The coefficients can be interpreted as short-term elasticities.
The coefficients of the classical determinants of the labour demand (output, capital and wages) are
statistically significant and have the expected signs and plausible magnitudes in almost all
estimations. The wage coefficient is negative and statistically significant in all countries and
sectors. The coefficients on sales and capital are positive and statistically significant in almost all
estimations, with the exception of Finland in the case of capital. Overall, the variation in the
explanatory variables included explains a large part of the variation of firm employment growth
(around 80% in many countries and sectors). The high R squared value indicates that the model
has a good fit overall. This is remarkable given that the variables are measured in first differences.
The coefficients on the variables capturing multinational and exporting status, age and size
categories, and on the sector dummies are mostly insignificant and where they are significant, they
do not suggest any clear pattern.
28 We also estimated a specification which includes ICT lags to allow for delays in adjustment of
employment in response to changes in the intensity of ICT use. The results for the lagged intensity of ICT use were very similar to our baseline results.
29 We also estimated the equation (1) separately for ICT producing sector ELECOM (Electrical machinery and Post and Telecommunications). The results were very similar to the results for the manufacturing and services.

13
The coefficients on the ICT measures are statistically insignificant in thirty-four out of thirty eight
country-sector combinations. In particular, when ICT use is measured as the share of employees
with access to broadband, the effect of ICT is always insignificant, though when it is measured as
the share of employees with mobile internet access, the coefficient is insignificant for eleven
country-sector combinations out of fourteen.30
Finally, when ICT is measured as the share of e-
sales in total sales, the effect of ICT is insignificant in all but one country-sector (service sector in
Finland). The consistency of our results across countries and sectors is quite remarkable, given that
several variables, including employment, were defined differently in different countries.31
Taken these results together suggests the following relationship between ICT and employment at
firm level: firms that use ICT more intensively tend to have higher labour productivity and
therefore, ceteribus paribus, lower employment levels. However, an increase in the intensity of ICT
use is not significantly associated to within-firm reductions in employment32
(i.e. there is no
evidence that firms that increase their use of ICT are also experiencing a drop in employment).
In interpreting these results, it is important to consider that the coefficients represent partial
effects, as we control for all other variables in the model. Specifically, some of the effects of ICT on
employment are captured by the coefficients on sales and capital, which are almost always positive
and statistically significant. This leads us to conclude that the insignificant substitution effect of
ICT may coexist with a positive effect of ICT on employment that works through improved firm
competitiveness and increased sales.
How do these results compare with previous results on this topic? Falk (2001) estimated a system
of two equations in which the conditional labour demand included both a measure of ICT intensity
and organizational change, where the latter was estimated with ICT use among the regressors. His
results show that, once organisational change had been controlled for, ICT had no additional effect
on employment growth. However, since ICT use positively affected organizational change, which
had a positive and significant effect on employment growth, the implication is that ICT did have a
positive effect on the employment growth of German firms in the period 1995-1997. Since
Germany is not among the countries for which ESSlait data are available, it has not been possible
to test our specification with German data and directly compare our results to those of Falk (the
time interval covered is also different). As for Bloom et al. (2011), who found that five-year lagged
ICT use had some positive effects on employment growth, it must be said that their study differs
30 In the remaining cases, the coefficient of ICT use is negative and statistically significant in two country-
sectors (manufacturing in Poland and services in UK) and positive and marginally statistically significant in one (manufacturing in Sweden).
31 Firm-level employment is measured in FTE in Finland, Poland and Sweden and in head-counts in France, Netherlands, Norway and the United Kingdom.
32 Methodologically, these results highlight the importance of taking into consideration firm unobserved firms’ characteristics, which may be correlated with ICT use and with labour demand.

14
from ours in two important ways. First, while we focus on the substitution effect, they examine the
total effect of ICT on employment, which is the sum of the substitution and the compensation
effects. Second, while we focus on the short-term,33
they examine the long-term effect of ICT
intensity on employment. It is possible that the insignificant short-term substitution effect of ICT
found in this study coexist with the long-term overall positive effects ICT have as a result of
improved firm competitiveness.
It must also be noted that our findings are broadly in line with those of several other firm-level
studies on the direct (substitution) effects of process innovation on employment. In particular,
Evangelista and Vezzani (2011), who distinguish between the direct effect of process innovation on
employment and its effect through increased sales, found that the substitution effect of process
innovation on employment is statistically insignificant in six European countries (Czech Republic,
Spain, France, Italy, Portugal and Slovenia). Several other studies (Van Reenen; 1997, Hall et al.,
2008; Giuliodori and Stucchi, 2012) also found that process innovation has insignificant or very
small job displacement effects at firm level.
6. Conclusions
In this study, we analyse the relationship between ICT use and employment growth among ICT-
using firms. We use firm-level data separately for manufacturing and services from seven
European countries during a recent period (2007-2010). Our data come from a unique dataset of
harmonised and linked micro data compiled by National Statistical Offices. This contains data
comparable across countries based on production statistics linked with the ICT /e-commerce survey
on firms’ ICT usage for each country and sector and on a range of other firm characteristics. To the
best of our knowledge, this is one of the very few studies that examine the relationship between
the intensity of ICT use and employment using specific ICT measures, and it is the first one that
uses a longitudinal dataset containing comprehensive and representative data from a large number
of EU countries.
Holding firm output and capital constant and controlling for time-invariant unobservable firm
characteristics, we find a non-significant relationship between employment growth and ICT
intensity among ICT-using firms. Since our estimates mainly capture the “substitution” effects of
ICT on employment (i.e. those due to ICT substituting for some type of labour and to ICT increasing
productivity and hence reducing demand for inputs, for constant values of output), our results
indicate that these effects are statistically insignificant.
33 They study the effect firm initial ICT intensity on employment growth during the following 5 years, while
we study the effect of yearly changes in ICT intensity on yearly changes in employment.

15
This result should not be interpreted as evidence for the hypothesis that ICT are irrelevant for
employment. In fact, we expect that the insignificant constant-output employment effect of ICT
intensity coexists with the positive effect of increased firm competitiveness -due to improved
productivity or output quality- which, however, is not the focus of this paper. In summary, we read
our results as an indication that, on average, increased intensity of ICT use has at least a non-
negative effect on employment at firm level.
We are conscious that our average firm-level estimates do not take into consideration the effects
due to firms exiting or entering the market or business-stealing effects. Nor do we examine
whether intensive ICT use has different effects on different skill-groups. We intend to address
these issues in further research, by using specifications that allow us to capture separately these
different ICT effects on employment, while also considering higher levels of aggregation (i.e. with
meso and macro level data).

16
References
Airaksinen, A., J. Berezowska, N. Djahangiri, E. Edelhofer, M. Redecker, and G. Zupan (2013), “ Study
on Input Data Quality” in Final Report of the ESSnet on Linking of Microdata to Analyse ICT
Impact, Eurostat
Amiti, M. and S. Wei (2006), “Service Offshoring, Productivity and Employment: Evidence from the
US”, CEPR Discussion Paper, No. 5475.
Bartelsman, E. J. (2004) “The Analysis of Microdata from an International Perspective”, STD/CSTAT,
12, OECD.
Bartelsman, E. J. and M. Barnes (2001) “Comparative Analysis of Firm Level Data: a Low Marginal
Cost Approach”, Research Report for the OECD.
Bartelsman, E. J., E. Hagsten and M. J. Polder (2013) Cross-country analysis of ICT impact using
firm-level data: Micro Moments Database and Research Infrastructure, Eurostat.
Berman, E., J. Bound and Z. Griliches (1994), “Changes in the Demand for Skilled Labor within US
Manufacturing: Evidence from the Annual Survey of Manufacturers”, Quarterly Journal of
Economics, 109, 367-397.
Biagi, F. (2013) “ICT and Productivity: a Literature Review”, Digital Economy Working Paper
2013/07, JRC-IPTS.
Blanchflower, D., and S. Burgess (1998). “New technology and jobs: Comparative evidence from a
two country study”, Economics of Innovation and New Technology, 5, 109–138.
Bloom, N., M. Draca and J. Van Reenen (2011) “Trade Induced Technical Change? The Impact of
Chinese Imports on Innovation, IT and Productivity,” NBER Working Papers 16717.
Brynjolfsson, E. and A. McAfee (2011) Race against the Machine: How the Digital Revolution is
Accelerating Innovation, Driving Productivity, and Irreversibly Transforming Employment and
the Economy, Digital Frontier Press.
Brynjolfsson, E. and A. McAfee (2014) The Second Machine Age: Work, Progress, and Prosperity in a
Time of Brilliant Technologies, W. W. Norton and Company.
Chennells, L. and J. Van Reenen (2002) “Technical change and the structure of employment and
wages: A survey on the micro-econometric evidence”, in Greenan, N., L’Horty, Y. and Mairesse
J. (eds.), Productivity, inequality and the digital economy, MIT Press.
Dachs, B. and B. Peters (2014) “Innovation, employment growth, and foreign ownership of firms a
European perspective”, Research Policy, 43, 214– 232.

17
Eurostat (2008) Final Report, Information Society: ICT Impacts Assessment by Linking Data from
Different Sources.
Eurostat (2012) Final Report, ESSNet on Linking of Microdata on ICT Usage.
Eurostat (2013) Final Report, ESSnet on Linking of Microdata to Analyse ICT Impact.
Evangelista, R. and A. Vezzani (2011) “The impact of technological and organizational innovations
on employment in European firms”, Industrial and Corporate Change, 21(4), 871–899.
Greenan, N. and D. Guellec (2000) “Technological Innovation and Employment Reallocation”, Labor,
14, 547–590.
Falk, M. and Y. Wolfmayr (2008) “Services and materials outsourcing to low-wage countries and
employment: Empirical evidence from EU countries”, Structural Change and Economic
Dynamics, 19(1), 38-52
Firpo, S., Fortin, N. M. and Lemieux, T. (2011). "Occupational Tasks and Changes in the Wage
Structure," IZA Discussion Papers 5542, Institute for the Study of Labor (IZA).
Giuliodori, D. and R. Stucchi (2012) “Innovation and job creation in a dual labor market: evidence
from Spain”, Economics of Innovation and New Technology, 21 (8), 801-813.
Hagsten, E. and A. Sabadash (2014) “A Neglected Input to Production: The Role of Schooled ICT
Experts in Firm Performance. Empirical Evidence from Six European Countries”, Digital
Economy Working Paper 2014/02, JRC-IPTS.
Hamermesh, D. (1993), Labor Demand, Princeton University Press, Princeton, New Jersey.
Hall, B. H., F. Lotti and J. Mairesse (2008) “Employment, innovation, and productivity: evidence from
Italian microdata”, Industrial and Corporate Change, 17, 813–839.
Harrison, R., J. Jaumandreu, J. Mairesse and B. Peters (2008) “Does Innovation Stimulate
Employment? A Firm-level Analysis Using Comparable Micro Data from Four European
Countries”, NBER Working Papers 14216.
Hijzen, A. and P. Swaim, (2007) “Does offshoring reduce industry employment?” Discussion Papers
07/24, University of Nottingham, GEP.
Iancu, D., E. Hagsten and P. Kotnik (2013) “Quality of Linked Firm-Level and Micro-Aggregated
Datasets: The Example of the ESSLait Micro Moments Database”, in Final Report of the
ESSnet on Linking of Microdata to Analyse ICT Impact, Eurostat
Lachenmaier, S., and H. Rottmann (2011) “Effects of Innovation on Employment: A Dynamic Panel
Analysis”, International Journal of Industrial Organization, 29, 210–220.

18
Levy, F and R.J. Murnane (1995), The New Division of Labor: How Computers Are Creating the Next
Job Market, Princeton University Press, Princeton, New Jersey.
Michaels, G., Natraj, A. and Van Reenen, J. (2014), “Has ICT polarized skill demand?: evidence from
eleven countries over 25 Years”, Review of Economics and Statistics, 96 (1), 60-77.
Peters, B. (2004). “Employment Effects of Different Innovation Activities: Microeconometric
Evidence.” ZEW Discussion Papers 0473.
Rifkin, J. (1995) The End of Work - The Decline of the Global Labour Force and the Dawn of the
Post-Market Era, Tarcher/Putnam, New York.
Sabadash, A. (2013) “ICT-induced Technological Progress and Employment: A Literature Review”
Digital Economy Working Paper 2013/07, JRC-IPTS.
Smolny, W. (1998) “Innovation, prices, and employment: A theoretical model and an application for
West German manufacturing firms”, Journal of Industrial Economics, 46, 359–381.
Van Reenen, J. (1997) “Employment and Technological Innovation: Evidence from U.K.
Manufacturing Firms,” Journal of Labor Economics, 15(2), 255-284.
Van Reenen J., Bloom N., Draca M. , Kretschmer T., Sadun R., Overman H. and Schankerman M.
(2010), “The Economic Impact of ICT”, Final Report for the European Commission.
Vivarelli, M. (2007) “Innovation and Employment: a Survey”, IZA Discussion paper, 2621.
Vivarelli, M. (2012) “Innovation, Employment and Skills in Advanced and Developing Countries: A
Survey of the Literature”, IZA Discussion Papers 6291.
Vivarelli, M. and Pianta, M. (eds) (2000) Employment Impact of Innovation: Evidence and Policy”.
Routledge: London.
Wooldridge, J. M. (2010). Econometric Analysis of Cross Section and Panel Data, MIT Press.

19
Annexes
Tables
Table 1: Coverage through the merging procedure: share of employment captured in the linked
dataset
Country Business Register (BR)
(Employment)
BR-PS (% of
BR)
BR-PS-EC (% of
BR)
Finland 1 113 088 95.6 43.3
France 4 373 323 100.0 78.1
The Netherlands 4 548 025 50.9 19.5
Norway 1 218 653 95.4 41.8
Poland 4 108 381 100.0 55.8
Sweden 1 886 255 100.0 34.1
The United Kingdom 15 422 078 52.0 27.8
Source: adopted from Iancu et al. (2013), p.8.
Table 2: Coverage through the merging procedure: share of firms captured in the linked dataset
Country Business Register (BR)
(No. of firms)
BR-PS (% of
BR)
BR-PS-EC (% of
BR)
Finland 182 009 54.1 1.4
France 23 253 0.8 0.3
The Netherlands 937 362 5.0 0.5
Norway 398 577 44.5 0.8
Poland 56 958 100.0 18.0
Sweden 569 478 100.0 0.5
The United Kingdom 1 366 044 2.6 0.2
Source: adopted from Iancu et al. (2013), p.7.

20
Table 3: Descriptive Statistics
Country FI
FR
NL
NO
PL
SE
UK
Year 2007 2010 Δ(%) 2007 2010 Δ(%) 2007 2010 Δ(%) 2007 2010 Δ(%) 2007 2010 Δ(%) 2007 2010 Δ(%) 2007 2010 Δ(%)
Manufacturing
Broadpct (%) 46.7 52.5 5.9 44.7 38.8 -5.9 41.1 45.4 4.3 47.2 53.7 6.4 16.4 25.6 9.1 47.0 66.4 19.4 39.9 50.1 10.2
Mobpct (%) 34.6 48.0 13.4 24.3 37.3 13.0 16.4 29.8 13.4 22.6 44.5 21.9 9.6 16.6 7.0 31.1 60.4 29.2 30.1 45.4 15.3
E-sales (%) 9.2 10.8 1.7 15.4 11.5 -3.8 5.8 12.2 6.4 31.7 34.4 2.7 5.2 7.4 2.1 34.9 35.1 0.3 9.3 23.6 14.3
Employment 64.7 62.2 -3.8 160.5 149.2 -7.0 109.0 99.3 -8.8 50.8 47.8 -5.9 93.5 86.8 -7.1 67.2 60.7 -9.8 192.4 259.9 35.1
Services
Broadpct (%) 70.0 76.4 6.4 57.3 48.1 -9.2 65.3 66.0 0.6 63.8 70.2 6.4 38.1 47.3 9.2 65.5 65.3 -0.3 50.5 60.3 9.8
Mobpct (%) 48.5 69.3 20.9 27.3 42.4 15.1 32.3 45.7 13.4 29.9 56.2 26.3 22.9 30.9 7.9 44.8 56.5 11.7 42.3 56.4 14.1
E-sales (%) 6.1 7.7 1.6 7.9 6.0 -1.9 6.7 14.0 7.3 28.0 29.0 1.0 3.4 4.8 1.4 25.5 27.6 2.1 7.0 11.4 4.4
Employment 43.9 44.1 0.4 189.1 240.7 27.3 77.4 77.7 0.4 31.6 34.3 8.7 70.6 67.1 -4.8 36.9 36.9 -0.1 404.1 545.7 35.0
Notes: Own calculations based on Esslait (PSSTAT and ECSTAT). Broadpct represents the share of employees with access to broadband in total employees. Mobpct represents the share of employees with access to mobile internet in total employees. E-sales represent the share of sales via computer networks in total sales. For Sweden, the change in E-sales is calculated for 2007-2009. Employment represents average firm employment in a given sector and country. The statistics are based on the PSEC (Production Survey and E-commerce Survey) sample.

21
Table 4: Effect of ICT use (measured as share of employees with access to broadband) on
employment level
Country FI FR NO SE UK
Manufacturing
lnWage 1.28 *** 0.65 *** 0.55 * -0.84 *** 0.70 ***
[0.17] [0.09] [0.27] [0.28] [0.12]
lnCapital -1.03 *** -0.83 *** -0.75 *** -0.68 *** -0.75 ***
[0.04] [0.02] [0.05] [0.05] [0.03]
lnSales 0.05 *** 0.15 *** 0.05 *** 0.07 *** 0.16 ***
[0.01] [0.01] [0.01] [0.01] [0.01]
Broadpct -0.17 *** -0.10 *** -0.26 *** -0.13 *** -0.14 ***
[0.03] [0.02] [0.04] [0.03] [0.04]
Obs. 2239 5791 1962 2152 2140
R-squared 0.84 0.85 0.84 0.90 0.79
Services
lnWage -1.09 *** -0.88 *** -0.96 *** -0.94 *** -0.77 ***
[0.03] [0.02] [0.02] [0.03] [0.02]
lnCapital -0.01 *** 0.00 -0.01 0.01 0.03 ***
[0.00] [0.00] [0.00] [0.01] [0.01]
lnSales 0.84 *** 0.79 *** 0.86 *** 0.87 *** 0.73 ***
[0.01] [0.01] [0.01] [0.01] [0.01]
Broadpct -0.34 *** -0.10 *** -0.37 *** -0.36 *** -0.52 ***
[0.03] [0.02] [0.03] [0.03] [0.03]
Obs. 3175 7128 5069 3255 3577
R-squared 0.87 0.83 0.88 0.90 0.83
Notes: Pooled OLS estimations. Dependent variable is ln(Employment). All equations include controls for export and multinational status, age categories, sector and year fixed effects. Standard errors are reported in the brackets. *, ** and *** indicate significance at 10%, 5% and 1%, respectively.

22
Table 5: Effect of ICT (measured as share of employees with mobile internet access) on employment level
Country FI FR NL NO PL SE UK
Manufacturing
lnWage -1.08 *** -0.85 *** -0.95 *** -0.84 *** -0.86 *** -0.72 *** -0.77 ***
[0.04] [0.02] [0.03] [0.05] [0.04] [0.05] [0.03]
lnCapital 0.05 *** 0.15 *** 0.13 *** 0.05 *** 0.08 *** 0.07 *** 0.16 ***
[0.01] [0.01] [0.01] [0.01] [0.01] [0.01] [0.01]
lnSales 0.72 *** 0.65 *** 0.59 *** 0.71 *** 0.59 *** 0.76 *** 0.58 ***
[0.01] [0.01] [0.01] [0.01] [0.02] [0.01] [0.01]
Mobpct -0.06 * -0.05 * -0.04 * -0.01
-0.13 ** -0.04
-0.06 *
[0.03] [0.02] [0.02] [0.03] [0.05] [0.03] [0.03]
Obs. 2239
5791
2919
1962
1340
2150
2140
R-squared 0.84 0.85 0.77 0.84 0.78 0.90 0.79
Services
lnWage -1.15 *** -0.90 *** -0.80 *** -1.01 *** -0.95 *** -0.99 *** -0.81 ***
[0.03] [0.02] [0.02] [0.02] [0.03] [0.03] [0.02]
lnCapital -0.01 *** 0.00
0.07 *** 0.00
0.04 *** 0.01
0.04 ***
[0.00] [0.00] [0.01] [0.00] [0.01] [0.01] [0.01]
lnSales 0.86 *** 0.80 *** 0.67 *** 0.87 *** 0.76 *** 0.89 *** 0.74 ***
[0.01] [0.01] [0.01] [0.01] [0.02] [0.01] [0.01]
Mobpct -0.09 *** 0.00
0.00
-0.02
-0.20 *** -0.10 *** -0.37 ***
[0.02] [0.02] [0.02] [0.02] [0.04] [0.02] [0.03]
Obs. 3175
7128
3671
5069
1463
3255
3577
R-squared 0.86 0.83 0.77 0.87 0.87 0.89 0.83
Notes: Pooled OLS estimates. Dependent variable is ln(Employment). All equations include controls for export and multinational status, age categories, sector and year fixed effects. Standard errors are reported in the brackets. *, ** and *** indicate significance at 10%, 5% and 1%, respectively.
23
Table 6: Effect of ICT use (measured as share of e-sales in total sales) on employment level
Country FI FR NL NO PL SE UK
Manufacturing
lnWage -1.06 *** -0.86 *** -0.96 *** -0.86 *** -0.91 *** -1.00 *** -0.78 ***
[0.04] [0.02] [0.03] [0.07] [0.04] [0.08] [0.03]
lnCapital 0.05 *** 0.15 *** 0.13 *** 0.06 *** 0.08 *** 0.06 *** 0.16 ***
[0.01] [0.01] [0.01] [0.01] [0.01] [0.02] [0.01]
lnSales 0.71 *** 0.65 *** 0.59 *** 0.74 *** 0.59 *** 0.79 *** 0.58 ***
[0.01] [0.01] [0.01] [0.02] [0.02] [0.02] [0.01]
E-sales 0.25 *** 0.02
-0.03
-0.04
-0.04
0.00
0.02
[0.04] [0.02] [0.04] [0.04] [0.04] [0.05] [0.03]
Obs. 2220
5791
2919
891
1340
700
2140
R-squared 0.84 0.85 0.77 0.87 0.78 0.91 0.79
Services
lnWage -1.18 *** -0.90 *** -1.00 *** -0.81 *** -1.00 *** -1.12 *** -0.88 ***
[0.03] [0.02] [0.03] [0.02] [0.03] [0.05] [0.02]
lnCapital -0.01 *** 0.00
0.04 *** 0.07 *** 0.04 *** 0.00
0.04 ***
[0.00] [0.00] [0.01] [0.01] [0.01] [0.01] [0.01]
lnSales 0.86 *** 0.81 *** 0.77 *** 0.67 *** 0.77 *** 0.90 *** 0.74 ***
[0.01] [0.01] [0.02] [0.01] [0.02] [0.02] [0.01]
E-sales -0.14 *** -0.29 *** -0.21 *** -0.16 *** -0.21 *** 0.02
-0.23 ***
[0.04] [0.03] [0.06] [0.04] [0.06] [0.06] [0.04]
Obs. 3150
7128
3670
2464
1468
963
3582
R-squared 0.86 0.83 0.77 0.87 0.87 0.89 0.82
Notes: Pooled OLS estimates. Dependent variable is ln(Employment). All equations include controls for export and multinational status, age categories, sector and year fixed effects. Standard errors are reported in the brackets. *, ** and *** indicate significance at 10%, 5% and 1%, respectively.

24
Table 7: Effect of changes in ICT use (measured as share of employees with access to broadband)
on changes in employment
Country FI FR NO SE UK
Manufacturing
ΔlnWage -0.87 *** -0.77 *** -0.44 *** -0.69 *** -0.41 ***
[0.05] [0.01] [0.03] [0.02] [0.02]
ΔlnCapital -0.03 * 0.17 *** 0.07 *** 0.11 *** 0.23 ***
[0.02] [0.01] [0.01] [0.01] [0.05]
ΔlnSales 0.83 *** 0.32 *** 0.35 *** 0.43 *** 0.37 ***
[0.01] [0.01] [0.01] [0.01] [0.02]
ΔBroadpct 0.01 0.00 0.00 0.01 0.04
[0.03] [0.01] [0.02] [0.01] [0.04]
Obs. 1647 3654 1304 1367 837
R-squared 0.86 0.61 0.52 0.63 0.44
Services
ΔlnWage -0.84 *** -0.96 *** -0.29 *** -0.76 *** -0.62 ***
[0.04] [0.01] [0.01] [0.02] [0.01]
ΔlnCapital 0.01 0.04 *** 0.04 *** 0.05 *** 0.09 ***
[0.01] [0.01] [0.00] [0.01] [0.02]
ΔlnSales 0.90 *** 0.59 *** 0.43 *** 0.54 *** 0.39 ***
[0.01] [0.01] [0.01] [0.01] [0.01]
ΔBroadpct -0.04 0.00 0.01 0.01 -0.01
[0.03] [0.01] [0.01] [0.02] [0.02]
Obs. 1786 3900 2809 1773 1810
R-squared 0.81 0.84 0.43 0.62 0.57
Notes: OLS in first differences estimates. Dependent variable is Δln(Employment). All equations include controls for export and multinational status, age and size categories, sector and year fixed effects. Standard errors are reported in the brackets. *, ** and *** indicate significance at 10%, 5% and 1%, respectively.

25
Table 8: Effect of changes in ICT use (measured as share of employees with mobile internet access) on changes in employment
Country FI FR NL NO PL SE UK
Manufacturing
ΔlnWage -0.87 *** -0.77 *** -0.67 *** -0.44 *** -0.34 *** -0.69 *** -0.41 ***
[0.05] [0.01] [0.01] [0.03] [0.04] [0.02] [0.02]
ΔlnCapital -0.03 * 0.17 *** 0.05 *** 0.07 *** 0.01 *** 0.11 *** 0.23 ***
[0.02] [0.01] [0.01] [0.01] [0.00] [0.01] [0.05]
ΔlnSales 0.83 *** 0.32 *** 0.27 *** 0.35 *** 0.24 *** 0.43 *** 0.37 ***
[0.01] [0.01] [0.01] [0.01] [0.01] [0.01] [0.02]
ΔMobpct 0.00 0.01 0.01 0.01 -0.07 *** 0.02 * -0.01
[0.02] [0.01] [0.01] [0.01] [0.03] [0.01] [0.03]
Obs. 1647 3654 1349 1304 1184 1367 837
R-squared 0.86 0.61 0.70 0.52 0.34 0.63 0.44
Services
ΔlnWage -0.85 *** -0.96 *** -0.84 *** -0.29 *** -0.26 *** -0.76 *** -0.62 ***
[0.04] [0.01] [0.01] [0.01] [0.04] [0.02] [0.01]
ΔlnCapital 0.01 0.04 *** 0.06 *** 0.04 *** 0.01 * 0.05 *** 0.09 ***
[0.01] [0.01] [0.01] [0.00] [0.00] [0.01] [0.02]
ΔlnSales 0.90 *** 0.59 *** 0.33 *** 0.43 *** 0.10 *** 0.54 *** 0.39 ***
[0.01] [0.01] [0.02] [0.01] [0.01] [0.01] [0.01]
ΔMobpct 0.01 0.00 0.01 -0.01 0.01 0.01 -0.04 **
[0.02] [0.01] [0.01] [0.01] [0.02] [0.01] [0.02]
Obs. 1786 3900 1503 2809 1073 1773 1810
R-squared 0.81 0.84 0.77 0.43 0.20 0.62 0.57
Notes: OLS in first differences estimates. Dependent variable is Δln(Employment). All equations contain controls for export and multinational status, age and size categories, sector and year fixed effects. Standard errors are reported in the brackets. *, ** and *** indicate significance at 10%, 5% and 1%, respectively.
26
Table 9: Effect of changes in ICT use (measured as share of e-sales in total sales) on changes in employment
Country FI FR NL NO PL SE UK
Manufacturing
ΔlnWage -0.87 *** -0.77 *** -0.68 *** -0.49 *** -0.34 *** -0.83 *** -0.41 ***
[0.05] [0.01] [0.01] [0.06] [0.05] [0.03] [0.02]
ΔlnCapital -0.03 * 0.17 *** 0.05 *** 0.06 *** 0.01 *** 0.05 ** 0.23 ***
[0.02] [0.01] [0.01] [0.01] [0.00] [0.02] [0.05]
ΔlnSales 0.84 *** 0.32 *** 0.28 *** 0.60 *** 0.24 *** 0.44 *** 0.37 ***
[0.01] [0.01] [0.01] [0.02] [0.01] [0.03] [0.02]
ΔE-sales 0.04 0.01 -0.01 0.00 0.00 0.02 -0.02
[0.04] [0.01] [0.01] [0.02] [0.02] [0.04] [0.03]
Obs. 1570 3655 1724 418 1184 352 837
R-squared 0.86 0.61 0.69 0.76 0.34 0.81 0.44
Services
ΔlnWage -0.81 *** -0.96 *** -0.83 *** -0.39 *** -0.26 *** -0.54 *** -0.62 ***
[0.04] [0.01] [0.01] [0.03] [0.04] [0.04] [0.01]
ΔlnCapital 0.01 0.04 *** 0.05 *** 0.03 *** 0.01 * 0.02 0.09 ***
[0.01] [0.01] [0.01] [0.01] [0.00] [0.02] [0.02]
ΔlnSales 0.90 *** 0.59 *** 0.37 *** 0.40 *** 0.10 *** 0.36 *** 0.39 ***
[0.01] [0.01] [0.02] [0.02] [0.01] [0.03] [0.01]
ΔE-sales 0.09 * 0.00 0.01 0.00 0.02 0.04 -0.04
[0.04] [0.01] [0.02] [0.01] [0.04] [0.04] [0.03]
Obs. 1696 3900 1961 1000 1073 421 1810
R-squared 0.81 0.84 0.74 0.42 0.20 0.49 0.57
Notes: OLS in first differences estimates. Dependent variable is Δln(Employment). All equations contain controls for export and multinational status, age and size categories, sector and year fixed effects. Standard errors are reported in the brackets. *, ** and *** indicate significance at 10%, 5% and 1%, respectively.

Europe Direct is a service to help you find answers to your questions about the European Union
Freephone number (*): 00 800 6 7 8 9 10 11
(*) Certain mobile telephone operators do not allow access to 00 800 numbers or these calls may be billed.
A great deal of additional information on the European Union is available on the Internet.
It can be accessed through the Europa server http://europa.eu.
How to obtain EU publications
Our publications are available from EU Bookshop (http://bookshop.europa.eu),
where you can place an order with the sales agent of your choice.
The Publications Office has a worldwide network of sales agents.
You can obtain their contact details by sending a fax to (352) 29 29-42758.
European Commission
Joint Research Centre – Institute for Prospective Technological Studies
Title: Are ICT Displacing Workers? Evidence from Seven European Countries
Authors: Smaranda Pantea, Federico Biagi and Anna Sabadash
Spain: European Commission, Joint Research Centre
2014 – 26 pp. – 21.0 x 29.7 cm
EUR – Scientific and Technical Research series – ISSN 1831-9408 (online)

JRC Mission As the Commission’s in-house science service, the Joint Research Centre’s mission is to provide EU policies with independent, evidence-based scientific and technical support throughout the whole policy cycle. Working in close cooperation with policy Directorates-General, the JRC addresses key societal challenges while stimulating innovation through developing new methods, tools and standards, and sharing its know-how with the Member States, the scientific community and international partners.
Serving society Stimulating innovation Supporting legislation


