Are Spiral Galaxies Round? Richard McDonald June 10, 2006 Introduction This project began as an exploration of the use of observational measurement and statistical techniques to test the hypothesis H 0 that all spiral galaxies are perfectly round and that the elliptical shapes we see correspond to the projection effect of our viewing angle on their randomly-inclined disks. As I discovered that I lack the measurement precision and the mathematical tools to make an accurate analysis of this hypothesis, the project expanded into a sample of these techniques, analysis of catalogue data, simulation of a theoretical case, and a survey of recent research on this and related questions. My results are mixed. I was able to answer the posed question, "are spiral galaxies round?" as "generally yes, within my available precision" with some confidence, based on visual analysis of distribution graphs. I was unable, however, to fit the theoretical distribution to observations with statistical techniques. Modern research is determining that spiral galaxies are not, in fact, round, but have a slight ellipticity. I show where some minor anomalies in my data may be attributed to this ellipticity. However, I was unable to reproduce the data analysis that is leading researchers to these conclusions. My attempt to compare the ellipticity theory to observed data by using a simulation was visually suggestive, but also failed statistical significance tests. Measuring Method Calculating Apparent Inclinations Observing a collection of galaxies at random locations in the sky, one observes a variety of ellipses of varying eccentricity, and rotated at varying angles from horizontal, as illustrated in Figure 1. I make the simplifying assumption that the angle of rotation from horizontal can be ignored, since it does not affect observed ellipticity, as do rotations in the other 2 dimensions (Rood and Baum 1967), so only the lengths of the perpendicular major and minor axes of the ellipses are recorded. Figure 1: Random Ellipses
Transcript
Are Spiral Galaxies Round?Richard McDonaldJune 10, 2006
Introduction
This project began as an exploration of the use of observational measurement andstatistical techniques to test the hypothesis H0 that all spiral galaxies are perfectly roundand that the elliptical shapes we see correspond to the projection effect of our viewingangle on their randomly-inclined disks. As I discovered that I lack the measurementprecision and the mathematical tools to make an accurate analysis of this hypothesis, theproject expanded into a sample of these techniques, analysis of catalogue data, simulationof a theoretical case, and a survey of recent research on this and related questions.
My results are mixed. I was able to answer the posed question, "are spiral galaxiesround?" as "generally yes, within my available precision" with some confidence, basedon visual analysis of distribution graphs. I was unable, however, to fit the theoreticaldistribution to observations with statistical techniques.
Modern research is determining that spiral galaxies are not, in fact, round, but have aslight ellipticity. I show where some minor anomalies in my data may be attributed to thisellipticity. However, I was unable to reproduce the data analysis that is leadingresearchers to these conclusions. My attempt to compare the ellipticity theory to observeddata by using a simulation was visually suggestive, but also failed statistical significancetests.
Measuring Method
Calculating Apparent Inclinations
Observing a collection of galaxies at random locations in the sky, one observes a varietyof ellipses of varying eccentricity, and rotated at varying angles from horizontal, asillustrated in Figure 1. I make the simplifying assumption that the angle of rotation fromhorizontal can be ignored, since it does not affect observed ellipticity, as do rotations inthe other 2 dimensions (Rood and Baum 1967), so only the lengths of the perpendicularmajor and minor axes of the ellipses are recorded.
Figure 1: Random Ellipses
Page 2 of 29
In fact, recent findings indicate this assumption is untrue – position angles ofgalaxies are not random, but are oriented so that the galaxies are aligned with thefilaments in recently-discovered large-scale structure (Trujillo, Carretero et al.2006). However, this effect is too small for detection in a study such as thisproject, and can safely be ignored.
We can also ignore inclinations greater than 90° since larger inclinations would simplypresent other faces of the galactic disk but would still project as ellipses.
Basic conical-section geometry shows that a circle inclined away from the viewer by anangle
�
θ (where
�
θ = 0 is face-on) will project as an ellipse where the ratio of the minor tomajor axes is
�
b /a = cosθEquation 1
(Eshbach 1936). Figure 2 shows the inclination of a circle producing an ellipse. Thiscircle is theoretical, with zero thickness.
Figure 2: Inclined Circle becomes Ellipse
Real galaxies, on the other hand, have a non-zero thickness. They would be bestmodelled by two concentric ellipsoids, one for the bulge and one for the disk, but can beclosely approximated by an ellipsoid with a thickness of 10% to 20% of the disk diameter(Sandage, Freeman et al. 1970) The intrinsic thickness of a galaxy limits the thinness thatcan be observed when the galaxy is viewed edge-on. For example, Figure 3 (page 14)shows an ellipsoid galaxy (a=10, b=9, c=2) viewed from above, showing only a normalprojection ellipse. When viewed directly edge-on, however, Figure 4 shows the thinnestobservable ellipse, corresponding to the thickness of the galactic disk.
Hubble (1926) derived a formula for translating the observed axis ratio to inclinationangle for a disk as
Page 3 of 29
�
cos2θ =(b /a)2 − q02
1− q02
Equation 2
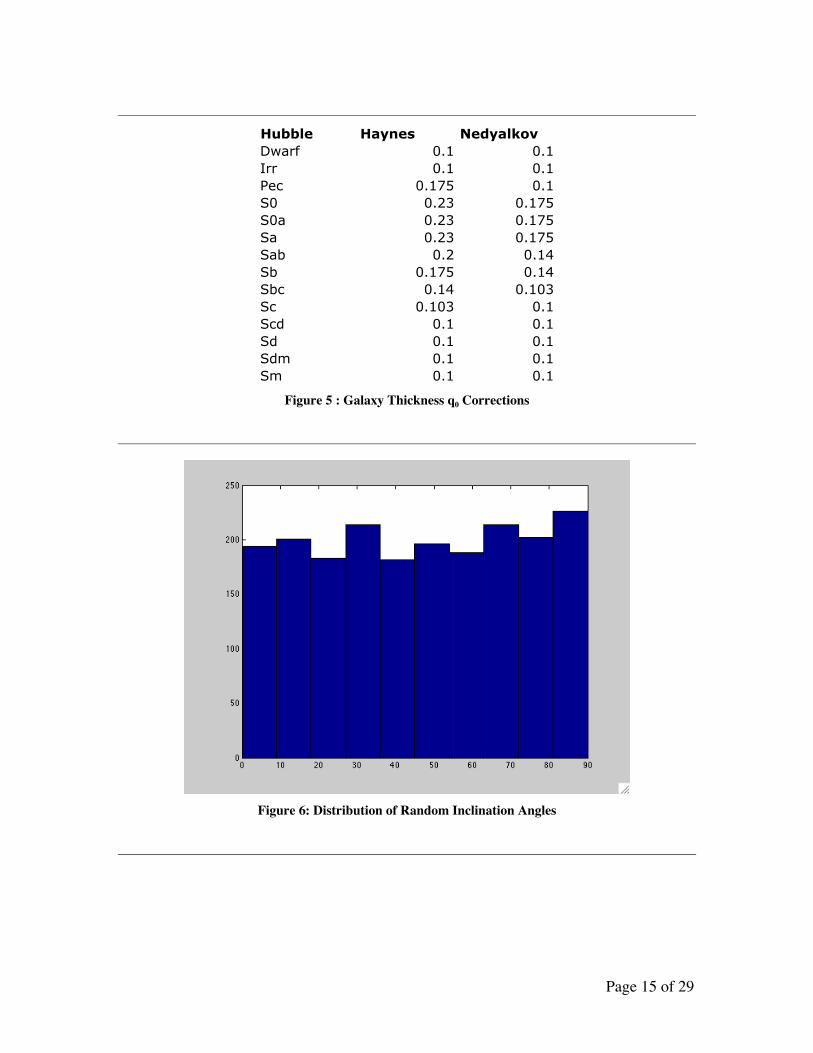
where q0 is the "inherent thickness", or the c-axis, of the ellipsoid. It was common inearly analyses to use a fixed value such as 0.20 for q0 (Tully 1972), (Tully and Fisher1977). More recently, the thickness correction has been found to vary with the galaxy'smorphological type (Ryden 2005). I found the q0 tables of Haynes (1984) and Nedyalkov(1993), as shown in Figure 5 (pg. 15), improved the fit of highly-inclined galaxiessignificantly. Finally, Aaronson et al (1980) recommend adding a fixed 3° correction toaccount for "systematic differences between RC2 ratios and radio observations". Iexperiment with this correction in the analysis below.
Expected Distribution
Before analyzing available data, I considered what kind of distribution I would expect tofind if H0 were true.
Clearly, if I truly were observing an unbiased random sample of randomly-inclined disks,and if all the ellipses observed were disks rotated on a single axis of rotation, I wouldexpect a uniform distribution of my calculated inclination angles (Huizinga and Albada1992). Figure 6 shows such a distribution from an artificially-generated sample.
However, although I am modelling the ellipses as disks with a single rotation, they are inreality disks rotated on two axes. (In fact, three, but I am ignoring position angle.) Thatis, if we assume the disk started face-on to us, we then have to rotate it on the"horizontal" axis, and then on the "vertical" axis to achieve any possible orientation inspace. This second rotation will drive the distribution we see away from a uniformdistribution. Since the ratio of the two axis lengths is related to the second rotation by
�
b /a = cosθ and therefore
�
θ = arccos(b /a), I would expect to see calculated inclinationsdistributed as arccosine. (I confess that I had to visually inspect the measureddistributions of my catalogue samples, hunting for an explanation of the sine-shapedhump before realizing what was happening. The fact that many curves exhibited a peaknear 60°, which is cos(1/2), was a clue.) Figure 7 (pg. 16) shows the distribution ofinclinations calculated from artificially-generated a and b axis lengths. This stronglyresembles an arccosine probability density, as seen by comparing to a theoreticalarccosine density shown in Figure 8.
Interestingly, this distribution suggests that face-on galaxies should be rarely observed.This is intuitive, since there are two dimensions of rotation that can take a galaxy awayfrom a face-on view, and only identical rotations in both of those dimensions leaves itappearing to face the observer. One would expect this to be a low-probability occurrence.Also, the central tendency (here peaking at 70-80 degrees) might shift left or rightdepending on the optical depth of the galaxies. If galaxies were largely opaque, thenedge-on galaxies would be underrepresented in a large sample (Disney 1990) – contrary
Page 4 of 29
to the relatively high representation of edge-on galaxies the arccosine distributionpredicts.
Data Collection
Both for my own measurements and, later, for catalogue analysis, I followed the lead ofmany researchers who select spiral galaxies with certain properties. I preferred Hubbletypes Sa and later for their distinct disk shapes (Tully and Fisher 1977), avoided Barredspirals because Bars can distort dimension measurements, especially in visiblewavelengths (Ryden 2004), selected disks with a large apparent diameter for easymeasurement (Binney and de Vaucouleurs 1981), and manually rejected images thatshowed obvious signs of interaction or distortion (Nedyalkov 1993).
For my own measurements, I downloaded images from the Internet, most from theDigital Sky Survey (Erdmann undated). I inspected these images in negative using AdobePhotoshop. Assuming that position angle is irrelevant, I rotated each image to bring thegalaxy's major axis horizontal, and then used the Photoshop ellipse tool to visually fit anellipse over the galaxy, measuring the dimensions in pixels. By judging the visualboundary of the galaxies, I was using a crude Isophotal definition of galaxy size. Figure 9(pg. 17) shows a typical galaxy image during this measurement process, with an ellipticalmarquee showing the Photoshop measurement area. (The coloured corners in this imageare an artefact of the image rotation that brought the ellipse horizontal for measurementby the Photoshop ellipse tool, which cannot trace inclined ellipses.)
Measured data were collected in an Excel spreadsheet for basic organization, and I usedthe MATLAB program from Mathworks for statistical analysis and data visualization.
Data Analysis
Messier Spirals
To test and rehearse the techniques, I analysed the 21 non-barred Messier spirals (Figure10). Unfortunately, this sample of 21 galaxies is too small for any pattern to be evident ineither the axis ratios (Figure 11, pg. 18) or the calculated inclinations (Figure 12) so I didno further analysis with the Messiers.
Selection of NGC Spirals
For a larger sample, I measured a selection of 100 NGC galaxies. To generate a useablesample, I selected only non-barred Hubble types Sa and later. I further restricted thesample to only galaxies above a threshold apparent major axis length according to theNGC/IC Project catalogue (Erdmann undated) in order to have images large enough forconvenient measurement. I then sorted the list into random order and selected the first100. Each of these galaxies was measured using Photoshop as described above. Finally,while measuring, I dropped any galaxies whose images showed obvious distortion frominteractions. The results are shown in Figure 13 (pg. 19).
Page 5 of 29
Plotting a number of distribution histograms for these data, we first note, in Figure 14,that the measured Axis ratios are not uniform, but display a central tendency which mightbe normal in a larger sample, except for an apparent outlier at ratio=1. This is good news,as normal axis ratios would indicate selection bias toward random ratios not randominclinations, as discussed above, while normal ratios should approach the predictedarccosine distribution of inclinations. Figure 15 (pg. 20) shows the distribution of thedirectly-calculated inclinations and markers showing the distribution of an artificially-generated arccosine curve. The sample is small, but one can see a tendency to follow thecosine curve, with two exceptions: There are outliers of incorrect counts of galaxies inthe 10°-40° range and, worse, there seem to be too few edge-on galaxies. In uncorrecteddata, this is not surprising, because edge-on galaxies would have zero thickness, and beundetected.
Hubble's approach for modelling disk thickness with
�
cos2θ =(b /a)2 − q02
1− q02 would better
represent the end points on this curve, especially the 90° edge-on case, but will notaddress the gaps and irregularities in the middle of the distribution curve. As a sample,Figure 16 (pg. 21) shows the Tully correction, using a fixed 0.20 thickness for theellipsoid disks. Ignoring the outlier at 50°, this is a closer fit. Very thin ellipses have beenclassified as ellipsoid disks viewed edge-on, so the 90° distribution is more in line withthe predicted curve.
There are still a number of irregularities in these data, however, which I attribute to poor-quality data in my coarse measurements, so I decided to move on to analysis of astatistically significant set of uniformly-measured data from online catalogues.
Catalogue Data
To analyse a large number of consistently and accurately measured spirals, I extractedspiral galaxies from the Principal Galaxy Catalogue (PGC 2003). As with the NGC dataabove, I selected only non-barred Sa and later type galaxies. To assure relatively accuratedata, I eliminated from the sample any galaxies whose error in diameter measurementexceeded 30%, or where any of the important data fields had nonsensical values (such asnegative diameters). The result was a sample of 36,368 spirals. PGC, like manycatalogues, gives the log of the axis ratio, not the actual axis dimensions, so I calculatedthe ratios. Figure 17 (pg. 21) shows the first few lines of the resulting list as an example.
The log(axis ratio) figures (Figure 18) roughly follow a log-normal distribution,indicating a distribution of ratios with a central tendency, but we see the ratio distributionis too lopsided and abrupt for a pure Normal fit (Figure 19). Nevertheless, this lead me toexpect a good approximation to the arccosine curve seen above for the calculatedinclinations.
Calculating the apparent inclinations, we see in Figure 20 (pg. 23) a curve roughlyfollowing the predicted arccosine distribution except, again, for an absence of edge-on
Page 6 of 29
(90°) cases. The various q0 correction schemes discussed above are designed to addressthese end conditions, so I tested the effect of each.
The basic correction used by Tully and Fisher (1977) uses a fixed value of 0.2 for q0.Figure 21 (pg. 23) shows this correction yields a distribution still roughly following thearccosine, except for falling off in the last 20 or 30 degrees, and for a large outlier at 90°(edge-on). The outlier at 90° is not surprising since this correction equates all galaxiesnarrow than 0.2 to edge-on; even if they truly were merely highly-inclined. With thisadjustment, 4,246 galaxies in our sample of 36,368 were classified as having aninclination of exactly 90°.
Two methods to apply different q0 correction values for different galaxy morphologicaltypes have been proposed by Haynes and Giovanelli (1984) and Nedyalkov (1993).Figure 22 and Figure 23 (pg. 24) show the distributions that result from applying thesecorrections to the PGC sample galaxies. Tully's large hump at 90° is spread to the left,across the central tendency hump. Visually, I find the Haynes correction yields a morecontinuous distribution, except for the now insufficient number of edge-on 90° galaxies.
We can now see the reason for an additional suggested correction. Tully and Fisher(1977) found that the visual observations presented as being slightly too face-on.Aaronson and Mould (1980) agreed; by comparing inclinations calculated from visualdata in the RC2 catalogue with radio-based calculations, they found a "small butsignificant systematic difference", and recommended that all visually-calculatedinclinations be increased by a fixed 3° (holding anything exceeding 90° to 90°).
Applying this additional 3° shift to the Haynes-corrected inclinations brings thedistribution much closer to the theoretical arccosine, as shown in Figure 24 (pg. 25).Even in this case, there are slight differences between the galaxy distribution and thearccosine reference, but it is clearly closely following that shape, enough that I amprepared to call this a visual match. Plotting the probability distributions of theinclinations and the theoretical arccosine on a quantile-quantile graph shows that thedistributions are virtually identical for inclinations greater than about 25° (Figure 25, pg.25).
Numerically, it is not a good match. Ryden (2005) recommends using the Kolmogorov-Smirnov test to test if two samples appear to come from the same distribution. Using thistest in MATLAB to compare the 3°-shifted, Haynes-corrected inclinations to theartificially-generated arccosine sample gave a probability of match near zero, and a KS-test value of 0.1, a very poor match.
H0 Conclusion
Based solely on the graphic analysis of inclination distributions, there would appear to begood support for the hypothesis that spiral galaxies are round disks randomly oriented inspace, with the ellipses we observe being projection effects, especially when the Haynesor Nedyalkov morphology-based corrections for intrinsic disk thickness are used.
Page 7 of 29
Numerically, however, I have been unable to find a match considered statisticallysignificant, due to remaining deficiencies near the face-on end of the distribution.
Most researchers are finding results inconsistent with these, that the distribution ofobserved spirals is consistent with the galaxies having a small intrinsic ellipticity(references below). Such ellipticities would be expected to present themselves asdifferences in the frequency of face-on and edge-on inclinations, and may be contributingto the edge deficiencies visible in my distributions.
Limitations
Some caution should accompany the conclusions from this graphic study, as severallimitations may affect these analyses.
First, nearly any visually-selected sample of galaxies will suffer from the Malmquisteffect: galaxies with larger diameters and higher luminosities are overrepresented(Nedyalkov 1993). Burstein and Haynes (1991) warn that selection (by diameter orluminosity) will determine the inclinations found. While this study should be independentof apparent diameter, it may be biased by selecting higher luminosities, since edge-ongalaxies will be over- or under- represented depending on the optical depth of typicalgalaxies (Ryden 2005).
This dependence of surface brightness on optical depth is an old debate. Authors werepointing out the effects of transparency or opacity of galaxies on their apparentluminosity before Hubble's study (Opik 1923) and even in the last twenty years, havetaken conflicting positions on whether galaxies are largely opaque (Valentijn 1990),transparent (Barnes and Sellwood 2003), or somewhere in between (Huizinga and Albada1992).
My initial Messier sample certainly suffered from this effect, as the Messiers consist ofonly those large and bright spirals that were easily visible with early observingequipment. The NGC catalogue, on the other hand, was more complete and the PGCcatalogue is complete down to a given limiting magnitude. Even when samples arecomplete, the morphological types of small and dim galaxies may be misclassified ifimportant telltale structural features are not clearly visible.
The slight under-representation of edge-on galaxies in Figure 24 may be indicative of theprevailing feeling that spiral galaxies are semi-transparent, with dust extinction reducingtheir surface brightness and causing them to be under-selected them in magnitude-limitedsamples.
Second, this study is based on measurement of the visible dimensions of galaxies, andthere are several problems with this approach. Barnes and Sellwood (2003) find thatseeing conditions bias elliptical isophotes towards being perceived as round, and Rudnickand Rix (1998) remind us that when we measure visible wavelengths, we are measuringthe ellipticity of the visible minority of the material in a galaxy, not necessarily the
Page 8 of 29
ellipticity of its mass distribution. Ryden (2004) poetically calls this "measuring theellipticity of starlight".
I certainly introduced error of this nature in my measured samples. By hand-fitting anellipse to a galaxy image, I was doing a crude isophotal size measurement using anaesthetic, rather than an objectively measured, sense of where galactic brightness fell offto a given extent. I was surprised at the variation between some of my measureddimensions and the published dimensions in the NGC catalogue. Often our measuresagreed within a few percent, but sometimes they disagreed by as much as 20 or 30%,sometimes on galaxies that appeared no different than those which measured accurately.Clearly the dimensions published in catalogues were measured with some technique morediscriminating than my visual inspection of an image.
Finally, the physical structure of spiral galaxies can be a source of error. As alreadypointed out, our modelling of the thickness of the galaxy as a single ellipsoid is asimplification, and the central bulge can be a source of measurement error (Ma, Song etal. 2000). Worse, the presence of open spiral structure can cause perceptual errorsvarying with inclination; we tend to underestimate the inclination of face-on galaxies(Aaronson, Huchra et al. 1979). Spiral structures have been blamed for measurementuncertainties on the order of 5 degrees (Barnes and Sellwood 2003).
Again, this may explain the slight under-representation of edge-on galaxies in my results.I avoided certain physical structure errors by rejecting galaxies with obvious signs ofinteraction, such as bridges to nearby neighbours or major distortions. However Iprobably misclassified at least some tidal tails as open spiral arms, or vice versa, and Iprobably perceived certain edge-on galaxies as too thick when they had an abnormallylarge or bright central bulge.
Alternate Hypothesis: Ellipticity
Visually favouring, but numerically unable to support, the hypothesis that spiral galaxiesare randomly inclined round disks, I was interested in trying to detect evidence of theirelliptical shapes.
Many researchers have studied this question and concluded the data are consistent withgalaxies having slightly elliptical shapes. For ellipsoid solids, Ellipticity, or flatness ismeasured as
�
f = 1− b /a . (Elliptical orbits, on the other hand, are usually measured byeccentricity, which is related to ellipticity by
�
e2 = 2 f − f 2 .) Lambas & Maddox (1992)and Andersen & Bershady (2001) both find evidence for ellipticity of approximately 0.1.Ryden (2004), after an combined analysis using photographic and kinematic methods,finds the best fit is with a normal distribution of ellipticities centred around f=0.15.
Not all researchers agree. Barnes & Sellwood (2003), for example, find "no evidence ofintrinsically elliptical disks", and argue that various measurement uncertainties canaccount for all the variations found in the measured data.
Page 9 of 29
Simulation
It was evident that analysis of observational data for consistency with elliptical structuresrequired a level of math and computing capacity well beyond me (Lucy 1974),(Noerdlinger 1979). Instead, I decided to perform a simple simulation, by generating alarge sample of galaxies incorporating slight ellipticity in their random dimensions,rotating them randomly in space, and then analysing them in the same manner as thecatalogue data, to compare the results. Distributions of my simulated galaxies similar tothe distributions of the catalogue data would be evidence in support of ellipticity.
The first problem that presented in this simulation was the geometry of how to rotateelliptical galaxies randomly in space. Circular galaxies, being axisymmetric, need only berotated on one axis to generate any possible observed ellipse (ignoring position angle).Elliptical galaxies, on the other hand, need to be treated in two dimensions since there is avisual difference between rotation on the long and short axes.
Consider first the case of a flat elliptical disk of zero thickness. Figure 26 (pg. 26), showshow this disk can be rotated twice, once by a random amount along the major axis (whichchanges the length of the minor axis), then by a random amount along the minor axis(which changes the length of the major axis). A third rotation, on the plane of the page,would orient the resulting ellipse at a random position angle. These 3 rotations aresufficient to transform any real disk into the projection seen at any random orientation inthe sky. Continuing with our assumption that position angles can be safely ignored, Iignored the 3rd rotation, and kept all the ellipses "horizontal".
Given initial dimensions a and b, the transformations for flat thin disks would be
(1) Rotate on a axis by angle
�
θa
�
′ b = b ⋅cosθa
(2) Rotate on b axis by angle
�
θb
�
′ a = a ⋅cosθb
To account for the disks being ellipsoid, not flat and infinitely thin, I rewrote the terms of
the corrected Hubble formula
�
cos2θ =ratio2 − q02
1− q02 as
�
ratio = cos2θ(1− q02) + q02
Equation 3
So the complete set of transformations to rotate the ellipsoid in space became:
(1) Rotate on a axis by angle
�
θa(shortening b axis, preserving a axis)
�
′ a = a
�
′ b = b ⋅ cos2θa (1− q02) + q02
(2) Rotate on b axis by angle
�
θb(shortening a axis, preserving new baxis)
�
′ ′ a = ′ a ⋅ cos2θb (1− q02) + q02
Page 10 of 29
axis)
�
′ ′ b = ′ b
To test the hypothesis H1 that observations are consistent with elliptical disks randomlyoriented in space, I generated 3000 ellipses with a uniformly random major axis between1 and 10, and with a specified average ellipticity (e.g. 0.15) and some variation ofellipticity around this mean. Each was randomly assigned a Hubble morphological type,with the Hubble types distributed in the same percentages as was found in the PGC data.Using the Nedyalkov q0 corrections based on Hubble type, the ellipsoids were rotated inspace by two random angles, using the transformations above, generating apparent majorand minor axis lengths. Finally, I plugged these axes into the same analysis used earlierfor the measured and catalogue data. Figure 27 (pg. 26) shows a sample of the rotationcalculations, and Figure 28 shows a sample of the calculated inclinations, for thesesimulated galaxies.
I repeated this test with several ellipticities, as follows. (The plus-minus ellipticityvariances were arbitrary, except for the figure associated with Ryden. Others were chosento be about half the ellipticity.)
Ellipticity Ellip +/1 Reference Figure Comments
0.05 0.02 Figure 29
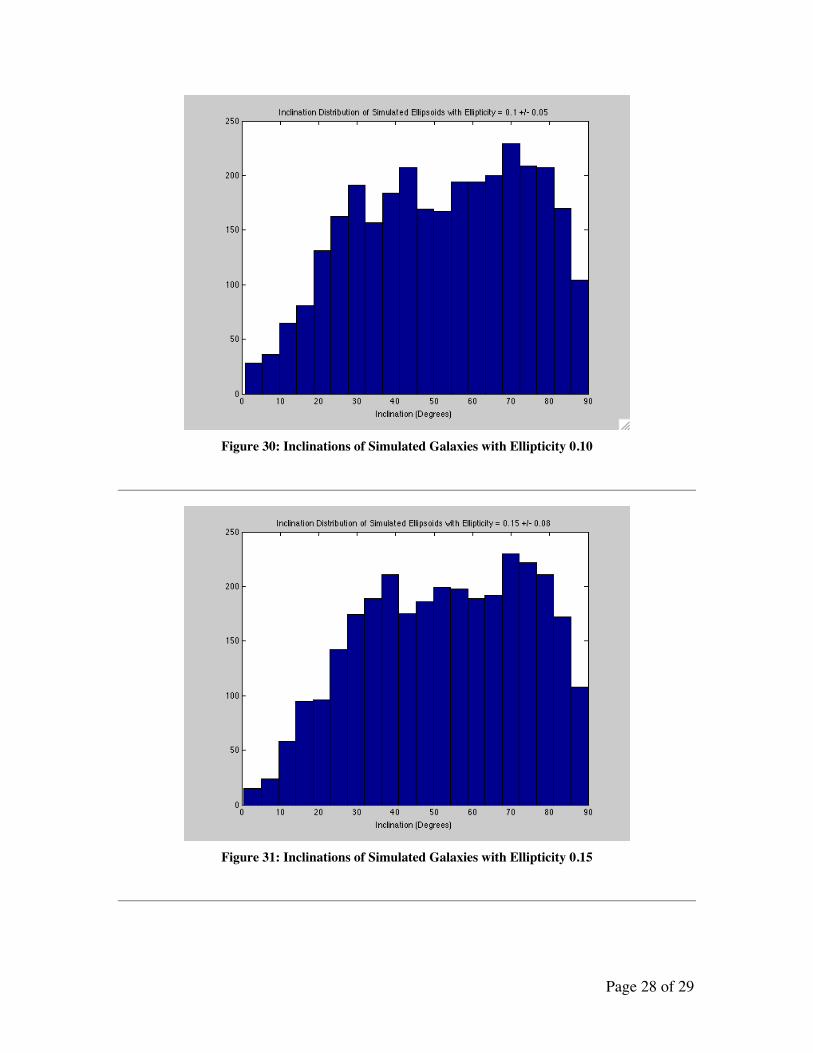
0.1 0.05 Andersen Figure 30
0.15 0.08 Ryden Figure 31
0.20 0.1 Figure 32
0.25 0.12 Figure 33
Table 1: Simulations with Various Ellipticities
Visually inspecting the distributions in these figures, it is evident that they follow thesame general shape as the distribution for the Haynes- and Nedyalkov- correctedinclinations in the large PGC sample (Figure 22, Figure 23). However, the fit is not exact– the simulated data have higher distributions at inclinations of 20 to 40 degrees than thereal data. A Kolmogorov-Smirnov test confirms what is visually evident: the real andsimulated data, while similar, are not from the same sample distribution: a two-sampleKS test of the visually closest, the Nedyalkov-corrected real data (Figure 23, pg. 24) andthe ellipticity 0.15 simulation (Figure 31, pg. 28) give a KS p-value near 0, and a KS teststatistic of 0.17 at 5% significance.
Conclusions
I conclude, based on my own measured samples and on analysis of catalogue data, thatspiral galaxies appear, to first approximation, to be round disks randomly inclined to theobserver. Minor variances in the two samples, however, prevents a numerical match ofstatistical significance. Intuitively, over-abundance or scarcity of ellipses at the extremes
Page 11 of 29
(face-on and edge-on) might be evidence in favour of the prevailing "slightly elliptical"hypothesis.
At a more sophisticated level, a literature search shows that most researchers feel thatspiral galaxies are not generally round, but exhibit a mild ellipticity. The degree ofellipticity is still uncertain, but values around 0.1 or 0.2 seem likely.
I attempted to reconcile the "elliptical disk" hypothesis with my calculated data bycomparing the distribution to the distribution of a simulated universe containingrandomly inclined disks with the hypothesised ellipticities. Again, while the visualdisplay of these results suggests a general agreement, a detailed statistical analysis rejectsthe two distributions as being equivalent. I attribute this failure to errors in mysimulation, since my method for generating elliptical ellipsoids and rotating them inspace was crude, and I believe that a more capable simulation would find the elliptical-disk theory to be compatible with these observed data.
Page 12 of 29
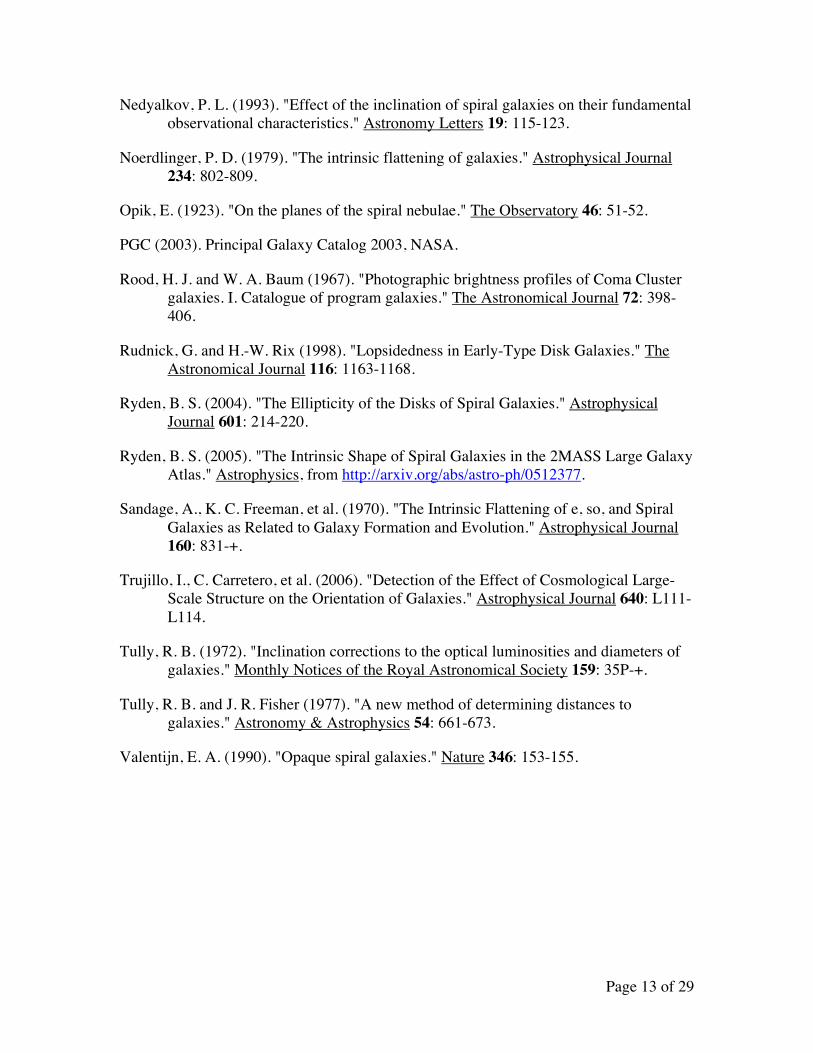
References
Aaronson, M., J. Huchra, et al. (1979). "The infrared luminosity/H I velocity-widthrelation and its application to the distance scale." Astrophysical Journal 229: 1-13.
Aaronson, M., J. Mould, et al. (1980). "A distance scale from the infrared magnitude/H Ivelocity-width relation. I - The calibration." Astrophysical Journal 237: 655-665.
Andersen, D. R., M. A. Bershady, et al. (2001). "A Measurement of Disk Ellipticity inNearby Spiral Galaxies." Astrophysical Journal 551: L131-L134.
Barnes, E. I. and J. A. Sellwood (2003). "Uncertainties in Spiral Galaxy ProjectionParameters." The Astronomical Journal 125: 1164-1176.
Binney, J. and G. de Vaucouleurs (1981). "The apparent and true ellipticities of galaxiesof different Hubble types in the Second Reference Catalogue." Monthly Noticesof the Royal Astronomical Society 194: 679-691.
Burstein, D., M. P. Haynes, et al. (1991). "Dependence of Galaxy Properties on ViewingAngle." Nature 353(6344): 515-521.
Disney, M. (1990). "Are Spiral Galaxies Opaque?" Nature 346(6280): 105-106.
Erdmann, B. (undated). The NGC/IC Project: Historically Corrected Catalogue Data for,and DSS Images of, NGC/IC Objects.
Eshbach, O. W. (1936). Handbook of Engineering Fundamentals. New York, John Wiley& Sons.
Haynes, M. P. and R. Giovanelli (1984). "Neutral hydrogen in isolated galaxies. IV -Results for the Arecibo sample." The Astronomical Journal 89: 758-800.
Hubble, E. P. (1926). "Extragalactic Nebulae." Astrophysical Journal 64: 321-369.
Huizinga, J. E. and T. S. v. Albada (1992). "Extinction in SC galaxies - an analysis of theESO-LV data." Monthly Notices of the Royal Astronomical Society 254: 677-685.
Lambas, D. G., S. J. Maddox, et al. (1992). "On the true shapes of galaxies." MonthlyNotices of the Royal Astronomical Society 258: 404-414.
Lucy, L. B. (1974). "An iterative technique for the rectification of observeddistributions." The Astronomical Journal 79: 745-+.
Ma, J., G. Song, et al. (2000). "Dependence of Spiral Galaxy Distribution on ViewingAngle in RC3." ArXiv Astrophysics e-prints.
Page 13 of 29
Nedyalkov, P. L. (1993). "Effect of the inclination of spiral galaxies on their fundamentalobservational characteristics." Astronomy Letters 19: 115-123.
Noerdlinger, P. D. (1979). "The intrinsic flattening of galaxies." Astrophysical Journal234: 802-809.
Opik, E. (1923). "On the planes of the spiral nebulae." The Observatory 46: 51-52.
PGC (2003). Principal Galaxy Catalog 2003, NASA.
Rood, H. J. and W. A. Baum (1967). "Photographic brightness profiles of Coma Clustergalaxies. I. Catalogue of program galaxies." The Astronomical Journal 72: 398-406.
Rudnick, G. and H.-W. Rix (1998). "Lopsidedness in Early-Type Disk Galaxies." TheAstronomical Journal 116: 1163-1168.
Ryden, B. S. (2004). "The Ellipticity of the Disks of Spiral Galaxies." AstrophysicalJournal 601: 214-220.
Ryden, B. S. (2005). "The Intrinsic Shape of Spiral Galaxies in the 2MASS Large GalaxyAtlas." Astrophysics, from http://arxiv.org/abs/astro-ph/0512377.
Sandage, A., K. C. Freeman, et al. (1970). "The Intrinsic Flattening of e, so, and SpiralGalaxies as Related to Galaxy Formation and Evolution." Astrophysical Journal160: 831-+.
Trujillo, I., C. Carretero, et al. (2006). "Detection of the Effect of Cosmological Large-Scale Structure on the Orientation of Galaxies." Astrophysical Journal 640: L111-L114.
Tully, R. B. (1972). "Inclination corrections to the optical luminosities and diameters ofgalaxies." Monthly Notices of the Royal Astronomical Society 159: 35P-+.
Tully, R. B. and J. R. Fisher (1977). "A new method of determining distances togalaxies." Astronomy & Astrophysics 54: 661-673.
Valentijn, E. A. (1990). "Opaque spiral galaxies." Nature 346: 153-155.