Are They Paying Attention? A Model-Based Method to Identify Individuals’ Mental StatesTongda Zhang, Renate Fruchter, and Maria Frank, Stanford University
In a global economy, online meeting participants often have
different backgrounds, making it difficult to know their mental
and physical states. The Mental Motion State Model, trained by
applying the Gaussian mixture model to electroencephalogram
data, can indicate degrees of engagement and fatigue
levels, providing a feedback channel for self-regulation.
Projects in an increasingly complex distributed work environment with 24/7 schedules often require online meetings that cross time zones, cultures, disciplines, technologies, and task-
execution styles.1 During these meetings, participants are often unaware of others’ engagement and fatigue levels and frequently power through the event without realizing that people might be tuning out or working on something else. One way to address this inefficiency is
to implement a feedback channel that makes all the par-ticipants’ emotional, mental, and physical states trans-parent. As the meeting progresses, participants can self- regulate to adjust the meeting’s flow and pace.2
Although this idea might seem a distant reality, recent studies have shown that integrating bioelectrical signals with cognition and behavioral understanding opens opportunities to infer people’s emotions and men-tal and physical states.3 Commercial sensor technolo-gies already detect and monitor a range of bioelectrical signals, such as electrocardiography (ECG), electroen-cephalography (EEG), Galvanic skin response (GSR), and heart-rate variability (HRV). Researchers have explored how to use EEG band frequencies or the ratios between
See www.computer.org/computer-multimedia for multimedia content related to this article.
M A R C H 2 0 1 7 41
them to detect and measure attention, meditation, alertness, and mental workload,3−6 typically through con-trolled experiments that demonstrate how these EEG signals can be used to measure people’s cognitive states and task engagement.3
However, detecting and labeling mental states is difficult, even when using manual labeling and video cod-ing, as most mental states are not directly observable. That is, it can be obvious what people are doing, but much harder to gauge what they are thinking or their cognitive workload. Moreover, labeled datasets of mental states are in short supply, so most stud-ies use direct measures or basic statisti-cal values, such as the mean or median of an EEG band’s power spectral density (PSD). To explore relative mental states, most studies compare PSD values in dif-ferent activities session by session.
As part of ongoing efforts to val-idate the idea that EEG bands can be used to indicate mental workload, we conducted a study that became the basis for developing the Mental Motion State Model (MMSM). The model uses a novel unsupervised learning algo-rithm6 based on the Gaussian mixture model to capture the transitions, or motions, between mental states. Rela-tive to raw EEG signals, these transi-tions provide a more meaningful way to distinguish engagement during project activities.
To evaluate the model, we collected two EEG datasets from participants in a graduate-level global teamwork course at Stanford University involv-ing partners worldwide.1 One dataset consisted of unlabeled EEG signals collected during two-hour weekly project meetings; the other consisted of signals labeled with five activities considered typical in most projects:
work, listen, collaborate, multitask, and relax. These activities are based on two decades of global teamwork studies in the Project-Based Learn-ing Laboratory at Stanford.1 We then trained the MMSM by applying our learning algorithm to the unlabeled data and validated the trained model using the labeled dataset. Finally, as an illustration of the model’s effective-ness, we combined the trained MMSM and EEG data from a randomly cho-sen individual and demonstrated the feasibility of discovering the subject’s different mental states and the transi-tions between them.
We view the MMSM as a first step toward interpreting mental states from EEG data. It can become the basis for a mechanism that will accurately measure participants’ engagement and fatigue levels during communication, such as online meetings, which partic-ipants can use as feedback to help them better manage the event.
EEG DATAWe collected EEG data from 10 male and 10 female graduate students tak-ing a global teamwork course at Stan-ford.1 For data collection, each student wore a Neurosky Mindwave headset, which has a dry sensor system that provides the PSD value of each EEG band directly.7,8 The wearable head-sets, which are used in many con-sumer applications of EEG technology, did not change the way the students participated in theiractivities.
Data collectionWe collected unlabeled recordings from the students during their weekly two-hour online project team meetings, which took place over four regions with different time zones: Central Europe, Caribbean, Midwest US, and West Coast
US. The projects lasted four months, giving us recordings for an extended period. For the labeled dataset, we asked students to participate in the five activities during a controlled setting in which we asked them to focus on each of the five activities for 10 minutes at a time, with the aim of emulating project teamwork tasks.1 The five activities had specific requirements:
› Work. Participants worked on a homework assignment with directives such as type, model, sketch, diagram, or data search.
› Listen. Participants selected and listened to a TED talk from a given list.
› Multitask. Every two minutes, participants had to switch per-forming multiple tasks simul-taneously, such as listening to a TED talk, checking email, taking calls, interacting with Facebook friends, or conducting some other chosen activity.
› Collaborate. Groups of three par-ticipants each were part of a col-laborative exercise in which they used a web-conferencing tool to share a sketching application. To keep all participants constantly engaged, a signal was given every few seconds, at which time the participant controlling the digital pen had to give it to the next person in the group to add to the sketch.
› Relax. Participants were asked to find a comfortable position, close their eyes, and listen to a guided meditation designed to bring them to a relaxed state.
For the labeled EEG recordings, we used a coding schema that represented the five activities.
See www.computer.org/computer-multimedia for multimedia content related to this article.
42 C O M P U T E R W W W . C O M P U T E R . O R G / C O M P U T E R
QUALITY-OF-LIFE TECHNOLOGIES
Dataset characteristicsWe processed and cleaned the arti-facts of labeled and unlabeled EEG recordings for the 20 participants and discarded any incomplete data-sets. We ended up with complete datasets of labeled and unlabeled records for 13 participants: 7 male and 6 female. In total, we had 2 mil-lion second-by-second EEG unlabeled records (approximately 60 hours) from the weekly project meetings and more than 50,000 second-by-second labeled EEG records (approximately 14 hours).
The EEG data includes the PSD val-ues of the classically defined EEG band frequencies—delta, theta, alpha, beta, and gamma—collected continuously for 1-second intervals. Each line in the EEG record includes a time stamp and eight EEG PSDs: delta, theta, low-alpha, high-alpha, low-beta, high-beta, low-gamma, and mid-gamma. The PSD val-ues have no units; they are meaningful
only as quantities relative to each other and themselves.
Table 1 shows the basic statistical values we calculated including the mean value and the median value of the PSD time series in terms of the EEG band frequencies: delta, theta, alpha, beta, and gamma (δ, θ, α, β, and γ).
Data interpretationAlthough studies exploring the cor-relation of mental states with EEG bands differ in how they define EEG bands’ boundaries, they are generally consistent in how they assign hertz to mental state. For example, delta (0.1 Hz to approximately 3 Hz) rep-resents deep sleep that is not rapid eye movement (REM) sleep; theta (4 Hz to approximately 7 Hz) represents creative, recall, imagery, and switch-ing thoughts; alpha (8 Hz to approxi-mately 12 Hz) represents a relaxed but not drowsy state; and gamma (30 Hz
to approximately 100 Hz) represents higher mental activity, thinking, and an integrated thought process.
Relax activity. We found that statisti-cal values for the relax activity differed from those for all the other activities in that it was characterized by a low value in the delta, theta, beta, and gamma bands and a high value in the alpha band. Unlike the other four activities, relax requires participants to remain in a mental state with the highest relaxation and lowest attention levels. The other four activities have less dis-tinguishable characteristics.
Mental workload. Mental workload is of particular interest because it is a measure of the cognitive processing level, which relates to thinking, inter-acting, and other activities during a meeting. Research has shown that EEG signal oscillations from the frontal
TABLE 1. Power spectral density (PSD) values for five electroencephalography (EEG) bands across five activities in our study.
PSD value Work Listen Multitask Collaborate Relax
mean(δ) 406,024 405,066 376,958 554,594 218,457
median(δ) 132,525 120,316 122,405 287,753 30,336
mean(θ) 99,278 97,819 101,539 130,228 67,092
median(θ) 39,308 36,690 40,799 54,449 23,388
mean(α) 54,757 45,097 53,149 63,932 59,311
median(α) 26,367 23,449 26,493 31,533 41,037
mean(β) 37,429 29,028 38,761 51,105 25,010
median(β) 21,109 18,541 22,060 25,836 17,450
mean(γ) 19,600 14,555 252,711 31,733 10,108
median(γ) 10,649 9,489 126,605 18,354 6,251
M A R C H 2 0 1 7 43
theta and lateral gamma are strongly correlated to mental workload.3,9−11 For that reason, we further investi-gated the role of theta and gamma EEG bands in indicating mental workload.
Figure 1 illustrates the changes in PSD of the theta and gamma bands over time for two randomly chosen participants during both work and relax activities.
Results were similar for the listen, multitask, and collaborate activities, during which mental workload also did not remain consistently high. The implication is that when participants worked, they seemed to interleave heavy mental workload states with a lighter “recovery” state. This finding—that people tend to alternate between several mental workload states with different mental workload levels—motivated us to develop the MMSM.
CAPTURING MENTAL STATE TRANSITIONSWe created the MMSM because analyz-ing raw EEG signals, as we did in Fig-ure 1, does not sufficiently distinguish
activities. The MMSM, in contrast, captures the transitions between men-tal states, each of which has a different mental workload.
The model’s underlying assump-tion is that an individual’s mental state defines the observed EEG sig-nal. A mental motion state (MMS) is a stable level of cognitive and think-ing intensity. As Figure 2 shows, the MMSM has three layers: MMS, distri-bution, and observation.6
The MMS layer is a time-indexed MMS sequence {s1, s2, … , st, …}, where si ∈ {possible MMSs} and i = 1, 2, …, t, … is the time index. For each MMS si, we assume there is a corresponding Gaussian distribution
N (µsi,σsi2 )
that generates the actual EEG signal θi we observed. Given the MMS sequence {s1, s2, … , st, …} in the MMS layer, the distribution layer is the corresponding
PSD
valu
e (x
105 )
00
0.5
1
2
2.5
1.5
50 100 150 200 250Time (s)
300 350 400 450 500
Participant 0 (theta)
Participant 2 (theta)
0
1
2
3
4
5
6
7
PSD
valu
e (x
104 )
0 50 100 150 200 250
Time (s)
300 350 400 450 500
00
1
2
3
4
5
6
PSD
valu
e (x
105 )
50 100 150 200 250Time (s)
300 350 400 450 500
Participant 0 (gamma)
Participant 2 (gamma)
0
1
2
3
4
5
6
PSD
valu
e (x
105 )
0 50 100 150 200 250
Time (s)
300 350 400 450 500
FIGURE 1. Power spectral density (PSD) values in the theta and gamma electroencephalography (EEG) bands for two randomly selected participants, which indicate mental workload. The values are taken for 500 seconds during the work (blue lines) and relax (red lines) activities. The curves show much higher values during the work activity, although the oscillation curves are slightly different for each participant, indicating that mental workload fluctuates during work activity.
MMSs
Distribution
Observation
N (μS1,σ2
S1) N (μS2
,σ2S2) N (μSt
,σ2St)
S1
θ1 θ2 θt
S2 St
FIGURE 2. Layers in the Mental Motion State Model (MMSM). The top layer is a time- indexed series of possible mental motion states (MMSs); the distribution layer describes the distribution the lower layer followed; and the observation layer is a sample EEG signal sequence generated from the distributions in the middle layer.
44 C O M P U T E R W W W . C O M P U T E R . O R G / C O M P U T E R
QUALITY-OF-LIFE TECHNOLOGIES
time-indexed EEG signal distribution sequence
{N (µs1,σs12 ),N (µs2
,σs22 ),…,N (µst
,σst2 ),…}.
The observation layer is an EEG signal sample sequence generated from the corresponding distributions in the dis-tribution layer. The signals are those obtained through the Mindwave head-set. For simplicity, we considered the observed second-by-second PSD value of each EEG signal band as a 1D data stream, so the corresponding distribu-tions are 1D Gaussian distributions. For the 2D case, Gaussian distributions are 2D distributions—the MMSM is essen-tially modeling the process in which a person constantly switches between different MMSs.
Learning algorithmAccording to our MMSM definition, the parameters that can describe a MMSM are
{K ,N (µ1,σ12),N (µ2,σ2
2),…,N (µK ,σK2 )},
where K is the number of all pos-sible MMSs that people have and {N (µ1,σ1
2),N (µ2,σ22),…,N (µK ,σK
2 )} is the set of means and variances of the K cor-responding distributions for each MMS.
Initially, the only available data is the observed EEG signals time se-quence {θ1, θ2, …, θt, …}, which is cap-tured in the MMSM’s observation layer. To train the
{K ,N (µ1,σ12),N (µ2,σ2
2),…,N (µK ,σK2 )}
mo del parameter, we used a learning algorithm based on the Gaussian mix-ture model.
We assume that the MMSM parameters
{K ,N (µ1,σ12),N (µ2,σ2
2),…,N (µK ,σK2 )}
are already known and that the MMSM’s sampling processes gener-ate EEG signals from a certain distri-bution at different time points that are independent from each other. Given observed EEG data θt at time point t, the probability calculated by
the Gaussian mixture model for data point θt can be expressed as
P (θt ) = λkk =1
K∑ ⋅ P (θt | state = k)
= λkk =1
K∑ ⋅N (θt | µk ,σk )
= λkk =1
K∑ ⋅ 1
2πσkexp −
(θt − µk )2
2σk2
⎛
⎝⎜⎜
⎞
⎠⎟⎟
(1),
where λk is the prior probability of the kth MMS, and μk and σt
2 are the mean and variance of the distribution of the kth MMS.
Assuming n EEG signal points {θ1, θ2, …, θn}, we used maximum- likelihood estimation to estimate the model’s parameter set
χ = {(µ1,σ12),(µ2,σ2
2),…,(µk ,σk2 )}.
The objective function is
maxχ
log P (θt )( )t =1
n∑ ,
where the Gaussian mixture model’s P(θt) is given by Equation 1. The com-plete expression for the log- likelihood function is
maxχ
log λk ⋅ 1
2πσkexp −
(θt − µk )2
2σk2
⎛
⎝⎜⎜
⎞
⎠⎟⎟k =1
K∑
⎛
⎝
⎜⎜
⎞
⎠
⎟⎟t =1
n∑
(2).
We used the expectation maximi-zation (EM) technique to find the esti-mated parameters x of the optimi-zation problem in Equation 2. EM is an iterative process that goes through each expectation step (E-step) and max-imization step (M-step) repetitively.12 The E-step uses the current estimated mean and variance parameters to esti-mate the probability that each data
Cost
fact
or (×
104 )
No. of MMSs
03.90
3.95
4.00
4.05
4.10
4.15
4.20
1 2 3 4 5 6 7 8 9 10 11 12 13 14
FIGURE 3. Determining model fit. Cost value drops dramatically at the beginning but remains almost unchanged after six MMSs. Although a model with more MMSs has a lower cost and thus a better fit with the data, more MMSs can mean a less understand-able model.
M A R C H 2 0 1 7 45
point belongs to each MMS. The M-step updates the mean and variance of each MMS’s distribution on the basis of probabilities calculated in the E-step. The EM learning process for n observed data points {θ1, θ2, …, θn} and K number of MMSs can be expressed as E-step:
ϖtk =
λk ⋅ 12πσk
exp −(θt − µk )
2
2σk2
⎛
⎝⎜⎜
⎞
⎠⎟⎟
λ j ⋅12πσ j
exp −(θt − µ j )
2
2σ j2
⎛
⎝
⎜⎜
⎞
⎠
⎟⎟j =1
K∑
(3).
M-step:
ξk = t =1n∑ ϖtk
µk = 1ξk
t =1n∑ ϖtkθt
σk2 = 1
ξkt =1n∑ ϖtk (θt − µk )
2
λk = 1n t =1
n∑ ϖtk (4),
where ϖtk (t=1, 2, …, n; k = 1, 2, …, K) is the estimated probability that data point θt belongs to kth MMS; ξk (k = 1, 2, …, K) is the normalization term for the kth MMS.
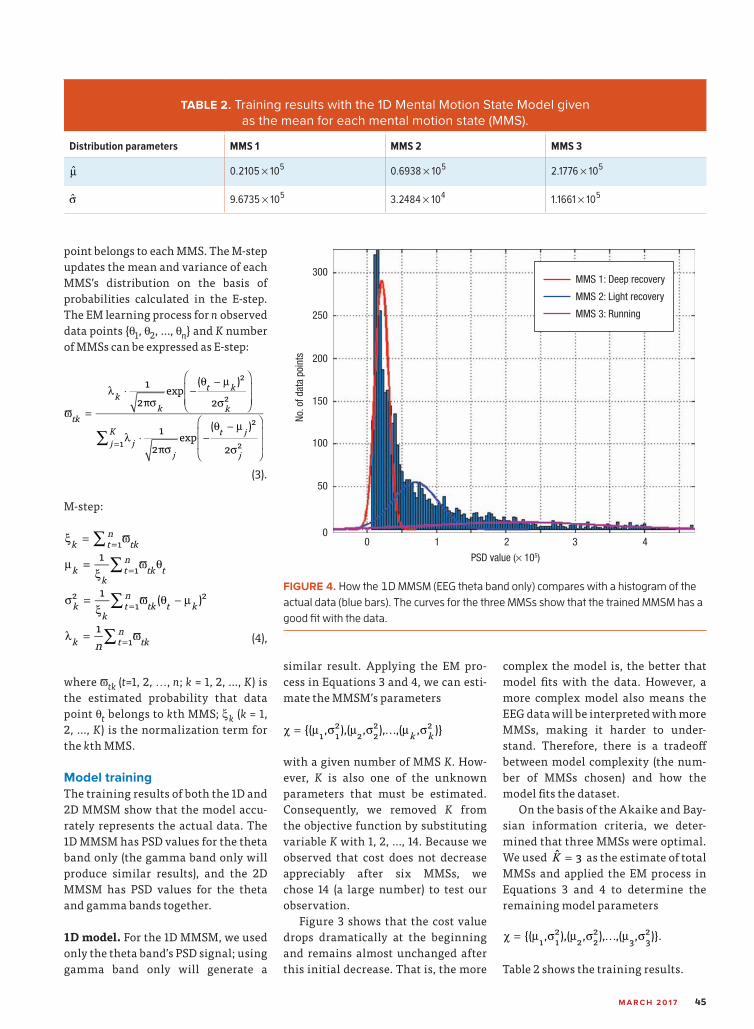
Model trainingThe training results of both the 1D and 2D MMSM show that the model accu-rately represents the actual data. The 1D MMSM has PSD values for the theta band only (the gamma band only will produce similar results), and the 2D MMSM has PSD values for the theta and gamma bands together.
1D model. For the 1D MMSM, we used only the theta band’s PSD signal; using gamma band only will generate a
similar result. Applying the EM pro-cess in Equations 3 and 4, we can esti-mate the MMSM’s parameters
χ = {(µ1,σ12),(µ2,σ2
2),…,(µk ,σk2 )}
with a given number of MMS K. How-ever, K is also one of the unknown parameters that must be estimated. Consequently, we removed K from the objective function by substituting variable K with 1, 2, …, 14. Because we observed that cost does not decrease appreciably after six MMSs, we chose 14 (a large number) to test our observation.
Figure 3 shows that the cost value drops dramatically at the beginning and remains almost unchanged after this initial decrease. That is, the more
complex the model is, the better that model fits with the data. However, a more complex model also means the EEG data will be interpreted with more MMSs, making it harder to under-stand. Therefore, there is a tradeoff between model complexity (the num-ber of MMSs chosen) and how the model fits the dataset.
On the basis of the Akaike and Bay-sian information criteria, we deter-mined that three MMSs were optimal. We used K = 3 as the estimate of total MMSs and applied the EM process in Equations 3 and 4 to determine the remaining model parameters
χ = {(µ1,σ12),(µ2,σ2
2),…,(µ3,σ32)}.
Table 2 shows the training results.
TABLE 2. Training results with the 1D Mental Motion State Model given as the mean for each mental motion state (MMS).
Distribution parameters MMS 1 MMS 2 MMS 3
µ 0.2105 × 10⁵ 0.6938 × 10⁵ 2.1776 × 10⁵
σ 9.6735 × 10⁵ 3.2484 × 10⁴ 1.1661 × 10⁵
0 1 2 3 4
PSD value (× 105)
No. o
f dat
a po
ints
0
50
100
150
200
250
300MMS 1: Deep recovery
MMS 2: Light recovery
MMS 3: Running
FIGURE 4. How the 1D MMSM (EEG theta band only) compares with a histogram of the actual data (blue bars). The curves for the three MMSs show that the trained MMSM has a good fit with the data.
46 C O M P U T E R W W W . C O M P U T E R . O R G / C O M P U T E R
QUALITY-OF-LIFE TECHNOLOGIES
Because the mean value of each MMS’s distribution reflects the indi-vidual’s average mental workload, we labeled the three MMSs in terms of workload using a running analogy:
› Deep recovery (MMS 1) has a relatively low mental workload; participants are assumed to be relaxing.
› Light recovery (MMS 2) has a medium mental workload. Participants are assumed to be generally thinking, processing information, or conducting sim-ple tasks.
› Running (MMS 3) has a heavy mental workload. Participants are assumed to be conducting a diffi-cult or high-level cognitive task.
Figure 4 shows how the trained 1D MMSM fits with the actual dataset—the histogram of PSD signals in the theta band. Consequently, the training result is satisfactory.
2D model. We used a similar training process for the 2D MMSM, in which the observation layer includes the PSD signals of both the theta and gamma bands from the work and relax activi-ties. The model parameter set becomes {K, (μ1, Σ1), (μ2, Σ2), …, (μK, ΣK)}, where
µi(θ),µi
(γ)( ) i = 1,2,!,K( )
is the mean vector (theta and gamma bands) of the ith MMS; and Σi (i = 1, 2, …, K) is the covariance matrix of the corresponding 2D MMSM’s Gaussian distribution. As in the 1D MMSM (see Figure 3), the 2D MMSM curve of cost versus number of MMSs has a dra-matic drop in cost at the beginning and remains almost unchanged after the initial decrease. Similarly, after applying the Akaike or Bayesian infor-mation criterion, we identified K = 3 as the optimal number of estimated MMSs, and we calculated the remain-ing parameters {(μ1, Σ1), (μ2, Σ2), (μ3, Σ3)}. Table 3 shows the training results.
Figure 5 shows the comparison of a 2D scatter plot of PSD values from both theta and gamma bands with the trained 2D MMSM. Like the 1D MMSM, the 2D MMSM fits well with the actual data.
Sample applicationTo illustrate the MMSM’s effective-ness, we randomly chose a participant
TABLE 3. Results of 2D MMSM training.
Distribution parameters MMS 1 MMS 2 MMS 3
µ(θ) 0.2609 × 10⁵ 0.6708 × 10⁵ 2.1776 × 10⁵
µ(γ ) 0.6665 × 10⁴ 1.4801 × 10⁴ 3.6212 × 10⁴
S 1.383 −0.098−0.098 0.082
⎡
⎣⎢
⎤
⎦⎥ × 108 1.221 0.017
0.017 0.049
⎡
⎣⎢
⎤
⎦⎥ × 109 1.414 0.145
0.145 0.074
⎡
⎣⎢
⎤
⎦⎥ × 1010
00
1
2
3
4
5
6
7
8
Work
Relax
0.5 1 1.5 2 2.5 3 3.5 4
PSD values for theta band (× 105)
PSD
val
ues
for
gam
ma
band
(×
104 )
FIGURE 5. How the 2D MMSM fits with a 2D scatter plot of PSD values (for gamma and theta in the work and relax activities). The three MMSs (spirals) fit well with the data. MMS 1 (blue spiral) is the deep recovery state, which fits with the concentration of relaxation data points. MMS 2 (black spiral) is the light recovery state and fits data that shows a transition (mix of work and relax data points) from relaxation to heavy work in MMS 3 (orange spiral), which is the running state.
M A R C H 2 0 1 7 47
from the activity-labeled data and translated the corresponding EEG raw data collected from the five activities into five MMS transition sequences. Figure 6 shows the three MMSs and the second-by-second state transitions of the five activities.
Visualizing the EEG data as MMS transitions provides insights into when individuals were in a state char-acterized by relaxation or deep think-ing. Predictably, in the relax activity, the participant spent more time in deep recovery, relative to the other four activities. But for the work, multi-task, and collaborate activities, Figure 6 reveals interesting mental patterns. For example, the work activity was focused on familiar homework tasks, so the participant entered the running state only sporadically. In multitask-ing, however, the participant must exert more cognitive effort to organize tasks, which the MMSM analysis and visualization support: the multitask activity is characterized by initially large running segments that likely reflect the cognitive overload in pro-cessing significant amounts of diverse information feeds.
In the collaborate activity, the MMSM analysis shows that the par-ticipant sporadically interleaved the three MMSs, following the cog-nitively demanding running state with microrecovery moments. This behavior is desirable because it incorporates the mental recovery that keeps thinking processes sharp for longer periods.
However, the interleaving of the three MMSs was not the result of explicit and systematic participant behavior, which we believe can lead to higher task performance. As a next step, we plan to further investigate the MMSM data analysis results with
the meeting recordings to look for a correlation between MMSs interleav-ing and task performance. Such a cor-relation would let us formalize rec-ommendations for increasing global learners’ and knowledge workers’ performance.
Model validationTo validate the MMSM, we used the labeled EEG dataset as the ground-truth test set and the unlabeled data as the training set. Our validation results showed that the three MMSs we defined (deep recovery, light recovery, and running) are consistent with both the activity labels in the ground-truth test set and our obser-vations during data collection. For example, relax data represents data captured while participants were in deep recovery, and work data was collected while participants were working and processing informa-tion—that is, when they were switch-ing between the light recovery and running states. An example is docu-ment editing, in which people tend to think for a bit, type for a bit, and then resume thinking; they do not type constantly.6
Therefore, if our assumption is right, we should be able to identify the
deep recovery MMS only in the data labeled “relax” and the light recov-ery and running MMSs in the data labeled “work.” To determine if this was the case, we used the learning algorithm to train a 1D MMSM from the relax data (with one MMS) and from the work data (with two MMSs). The results of the two training models gave us the same three MMSs: deep recovery, light recovery, and run-ning. Thus, the model trained on the unlabeled dataset is consistent with the actual activity labeling (relax and work), verifying that it is useful in improving the degree of distinction among activities.
We also used Weitzman’s overlap-ping coefficient—widely regarded as the measure of distributions’ agree-ment or similarity—to compare each pair of the three distribution parame-ter sets (the three MMSs). Our results showed that the overlapping coeffi-cients of the distributions of the three mental states learned from the test set and the training set are 0.721, 0.944, and 0.993. They are all higher than 0.7, which indicates that results were highly consistent.
Finally, considering the label of the five activities as ground truth, we used the degree of distinction
FIGURE 6. Interpreting activity transition states. Visualizing data in terms of transition states reveals interesting mental patterns. For example, this participant spent more time in the deep recovery state during the relax activity than in any of the other four activities and had a surprising amount of light recovery time during the work activity.
48 C O M P U T E R W W W . C O M P U T E R . O R G / C O M P U T E R
QUALITY-OF-LIFE TECHNOLOGIES
as a metric to compare the MMSM with the raw mental workload indi-cator signals on the ability to distin-guish those five different activities. Our results show that the proposed MMSM can greatly increase the degree of distinction between activ-ities compared to approaches using only raw EEG mental workload indi-cators such as the theta and gamma PSD values. This result shows that the MMSM can reveal more details about participants’ activities relative to using the predefined EEG frequency bands directly.6
Globalization has affected the way people collaborate in cor-porate and academic projects,
which greatly influences the quality of online meetings. Understanding meet-ing participants’ mental and physi-cal states helps build an awareness of engagement style and fatigue level and can lead to self-regulated meetings.
Fluctuations of the theta and gamma bands hinder the understand-ing and interpretation of individuals’ mental activities when using raw EEG signals. The MMSM describes these fluctuations in a more meaningful
way as transitions between MMSs, allowing greater distinction among activities than is possible with just EEG indicators, such as the PSD values of EEG theta and gamma bands. The MMSM’s unique learning algorithm provides detailed information about mental processes for individuals to self- regulate their degree of engage-ment, activity pace, and workload balance. This regulation could lead to better task performance and a higher overall quality of life.
The MMSM can serve as the foun-dation for interesting research, such as integrating additional EEG bands as other mental property indicators and automating the activity-labeling algo-rithm. As a next step, we plan to inte-grate MMSM data analysis results with other sensor data analysis indicators such as heart rate and body motion. We also plan to use the MMSM as an inter-mediate signal-processing level with state transitions becoming part of the data for analyzing higher-level mental processes, such as problem solving, cost benefit analysis, negotiation, conflict resolution, and decision making.
ACKNOWLEDGMENTSThis study was sponsored by the NSF under grant 1265953. Any opinions, find-ings, conclusions, or recommendations expressed in this material are those of the authors and do not necessarily reflect the views of the NSF.
REFERENCES1. R. Fruchter and R. Courtier, “Build-
ing Common Ground in Global Team-work through Re-representation,” Int’l J. AI & Society, vol. 26, no. 3, 2011, pp. 233−245.
ABOUT THE AUTHORS
TONGDA ZHANG is cofounder of WestMatrix Inc., which focuses on AI in real estate, healthcare, and financial services. His research interests include data mining and applying machine learning to understand human behavior. Zhang received a PhD in electrical engineering from Stanford University, and was a student there while conducting the research reported in this article. He is a member of IEEE. Contact him at [email protected].
RENATE FRUCHTER is founding director of the Project Based Learning Labo-ratory (PBL Lab) at Stanford University. Her research interests include collab-oration technologies to support global teamwork in education and corporate settings; identifying cognitive demands of global learners and knowledge workers; team engagement, well-being, and knowledge-work productivity; and team dynamics. Fruchter received a PhD in AI application in earthquake design of high-rise buildings from the Technion–Israel Institute of Technology. She is a member of the American Society of Civil Engineers’ Technical Commit-tee on Computing and Information Technology (ASCE−TCCIT). Contact her at [email protected].
MARIA FRANK is a PhD student in civil and environmental engineering at Stan-ford University. Her research interests include the psychophysiological man-ifestations of global teamwork, distributed collaboration, and cross- cultural communication. Frank received an MS in construction, real estate, and infra-structure management from Bauhaus University. Contact her at mfrank0@ stanford.edu.
M A R C H 2 0 1 7 49
2. Q.G. Ma et al., “Mental Workload Analysis during the Production Pro-cess: EEG and GSR Activity,” Applied Mechanics and Materials, vol. 220, 2013, pp. 193−197.
3. C. Berka et al., “EEG Correlates of Task Engagement and Mental Work-load in Vigilance, Learning, and Memory Tasks,” Aviation, Space, and Environmental Medicine, vol. 78, supp. 1, 2007, pp. 231−244.
4. A. Pahor and N. Jausovec, “Theta- Gamma Cross-Frequency Coupling Relates to the Level of Human Intel-ligence,” Intelligence, vol. 46, 2014, pp. 283−290, 2014.
5. X.W. Wang, D. Nie, and B.L. Lu, “Emotional State Classification from EEG Data using Machine Learning Approach,” Neurocomputing, vol. 129, 2014, pp. 94−106.
6. T. Zhang, “Pattern Learning in Smart Homes and Offices using Motion Sensor and Mind Wave Data:
7. K. Crowley et al., “Evaluating a Brain−Computer Interface to Cate-gorize Human Emotional Response,” Proc. 10th IEEE Int’l Conf. Advanced Learning Technologies (ICALT 10), 2010, pp. 276−278.
8. “Brain Wave Signal (EEG) of Neuro Sky,” NeuroSky, 2009; www .frontiernerds.com/files/neurosky -vs-medical-eeg.pdf.
9. C. Berka et al., “Real-Time Analy-sis of EEG Indexes of Alertness, Cognition, and Memory Acquired with a Wireless EEG Headset,” Int’l J. Human−Computer Interaction, vol. 17, no. 2, 2004, pp. 151−170.
10. G.F. Wilson and C.A. Russell, “Real-Time Assessment of Mental Workload using Psychophysiologi-cal Measures and Artificial Neural
Networks,” Human Factors: J. Human Factors and Ergonomics Soc., vol. 45, no. 4, 2003, pp. 635−644.
11. G. Shou and L. Ding, “Frontal Theta EEG Dynamics in a Real-World Air Traffic Control Task,” Proc. IEEE 35th Int’l Eng. in Medicine and Biology Conf. (EMBC 13), 2013, pp. 5594−5597.
12. J.A. Bilmes, A Gentle Tutorial of the EM Algorithm and Its Application to Parameter Estimation for Gaussian Mixture and Hidden Markov Models, tech. report TR-97-021, Int’l CS Inst., UC Berkeley, 1998; melodi.ee .washington.edu/people/bilmes/my papers/em.pdf.
Read your subscriptions through the myCS publications portal at
http://mycs.computer.org
JULY/AUGUST 2016
www.computer.org/cloudc
omputing
MANUFACTURING
& THE CLOUD
Mobile Service Computing 32
Securing Cryptographic Keys 42
MARCH/APRIL 2016
www.computer.org/cloudcomputing
Security and Dependability of Cloud-Assisted Internet of ThingsLive Migration 12Capability-Oriented