Conference on Global Economic Crisis: Impacts, Transmission, and Recovery Paper Number 5 EWC / KDI Conference, Honolulu, Hawaii, 19–20 August 2010 Are We Really Between Scylla and Charybdis? Imbalances, Overheating, and the Recovery Menzie D. Chinn Professor, Department of Economics, University of Wisconsin, and NBER 1. Introduction In considering the prospects for the world economy, and what policy measures can mitigate the hindrances to resumption of sustainable growth, several questions remain unanswered First, how important was the global imbalance and/or global overheating in explaining the global crisis? Second, was the trade exposure the main channel through which the shock was propagated? Third, how important was domestic demand in Asia (particularly China) in protecting the global economy from collapsing more? Fourth, are the global imbalance and/or global overheating being corrected, or have they been sufficiently adjusted? Without tackling the sources of the financial crisis and the ensuing global “great recession,” one cannot fully determine the appropriate course of action, in terms of rebalancing the global economy so that we avoid a recurrence of unsustainably expanding current account balances, or falling into overheating or deflation. Hence, the first question is hardly academic, and indeed the answer is essential to answering the fourth question. Acknowledgments. I thank Jamus Jerome Lin for providing data, Yin-Wong Cheung, Eiji Fujii, and Hiro Ito, for allowing me to cite joint work.
Transcript
Conference on Global Economic Crisis: Impacts, Transmission, and Recovery
Paper Number 5
EWC / KDI Conference, Honolulu, Hawaii, 19–20 August 2010
Are We Really Between Scylla and Charybdis? Imbalances, Overheating, and the Recovery
Menzie D. Chinn
Professor, Department of Economics, University of Wisconsin, and NBER
1. Introduction
In considering the prospects for the world economy, and what policy measures can
mitigate the hindrances to resumption of sustainable growth, several questions remain
unanswered
First, how important was the global imbalance and/or global overheating in explaining
the global crisis?
Second, was the trade exposure the main channel through which the shock was
propagated?
Third, how important was domestic demand in Asia (particularly China) in protecting the
global economy from collapsing more?
Fourth, are the global imbalance and/or global overheating being corrected, or have they been
sufficiently adjusted?
Without tackling the sources of the financial crisis and the ensuing global “great
recession,” one cannot fully determine the appropriate course of action, in terms of rebalancing
the global economy so that we avoid a recurrence of unsustainably expanding current account
balances, or falling into overheating or deflation. Hence, the first question is hardly academic,
and indeed the answer is essential to answering the fourth question.
Acknowledgments. I thank Jamus Jerome Lin for providing data, Yin-Wong Cheung, Eiji Fujii, and Hiro Ito, for allowing me to cite joint work.
Menzie D. Chinn
EWC / KDI Conference, Honolulu, Hawaii, 19–20 August 2010
2
The global economic recovery will proceed in a manner that will be related to how the
initial negative shock was propagated. In particular, while trade links (the second question) were
a particularly visible means by which the reduction in aggregate demand was transmitted, I do
not think that was the only relevant channel. In particular, with respect to the other core
developed economy, the repricing of risk, as well as the freeze in financial markets, were as
important or even more important to spurring the great recession. Reversal of these trends will
thus play out in the recovery. The extent to which the Chinese stimulus sustained world output in
2008-09 is an important question. The answer to that question directly links to prospects for
sustaining world aggregate demand as China seeks to retrench in terms of credit and fiscal
stimulus, going forward.
2. Did Imbalances Cause the Crisis?
2.1 Potential Explanations for the Imbalances
In order to answer the question of whether the “imbalances” caused the crisis, one first
has to take a stand on the sources of the imbalances.
In the years from 1998-2008, economists focused their attention on the causes and
consequences of the expanding current account deficits and surpluses. The pattern of current
account balances was interesting from an economic standpoint, in that it did not appear to
conform to what would be predicted by standard economic theories. They were troubling from a
policy standpoint in that they were unprecedentedly large by post-war standards.
Throughout the first decade after 2000, the United States ran enormous current account
deficits. China, the rest of East Asia, and the oil exporting countries ran correspondingly large
current account surpluses, as shown in Figure 1. In 2008-09, these current account balances
drastically reversed, albeit incompletely, as a global financial crisis engulfed the world economy.
The proximity of the two events naturally leads to the question whether the two phenomena are
related, or causal in nature.
In this section, I will review the various explanations for the rise of global imbalances,
defined as large current account balances. These explanations include (1) trends in saving and
investment balances, (2) the intertemporal approach, (3) mercantilist behavior, (4) the global
saving glut, and (5) distortions in financial markets. Note that the explanations are not mutually
exclusive.
Are We Really Between Scylla and Charybdis? Imbalances, Overheating, and the Recovery
EWC / KDI Conference, Honolulu, Hawaii, 19–20 August 2010
3
Figure 1: Current account balances as a share of world GDP. 2009-2015 data are IMF projections.
US is United States, OIL is oil exporting countries, DEU+JPN is Germany plus Japan, OCADC is other advanced developed countries, CHN+EMA is China plus other emerging Asia, and ROW is rest of the world. Source: IMF, World Economic Outlook, April 2010.
The first approach relies upon the definition of the current account as the difference
between national saving and investment. The second approach is the standard economist’s
explanation for lending and borrowing – namely the tendency to smooth consumption in the face
of time variation in output. The third approach relies upon the export oriented development path
undertaken by East Asian countries as an explanation for the pattern of deficits and surpluses.
The fourth approach assumes there is a distortion in less developed country financial markets, in
so far as they are not able to channel capital from savers to borrowers domestically. The
financial intermediation activity is thus outsourced to developed countries. The fifth approach
takes the key distortion as lying in the financial markets of the United States, and to a lesser
extent, other developed countries.
2.2. The Saving-Investment Approach
The saving-investment approach takes the perspective from the national saving identity
CA ≡ (T – G) + (S – 1)
Menzie D. Chinn
EWC / KDI Conference, Honolulu, Hawaii, 19–20 August 2010
4
where the T is tax receipts net of transfer payments, G is government spending, S is private
saving, and I is private investment; (T – G) is the budget balance, and (S – I) is the private sector
saving-investment balance.
Hence, the current account is, by an accounting identity, equal to the budget balance and
the private saving-investment gap. This is a tautology, unless one imposes some structure and
causality.
One particularly simple variant of this approach relies upon assuming that the shocks
primarily hit the government sector. Then changes in the budget balance are quasi-exogenous,
and the current account consequently responds. The inspiration for this perspective is the mid-
1980’s experience with the Reagan era tax cuts and defense buildup. During that episode, the
budget deficit and current account deficits both yawned to unprecedentedly large magnitudes,
inspiring the term “the twin deficits”.
Upon inspection, the simple interpretation of the twin deficits clearly does not hold,
beyond the mid-1980s, and 2001-2004. Of course, other types of shocks perturb the economy,
and once one allows for shocks to the other components of aggregate demand, or to the supply
side, then no such positive correlation need hold at all times. However, that does not deny the
validity of that view during the last decade.1
A systematic approach involves modeling the current account by explicitly focusing on
the determinants of private investment and saving, and adding those variables to the budget
balance. Chinn and Prasad (2003) is one early example of this approach.2 They analyze a sample
encompassing 18 industrial and 71 developing countries over the period 1971-95, using non-
overlapping 5 year averages of the data. The analysis includes a number of explanatory variables
to account for private saving and investment behavior, including demographic variables, per
capita income,3 trade openness, as well as variability of terms of trade shocks and GDP growth.
In addition, the budget balance enters in as a key macroeconomic policy variable. Additional
explanatory variables include net foreign assets, and capital controls.
1 See for instance Chinn (2005). A dissenting view is Truman (2005).
2 This line of research is closely related upon the voluminous savings retention regression literature of Feldstein and Horioka (1980); see also Dooley, Frankel and Mathieson (1987).
3 One reason the pattern of capital flows has been so puzzling is that capital seems to be flowing from poor to rich countries. See Alfaro, Kalemli-Ozcan and Volosovych (2008).
Are We Really Between Scylla and Charybdis? Imbalances, Overheating, and the Recovery
EWC / KDI Conference, Honolulu, Hawaii, 19–20 August 2010
5
They find that government budget balances, initial net foreign asset positions and, for
developing countries, indicators of financial deepening are positively correlated with current
account balances. Among developing countries, they also find that higher terms of trade
volatility is associated with larger current account surpluses (or smaller deficits). Greater
macroeconomic uncertainty apparently increases domestic saving and also has a slightly negative
impact on investment. The degree of openness to international trade appears to be weakly
associated with larger current account deficits among developing countries.4 Note that because
they include average GDP growth and initial net foreign assets5 in the regressions, the saving-
investment approach is consistent with some aspects of the intertemporal approach (discussed
below).
Gruber and Kamin (2007) obtain similar results for a smaller panel of 61 countries
spanning the 1982-2003 period. They find that including a crisis dummy for the East Asian
countries statistically explains those countries’ current account balances. However, their results
do not shed light on the source of US deficits. Hence, while the stylized facts are relevant to the
question at hand, they pertain to the period before the appearance of global imbalances.
Chinn and Ito (2007, 2008) expand the sample period to extend from 1971 to 2004,
thereby encompassing a period during which the global imbalances became much more
pronounced. In this analysis, the goal was to determine whether American and East Asian current
account balances were evolving in a manner inconsistent with historical correlations. The
regression analysis controls for a similar set of variables as used in Chinn and Prasad (2003), but
focuses in on the role of budget balances, financial development, and institutions.
Their key findings include the following. First, the budget balance is an important
determinant of the current account balance for industrial countries; the coefficient for the budget
balance variable is 0.15 in a model controlling for institutional variables. A series of robustness
checks yield the results that a one percent point increase in the budget balance leads to a 0.1 to
4 They also find limited evidence to support the patterns of evolutions in current accounts predicted by the stages-of-development hypothesis. Other potentially important variables such as indicators of capital controls and average GDP growth, however, appear to bear little systematic relationship with current account balances.
5 The initial net foreign assets variable is expressed as a share of GDP, and pertains to the beginning of each panel. The data are from Sinn (1990) and various versions of the Lane and Milesi-Ferretti data base (2006).
Menzie D. Chinn
EWC / KDI Conference, Honolulu, Hawaii, 19–20 August 2010
6
0.5 percentage point increase in the current account balance. 6 For the United States, their
analysis confirms the view that it is a saving drought – not investment boom – that is
contributing to the enlargement of current account deficits, although there is some evidence of
anomalous behavior in the 2001-04 period. For the East Asian countries, Chinn and Ito find
some evidence that the budget balances are somewhat larger than predicted by their empirical
models.
Chinn and Ito extend their analysis by accounting for endogeneity in two ways. First,
they estimate use an instrumental variables approach, and second they replace the budget balance
with the cyclically adjusted budget balance.7 In both cases, the coefficient on the budget balance
in both cases rises considerably, ranging from 0.45 to 0.49. The US current account deficit in
2001-04 was significantly different from that predicted by the model, but just barely. China’s
current account was within the 95% prediction band.
2.3. The Intertemporal Approach
The intertemporal approach is the mainstay of the rigorous approach to explaining current
account imbalances. Suppose one maximizes an intertemporal utility function subject to a budget
constraint. If agents are not constrained by borrowing restrictions, and if they have rational
expectations, then the agents should smooth consumption. In order to smooth consumption, they
borrow and save accordingly.
In this perspective, consumption today is to equal a share of the present discounted value
of future expected net output , or net wealth. Hence, changes in consumption are due solely to
changes in either the interest rate, or changes in expectations about future net output due to
productivity shocks or reductions in investment and government spending.
What does this mean in the context of the question at hand? Suppose that in the early
2000’s, Americans thought that productivity would boom in the future. Then rather than waiting
for that anticipated productivity boom in the future to increase consumption, it makes sense for
6 Smaller estimates of the fiscal impact are reported by Bussiere (2005), Corsetti and Muller (2006), and Gruber and Kamin (2007).
7 For the IV approach, they use a dummy for the left-wing government, political constraint (democracy) index, military spending as a ratio to GDP, yearly changes in unemployment rates, and regional dummies. The “trend” budget balance is estimated using the HP filter.
Are We Really Between Scylla and Charybdis? Imbalances, Overheating, and the Recovery
EWC / KDI Conference, Honolulu, Hawaii, 19–20 August 2010
7
them to start consuming more now, so as to smooth consumption as much as possible.8 In the
context of America in the 2000’s, to consume more now means to import more and export less.
In this perspective, deficits signal future economic strength. For the United States,
deficits could result from the relative attractiveness as a place to invest due to relatively high
rates of return. This argument would be more convincing if GDP growth were being maintained
by investment rather than consumption and, more importantly, if the lending to the United States
took the form of purchases of stock and direct investment. Instead, a large proportion of capital
flowing to the United States takes place in the form of purchases of U.S. government securities –
not purchases of American stocks or direct investment in its factories, as it did in the years
leading up to 2000. Moreover, the heavy involvement of foreign central banks in purchasing U.S.
assets suggests that the profit motive is not behind the ongoing flows to the United States.
There are numerous ways in which to account for intertemporal effects in current account
dynamics. Chinn and Lee (2009) apply a structural VAR approach, which allows for transitory
and permanent shocks to drive the current account and the real exchange rate. The key
identifying assumption is that the current account is stationary, while the real exchange rate is
integrated of order one. Using the same approach as in Lee and Chinn (2006), they examine the
US, the euro area and Japan, and find that a large share of the 2004-07 US current account is
inexplicable using their model.
Some early formal analyses of the present value approach were conducted by Sheffrin
and Woo (1990a, b). These studies were applied to small countries, which fit the theoretical
framework. A formal test of the intertemporal approach, as applied to the United States, was
conducted by Engel and Rogers (2006). They model the current account as a function of the
expected discounted present value of its future share of world GDP relative to its current share of
world GDP (where the world is the advanced economies). The key difficulty in testing this
approach is in modeling expected output growth; using a Markov-switching approach, they find
that the U.S. is not keeping on a long-run sustainable path.9 10However, using survey data on
8 See Pakko (1999) for an early interpretation in this vein. Note that the empirical evidence for the theoretical model underpinning this argument is weak. See Nason and Rogers (2006).
9 Engel and Rogers use data over the 1790-2004 period for one of their sustainability tests. The survey-based tests rely upon a shorter sample, 1994-2004.
10 Choi, Mark and Sul (2008) allow for different rates of discount, and can replicate the pattern of imbalances in a two-country model.
Menzie D. Chinn
EWC / KDI Conference, Honolulu, Hawaii, 19–20 August 2010
8
forecasted GDP growth in the G-7, their empirical model appears to explain the evolution of the
U.S. current account remarkably well.
2.4. East Asian Mercantilism and Bretton Woods II versus Self-Protection
One view attributes the East Asian surpluses to explicitly mercantilist behavior. From this
perspective, the developing countries of East Asia have followed an export led development
strategy. That export led strategy resulted in rapid growth; however, starting in the mid-1990’s,
current account surpluses evolved into current account deficits, as investment boomed.
In the wake of the 1997 financial crisis, investment levels collapsed, while saving rates
remained relatively high. Currencies depreciated sharply in the region; however, over time, East
Asian central banks maintained their currencies at fairly weak levels. For some observers, this
observation is sufficient to explain the relatively large and persistent current account surpluses in
the region. One difficulty with this explanation is that the export led development path has been
in place for decades; the explanation for the sharp break post-1997 is missing.
In addition, in the traditional monetarist approach to the balance of payments, pegging
the nominal exchange rate at a weak level is no guarantee that the real exchange rate will be
commensurately weak. Over time, with reserve accumulation, the money supply will increase
thereby inducing an increase in the price level which undoes the exchange rate undervaluation.
In the short run, price stickiness and sterilization of the impact of the reserve accumulation on
the money base can prevent the adjustment process. However, in standard interpretations, one
cannot maintain this undervaluation by way of the foreign exchange intervention over many
years (see CEA, 2007, chapter 7).
Note that while the model explains one half of the current account imbalances, it does not
explain the other side -- namely why it is that the United States, United Kingdom, and specific
other developed countries ran substantial deficits.
In a series of papers, Dooley, Folkerts-Landau, and Garber (2003; 2008) interpret the U.S.
current account deficit as the outcome of concerted mercantilist efforts by East Asian state actors.
In this context, the financing of America’s trade (and budget) deficit is an explicit quid pro quo
for continued access to American markets. Their explanation argues that the entire panoply of
government interventions are aimed at supporting exporting industries.
Are We Really Between Scylla and Charybdis? Imbalances, Overheating, and the Recovery
EWC / KDI Conference, Honolulu, Hawaii, 19–20 August 2010
9
There are also problems with this thesis. Most notable is the mysterious aspect of timing:
East Asian savings began flowing to the United States in 2003. Why not earlier, if the
mercantilist impetus had been there all along? For a thorough critique, see Prasad and Wei
(2005).
An alternative interpretation for the large scale reserve accumulation has been attributed
to the self-insurance or precautionary demand. Foreign exchange reserves can reduce the
probability of an output drop induced by capital flight or sudden stop. This self-insurance
motivation rose substantially in the wake of the East Asian crises; this point was verified by
Aizenman and Marion (2003).11 Aizenman and Lee (2007) evaluated the relative importance of
these of the various motivations by augmenting the conventional specifications for reserve
holdings with proxy variables associated with the mercantilism and self-insurance/precautionary
demand approaches. While variables associated with both approaches are statistically significant,
the self-insurance variables play a greater economic role in accounting for recent trends.
2.5. A Global Saving Glut?
The “global saving glut” explanation has been expounded by Bernanke (2005), Clarida
(2005a,b), and Hubbard (2005). This argument views excess saving from Asian emerging market
countries, driven by rising savings and collapsing investment in the aftermath of the financial
crisis (and to a lesser extent Europe), as the cause of the U.S. current account deficit. More
recently, the burgeoning surpluses of the oil exporters, ranging from the Persian Gulf countries to
Russia, have moved to the fore as sources of excess saving. From this perspective, the U.S.
external imbalance is a problem made abroad; the lack of well-developed and open financial
markets encourages countries with excess savings to seek financial intermediation in well-
developed financial systems such as the United States. Hence, a solution may only arise in the
longer term, as better developed financial systems mitigate this excess savings problem.
Caballero, Farhi and Gourinchas (2008) model the saving glut explanation as a shortage
of assets in the developing world. Mendoza, Quadrini and Rios-Rull model financial
development as the increase in the degree of enforcement of financial contracts.
The strongest point in favor of the saving glut hypothesis is the observation of a widening
current account deficit in the United States, combined with low real world interest rates. 11 See also Aizenman and Lee (2007), and Jeanne and Ranciere (2005).
Menzie D. Chinn
EWC / KDI Conference, Honolulu, Hawaii, 19–20 August 2010
10
However, the saving glut versus twin deficits view is not an either-or proposition. An
expansionary fiscal policy in the United States, combined with an investment drought in East
Asia would yield the observed increase in current account imbalances, while at the same time
resulting in a drop in the real interest rate. Thus, a simple open economy macro model can
explain the recent rise in U.S. current account deficits, East Asian current account surpluses, and
the recent fall in global interest rates without resort to exotic demand for high quality assets, or
the like.
In order to formally test the saving glut hypothesis, one can evaluate whether financial
development and institutional development explain the pattern of imbalances, using the
framework laid out in Section 3. The estimation results are reported in Table 1, extracted from
Chinn and Ito (2008).12 One interesting result shown in the table is the significantly positive
relationship (with the p-value of less than 10%) between current account and government budget
balances found for the industrialized countries group. This result differs from the results obtained
in Chinn and Prasad (2003), who examined a shorter sample from 1971 to 1995. A one
percentage point increase in the budget balance would lead to a 0.16 percentage point increase in
the current account balance for industrialized countries and 0.24 for less developed countries
except for African countries.
One noteworthy aspect of Table 1 relates to the financial deepening variable. Only in the
industrial countries’ current account regressions does it exhibit a negative coefficient, though
statistically insignificantly. With these results, one may not be able to conclude that more
developed financial markets lead to decreased current account balances, as posited by the
adherents of the global saving glut thesis.
Because the economic environmental factors may affect the way in which financial
development might affect saving and investment we include interaction involving these variables.
Interactions between the financial development and legal variables (PCGDP times LEGAL),
interactions between the financial development and financial openness variables (PCGDP times
KAOPEN), and interactions between legal development and financial openness (LEGAL times
KAOPEN). The financial and legal interaction effect is motivated by the conjecture that 12 Since these results are sensitive to the inclusion of the African countries, we also report separate sets of results with and without the African countries included, for the developing country sample. We also report separate results for an emerging market group that differs somewhat from the developing country sample.
Are We Really Between Scylla and Charybdis? Imbalances, Overheating, and the Recovery
EWC / KDI Conference, Honolulu, Hawaii, 19–20 August 2010
11
deepening financial markets might lead to higher saving rates, but the effect might be magnified
under conditions of better developed legal institutions. Alternatively, if greater financial
deepening leads to a lower saving rate or a lower investment rate, that effect could be mitigated
when financial markets are equipped with highly developed legal systems. A similar argument
can be applied to the effect of financial openness on current account balances.
Table 1: Current account regressions
Dependent variable: 5-yr average of current account (% of GDP): 1971 – 2004 (1) (2) (3) (4) (5) Full IDC LDC LDC w/o Africa EMG Gov’t budget balance 0.15 0.16 0.15 0.242 0.219
Robust standard errors in brackets, * significant at 10%; ** significant at 5%; *** significant at 1% The estimated coefficients for the time-fixed dummies and constant are not shown.
In order to examine the importance of institutions, Chinn and Ito augment their basic
model specification with variables aimed at capturing institutional factors, namely the legal
Menzie D. Chinn
EWC / KDI Conference, Honolulu, Hawaii, 19–20 August 2010
12
development variable (LEGAL), financial openness (KAOPEN), and associated interaction terms
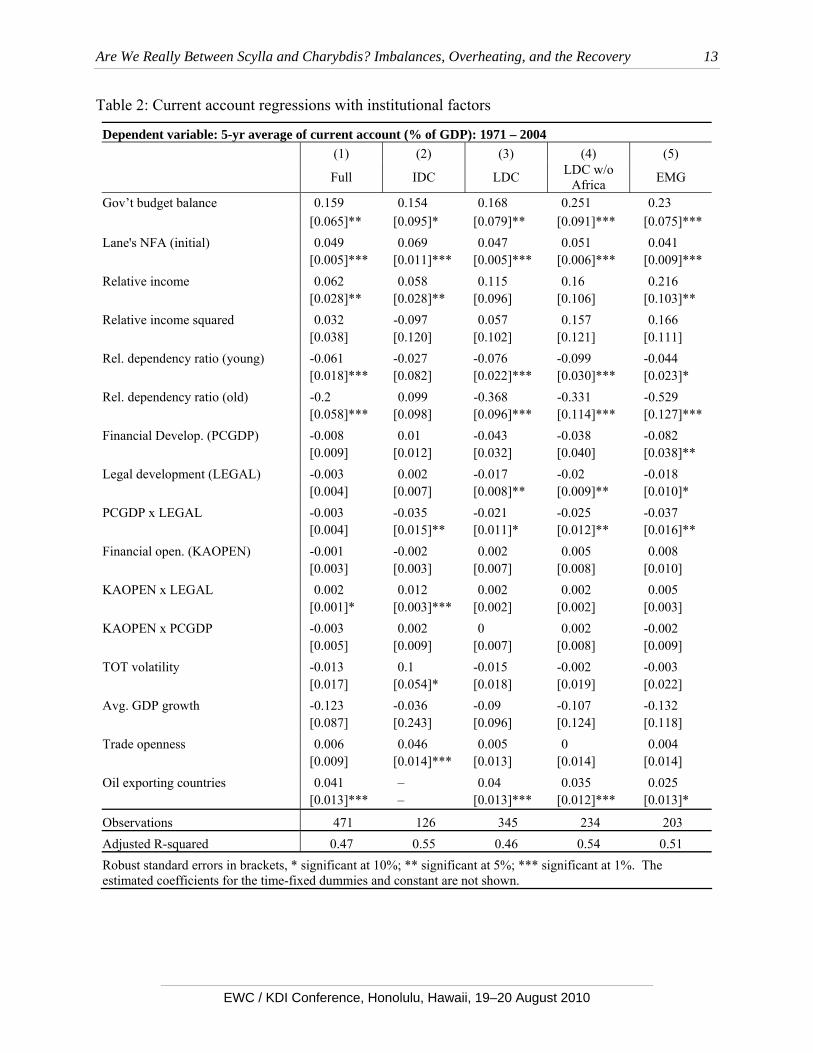
(including those with PCGDP). Table 2 displays results from panel OLS regressions with
institutional variables. They obtain several notable results.
Despite the inclusion of institutional variables and their interactions, the significantly
positive relationship between current account and government budget balances is detected in
almost all sample groups like in Table 1 from the previous analysis. The point estimate on
budget balances is a statistically significant 0.15 for the industrialized countries group, about the
same as in the previous estimation, implying that the coefficient on the budget balance for the
IDC group is robust to inclusion of institutional variables (Note that a ±2 standard error
confidence interval encompasses values as high as 0.34). The estimated coefficients on budget
balances remain close to that reported in Table 1 the other sample groups.13
Second, financial development is found to have different, and nonlinear, effects on saving
and investment. Chinn and Ito use the estimates from Table 2 to identify the countries for which
financial development would reduce the current account. With only Hong Kong and Singapore
categorized as countries in East Asia at the highest tenth percentile in legal development and
highest tenth percentile in financial openness, only they would experience a reduction in their
current account balances as financial development proceeds. For the majority of Asian emerging
market countries that are categorized as middle or lower level in terms of legal development and
financial openness, they will experience an increase in the ratio of national savings to GDP if
financial markets develop further. Given these results, Chinn and Ito conclude that financial
development reduces the level of current account balances, especially for Asian emerging market
countries, but that effect is achieved, not through a reduction in savings rates, but through
increased levels of investment.
In sum, Chinn and Ito’s results present evidence against the argument that emerging
market countries, especially those in East Asia, will experience lower rates of saving once these
countries achieve higher levels of financial development and better developed legal
infrastructure. In addition, more open financial markets do not appear to have any impact on
current account balances for this group of countries.
13 Gruber and Kamin (2005) report similar results.
Are We Really Between Scylla and Charybdis? Imbalances, Overheating, and the Recovery
EWC / KDI Conference, Honolulu, Hawaii, 19–20 August 2010
13
Table 2: Current account regressions with institutional factors
Dependent variable: 5-yr average of current account (% of GDP): 1971 – 2004 (1) (2) (3) (4) (5)
Observations 471 126 345 234 203 Adjusted R-squared 0.47 0.55 0.46 0.54 0.51 Robust standard errors in brackets, * significant at 10%; ** significant at 5%; *** significant at 1%. The estimated coefficients for the time-fixed dummies and constant are not shown.
Menzie D. Chinn
EWC / KDI Conference, Honolulu, Hawaii, 19–20 August 2010
14
One key challenge in this type of empirical exercise involves the proper measurement of
financial development. Ito and Chinn (2009) pursue this issue by using alternative indicators of
financial development, namely measures of equity, bond, and insurance market activity, as well
as different aspects of financial development such as the cost performance, size, and activeness
of the industry. The drawback of using these types of data is that the sample size is shortened;
their sample includes the 1986-05 period.14
They obtain the following results. First, they confirm a role for budget balances in
industrial countries when bond markets are incorporated. Second, empirically both credit to the
private sector and stock market capitalization appear to be equally important determinants of
current account behavior. Third, while increases in the size of financial markets induce a decline
in the current account balance in industrial countries, the reverse is more often the case for
developing countries, especially when other measures of financial development are included.
However, because of nonlinearities incorporated into the specifications, this characterization is
contingent. Fourth, a greater degree of financial openness is typically associated with a smaller
current account balance in developing countries.
One caveat is that the model does not predict well the observed current account
imbalances. In Chinn, Eichengreen and Ito (2010), the authors find that the US current account is
overpredicted in the 2006-08 period, while the Chinese current account is underpredicted – in
both cases by (barely) statistically significant amounts. Hence, there is some role for factors that
are not accounted for in our models. One of those is financial deregulation, and the inducement
of a “bubble” or boom/bust cycle delinked from fundamentals. This observation is directly linked
to my interpretation of the role of the global imbalances in the financial crisis.
2.6. Imbalances and the Financial Crisis
Some observers have taken to claiming the saving glut caused the crisis, by inducing a
search for yield and excessive leverage, and/or risk taking. This view is succinctly summarized
in CEA (2009: 22-23):
• The roots of the current global financial crisis began in the late 1990s. A rapid
increase in saving by developing countries (sometimes called the “global saving glut”)
14 These alternative financial measures are based on updated versions of the Beck, Demirgüc-Kunt and Levine (2001) data set.
Are We Really Between Scylla and Charybdis? Imbalances, Overheating, and the Recovery
EWC / KDI Conference, Honolulu, Hawaii, 19–20 August 2010
15
resulted in a large influx of capital to the United States and other industrialized
countries, driving down the return on safe assets. The relatively low yield on safe
assets likely encouraged investors to look for higher yields from riskier assets, whose
yields also went down. What turned out to be an underpricing of risk across a number
of markets (housing, commercial real estate, and leveraged buyouts, among others) in
the United States and abroad, and an uncertainty about how this risk was distributed
throughout the global financial system, set the stage for subsequent financial distress.
• The influx of inexpensive capital helped finance a housing boom. House prices
appreciated rapidly earlier in this decade, and building increased to well-above
historic levels. Eventually, house prices began to decline with this glut in housing
supply.
In this interpretation, the trigger is excess savings associated with the inflows. What is
missing from the story is the explanation for why the capital had to flow to the United States.15
In contrast, Obstfeld and Rogoff (2009) argue:
We too believe that the global imbalances and the financial crisis are intimately
connected, but we take a more nuanced stance on the nature of the connections. In
our view, both originated primarily in economic policies followed in a number of
countries in the 2000s (including the United States) and in distortions that
influenced the transmission of these policies through U.S. and ultimately through
global financial markets.
Financial market distortions in the developing world led to the excess of saving; financial
distortions in America pulled those flows to America. These financial distortions have been
highlighted in a number of analyses of the financial crises. Irrationality, or waves of excess
optimism and pessimism, is stressed by Akerlof and Shiller (2009). Stiglitz (2010) stresses the
credit market imperfections associated with asymmetric information. Rent seeking and
regulatory capture dominate the discussion by Johnson and Kwak (2010). Interestingly, excess
saving from East Asia does not appear as a causal factor in any of these accounts. Roubini and
Mihm (2010: 80-82) and Chinn and Frieden (2009; forthcoming) argue that excess rest-of-world
15 Caballero, Farhi and Gourinchas (2008b) view the link from inflows to crisis through the prism of the asset shortage interpretation (Caballero, Farhi and Gourinchas, 2008a).
Menzie D. Chinn
EWC / KDI Conference, Honolulu, Hawaii, 19–20 August 2010
16
saving combined with domestic financial distortions were central to the development and extent
of the crisis.
The Chinn-Frieden interpretation is consistent with the view that a resumption of
expanding imbalances without dealing with the distortions in credit markets would cause a
repetition, albeit some other form. While the US has begun addressing some of those market
distortions in the form of a comprehensive financial regulation package, much of the actual
regulation remains to be implemented. Even then, it is unlikely that the financial reforms will do
more than moderate the distortions. Hence, going forward, policymakers should seek to mitigate
large current account balances (in either direction), as a second best policy.16
3. The Global Recession: Propagation and Resilience
The global recession of 2008-09 was marked by a tremendously deep drop in trade flows
– much more pronounced than the decrease in production. Even more remarkable, this trade drop
was proportionately deeper than what occurred during the Great Depression (Eichengreen and
O’Rourke, 2010). The decline in growth rates in the value of goods exports is shown in Figure 2,
for the world, for advanced countries and for the emerging markets and LDCs (IMF
definitions).17
Note that one can barely distinguish between the export growth of the advanced and
emerging market economies.
As discussed Levchenko, Lewis and Tesar (2009), it is typical for trade flows to drop
more steeply than output during recessions. This is in part because trade is concentrated in
manufactured goods (relative to overall output), particularly in manufactured durable goods. In
the Great Recession, durable goods sectors were particularly hard hit. Hence, a large component
of the decline in trade was due to this compositional effect.
Another component, the size of which is disputed, arose from the impact of difficulty in
accessing trade financing. While there was anecdotal evidence of this effect, and there were
16 Clearly, this is a rejection of the Greenspan (2005) doctrine that associates larger current account deficits and surpluses with greater optimizing in the face of increased capital mobility.
17 Note that these are nominal values of trade. Deflating by unit value indices (keeping in mind all the problems with such indices) halves the percentage point drop during the Great Recession. The greater comovement is partly attributable to vertical specialization. See Chinn (2010) for a discussion of how vertical specialization drives a wedge between measured trade and traded in value added.
Are We Really Between Scylla and Charybdis? Imbalances, Overheating, and the Recovery
EWC / KDI Conference, Honolulu, Hawaii, 19–20 August 2010
17
several initiatives under the auspices of the G-20 to mitigate difficulties in accessing trade
financing, most of the empirical studies have failed to precisely measure the impact. That being
said, it is very difficult to identify the impact of this factor, exactly because the purported
decrease in access to trade financing occurs at exactly the same time as a general credit freeze in
Figure 2: Annual growth rates of exports, in nominal dollars, for the world (blue), advanced countries (red) and emerging market and LDCs (green). Growth rates calculated as log differences. Source: IMF, International Financial Statistics, and author’s calculations.
Finally, there is the drop in trade flows due to the drop in aggregate demand; this is the
traditional view of how foreign demand shocks are propagated. Certainly, Chinese exports fell
substantially during the global recession, as illustrated in Figure 3.
On an annualized basis, Chinese exports dropped as much as 30%, in nominal terms.
How much of an impact on the Chinese economy this was is subject to some dispute, as the
value-added content of Chinese exports is much less than 100%. Estimates range from 30% to
18 See Mora and Powers (2009) for an evaluation of the trade credit hypothesis, while Iacovoni and Zavacka (2009) assess the hypothesis that bank credit constraints hit the export-oriented manufacturing firms the hardest, thus explaining the sharp drop in trade.
Menzie D. Chinn
EWC / KDI Conference, Honolulu, Hawaii, 19–20 August 2010
18
50%.19 Even at the low end of value-added content, this implies something on the order of a
$125 billion reduction in aggregate demand.20
-.6
-.4
-.2
.0
.2
.4
.6
.8
90 92 94 96 98 00 02 04 06 08 10
D(LOG(EXPCH),0,12)D(LOG(IMPCH),0,12)
Chineseexports
Chineseimports(c.i.f.)
Figure 3: Annual growth in Chinese exports and imports, in USD, calculated log-differences. Source: IMF, International Financial Statistics, and author’s calculations.
Regardless of the value-added in Chinese exports, since China is at the end of a
production chain centered in Asia, the reduction in Chinese exports would obviously have been
propagated to the rest of the region. This explains why, in part, overall Asia ex.-Japan output
contributed less to overall world growth than China itself.
19 Dean, Fung and Wang (2007) provide an estimate of 30%, based upon the vertical specialization model of Hummels, Ishi and Yi (2001). Arguing that that approach is inappropriate when the usage of input is due to tax incidence reduction, Koopman, Wang and Wei (2008) estimates 50% domestic valued added for 2006 exports.
20 The calculations are as follows: Chinese exports in 2008 were about $1.4 trillion. Assuming 30% value added in Chinese exports then suggests about $420 billion in 2008 export value added. The 30% reduction then implies a reduction in aggregate demand of $126 billion. Since actual Chinese GDP in 2008 was $4.519 trillion, this implies a reduction in aggregate demand through export demand reduction of about 2.8%. If value added is 50%, then the impact was about 4.7%.
Are We Really Between Scylla and Charybdis? Imbalances, Overheating, and the Recovery
EWC / KDI Conference, Honolulu, Hawaii, 19–20 August 2010
19
-4,000
-3,000
-2,000
-1,000
0
1,000
2,000
3,000
4,000
5,000
2007 2008 2009 2010 2011 2012 2013
US
China
Asiaex.-Japan
Worldex.-USex.-Asia*
Figure 4. Contribution to World Growth, in billions of USD, for US (blue), China (red), Asia ex.-Japan (green) and World ex.-US, ex.-Asia* (black). Asia defined as newly industrializing Asia, developing Asia, excluding Japan. Gray shaded area are forecasts. Source: IMF, World Economic Outlook, April 2010, and author’s calculations.
Surely, in the absence of the tremendous stimulus program that took place, Chinese and
hence world output would have been less. It is not clear to me how much less world output
would have been less due to decreased Chinese demand for final imports.
The preceding pertains to the propagation of shocks to the rest of the world, and in
particular East Asia. One of the interesting aspects of the financial crisis of 2008 is that it was
centered in the core advanced countries. The crisis started in the US, propagated to Europe by
way of the difficult-to-value and problematic derivatives on the books of European banks, and
then by the freeze in credit markets in the wake of the Lehman bankruptcy.
It seems useful to distinguish, then, between how the recession spread to the other
advanced countries versus to the emerging market and developing countries. In fact, one of the
interesting things remarked upon in IMF (2009) was the fact that financial stress seemed to
propagate to the industrial countries rapidly, starting in 2008. Only toward the end of 2008 did
financial stress indicators begin to rise for the emerging markets.
What I find interesting is that despite elevated stress, growth did not slow down in most
of those countries as a result of financial stress, with the exception of those in Eastern and
Southern Europe. IMF (2009) expands upon some of the reasons that this occurred.
Menzie D. Chinn
EWC / KDI Conference, Honolulu, Hawaii, 19–20 August 2010
20
Figure 5: Financial Stress. Source: IMF, World Economic Outlook, April 2009.
4. Have the Imbalances Been Corrected? Is Overheating Still a Threat?
4.1 A Framework for Analysis
In order to discuss whether a given economy has achieved a situation where over the
medium term the current account balance is at a level that is sustainable, and yet output is close
to potential GDP, it is useful to appropriate a device from an earlier time, namely the Swan
diagram, which related internal and external balance to combinations of the exchange rate and
government spending. This approach was appropriate for a time when exchange rates were
policy tools (because they were fixed) and the concern was with the Keynesian equilibrium
condition that aggregate demand equaled production. In order to update framework, I work with
two equilibrium conditions:
(1) YAS = YAD = α1G + α2(M/P)
(2) 0 = TB = β1G + β2(M/P)
Are We Really Between Scylla and Charybdis? Imbalances, Overheating, and the Recovery
EWC / KDI Conference, Honolulu, Hawaii, 19–20 August 2010
21
where α1 > 0, α2 > 0, β1 < 0, β2 >< 0, G is government spending, M/P is real money supply. These
two variables could be more broadly interpreted as a measure of fiscal impulse, and of monetary
stimulus, respectively.
Equation (1) states that equilibrium is given by output equaling potential output, where
potential output is exogenously given. This is obviously a long run condition, since in the short
run prices are predetermined. Equation (2) is an external equilibrium condition, where the trade
balance is set to zero for simplicity. In general, it could be set to a constant, which is
exogenously set (and possibly changing over time). Note that there is one ambiguously signed
coefficient, namely β2. I’ll assume that for purposes of discussion, β2 > 0, that the trade balance
responds positively to an exchange rate depreciation that results from an expansion in the money
supply. These equilibrium conditions can be interpreted in Figure 6 as follows:
Figure 6: Internal and external balance
The BB curve is sloped upward, while the YY curve is sloped downward. Points to the
right of the BB curve indicate deficits, while points to the right of the YY curve indicate output
in excess of potential. Countries can then be categorized as falling into four combinations of
Slack/Trade Deficit. Changes in government spending, could typically restore either internal and
external equilibrium, but not both (except by good fortune). Similarly monetary policy can only
Menzie D. Chinn
EWC / KDI Conference, Honolulu, Hawaii, 19–20 August 2010
22
achieve one or the other equilibrium conditions. Both instruments are needed to achieve both
targets.
In Figure 6, I plot what are commonly viewed positions of the US (slack/trade deficit)
and China (above potential GDP/trade surplus). It’s important to not take the graph as a full
fledged characterization of economic situations; rather it highlights the difficult choices that face
certain economies. For the US, greater fiscal stimulus could achieve full employment, but at the
cost of a worsening of the trade deficit. Monetary policy in combination with some fiscal
retrenchment could achieve internal and external equilibrium.
This does not seem like a difficult problem, on merely technical grounds. However, an
additional complication arises if we do not know what the value of potential GDP is. A decrease
in potential GDP shows up as a shift inward in the YY curve. This effect is shown in Figure 7. If
US policymakers were aiming for internal and external equilibrium (by using expansionary
monetary policy, and contracting fiscal), but misinterpreted the new level of potential output,
then the US would then end up in a position of overheating the economy.
Figure 7: Internal and external balance, with a reduction in potential GDP
This simple observation motivates the evaluation of where each of the major economies
of the world are currently, and where they are likely to be over the short to medium term (the
short run being ignored in this framework).
Are We Really Between Scylla and Charybdis? Imbalances, Overheating, and the Recovery
EWC / KDI Conference, Honolulu, Hawaii, 19–20 August 2010
23
4.2 Prospects for Rebalancing versus Overheating
4.2.1 The Major Economies
Overview
The United States is the key to rebalancing the world economy. As the single largest
economy, and the one that has been conducting unsustainable path, developments in that country
will have the largest single impact on the world economy. Figure 1, and the accompanying IMF
projections, demonstrate that the recent global recession has only brought a temporary respite
from unsustainable current account deficits. Let’s first consider the current account to GDP ratios
projected for the United States, the euro area and Japan, shown in Figure 8.
-8
-6
-4
-2
0
2
4
6
1980 1985 1990 1995 2000 2005 2010 2015
CAPPT_US CAPPT_EU CAPPT_JP
US
Euroarea
Japan
Figure 8: Current account as a share of GDP, for US, Euro area and Japan. Shaded area denotes forecasts. Source: IMF, World Economic Outlook (April 2010).
What is clear is that, without drastic changes in exchange rates, and the domestic
composition of output in the US, then the current account is slated to rise slightly to about 3.5%.
What about the Euro area and Japan. Without clear evidence of structural change in Japan, the
IMF is projecting continued surpluses. The Euro area remains at approximate balance. In other
words, if rebalancing is to proceed apace, we cannot rely upon the rest of the advanced industrial
countries to contribute a lot to the adjustment process. This is even more true in the wake of the
Menzie D. Chinn
EWC / KDI Conference, Honolulu, Hawaii, 19–20 August 2010
24
sovereign debt concerns in Europe. Southern European countries are going to implement
programs of fiscal consolidation. Even more worrisome, the countries that have fiscal space –
namely Germany and to lesser extent France – are also embarking upon no further programs to
stimulate the economy. Certainly, there are no moves to encourage additional private
consumption.
-8
-6
-4
-2
0
2
4
1980 1985 1990 1995 2000 2005 2010 2015
GAP_US GAP_EU GAP_JP
US
Euroarea
Japan
Figure 9: Output gaps as a share of GDP, for US, Euro area and Japan. Shaded area denotes forecasts. Source: IMF, World Economic Outlook (April 2010).
Japan is recovering from a very deep drop in output relative to potential. With the output
gap deeply negative (Figure 9), and deflation already entrenched (Figure 10), the prospects of
“overheating” in Japan are nil. Somewhat more controversially, I doubt that there are realistic
prospects for overheating in the Euro area. With the output gap mired at nearly 4 percentage
points of GDP, and a very slow recovery to potential forecast, it seems highly unlikely that
inflation will surge. US inflation is also projected by the IMF to be muted, which is not
surprising given the large amount of slack in the economy.
It would be a mistake to put too much faith in the IMF projections, not because of any
failings of the Fund economists, but because calculating potential GDP, and hence the output gap,
is an enterprise fraught with hazards. This is particularly true during periods of substantial
Are We Really Between Scylla and Charybdis? Imbalances, Overheating, and the Recovery
EWC / KDI Conference, Honolulu, Hawaii, 19–20 August 2010
25
structural change, such as we have just experienced. For instance, OECD (2009) has reduced
estimates of 2010 potential GDP growth by 0.4, 0.8 and 0.5 percentage points. These revisions
are shown in Table 3, reproduced from that study; but those revisions themselves are subject to
considerable uncertainty.
-2
-1
0
1
2
3
4
5
6
90 92 94 96 98 00 02 04 06 08 10 12 14
INFL_US INFL_EU INFL_JP
US
Euroarea
Japan
Figure 10: Year on year inflation rate for US, Euro area and Japan. Gray shaded areas denote forecasts. Source: IMF, World Economic Outlook (April 2010).
Table 3: Excerpt from OECD (2009), Box 4-1.
Menzie D. Chinn
EWC / KDI Conference, Honolulu, Hawaii, 19–20 August 2010
26
Because the US economy is implementing the largest fiscal and monetary stimulus, the
US case bears closer scrutiny.
More on the United States
First, given the concerns about overheating, I display in Figure 11 the output gap
measures from the IMF (displayed earlier in Figure 9), the Congressional Budget Office, and
from two statistical measures – the commonly used Hodrick-Prescott filter and the Baxter-King
band pass filter. The discrepancy between the various measures highlights the uncertainty I
mentioned earlier. The IMF indicates a 2010 output gap of only about -4 percentage points of
GDP, while the OECD and CBO indicate a greater extent of slack, at -5 and -6 percentage points.
The statistically based measures, the HP filter and BP filter, indicate smaller output gaps, at
roughly 2 and 1 percentage points respectively.21
-8
-6
-4
-2
0
2
4
6
8
1980 1985 1990 1995 2000 2005 2010 2015
IMF
CBOHP filterBPfilter
OECD
Figure 11: Output gap for the United States, from IMF, CBO, OECD, HP filter, and Band Pass filter. Gray shaded areas denote forecasts. Source: IMF, World Economic Outlook (April 2010), CBO, Economic and Budget Outlook (January 2010).
21 Since both the HP and BP filters are subject to end-point distortions, I forecast forward 6 years starting from 2010, and then apply the filter to the entire data series.
Are We Really Between Scylla and Charybdis? Imbalances, Overheating, and the Recovery
EWC / KDI Conference, Honolulu, Hawaii, 19–20 August 2010
27
The fact that there is so much discrepancy between the IMF, OECD and CBO measures
is somewhat distressing given that they are all based roughly on a production function approach.
On the other hand, there is a wide degree of discretion in estimating and forecasting the inputs
into the potential GDP (labor force, capital stock, technology), so perhaps we shouldn’t be too
surprised.
The fact that the IMF output gap is smaller in absolute value might explain why the IMF
is more set upon an early withdrawal of stimulus and fiscal consolidation. That being said, in my
opinion, the recent downward revision in the level of US GDP (almost a percentage point)
lessens the urgency to retrench.22
The debate regarding the output gap is linked up to the unemployment gap, and the
natural rate of unemployment. There has been substantial argument that, with the large changes
in the composition of output, the labor market mismatch has increased; consequently the natural
rate has increased. The argument is persuasive given the large proportion of long term
unemployed – the highest on record.
Early estimates, such as Valetta and Cleary (2009) and Risman (2009), do not find much
evidence that structural unemployment has risen. More recent estimates, based on different
methodologies, do find an increase in the structural rate of unemployment. Weidner and
Williams (2010) work off Okun’s Law to calculate an increase of 2.8 ppts from 2007Q4 to
2010Q1. A more micro based approach is adopted by Dowling, Estevão, and Tsounta (2010),
who directly address the skills mismatch issue. The estimate the natural rate has risen 1.5 ppts.
Clearly, the unemployment gap uncertainty mirrors the output gap uncertainty.
Despite the uncertainty regarding the exact magnitude of the output gap and
unemployment gap, I think it notable that there is no indication that there incipient inflationary
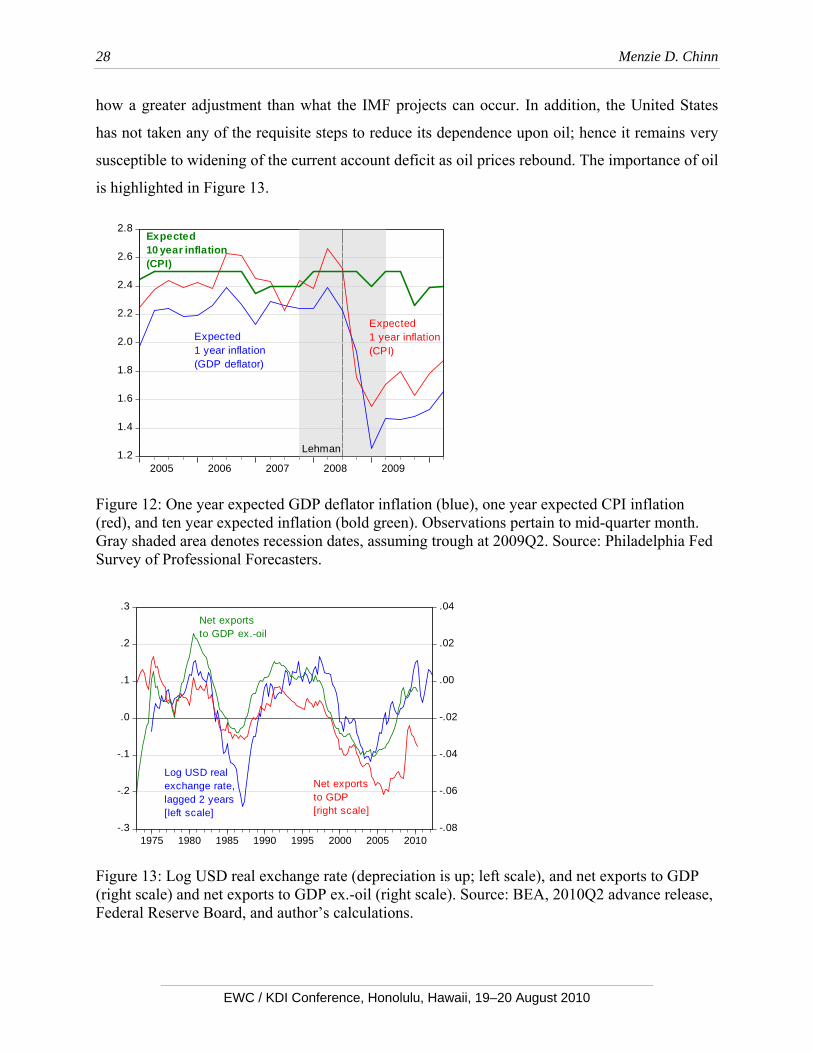
expectations. Figure 12 displays the mean forecasts for inflation. Even at the 10 year horizon,
expectation have barely budged. If anything, fears of deflation have risen. Hence, there is little
danger of the US economy overheating; I suspect that a similar characterization applies to other
advanced economies.
The rebalancing issue is harder to assess, in part because rebalancing depends upon what
happens in the rest of the world. However, given the current constellation of exchange rates,
particularly with respect to China, and the failure of Europe to expand rapidly, it is hard to see 22 See Chinn (2010) for estimates of the price elasticities.
Menzie D. Chinn
EWC / KDI Conference, Honolulu, Hawaii, 19–20 August 2010
28
how a greater adjustment than what the IMF projects can occur. In addition, the United States
has not taken any of the requisite steps to reduce its dependence upon oil; hence it remains very
susceptible to widening of the current account deficit as oil prices rebound. The importance of oil
is highlighted in Figure 13.
1.2
1.4
1.6
1.8
2.0
2.2
2.4
2.6
2.8
2005 2006 2007 2008 2009
Expected1 year inflation(GDP deflator)
Expected1 year inflation(CPI)
Expected10 year inflation(CPI)
Lehman
Figure 12: One year expected GDP deflator inflation (blue), one year expected CPI inflation (red), and ten year expected inflation (bold green). Observations pertain to mid-quarter month. Gray shaded area denotes recession dates, assuming trough at 2009Q2. Source: Philadelphia Fed Survey of Professional Forecasters.
Figure 13: Log USD real exchange rate (depreciation is up; left scale), and net exports to GDP (right scale) and net exports to GDP ex.-oil (right scale). Source: BEA, 2010Q2 advance release, Federal Reserve Board, and author’s calculations.
Are We Really Between Scylla and Charybdis? Imbalances, Overheating, and the Recovery
EWC / KDI Conference, Honolulu, Hawaii, 19–20 August 2010
29
Nonetheless, there are two points of optimism. The first relates to the domestic
overheating issue, as well as the rebalancing issue. That is that US households appear to be
retrenching more than had been earlier anticipated; household saving rates have not declined,
according to the most recent statistics. The mirror image of this is that aggregate demand will not
have an upward push from domestic sources, so slack is even more likely than overheating. This
also means that imports – at least for consumer goods – will not pick up as much as otherwise.
That will help on the external accounts.
The other point of optimism is that price elasticities might be higher than we think. That
means the scope for trade balance adjustment if the Chinese allow more rapid appreciation, and
the rest of East Asia follows is greater than currently allowed for. In Chinn (2010), I re-
investigate the elasticities associated with US trade flows, and find that particularly on the export
side, export price elasticities are closer to unity than to 0.5, which I had found in my earlier work.
Import elasticities, after proper disaggregation, also appeared to be higher than detected in earlier
work from the early 2000’s. That set of findings is in line with work by the IMF (2007).
The implication of this last set of findings is that rebalancing might be more feasible than
anticipated, if the USD exchange rate is allowed to depreciate further. This depends critically
upon China, as Chinese currency appreciation will allow much of the rest of the de facto dollar
area to appreciate as well.
4.2.2 The BRICs
Overview
The current account balances of Brazil, Russia, India, and China, and associated IMF
projections, are depicted in Figure 14. The most notable of these are Russia’s, which is projected
to slide to zero by 2015, and China’s, which is projected to resume expansion. The trade balance
proportion is slated to stay relatively constant at its 2010 level; the net factor income proportion
expands as receipts on foreign assets increases.23
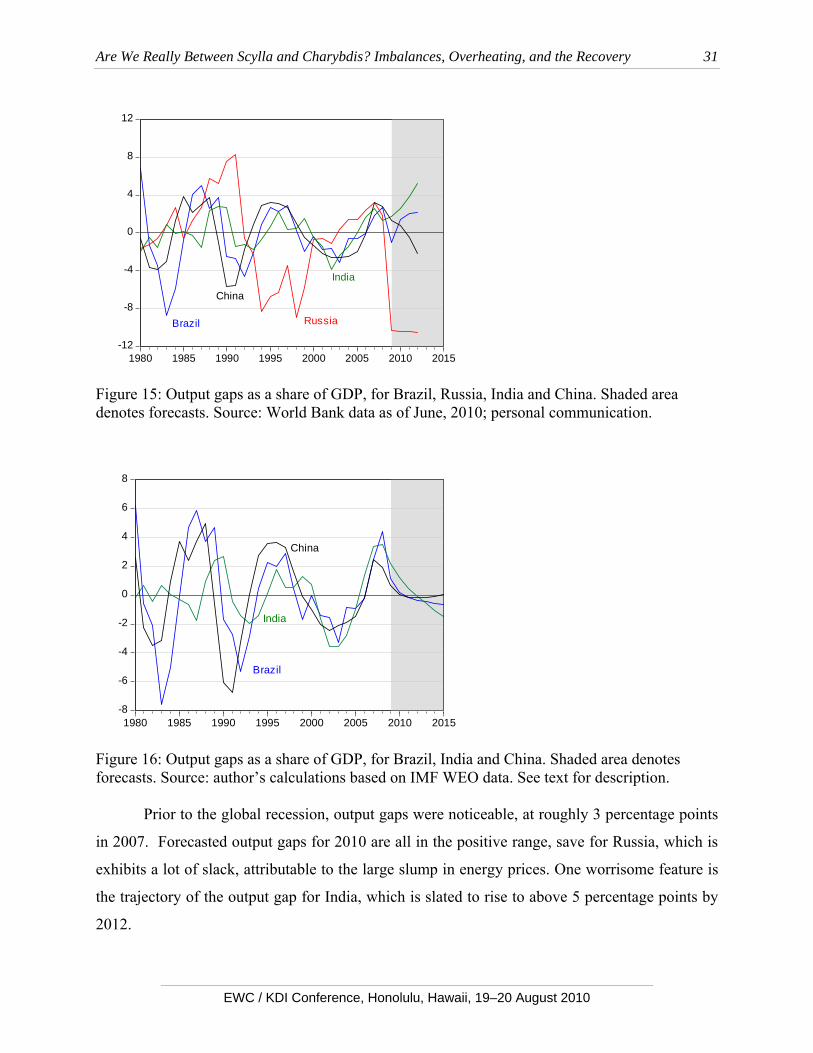
Since the IMF does not report potential GDP for the emerging and developing countries,
in Figure 15 I have graphed the output gaps as reported by the World Bank. Because determining
whether the major emerging market economies are overheating is a complicated task, analysts
23 World Bank’s (2010a) June China Quarterly report indicates a 2 ppts of GDP gap between the trade balance and the current account by 2015.
Menzie D. Chinn
EWC / KDI Conference, Honolulu, Hawaii, 19–20 August 2010
30
take the shortcut of applying a statistical filter to determine potential GDP. This procedure makes
sense as these open economies are much more dependent upon commodities (as in the case of
Russia), or have been subject to major economic crises (Brazil and Russia), or are undergoing
rapid structural change, which make the application of the production function approach
implemented for the developing countries problematic. For these countries, the historical output
gap series for the World Bank and the HP filter match pretty well (Figure 16).24 The forecast
output gaps differ substantially; hence I will rely upon the World Bank measures.25
-10
-5
0
5
10
15
20
1980 1985 1990 1995 2000 2005 2010 2015
CAPPT_BR CAPPT_RUCAPPT_IN CAPPT_CH
Brazil
Russia
India
China
Figure 14: Current account as a share of GDP, for US, Euro area and Japan. Shaded area denotes forecasts. Source: IMF, World Economic Outlook (April 2010).
24 Since there is an end-point problem with applying the HP filter, which is two-sided. To mitigate this, I extend the time series from 1980-2009 by adding forecasted data for the 2010-15 period, using an ARIMA(1,1,0) model, and apply the HP filter to this entire series to obtain potential GDP. To calculate the output gap, I use the IMF forecasted level of GDP and the trend obtained from the HP filtered data. Since the data are annual in frequency, I set lambda=100.
25 These are production function based measures of potential GDP, similar to those developed by the OECD for their advanced country measures. A description is contained in World Bank (2010b), Box 2.8.
Are We Really Between Scylla and Charybdis? Imbalances, Overheating, and the Recovery
EWC / KDI Conference, Honolulu, Hawaii, 19–20 August 2010
31
-12
-8
-4
0
4
8
12
1980 1985 1990 1995 2000 2005 2010 2015
Brazil Russia
India
China
Figure 15: Output gaps as a share of GDP, for Brazil, Russia, India and China. Shaded area denotes forecasts. Source: World Bank data as of June, 2010; personal communication.
-8
-6
-4
-2
0
2
4
6
8
1980 1985 1990 1995 2000 2005 2010 2015
Brazil
India
China
Figure 16: Output gaps as a share of GDP, for Brazil, India and China. Shaded area denotes forecasts. Source: author’s calculations based on IMF WEO data. See text for description.
Prior to the global recession, output gaps were noticeable, at roughly 3 percentage points
in 2007. Forecasted output gaps for 2010 are all in the positive range, save for Russia, which is
exhibits a lot of slack, attributable to the large slump in energy prices. One worrisome feature is
the trajectory of the output gap for India, which is slated to rise to above 5 percentage points by
2012.
Menzie D. Chinn
EWC / KDI Conference, Honolulu, Hawaii, 19–20 August 2010
32
According to the IMF, inflationary pressures will be well maintained. Actual and
forecasted inflation are displayed in Figure 17. This pattern is not quite consistent with the output
gap measurements from the World Bank, especially in regard to India. Given the uncertainty
surrounding the estimation of these particular countries’ prospects, and identifying the proper
potential GDP series, it seems to me that this is where our greatest worries about overheating
reside.
-4
0
4
8
12
16
20
24
2000 2002 2004 2006 2008 2010 2012 2014
INFL_BR INFL_RUINFL_IN INFL_CH
Brazil
Russia
India
China
Figure 17: Year on year inflation rate for Brazil, Russia and China. Gray shaded areas denote forecasts. Source: IMF, World Economic Outlook (April 2010).
Since Russian aggregate demand is sensitive to energy prices, and the other BRICs are
sensitive to commodity prices in terms of aggregate supply shocks, it seems worthwhile to
consider where commodity prices are right now. As of March 2010, there seemed to be little
movement forecasted in these prices (Figure 18). However, typically, these forecasts predict little
of the movement in subsequent commodity prices. Hence, I would say that the biggest wild card
is energy prices; a movement upward in this price would improve Russian prospects, while
pushing down output gaps in the other BRICs and simultaneously pushing up inflation.
Are We Really Between Scylla and Charybdis? Imbalances, Overheating, and the Recovery
EWC / KDI Conference, Honolulu, Hawaii, 19–20 August 2010
33
50
100
150
200
250
300
350
400
450
03 04 05 06 07 08 09 10 11
Energy
Food
Agric.raw mat.
Metals
Beverages
Figure 18: Commodity prices (2003=100) for energy, food, agricultural raw materials, metals, and beverages. Source: IMF, World Economic Outlook, April 2010, Figure 1-18.
More on China
Like the United States, China merits additional discussion because of its central role in
the current account imbalances. The analysis can proceed along two fronts. The first is the
conventional elasticities approach, where the impact of Chinese currency revaluation is assessed
in a very partial equilibrium approach. The second is a more general one, where one views the
current account (really the trade balance) as the outcome of saving and investment and
government budget decisions. The latter approach does not necessarily exclude the former; rather
it changes the focus.
I’ll turn first to the role for exchange rate changes on the trade balance. The motivation
for the interest can be easily seen by inspecting the Chinese trade balance and the real exchange
rate, in Figure 19.
Before the surge in the Chinese trade surplus, few academic studies aimed at estimating
Chinese trade elasticities, at least over the relevant period. Many of the studies used data
spanning the 1980’s, which arguably pertained to an economy substantially different from that of
the 1990’s and 2000’s (e.g. Cerra and Dayal-Gulati, 1999; Cerra and Saxena, 2000). With
respect to the recent debate, one widely cited estimate from Goldman Sachs was for a Chinese
export price elasticity of 0.2 and an import price elasticity of 0.5 -- relatively low.
Menzie D. Chinn
EWC / KDI Conference, Honolulu, Hawaii, 19–20 August 2010
34
-.25
-.20
-.15
-.10
-.05
.00
.05
.10
-200
-100
0
100
200
300
400
500
00 01 02 03 04 05 06 07 08 09
Log CNY realexchange rate[left scale]
AnnualizedChinesetrade balance[irght axis]
Figure 19: Log CNY real effective exchange rate (down is appreciation, left scale), and annualized trade balance (in billions of USD, right scale). Source: IMF, International Financial Statistics and author’s calculations.
Garcia-Herrero and Koivu (2007) examine data over the 1995-2005 period, breaking the
data into ordinary and processing/parts imports and exports, and relate Chinese exports to the
world, imports and the real effective exchange rate, augmented by a proxy measure for the value-
added tax rebate on exports, and a capacity utilization variable. In both import and export
equations, the stock of FDI is included. One notable result they obtain is that for Chinese imports,
the real exchange rate coefficient has a sign opposite of anticipated in the full sample.
Additionally, they find that post-WTO entry, Chinese income and price elasticities for exports
rise considerably. On the import side, no such change is obvious with respect to the pre- and
post-WTO period.
Marquez and Schindler (2009) argue that the absence of useful price indices for Chinese
imports and exports requires the adoption of an alternative model specification. They treat the
variable of interest as world (import or export) trade shares, broken down into “ordinary” and
“parts and components”. Using monthly Chinese imports data from 1997 to July 2006, they find
ordinary trade-share income “elasticities” ranging from -0.021 to -0.001 (i.e., the coefficients are
in the wrong direction), and price “elasticities” from 0.013 to 0.021. The parts and components
price elasticities are in the wrong direction, and statistically significantly so. Interestingly, the
stock of FDI matters in almost all cases. Since the FDI stock is a smooth trend, it is not clear
Are We Really Between Scylla and Charybdis? Imbalances, Overheating, and the Recovery
EWC / KDI Conference, Honolulu, Hawaii, 19–20 August 2010
35
whether to attribute the effect explicitly to the effect of FDI, or to other variables that may be
trending upward over time, including productive capacity.
For export shares (ordinary goods), they find income elasticities ranging from 0.08 to
0.09, and price elasticities ranging from 0.08 to 0.068. For parts and components export share,
the income coefficient ranges from a 0.042 to 0.049. Their preferred specification implies that a
ten-percent real appreciation of the Chinese RMB reduces the Chinese trade balance between
$75 billion and $92 billion.
Thorbecke and Smith (2010) do not directly examine the implications for both imports
and exports, but do focus on the impact of RMB appreciation on exports, taking into account the
integration of the production chain in the region. Using a sample of 33 countries over the 1994-
2005 period, and a trade-weighted exchange rate that measures the impact of how bilateral
exchange rates affect imported input prices, they find that a 10% RMB appreciation in the
absence of changes in other East Asian currencies would result in a 3% decline in processed
exports and an 11% decline in ordinary exports. If other East Asian currencies appreciated in line
with the RMB, then the resulting change in the processed exports would be 9%.
Cheung, Chinn and Fujii (2010) trade equations over the 1993-2006 period, using the
Stock-Watson (1993) dynamic OLS regression method. The import and export data are
examined as aggregates, and as series disaggregated into ordinary and processing and parts trade.
The data are converted into real terms using a variety of deflators, including US CPI, PPI for
finished goods, and country specific Chinese price indices due to Gaulier et al. (2006), as well as
(for Chinese exports) Hong Kong re-export indices. They use the IMF’s CPI deflated trade-
weighted index, For a supply side variable for Chinese exports, they the capital stock in
manufacturing. This capital stock measure was calculated by Bai et al. (2006).
The results are less than definitive; the estimated income and price coefficients are not
typically significantly significant, although they point in the right direction. Only the supply
variable coefficient is statistically significant.
As suggested by Marquez and Schindler (2007), the differing behavior of ordinary and
processing exports suggests that aggregation is inappropriate. For ordinary exports, one finds that
the rest-of-the-world activity is not a good predictor of exports, while the price variable is an
important determinant. Using either Gaulier et al. (hereafter GUL-K) or HK indices, one finds
Menzie D. Chinn
EWC / KDI Conference, Honolulu, Hawaii, 19–20 August 2010
36
that the export elasticity of approximately 0.6. At the same time, a one percent increase in the
Chinese manufacturing capital stock induces between a 2.2 and 2.5% increase in real exports.
Cheung, Chinn and Fujii find that aggregate Chinese imports appear to respond strongly
to income, and in the expected direction. On the other hand, they replicate Marquez and
Schindler’s results with regard to the price elasticity. A weaker RMB induces greater imports,
rather than less. This is true also for ordinary imports. Only when moving to parts and processing
imports does one obtain some mixed evidence, and there the results are still toward finding a
wrong-signed coefficient. These results are pertain to data prior to the global recession; the
variation – or lack of variation – in the series is probably partly responsible for obtaining these
perverse or non-conclusive results.
Ahmed (2009) has used data that spans the recent recession and sharp drop-off and
rebound in Chinese imports and exports (1996Q1-2009Q2). Using first differences specifications
corresponding to equations (6) and (7), he finds that (in the long run) a one percentage point
increase in the annual rate of appreciation of the real exchange rate would have a cumulative
negative effect on real export growth of 1.8 percentage points, which is statistically significant.
A one percentage point increase in foreign consumption growth would increase export growth by
5.9 percentage points, which is also statistically significant, and appears to be an implausibly
large effect. Also, a 1 percentage point increase in the growth rate of the FDI capital stock,
comparable to the supply shift term in Cheung, Chinn and Fujii, raises export growth by a
cumulative and statistically significant 0.3 percentage points.
In practical terms, the difference in impacts is substantial. Consider estimates of China’s
export elasticities. Ahmed (2009) finds that after four years, 20% yuan appreciation induces a
$400 billion decrease in Chinese exports. In contrast Cheung, Chinn and Fujii (2010) find $50
billion impact.
Most recently, Cline (2010) has come out with new estimates indicating an equally large
impact from Chinese revaluation. He backs out an implied export elasticity of 1.27, assuming
that the import price elasticity is unity. In dollar terms, he calculates this as a 1 percent
appreciation induces a $45 billion decrease in the Chinese current account balance. This is a
substantially larger impact than obtained by Ahmed (2009).26
26 Cline’s specification is a regression of the current account to GDP ratio on the log real exchange rate, the growth differential between China and the rest-of-the-world, and a time trend, over the 2000-2010
Are We Really Between Scylla and Charybdis? Imbalances, Overheating, and the Recovery
EWC / KDI Conference, Honolulu, Hawaii, 19–20 August 2010
37
In contrast to the earlier debates regarding China’s burgeoning current account surplus,
most economists now accept that exchange rate adjustment in and of itself would not be
sufficient to shrink the Chinese current account balance to more sustainable levels. The results in
Chinn and Ito, discussed in section 2 of the paper, highlight the fact that fiscal policy could do
additional work. And certainly there is scope for additional government spending, given the
relatively low ratio of government debt to GDP. However, the cross section analysis conducted
by Chinn and Ito could not get at some of the factors of specific import for the Chinese economy.
After all, in their studies, the Chinese current account surplus was underpredicted – not by a
statistically significant amount, but by a couple percentage points. This outcome was a function
of the underprediction of national saving.
That means that we need to focus on the determinants of the private saving-investment
balance as a critical factor, in addition to elasticities and income, as suggested in a simple
Keynesian/ Mundell-Fleming framework.
Kuijs (2005) stressed corporate saving as the main culprit in the surge in the early 2000’s.
Prasad (2009) has focused on both corporate and household saving, while Ma and Yi (2010)
argue that currently all three of the components of saving – government, household and
corporate – have been abnormally high and rising. Figure 20 illustrates this observation.
Figure 20: Gross saving by sector, and across countries. Source: Figure 3 from Ma and Yi (2010).
period. The adjusted R-squared is 0.89, but no diagnostics are provided for serial correlation, heteroskedasticity, etc.
Menzie D. Chinn
EWC / KDI Conference, Honolulu, Hawaii, 19–20 August 2010
38
The biggest medium term issue seems to be the decreasing share of labor income in
Chinese GDP. This phenomenon, combined with the relatively high household saving rate,
means that merely trying to raise the household saving rate (by improving the social safety net,
and by increasing access to consumer credit) cannot in and of itself solve the problem. Hence,
rebalancing involves a rebalancing of the domestic shares of income, away from capital.
This point has become increasingly central as the debate has moved to whether wage
rates are rising. Those familiar with the Lewis (1954) and Fei-Ranis (1964) model of
development will recall that as wages rise, the share of income going to capital decreases. If the
propensity to save of labor is less than that of capitalists, then the saving rate should decline
(Kroeber, 2010). It might be that this process is happening as a natural outcome arising from the
exhaustion of labor close to the coastal provinces. Even if that is true, the process of raising
household savings (in aggregate terms, not just as a share of household income) can be
accelerated by aggressive government action – although even the most aggressive action will
take years to have a substantive impact.
In sum, there is scope for government policy to accelerate rebalancing. In the short term,
this involves faster currency appreciation; 27 over the longer term, allowing state owned
enterprises to pay dividends, reducing the monopoly power of the state owned corporations, and
accelerating the development of a social safety net and provision of social services (which will
reduce incentives for household saving, while decreasing government saving).
5. Conclusion
This tour of the world economy has necessarily given short shrift to many important
aspects of the rebalancing/overheating debate. The key points I glean from this analysis is that
there is little chance of overheating in the short term in the US, or other advanced countries.
Rather, the greater downside risk is of deflation. On the other hand, with the likelihood of a two-
speed global recovery becoming ever more apparent, the possibility of overheating is more
pronounced in the emerging markets.
Rebalancing of current accounts is not proceeding apace – at least not with current
policies. Continued consumer retrenchment in the US will aid in adjustment to a smaller US
27 There has been some debate whether such appreciation endangers China’s growth too much. On one side is Dani Rodrik (2008). On the other side is IMF (2010) and Eichengreen and Rose (2010).
Are We Really Between Scylla and Charybdis? Imbalances, Overheating, and the Recovery
EWC / KDI Conference, Honolulu, Hawaii, 19–20 August 2010
39
current account deficit, but Northern European fiscal retrenchment is not helpful. In addition, the
failure of the Chinese to resume currency appreciation (thus far) means that the quickest means
of effecting some adjustment has been put on hold. Yet additional measures, described in Chinn,
Eichengreen and Ito (2010), could further reinforce adjustment to sustainable current account
balances with sustainable growth.
References
Ahmed, Shaghil, 2009, “Are Chinese Exports Sensitive to Changes in the Exchange Rate?” International Finance Discussion Paper No. 987 (December).
Akerlof, George A. and Robert J. Shiller, 2009, Animal Spirits: How Human Psychology Drives the Economy and Why It Matters for Global Capitalism (Princeton: Princeton University Press).
Aizenman, Joshua and Jaewoo Lee, 2007, ‘International Reserves: Precautionary versus Mercantilist Views, Theory and Evidence,’ Open Economies Review, 18(2): 191-214.
Aizenman, Joseph and Nancy P. Marion, 2003, ‘The High Demand for International Reserves in the Far East: What’s Going On?’ Journal of the Japanese and International Economies, 17(3): 370–400.
Alfaro, Laura, Sebnem Kalemli-Ozcan and Vadym Volosovych, 2008. "Why Doesn't Capital Flow from Rich to Poor Countries? An Empirical Investigation," The Review of Economics and Statistics 90(2), pages 347-368, 01.
Bai, Chong-En Bai, Chang-Tai Hsieh, and Qingyi Qian, 2006, “Returns to Capital in China,” Brookings Papers in Economic Activity 2006(2).
Beck, Torsten, Asli Demirgüc-Kunt, Ross Levine, 2001, “A new database on financial development and structure,” in Demirgüc-Kunt, A., Levine, R. (Eds.) Financial Structure and Economic Growth: A Cross-Country Comparison of Banks, Markets, and Development. MIT Press, Cambridge, MA.
Bernanke, Benjamin, 2005. The Global Saving Glut and the U.S. Current Account. Remarks at the Sandridge Lecture, Virginia Association of Economics, Richmond, VA, March 10.
Bracke, Thierry and Michael Fidora, 2008, “Global Liquidity Glut or Global Savings Glut? A Structural VAR Approach,” ECB Working Papers No. 911 (Frankfurt: ECB).
Bussière, Matthieu, Marcel Fratzscher and Gernot J. Müller, 2005, “Productivity shocks, budget deficits and the current account,” ECB Working Paper No. 509 (Frankfurt: ECB).
Caballero, Ricardo, Emmanuel Farhi, and Pierre-Olivier Gourinchas, 2008a, “An Equilibrium Model of ‘Global Imbalances’ and Low Interest Rates,” American Economic Review, 98(1) (March): 358-393.
Caballero, Ricardo, Emmanuel Farhi, and Pierre-Olivier Gourinchas, 2008b, “Financial Crash, Commodity Prices, and Global Imbalances,” Brookings Papers on Economic Activity 2008(2) (Fall): 1-68.
Menzie D. Chinn
EWC / KDI Conference, Honolulu, Hawaii, 19–20 August 2010
40
Cerra, Valerie, and Anuradha, Dayal-Gulati, 1999, “China's Trade Flows-Changing Price Sensitivies and the Reform Process,” IMF Working Paper No. 99/01.
Cerra, Valerie, and Sweta Chaman Saxena, 2000, “An Empirical Analysis of China's Export Behavior,” IMF Working Paper No. 02/200.
Cheung, Yin-Wong, Menzie Chinn, Menzie, and Eiji Fujii, 2010, “China’s Current Account and Exchange Rate,” China's Growing Role in World Trade, edited by Robert Feenstra and Shang-Jin Wei (U.Chicago Press for NBER): 231-271.
Chinn, Menzie, 2010, “Supply Capacity, Vertical Specialization and Trade Costs: The Implications for Aggregate U.S. Trade Flow Equations,” mimeo (June). Revision of NBER Working Paper No. 11719 (October 2005).
Chinn, Menzie, 2005, “Getting Serious about the Twin Deficits,” Council Special Report No. 10 (New York: Council on Foreign Relations, September).
Chinn, Menzie, Barry Eichengreen and Hiro Ito, 2010, “Rebalancing Global Growth,” paper prepared for the World Bank’s Re-Growing Growth Project (August).
Chinn, Menzie and Jeffry Frieden, forthcoming, The Lost Decades: The Making of America’s Debt Crisis and the Long Recovery (manuscript to be published by W.W. Norton)
Chinn, Menzie and Jeffry Frieden, 2009, “Reflections on the Causes and Consequences of the Debt Crisis of 2008,” La Follette Policy Report 19(1) (Fall): 1-5.
Chinn, Menzie, and Hiro Ito, 2008, “Global Current Account Imbalances: American Fiscal Policy versus East Asian Savings,” Review of International Economics 16(3): 479-498.
Chinn, Menzie and Hiro Ito, 2007, “Current Account Balances, Financial Development and Institutions: Assaying the World ‘Savings Glut,’” Journal of International Money and Finance 26(4) (June): 546-569.
Chinn, Menzie and Hiro Ito, 2006. What Matters for Financial Development? Capital Controls, Institutions, and Interactions. Journal of Development Economics, 82: 163 – 192.
Chinn, Menzie and Jaewoo Lee, 2006, “Current Account and Real Exchange Rate Dynamics in the G-7 Countries,” Journal of International Money and Finance 25 (March): p. 257-274.
Chinn, Menzie and Eswar Prasad, 2003, “Medium-Term Determinants of Current Accounts in Industrial and Developing Countries: An Empirical Exploration,” Journal of International Economics 59(1) (January): 47-76.
Choi, Horag, Nelson C. Mark, and Donggyu Sul, 2008, “Endogenous Discounting, the World Saving Glut and the U.S. Current Account,” Journal of International Economics 75(1) (May): 30-53.
Clarida, Rich, 2005a, “Japan, China, and the U.S. Current Account Deficit,” CATO Journal 25(1) (Winter).
Clarida, Rich, 2005b, “Some Thoughts on ‘The Sustainability and Adjustment of Global Current Account Imbalances.’” Speech given at the Council on Foreign Relations, March 28.
Corsetti, Giancarlo and Gernot J. Müller, 2006, “Twin Deficits: Squaring Theory, Evidence and Common Sense,” Economic Policy 21(48) (October): 597–638.
Are We Really Between Scylla and Charybdis? Imbalances, Overheating, and the Recovery
EWC / KDI Conference, Honolulu, Hawaii, 19–20 August 2010
41
Council of Economic Advisers, 2009, Economic Report of the President, 2009 (Washington: U.S. GPO, January).
Dean, Judith M., K.C. Fung, and Zhi Wang, 2007, “Measuring the Vertical Specialization inChinese Trade,” Office of Economics Working Paper No. 2007-01-A, U.S. International Trade Commission.
Dooley, Michael, David Folkerts-Landau, and Peter Garber, 2003, “An Essay on the Revived Bretton Woods System,” NBER Working Paper, No. 9971 (September 2003).
Dooley, Michael, David Folkerts-Landau, and Peter Garber, 2008, “Direct Investment, Rising Real Wages, and the Absorption of Excess Labor in the Periphery,” in Rich Clarida (editor), G-7 Current Account Imbalances: Sustainability and Adjustment (University of Chicago Press for NBER).
Dooley, Michael, Jeffrey Frankel, and Donald Mathieson, 1987, “International Capital Mobility in Developing Countries vs. Industrialized Countries: What Do Saving-Investment Correlations Tell Us?” IMF Staff Papers 34(3) (September): 503-530.
Dowling, Thomas, Marcello Estevão, and Evridiki Tsounta, 2010, “The Great Recession and Structural Unemployment,” United States: Selected Issues Paper, IMF Country Report No. 10/248 (July).
Eichengreen, Barry and Andrew Rose, 2010, “27 Up: The Implications for China of Abandoning its Dollar Peg,” mimeo (UC Berkeley).
Eichengreen, Barry, and Kevin H. O’Rourke, 2010, “A Tale of Two Depressions: What do the new data tell us?” VoxEU (March 8, 2010).
Fei, John C. H. and Gustav Ranis, 1964, Development of the Labor Surplus Economy: Theory and Policy, (Richard D. Irwin).
Feldstein, Martin and Charles Horioka, 1980. Domestic Saving and International Capital Flows. Economic Journal 90, p. 314 – 329.
Garcia-Herrero, Alicia and Tuuli Koivu, 2007, “Can the Chinese Trade Surplus Be Reduced through Exchange Rate Policy?” BOFIT Discussion Papers No. 2007-6 (Helsinki: Bank of Finland, March).
Gaulier, Guillaume, Françoise Lemoine and Deniz Ünal, 2006, “China’s Emergence and the Reorganization of Trade Flows in Asia,” CEPII Working Paper No. 2006-05 (Paris: CEPII, March).
Greenspan, Greenspan, 2005, “Current Account,” Presentation at Advancing Enterprise 2005 Conference, London, England, February 4.
Gruber, Joseph, and Steven Kamin, 2007, “Explaining the Global Pattern of Current Account Imbalances,” Journal of International Money and Finance 26 (June): 500-522.
Gruber, Joseph and Steven Kamin, 2009, “Do Differences in Financial Development Explain the Global Pattern of Current Account Imbalances?” Review of International Economics 17(4): 667–688.
Hummels, David, Jun Ishii and Kei-Mu Yi, 2001, “The Nature and Growth of Vertical Specialization in World Trade,” Journal of International Economics 54:75-96.
Menzie D. Chinn
EWC / KDI Conference, Honolulu, Hawaii, 19–20 August 2010
42
Iacovone, Leonardo and Veronika Zavacka, 2009, “Banking crises and exports: Lessons from the past for the recent trade collapse,” in Richard Baldwin (ed.), The great trade collapse: Causes, Consequences and Prospects (VoxEU/CEPR, November).
IMF, 2009, “Chapter 4: How Linkages Fuel the Fire: The Transmission of Financial Stress from Advanced to Emerging Economies,” World Economic Outlook, April 2009.
IMF, 2010, “Chapter 4: Getting the Balance Right: Transitioning Out of Sustained Current Account Surpluses,” World Economic Outlook, April 2010.
Jeanne, Olivier and Romain Ranciere, 2006, ‘The Optimal Level of International Reserves for Emerging Market Economies: Formulas and Applications,’ IMF Working Paper WP/06/229 (Washington, D.C.: IMF, October).
Johnson, Simon, and James Kwak, 2010, 13 Bankers: The Wall Street Takeover and the Next Financial Meltdown (New York: Pantheon).
Koopman, Robert, Zhi Wang and Shang-Jin Wei, 2008, How Much of Chinese Exports Is Really Made in China? Assessing Domestic Value-Added when Processing Trade Is Pervasive,” NBER Working Paper No. 14109 (June).
Kuijs, Louis, 2005, “Investment and Saving in China,” World Bank Working Paper WPS3633.
Lane, Phillip, Gian-Maria Milesi-Ferretti, 2006, “The External Wealth of Nations Mark II: Revised and Extended Estimates of Foreign Assets and Liabilities, 1970 – 2004,” IMF Working Paper WP/06/69 (Washington, D.C.: IMF).
Levchenko, Andrei A., Logan Lewis, and Linda L. Tesar, “The Collapse of International Trade During the 2008-2009 Crisis: In Search of the Smoking Gun,” October 2009. Prepared for the IMF Economic Review special issue, “Economic Linkages, Spillovers and the Financial Crisis.”
Lewis, W. Arthur, 1954, “Economic Development with Unlimited Supplies of Labor,”. Manchester School of Economic and Social Studies 22: 139-91
Ma, Guonan, and Wang Yi, 2010, “China´s High Saving Rate: Myth and Reality,” BIS Working Paper No. 312 (June).
Marquez, Jaime and John W. Schindler, 2007, “Exchange-Rate Effects on China’s Trade,” Review of International Economics 15(5), 837–853. Also International Finance and Discussion Papers No. 861 (Washington, D.C: Federal Reserve Board, May).
Mendoza, Enrique G., Vincenzo Quadrini, and Jose-Victor Ríos-Rull, 2009. “Financial Integration, Financial Deepness and Global Imbalances,” Journal of Political Economy 117(3): 317-416.
Mora, Jesse, and William M. Powers, 2009, “Decline and gradual recovery of global trade financing: US and global perspectives,” in Richard Baldwin (ed.), The Great Trade Collapse: Causes, Consequences and Prospects (VoxEU/CEPR, November).
Nason, James M. and John H. Rogers, 2006, “The Present Value Model of the Current Account Has Been Rejected: Round Up the Usual Suspects,” Journal of International Economics 68 (January): 159-187.
Are We Really Between Scylla and Charybdis? Imbalances, Overheating, and the Recovery
EWC / KDI Conference, Honolulu, Hawaii, 19–20 August 2010
43
Obstfeld, Maurice and Kenneth Rogoff, 1996, Foundations of International Macroeconomics. Cambridge: MIT Press.
Obstfeld, Maurice and Kenneth Rogoff, 2009, “Global Imbalances and the Financial Crisis: Products of Common Causes,” paper presented at Federal Reserve Bank of San Francisco Asia Economic Policy Conference, Santa Barbara, CA, October 18-20.
Pakko, Michael R., 1999, “The U.S. Trade Deficit and the ‘New Economy,’” Federal Reserve Bank of St. Louis Review 81(5): 11–20.
Prasad, Eswar and Shang-Jin Wei, 2005, “The Chinese Approach to Capital Inflows: Patterns and Possible Explanations,” IMF Working Paper, No. 05/79 (April).
Rajan, Raghuram G., and Zingales, Luigi, 1998, “Financial Dependence and Growth,” American Economic Review, 88: 559 – 586.
Rissman, Ellen R., 2009, “Employment growth: Cyclical movements or structural change?” Chicago Fed Economic Perspectives 2009Q4.
Rodrik, Dani, 2008, “The Real Exchange Rate and Economic Growth,” Brookings Papers on Economic Activity (Fall): 365–412.
Roubini, Nouriel, and Stephen Mihm, 2010, Crisis Economics: A Crash Course in the Future of Finance (New York: The Penguin Press).
Sheffrin, Steven and Wing Thye Woo, 1990a, “Present Value Tests of an Intertemporal Model of the Current Account," Journal of International Economics 29 (Nov.): 237-253.
Sheffrin, Steven and Wing Thye Woo, 1990b, “Testing an Optimizing Model of the Current Account via the Consumption Function,” Journal of International Money and Finance (June).
Sinn, Stefan, 1990, “Net External Zsset Positions of 145 Countries,” Kieler Studien 234 (Kiel: Kiel University).
Stiglitz, Joseph E., 2010, Freefall: America, Free Markets, and the Sinking of the World Economy (New York: W.W. Norton).
Thorbecke, Willem, 2006,”How Would an Appreciation of the Renminbi Affect the US Trade Deficit with China?” BE Press Macro Journal 6(3): Article 3.
Thorbecke, Willem and Gordon Smith, 2010, “How Would an Appreciation of the RMB and Other East Asian Currencies Affect China’s Exports?” Review of International Economics.
Truman, Edwin, 2005, “Budget and external deficits: not twins but the same family,” paper presented at the Symposium on the "Revived Bretton Woods System: A New Paradigm for Asian Development?" (Federal Reserve Bank of San Francisco, February).
Valetta, Robert and Aisling Cleary, 2008, “Sectoral Reallocation and Unemployment,” FRBSF Economic Letter 2008-32; October 17, 2008.
World Bank, 2010a, China Quarterly Report (Beijing: World Bank, June).
World Bank, 2010b, Global Economic Prospects (Washington, DC: World Bank).