The Comparative Analysis of Technical Efficiency of Jasmine Rice Production in Thailand Using Survey and Measurement Data. Aree Wiboonpongse Songsak Sriboonchitta Chiang Mai University, Thailand. At Fourth International Conference on Agriculture Statistics, - PowerPoint PPT Presentation
1 The Comparative Analysis of Technical Effi ciency of Jasmine Rice Production in Thail and Using Survey and Measurement Data Aree Aree Wiboonpongse Wiboonpongse Songsak Sriboonchitta Songsak Sriboonchitta Chiang Mai University, Chiang Mai University, Thailand Thailand At Fourth International Conference on At Fourth International Conference on Agriculture Statistics, Agriculture Statistics, October 22-24, 2007, Beijing, China October 22-24, 2007, Beijing, China
Transcript
1
The Comparative Analysis of Technical Efficiency of Jasmine Rice Production in Thailand Using Survey and Measurement Data
Chiang Mai University, ThailandChiang Mai University, Thailand
At Fourth International Conference on Agriculture Statistics, At Fourth International Conference on Agriculture Statistics,
October 22-24, 2007, Beijing, ChinaOctober 22-24, 2007, Beijing, China
2
OutlineOutline
11 . .Significance of the StudySignificance of the Study
22 . .Key questions and objectivesKey questions and objectives
33 . .Data and Model SpecificationsData and Model Specifications
44 . .Empirical ResultsEmpirical Results
55 . .Policy Implications and ConclusionsPolicy Implications and Conclusions
3
• Jasmine rice of Thailand is of premium quality and its export share has increased substantially due to its high price.
• However, its production yield can be regarded as low compared to those of other varieties.
• Questions are naturally asked whether Thai Jasmine rice productivity can be improved.
• Most studies on agricultural production models have used survey rather than measurement data from cropcut samples and record keeping.
• Survey data obtained from interview using questionnaire are subject to errors in recalling of farmers.
• Errors in the yield data could be caused by incorrect recall as well as the loss during harvesting.
1. Significance of the Study1. Significance of the Study
4
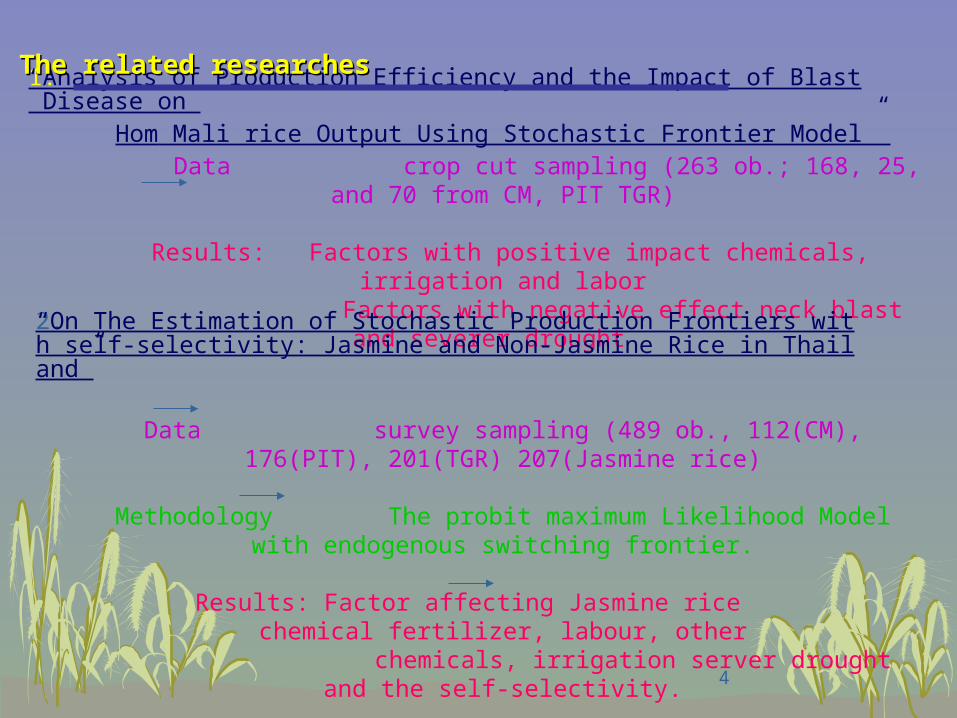
1. “Analysis of Production Efficiency and the Impact of Blast Disease on Hom Mali rice Output Using Stochastic Frontier Model”
Data crop cut sampling (263 ob.; 168, 25, and 70 from CM, PIT TGR)
Results: Factors with positive impact chemicals, irrigation and labor Factors with negative effect neck blast and severer drought
The related researchesThe related researches
2.“On The Estimation of Stochastic Production Frontiers with self-selectivity: Jasmine and Non-Jasmine Rice in Thailand”
Data survey sampling (489 ob., 112(CM), 176(PIT), 201(TGR) 207(Jasmine rice)
Methodology The probit maximum Likelihood Model with endogenous switching frontier.
Results: Factor affecting Jasmine rice chemical fertilizer, labour, other chemicals, irrigation server drought and the self-selectivity.
5
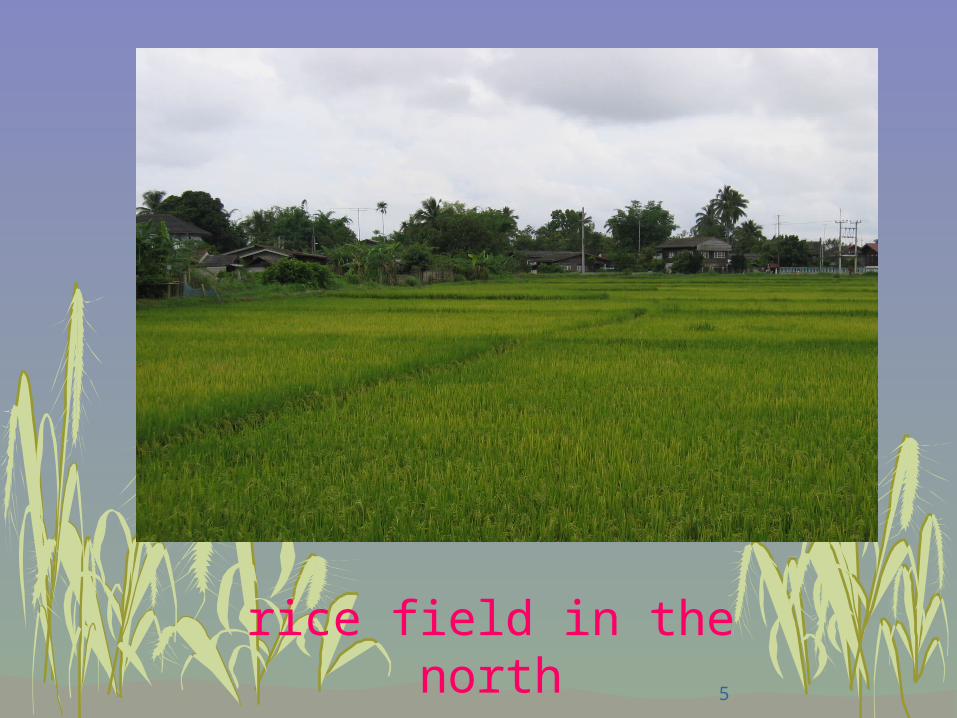
rice field in the north
6blast neck blast
7
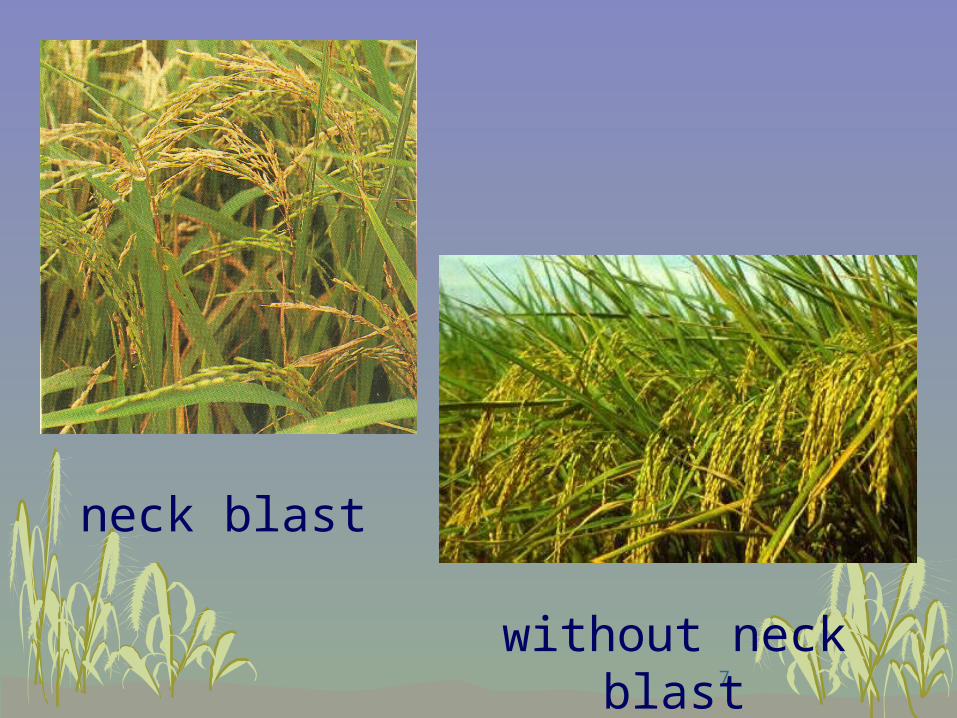
neck blast
without neck blast
8
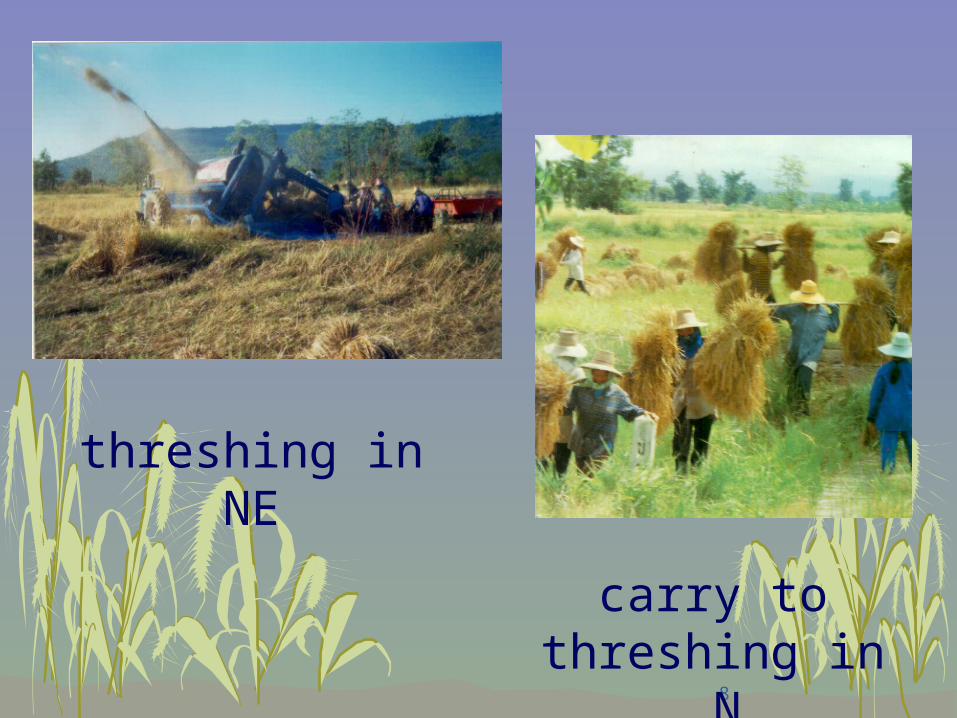
threshing in NE
carry to threshing in N
9
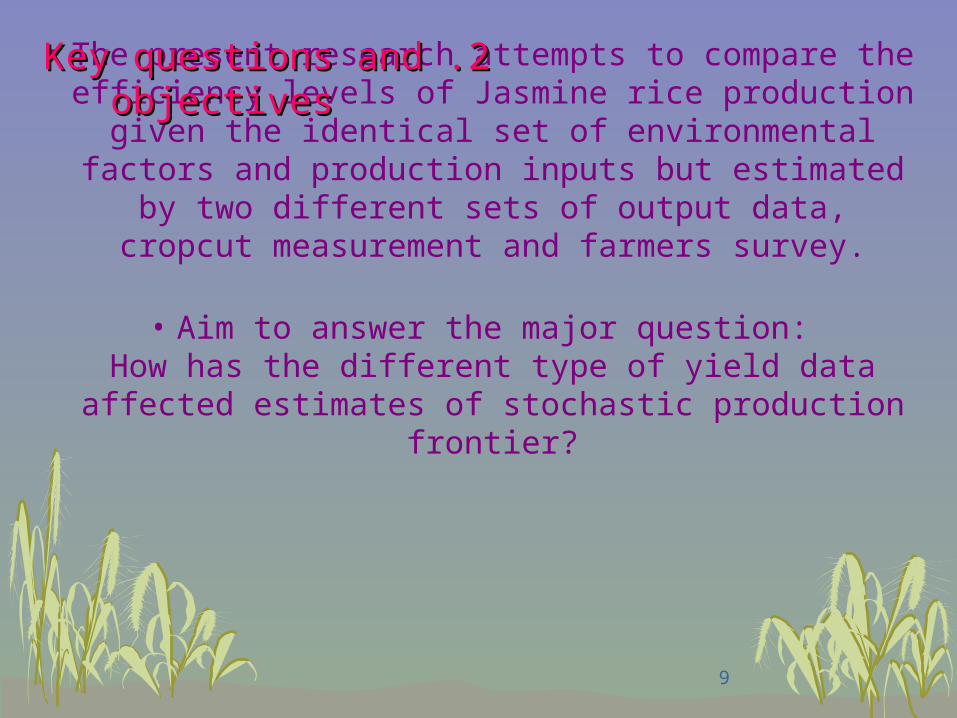
• The present research attempts to compare the efficiency levels of Jasmine rice production given the identical set of environmental factors and production inputs but estimated by two different sets
of output data, cropcut measurement and farmers survey.
• Aim to answer the major question:How has the different type of yield data affected estimates of
stochastic production frontier?
22 . .Key questions and objectivesKey questions and objectives
10
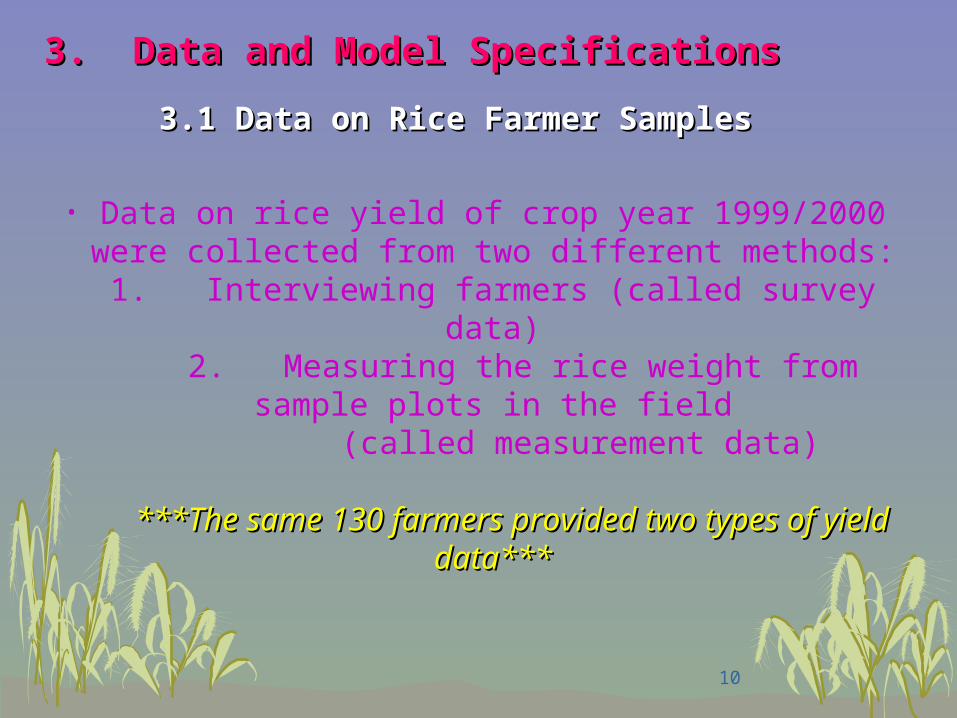
• Data on rice yield of crop year 1999/2000 were collected from two different methods:
1. Interviewing farmers (called survey data) 2. Measuring the rice weight from sample plots in the field
(called measurement data)
***The same 130 farmers provided two types of yield data******The same 130 farmers provided two types of yield data***
3. Data and Model Specifications3. Data and Model Specifications
3.1 Data on Rice Farmer Samples3.1 Data on Rice Farmer Samples
11
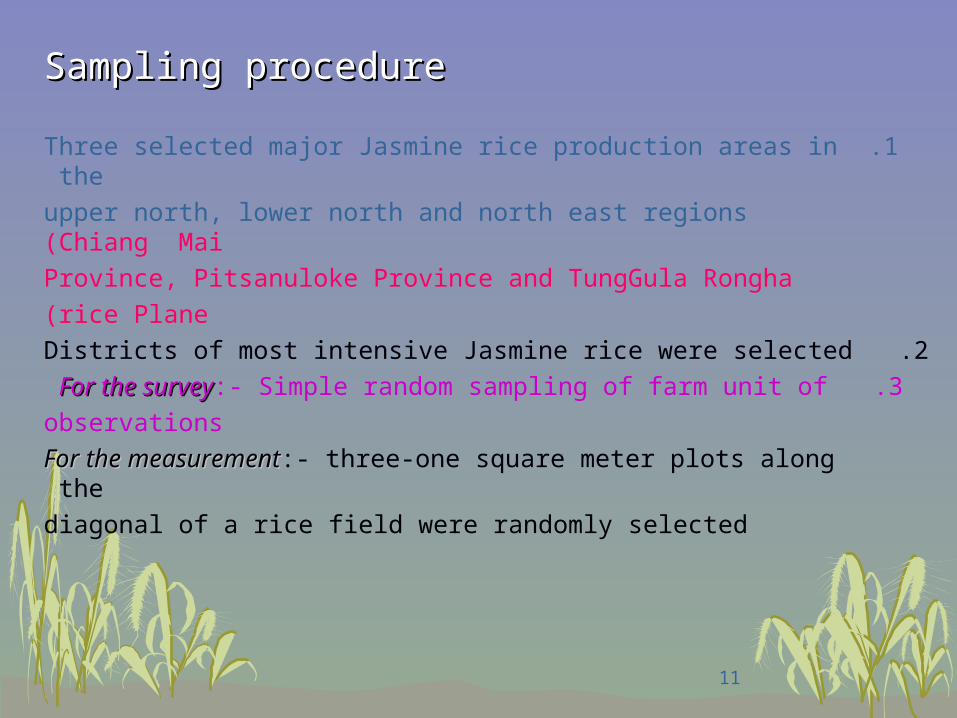
Sampling procedureSampling procedure
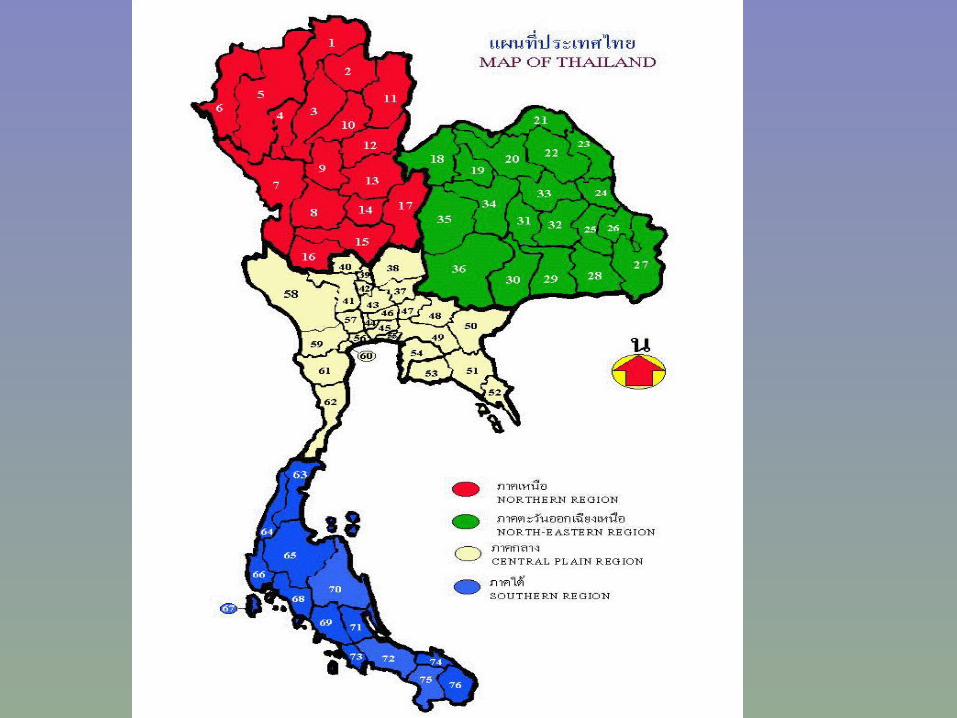
1 .Three selected major Jasmine rice production areas in the
upper north, lower north and north east regions (Chiang Mai
Province, Pitsanuloke Province and TungGula Rongha
rice Plane(
2. Districts of most intensive Jasmine rice were selected
3 .For the surveyFor the survey:- Simple random sampling of farm unit of
observations
For the measurementFor the measurement:- three-one square meter plots along the
diagonal of a rice field were randomly selected
13
VariableSample Mean
Sample Standard Deviation
MinimumMaximum
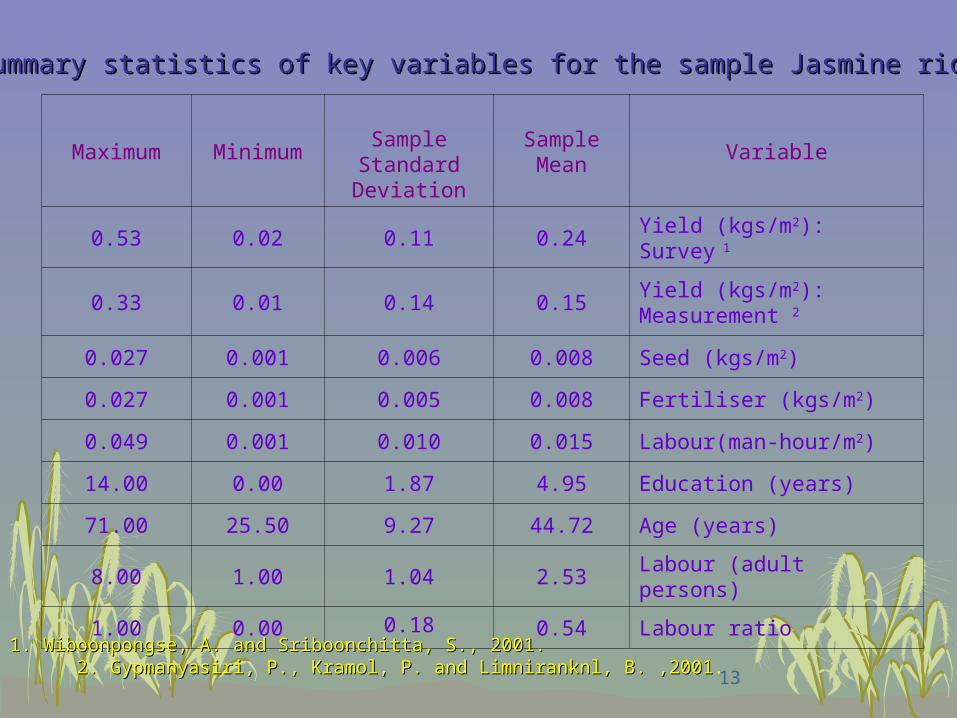
Yield (kgs/m2): Survey 10.240.110.020.53
Yield (kgs/m2): Measurement 20.150.140.010.33
Seed (kgs/m2)0.0080.0060.0010.027
Fertiliser (kgs/m2)0.0080.0050.0010.027
Labour(man-hour/m2)0.0150.0100.0010.049
Education (years)4.951.870.0014.00
Age (years)44.729.2725.5071.00
Labour (adult persons)2.531.041.008.00
Labour ratio0.540.180.001.00
Sources: 1. Wiboonpongse, A. and Sriboonchitta, S., 2001.Sources: 1. Wiboonpongse, A. and Sriboonchitta, S., 2001. 2. Gypmanyasiri, P., Kramol, P. and Limniranknl, B. ,20012. Gypmanyasiri, P., Kramol, P. and Limniranknl, B. ,2001.
Table 1: Summary statistics of key variables for the sample Jasmine rice farmersTable 1: Summary statistics of key variables for the sample Jasmine rice farmers
14
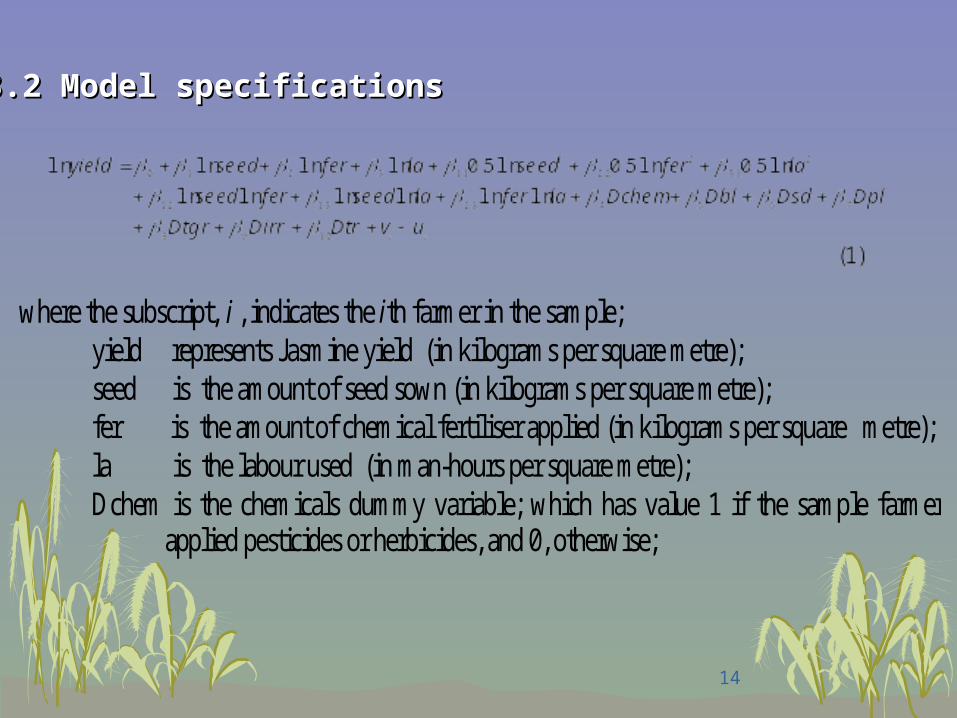
where the subscript, i , indicates the ith farmer in the sample; yield represents Jasmine yield (in kilograms per square metre);
seed is the amount of seed sown (in kilograms per square metre); fer is the amount of chemical fertiliser applied (in kilograms per square metre); la is the labour used (in man-hours per square metre); Dchem is the chemicals dummy variable; which has value 1 if the sample farmer
applied pesticides or herbicides, and 0, otherwise;
3.2 Model specifications3.2 Model specifications
15
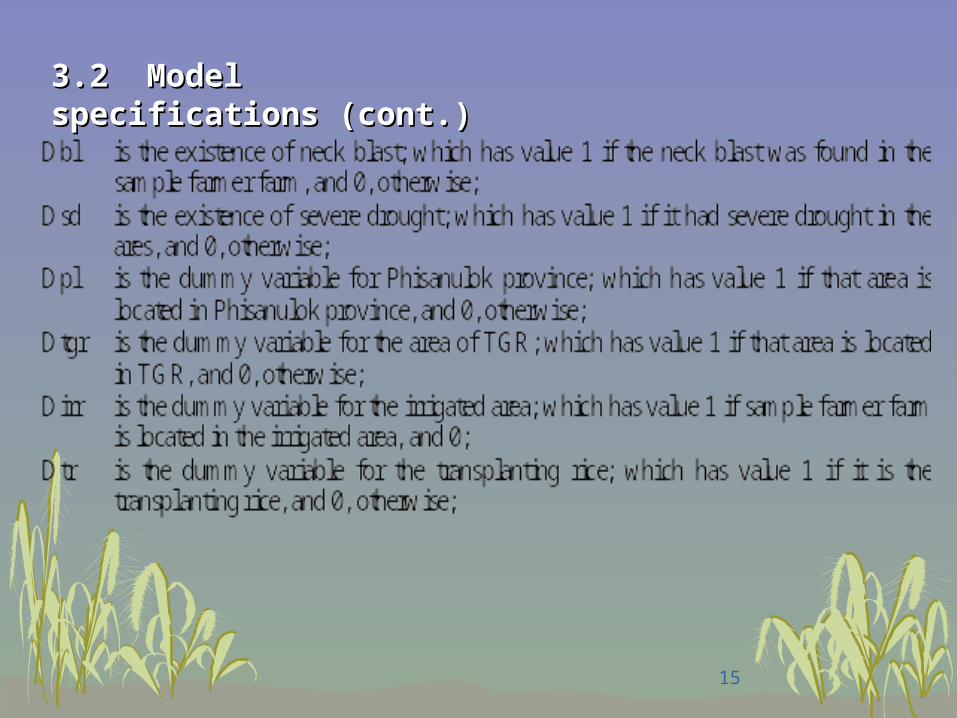
3.2 Model specifications3.2 Model specifications (cont.) (cont.)
16
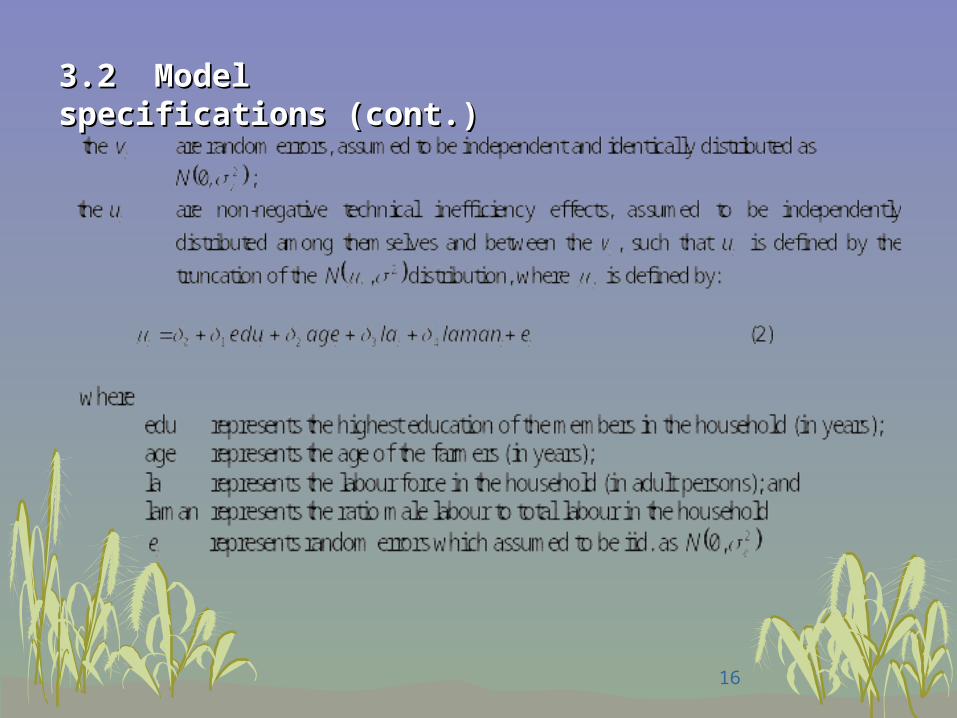
3.2 Model specifications3.2 Model specifications (cont.) (cont.)
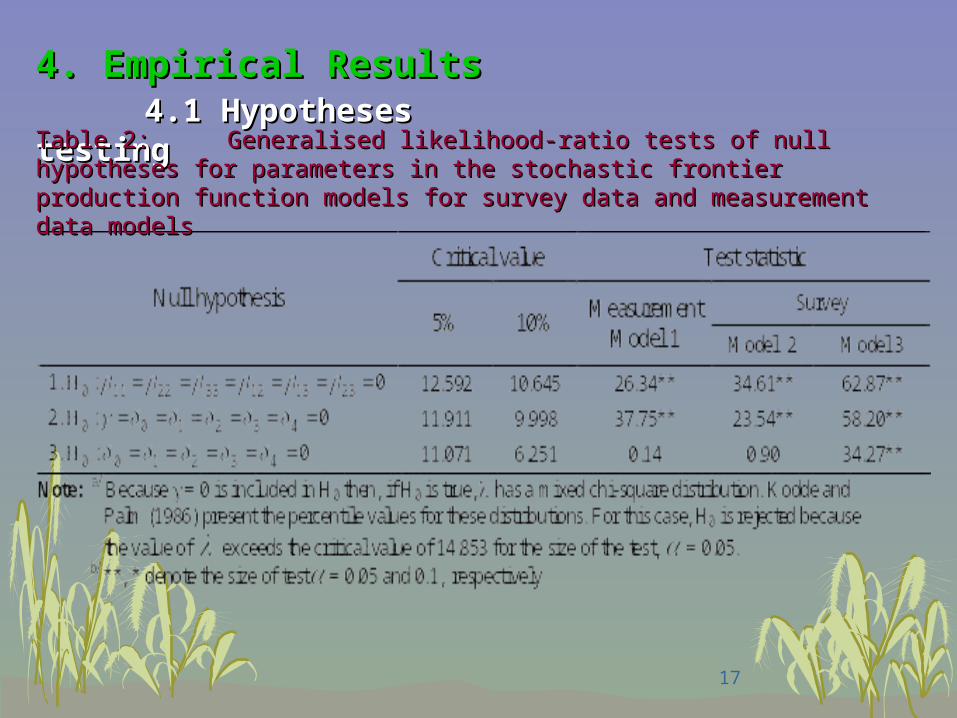
Table 2: Table 2: Generalised likelihood-ratio tests of null hypotheses for parameters in the Generalised likelihood-ratio tests of null hypotheses for parameters in the stochastic frontier production function models for survey data and measurement data modelsstochastic frontier production function models for survey data and measurement data models
18
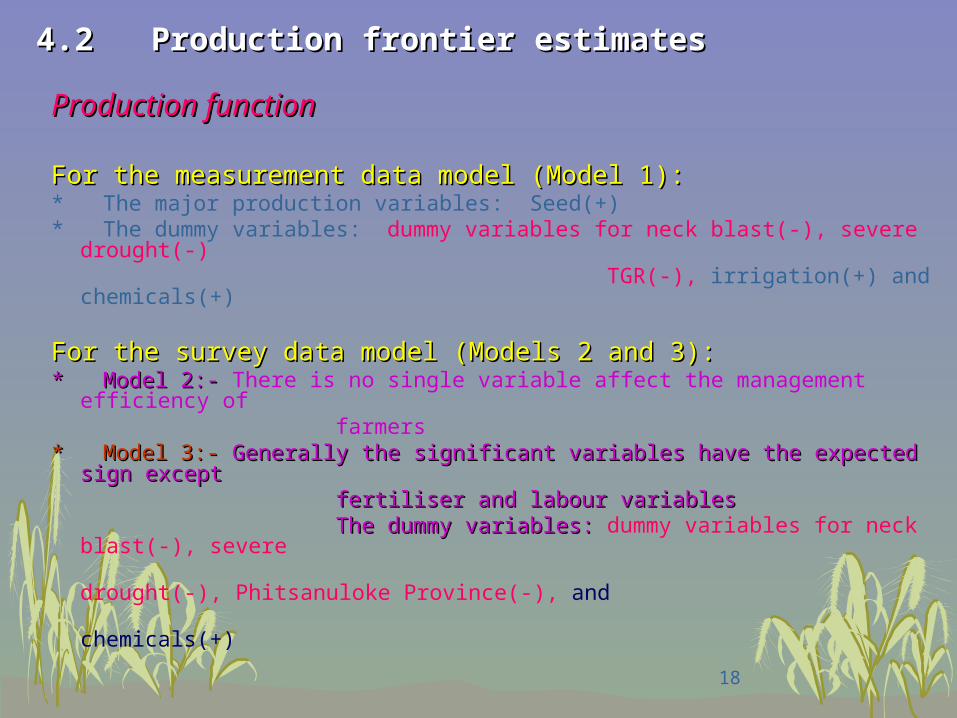
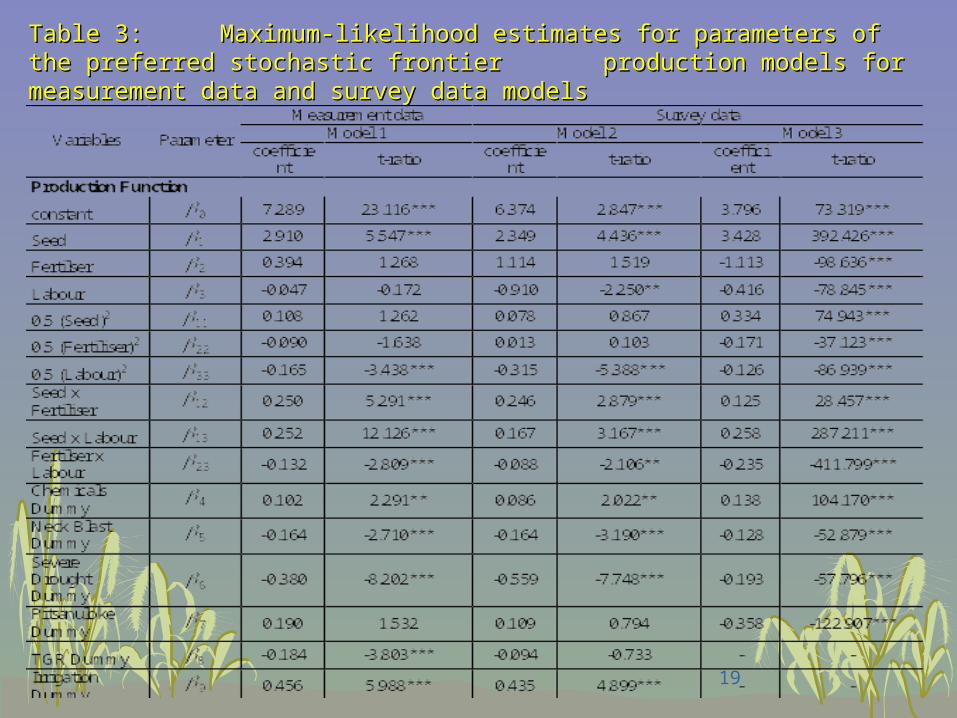
Production functionProduction function
For the measurement data model (Model 1):For the measurement data model (Model 1):* The major production variables: Seed(+)* The dummy variables: dummy variables for neck blast(-), severe drought(-) TGR(-), irrigation(+) and chemicals(+)
For the survey data model (Models 2 and 3):For the survey data model (Models 2 and 3):* * Model 2:- Model 2:- There is no single variable affect the management efficiency of farmers* * Model 3:-Model 3:- Generally the significant variables have the expected sign except Generally the significant variables have the expected sign except fertiliser and labour variables fertiliser and labour variables The dummy variables: The dummy variables: dummy variables for neck blast(-), severe drought(-), Phitsanuloke Province(-), and chemicals(+)
4.2 Production frontier estimates4.2 Production frontier estimates
19
Table 3: Table 3: Maximum-likelihood estimates for parameters of the preferred stochastic frontier Maximum-likelihood estimates for parameters of the preferred stochastic frontier production models for measurement data and survey data modelsproduction models for measurement data and survey data models
20
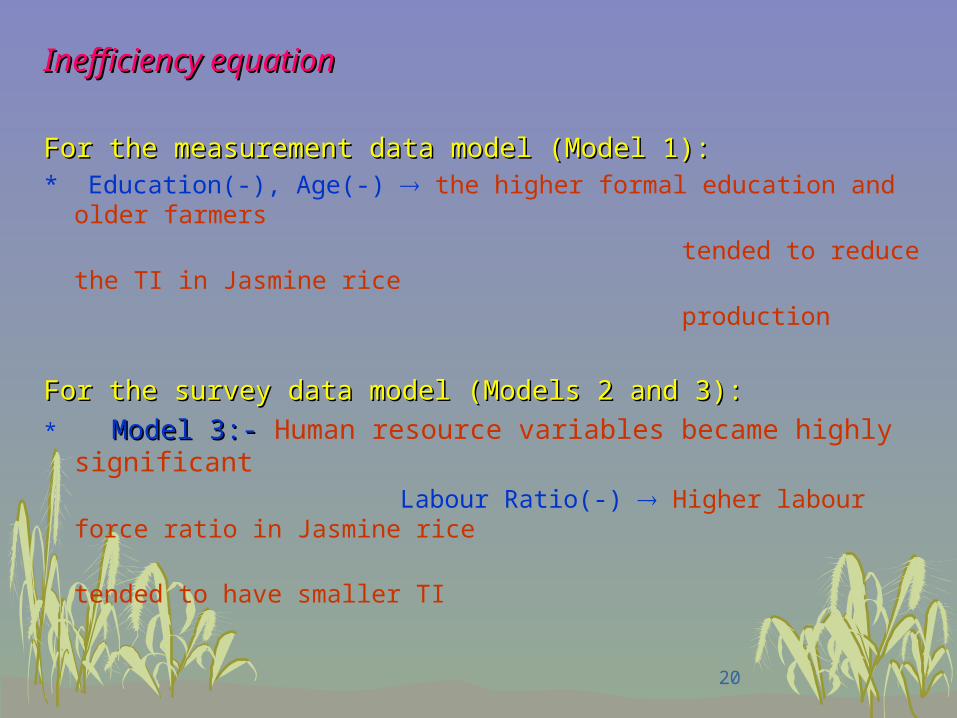
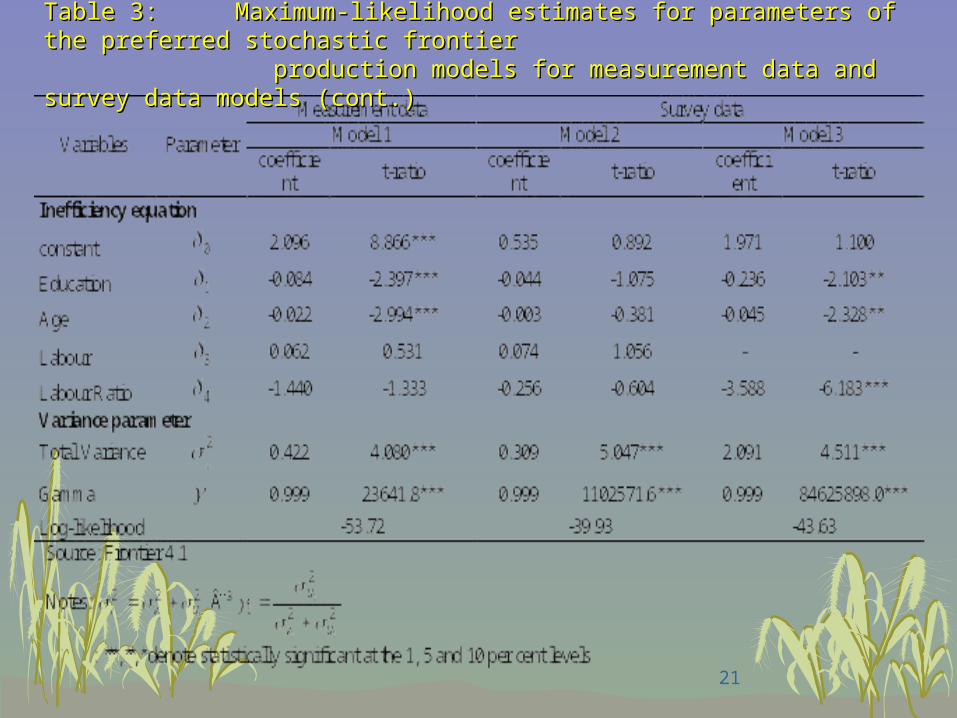
Inefficiency equationInefficiency equation
For the measurement data model (Model 1):For the measurement data model (Model 1):* Education(-), Age(-) the higher formal education and older farmers
tended to reduce the TI in Jasmine rice
production
For the survey data model (Models 2 and 3):For the survey data model (Models 2 and 3):
* Model 3:-Model 3:- Human resource variables became highly significant Labour Ratio(-) Higher labour force ratio in Jasmine rice
tended to have smaller TI
21
Table 3: Table 3: Maximum-likelihood estimates for parameters of the preferred stochastic frontier Maximum-likelihood estimates for parameters of the preferred stochastic frontier production models for measurement data and survey data modelsproduction models for measurement data and survey data models (cont.) (cont.)
22
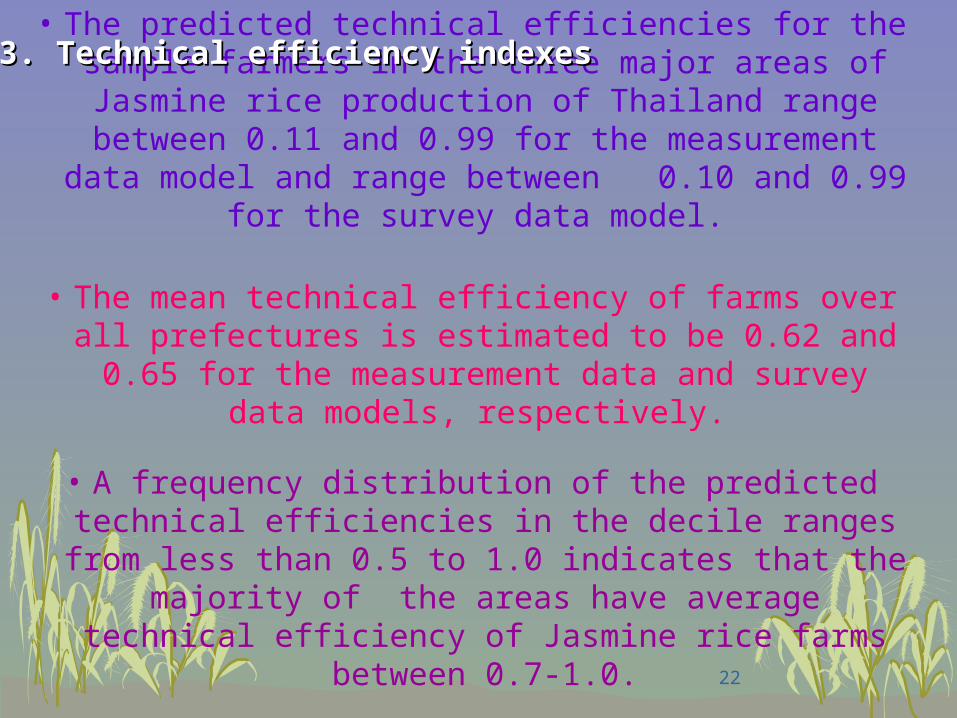
• The predicted technical efficiencies for the sample farmers in the three major areas of Jasmine rice production of Thailand range
between 0.11 and 0.99 for the measurement data model and range between 0.10 and 0.99 for the survey data model.
• The mean technical efficiency of farms over all prefectures is estimated to be 0.62 and 0.65 for the measurement data and survey
data models, respectively.
• A frequency distribution of the predicted technical efficiencies in the decile ranges from less than 0.5 to 1.0 indicates that the
majority of the areas have average technical efficiency of Jasmine rice farms between 0.7-1.0.
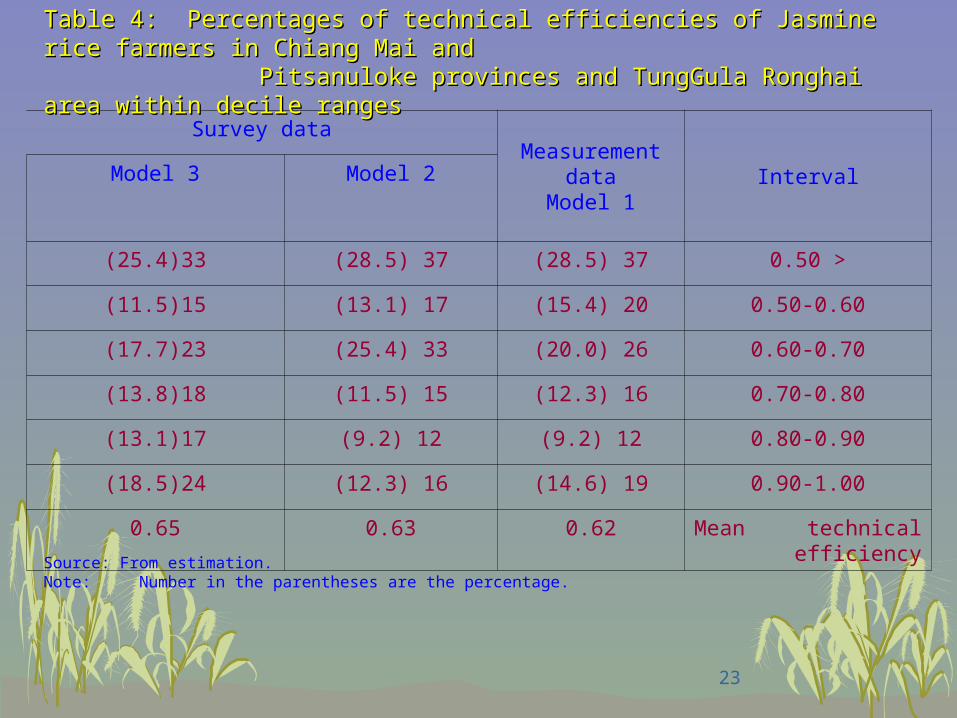
Table 4: Percentages of technical efficiencies of Jasmine rice farmers in Chiang Mai Table 4: Percentages of technical efficiencies of Jasmine rice farmers in Chiang Mai and and Pitsanuloke provincesPitsanuloke provinces and TungGula Ronghai area and TungGula Ronghai area within decile ranges within decile ranges
Source: From estimation.Note: Number in the parentheses are the percentage.
24
• Rice productivity in the study areas was determined primarily by the amount of seeds sown and the responsiveness of the rice
variety to chemical fertilizer input.
• The availability of irrigation would definitely enhance yield.
• Rice productivity can be seriously impaired at the presence of severe drought and neck blast.
• Development of human resource to possess good management practice ability is seen to be crucial for the increase in production efficiency, which can be materialized by learning and experience accumulation processes as well as by increasing the proportion of
male labour input.
5. Policy implications and conclusions5. Policy implications and conclusions
25
* The comparative study between the use of survey data and measurement data to estimate the technical efficiency provided the evidence of extremely different conclusions from the use of different dependent variables despite the identical sets of independent parameters.
* Use of measurement data appeared to provide results which are not sensitive to the model specification at the given severity of multicollinearity.
5. Policy implications and conclusions (cont.)5. Policy implications and conclusions (cont.)
26
*Apart from the robust variables, the remaining weak determinants would generate different values of estimate and
which are highly sensitive to model specification.
*Agricultural economists and users of survey data, therefore , should be cautioned to pay special attention to survey design so
as to minimize error.
*The test of model specification might be an effective means to detect the errors in estimation due to the choice of variables .
5. Policy implications and conclusions (cont.)5. Policy implications and conclusions (cont.)