220
Ares Investor Day August 12, 2021

Ares Investor DayAugust 12, 2021

Ares Management Corporation Investor Day 2021 - Not for Publication or Distribution 2
Important NoticeThis presentation is prepared for Ares Management Corporation (NYSE: ARES) for the benefit of its public stockholders. This presentation is solely for information purposes in connection with evaluating the business, operationsand financial results of Ares Management Corporation (“Ares”) and certain of its affiliates. Any discussion of specific Ares entities is provided solely to demonstrate such entities’ role within the Ares organization and theircontribution to the business, operations and financial results of Ares. This presentation does not constitute, and shall not be construed as, an offer to buy or sell, or the solicitation of an offer to buy or sell, any securities,investment funds, vehicles or accounts, investment advice, or any other service by Ares of any of its affiliates or subsidiaries.This presentation may not be referenced, quoted or linked by website, in whole or in part, except as agreed to in writing by Ares.This presentation contains “forward looking statements” within the meaning of Section 21E of the Securities Exchange Act of 1934, as amended, that are subject to risks and uncertainties. Forward-looking statements can beidentified by the use of forward-looking words such as "outlook," "believes," "expects," "potential," "continues," "may," "will," "should," "seeks," "predicts," "intends," "plans," "estimates," "anticipates," "foresees" or negative versions ofthose words, other comparable words or other statements that do not relate to historical or factual matters. Actual outcomes and results could differ materially from those suggested by this presentation due to the impact of manyfactors beyond the control of Ares, including but not limited to the impact of the COVID-19 pandemic and the pandemic's impact on the U.S. and global economy, as well as those described in the “Risk Factors” section of our filingswith the Securities and Exchange Commission (“SEC”). These factors should not be construed as exhaustive and should be read in conjunction with other cautionary statements that are included in our periodic filings and in thispresentation. Any such forward-looking statements are made pursuant to the safe harbor provisions available under applicable securities laws and speak only as of the date of this presentation. Ares assumes no obligation toupdate or revise any such forward-looking statements, whether as a result of new information, future developments or otherwise, except as required by law.The following slides contain summaries of certain financial and statistical information about Ares. The information contained in this presentation is summary information that is intended to be considered in the context of Ares’SEC filings and other public announcements that Ares may make, by press release or otherwise, from time to time. In addition, this presentation contains information about Ares, its affiliated funds and certain of their respectivepersonnel and affiliates, and their respective historical performance. You should not view information related to the past performance of Ares and its affiliated funds as indicative of future results. Certain information set forthherein includes estimates and targets and involves significant elements of subjective judgment and analysis. No representations are made as to the accuracy of such estimates or targets or that all assumptions relating to suchestimates or targets have been considered or stated or that such estimates or targets will be realized. Further, certain performance information, unless otherwise stated, is before giving effect to management fees, carried interestor incentive fees and other expenses.Nothing in this presentation constitutes the provision of tax, accounting, financial, investment, regulatory, legal or other advice by Ares or its advisors. Management uses certain non-GAAP financial measures, including AssetsUnder Management, Fee Paying Assets Under Management, Fee Related Earnings and Realized Income to evaluate Ares’ performance and that of its business segments. Management believes that these measures provide investorswith a greater understanding of Ares’ business and that investors should review the same supplemental non-GAAP financial measures that management uses to analyze Ares’ performance. The measures described hereinrepresent those non-GAAP measures used by management, in each case, before giving effect to the consolidation of certain funds within its results in accordance with GAAP. These measures should be considered in addition to,and not in lieu of, Ares’ financial statements prepared in accordance with GAAP. The definitions and reconciliations of these measures to the most directly comparable GAAP measures, as well as an explanation of why we use thesemeasures, are included in the Appendix. Amounts and percentages may reflect rounding adjustments and consequently totals may not appear to sum. For the definitions of certain terms used in this presentation, please refer tothe "Glossary" slide in the Appendix.Certain information discussed in this presentation was derived from third party sources and has not been independently verified and, accordingly, Ares makes no representation or warranty in respect of this information andassumes no responsibility for independent verification of such information.This may contain information sourced from Bank of America, used with permission. BANK OF AMERICA IS LICENSING THE ICE BOFA INDICES AND RELATED DATA “AS IS,” MAKES NO WARRANTIES REGARDING SAME, DOES NOTGUARANTEE THE SUITABILITY, QUALITY, ACCURACY, TIMELINESS, AND/OR COMPLETENESS OF THE ICE BOFA INDICES OR ANY DATA INCLUDED IN, RELATED TO, OR DERIVED THEREFROM, ASSUMES NO LIABILITY IN CONNECTION WITH THEIRUSE, AND DOES NOT SPONSOR, ENDORSE, OR RECOMMEND ARES MANAGEMENT, OR ANY OF ITS PRODUCTS OR SERVICES.This may contain information obtained from third parties, including ratings from credit ratings agencies such as Standard & Poor’s. Reproduction and distribution of third party content in any form is prohibited except with theprior written permission of the related third party. Third party content providers do not guarantee the accuracy, completeness, timeliness or availability of any information, including ratings, and are not responsible for any errors oromissions (negligent or otherwise), regardless of the cause, or for the results obtained from the use of such content. THIRD PARTY CONTENT PROVIDERS GIVE NO EXPRESS OR IMPLIED WARRANTIES, INCLUDING, BUT NOT LIMITED TO,ANY WARRANTIES OF MERCHANTABILITY OR FITNESS FOR A PARTICULAR PURPOSE OR USE. THIRD PARTY CONTENT PROVIDERS SHALL NOT BE LIABLE FOR ANY DIRECT, INDIRECT, INCIDENTAL, EXEMPLARY, COMPENSATORY, PUNITIVE,SPECIAL OR CONSEQUENTIAL DAMAGES, COSTS, EXPENSES, LEGAL FEES, OR LOSSES (INCLUDING LOST INCOME OR PROFITS AND OPPORTUNITY COSTS OR LOSSES CAUSED BY NEGLIGENCE) IN CONNECTION WITH ANY USE OF THEIRCONTENT, INCLUDING RATINGS. Credit ratings are statements of opinions and are not statements of fact or recommendations to purchase, hold or sell securities. They do not address the suitability of securities or the suitability ofsecurities for investment purposes, and should not be relied on as investment advice.The statements contained in this presentation are made as of June 30, 2021, unless another time is specified in relation to them, and access to this presentation at any given time shall not give rise to any interpretation that therehas been no change in the facts set forth in this presentation since that date. Certain historical amounts within this presentation were prepared to conform with our accounting policies that were implemented in each of therespective historical years. Therefore, historical amounts may be prepared under different accounting policies than currently implemented. In certain cases where indicated, Assets Under Management, employee statistics, officelocations and fund related information, includes the acquisition of Black Creek Group, which closed on July 1, 2021.Note: For Additional Important Disclosure Information, please refer to the Footnotes and Endnotes of each section of this presentation, as needed.

Ares Management Corporation Investor Day 2021 - Not for Publication or DistributionAres Management Corporation Investor Day 2021 - Not for Publication or Distribution
Carl DrakeHead of Public Investor Relations and Communications
Welcome & Agenda

Ares Management Corporation Investor Day 2021 - Not for Publication or Distribution 4
Goals for Today
What makes us different and how we drive strong and consistent performance Our Differentiation
How we build businesses and where we see ourselves by 2025 in our large end marketsOur Growth Opportunities
How we are all striving to lead by making a positive impact for all stakeholdersOur Impact
We want our investors to understand…

Ares Management Corporation Investor Day 2021 - Not for Publication or DistributionAres Management Corporation Investor Day 2021 - Not for Publication or Distribution
Ares Investor Day AgendaTime (EDT) Topic Presenter
8:00am – 8:05am Welcome & Agenda Carl Drake
I. Business, Strategic and Financial Discussion
8:05am – 8:20am Guiding Principles of Ares Tony Ressler
8:20am – 8:45am Strategy Overview & Outlook Michael Arougheti
8:45am – 9:10am Financial Review & Outlook Jarrod Phillips
9:10am – 9:25am Business Development & Client Strategy Ryan Berry
II. Core Business Overview
9:25am – 9:50am Credit Overview & Outlook Kipp deVeer
9:50am – 10:10am* Private Equity Overview & Outlook Matt Cwiertnia & Scott Graves
10:20am – 10:40am Real Estate Overview & Outlook David Roth
III. Emerging Businesses
10:40am – 10:55am Secondary Solutions Overview & Outlook Frank Borges
10:55am – 11:10am New Platforms Overview & Outlook Michael Arougheti
IV. Impact at Ares
11:10am - 11:30am Stakeholder Impact Michael Arougheti, Adam Heltzer, Indhira Arrington & Michelle Armstrong
11:30am - 12:00pm Closing Remarks and Ares Q&A Michael Arougheti and Speaker Panel
*There will be a short break after the Private Equity Overview & Outlook section.

Ares Management Corporation Investor Day 2021 - Not for Publication or DistributionAres Management Corporation Investor Day 2021 - Not for Publication or Distribution
Tony ResslerCo-Founder and Executive Chairman
Guiding Principles of Ares

Ares Management Corporation Investor Day 2021 - Not for Publication or Distribution 7
Guiding Principles of Ares
1
6
Assets Follow Performance If We Deliver Consistent Performance, Growth Will Follow
…Resulting InPrinciples
2 Transparency with Investors Builds Trust and Develops a True Sense of Partnership
3 Commitment to Hiring and Retaining Good People High Performing, Collaborative Culture with Low Turnover
4 Power of the Platform Each Group Benefitting the Others
5 Direct Origination Focus Differentiated and Defensible Investor Returns
Ability to Invest Well In All Markets Flexible Approach and Consistent Performance

Ares Management Corporation Investor Day 2021 - Not for Publication or Distribution 8
Ares Key Milestones
Ares Founded as a Credit Manager
1997
Our history highlights our thoughtful organic and inorganic growth which has created benefits for our stakeholders
2002 - 2004
Expanded into Private Equity
& Direct Lending
2011 - 20141Q-12: ARES reaches
$50B of AUM
Added Real Estate
Completed IPO
2017 - 20182Q-17: ARES reaches
$100B of AUM
NamedMichael Arougheti CEO
New Credit Group Heads
Among the first in alternative industry
to transition to C-Corp structure
2020 - 20211Q-21: ARES reaches
$200B of AUM
Strategic Acquisitions:
SSG, Aspida, Landmark & Black Creek
AUM amounts include funds managed by Ivy Hill Asset Management, L.P., a wholly owned portfolio company of Ares Capital Corporation and registered investment adviser. Past performance is not indicative of future results.

Ares Management Corporation Investor Day 2021 - Not for Publication or Distribution 9
Large Investment Footprint Across U.S., Europe and Asia-Pacific
As of June 30, 2021. Offices and professionals include the acquisition of Black Creek Group which closed on July 1, 2021. Please refer to Endnotes for additional important information.
Over 30 Global Offices1
695+ Investment Professionals2
~1,000 Support Professionals2
250+ Strategy, RM & IR Professionals2

Ares Management Corporation Investor Day 2021 - Not for Publication or Distribution 10
Co-Founders and Other Executive Officers
Represents 10 or more years at Ares or the acquired platform
GroupHeads/EMC
Average Tenure at Ares1
17 Years
18 Years
Ryan BerryChief Marketing and Strategy
Officer
Experience: 18Ares: 16
Kipp deVeerDirector, Head of Credit Group
Experience: 26Ares: 17
Naseem Sagati AghiliGeneral Counsel & Secretary
Experience: 15Ares: 12
Jarrod PhillipsChief Financial Officer
Experience: 21Ares: 6
Antony ResslerDirector, Co-Founder and
Executive Chairman
Experience: 36Ares: 24
Michael AroughetiDirector, Co-Founder, Chief
Executive Officer and President
Experience: 28Ares: 17
David KaplanDirector, Co-Founder & Co-Chairman of Private Equity
Group
Experience: 32Ares: 18
Bennett RosenthalDirector, Co-Founder & Co-Chairman of Private Equity
Group
Experience: 35Ares: 23
Credit
# of Partners2: 48Average Tenure: 11 years
Private Equity
# of Partners2: 29Average Tenure: 10 years
Real Estate2
# of Partners2: 11Average Tenure1: 12 years
Secondary Solutions
# of Partners2: 16Average Tenure1: 18 years
Strategic Initiatives
# of Partners2: 12Average Tenure1: 8 years
Tim HavilandCo-Head of Secondary Solutions
Experience: 36Ares1: 36
Michael SmithCo-Head of
Credit Group
Experience: 26Ares: 17
Mitch GoldsteinCo-Head of
Credit Group
Experience: 27Ares: 16
Edwin WongHead of
Ares SSG
Experience: 30Ares1: 12
Bill BenjaminHead of Real Estate Group
Experience: 35Ares1: 26
Frank BorgesCo-Head of Secondary Solutions
Experience: 39Ares1: 23
Matt CwiertniaCo-Head
Private Equity
Experience: 25Ares: 16
Scott GravesCo-Head
Private Equity
Experience: 27Ares: 5
Jessica DosenGlobal Head of
Human Resources
Experience: 19Ares: 10
As of June 30, 2021.1. Includes years at firm acquired by Ares.2. Number of investment professional partners.
Asset Management Is a Talent Business and We Have a Deep Bench
Strategy, Relationship Management &
Investor Relations# of Partners: 19
Average Tenure: 12 years
Business Operations
# of Partners: 13Average Tenure: 8 years

Ares Management Corporation Investor Day 2021 - Not for Publication or Distribution 11Ares Management Corporation Investor Day 2021 - Not for Publication or Distribution
GrowingAUM
$262B1
in a ~$280T2
Industry
Strong Investor Base
~1,790Direct
Institutional Investors3
Diversified Strategies
~20Investment
Strategies in
5 Groups
Quality Team
2,000Employees4 on
5 Continents
Strong Stock Performance
Since Inception
24%Annualized
Total Return vs. 14.5% for
Russell 10005
Leading Global Manager That Has Performed For Its Investors
As of June 30, 2021. AUM, Direct Institutional Investors & Employees include the acquisition of Black Creek Group, which closed on July 1, 2021. Past performance is not indicative of future results. Please refer to Endnotes for additional important information.

Ares Management Corporation Investor Day 2021 - Not for Publication or DistributionAres Management Corporation Investor Day 2021 - Not for Publication or Distribution
Michael AroughetiCo-Founder, Chief Executive Officer and President
Strategy Overview & Outlook

Ares Management Corporation Investor Day 2021 - Not for Publication or Distribution 13
We Believe Our Platform Provides Advantages and a Strong Foundation for Growth
13Ares Management Corporation Investor Day 2021 – Not for Publication or Distribution
Our integrated and collaborative
mindset drives our success
~50% employee ownership of the company,
$2 billion employee fund investments and carried interest
Focus on long-term growth informs how we manage
the business and serve our clients
Deep Team with a
Collaborative Approach
Alignment of Interests with Fund Investors
and Stockholders
Consistent Business
Model
Culture of Growth
Management fee-centric model creates
consistent growth

Ares Management Corporation Investor Day 2021 - Not for Publication or Distribution 14
$177
$510 $259
$676
2015 Q2-21 LTM
We Operate with a Repeatable Business Model That Drives Strong Outcomes
$23
$56
2015 Q2-21 LTM
680
1,790
2015 Q2-21
Direct Institutional Investors
$9.0
$28.2
2015 Q2-21 LTM
Deployment($ in billions)
Realized Income($ in millions)
Annual Fundraising($ in billions)
+23%CAGR
+19%CAGR+19%
CAGR
+18%CAGR
FRE Realized Net Performance Income/ Realized Net Investment Income
$12.93
$63.59
$7.11
2015 Q2- 21
$70.70
Stock Price
Cumulative Dividends
ARES Total Return
+36%CAGR
As of June 30, 2021.1. Direct Institutional Investors includes the acquisition of Black Creek Group, which closed on July 1, 2021.
1

Ares Management Corporation Investor Day 2021 - Not for Publication or Distribution 15
Multi-Decade Trend Towards Private Capital Will Continue As Investors Expand Into Alternatives
Information as of June 30, 2021. Please refer to Endnotes for additional important information.
• Multi-decade bank consolidation begins in 1990s
• Increased regulation pushes remaining banks to focus on larger borrowers
Bank Retrenchment from Middle Market
• 50% decline in number of public companies since 19961
• ~7x higher average market capitalization of public stocks vs. 20+ years ago2
• Market share of the high yield market for $300m tranche size or less declined from 39% in 2004 to <2% in 20213
Public Markets Shift to Larger Companies • Private equity assets under
management increase 8xsince 20024
• Private markets outpaced public markets growth by 4x over the past 20 years5
Growth in Private Equity
• Private debt experiencesincreasing demand from borrowers
• Investors begin increasing allocations to private debt
Growth in Private Debt

Ares Management Corporation Investor Day 2021 - Not for Publication or Distribution 16
$30
$23
$6$1
$11$8
Liquid Credit US DirectLending
EuropeanDirect Lending
AlternativeCredit
Private Equity Real Estate
We Have Meaningfully Diversified and Expanded our Business Lines
AUM at IPO in 2014: $77 billion1
58 22 8 5 9 42Total
144
Our focus on investment performance and broadening the platform has supported significant asset growth since our IPO
1. IPO occurred on 5/1/2014, AUM and funds as of 3/31/2014.
Number of Funds & Accounts

Ares Management Corporation Investor Day 2021 - Not for Publication or Distribution 17
We Have Meaningfully Diversified and Expanded our Business Lines
$36
$69
$48
$15
$31$33
$19
$10
Liquid Credit US DirectLending
EuropeanDirect Lending
AlternativeCredit*
Private Equity Real Estate SecondarySolutions
StrategicInitatives
Our focus on investment performance and broadening the platform has supported significant asset growth since our IPO
92 60 30 28 22 52 35655 17
AUM Today: $262 billion1
Number of Funds & Accounts
Total
As of June 30, 2021. AUM & Funds includes the acquisition of Black Creek Group, which closed on July 1, 2021. Please refer to Endnotes for additional important information.*Excludes approximately $800 million included in Global Liquid Credit AUM.

Ares Management Corporation Investor Day 2021 - Not for Publication or Distribution 18
Our Repeatable Formula for Successful Growth and Expansion
Grow throughInnovation
& Business Building
Leverage the Power of Our Platform to deliver
strong performance
Invest in Large and Growing Markets
where we add value and have Substantial
Room to Expand
1 2 3

Ares Management Corporation Investor Day 2021 - Not for Publication or Distribution 19
We Are Market Leaders In Large, Global MarketsWe have meaningful opportunities for growth with fragmented competition
Information as of June 30, 2021. Strategy AUM numbers may not add to total due to rounding. Please refer to Endnotes for additional important information. *Total Private Equity AUM of $31 billion is comprised of Private Equity and Infrastructure.**AUM includes the acquisition of Black Creek Group, which closed on July 1, 2021.
Addressable Market($ in trillions)
Ares AUM($ in billions)
Ares Share of the Addressable Market
Credit $10.61 $168 1.6%
Private Equity $4.22 $278* 0.6%
Infrastructure $0.83 $48* 0.5%
Real Estate $304 $33** 0.1%
Secondary Solutions $6.25 $191 0.3%
Insurance $386 $39 <0.1%
Asia-Pacific Direct Lending $0.37 $710 2.5%
Total Addressable Market $90 trillion $262 billion**11 0.3%

Ares Management Corporation Investor Day 2021 - Not for Publication or Distribution 20
We Are Significantly Outpacing the Growth in Our Market
6%
8%
20%
Global ClientAsset Growth
Alternative MarketAsset Growth
Ares AUM Growth
2016 – 2020 Annual Growth
4%
9%
20%
Global ClientAsset Growth
Alternative MarketAsset Growth
Ares TargetedAUM Growth
2020 – 2025 Targeted Annual Growth
Our growth has been > 2x the alternative market which is growing faster than overall market for AUM. The alternative market is expected to continue to grow 2x the overall market for AUM and ARES is targeting to continue such growth
Projections and forward-looking statements are not reliable indicators of future events and there is no guarantee that such activities will occur as expected or at all. Please refer to Endnotes for additional important information. *Alternative assets include Hedge Funds, Private Equity, Real Estate and Infrastructure.
1 1* 1 1*

Ares Management Corporation Investor Day 2021 - Not for Publication or Distribution 21
Our Repeatable Formula for Successful Growth and Expansion
Grow throughInnovation
& Business Building
Leverage the Power of Our Platform to deliver
strong performance
Invest in Large and Growing Markets
where we add value and have Substantial
Room to Expand
1 2 3

Ares Management Corporation Investor Day 2021 - Not for Publication or Distribution 22
Our Scaled Platform Drives Strong Performance Across Funds
Sourcing
Scaled Portfolio
InformationEdge
Global Direct Sourcing Drives Proprietary Deal Flow and Outcomes
• Broad market coverage enables better relative value lens and asset selectivity
• Lead/active role improves control over outcomes
Large Existing Portfolio Provides Pipeline Of New Activity
• Flexible capital solutions• Power of incumbency• Source new opportunities across
Ares' platform
Cross-Platform Collaboration Enables Valuable Information Sharing
• Cross-vertical sourcing, due diligence and idea sharing
• Cross-populating ICs with diverse professionals
• Global markets committees sharing industry trends
Extensive sourcing, information advantages and opportunities within our portfolio help drive strong performance
Ares Management Corporation Investor Day 2021 - Not for Publication or Distribution 23
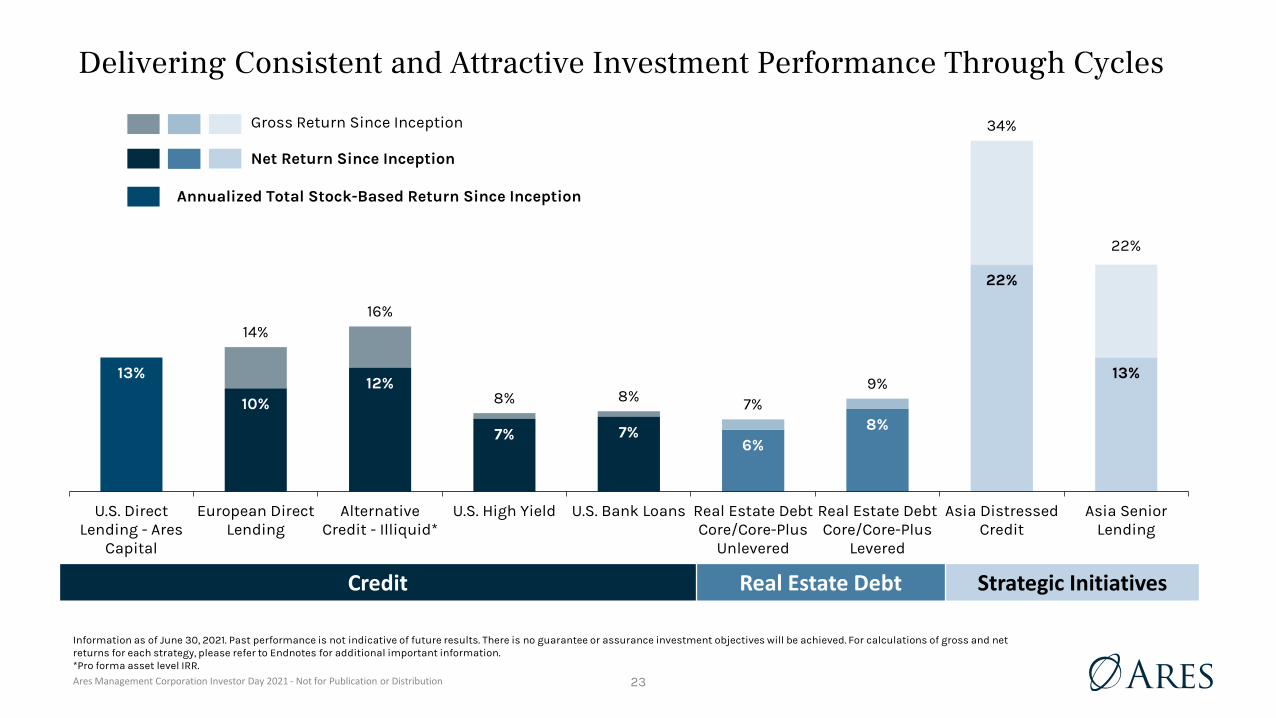
13%
10%12%
7% 7%6%
8%
22%
13%
14%16%
8% 8% 7%9%
34%
22%
U.S. DirectLending - Ares
Capital
European DirectLending
AlternativeCredit - Illiquid*
U.S. High Yield U.S. Bank Loans Real Estate DebtCore/Core-Plus
Unlevered
Real Estate DebtCore/Core-Plus
Levered
Asia DistressedCredit
Asia SeniorLending
Delivering Consistent and Attractive Investment Performance Through Cycles
Net Return Since Inception
Gross Return Since Inception
Information as of June 30, 2021. Past performance is not indicative of future results. There is no guarantee or assurance investment objectives will be achieved. For calculations of gross and net returns for each strategy, please refer to Endnotes for additional important information. *Pro forma asset level IRR.
Credit Real Estate Debt Strategic Initiatives
Annualized Total Stock-Based Return Since Inception

Ares Management Corporation Investor Day 2021 - Not for Publication or Distribution 24
52%
15%13% 14%
18% 17%
25%
68%
22%
19% 19%21%
24%
33%
SpecialOpportunities
CorporateOpportunities
Infrastructure &Power
U.S. Value-AddEquity
European Value-Add Equity
Private Equity Real Estate
Net Return Since Inception
Gross Return Since Inception
Private Equity Real Estate Equity Secondary Solutions
Delivering Consistent and Attractive Investment Performance Through Cycles
Information is as of June 30, 2021 with the exception of Secondary Solutions which is as of December 31, 2020. Past performance is not indicative of future results. There is no guarantee or assurance investment objectives will be achieved. For calculations of gross and net returns for each strategy, please refer to Endnotes for additional important information.

Ares Management Corporation Investor Day 2021 - Not for Publication or Distribution 25
Our Repeatable Formula for Successful Growth and Expansion
Grow throughInnovation
& Business Building
Leverage the Power of Our Platform to deliver
strong performance
Invest in Large and Growing Markets
where we add value and have Substantial
Room to Expand
1 2 3

Ares Management Corporation Investor Day 2021 - Not for Publication or Distribution 26
Identify Market Needs or Inefficiencies in
Large Addressable Segments
Add High Quality Leadership and Investment Talent
Integrate Into the Ares Culture
Create Value / Power of Platform
Expand Product Suite
Expand Distribution to New Channels & Geographies
Provide Flexible Growth Capital
Capture Revenue Synergies
Drive Scale and Earnings
We Build Businesses Using a Consistent Playbook for Results
We use our business building playbook for both organic and inorganic growth opportunities
Phase 1 Phase 2 Phase 3
Identify Opportunity and Build Platform
Integrate Platform and Provide Flexible Capital
Expansion and Drive Scale

Ares Management Corporation Investor Day 2021 - Not for Publication or Distribution 27
De Novo Team Build Strategic Acquisitions
Examples of Using Our Growth Playbook For Organic & Inorganic Opportunities
Growth Playbook EU DL ASOF Indicus AREA SSG Aspida Landmark Black Creek
Invest In Large Addressable End Markets High Quality Leadership Team and Investment Talent
Integrate Into the Ares Culture Ares’ Power of the Platform Enhances Value Creation Provide Flexible Capital To Build New Products
Capture Revenue Synergies
Expand Investment Product Suite Expand Product Distribution to New Channels & Geographies
Drive Scale and Earnings Impact
Significant Opportunity To Drive Further
Growth
Does not include organic product extensions using existing teams such as SDL, PCS, and Pathfinder series

Ares Management Corporation Investor Day 2021 - Not for Publication or Distribution 28
2003 2004 2005 2006 2007 2008 2009 2010 2011 2012 2013 2014 2015 2016 2017 2018 2019 2020 2021
History of Innovation, Business Building and Strategic Acquisitions
Initial AUM1 Current AUM2
Since Initial AUM
CAGR
Multi Asset
Alternative Credit (CLO Equity & Asset Backed)
Alt Credit (Pathfinder Series)
European Liquid Credit
Junior Debt (PCS Series)
Sports, Media & Entertain.
Senior Debt (SDL Series)
US Direct Lending (ARCC & SMAs)
European Direct Lending (ACE Series & SMAs)
High Yield Products
Capital Markets Bank Loans & High YieldLiquid Credit$36
Alt. Credit$15*
DirectLending
$117
Liquid Credit
$4
Alt. Credit$0.8
DirectLending
$0.3
13%
35%
44%
Special Opportunities (ASOF Series)
Climate Infrastructure Series
Corporate Private Equity (ACOF Series)Private Equity
$31Energy & Power (US Power Series)
Private Equity
$0.724%
U.S. Opportunistic Real Estate SeriesEurope Value Add Real Estate Series Europe Opportunistic Real Estate Series
Real Estate Debt (ACRE & SMAs)
Core/Core Plus Equity
Open-End Core Debt Strategy
Real Estate
$33
U.S. Value Add Real Estate SeriesReal Estate
$1.4 39%
Secondaries – PE SeriesSecondaries – RE SeriesSecondaries – Infra Series
SecondarySolutions
$20
SecondarySolutions
$19NA
Information as of June 30, 2021, unless otherwise stated. Strategy AUM numbers may not add to total due to rounding. Please refer to Endnotes for additional important information.*Excludes approximately $800 million included in Global Liquid Credit AUM.
($ in billions)
Following strategic acquisitions and de novo builds we add adjacent strategies to drive scale and profitability
StrategicInitiatives
$10Aspida InsuranceAsian Secured Lending Series
Asian Special Situations SeriesStrategicInitiatives
$6.945%
Ares Acquisition Corporation

Ares Management Corporation Investor Day 2021 - Not for Publication or Distribution 29
European Team Lift Out (2007)
Created Ares European Direct Lending Strategy
Hired London Financial Sponsor Team @ Large European Bank
$0 Billion AUM at Inception
Case Study – European Direct Lending
• Unlike peers, launched with a direct origination strategy
• Today, 66 investment professionals in London, Paris, Madrid, Amsterdam, Luxembourg, Frankfurt & Stockholm
• A market leading direct lending platform in Europe today
Current Fund Statistics
European Direct Lending • $48 billion in AUM, up nearly 5x in 5 years
ACE V• One of the largest private credit funds at
>$17 billion when projected leverage is fully deployed
Growth Strategy
$0 $3 $6 $9 $10 $12
$24 $26
$42$48
2007 2011 2014 2015 2016 2017 2018 2019 2020 Q2-21
European Direct Lending AUM($ in billions)
All data is as of June 30, 2021, unless otherwise noted. Projections and forward-looking statements are not reliable indicators of future events and no guarantee or assurance is given that such activities will occur as expected or at all.

Ares Management Corporation Investor Day 2021 - Not for Publication or Distribution 30
Case Study – Special Opportunities
$0.0
$1.7
$3.5
$5.7$6.3
2017 2018 2019 2020 Q2-21
Special Opportunities Team Formation (2017)
All data is as of June 30, 2021, unless otherwise noted. Past performance is not indicative of future results. 1. AUM includes all assets managed by Special Opportunities team, including Ares Special Situations Fund IV.
Hired Scott Graves, Craig Snyder & Aaron Rosen
$0 Billion AUM At Hiring
• Built a team of 17 investment professionals housed within the Private Equity Group for product and industry synergies
• Developed track record with existing capital
• Ares Special Opportunities Fund I (ASOF I) raised $3.5 billion exceeding its $2 billion initial target
• Team sources opportunities for ASOF, ACOF and credit funds
ASOF I• 67.9% Gross / 52.2% Net IRR since inception
• 71% Drawn & Committed
Current Fund StatisticsGrowth Strategy
Hired Special Opportunities Team AUM1
($ in billions)

Ares Management Corporation Investor Day 2021 - Not for Publication or Distribution 31
Case Study – Indicus (Alternative Credit)
$0.8 $1.7$3.1
$4.8 $5.4$7.6
$12.9$14.5
2011 2013 2015 2017 2018 2019 2020 Q2-21*
All data is as of June 30, 2021, unless otherwise noted. Please refer to Endnotes for additional important information.* *Excludes approximately $800 million included in Global Liquid Credit AUM.
Acquired Indicus in 2011
Created Ares Alternative Credit
17 professionals in London & New York
$2 Billion AUM At Acquisition1
• Formed the basis for our Alternative Credit team including Keith Ashton, Co-Head of Alternative Credit
• Organic additions of key talent including Joel Holsinger, Co-Head of Alternative Credit in 2019
• Currently ~35 investment professionals in Alternative Credit
Current Fund Statistics
Alternative Credit • $14.5 billion in AUM*
Pathfinder Series • $3.7 billion initial Pathfinder Fund
Growth Strategy
Alternative Credit AUM2
($ in billions)

Ares Management Corporation Investor Day 2021 - Not for Publication or Distribution 32
Case Study – AREA Property Partners (Real Estate Equity)
$8.7$10.3 $10.2
$11.3 $13.2$14.8
$19.7
$13.7
$33.4
2013 2015 2017 2018 2019 2020 Q2-21
All data is as of June 30, 2021, unless otherwise noted. Please refer to Endnotes for additional important information.
Acquired AREA Property Partners - 2013
Added Ares Real Estate Group
50+ professionals with 6 offices across U.S. & Europe
Approximately $6 Billion AUM At Acquisition1
• Scaled existing funds, expanded product suite and attracted new investors
• Increased 130 LPs with $3 billion in commitments at closing in 2013 to > $11 billion in commitments today
• Today, over 190 investment professionals3 in 17 office locations across U.S. & Europe4
Current Fund Statistics
Real Estate Group • $33.4 billion in AUM
Growth Strategy
Real Estate Group AUM2
($ in billions)Includes
Black CreekAcquisition

Ares Management Corporation Investor Day 2021 - Not for Publication or Distribution 33
Credit
Pathfinder Series Global Multi Asset
Secured & Enhanced Income Series
Sports, Media & Entertainment
Private Equity
Special Opportunities Series
Climate Infrastructure Series
Real Estate
Income Series
Secondary Solutions
Infrastructure
Ares SSG
Senior Lending Series
Credit
Core Alternative Non-Traded Credit
Specialty Healthcare
Aspida Insurance Products
Private Equity
Social Impact Infrastructure
Growth Sector-Focused
Real Estate
European Debt
Debt Securities
Opportunistic Debt
Triple Net Lease
Secondary Solutions
Credit Retail Products
New Geographies (Asia & Europe)
Ares SSG
Unitranche Secondary & RE
Credit
ARCC PCS Series
ACE Series SDL Series
High Yield Bank Loans
Private Equity
Corporate Opportunities Series
Real Estate
U.S. & Europe Opportunistic Equity
U.S. & Europe Value-Add Equity
U.S. Core Equity
Real Estate Debt
Secondary Solutions
Private Equity
Real Estate
Ares SSG
Special Situations Series
We Continue to Innovate and Create New Investment Strategies
List of strategies as of June 2021. There can be no assurance that the strategies and products will launch within the expected timeframe or at all. Other strategies and products may get added to this list as they are identified, and their fundraising plans get more developed. Projections and forward-looking statements are not reliable indicators of future events and there is no guarantee that such activities will occur as expected or at all.
Future GrowthStrategies & Products
EmergingStrategies & Products
EstablishedStrategies & Products

Ares Management Corporation Investor Day 2021 - Not for Publication or Distribution 34
Expanding Our Primary Distribution ChannelsWe have expanded our fundraising and client servicing platforms in the ~$280 Trillion addressable market
Information as of June 30, 2021. AUM includes the acquisition of Black Creek Group, which closed on July 1, 2021. Please refer to Endnotes for additional important information.
Retail Channel
Insurance Channel
Institutional Channel
$32 Billion in AUM
• Insurance SMAs• Insurance Commingled Accounts• Aspida Reinsurance & Wealth
Management
$189 Billion in AUM
• Commingled Funds• Separately Managed Accounts• CLOs
$63 Trillion Addressable Market1
$178 Trillion Addressable Market1
$38 Trillion Addressable Market1
AUM$262 Billion
Investment Solutions
+Client Relationship
Management
$41 Billion in AUM
• Traded - ARCC, ACRE & ARDC• Non-Traded – CADEX, BCI IV, DPF• Commingled Retail Accounts• Fidante Retail Funds

Ares Management Corporation Investor Day 2021 - Not for Publication or Distribution 35
Looking Forward…We Are Targeting $500+ Billion of AUM by Year-End 2025
2025EToday
$2621
$500+
Scale Existing Funds
Launch Ancillary Products
Expand and Penetrate Distribution Channels
Leverage Expanded Geographic Footprint
Potential Tuck-InInorganic Opportunities*
We have multiple growth drivers for each of our business groups
As of June 30, 2021, unless otherwise stated. Projections and forward-looking statements are not reliable indicators of future events and there is no guarantee that such activities will occur as expected or at all.* $500+ billion target AUM does not include growth from inorganic opportunities1. Includes the acquisition of Black Creek Group, which closed on July 1, 2021
($ in billions)

Ares Management Corporation Investor Day 2021 - Not for Publication or DistributionAres Management Corporation Investor Day 2021 - Not for Publication or Distribution
Jarrod PhillipsChief Financial Officer
Financial Review & Outlook

Ares Management Corporation Investor Day 2021 - Not for Publication or Distribution 37
Differentiated Business Model is Well Positioned for Continued Growth
Diversified, Recurring
Revenue Stream
Long Dated, Long Duration Capital
Management Fee Centric Business
Model
Economies of Scale Driving
Margin Expansion
More Stable, Balance Sheet
Light Model
We believe we operate a distinctive business model in our sector which provides growth and stability advantages

Ares Management Corporation Investor Day 2021 - Not for Publication or Distribution 38
We Have Built a Market Leading Business With Strong Growth Potential
Annual Fundraising Fee Related Earnings($ in millions)($ in billions) ($ in billions)
AUM Drawdown Deployment($ in billions)
$177
$510
2015 Q2-21 LTM
$23
$56
2015 Q2-21 LTM
$94
$262
2015 Q2-21
$9.0
$28.2
2015 Q2-21 LTM
Represent Firm Records as We Continue to Execute Our Business Goals
Core functions hitting in all areas across the firm
All data as of June 30, 2021, unless otherwise stated. Please refer to Endnotes for additional important information.1. Includes the acquisition of Black Creek Group, which closed on July 1, 2021.
1
Ares Management Corporation Investor Day 2021 - Not for Publication or Distribution 39
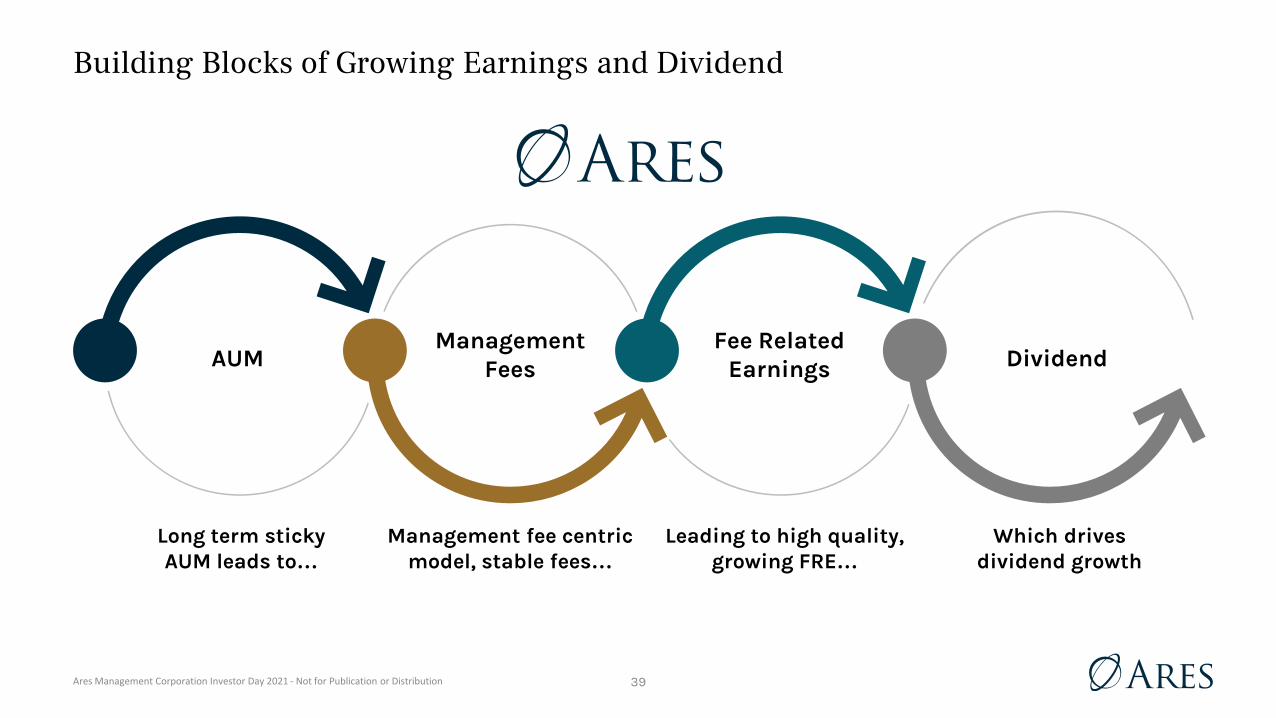
Building Blocks of Growing Earnings and Dividend
AUMManagement
FeesFee Related
Earnings Dividend
Long term sticky AUM leads to…
Management fee centric model, stable fees…
Leading to high quality, growing FRE…
Which drives dividend growth

Ares Management Corporation Investor Day 2021 - Not for Publication or Distribution 40
95%
5%
Fees Insulated fromRedemptions
Short Term LiquidCredit StrategyFunds Subject toRedemption
Management Fees Driven by Long Dated, Sticky Capital
Locked Up and Insulated from Redemptions Management Fees by Fund Type
• Management fees are largely derived from long dated sticky capital
• 95% of our management fees are insulated from redemptions with 90% derived from permanent capital, closed end funds and CLOs and 5% from illiquid strategies
• Less than 5% of our management fees are derived from short-term, open-ended funds in liquid credit strategies
Ares operates a management fee centric business primarily driven by long dated, closed end funds
All data as of June 30, 2021, unless otherwise stated. Please refer to Endnotes for additional important information.

Ares Management Corporation Investor Day 2021 - Not for Publication or Distribution 41
Stable and Diversified Management Fee Driven Business Model
Total Unconsolidated Fee Revenue Composition1
$767
58%
19%
9%12%2%
$843
56%
24%
8%9%3%
$967
57%
21%
8%
11%3%
62%
19%
8%
10%
$1,143
1%
$1,338
63%
17%
7%
10%1%2%
89% in Mgmt.
Fees
89% in Mgmt.
Fees
86% in Mgmt.
Fees
88% in Mgmt.
Fees
86% in Mgmt.
Fees
$1,505
64%
16%
7%
8%2%3%
88% in Mgmt.
Fees
Our Effective Management Fee rate has consistently ranged between 1% and 1.1% past 5 years
$712
61%
21%
9%8%1%
91% in Mgmt.
Fees
Consistent 85%-90% Fee Revenue from Stable, Diversified and Cross-Platform Management Fees
All data as of June 30, 2021, unless specified. There can be no guarantee that Ares can or will sustain such growth. Please refer to Endnotes for additional important information.
($ in millions)
2015 2016 2017 2018 2019 2020 Q2-21 LTM
Realized net performance income
Other
Mgmt. Fees: Strategic Initiatives
Mgmt. Fees: Secondary Solutions
Mgmt. Fees: Real Estate
Mgmt. Fees: Private Equity
Mgmt. Fees: Credit

Ares Management Corporation Investor Day 2021 - Not for Publication or Distribution 42
Diversified Credit Business Enhances Earnings Stability and Growth Opportunities
Credit is More of a Growth Business
• Larger addressable market
• Wide range of investment solutions, from low single digit to high-teen return opportunities
Scale Leads to Competitive Advantages
• Scale creates alpha
• Incumbency
• Sourcing advantages
• Information advantages
Efficient Deployment of Capital
• Easier and more efficient to deploy capital in private credit than private equity
Less Risk, Greater Diversity with Credit Focus
• Senior assets provide greater loss protection
• Larger number of investments enhances diversification and reduces concentration risk
Less Cyclical
• Returns are more stable and less volatile, particularly during periods of market stress
We believe our credit franchise provides strategic business model advantages

Ares Management Corporation Investor Day 2021 - Not for Publication or Distribution 43
Our Model Produces Consistent Growth Even in Volatile MarketsOur business has shown notable stability during periods of significant volatility
Management Feesgrew at a
28% CAGR during the GFC
and 20% CAGR during COVID2
There can be no guarantee that Ares can or will sustain such growth. Please refer to Endnotes for additional important information.
'06 '07 '08 '09 '10 '11 '12 '13 '14 '15 '16 '17 '18 '19 '20 Q2-21LTM
$0
$200
$400
$600
$800
$1,000
$1,200
$1,400
0
100
200
300
400
500
600
700
Management Fees VIX3
Indexed at 1001
$ in millions

Ares Management Corporation Investor Day 2021 - Not for Publication or Distribution 44
$94 $95$106
$131
$149
$197
$262$275
2015 2016 2017 2018 2019 2020 Q2-21 2021E … 2025E
AUM $500+
We Believe we are Well Positioned to Continue Growing our AUM
Historical AUM Growth Growth Driven by($ in billions)
• Diversified and growing investor base
• Strong fundraising and organic growth
• Demonstrated track record of performance
• Cross selling across our platform
• Deepening our wallet share with investors
Our AUM has been growing at a 21% growth rate and we are targeting further growth through year-end 2025
There can be no guarantee that Ares can or will sustain such growth. CAGR of 15% assumes 2025 year-end AUM of $500 billion. 1. Includes the acquisition of Black Creek Group, which closed on July 1, 2021.
+15%CAGR
+
1
Ares Management Corporation Investor Day 2021 - Not for Publication or Distribution 45
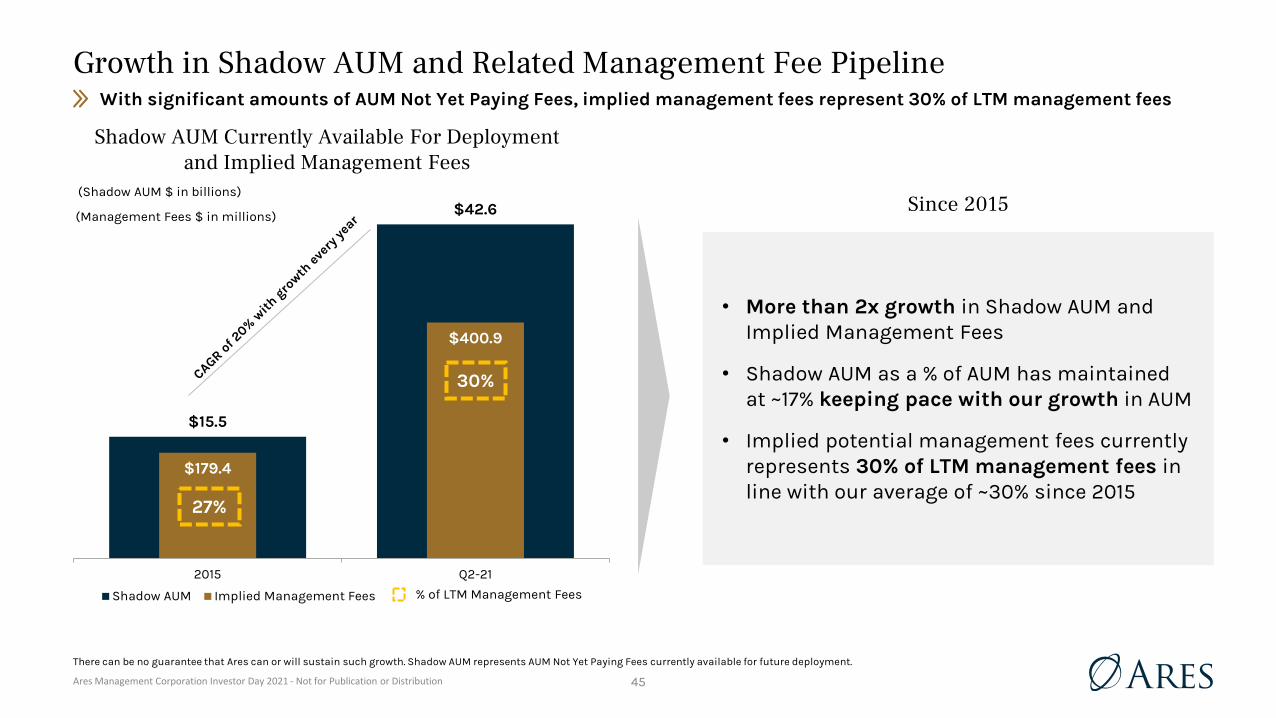
$15.5
$42.6
$179.4
$400.9
2015 Q2-21
Shadow AUM Implied Management Fees
Growth in Shadow AUM and Related Management Fee Pipeline
Shadow AUM Currently Available For Deployment and Implied Management Fees
(Shadow AUM $ in billions)
• More than 2x growth in Shadow AUM and Implied Management Fees
• Shadow AUM as a % of AUM has maintained at ~17% keeping pace with our growth in AUM
• Implied potential management fees currently represents 30% of LTM management fees in line with our average of ~30% since 2015
(Management Fees $ in millions)Since 2015
27%
30%
% of LTM Management Fees
With significant amounts of AUM Not Yet Paying Fees, implied management fees represent 30% of LTM management fees
There can be no guarantee that Ares can or will sustain such growth. Shadow AUM represents AUM Not Yet Paying Fees currently available for future deployment.

Ares Management Corporation Investor Day 2021 - Not for Publication or Distribution 46
Deployment Continues to Scale With Our AUM Growth
Q2-21 LTM Deployment1
• Deployment has grown at more than a 20% CAGR since 2015
• We are deploying nearly 3x the amount of capital now vs 2015
• Deployment growth from 2015 driven by:o ~2x # of investment professionalso ~2x # of global officeso ~2x # of fund strategieso ~3x # of billion dollar fundso ~2.5x # of institutional investorso ~1.5x average check sizes
• Historically, over 90% of our Shadow AUM is deployed in ~18 months
($ in billions)
Credit
PE
RE
SI
Credit
PE
RE$16.1
$5.9
$4.3
$1.8
$4.0
$3.5
$1.6
$28.2
$9.0
Deployment continues to scale as we grow our business and platform in new and adjacent segments
2015 Deployment1
1. Represents deployment of drawdown funds. Q2-21 LTM drawdown deployment includes approximately $0.1 billion in Secondary Solutions.
2015 Q2-21 LTM
US Direct Lending EU Direct Lending Other Credit
Corporate Private Equity Infrastructure and Power Special Opportunities
Real Estate Equity Real Estate Debt Strategic Initiatives

Ares Management Corporation Investor Day 2021 - Not for Publication or Distribution 47
$177 $172 $217
$255
$324
$424
$588
27.0% 25.7%28.3% 29.7%
31.4%35.2%
38.7%
45.0%
15%
20%
25%
30%
35%
40%
45%
50%
55%
60%
2015 2016 2017 2018 2019 2020 Q2-21Run Rate
… 2025E
Fee Related Earnings FRE Margin
3-Year: 29% CAGR1
5-Year: 26% CAGR2
Fee Related Earnings Growth is Driven by AUM and Margin Expansion
Fee Related Earnings (FRE) & Margin Trends/Targets
• Targeting 45% FRE run rate margins by year-end 2025
• Average annual increase of ~200 bps from 2016 to 2020
• Targeting FRE and dividend growth of 20%+ through year-end 20253
• We continue to invest substantially for 2025
45%
Fee Related Earnings have increased over 25% annually over the past 5 years due to AUM growth, maturation of sub-scale strategies and operational scale efficiencies
There can be no guarantee that Ares can or will sustain such growth. Please refer to Endnotes for additional important information.
($ in millions)

Ares Management Corporation Investor Day 2021 - Not for Publication or Distribution 48
Ares Dividend Tied To Robust FRE Performance
Dividend & FRE Growth
Consistent & Growing FRE Base Supports Our Dividend
Q1-19 Q2-19 Q3-19 Q4-19 Q1-20 Q2-20 Q3-20 Q4-20 Q1-21 Q2-21
LTM FRE per Share
Our FRE per Share Growth Continues to Drive Dividend Growth
LTM After-Tax FRE per Share Growth
Our dividend growth is pegged to the growth of after-tax FRE
There can be no guarantee that Ares can or will sustain such growth.
14%
25% 23%27%
31%
39%
2018 to 2019 2019 to 2020 LTM Q2-20 to LTM Q2-21
Dividend Growth FRE Growth

Ares Management Corporation Investor Day 2021 - Not for Publication or Distribution 49
Path to Shareholder Value Creation
Fee Related EarningsRealized Net Performance Fees and
Realized Net Investment Income
• Diversity and composition of AUM drivestable and growing earnings
• Deploy significant AUM not yet paying fees
• Increase successor funds
• Increase core and adjacent fund strategies
• Scale efficiencies to drive margin expansion
• Realize accrued net performance income
• Realize income from balance sheet investments
• Increase new performance income by deploying un-invested incentive eligible AUM
• Continued growth of incentive eligible AUM
• Convert incentive eligible AUM into incentive generating AUM through deployment
Annual qualified dividend pegged to after-tax Fee Related Earnings1
with retained earnings invested in organic & inorganic growth
Stable and growing FRE continues to fuel dividend growth and increasing realized net performance income can be reinvested
Past performance is not indicative of future results. There can be no guarantee that Ares can or will sustain such growth. Please refer to Endnotes for additional important information.

Ares Management Corporation Investor Day 2021 - Not for Publication or Distribution 50
45.8
151.3
13.9
62.8
2015 Q2-21IEAUM IGAUM
Strong IEAUM Growth Underpins Future Performance Fees
Incentive Eligible and Incentive Generating AUM
($ in billions)
• Net accrued performance income growing at 30%+ CAGR
• $64 billion of IEAUM is uninvested
• Annual net realized performance income on average represents 41% of prior year net accrued balance over the past three years
$140.1
$615.6
2015 Q2-21
Net Accrued Performance Income
We have consistently generated strong annual growth in Incentive Eligible and Incentive Generating AUM
There can be no guarantee that Ares can or will sustain such growth.
($ in millions)

Ares Management Corporation Investor Day 2021 - Not for Publication or Distribution 51
Growth of European Waterfall Style Funds
$11
$22$25
$46
$61
$6 $8$13
$19$26
2017 2018 2019 2020 Q2-21
EU StyleIEAUM
EU StyleIGAUM
Cumulative European Waterfall Growth in IGAUM & IEAUM2
($ in billions)
Commingled Final Fund Closes Over
$1B3
PCS$3.4B
ACE IV$7.5B
AREOF III$1.7B
SDL$3.5B
US Fund IX$1.0B
ASOF$3.5B
= Funds not yet closed
Future Fundraising to
Drive Continued
Growth
2nd Senior Direct Lending
Fund
Open-End Core Alternative Credit Fund
2nd Junior Capital Direct Lending Fund
The significant growth of our incentive eligible European Style funds of more than 5x in the last 5-years, which is not reflected in our current earnings, is expected to drive significant future performance income1
There can be no guarantee that Ares can or will sustain such growth. Please refer to Endnotes for additional important information.
ACE V$13.1B
Pathfinder$3.7B
10th U.S. Value Add Real Estate
Fund

Ares Management Corporation Investor Day 2021 - Not for Publication or Distribution 52
European Waterfall Funds Expected to Significantly Enhance Performance IncomeWe estimate our EU-Style funds could generate ~$1.5B or $4.95 per share of Realized Net Performance Income
• Expect increased and significant Realized Net Performance Income from EU style waterfall funds
• Estimated to generate ~$1.5 Billion or $4.95 per share in potential Realized Net Performance Income 2022-2028 and beyond from EU style waterfall funds raised using our fully diluted share count as of June 30, 2021
• Of our current European waterfall style funds, over 92% have reached or exceeded their hurdle rates
Projections and forward-looking statements are not reliable indicators of future events and there is no guarantee that such activities will occur as expected or at all. Per Share amounts are based on 294,918,694 fully diluted shares of common stock on June 30, 2021. Please refer to Endnotes for additional important information.
$160
$400
$525
$375
$0
$250
$500
$750
$1,000
$1,250
$1,500
2022 - 2023 2024 - 2025 2026 -2027 2028+
EU Style…
Estimated Realized Net Performance Income1 - Current Funds
$1.5 Billion
$1.36 per share
$1.78per share
$1.27 per share
$0.54 per share
Total EU Waterfall
Funds
($ in millions, except per share, pre-tax amounts)

Ares Management Corporation Investor Day 2021 - Not for Publication or Distribution 53
European and American Funds Expected to Significantly Enhance Performance Income
$160
$400
$525
$375
$0
$250
$500
$750
$1,000
$1,250
$1,500
2022 - 2023 2024 - 2025 2026 -2027 2028+
EU Style…
$1.36 per share
$1.78per share
$1.27 per share
$0.54 per share
We estimate our EU-Style funds could generate ~$1.5B or $4.95 per share of Realized Net Performance Income on top of another estimated ~$1.5B or $4.95 per share in American Style funds from IEAUM funds already raised
Estimated Realized Net Performance Income1 - Current Funds
• Expect increased and significant Realized Net Performance Income from EU style waterfall funds
• Estimated to generate ~$1.5 Billion or $4.95 per share in potential Realized Net Performance Income 2022-2028 and beyond from EU style waterfall funds raised using our fully diluted share count as of June 30, 2021
• Of our current European waterfall style funds, over 92% have reached or exceeded their hurdle rates
• Including American style waterfall funds, we estimate we will generate ~$3.0 billion or ~$10 per share in potential Realized Net Performance Income from funds raised
($ in millions, except per share, pre-tax amounts)$1.5 Billion $1.5 Billion
Total American Waterfall
Funds
Total EU Waterfall
FundsProjections and forward-looking statements are not reliable indicators of future events and there is no guarantee that such activities will occur as expected or at all. Per Share amounts are based on 294,918,694 fully diluted shares of common stock on June 30, 2021. Please refer to Endnotes for additional important information.

Ares Management Corporation Investor Day 2021 - Not for Publication or Distribution 54
Balance Sheet Lite Model Allows for Flexibility and Available Capital
$1,036
$1,368
$974 $940
$1,133
$1,605 $1,673
11.7x
9.6x10.2x
11.9x
16.5x17.0x
18.8x
1.5x
-0.2x
2.3x1.5x
0.6x 0.2x1.0x
-5.0x
0.0x
5.0x
10.0x
15.0x
20.0x
$-
$200
$400
$600
$800
$1,000
$1,200
$1,400
$1,600
$1,800
2015 2016 2017 2018 2019 2020 Q2-21 LTM
Available liquidity FRE/Interest Expense Net Debt/FRE
Improved Credit Metrics with Consistent Growth
• A- / BBB+ rated balance sheet
• Low net debt and high FRE interest coverage ensures stability
• Approximately $1.5 billion in available liquidity as of June 30, 2021 gives significant flexibility
• Average debt maturity greater than 14 years
Substantial Available Liquidity Allows Flexibility and Stability Throughout Market Cycles
All data as of June 30, 2021, unless otherwise stated.
($ in millions)

Ares Management Corporation Investor Day 2021 - Not for Publication or Distribution 55
Our Balance Sheet Lite Model Enhances Growth With Less Capital
240x
130x
ARES Peer Average
ARES Peer Average
AUM as a Multiple of Balance Sheet Investments
LTM Management Fees as % of Balance Sheet Investments
129%
75%
ARES Peer Average
ARES Peer Average
Lower Volatility During Periods of
Market Disruptions
Fewer Conflicts of Interest
Higher Return on Capital
* Peer Group excludes Ares, calculated using fair value of investments on balance sheet. Please refer to Endnotes for additional important information.

Ares Management Corporation Investor Day 2021 - Not for Publication or Distribution 56
Key Takeaways
Management Fee Centric Business
Model
• Over 95% of our management fees are insulated from redemptions leading to a predictable revenue stream
• Targeting a 45% FRE margin with continued efficiencies of scale, deployment growth and benefits from acquisitions and investments
• Targeting annual growth of 20%+ in FRE and dividends per share of class A common and non-voting stock through 20251
• Estimated outsized realized net performance income of $3.0 billion in future years from EU and American style funds already raised
• Goal of $500 billion in AUM by 2025E driven by continued organic fundraising and organic platform expansion
• Fundraising and deployment are on a strong growth trajectory and realizations are poised to accelerate in future years
Projections and forward-looking statements are not reliable indicators of future events and there is no guarantee that such activities will occur as expected or at all. Please refer to Endnotes for additional important information.

Ares Management Corporation Investor Day 2021 - Not for Publication or DistributionAres Management Corporation Investor Day 2021 - Not for Publication or Distribution
Ryan BerryChief Marketing and Strategy Officer
Business Development & Client Strategy

Ares Management Corporation Investor Day 2021 - Not for Publication or Distribution 58
We have a tremendous opportunity to broaden and deepen our Firm’s investor relationships
The ongoing growth and diversification of
our AUM highlights the merits of our approach
A powerful network of client service teams
working in partnership to develop solutions
1 2 3
Ares Business Development & Client Strategy Today

Ares Management Corporation Investor Day 2021 - Not for Publication or Distribution 59
~260 Dedicated Professionals Leading our Capital Formation Efforts
North America
Europe
Middle East / Africa
Asia Pacific
Strong collaboration enables us to work more effectively with our investors to develop solutions
As of July 31, 2021. Wealth Solutions Professionals include the acquisition of Black Creek Group, which closed on July 1, 2021.
~30Strategy
Professionals
~50Relationship
Managers
~90Wealth Solutions
Professionals
~90Product Mgmt. / IR Professionals
DistributionPartners

Ares Management Corporation Investor Day 2021 - Not for Publication or Distribution 60
$82
$186
$53
$35
($94)
$262
2014 AUM OrganicInflows
M&A / OpportunisticInflows
Appreciation Distributed Capital Q2-21 AUM
Our AUM has More than Tripled in Under 7 YearsFundraising has been the key driver... $186 billion organic inflows versus $53 billion M&A / opportunistic inflows since our IPO year
($ in billions)
1
1. Includes relinquishment of equity commitments that were previously uncalled. 2. Includes the acquisition of Black Creek Group, which closed on July 1, 2021.
2

Ares Management Corporation Investor Day 2021 - Not for Publication or Distribution 61
$82 $94 $95 $106 $131
$149 $165
$262
Q4-14 Q4-15 Q4-16 Q4-17 Q4-18 Q4-19 Q2-20 Q2-21
AUM
$23 $14 $17$36 $24
$41$56
2015 2016 2017 2018 2019 2020 LTMQ2-21
Organic Inflows
1. Q2-20 AUM includes the Ares SSG acquisition that closed on July 1, 2020 and Q2-21 AUM includes the acquisition of Black Creek Group, which closed on July 1, 2021.
Organic Inflows as Percentage of Beginning AUM
18% 34% 18% 28%15%
Record Fundraising PeriodsWe raised $56 billion over the past 12 months… the equivalent of 34% of the period’s beginning AUM of $165 billion
34%
11
28%
($ in billions)

Ares Management Corporation Investor Day 2021 - Not for Publication or Distribution 62
$24
$69$9
$48
$25
$36
$3
$14
$23
$31
$10
$33
$10
$19
$94
$262
2015 Q2-21
AUM by Strategy
1. Q2-21 AUM includes the acquisition of Black Creek Group, which closed on July 1, 2021. Black Creek’s non-traded REITs are captured in Public & Affiliates and may be re-classified in future presentations.Inv. Manager/Other includes Investment Managers, Endowments & Foundations, Sub-Advisory and other client types. Client type classifications are prepared by Ares and subject to periodic review.
Secondary Solutions
Real Estate
Private Equity
Alternative Credit
Global Liquid Credit
European Direct Lending
U.S. Direct Lending21%
CAGR
36%
7%
33%
5%
25%
Strategic Initiatives
NA
NA
Growth Across All Client Types and Strategies
Ares
Bank
Sovereign
Pensions
Public & Affiliates
$25
$78$9
$22
$8
$34
$6
$23
$16
$7
$20
$1
$3
$22
$41
$14
$25
$94
$262
2015 Q2-21
Institutional Intermediated
AUM by Client Type
23%
25%
CAGR
19%
21%CAGR
High Net Worth
Inv. Manager/Other
16%
22%
50%
27%
12%
11%
Insurance31%
21%CAGR
1 1
($ in billions) ($ in billions)

Ares Management Corporation Investor Day 2021 - Not for Publication or Distribution 63
11
49
2015 Q2-21
17%30%
30%
32%
53%38%
2015 Q2-21
Deepening Our Relationships
As of June 30, 2021, unless otherwise stated. Past performance is not indicative of future results. There can be no guarantee that Ares can or will sustain such growth. Includes the acquisition of Black Creek Group, which closed on July 1, 2021.
1 Group
2 Groups
3 or More
$57B $195B
Direct AUM by # of Groups # of 1 Billion+ Direct Relationships
37%
62%
LTM Direct Inflows by Existing vs. New
4.5x
New Investors
16%
Existing InvestorsNot a Fund Family Re-Up
50%
Existing InvestorsFund Family Re-Up
34%
84%

Ares Management Corporation Investor Day 2021 - Not for Publication or Distribution 64
Onboarding New Investors & Entering New Geographies
# of Direct Relationships
As of June 30, 2021, unless otherwise stated. Past performance is not indicative of future results. There can be no guarantee that Ares can or will sustain such growth. AUM and Direct Relationships include the acquisition of Black Creek Group, which closed on July 1, 2021.
% of Direct AUM by Region(# of Countries)
2.6x
59% (8) 59% (13)
30% (19) 27% (29)
12% (8) 15% (12)
2015 Q2-21
Americas
EMEA
Asia Pacific
$57B (35) $195B (54)
683
1,792
+10
+4
+5
Increase in Countries
New to Ares in the
Proceeding 18 months
4.6x
204
929 479
863
2015 Q2-21

Ares Management Corporation Investor Day 2021 - Not for Publication or Distribution 65
Dedicated Strategy Teams Pursuing Other Growth Avenues
Strategic Agreement
SMBC Multi-Faceted Partnership• Closed March 2020
Platform Acquisitions
3 Platforms in Past Year• SSG Capital ($6.9 billion of AUM)• Landmark ($19.5 billion of AUM)• Black Creek ($13.7 billion of AUM)
Strategic Investments
3 Investments in Past 18 Months• Crestline Denali ($2.7 billion of AUM)• F&G Re ($2.2 billion of AUM)• GBIG Insurance
Distribution Relationship
Ares Australia Management• Strategic Australia JV with
Fidante Partners in Q4-19
Investor Solutions
Investor Strategic Partnerships• Large multi-strategy mandates
Operations& Events
• Enhancing analytical tools to drive increased productivity
• Increased brand awareness and client engagement

Ares Management Corporation Investor Day 2021 - Not for Publication or Distribution 66
The Ares Value PropositionAres provides institutional and retail investors with comprehensive investment solutions to meet their evolving needs
$ Generate compelling cash yields
Access the growing private markets
Reduce volatility & increase diversification
Selected Targeted Benefits of Investing in
Alternatives
Deep origination capabilities across the globe
Strong investment performance across cycles
Growing offering of investment solutions
Firm-wide focus on making a positive impact
Selected Targeted Benefits of Investing with
Enhance long-term risk-adjusted returns +

Ares Management Corporation Investor Day 2021 - Not for Publication or Distribution 67
Excludes Hedge Funds
$3.3
$7.2
$12.9
2012 2020E 2025E
Private Equity Private Debt Real Estate
Infrastructure Natural Resources
$175
$279
$345
2012 2020E 2025E
Mass Affluent High Net WorthInsurance Sovereign Wealth FundsPension
Alternative Assets Continue to Take Share
Alternative Assets Under Management2Global Client Assets1
Alternatives expected to grow at 12% CAGR over the next five years… going from doubling to tripling the growth rate of global client assets
($ in trillions)($ in trillions)
6%CAGR
4%CAGR
10%CAGR
12%CAGR
36% 40% 42%
Projections and forward looking statements are not reliable indicators of future events and there is no guarantee that such activities will occur as expected or at all. Please refer to Endnotes for additional important information.
% of Client Assets Managed by
Third Parties3

Ares Management Corporation Investor Day 2021 - Not for Publication or Distribution 68
Black Creek Transforms Our Retail Distribution Platform
90+ Person Nationwide Distribution PlatformRetail Assets Investing in Alternatives1
$2.4
$5.1
2020 2025E
Retail investor allocations to alternative assets are increasing rapidly… we are excited to partner with our new Wealth Solutions colleagues
Projections and forward looking statements are not reliable indicators of future events and there is no guarantee that such activities will occur as expected or at all. 1. Source: Morgan Stanley. High Net Worth and Ultra High Net Worth Investors capital allocated to Private Market Assets defined as Private Equity, Private Debt, Venture Capital,
Real Estate & Infrastructure using the midpoint of the range for expected investment in 2020 & 2025.
16%CAGR
Sales & Product
Marketers
21Retail
Distribution Support
14Sales Professionals covering Financial
Advisors across multiple channels
47Sales & Product
Management with average of 20 years of
experience
8($ in trillions)

Ares Management Corporation Investor Day 2021 - Not for Publication or Distribution 69
Selected Growth Drivers
1. Source: Preqin as of August 2020.2. Source: Institutional Investor, Top 100 Global Asset Owners, November 2020
• 81% of institutional investors expected to increase allocations to alternatives by 20251
• 40 of the Top 100 global asset owners2 do not currently have a direct institutional relationship with Ares
• 29 of the 60 investors that do have a relationship are only invested with a single Ares investment group
• Less than 1% of our existing investors’ alternative asset allocation is invested with Ares
• Outsized market growth expected in Asia Pacific, High Net Worth, Insurance and
Secondaries… each a key focus where we have led recent business building initiatives
• We will have ~3x the number of commingled fundraises in the market this year than 5 years ago
1
2
3
4
5

Ares Management Corporation Investor Day 2021 - Not for Publication or Distribution 70
We have a tremendous opportunity to broaden and deepen our Firm’s investor relationships
The ongoing growth and diversification of
our AUM highlights the merits of our approach
A powerful network of client service teams
working in partnership to develop solutions
1 2 3
Closing Remarks
We have wonderful people and are proud of what we have built together4

Ares Management Corporation Investor Day 2021 - Not for Publication or DistributionAres Management Corporation Investor Day 2021 - Not for Publication or Distribution
Kipp deVeerHead of Credit Group and Chief Executive Officer of Ares Capital Corporation
Credit Overview & Outlook

Ares Management Corporation Investor Day 2021 - Not for Publication or Distribution 72
Ares Credit Group Overview
U.S. Direct Lending41%
EU Direct Lending29%
Liquid Credit22%
Alternative Credit8%
By Strategy
$167.6BIn Credit AUM1
A Global Leader in Non-Investment Grade Credit
Significant Scale Globally
Significant In-House Research and Portfolio Management Capabilities
Highly Diversified Across Liquid and Illiquid Strategies
Platform Attributes
290+Investment Professionals
~70Research Professionals
16Offices
~2,900Companies
Collaborate Closely with Ares SSG
We believe we are one of the largest non-investment grade credit platforms globally
As of June 30, 2021, unless otherwise stated. For illustrative purposes only. Please refer to Endnotes for additional important information.

Ares Management Corporation Investor Day 2021 - Not for Publication or Distribution 73
Platform Leadership
Accolades5
Over the last 5 years:3x winner Global Fund Manager of the Year
3x winner BDC of the Year (Americas)
Top Quartile Rankings for Several Funds 1Q-21
Over the last 5 years:4x winner Lender of the Year
(North America)
ARCC Has Received Most Honored Designation Twice & Highest Rankings
for CEO, CFO and Best IR Program
20+ year Track Record of Investing Through Cycles
#1 Global Leader in Direct Lending1 Top 5 Global CLO Manager3#1 in Private Debt Capital Raised2
One of the Largest Syndicated Loan Buyers4
One of the Largest Dedicated Alternative Credit Teams4
We maintain a strong leadership position in each of our respective businesses
For illustrative purposes only. The awards and ratings noted herein relate only to selected funds/strategies and may not be representative of any given client’s experience and should not be viewed as indicative of Ares’ past performance or its funds’ future performance. All investments involve risk, including loss of principal. Please refer to Endnotes for additional important information.

Ares Management Corporation Investor Day 2021 - Not for Publication or Distribution 74
Addressable Market*
Ares Share of the Addressable Market**
Liquid Credit1 $4.2T
U.S. Direct Lending2 $1.5T
EU Direct Lending3 $0.7T
Alternative Credit4 $4.2T
Total Addressable
Market$10.6T
Large Addressable Global Credit Market
<1%
3%
2%
<1%
Global Bank Retrenchment
Growing Acceptance for Private Capital
Increasing Institutional and
Retail Investor Interest
Scaling and Growth of Private
Equity
Key Drivers
We have developed a broad product suite of strategies that participate across large addressable markets
For illustrative purposes only. Please refer to Endnotes for additional important information.*As of March 31, 2021.**As of June 30, 2021.

Ares Management Corporation Investor Day 2021 - Not for Publication or Distribution 75
Favorable Global Demand Drivers for Credit
52% reduction in the number of U.S. and EU banks since 19981Bank Consolidation and
Regulation
Direct lending dry powder is only 19% of PE buyout dry powder2Growth in
Private Equity Drives Growth in Private Credit
Issuer Demand
Investor Demand
Asset classes where Ares Credit Group invests are expected to generate
returns 2-5x the corporate IG market over the next 10 years3
PremiumYields
Private Credit historically has had leading performance through volatile markets vs. other major public and private asset classes4
DemonstratedPerformance
Low Rate Environment Low global interest rates have supported issuer demand
Insulated from Inflation Floating rate focus insulates from inflation
For illustrative purposes only. Projections and forward looking statements are not reliable indicators of future events and no guarantee or assurance is given that such activities will occur as expected or at all. Please refer to Endnotes for additional important information.

Ares Management Corporation Investor Day 2021 - Not for Publication or Distribution 76
$1.3
$4.7
2015 Q2-21
$60.4
$167.6
2015 Q2-21
High Yield
Multi-Asset Credit
Alternative Credit
Syndicated Loans
E.U. Direct Lending
U.S. Direct Lending
Growth in Average Commingled Fund Size
We Are Expanding Our Strategies and AUM to Meet Market Opportunity
Growth in Assets Under Management1
($ in billions)($ in billions)
20152 Q2-21
European Direct Lending Strategy
European Direct Lending Strategy
Ares Commercial Finance
Ares Commercial Finance
Ares Capital Corporation
Ares Capital Corporation
Flagship Alternative Credit Strategy
Junior DirectLending Strategy
Senior DirectLending Strategy
Expansion of Key Fund Series +
Expansion of key fund series and larger commingled funds have driven AUM growth
As of June 30, 2021, unless otherwise stated. For illustrative purposes only. There can be no guarantee that Ares can or will sustain such growth. Please refer to Endnotes for additional important information.
=

Ares Management Corporation Investor Day 2021 - Not for Publication or Distribution 77
Integrated and Leading Platform Supports Global Position
Direct Lending
Alternative Credit
Liquid Credit
Differentiated perspective Cross pollination of IC
members across strategies
Depth of due diligenceExperience in asset-backed
markets
Coverage of 900+ financial sponsors
Access to differentiated market insights
Dedicated workout and restructuring resources
Complementary assets
Collaboration across the Credit group drives synergies in idea generation, diligence, sourcing and trading
For illustrative purposes only. As of June 30, 2021.

Ares Management Corporation Investor Day 2021 - Not for Publication or Distribution 78
A Leadinginstitutional bank loan manager
40Dedicated investment professionals, including
28 research analysts
~1,000Issuers covered
60+industries covered
Central repository for information across the firm
Significant Capabilities
US Bank Loan 65%
HY Bond8%
Euro HY Bond & Bank Loan
16%
Multi-Credit11%
$36.4BIn Global Liquid Credit AUM
Market Leader in Global Liquid Credit for 20+ YearsThe liquid credit team invests in a wide range of strategies and capabilities across the global credit markets
As of June 30, 2021. For illustrative purposes only.
By Strategy

Ares Management Corporation Investor Day 2021 - Not for Publication or Distribution 79
1.1%
4.1%
Ares H0A0
0.8%
2.4%
Ares WELLI
0.8%
2.6%
Ares CSLLI
Investment Performance Has Supported AUM Growth
• Top Quartile absolute risk adjusted gross returns since inception for U.S. High Yield1
• Benchmark outperformance since inception5
• Attractive performance in down markets relative to peers and benchmark1,5
High Yield
• Top quartile performer for U.S. Leveraged Loans1
• 20+ year history managing bank loans
• 14+ year track record in Europe generating alpha2
Lower Average Default Levels vs. the Market
0.0%
2.1%
Ares WEHY
~50%Liquid
Credit AUM Growth
since 20158
Leveraged Loans
3
As of June 30, 2021, unless otherwise stated. For illustrative purposes only. All investments involve risk, including loss of principal. The performance, awards/rankings noted herein relate only to selected funds/strategies and may not be representative of any client’s experience and should not be viewed as indicative of Ares’ past performance or its funds’ future performance. Please refer to Endnotes and Index Definitions for additional important information.
3 44
6 6 7 7
Leveraged Loans High Yield

Ares Management Corporation Investor Day 2021 - Not for Publication or Distribution 80
U.S. Direct Lending EU Direct Lending
2004 Founded 2007
$68.6 billionAssets Under Management1 $48.1 billion
1,335Investments since
Inception2 243
$83.5 billionInvested Capital Since Inception3 $35.9 billion
$54.8 billionRealized Proceeds Since Inception4 $17.9 billion
0.02%5Pro Forma
Annualized Losses since inception
0.06%6
Leading Global Direct Lending Platform
$116.7BIn Global Direct Lending AUM1
U.S. Direct Lending
59%EU Direct Lending
41%
Over our 17+ year history, we have deployed $120 billion in capital3 with near zero annualized realized loss rates5,6
As of June 30, 2021, unless otherwise stated. For illustrative purposes only. Past performance in not indicative of future results. Pro forma results have inherent limitations, and no representation is being made that any account will or is likely to achieve profits or losses similar to those shown. Please refer to Endnotes for additional important information.

Ares Management Corporation Investor Day 2021 - Not for Publication or Distribution 81
Attractive Performance Across All Strategies
U.S. Junior Direct Lending
14%Gross IRR2
/10% Net IRR3
U.S. Senior Direct Lending EU Direct LendingAres Capital Corp.
13%Annualized Total Stock Based Return1
Levered
19%Gross IRR2
/14% Net IRR3
Unlevered
10%Gross IRR2
/7% Net IRR3
Levered
14%Gross IRR2
/10% Net IRR3
Unlevered
9%Gross IRR2
/7% Net IRR3
Demonstrated track record across strategies, risk-return profiles and regions
Information as of June 30, 2021. Past performance is not indicative of future results. There is not guarantee or assurance investment objectives will be achieved. Returns shown are since inception for the most recent fund that reports performance in each respective strategy. Please refer to Endnotes for additional important information.
SDL I ACE IV
PCS I

Ares Management Corporation Investor Day 2021 - Not for Publication or Distribution 82
Leading Scale in Direct Lending Globally
Over $100B
$50B - $100B 1 Competitor
$30B - $50B 1 Competitor
Less Than $30B 17 Competitors
200+
~100 to 175 3 Competitors
~50 to 100 6 Competitors
Less than 50 10 Competitors
10+ Offices2 Competitors
6 to 9 Offices 5 Competitors
Less than 6 12 Competitors
Global Focus Direct Lending AUM1
Global TeamDirect Lending Investment Professionals1
Global FootprintDirect Lending Offices1
Market Share is Consolidating in Private Credit Amongst the Largest Lenders2
60%OF THE PRIVATE CREDIT MARKET
Top 15 Lenders 2xGROWTH RATE VS.TOP 50 LENDERS
Top 5 Lenders 30%INCREASE IN MARKET
SHARE SINCE 2017
Top 5 Lenders
We believe that Ares is one of the only managers with a market leading and truly global Direct Lending platform
As of March 31, 2021. For illustrative purposes only. Please refer to Endnotes for additional important information.

Ares Management Corporation Investor Day 2021 - Not for Publication or Distribution 83
Expansion of the Global Direct Lending Platform
$20 $31
$8
$10
$5
$32
$4
$19
$4
$16
$33
$117
2015 Q2-21
AU
M (
$, B
illi
ons1 )
ARCC & Affiliates Junior DL StrategySenior DL Strategy ACEU.S. SMAs and Other Funds EU SMAs and Other Funds
Ares Direct Lending AUM and Strategy Growth
$11
NEW
NEW
$28
$16
$12 3x growth in the number of $1+ billion fund series
Introduced multiple adjacent fund familieswith scale
U.S. Direct Lending AUM growth of 2.9x
EU Direct Lending AUM growth of 5.3x
Diverse and Growing Platform since 2015
We have expanded our direct lending products and strategies over the past 5 years
As of June 30, 2021. For illustrative purposes only. There can be no guarantee that Ares can or will sustain such growth.
~2,800 deals reviewed in the LTM Q2-21
($ in billions)

Ares Management Corporation Investor Day 2021 - Not for Publication or Distribution 84
Established New Flagship Funds and Growing Successor Fund Size
$1.0
$9.1
$17.1
2004 2015 Q2-21
Ares Capital Corporation
Ares Capital Europe Strategy
<
€ 0.8 € 1.4
€ 4.3
€ 8.8
€ 15.4
ACE I ACE II ACE III ACE IV ACE V
Growth of Existing Funds Growth of New Adjacent Funds
As of June 30, 2021. For illustrative purposes only. There can be no guarantee that Ares can or will sustain such growth or that expected remaining fundraise levels will be achieved. Amounts include leverage for respective funds.
Junior Direct Lending Strategy
$1.0 $1.9
$3.4 $3.6
0
0.5
1
1.5
2
2.5
3
3.5
4
4.5
1st Junior Direct Lending Fund 2nd Junior Direct Lending Fund
Additional Amounts Raised in Subsequent ClosingsFirst Close
$4.9
$8.5
1st Senior Direct Lending Fund 2nd Senior Direct Lending Fund
Final Close
First Close
Senior Direct Lending Strategy
As of 6/30/21
($ in billions) ($ in billions)
($ in billions)(€ in billions)

Ares Management Corporation Investor Day 2021 - Not for Publication or Distribution 85
Liquid Alternative Credit Assets1
45%
Illiquid Alternative
Credit Assets2
55%
$14.5BIn Alternative Credit AUM*
1,685+investments since inception4
1.0bpsrealized annualized
loss rate across Alt Credit4
5.0% Gross/4.5% net
realized liquid IG focused Alt Credit pro forma asset-level IRR4
16.2%Gross/11.7% net
realized illiquid Alt Creditpro forma asset-level IRR4
40Investment
Professionals3
~21 Yearsof Senior Investment
Professional Experience3
A Market Leader in Global Alternative CreditThe Alternative Credit Team invests in large, diversified portfolios of assets that generate contractual cash flows
As of June 30, 2021, unless otherwise stated. For illustrative purposes only. Past performance is not indicative of future results. Please refer to Endnotes for additional important information.*Excludes approximately $800 million included in Global Liquid Credit AUM.
By Strategy

Ares Management Corporation Investor Day 2021 - Not for Publication or Distribution 86
Alternative Credit Addresses Needs Traditional Markets Do Not Fulfill
Illustrative Competitive Landscape
<$150 million
<$50 million
$150+ million
Creative Bespoke Solutions Flexible Capital No Ratings Requirement Industry Expertise
Ability to Develop Differentiated Asset-Focused Solutions
Type of Assets
Format of InvestmentsThe format of our investments is typically one of the following:
Lending Asset AcquisitionLiquids
Buy Alt Credit securitiesLend against assets Acquire asset pools
Loans Leases Receivables
Large, diversified portfolios of assets with contractual cash flows and demonstrated stable performance throughout cycles. Asset pools generally consist of:
Our flexible, scaled capital is proving to be a distinct competitive advantage today
For illustrative purposes only. Based on Ares’ views and market observations. Diversification does not assure profit or protect against market loss. Past performance is not indicative of future results.

Ares Management Corporation Investor Day 2021 - Not for Publication or Distribution 87
Alternative Credit AUM Growth
$3.1
$14.5 1
2015 Q2-21
Alternative Credit AUM Growth Diverse and Growing Platform
Flagship Liquid and Illiquid Funds
Scaled Capital Across a Target Net Return Spectrum From 3% to 15%+2
Robust Deployment in Existing Strategies
Access to Alternative Credit in Evergreen Format
Resulting in AUM Growth of ~4.7x since 2015
The Alternative Credit team manages ~$14.5 billion1 Alternative Credit AUM across dedicated funds
As of June 30, 2021. For illustrative purposes only. There can be no guarantee that Ares can or will sustain such growth.1. Excludes approximately $800 million included in Global Liquid Credit AUM.2. No assurance can be made that target returns will be achieved, and actual results may differ materially. Target net returns reflect deduction of any applicable management fees,
performance fees and other expenses.
($ in billions)

Ares Management Corporation Investor Day 2021 - Not for Publication or Distribution 88
We Continue to Diversify and Scale Our Investing
$9 $8
$12
$16
$20 $18
$28
2015 2016 2017 2018 2019 2020 2021
Liquid Credit
U.S. Direct Lending
EU Direct Lending
Alternative Credit
Q2-21 Annualized
Total Credit Deployment1
2021 run-rate deployment is over 50% greater than 2020
Q2-21 was our largest level of quarterly deployment
Deployment per investment professional has increased over 2x since 2015
Significant available dry powder
Total Available Credit Capital
$9 $8 $13
$27 $24
$40
$50
2015 2016 2017 2018 2019 2020 Q2-21
Key Points
For illustrative purposes only. There can be no guarantee that Ares can or will sustain such growth.1. Includes new capital invested in draw down and non-draw down funds.
($ in billions)
($ in billions)

Ares Management Corporation Investor Day 2021 - Not for Publication or Distribution 89
55%
61%
2015 Q2-21 LTM
FRE
Mar
gin
Our Market Presence and Profitability are Also Expanding with Scale
$281
$574
2015 Q2-21
AU
M b
y In
vest
men
t Pr
ofes
sion
al
($ m
m)
Credit AUM1 by Investment Professional
Credit Group Business Line FRE Margins3 2.5xGrowth in Business Line FRE3
87% growth In the number of deals reviewed since 20152
Enhanced Scaling of the Credit Group
600bps Business Line FRE margin expansion3
100% growth In AUM per investment professional since 20151
For illustrative purposes only. There can be no guarantee that Ares can or will sustain such growth. Please refer to Endnotes for additional important information.
($ in millions)

Ares Management Corporation Investor Day 2021 - Not for Publication or Distribution 90
Future Growth Drivers of the Ares Credit Group
Continued Desire for Income• Persistent demand from demographic
shifts and low global interest rates
Product and Distribution Expansion• New products and adjacencies• New geographies• New distribution channels
External Market Drivers
Internal Drivers
Sustained Institutional Demand• Demand for non-investment grade and
illiquid credit products
Larger Successor Funds• Consistent performance• Benefits from consolidation of
managers
Continued Deployment of Dry Powder• Invest in new professionals and become
more productive• Increased positions of incumbency
Ares is well positioned in large and growing end markets that are supported by increasing retail and institutional demand
For illustrative purposes only. Past performance is not indicative of future results.
Growth in Retail Demand• Increasing retail interest for non-traded
credit funds

Ares Management Corporation Investor Day 2021 - Not for Publication or DistributionAres Management Corporation Investor Day 2021 - Not for Publication or Distribution
Matt CwiertniaCo-Head of Private Equity Group
Scott GravesCo-Head of Private Equity Group and Head of Special Opportunities
Private Equity Overview & Outlook

Ares Management Corporation Investor Day 2021 - Not for Publication or Distribution 92
$30.7BIn Private Equity AUM Across 3 Complimentary Strategies1
Ares Private Equity Group Overview
~110Investment Professionals
20+Funds
~45Portfolio Companies
~35Infrastructure Assets
Corporate Private Equity
67%
Special Opportunities
21%
Infrastructure & Power
12%
Consistent Deployment Through Cycles
Serve as a Partner of Choice
Seek to Be a Catalyst for Good
Key Attributes of the Private Equity Group
Leveraging The Power of The Ares Platform
Integrated Team With Traditional & Distressed Capabilities
Group Built to Scale
1. As of June 30, 2021.2. Includes Ares Energy Opportunities Fund, L.P., Ares PE Extended Value Fund LP and ACOF Asia.
Our focus is to consistently generate attractive net returns, which we believe will enable us to grow AUM
2

Ares Management Corporation Investor Day 2021 - Not for Publication or Distribution 93
Private Equity is a Large and Growing Market
0
2
4
6
8
10
12
14
20
00
20
01
20
02
20
03
20
03
20
04
20
05
20
06
20
06
20
07
20
08
20
09
20
09
20
10
20
11
20
12
20
12
20
13
20
14
20
15
20
15
20
16
20
17
20
18
20
18
20
19
20
20
Net
Ass
et V
alu
e an
d M
arke
t C
ap In
dex
ed t
o 2
00
0
Global Private Equity Net Asset Value Global Public Equities Market Cap
$5 Trillion Market1 Private Markets Growth Has Outpaced Public Markets2
Buyout48%
Growth16%
Fund of Funds
15%
Special Situations / Distressed Debt
8%
Other13%
Private Markets Outpaced
Public MarketsGrowth by
4x
Private Equity is Poised for Significant Future Growth, with Nearly 80% of LPs Planning to Increase their Allocations3
Private Markets Have Grown at a 13% CAGR Over the Past Two Decades and Growth Will Likely Remain Robust as Investors Hunt for Return
Please refer to Endnotes for additional important information.

Ares Management Corporation Investor Day 2021 - Not for Publication or Distribution 94
Partnership Approach Across Asset Classes
Rescue Financing
Buyouts
Stressed / Distressed
Structured Recap
Solutions
Structured Equity
GrowthEquity
Credit Equity
Infrastructure & Power
Renewable Energy Sponsor, Private Equity Sponsor and Credit/Mezzanine
Fund Manager of the Year 2019
Infrastructure & Power
Best Real Assets Manager
Corporate Private Equity
Top 20 Private Equity Performance Rankings – Year 2020
Ares Private Equity
Top 2 Distressed Debt Investor of the Year in North America
We Have Received Numerous Accolades1
As of June 30, 2021, unless otherwise noted. Please refer to Endnotes for additional important information.1. The performance, awards/ratings noted herein relate only to selected funds/strategies and may not be representative of any given client’s experience and should not be viewed as indicative
of Ares’ past performance or its funds’ future performance. All investments involve risk, including loss of principal.

Ares Management Corporation Investor Day 2021 - Not for Publication or Distribution 95
Key Enablers Lead to Our Sustainable Competitive Advantages
People• 105+ PEG & 695+ Ares Investment Professionals1
• Deep Industry & Asset Class Experience
• Trusted & Creative Solutions Providers
Process• Consistent & Repeatable
• Highly Iterative Underwriting
• Systematic Value Creation
Culture• Emphasis on Platform Collaboration
• Performance Through Teamwork
• Transparency & Active Communication
Key Enablers
Robust Sourcing
Disciplined Underwriting
Creative, Flexible Structuring
Differentiated Experience Growing Companies
Sustainable Competitive Advantages
Hybrid Traditional & Distressed Experience
1. As of June 30, 2021. Total investment professionals includes approximately 108 investment professionals for the acquisition of Black Creek Group, which closed on July 1, 2021.

Ares Management Corporation Investor Day 2021 - Not for Publication or Distribution 96
$0.7 $0.7 $1.0
$2.9 $3.6
$6.1 $7.0
$7.8 $7.4
$10.1 $9.9
$14.1
$21.1
$25.0 $24.5 $23.5
$25.2
$27.4
$30.7
2003 2004 2005 2006 2007 2008 2009 2010 2011 2012 2013 2014 2015 2016 2017 2018 2019 2020 Q2-21
Corporate Private Equity AUM Special Opportunities AUM Infrastructure & Power AUM
We Are Built to Scale and Our Growth Has Outpaced the Market
ACOF I $751M
ACOF II $2.1B
ACOF III $3.5B
ACOF IV $4.7B
EIF V$800M
ACOF V $7.8B
ASOF I$3.5B
AEVF$1.2BAEOF
$1.1B22%PEG AUM CAGR1
Since 2003
14%Market CAGR1
Since 2003
vs.
As of June 30, 2021, unless otherwise stated.1. Reflects private equity assets under management as of December 31, 2020. Market data per Preqin. Includes Private Equity (excluding Venture Capital), Distressed Debt, and Special Situations funds.

Ares Management Corporation Investor Day 2021 - Not for Publication or Distribution 97
$1,781
$2,528
$3,407
$4,625
$5,157
$0
$1,000
$2,000
$3,000
$4,000
$5,000
$6,000
2017 2018 2019 2020 1H 2021
We Have Invested in Our Team and Processes to Scale Deployment
Private Equity Deployment
~3xGrowth Over Past 5 Years
$2,792
Annualized Deployment
Seek to Deploy Approx.
$4-5B+per Year
Annual Deployment Targets
$0.3-$0.5B
Infrastructure & Power
$1.5-$2.5B+
ASOF
$1.5-$2.5B+
ACOF
ACOF (Ex-Energy)1 ASOF2 Infrastructure & Power3
($ in millions)
There is no guarantee deployment will occur as described above. Please refer to Endnotes for additional important information.

Ares Management Corporation Investor Day 2021 - Not for Publication or Distribution 98
Corporate OpportunitiesACOF Overview and Performance
Middle-and-Upper Middle Market Focus
Blend of Traditional and Distressed Strategies
Typically Control or Shared Control Ownership
Rigorous and Systematic Value Creation Framework
Focus on Great, Growing Companies
42%
27% 28%21%
Healthcare Services / Technology Consumer / Retail Industrials
3.6x
2.1x 2.1x2.3x
Core Industries Performance2Aggregate Performance1
$18.4BInvested Capital
$24.4BRealized Proceeds
Net MIC / IRR: 1.7x / 15%
22% 25%
Aggregate Ex-Energy
2.0x 2.4x
Net MIC / IRR: 2.1x / 18%
Investment performance is as of June 30, 2021 and reflects realized and unrealized investments. No assurance can be made that unrealized values will be realized as indicated; past performance is not indicative of future results. Net IRRs arenot shown for Core Industries Performance because doing so would require arbitrary assumptions about the allocation of management fees, carried interest and other expenses. Please refer to Endnotes for additional important information.
Gross IRR / MICGross IRR / MIC

Ares Management Corporation Investor Day 2021 - Not for Publication or Distribution 99
Corporate OpportunitiesSystematically Growing Companies is A Key to Our Success
Please refer to Endnotes for additional important information.
~72%Of Our
ReturnsGenerated by
EBITDA Growth3
We Identify Systems for Growth… Our Ability to Grow EBITDA
Rec
ent
Inve
stm
ents
2H
isto
rica
l In
vest
men
ts1…Where We Can Primarily Drive Top Line Growth…
…And Opportunistically Find Margin Improvements
Salesforce Growth &
Effectiveness
Strategic, Integrated M&A
New ServicesMulti-Unit Expansion
New ProductsGeographic Expansion
Tuck-In M&A E-Commerce
Expand into Ancillaries
Grow Customer Base
SynergiesSame Store
Sales
ProcurementTechnology Efficiencies
Economies of Scale
Pricing
Quality of Service
Invest in TalentWin New Contracts
Strategic Partnerships

Ares Management Corporation Investor Day 2021 - Not for Publication or Distribution 100
Corporate Opportunities ACOF’s Competitive Differentiation
Past performance is not indicative of future return.
Leverages Platform Competitive Advantages
Focus on Core Industries
Traditional & Distressed Expertise
Advantaged Deal Flow
Creative Solutions Provider
Differentiated Value Creation
Middle Market Approach Areas of Expertise
with Breadth and Depth
Attractive Relative Value Identification Capabilities
Enabled by Go-to-Market Approach and Relationships/ Network
Positioned as a “Partner of Choice”
Combine Proprietary “Playbook” and Robust Portfolio Management

Ares Management Corporation Investor Day 2021 - Not for Publication or Distribution 101
Special OpportunitiesASOF Overview and Performance
ASOF I Has Generated Strong Performance with Consistent, “All-Weather” Deployment Across Credit Cycles
67.9%
52.2%
Gross IRR Net IRR
MIC: 1.4x
MIC: 1.5x
$4.1BDeployed since 2019
0.1%Loss Ratio
41:1Winners-to-Losers Ratio
“All-Weather” Special Situations and Distressed Strategy
Focus on Middle Market Companies Undergoing Transformational Change
Targets Debt and Non-Control Equity
Offers Leadership, Capital Flexibility and Structuring Expertise
Assists Non-Distressed Businesses to Unlock Value
Helps Distressed Businesses Return to Health
As of June 30, 2021. Past performance is not indicative of future results and reflects realized and unrealized investments. No assurance can be made that unrealized values will be realized as indicated.Deployment includes $329 million of commitments to CBB, McLaren and Hertz that were signed transactions yet to close as of June 30, 2021. $175 million in CBB has yet to close as of August 3, 2021, is subjectto closing conditions, and there is no guarantee that the transaction will close. Hertz $8 million follow-on closed in July 2021 and McLaren $146 million investment closed in August 2021. Please refer toEndnotes for additional important information.
12%
8%
8%
8%
7%7%7%
6%
4%
33%
Diversified Telecommunication Services
Media
Construction & Engineering
Automobiles
Specialty Retail
Aerospace & Defense
Transportation Infrastructure
Metals & Mining
Gas Utilities
Other (<4%)
(Transaction Type and Industry Diversification, % of ASOF I Current Cost & Commitments)
22%Public
78%Private

Ares Management Corporation Investor Day 2021 - Not for Publication or Distribution 102
$23
$237
$484
$257
$311
$176
$48
$1,536
$560
$40
$358
$319
$307
$693
$291
$2,568
$0
$500
$1,000
$1,500
$2,000
$2,500
$3,000
$3,500
$4,000
$4,500
Special OpportunitiesInvesting In and Catalyzing Transformational Change Across Market Environments
Logos denote first period when an investment / commitment became a core position. Deployment includes $329 million of commitments to CBB, McLaren and Hertz that were signed transactions yet to closeas of June 30, 2021. $175 million in CBB has yet to close as of August 3, 2021, is subject to closing conditions, and there is no guarantee that the transaction will close. Hertz $8 million follow-on closed in July2021 and McLaren $146 million investment closed in August 2021. Please refer to Endnotes for additional important information.
ASOF I Gross Deployment Since Inception1
($ in millions)
Phase 1:Pre-Pandemic
Phase 2:Pandemic
Phase 3:Start of Emergence
Phase 4:Benign Market
Pub
lic
Inve
stm
ents
Priv
ate
Inve
stm
ents
2019 – Feb 2020 Mar 2020 Q2 2020 Q3 2020 Q4 2020 Q1 2021 Q2 2021Total Gross Deployment
2
EETC Portfolio
$4,104

Ares Management Corporation Investor Day 2021 - Not for Publication or Distribution 103
Special OpportunitiesASOF’s Competitive Differentiation
“All Weather”
Deployment
Private & Public
Relative Value Lens
Advantaged Private
Deal Flow
Middle Market Focus
Capital Partner of
Choice
Experienced Team
Invest in Non-Distressed Special
Situations and Stressed / Distressed
Opportunities Across Cycles
Leverage One of the Largest Direct Lending
Platforms to Source Private
Opportunities
Seek to Catalyze Solutions that
Enhance Enterprise Value
Target What We Believe to Be the Most
Attractive Opportunities
Across Private and Public Markets
Lends to and Leverages Platform Competitive
Advantages
History of Generating Attractive Returns
Utilizing a Consistent, Repeatable
Investment Process

Ares Management Corporation Investor Day 2021 - Not for Publication or Distribution 104
Infrastructure & PowerAIP Overview and Performance
Value-Add and Flexible Strategy Targets Climate Infra Assets
Cycle-tested Across Subsectors and the Asset Life Cycle
Structuring Supports Late-Stage Development and Asset Optimization
ESG Plays an Integral Role at Every Stage of the Investment Process
Benefits from the Scale and Resources of the Ares Platform
We Have a Demonstrated Track Record of Structuring and Managing Complex Assets
$9B+Historical Deployment
$3B+In Climate Infrastructure
18.6%13.0%
57.3%
Gross IRR Net IRR ClimateGross IRR
MIC: 1.4x
MIC: 1.8x
MIC: 1.3x
AEIF V Performance1
As of June 30, 2021. Please refer to Endnotes for additional important information. Past performance is not indicative of future return.

Ares Management Corporation Investor Day 2021 - Not for Publication or Distribution 105
Infrastructure & PowerClimate Infrastructure is the Largest and Fastest Growing Infra Sector
Climate Infrastructure is the Largest Infra Sector in the U.S.
Historical Climate Infrastructure Investment in the U.S. (2016-2020)2
Estimated Global Energy Investment (2050)3
The U.S. is the Most Active Climate Infra Market in the OECD
68%
30%
2%
Renewable Power Fossil Fuel Nuclear
68%Renewables expected to be the largest share of
global power investment by 2050
$30T
U.S. climate infrastructure has outpaced all other infrastructure sectors in total value and number of transactions1
Source: IJ Global and Bloomberg New Energy Finance. Transactions include asset acquisitions, primary financings, and portfolio financings. Excludes corporate acquisitions. Projections and forward looking statements are not reliable indicators of future events and there is no guarantee that such activities will occur as expected or at all. 1. Over the past five years (2016-2020). 2. Climate infrastructure includes all renewables sub-sectors (wind, solar, storage, hydro, nuclear, biomass, biofuels, etc.) and transmission. 3. Source: Bloomberg New Energy Finance.

Ares Management Corporation Investor Day 2021 - Not for Publication or Distribution 106
Infrastructure & PowerAIP’s Competitive Differentiation
Invested in Power and Infrastructure
Opportunities Across Cycles
Spanning Several Decades
History of Generating
Attractive Risk-Adjusted Returns
Utilizing a Consistent, Repeatable
Investment Strategy
Proactively Mitigate Risks Throughout the Asset Lifecycle
Local Relationships
Support Origination,
Diligence, and Management
Positions AIP as a Partner of Choice
Leverage Ares Experience to
Support Sourcing,
Diligence, and Risk Management
Deep Experience
Across Sectors and
Through Cycles
Deep and Local
Sourcing Capabilities
Value-Add and
Flexible Capital
Strategy
Demonstrated History of
Structuring & Managing
Complex Assets
Dedicated Asset
Management Team
Advantaged by Ares
Platform
Past performance is not indicative of future results.

Ares Management Corporation Investor Day 2021 - Not for Publication or Distribution 107
Private Equity FRE Has Grown as the Business Has Scaled
$23
$31
2015 Q2-21
Corporate Opportunities Special Opportunities Infrastructure & Power
34%
Private Equity Business Line Fee Related Earnings (FRE)
Private Equity Assets Under Management1
$84
$99
2015 LTM Q2-21
18%
As of June 30, 2021, unless otherwise stated. There can be no guarantee that Ares can or will sustain such growth.
($ in billions)($ in millions)

Ares Management Corporation Investor Day 2021 - Not for Publication or Distribution 108
Looking Ahead: We Believe We Have Several Avenues for Growth
Corporate OpportunitiesSpecial Opportunities Climate Infrastructure
$31BAUM Today
Scale Flagship
Funds
New Product Development
Sector-focused
Geographical-focused
Growth-focused
Infrastructure Equity
Continuation Funds
Retail Investor-oriented
Impact Funds
Our growth will be driven by our focus on industry-leading investment performance through both organic and M&A opportunities
As of June 30, 2021. Projections and forward looking statements are not reliable indicators of future events and there is no guarantee that such activities will occur as expected or at all.

Ares Management Corporation Investor Day 2021 - Not for Publication or DistributionAres Management Corporation Investor Day 2021 - Not for Publication or Distribution
David RothHead of U.S. Real Estate Private Equity
Real Estate Overview & Outlook

Ares Management Corporation Investor Day 2021 - Not for Publication or Distribution 110
Ares Real Estate Group Overview
U.S. Real Estate Equity
58%
EU Real Estate Equity
17%
Real Estate Debt25%
ByStrategy
$33.4BIn Real Estate AUM
Cycle-Tested Team with Deep Sector, Geographic and Structuring Experience
Consistent, Attractive Performance Across All RealEstate Strategies
Complementary Strategies Investing Across Sectors with Dedicated Industrial Vertically Integrated Capability
Disciplined and Repeatable Investment Process
Scaled Platform with Significant Opportunity for Growth
As of June 30, 2021, unless otherwise stated. All information includes the acquisition of Black Creek Group, which closed on July 1, 2021.1. Includes offices and market coverage locations.2. As of March 31, 2021. Includes the acquisition of Black Creek Group, which closed on July 1, 2021.
~195Investment Professionals
~28%Permanent Capital and perpetual
non-traded REITs
17Offices1
420+Investments2
Key Differentiators & Advantages
Our Real Estate Group combines long standing relationships, local market intelligence, and deep property-level experience to seek to drive differentiated results

Ares Management Corporation Investor Day 2021 - Not for Publication or Distribution 111
Global Real Estate Is One of the Largest Addressable Markets
1. Source: KBW North American Research, July 2019.2. Source: Real Capital Analytics, June 2021.
$~30TGlobal
Commercial Real Estate
Market1
2020 U.S. Transactions by Property Type2 2020 EU Transactions by Property Type2
23%
26%
40%
8%
3%
40%
17%
24%
15%
4%
We believe Ares is well positioned in the global real estate market with a focus on the liquid property types
Office Industrial Multi-Family Retail Hotel Ares RE Group Focus

Ares Management Corporation Investor Day 2021 - Not for Publication or Distribution 112
Portfolio of real estate debt and equity investments located across major markets and growth submarkets
Current U.S. Real Estate Portfolio1,2
Ares Real Estate U.S. Office
Ares Real Estate Market Coverage Location3
Additional Business Operations / Support Office4
Atlanta
Chicago
New York
Los Angeles
West
South30%
EastMidwest13%
23%34%
Denver
El Segundo
Newport Beach
Dallas
West Hartford
Rutherford
Washington, D.C.
London
ParisLuxembourg
2%
31%
9%
5%
2%
35%
0.3%
7%
1%
1%
2%
2%
Madrid
Frankfurt
1%
Amsterdam
Portfolio of real estate equity investments focused in the major cities across 13 European countries
Current European Real Estate Portfolio1
Ares Real Estate European Office
Ares Real Estate Market Coverage Location3
Additional Business Operations/ Support Office4
Global Real Estate Platform with Local Reach
As of March 31, 2021. Includes the acquisition of Black Creek Group, which closed on July 1, 2021. Please refer to Endnotes for additional important information.
Global presence with “boots on the ground” model of real estate professionals located across 17 offices in the U.S. and Europe

Ares Management Corporation Investor Day 2021 - Not for Publication or Distribution 113
Lower Return Target
Medium Return Target
Higher Return Target
Non-Traded REITs
Public REITs
Open-End
Closed-End
17 offices in the U.S. and EU
Extensive Sourcing Network
Deep Local Knowledge
Bottom-Up Underwriting
Execution Advantages
Industry Prominence
Comprehensive Product Coverage
As of June 30, 2021. Includes the acquisition of Black Creek Group, which closed on July 1, 2021.
Investment Spectrum
Core / Core-Plus Equity
$13.7BValue-Add Equity
$4.8BOpportunistic Equity
$6.5BReal Estate Debt
$8.4B
Benefits of Scale
Full suite of complementary products and strategies brings significant competitive advantages to industry partners and institutional and retail investors

Ares Management Corporation Investor Day 2021 - Not for Publication or Distribution 114
Investing Across All Strategies with Attractive Performance
Information as of June 30, 2021. Past performance is not indicative of future results. There is not guarantee or assurance investment objectives will be achieved. Returns shown are since inception for the most recent fund that reports performance in each respective strategy. Please refer to Endnotes for additional important information. *Since inception net returns are based on Class I Shares. Inception for the fund refers to the time period beginning on September 30, 2012, after converting to an NAV REIT on July 12, 2012.
Diversified Non-Traded REIT*
10%Gross Return3
/7% Net Return4
EPEP II
18%Gross IRR5
/14% Net IRR6
US IX
17%Gross IRR5
/14% Net IRR6
AREOF II
31%Gross IRR5
/27% Net IRR6
EF V
25%Gross IRR5
/16% Net IRR6
Real Estate Debt
Debt Core / Core-Plus Value-Add Opportunistic
Unlevered
7%Gross Return1
/6% Net Return2
Levered
9%Gross Return1
/8% Net Return2

Ares Management Corporation Investor Day 2021 - Not for Publication or Distribution 115
Deliberate and Resilient Portfolio Construction
3.6%
-4.2%
3.4%6.4%
9.2%7.6%
14.3%
Q4-19 Q1-20 Q2-20 Q3-20 Q4-20 Q1-21 Q2-21
U.S. Equity Quarterly Gross Returns
4.9%
-3.5%
4.4%
1.7%
4.5%
6.8%
10.0%
Q4-19 Q1-20 Q2-20 Q3-20 Q4-20 Q1-21 Q2-21
EU Equity Quarterly Gross Returns
Equity Fund Returns Have Rebounded2
Overweight
Industrial Residential
~65% as of Q1-20
Underweight
X RetailX Hospitality
~5% as of Q1-20
Focus on Resilient Property Types1
Net returns for U.S. equity were 3.6%, -3.5%, 2.6%, 5.2%, 6.2%, 5.7% and 12.2% in Q4-19, Q1-20, Q2-20, Q3-20, Q4-20, Q1-21 and Q2-21, respectively. Net returns for EU equity were 4.9%, -4.0%, 3.2%, 0.2%, 3.8%, 6.0% and 8.2% in Q4-19, Q1-20, Q2-20, Q3-20, Q4-20, Q1-21 and Q2-21, respectively. Please refer to Endnotes for additional important information.
Our focus on resilient property types led to strong performance through COVID

Ares Management Corporation Investor Day 2021 - Not for Publication or Distribution 116
Sector Ares View1
Industrial
Multifamily
Adjacent Sectors(SFR, Med. Office / Life Science)
Hospitality
Office
Retail
Opportunities Driven by Acceleration of Secular Growth Trends and Tactical Situations Where We Can Provide Capital and
Cycle-Tested Solutions
Leisure and Business Travel
Penetration of E-commerce
Remote Work
Institutionalization of Niche Sectors
Office De-densification
Suburban Versus Urban Living
Key Drivers in Real Estate That Support Our Investment Approach
Based on Ares' Real Estate Group's current observations of the market as of June 2021. Please refer to Endnotes for additional important information.
We continue to position our portfolios in property types with sustainable long-term demand drivers

Ares Management Corporation Investor Day 2021 - Not for Publication or Distribution 117
Performance and Acquisitions Have Supported AUM Growth
$10.3
$33.4
2015 Q2-21
Includes Black Creek
GroupAcquisition
$1.7
$5.5
0
1
2
3
4
5
6
7
8
9
10
2015 Q2-21 LTM
Total Gross Capital Raised2
AUM Growth1
30%Increase in average commitment size
of top 10 largest investors*
40%+Growth in number of
institutional investors*
28%of AUM in Permanent Capital and
perpetual non-traded REITs3
~90% Organic AUM Growth
There can be no guarantee that Ares can or will sustain such growth. Please refer to Endnotes for additional important information.*Excludes Black Creek Group.
AUM growth and growth in our investor base are products of our strong track record
($ in billions)
($ in billions)

Ares Management Corporation Investor Day 2021 - Not for Publication or Distribution 118
€ 327 € 513
€ 665
€ 954
0
200
400
600
800
1000
1200
2nd EU Value-Add Fund 3rd EU Value-Add Fund
First CloseAdditional Amounts Raised in Subsequent Closings
As of 6/30/21
$1,302
$1,968
EF IV EF V
$415
$1,697
AREOF II AREOF III
Consistent Growth in Successor Funds
There can be no guarantee that Ares can or will sustain such growth.
U.S. Opportunistic StrategyU.S. Value-Add Strategy
EU Opportunistic StrategyEU Value-Add Strategy
49%
51%
Strong, consistent performance allows Ares to steadily increase fund size, on average, by 70% for each successor vehicle
$415
$740
$1,040
0
200
400
600
800
1000
1200
9th U.S. Value-Add Fund 10th U.S. Value-Add Fund
First CloseAdditional Amounts Raised in Subsequent Closings
40%
60%
($ in millions)
(€ in millions)
($ in millions)
($ in millions)

Ares Management Corporation Investor Day 2021 - Not for Publication or Distribution 119
Expanding Profitability
$13
$39
2015 Q2-21 LTM
Fee
Rel
ated
Ear
nin
gs
($ m
m)
Real Estate Group Business Line Fee Related Earnings (FRE)1
Real Estate Group Business Line FRE Margins1
19%
35%
2015 Q2-21 LTM
FRE
Mar
gin
FRE margins have grown by over 80%1 since 2015
FRE has grown by over 3x1 since 2015
AUM Growth has Driven Enhanced Scaling of the Real Estate Group
There can be no guarantee that Ares can or will sustain such growth.1. Pre-Operations Management Group.
Black Creek Group would have increased the Real Estate Group management and
other fees by ~60% for 1H-21
The Real Estate Group has become more profitable with scale
($ in millions)

Ares Management Corporation Investor Day 2021 - Not for Publication or Distribution 120
Core / Core-Plus - Majority of Global Real Estate AUM & Growing Faster1
Retail Investors are Underallocated to Real Estate and Alternatives1
Growth in E-Commerce Retail Sales is Driving Industrial Demand4
Additional Key Macro Drivers in Real Estate
Retail Investor Allocation $80 Trillion Market Opportunity3
Alternatives6%
Real Estate<1%
Remaining94%
<0.5%Retail wallet share is allocated to RE
Core / Core-Plus54%
Other
$44
$197
Q1-11 Q1-21
Industrial Property Demand ~$5 Trillion Global Opportunity5
Please refer to Endnotes for additional important information.
Global Real Estate AUM by Strategy
2x fasterAUM growth in core core-plus vs.
value-add and opportunistic2
9%Allocation to RE for Institutional
Investors
Vs.
($ in billions of E-Commerce Retail Sales)

Ares Management Corporation Investor Day 2021 - Not for Publication or Distribution 121
Acquisition of Black Creek Group Enhances Growth Outlook
Identify Opportunity and Build Platform
Next Steps: Integrate Platform to Expand and Drive Scale
Expand across global institutional investor base
Increase the number of global retail partners
Leverage Ares investing capabilities and relationships
Drive efficiencies through vertical integration
Expand products offered through the broker dealer
Leading Core / Core-Plus Investor
Market-Leading Retail Distribution Platform
Significant Industrial Capabilities
Highly complementary combination of investment products, people and resources

Ares Management Corporation Investor Day 2021 - Not for Publication or Distribution 122
Significant Market Opportunity with a Leading Retail Platform
Non-Traded REIT Fundraising is Dominated by the Top 3 Platforms1
$27.3
Capital Raised since 2018
$ Capital Raised of Top 3 Non-Traded REITs$ Capital Raised of Remaining Non-Traded REITs
Ares’ Leading Retail Platform
In 2020 based on dollars raised as measured by Stanger2
#2Non-Traded REIT
Cumulative capital raised since 20103
29%CAGR
Individuals invested100,000+
Relationships with financial professionals~5,000
187% Growth
-11% Contraction
Vs.
As of December 31, 2020, unless otherwise stated. Please refer to Endnotes for additional important information.
% Growth/Contraction in Annual Capital Raised from 2018 to 2020
Top 3 Non-Traded REIT Platforms Raised 85%
of Capital (includes Ares’ Broker Dealer)
Remaining Non-Traded REIT Platforms
Black Creek Group’s retail platform is a strategic asset to support future growth

Ares Management Corporation Investor Day 2021 - Not for Publication or Distribution 123
Future Growth Opportunities for the Ares Real Estate Group
Forward looking statements are not reliable indicators of future events and no guarantee or assurance is given that such activities will occur as expected or at all. Actual events or conditions are unlikely to be consistent with, and may differ materially from, those assumed.
We believe the Ares Real Estate Group is well positioned to meet our target of doubling in size over the next 5 years
Scale Existing Strategies
• Use strong investment performance to further drive capital flows
• Continue to grow successor funds or similar strategies
• Realize revenue synergies from Black Creek acquisition
Pursue Accretive New Strategies, Products and
Markets
Broaden Investor Base
• New adjacent strategies
• Increase perpetual capital product offerings over time
• New geographies
• Increase relevance of Ares products in the retail channel
• Expand Black Creek’s investor base with Ares global institutional relationships

Ares Management Corporation Investor Day 2021 - Not for Publication or DistributionAres Management Corporation Investor Day 2021 - Not for Publication or Distribution
Francisco BorgesCo-Head of Secondary Solutions Group
Secondary Solutions Overview & Outlook

Ares Management Corporation Investor Day 2021 - Not for Publication or Distribution 125
Ares Secondary Solutions
45+Investment Professionals
55+ Active Funds
800+Sponsors
2,400+Investments
Private Equity63%
Real Estate29%
Infrastructure 8%
By Strategy
$19.5BIn Secondary Solutions AUM
Across Secondary Solutions Platform
A history of product innovation and client solutions
Average senior management tenure of 19 years
Growing and expanding end markets
New products to enhance growth potential
Key Differentiators & Advantages:
One of the most experienced secondary investors
As of June 30, 2021.
The recent acquisition of Landmark Partners moves Ares into a leadership position in the rapidly growing secondaries market

Ares Management Corporation Investor Day 2021 - Not for Publication or Distribution 126
Private EquitySecondary Investing
Since 199011 Partners & Managing Directors with
21 Years of Experience on Average
25 Investment Professionals
Real EstateSecondary Investing
Since 1996
9 Partners & Managing Directors with
22 Years of Experience on Average
19 Investment Professionals
Infrastructure Secondary Investing
Since 2015
Landmark Partners Leadership and Team
16 Partners & Managing Directors with
19 Years of Experience on Average
23 Investment Professionals
As of June 30, 2021. Investment professionals, partners and managing directors share responsibilities across investment strategies.
Long-tenured team with deep and broad experience across alternative asset classes
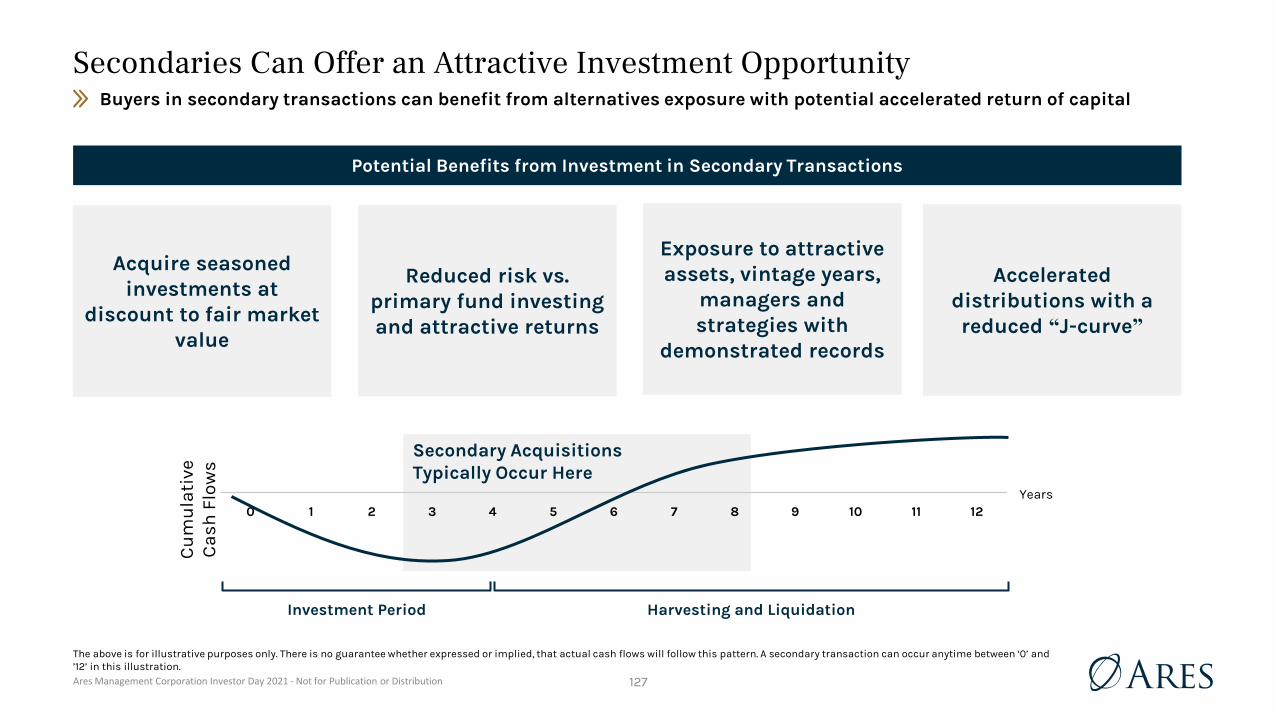
Ares Management Corporation Investor Day 2021 - Not for Publication or Distribution 127
Secondaries Can Offer an Attractive Investment Opportunity
Potential Benefits from Investment in Secondary Transactions
Reduced risk vs. primary fund investing and attractive returns
Exposure to attractive assets, vintage years,
managers and strategies with
demonstrated records
Acquire seasoned investments at
discount to fair market value
Accelerated distributions with a reduced “J-curve”
Secondary AcquisitionsTypically Occur Here
Investment Period Harvesting and Liquidation
0 1 2 3 4 5 6 7 8 9 10 11 12Years
Cu
mu
lati
ve
Ca
sh F
low
s
The above is for illustrative purposes only. There is no guarantee whether expressed or implied, that actual cash flows will follow this pattern. A secondary transaction can occur anytime between ‘0’ and ’12’ in this illustration.
Buyers in secondary transactions can benefit from alternatives exposure with potential accelerated return of capital

Ares Management Corporation Investor Day 2021 - Not for Publication or Distribution 128
Sellers Pursue Secondary Transactions for a Variety of Reasons
Continuation Fund
Fund Level Preferred Equity
Minority Equity Sell-Down
Strip Sale
Sub-Portfolio Divestment
Whole-Fund Liquidity Option
Source: Credit Suisse: Redefining Private Equity in the 2020s, and Landmark Partners.
LP-Led Transactions GP-Led Transactions
Portfolio Management
Regulatory Pressure
Non-Core Asset
Distressed
Liquidity Driven
Unfunded Relief
Secondaries may offer various liquidity solutions to both LP & GP counterparties

Ares Management Corporation Investor Day 2021 - Not for Publication or Distribution 129
We Believe the Secondaries Market is Attractive and Growing
$34
$50
$66$71
$60
$100
2016 2017 2018 2019 2020 2021E
($ in billions)
Private EquitySecondary Transaction Volume
Real EstateSecondary Transaction Volume
InfrastructureSecondary Transaction Volume
$5.0
$6.0
$5.3
$7.2
$8.5
$9.0
2016 2017 2018 2019 2020 2021E
All data as of December 31, 2020, unless otherwise stated.Sources: Landmark Partners, Evercore, Preqin. Private Equity 2020 Actuals and 2021 Estimates from PJT Park Hill, “FY 2020 Market Review, Secondary Investor Roadmap”, published in March 2021.Projections and forward-looking statements regarding market developments are based on assumptions that Landmark believes to be reasonable at this time. However, actual results may vary materially from stated expectations.
$2.2
$6.0$6.2
$6.7
$3.0
$7.5
2016 2017 2018 2019 2020 2021E
Secondary transaction volumes have seen notable increases over the past 5 years
($ in billions) ($ in billions)

Ares Management Corporation Investor Day 2021 - Not for Publication or Distribution 130
$6.7
$800
SecondaryVolume
AddressableMarket
($ in billions)
$8.5
$1,200
SecondaryVolume
AddressableMarket
($ in billions)
Secondary Solutions Are Just Scratching the Surface with Huge End Markets
$60
$4,200
SecondaryVolume
AddressableMarket
($ in billions)
Secondary Transaction
Volumes Represent
1.4%of the
Market Opportunity
Secondary Transaction
Volumes Represent
0.7%of the
Market Opportunity
Secondary Transaction
Volumes Represent
0.8%of the
Market Opportunity
1. Sources: Landmark Partners, Evercore, Preqin. Private Equity 2020 Actuals from PJT Park Hill, FY 2020 Market Review, Secondary Investor Roadmap, March 2021.2. Source: Preqin. Reflects private equity, real estate and infrastructure assets under management, respectively, as of December 31, 2020. Excludes venture capital, fund of funds and hybrid. Note
that within the “Private Equity Overview & Outlook” section, slide “Private Equity is a Large and Growing Market” shows a $5 trillion private equity market size, which includes fund of funds.
2 2 21 1 1
Secondaries transaction volumes represent a fraction of the addressable markets
Secondary Private Equity Secondary Real Estate Secondary Infrastructure

Ares Management Corporation Investor Day 2021 - Not for Publication or Distribution 131
Investment Transaction Types in Landmark Partners’ Most Recent Vintage Funds
Private Equity Secondary Fund:Landmark Equity Partners XVI
Real Estate Secondary Fund:Landmark Real Estate Fund VIII
Infrastructure Secondary Fund:Landmark Infrastructure Partners II
As of June 30, 2021. Diversification does not assure profit or protect against market loss.
LP Interests50%
Fund Recaps
47%
Non-Fund Recaps/Interests
3%
LP Interests12%
GP-led Solutions
29%Preferred
Structures59%
Fund Restructurings
20%
Preferred Structures
80%
Flexible suite of solutions spanning a wide variety of transaction types

Ares Management Corporation Investor Day 2021 - Not for Publication or Distribution 132
Secondary Private Equity
$11.2
$17.2
CapitalContributed
TotalValue
($ in billions)
17% Net IRR since
Inception in 1990
Secondary Real Estate
$4.7
$6.4
CapitalContributed
TotalValue
($ in billions)
25% Net IRR since
Inception in 1996
Secondary Infrastructure
$357.7
$489.1
CapitalContributed
TotalValue
($ in millions)
10% Net IRR since
Inception in 2015
All data as of December 31, 2020, unless otherwise stated. Performance results are unaudited. Past performance is not necessarily indicative of future results, nor does it ensure that investors will not incur a loss with respect to their investment. Includes realized and unrealized investments and no assurance can be made that unrealized values will be realized as indicated. Please refer to Endnotes for additional important information.
Landmark Partners Track RecordLandmark Partners’ strong track record on over $22 Billion invested since 1990

Ares Management Corporation Investor Day 2021 - Not for Publication or Distribution 133
$0.7
$1.6
$3.3
LREF VI LREF VII LREF VIII
Landmark Partners Fundraising is Growing and Expanding
As of April 30, 2021, unless otherwise stated. Dollars in billions. Represents partnership capital for each respective fund. There can be no guarantee that Ares can or will sustain such growth.
$2.0
$3.3
$4.9
LEP XIV LEP XV LEP XVI
Private Equity Fund Growth Real Estate Fund Growth
$0.5
$0.9
LRAP I LIP II
Infrastructure Fund Growth
(2008) (2017)(2013)
+48%
Landmark Partners has a history of larger successor funds and expanding into new industry verticals
(2010) (2017)(2014) (2015) (2018)
+65%
+106%
+123%
+83%

Ares Management Corporation Investor Day 2021 - Not for Publication or Distribution 134
Expansion of Private Markets
Private markets have grown at a 15% CAGR over the past 20 years1
Increased Trading Volumes
The share of private market assets that are sold in the
secondaries market is expected to increase with new secondary products
Step Functions in Innovation
Secondaries market is innovating new solutions for GP & LPs resulting in a rapidly expanding market, enabling private assets to
become more liquid
Key Drivers of Future Growth in the Secondaries Market
1. Source: Preqin from Dec. 2000 to Sept. 2020. Private Equity Net Asset Value defined as AUM less dry powder.
Leads To Creates
Secondaries market innovation should drive increased volumes through higher asset turnover and greater liquidity in private markets

Ares Management Corporation Investor Day 2021 - Not for Publication or Distribution 135
Long-Term Product Expansion Opportunities
Grow Size of Future Vintage Funds
Retail High Net Worth Secondaries Products
Insurance Products
Innovation In New Markets
& Geographies
There are exciting product expansion opportunities for the business

Ares Management Corporation Investor Day 2021 - Not for Publication or DistributionAres Management Corporation Investor Day 2021 - Not for Publication or Distribution
Michael AroughetiCo-Founder, Chief Executive Officer and President
New Platforms Overview & Outlook

Ares Management Corporation Investor Day 2021 - Not for Publication or Distribution 137
Ares Is Building Long-Term Attractive Businesses Within the Strategic Initiatives Group
Ares SSG72%
Ares Insurance Solutions (AIS)
18%
Ares Acquisition Corporation
(AAC)10%
By Strategy
$10.4BIn Strategic Initiatives AUM
Ares Insurance Solutions provides asset management, capital solutions and corporate
development services to insurance clients, including Aspida2
Ares Acquisition Corporation is our special purpose acquisition company seeking to make a
potential investment across a broad range of industries
Our Strategic Initiatives:
Ares SSG is one of the largest Asia-Pacific credit platforms
As of June 30, 2021.1. AUM managed by Ares Insurance Solutions excludes assets which are sub-advised by other Ares investment groups or invested in Ares funds and investment vehicles.2. Aspida is an indirectly-owned subsidiary of Ares Management Corporation.
Ares has three key strategic initiatives with significant long-term growth potential
1

Ares Management Corporation Investor Day 2021 - Not for Publication or Distribution 138
$7.5BIn Ares SSG AUM by Strategy
All data is as of June 30, 2021, unless otherwise noted. Past performance is not indicative of future results.
Our Growth Playbook & Ares SSG
Large and rapidly growing Asia-Pacific region. Direct Lending market beginning to take shape
Extensive coverage, tenured team, disciplined approach, track record of investment success
Growing our existing platform and expanding into new products (sponsor lending) withopportunity to expand into new asset types
Large Addressable End Markets
High Quality Platform & Team
Significant Growth Opportunities
Special Situations
67%
Secured Lending
33%
Recognized as a Leading Private Credit Firm in the Asia-Pacific Region

Ares Management Corporation Investor Day 2021 - Not for Publication or Distribution 139
A Growing Pan-Asian Non-Bank Lending Market
1. Source: Bloomberg. Countries under Asia-Pacific Bank Market include China, India, Japan, Korea, Australia, New Zealand, Singapore, Malaysia, Thailand, Indonesia, Philippines, Sri Lanka, Mongolia and Pakistan.
2. Source: Global Monitoring Report on NBFI 2020, Financial Stability Board. Assets of Non-Bank Financial Intermediaries defined as OFIs (Other Financial Intermediaries).
Asia Non-Bank Lending Growth2
0
5
10
15
20
25
2009 2014 2019
China Japan South Korea Australia
India Singapore Hong Kong Indonesia
($ in Trillions)
Long-term GDP Growth (2016-2030) by Region1
Macro Backdrop Drives Non-Bank Lending Opportunities
66%10%
8%
9%7%Asia-Pacific
US/CA
Europe
ME & Africa
Latam
Two-thirds of global GDP growth will come from the Asia-Pacific region Includes all forms of non-bank financed assets
With expanding GDP and credit demand, we believe there is a growing need for non-bank lenders

Ares Management Corporation Investor Day 2021 - Not for Publication or Distribution 140
Direct Lending Market Opportunity Across the Globe
Regional Breakdowns of Bank vs. Non-Bank Lending
Projections and forward looking statements are not reliable indicators of future events and no guarantee or assurance is given that such activities will occur as expected or at all.1. Sources: AsianInvestor “Asia’s $4tr funding gap luring private debt investors” (August 30, 2020)2. Includes U.S. and European Direct Lending. Based on Ares’ own calculations using information from Thomson Reuters, Deloitte, S&P Global Market Intelligence and Ares’ observations. As of March 31, 2021.3. Based on Ares SSG’s views of the market as of December 31, 2020.
We believe the total size of Asian financing market as well as its reliance on direct lending will grow significantly over time to resemble the composition in the US and Europe
US1,2
Bank (20%)
Non-Bank Lending Including:
$1.5 Trillion
of Direct Lending
Europe1,2
Bank (30%)
Non-Bank Lending Including:
$700 Billion
of Direct Lending
Asia1,3
Bank (>75%)
Non-Bank Lending Including:
$300+ Billionof Direct Lending
Asia still shows high reliance on domestic banking system to fuel the growth of economy

Ares Management Corporation Investor Day 2021 - Not for Publication or Distribution 141
i
Jakarta1
Mumbai1
Singapore
Mauritius
Shanghai
Bangkok2
New Delhi2
Sydney
Hong Kong
Significant Asia-Pacific Coverage
10Countries
Invested in
9Offices1
16Years 7 Founding
Members Have Worked Together on
AverageCountries invested
LEGEND:
As of June 30, 2021.1. Jakarta, Mumbai and New Delhi offices are operated by third parties with which Ares SSG maintains an ongoing relationship relating to the sourcing, acquisition and/or management of investments.2. Employees of local asset management companies (“AMCs”) and not Ares SSG employees; ACRE is 49% and Alpha is 51% owned by Ares SSG.
20Years Credit/Risk
Investing By Senior Team on Average
35+ Investment
Professionals
8Active Funds
Highly built-out regional footprint across 9 offices with local presence, infrastructure and licenses enabling onshore and offshore investments

Ares Management Corporation Investor Day 2021 - Not for Publication or Distribution 142
Strong Performance Driven by Low Loss Rates and Differentiated Market Opportunities
As of June 30, 2021, unless otherwise stated. Past performance is not indicative of future results. Please refer to Endnotes for additional important information.
Ares SSG has invested $7.8 Billion across the firm since inception with an attractive record of performance
74% $5.0B $7.8B of Capital Deployed1
19 bps Annualized Loss Rate Since Inception in 20094
34% / 22%Gross / Net IRR
since Inception in 20093
23% / 13%Gross / Net IRR
since Inception in 20153
Special Situations Series Senior Lending Series
Ares SSG Capital Deployment & Performance Track Record
Ares SSG Credit Results
Realized / of Proceeds2

Ares Management Corporation Investor Day 2021 - Not for Publication or Distribution 143
$1.6
$2.7
$4.0
$4.5
$6.4
$7.0
$7.5
2015 2016 2017 2018 2019 2020 Q2-21
Strong Performance Has Led to Significant AUM Growth
($ in billions)Ares SSG AUM Growth1
As of June 30, 2021, unless otherwise stated. Past performance is not indicative of future results. Please refer to Endnotes for additional important information.
Ares SSG has two strategies, Special Situations and Senior Lending, both gaining significant traction over the past 5 years
36% CAGR over the past
5 years

Ares Management Corporation Investor Day 2021 - Not for Publication or Distribution 144
Ares SSG’s Growth Opportunities
Extensive Runway for
Existing Products
As of June 30, 2021. Projections and forward-looking statements are not reliable indicators of future events and there is no guarantee that such activities will occur as expected or at all.
$17.0
$7.5
$19.0
Q2-21 2025E
Ares SSG Growth Targets
AUM($ in billions)
20-23%CAGR
UnitrancheSponsor Finance
Opportunities
Expand Into New Asset
Types
• As non-bank lending continues to penetrate, we expect significant growth for our existing series of funds
• Expand unitranche solutions to Australia, Korea, China and broader Asia-Pacific region
• Real Estate, Infrastructure, and Secondaries in the Asia-Pacific region
We are playing for a large expansion of the Ares SSG platform similar to the growth of our EU platform

Ares Management Corporation Investor Day 2021 - Not for Publication or Distribution 145
Ares Insurance Solutions – Aspida
$2.7BAIS Managed Aspida AUM 1
As of June 30, 2021. See Endnotes for additional important information.
Subadvised by 3rd Party
69%
Subadvised By Ares
31%
Aspida’s Annuity Platform Growth Strategy
Primary Origination1
Reinsurance2
M&A Activity3$38 TrillionInsurance Addressable Market2
AIS provides asset management, capital solutions and corporate development services to Ares’ modern life and annuity platform

Ares Management Corporation Investor Day 2021 - Not for Publication or Distribution 146
Utilize highly scalable, tech-enabled platform to drive future growth through primary issuance of annuities
Executed agreement to acquire U.S. insurance company to provide necessary state licenses
Expect to begin writing fixed annuity business in early 2022
Acquired an annuity platform1, rebranded as Aspida Financial, that has over 100 professionals and a strong track record in annuity distribution, reinsurance and M&A
Aspida’s Primary Origination PlatformWe are executing on our strategy with the launch of the Aspida U.S. annuity platform in 2022
Projections and forward looking statements are not reliable indicators of future events and no guarantee or assurance is given that such activities will occur as expected or at all.1. Aspida Financial is also licensed as a Third Party Insurance Administrator.

Ares Management Corporation Investor Day 2021 - Not for Publication or Distribution 147
Aspida’s Reinsurance Platform
2020 Ares launched Aspida Re with the acquisition of F&G Re $2.7B
in AUM1
Ares receives servicing fee on total AUM and additional fees on subadvised assets
40%-60%
Long-term target range subadvised by Ares$1B+
in current reinsurance annual flows1
Five reinsurance treaties, including two open to new business flow and pursuing additional opportunities
Projections and forward looking statements are not reliable indicators of future events and no guarantee or assurance is given that such activities will occur as expected or at all.1. As of June 30, 2021.
Aspida Re provides life and annuity reinsurance solutions to insurance partners
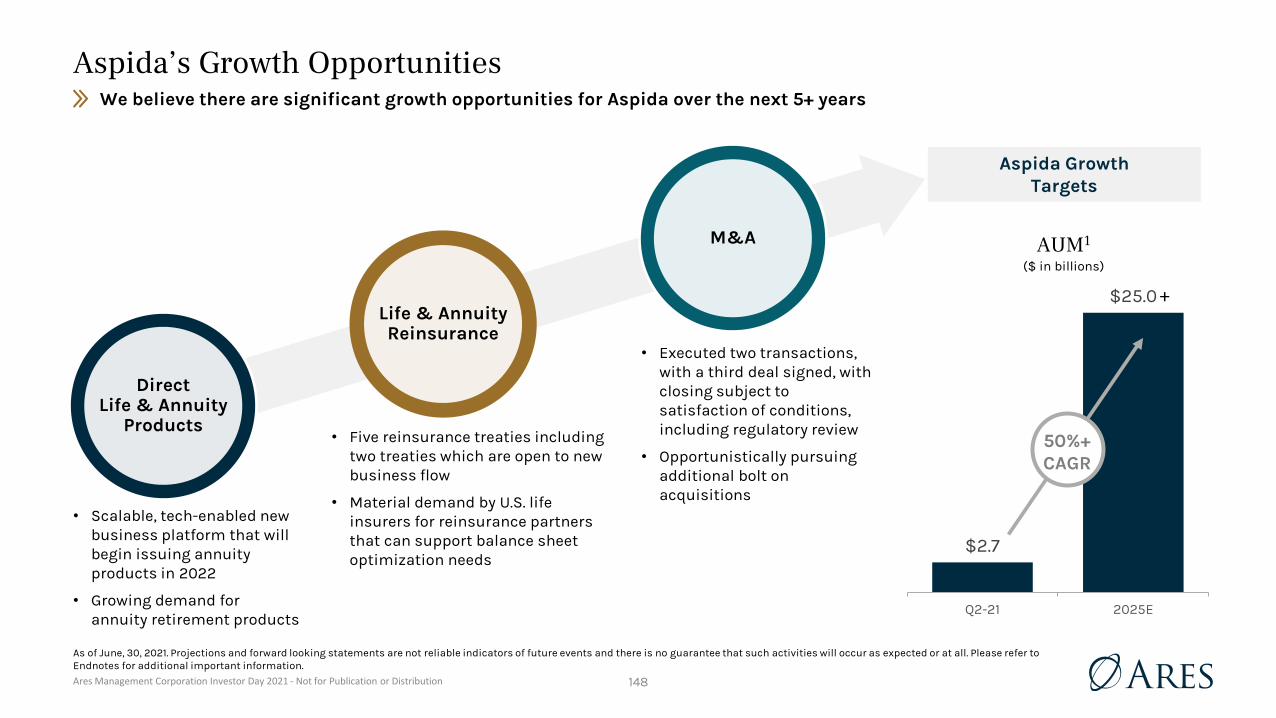
Ares Management Corporation Investor Day 2021 - Not for Publication or Distribution 148
Aspida’s Growth OpportunitiesWe believe there are significant growth opportunities for Aspida over the next 5+ years
Direct Life & Annuity
Products
$2.7
$25.0
Q2-21 2025E
Aspida Growth Targets
AUM1
($ in billions)
50%+CAGR
+Life & Annuity Reinsurance
M&A
• Scalable, tech-enabled new business platform that will begin issuing annuity products in 2022
• Growing demand for annuity retirement products
• Five reinsurance treaties including two treaties which are open to new business flow
• Material demand by U.S. life insurers for reinsurance partners that can support balance sheet optimization needs
• Executed two transactions, with a third deal signed, with closing subject to satisfaction of conditions, including regulatory review
• Opportunistically pursuing additional bolt on acquisitions
As of June, 30, 2021. Projections and forward looking statements are not reliable indicators of future events and there is no guarantee that such activities will occur as expected or at all. Please refer to Endnotes for additional important information.

Ares Management Corporation Investor Day 2021 - Not for Publication or DistributionAres Management Corporation Investor Day 2021 - Not for Publication or Distribution
Adam HeltzerHead of ESG
Michael AroughetiCo-Founder, Chief Executive Officer and President
Indhira ArringtonGlobal Chief Diversity, Equity and Inclusion Officer
Michelle ArmstrongHead of Philanthropy
Stakeholder Impact

Ares Management Corporation Investor Day 2021 - Not for Publication or Distribution 150
Our Purpose Driven Culture Positions Ares to Be a Leader
PurposeWe are a catalyst for shared prosperity and a better future
VisionWe are a leader in our industry in seeking to generate attractive returns and making a lasting positive impact
MissionWe invest to help businesses flourish and create enduring value for all of our stakeholders
CollaborativeWe achieve more together
ResponsibleWe strive to be a force for good
EntrepreneurialWe innovate and build
Self-AwareWe reflect and evolve
TrustworthyWe are dedicated stewards

Ares Management Corporation Investor Day 2021 - Not for Publication or Distribution 151
Translating Aspirations into ActionsToday we act on our purpose through three distinct but interconnected sets of activities
I M P A C T A T A R E S
Adam HeltzerHead of ESG
Indhira Arrington Chief DEI Officer
Michelle Armstrong Head of Philanthropy
ESG Integration into the Investment Platform and Ares’
OperationsDiversity, Equity, and Inclusion
Grants, Employment Engagement and Sponsorships
Corporate Sustainability People and Culture Ares Charitable Foundation
Responsible InvestmentBusiness &
Investment ProcessAres in Motion (“AIM”)
Thought Leadership Communities Corporate Contributions
| ESG | DEI | PHILANTHROPY

Ares Management Corporation Investor Day 2021 - Not for Publication or Distribution 152
ESG Makes Good Business SenseStrong ESG performance supports greater profitability and higher enterprise values1
Increased Cost Efficiencies
Improved Risk Management
Enhanced Employee Productivity and
Engagement
Greater Investment
Performance
Stronger Growth Prospects
ESG Economic Benefits2
1. Pension & Investments, ISS study links ESG performance to profitability, January 2020.2. McKinsey Quarterly, Five Ways that ESG Creates Value, November 2019.

Ares Management Corporation Investor Day 2021 - Not for Publication or Distribution 153
Equal commitment to Corporate Sustainability and Responsible Investment Practices
~90 ESG champions lead bespoke ESG integration efforts within each line of business
Head of ESG reports directly to Ares’ CEO and President
We are Building the ESG Program of the Future
Executive Priority
Distributed Resource Model
Lead by Example
We see three key markers of a differentiated ESG program in alternative investment management

Ares Management Corporation Investor Day 2021 - Not for Publication or Distribution 154
Our ESG Framework
Corporate SustainabilityDemonstrate our commitment
through industry-leading sustainability practices in our
own corporate operations
Responsible InvestmentScale sustainability practices
through our investment platform of over 3,000 companies & assets1
1. As of June 30, 2021.
Corporate Sustainability
“Lead By Example”
Responsible Investment
“Scale our Impact”
We have conviction in developing leading sustainability practices and then amplifying these principles through our investments

Ares Management Corporation Investor Day 2021 - Not for Publication or Distribution 155
Carbon neutral for Scope 1, 2, and 3 (business travel)
Publishing inaugural TCFD Report in May 2022
Sustainability Report
Sustainability Linked Lending
Thought Leadership
Inaugural report and disclosures published in May Tracking KPIs Inaugural disclosures for key public funds published in early July
Direct Lending ESG white paper published in April
Ares and its PE portfolio companies are undergoing a deep strategic review of our DEI practices to drive multi-year improvement
Great Places to Work certified
HRC Corporate Equality Index Score of 100% Measuring LGBTQ inclusion
Closed largest direct lending ESG linked loan - £1 billion credit facility to RSK Group, U.K.’s largest privately-owned multi-disciplinary environmental business
Climate Change
Recent Recognition
We commit to continued improvement in transparency and reporting as part of sustainability best practices
Recent ESG Successes and Results

Ares Management Corporation Investor Day 2021 - Not for Publication or Distribution
156
Diversity, Equity & Inclusion is a Business-Critical IssueDiversity, equity & inclusion are good for business, our investors and our stakeholders
Diversity
Equity
Inclusion
36%+ Ethnically diverse
companies more likely to outperform less diverse
organizations1
25%+ Gender diverse companies
more likely to outperform less diverse organizations
3xEmployees more likely to stay
at and recommend organizations that offer both
opportunity and fairness
52% Of employees of color will not
work for a company that fails to address racial inequality
39%Of global job seekers have turned down or
decided not to pursue a job opportunity because of a perceived lack of inclusion
2xYounger employees more likely to
raise the need for inclusion and diversity vs. older employees 2
DEI is Core to Our
Culture and
Performance
Source: McKinsey & Company, Diversity Wins 2020, 2019 Women in the Workplace research; Edelman Trust Barometer 2020.1. Ethnicity defined as all non-white ethnicities. In the US, also includes Hispanic/Latino of any race.2. Compares employees in middle-management under age 30 to employees in middle-management between ages 50-60.

Ares Management Corporation Investor Day 2021 - Not for Publication or Distribution 157
Diversity, Equity & Inclusion at Ares
People &
Culture
Attract
Develop
Engage
Advance
Investment Decisions
Investment Portfolio
Vendors
Industry Partnerships
Corporate Partnerships
Philanthropy
Business & Investment
ProcessCommunities
Data-Driven, Accountability-Based Approach
Our DEI framework and strategy aspires to harness the power of difference to be a force for good and contribute to the long-term success of Ares, the companies in which we invest, and the communities in which we operate.

Ares Management Corporation Investor Day 2021 - Not for Publication or Distribution 158
Operation AmpliFY DEI: Leading By Example
Diversity Assessment
Illustrates opportunities to enhance representation by
diversity dimension and level
DEI InfrastructureAssessment
Assesses the infrastructure necessary to operationalize and
integrate DEI into business decisions
Inclusion Assessment
Evaluates how team members are experiencing the organization by
diversity dimension
Ares and certain PE portfolio companies1 implemented a strategic review of DEI practices focusing on three main areas
Results
Multi-year strategic plans with informed goals and specific milestones for excellence
Investment professionals well prepared to be DEI champions
Upskilled our portfolio companies to drive DEI change
1. Includes a cohort of 10 portfolio companies within Ares’ Corporate Opportunities Private Equity strategy.

Ares Management Corporation Investor Day 2021 - Not for Publication or Distribution 159
Philanthropy Yields Returns Beyond Dollars and CentsOur commitment to “do good” reflects our core values and helps enhance our ability to attract and retain talent who embrace these ideals
Ares Charitable Foundation Ares in
Motion(“AIM”)
Corporate Contributions
PHILANTHROPYE
Volunteer opportunities and charitable matches to augment team members’ donations for causes that matter most to them
E501(c)(3) funded by Ares’ investment profits and employee donations to accelerate equality of economic opportunity for people globally
ESponsorships and support for charitable purposes in communities where Ares does business

Ares Management Corporation Investor Day 2021 - Not for Publication or Distribution 160
Employee Engagement Sponsorships & Support
Ares In Motion (“AIM”)
Corporate Contributions
Our Philanthropy Makes Us Distinctly DifferentWe lead by example, give back with intentionality and create opportunities for team members to give and get involved
1. Pledges over five years as of June 30, 2021.
Ares is committing apercentage of profits from
certain funds to charitable causes
Grants to nonprofits for:
Grantmaking
1,800+ volunteer hours in 2020
300+ team membersin 2020 who participated in
virtual service and fundraising events
$6.1 million contributedin 2020 for COVID relief, diversity programming and social justice
initiatives
We believe Pathfinder is the first institutional private investment fund
to utilize a predefined structure to make a substantial commitment
to charitable activities
$560,000+ in matching dollarsin 2020 to augment team members’
charitable donations
Career Preparation & Reskilling Entrepreneurship Personal Finance
$31 million in employee pledges1

Ares Management Corporation Investor Day 2021 - Not for Publication or Distribution 161
$30 million Career Preparation & Reskilling grant
Internship and career opportunities at partner firms
Collaboration with Apollo and Oaktree ($90 million in total over 10 years)1
Industry-first initiative to help attract, develop and provide professional opportunities for Historically Black College & University (“HBCU”) students to increase diversity in the alternatives industry
Mentored fellowship program and scholarships
Diverse and skilled talent pipeline for alternatives industry
Virtual institute for all HBCU students
AltFinance: Investing in Black Futures
1. Ares expects to contribute up to $30 million over 10 years. The actual amount contributed may be less than this amount.

Ares Management Corporation Investor Day 2021 - Not for Publication or Distribution 162
Integrated Approach Maximizes Impact
Our three integrated approaches to stakeholder impact arepurposefully designed to drive growth and accelerate results
We are committed to an integrated approach across the organization to maximize our impact

Ares Management Corporation Investor Day 2021 - Not for Publication or DistributionAres Management Corporation Investor Day 2021 - Not for Publication or Distribution
Michael AroughetiCo-Founder, Chief Executive Officer and President
Closing Remarks

Ares Management Corporation Investor Day 2021 - Not for Publication or Distribution 164
Closing Remarks
Management Fee Centric Business
Model
• Cultivate remarkable people and a differentiated culture
• Use consistent playbook that leverages our platform for growth through market cycles
• Operate in large addressable markets with leading businesses
• We are more diversified than we have ever been
• Recent acquisitions add to our outlook
• Each of the five groups can scale towards our $500 billion + goal
• Approach ESG and impact with purpose
Projections and forward-looking statements are not reliable indicators of future events and there is no guarantee that such activities will occur as expected or at all.

Ares Management Corporation Investor Day 2021 - Not for Publication or DistributionAres Management Corporation Investor Day 2021 - Not for Publication or Distribution
Q & A

Ares Management Corporation Investor Day 2021 - Not for Publication or DistributionAres Management Corporation Investor Day 2021 - Not for Publication or Distribution
Appendix

Ares Management Corporation Investor Day 2021 - Not for Publication or Distribution 167
GAAP Statement Of OperationsYear Ended December 31,
$ in thousands, except share data Q2-21 LTM 2020 2019 2018 2017 2016 2015 2014RevenuesManagement fees $1,307,451 $1,150,608 $979,417 $802,502 $722,419 $642,068 $634,399 $486,477Carried interest allocation 1,583,262 505,608 621,872 42,410 620,454 494,580 146,038 63,884Incentive fees 59,544 37,902 69,197 63,380 16,220 23,272 4,577 27,528Principal investment income (loss) 103,857 28,552 56,555 (1,455) 64,444 55,168 11,290 6,527Administrative, transaction and other fees 46,972 41,376 38,397 51,624 56,406 39,285 29,428 26,000Total revenues 3,101,086 1,764,046 1,765,438 958,461 1,479,943 1,254,373 825,732 610,416ExpensesCompensation and benefits 903,576 767,252 653,352 570,380 514,109 447,725 414,454 456,372Performance related compensation 1,212,720 404,116 497,181 30,254 479,722 387,846 111,683 170,028General, administrative and other expenses 289,602 258,999 270,219 215,964 196,730 159,776 224,798 166,839Transaction support expense — — — — 275,177 — — —Expenses of Consolidated Funds 28,903 20,119 42,045 53,764 39,020 21,073 18,105 66,800Total expenses 2,434,801 1,450,486 1,462,797 870,362 1,504,758 1,016,420 769,040 860,039Other income (expense)Net realized and unrealized gains (losses) on investments 9,146 (9,008) 9,554 (1,884) 8,262 (7,629) 12,913 26,206Interest and dividend income 9,745 8,071 7,506 7,028 7,043 4,493 6,851 6,639Interest expense (27,122) (24,908) (19,671) (21,448) (21,219) (17,981) (18,949) (8,617)Other income (expense), net (2,322) 11,291 (7,840) (851) 19,470 35,650 21,680 (2,422)Net realized and unrealized gains (losses) on investments of Consolidated Funds 84,850 (96,864) 15,136 (1,583) 100,124 (2,057) (24,616) 513,270Interest and other income of Consolidated Funds 463,830 463,652 395,599 337,875 187,721 138,943 117,373 937,835Interest expense of Consolidated Funds (259,777) (286,316) (277,745) (222,895) (126,727) (91,452) (78,819) (666,373)Total other income 278,350 65,918 122,539 96,242 174,674 59,967 24,792 806,538Income before taxes 944,635 379,478 425,180 184,341 149,859 297,920 81,484 556,915Income tax expense 125,400 54,993 52,376 32,202 (23,052) 11,019 19,064 11,253Net income 819,235 324,485 372,804 152,139 172,911 286,901 62,420 545,662Less: Net income attributable to non-controlling interests in Consolidated Funds 164,190 28,085 39,704 20,512 60,818 3,386 (5,686) 417,793Less: Net income attributable to redeemable interests in Consolidated Funds — — — — — — — 2,565Net income attributable to Ares Operating Group entities 655,045 296,400 333,100 131,627 112,093 283,515 68,106 125,304
Less: Net income (loss) attributable to redeemable interest in Ares Operating Group entities (607) (976) — — — 456 338 731
Less: Net income attributable to non-controlling interests in Ares Operating Group entities 328,823 145,234 184,216 74,607 35,915 171,251 48,390 89,585
Net income attributable to Ares Management Corporation 326,829 152,142 148,884 57,020 76,178 111,808 19,378 34,988Less: Series A Preferred Stock dividends paid 21,700 21,700 21,700 21,700 21,700 12,176 — —Less: Series A Preferred Stock redemption premium 11,239 — — — — — — —
Net income attributable to Ares Management Corporation Class A and non-voting common stockholders $293,890 $130,442 $127,184 $35,320 $54,478 $99,632 $19,378 $34,988
Net income per share of Class A and non-voting common stock:Basic $1.88 $0.89 $1.11 $0.30 $0.62 $1.22 $0.23 $0.43Diluted $1.82 $0.87 $1.06 $0.30 $0.62 $1.20 $0.23 $0.43Weighted-average shares of Class A and non-voting common stock:Basic N/A 135,065,436 107,914,953 96,023,147 81,838,007 80,749,671 80,673,360 80,358,036Diluted N/A 149,508,498 119,877,429 96,023,147 81,838,007 82,937,030 80,673,360 80,358,036Dividend declared and paid per share of Class A and non-voting common stock $1.74 $1.60 $1.28 $1.33 $1.13 $0.83 $0.88 $0.42

Ares Management Corporation Investor Day 2021 - Not for Publication or Distribution 168
RI and Other Measures Financial SummaryYear Ended December 31,
$ in thousands, except share data (and as otherwise noted) Q2-21 LTM 2020 2019 2018 2017 2016 2015 2014
Management fees(1) $1,335,413 $1,186,565 $1,012,530 $836,744 $744,825 $659,451 $650,918 $598,046
Other fees 25,993 19,948 18,078 24,288 22,431 12,351 4,599 6,300
Compensation and benefits expenses (673,939) (609,966) (528,207) (456,255) (413,735) (384,715) (360,622) (354,362)
General, administrative and other expenses (177,709) (172,097) (178,742) (149,465) (136,531) (114,737) (117,903) (102,720)
Fee Related Earnings 509,758 424,450 323,659 255,312 216,990 172,350 176,992 147,264
Realized net performance income 143,260 131,548 112,136 105,610 75,457 94,734 56,757 65,895
Realized net investment income 23,285 25,958 67,691 34,474 32,993 33,244 24,836 59,660
Realized Income 676,303 581,956 503,486 395,396 325,440 300,328 258,585 272,819
After-tax Realized Income, net of Series A Preferred Stock dividends(2) $614,690 $519,028 $436,666 $345,926 $273,624 $248,686 $224,417 $242,849
After-tax Realized Income per share of Class A and non-voting common stock, net of Series A Preferred Stock dividends(3) $2.12 $1.86 $1.67 $1.42 $1.08 $0.98 $0.83 $0.93
Other Data
Total Fee Revenue(4) $1,504,666 $1,338,061 $1,142,744 $966,642 $842,713 $766,536 $712,274 $670,241
Effective management fee rate(5) N/A 1.09% 1.10% 1.07% 1.06% 1.09% 1.15% 1.17%
All historical filings can be found on the SEC’s website.1. Includes Part I Fees of $204.7 million and $184.1 million for Q2-21 LTM and FY-20, respectively. 2. For Q2-21 LTM and FY-20, after-tax Realized Income includes current income tax related to: (i) realized performance and investment income of $22.7 million and $20.3 million, respectively and (ii)
FRE of $17.2 million and $20.9 million, respectively. Of the current tax related to FRE, this includes (a) entity level taxes of $13.5 million and $10.7 million, respectively, and (b) corporate level tax expense of $3.7 million and $10.2 million, respectively.
3. Calculation of after-tax Realized Income per share of Class A and non-voting common stock uses total average shares of Class A and non-voting common stock outstanding and proportional dilutive effects of the Ares' equity-based awards.
4. Total fee revenue is calculated as the total of management fees, other fees and realized net performance income.5. Effective management fee rate represents the quotient of management fees and the aggregate fee bases for the periods presented. The effective rate shown excludes the effect of one-time catch-up
fees.

Ares Management Corporation Investor Day 2021 - Not for Publication or Distribution 169
GAAP to Non-GAAP Reconciliation – Unconsolidated Reporting Basis
This table is a reconciliation of income before provision for income taxes on a GAAP basis to RI and FRE on an unconsolidated basis, which reflects the results of the reportable segments on a combined basis together with the Operations Management Group ("OMG"). The OMG’s expenses are not allocated to our reportable segments but management considers the cost structure of the OMG when evaluating our financial performance. Management uses this information to assess the performance of our reportable segments and OMG and believes that this information enhances the ability of shareholders to analyze our performance. 1. FY-19 includes a $20.0 million non-cash impairment charge on certain intangible assets2. For Q2-21 LTM and FY-20, equity compensation expense was attributable to the following: (i) IPO awards and other non-recurring awards of $64.2 million and $33.9 million, respectively; (ii) annual
bonus awards of $25.0 million and $39.1 million, respectively; and (iii) annual discretionary awards of $36.0 million and $50.0 million, respectively.3. Represents the amortization of a contingent liability not to exceed $300.0 million established in connection with the Landmark Acquisition that is based on the achievement of fundraising targets
for certain Landmark funds during a commitment period. The Company expects to settle with a combination of 15% cash and 85% equity awards that will vest over four years following the grant date. As of June 30, 2021, the fair value of the contingent liability is $236.0 million.
4. Q2-21 LTM and FY-20 includes a $9.7 million and $10.2 million non-cash unrealized guarantee expense that will reduce RI to the extent it is realized. FY-18 includes a $11.8 million payment to ARCC for rent and utilities for the years ended 2017, 2016, 2015 and 2014, and the first quarter of 2018.
Year Ended December 31,
$ in thousands Q2-21 LTM 2020 2019 2018 2017 2016 2015 2014
Realized Income and Fee Related Earnings:
Income before taxes $944,635 $379,478 $425,180 $184,341 $149,859 $297,920 $81,484 $556,915
Adjustments:
Amortization of intangibles(1) 42,938 21,195 23,460 9,032 17,850 26,638 46,227 27,610
Depreciation expense 20,937 19,467 17,142 16,055 12,631 8,215 6,942 7,346
Equity compensation expenses(2) 186,899 122,986 97,691 89,724 69,711 39,065 32,244 83,230
Management incentive plan(3) 4,630 — — — — — —
Acquisition and merger-related expenses 23,090 11,194 16,266 2,936 259,899 (16,902) 34,864 11,043
Deferred placement fees 4,921 19,329 24,306 20,343 19,765 6,424 8,825 14,753
Offering costs — — — 3 688 — — —
Other (income) expense, net(4) 9,742 10,207 (460) 13,486 (1,730) (1,728) 110 3,384
Net expense of non-controlling interests in consolidated subsidiaries (16,276) 3,817 2,951 3,343 1,739 — — —
(Income) loss before taxes of non-controlling interests in Consolidated Funds, net of eliminations (164,352) (28,203) (39,174) (20,643) (62,705) (2,649) 5,682 (415,075)
Total performance (income) loss—unrealized (1,089,180) 7,554 (303,142) 247,212 (325,915) (228,472) (31,647) (94,883)
Total performance related compensation—unrealized 800,625 (11,552) 206,799 (221,343) 237,392 189,582 46,492 89,429
Total net investment (income) loss—unrealized (92,306) 26,484 32,467 50,907 (53,744) (17,765) 27,362 (10,933)
Realized Income 676,303 581,956 503,486 395,396 325,440 300,328 258,585 272,819
Total performance income—realized (555,469) (547,216) (402,518) (357,207) (317,787) (292,998) (121,948) (146,494)
Total performance related compensation—realized 412,209 415,668 290,382 251,597 242,330 198,264 65,191 80,599
Total investment income—realized (23,285) (25,958) (67,691) (34,474) (32,993) (33,244) (24,836) (59,660)
Fee Related Earnings $509,758 $424,450 $323,659 $255,312 $216,990 $172,350 $176,992 $147,264

Ares Management Corporation Investor Day 2021 - Not for Publication or Distribution 170
GAAP to Non-GAAP Reconciliation – Unconsolidated Reporting Basis (cont'd)
These tables reconcile consolidated carried interest allocation and incentive fees reported in accordance with GAAP to unconsolidated realized performance income and consolidated GAAP other income to unconsolidated realized net investment income. These reconciliations show the results of the reportable segments on a combined basis together with the Operations Management Group ("OMG"). The OMG’s expenses are not allocated to our reportable segments but management considers the cost structure of the OMG when evaluating our financial performance. Management uses this information to assess the performance of our reportable segments and OMG and believes that this information enhances the ability of shareholders to analyze our performance.
1. Related to performance income for AREA Sponsor Holdings LLC. Changes in value of this investment are reflected within net realized and unrealized gains (losses) on investments in Ares' Consolidated Statements of Operations.
2. Q2-21 LTM and FY-20 includes a $9.7 million and $10.2 million non-cash unrealized guarantee expense that will reduce RI to the extent it is realized.
Year Ended December 31,
$ in thousands Q2-21 LTM 2020 2019 2018 2017 2016 2015 2014
Performance income and net investment income reconciliation:
Carried interest allocation $1,583,262 $505,608 $621,872 $42,410 $620,454 $494,580 $146,038 $63,884
Incentive fees 59,544 37,902 69,197 63,380 16,220 23,272 4,577 27,528
Carried interest allocation and incentive fees 1,642,806 543,510 691,069 105,790 636,674 517,852 150,615 91,412
Performance income—realized from Consolidated Funds 1,739 141 13,851 4,000 8,089 — 1,769 95,308
Performance income (loss) reclass(1) 252 (3,726) 740 205 1,936 2,479 7,398 14,587
Total performance (income) loss—unrealized (1,089,180) 7,554 (303,142) 247,212 (325,915) (228,472) (31,647) (94,883)
Performance (income) loss—unrealized earned from Consolidated Funds — — — — (2,997) 1,139 (6,187) 40,070
Performance income of non-controlling interests in consolidated subsidiaries (148) (263) — — — — — —
Performance income realized $555,469 $547,216 $402,518 $357,207 $317,787 $292,998 $121,948 $146,494
Total consolidated other income $278,350 $65,918 $122,539 $96,242 $174,674 $59,967 $24,792 $806,538
Net investment income from Consolidated Funds (276,608) (85,047) (130,396) (115,151) (153,810) (37,484) (16,455) (780,490)
Performance (income) loss reclass(1) (252) 3,726 (740) (205) (1,936) (2,479) (7,398) (14,587)
Principal investment income 122,804 4,044 44,320 1,047 89,031 50,408 2,043 55,748
Change in value of contingent consideration 312 70 — — (20,156) (17,675) (21,064) —
Other expense (income), net(2) 9,742 10,207 (460) 1,650 (1,730) (1,728) 110 3,384
Merger-related expenses — — — — — — 15,446 —
Offering costs — — — 3 688 — — —
Other expense (income) of non-controlling interests in consolidated subsidiaries (18,757) 556 (39) (19) (24) — — —
Investment loss (income)—unrealized (91,552) 40,405 24,542 50,809 (55,487) (14,456) 27,362 (10,933)
Interest and other investment loss (income)—unrealized (754) (13,921) 7,925 98 1,743 (3,309) — —
Total realized net investment income $23,285 $25,958 $67,691 $34,474 $32,993 $33,244 $24,836 $59,660
Ares Management Corporation Investor Day 2021 - Not for Publication or DistributionAres Management Corporation Investor Day 2021 - Not for Publication or Distribution
Glossary

Ares Management Corporation Investor Day 2021 - Not for Publication or Distribution 172
GlossaryARCC Part II Fees ARCC Part II Fees refers to fees that are paid in arrears as of the end of each calendar year when the cumulative aggregate realized capital gains exceed the cumulative
aggregate realized capital losses and aggregate unrealized capital depreciation, less the aggregate amount of ARCC Part II Fees paid in all prior years since inception.
Ares Operating Group Entities Ares Operating Group Entities refers to, collectively, Ares Holdings, L.P. and any future entity designated by our board of directors in its sole discretion as an Ares OperatingGroup entity.
Ares Operating Group Unit Ares Operating Group Unit or an “AOG Unit” refers to, collectively, a partnership unit in the Ares Operating Group entities including Ares Holdings and any future entitydesignated by our board of directors in its sole discretion as an Ares Operating Group entity.
Assets Under Management Assets Under Management or “AUM” generally refers to the assets we manage. For our funds other than CLOs, our AUM represents the sum of the net asset value (“NAV”)of such funds, the drawn and undrawn debt (at the fund-level including amounts subject to restrictions) and uncalled committed capital (including commitments tofunds that have yet to commence their investment periods). NAV refers to the fair value of the assets of a fund less the fair value of the liabilities of the fund. For the CLOswe manage, our AUM is equal to initial principal amounts adjusted for paydowns. AUM also includes the proceeds raised in the initial public offering of a special purposeacquisition company (“SPAC”) sponsored by us.
AUM Not Yet Paying Fees AUM Not Yet Paying Fees (also referred to as “shadow AUM”) refers to AUM that is not currently paying fees and is eligible to earn management fees upon deployment.
Available Capital Available Capital (also referred to as “dry powder”) is comprised of uncalled committed capital and undrawn amounts under credit facilities and may include AUM thatmay be canceled or not otherwise available to invest.
Class B Membership Interests Class B Membership Interests refers to the interests that were retained by the former owners of Crestline Denali Capital LLC and represent the financial interests in thesubordinated notes of the related CLOs.
Consolidated Funds Consolidated Funds refers collectively to certain Ares funds, co-investment entities, CLOs and SPACs that are required under GAAP to be consolidated in our consolidatedfinancial statements.
Fee Paying AUM Fee Paying AUM or “FPAUM” refers to the AUM from which we directly earn management fees. FPAUM is equal to the sum of all the individual fee bases of our funds thatdirectly contribute to our management fees. For our funds other than CLOs, our FPAUM represents the amount of limited partner capital commitments for certain closed-end funds within the reinvestment period, the amount of limited partner invested capital for the aforementioned closed-end funds beyond the reinvestment period andthe portfolio value, gross asset value or NAV. For the CLOs we manage, our FPAUM is equal to the gross amount of aggregate collateral balance, at par, adjusted fordefaulted or discounted collateral.
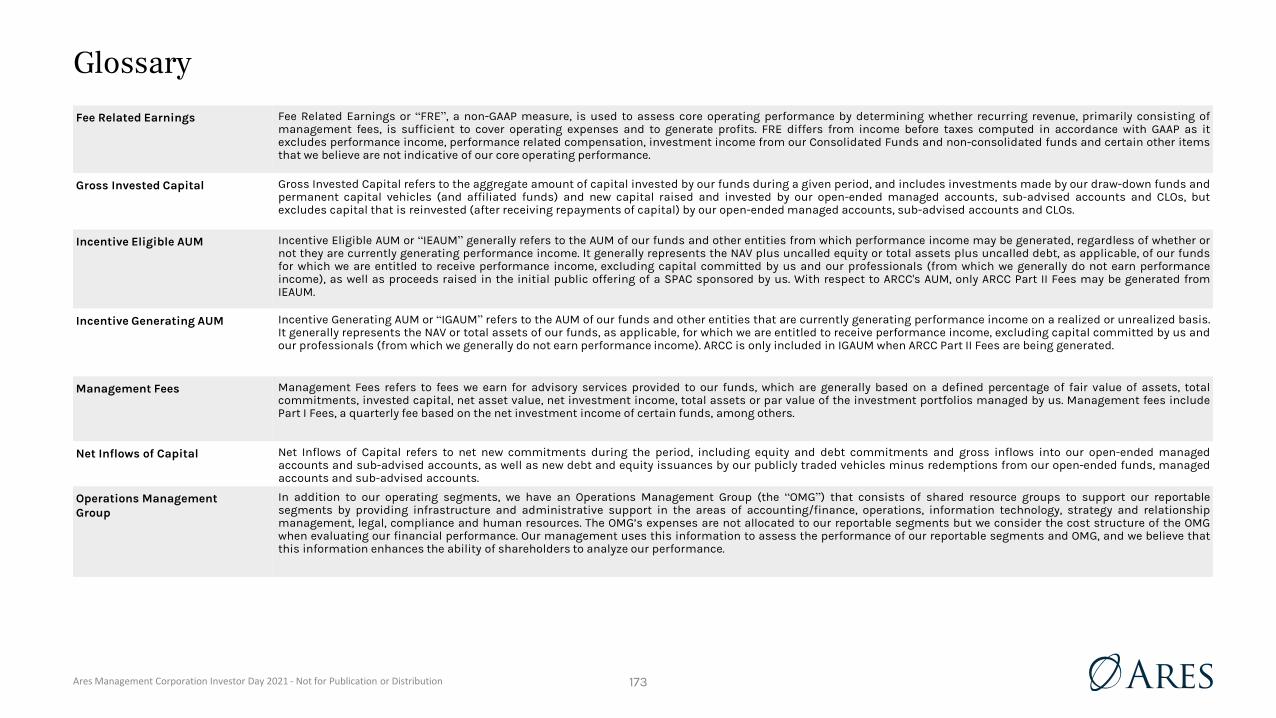
Ares Management Corporation Investor Day 2021 - Not for Publication or Distribution 173
GlossaryFee Related Earnings Fee Related Earnings or “FRE”, a non-GAAP measure, is used to assess core operating performance by determining whether recurring revenue, primarily consisting of
management fees, is sufficient to cover operating expenses and to generate profits. FRE differs from income before taxes computed in accordance with GAAP as itexcludes performance income, performance related compensation, investment income from our Consolidated Funds and non-consolidated funds and certain other itemsthat we believe are not indicative of our core operating performance.
Gross Invested Capital Gross Invested Capital refers to the aggregate amount of capital invested by our funds during a given period, and includes investments made by our draw-down funds andpermanent capital vehicles (and affiliated funds) and new capital raised and invested by our open-ended managed accounts, sub-advised accounts and CLOs, butexcludes capital that is reinvested (after receiving repayments of capital) by our open-ended managed accounts, sub-advised accounts and CLOs.
Incentive Eligible AUM Incentive Eligible AUM or “IEAUM” generally refers to the AUM of our funds and other entities from which performance income may be generated, regardless of whether ornot they are currently generating performance income. It generally represents the NAV plus uncalled equity or total assets plus uncalled debt, as applicable, of our fundsfor which we are entitled to receive performance income, excluding capital committed by us and our professionals (from which we generally do not earn performanceincome), as well as proceeds raised in the initial public offering of a SPAC sponsored by us. With respect to ARCC's AUM, only ARCC Part II Fees may be generated fromIEAUM.
Incentive Generating AUM Incentive Generating AUM or “IGAUM” refers to the AUM of our funds and other entities that are currently generating performance income on a realized or unrealized basis.It generally represents the NAV or total assets of our funds, as applicable, for which we are entitled to receive performance income, excluding capital committed by us andour professionals (from which we generally do not earn performance income). ARCC is only included in IGAUM when ARCC Part II Fees are being generated.
Management Fees Management Fees refers to fees we earn for advisory services provided to our funds, which are generally based on a defined percentage of fair value of assets, totalcommitments, invested capital, net asset value, net investment income, total assets or par value of the investment portfolios managed by us. Management fees includePart I Fees, a quarterly fee based on the net investment income of certain funds, among others.
Net Inflows of Capital Net Inflows of Capital refers to net new commitments during the period, including equity and debt commitments and gross inflows into our open-ended managedaccounts and sub-advised accounts, as well as new debt and equity issuances by our publicly traded vehicles minus redemptions from our open-ended funds, managedaccounts and sub-advised accounts.
Operations ManagementGroup
In addition to our operating segments, we have an Operations Management Group (the “OMG”) that consists of shared resource groups to support our reportablesegments by providing infrastructure and administrative support in the areas of accounting/finance, operations, information technology, strategy and relationshipmanagement, legal, compliance and human resources. The OMG’s expenses are not allocated to our reportable segments but we consider the cost structure of the OMGwhen evaluating our financial performance. Our management uses this information to assess the performance of our reportable segments and OMG, and we believe thatthis information enhances the ability of shareholders to analyze our performance.

Ares Management Corporation Investor Day 2021 - Not for Publication or Distribution 174
GlossaryOur Funds Our Funds refers to the funds, alternative asset companies, co-investment vehicles and other entities and accounts that are managed or co-managed by the Ares
Operating Group, and which are structured to pay fees. It also includes funds managed by Ivy Hill Asset Management, L.P., a wholly owned portfolio company of ARCC andan SEC-registered investment adviser.
Part I Fees Part I Fees refers to a quarterly performance income on the net investment income of Ares Capital Corporation (NASDAQ: ARCC) (“ARCC”) and CION Ares Diversified CreditFund (“CADC”). Such fees are classified as management fees as they are predictable and recurring in nature, not subject to contingent repayment and generally cash-settled each quarter, unless subject to a payment deferral.
Performance Income Performance Income refers to income we earn based on the performance of a fund that is generally based on certain specific hurdle rates as defined in the fund’sinvestment management or partnership agreements and may be either an incentive fee or carried interest.
Permanent Capital Permanent Capital refers to capital of our funds that do not have redemption provisions or a requirement to return capital to investors upon exiting the investments madewith such capital, except as required by applicable law. Such funds currently consist of ARCC, Ares Commercial Real Estate Corporation (“ACRE”) and Ares Dynamic CreditAllocation Fund, Inc. (“ARDC”). Such funds may be required, or elect, to return all or a portion of capital gains and investment income. In addition, permanent capitalincludes certain insurance related assets that are owned or related to Aspida Life Re Ltd (“Aspida”).
Realized Income Realized Income or “RI”, a non-GAAP measure, is an operating metric used by management to evaluate performance of the business based on operating performance andthe contribution of each of the business segments to that performance, while removing the fluctuations of unrealized income and losses, which may or may not beeventually realized at the levels presented and whose realizations depend more on future outcomes than current business operations. RI differs from income before taxesby excluding (a) operating results of our Consolidated Funds, (b) depreciation and amortization expense, (c) the effects of changes arising from corporate actions, (d)unrealized gains and losses related to performance income and investment performance and (e) certain other items that we believe are not indicative of our operatingperformance. Changes arising from corporate actions include equity-based compensation expenses, the amortization of intangible assets, transaction costs associatedwith mergers, acquisitions and capital transactions, underwriting costs and expenses incurred in connection with corporate reorganization.
Total Fee Revenue Total Fee Revenue refers to the total of segment management fees, other fees and realized net performance income.

Ares Management Corporation Investor Day 2021 - Not for Publication or DistributionAres Management Corporation Investor Day 2021 - Not for Publication or Distribution
Endnotes – Guiding Principles of Ares

Ares Management Corporation Investor Day 2021 - Not for Publication or Distribution 176
Guiding Principles of Ares Index Definitions and EndnotesIndex DefinitionsIndices are provided for illustrative purposes only and not indicative of any investment. They have not been selected to represent appropriate benchmarks or targets for the strategy. Rather, the indicesshown are provided solely to illustrate the performance of well known and widely recognized indices. Any comparisons herein of the investment performance of a strategy to an index are qualified asfollows: (i) the volatility of such index will likely be materially different from that of the strategy; (ii) such index will, in many cases, employ different investment guidelines and criteria than thestrategy and, therefore, holdings in such strategy will differ significantly from holdings of the securities that comprise such index and such strategy may invest in different asset classes altogetherfrom the illustrative index, which may materially impact the performance of the strategy relative to the index; and (iii) the performance of such index is disclosed solely to allow for comparison on thereferenced strategy’s performance to that of a well known index. Comparisons to indices have limitations because indices have risk profiles, volatility, asset composition and other materialcharacteristics that will differ from the strategy. The indices do not reflect the deduction of fees or expenses. You cannot invest directly in an index. No representation is being made as to the riskprofile of any benchmark or index relative to the risk profile of the strategy presented herein. There can be no assurance that the future performance of any specific investment, investment strategy, orproduct will be profitable, equal any corresponding indicated historical performance , or be suitable for a portfolio.
The Russell 1000 Index measures the performance of the large-cap segment of the U.S. equity universe. It is a subset of the Russell 3000 Index and includes approximately 1,000 of thelargest securities based on a combination of their market cap and current index membership. The Russell 1000 represents approximately 92% of the U.S. market. The Russell 1000 Index isconstructed to provide a comprehensive and unbiased barometer for the large-cap segment and is completely reconstituted annually to ensure new and growing equities and included.
EndnotesLarge Investment Footprint Across U.S., Europe and Asia-Pacific1. Jakarta, Mumbai and New Delhi offices are operated by third parties with whom Ares SSG maintains an ongoing relationship relating to the sourcing, acquisition and/or management
of investments.2. Includes approximately 299 employees including 108 investment professionals and three new cities where Ares did not previously have offices for the acquisition of Black Creek Group,
which closed on July 1, 2021. Total support headcount includes all non-investment and non-strategy, RM, IR professionals.
Leading Global Manager That Has Performed For Its Investors1. AUM amounts include funds managed by Ivy Hill Asset Management, L.P., a wholly owned portfolio company of Ares Capital Corporation and a registered investment adviser. Includes
the acquisition of Black Creek Group , which closed on July 1, 2021.2. PwC, Asset and Wealth Management Revolution: The Power to Shape the Future. Assets as of December 31, 2020.3. Relationships include the acquisition of Black Creek Group, which closed on July 1, 2021.4. Includes approximately 299 employees including 108 investment professionals for the acquisition of Black Creek Group, which closed on July 1, 2021. Total employee headcount
includes admin professionals.5. Source: Bloomberg. From Ares IPO through June 30, 2021. Stock based total returns is calculate assuming dividends are reinvested. Index provided for comparison purposes only and
includes reinvested dividends.

Ares Management Corporation Investor Day 2021 - Not for Publication or DistributionAres Management Corporation Investor Day 2021 - Not for Publication or Distribution
Endnotes – Strategy Overview & Outlook

Ares Management Corporation Investor Day 2021 - Not for Publication or Distribution 178
Strategy Overview & Outlook EndnotesMulti-Decade Trend Towards Private Capital Will Continue As Investors Expand Into Alternatives 1. Source: The World Bank: World Federation of Exchanges Database as of June 30, 2021. Includes U.S. listed domestic companies. Most recent data for number of public companies is as
of 2019.2. Source: Wishire.com. In January 2000, the Wilshire 5000 index of 5,000 U.S. capitalization weighted equity securities contained 7,200 stocks with a total market capitalization of $13
trillion or an average company market cap of $1.8 billion. As of June 30, 2021, the Wilshire 5000 contained 3,500 stocks with a total market capitalization of $45 trillion or an average company market cap of $12.8 billion.
3. Source: ICE BofA U.S. High Yield Constrained Index (HUC0), June 30, 2021.4. Preqin as of December 31. 2020. Private Equity AUM excludes venture capital, hybrid and fund of funds.5. Source: Preqin and World Bank. Private Equity (excluding venture capital, hybrid and fund of funds) Net Asset Value defined as AUM less dry powder. Global Public Equities Market Cap
growth from 2000-2018 is from the World Bank Database, most recent complete global data. 2019 – 2020 increase is based on the growth in the Bloomberg World Exchange Market Capitalization Index.
We Have Meaningfully Diversified and Expanded our Business Lines1. AUM amounts include funds managed by Ivy Hill Asset Management, L.P., a wholly owned portfolio company of Ares Capital Corporation and registered investment adviser.
We Are Market Leaders In Large, Global Markets1. Source: CSLLI, WELLI (Hedged to USD) and HW00 Global HY Index. Includes U.S. and European Direct Lending. Based on Ares’ own calculations using information from Thomson Reuters,
Deloitte, S&P Global Market Intelligence and Ares’ observations. Based on Ares’ own calculations using information from Bain and Company, Market Watch, WSJ, Houlihan Lokey, CoralCapital Solutions, Equipment Leasing & Finance Foundation, Real Capital Analytics, Commercial Finance Association, JP Morgan, AIMA, S&P Capital IQ, Credit Suisse, Bloomberg,SIFMA, Cambridge Centre for Alternative Finance and Ares’ observations. Certain broadly syndicated loans are held within CLO structures which are part of the investable universe foralternative credit. CLO securities represent ~$891B. Certain real estate debt is held within CMBS structures which are part of the investable universe for alternative credit. CMBSrepresents ~$581B.
2. Source Preqin. Reflect private equity assets under management as of September 30, 2020. Includes Balanced, Buyout, Co-investment, Co-Investment Multi-Manager, Direct Secondaries, Distressed Debt, Growth, Infrastructure, Natural Resources, Special Situations and Turnaround funds.
3. Source: Preqin. Reflects infrastructure assets under management as of December 31, 2020. 4. Sources: MSCI Real Estate Market Size 2019/20 Report and Nareit Estimating the Size of the Commercial Real Estate Market in the U.S., July 2019.5. Source: Source: Preqin. Reflects private equity, real estate and infrastructure assets under management, respectively, as of December 31, 2020. Excludes venture capital, fund of funds
and hybrid. See slide titled “Secondary Solutions Are Just Scratching the Surface with Huge End Markets” in the Secondary Solutions section of the presentation for further details.6. Source: PwC, “Asset and wealth management revolution: The power to shape the future,” 2020. Reflects estimated assets under management at insurance companies in 2020.7. Based on SSG’s view of the market as of December 31, 2020.8. Ares Private Equity Group includes both Infrastructure and Private Equity.9. Aspida Insurance has $2.7 billion of AUM as of June 30, 2021, of which approximately $800 million is sub-advised by Ares and also included in our Credit AUM.10. Includes Asia-Pacific distressed lending AUM.11. AUM amounts include funds managed by Ivy Hill Asset Management, L.P., a wholly owned portfolio company of Ares Capital Corporation and registered investment adviser.

Ares Management Corporation Investor Day 2021 - Not for Publication or Distribution 179
Strategy Overview & Outlook EndnotesWe Are Significantly Outpacing the Growth in Our Market1. Sources: PwC AWM Research Centre analysis. Past data based on Lipper, ICI, Preqin, Hedge Fund Research, EFAMA, City UK, Insurance Europe, Financial Stability Board, Credit Suisse,
Towers Watson, OECD and World Bank. Note: Foundations and Endowments assets were not included as their total global assets represent less than 1% of all client assets. Alternative assets include Hedge Funds, Private Equity, Real Estate and Infrastructure. As of December 2020.
Delivering Consistent and Attractive Investment Performance Through Cycles• Past performance is not indicative of future results. Please see the below performance disclosures for important information about the results shown herein. The investments reflected
herein are intended to be illustrative, and are not intended to be used as an indication of current or future performance of any Ares fund, or investment. Further, reference to theseparticular investments is not necessarily indicative that any Ares fund will offer or hold any or all of the investments. The opportunity to invest in future Ares funds or investments on anongoing basis is not guaranteed, and will be made by means of definitive offering memoranda, which will be furnished to qualified investors at their request.
• Credit Strategieso U.S. Direct Lending – ARCC
Shareholder Annualized Return: As of June 30, 2021. Hypothetical value of $1 invested in ARCC’s IPO in October 2004 and kept invested through June 30, 2021, assumingreinvestment income. Past performance is not guarantee of future results. Ares Capital Corporation’s stock price-based total return is calculated assuming dividends arereinvested at the end of day stock price on the relevant quarterly ex-dividend dates, and assuming investors did not participate in Ares Capital’s rights offering issuance as ofMarch 20, 2008. Source: Bloomberg.
o European Direct Lending Returns shown are since inception for the most recent fund that reports performance (ACE IV). Gross Return: The gross IRR is an annualized since inception gross internal rate of return of cash flows to and from investments and the residual value of the investments at the
end of the measurement period. Gross IRRs reflect returns to all partners. Cash flows used in the gross IRR calculation are assumed to occur at quarter-end. The gross IRRs arecalculated before giving effect to management fees, carried interest and other expenses, as applicable. Net Return: The net IRR is an annualized since inception net internal rate of return of cash flows to and from the fund and the fund’s residual value at the end of the
measurement period. Net IRRs reflect returns to the fee-paying partners and, if applicable, exclude interests attributable to the non-fee paying partners and/or the generalpartner which does not pay management fees or carried interest or has such fees rebated outside of the fund. The cash flow dates used in the net IRR calculation are based onthe actual dates of the cash flows. The net IRRs are calculated after giving effect to management fees, carried interest as applicable, and other expenses.

Ares Management Corporation Investor Day 2021 - Not for Publication or Distribution 180
Strategy Overview & Outlook EndnotesDelivering Consistent and Attractive Investment Performance Through Cycles (cont’d)• Credit Strategies (cont’d)
o Alternative Credit – Illiquid The Total Alternative Credit track record shown includes the following:
• Financial: all CLO investments in commingled funds and separately managed accounts executed by investment professionals within Ares Credit Group for the period January 1, 2012 to March 31, 2021; all FINCO debt investments in Ares Capital Corporation executed by investment professionals within Ares Credit Group for the period from January 1, 2012 to March 31, 2021; and all financial asset investments in commingled funds and separately managed accounts executed by investment professionals within Ares Credit Group.
• Specialty: all private asset-backed investments in commingled funds and separately managed accounts executed by investment professionals within Ares Credit Group.• Real: all CMBS investments in commingled funds and separately managed accounts executed by investment professionals within Ares Credit Group for the period January 1,
2018 to March 31, 2021; all real asset investments in commingled funds and separately managed accounts executed by investment professionals within Ares Credit Group; and all K-Series investments in separately managed accounts executed by investment professionals within Ares Real Estate Group.
The illiquid Alternative Credit Subset reflects all opportunistic Alternative Credit investments. The pro forma performance results shown have been compiled by Ares from actual realized and unrealized investments that were not collectively part of an actual portfolio.
However, these results are based on a grouping of assets that are representative of each respective Alternative Credit strategy. Pro forma performance results may have inherentlimitations, and no representation is being made that any investor will or is likely to achieve profits or losses similar to those shown. Had a fund focused on the assetsrepresented by this performance actually existed, Ares may not have made the same investment decisions. Given Ares did not offer an investment vehicle that held all of theassets included in the pro forma track record, an investor was not able to invest in these assets as presented. There are factors related to the markets in general, or to theimplementation of any specific portfolio strategy, which cannot be fully accounted for in the preparation of pro forma portfolio performance, all of which can adversely affectactual portfolio results. Returns of unrealized investments herein are based in part on unrealized valuations and the actual realized returns of such unrealized investments maydiffer materially from the returns indicated herein. The performance information summarized herein has not been audited. Past performance is not indicative of future results.No individual investor has received the investment performance indicated by the pro forma returns presented herein. Certain assumptions, not all of which are described herein,have been made to calculate pro forma returns and the use of different assumptions could produce materially different results. Gross Return: Represents the asset-level Internal Rate of Return (IRR) of selected investments. IRR is the discount rate that makes the net present value of all cash flows related
to a particular investment equal to zero. IRRs are de-annualized for investments with a holding period of less than one year. Gross asset-level IRR is gross of management andother expenses related to investments as these expenses are not allocable to specific investments and differ among funds. Gross asset-level performance does not reflect theeffect of management fees, carried interest or other expenses, which in the aggregate may be substantial. Investments are considered to be realized when the originalinvestment objective has been achieved through the receipt of cash upon the sale of an investment. Net Return: Represents the asset-level Internal Rate of Return (IRR) of selected investments. IRR is the discount rate that makes the net present value of all cash flows related to
a particular investment equal to zero. IRRs are de-annualized for investments with a holding period of less than one year. The net IRR reflects the deduction of hypotheticalmanagement fees, incentive fees, and operating and administrative expenses from the gross IRR. For the illiquid track record, we assumed management fees of 1.25% perannum, administrative expenses of 0.12% per annum, and one time organizational expense of 0.175%. For the incentive fee estimate, we assumed a straight-line 20% deductionagainst the net return before incentive fees once a 6% hurdle was cleared. Investments are considered to be realized when the original investment objective has been achievedthrough the receipt of cash upon the sale of an investment.

Ares Management Corporation Investor Day 2021 - Not for Publication or Distribution 181
Strategy Overview & Outlook EndnotesDelivering Consistent and Attractive Investment Performance Through Cycles (cont’d)• Credit Strategies (cont’d)
o U.S. High Yield The U.S. High Yield Composite ("Composite") includes all actual, fully discretionary, fee-paying, separately managed portfolios that primarily invest in U.S. high yield fixed
income securities and are benchmarked to the ICE BofA Merrill Lynch US High Yield Master II Constrained Index. Portfolios in the Composite have an emphasis on capitalappreciation and income. The Composite was created in November 2011. Returns include the reinvestment of income and other earnings and reflect the deduction of all trading expenses. Gross Return: Gross returns do not reflect the deduction of investment advisory fees or any other expenses that may be incurred in the management of the account. Net Return: Net returns are calculated monthly by reducing the gross return by 1/12th of the highest tier of the fee schedule in effect for the respective period. The
representative management fee schedule currently in effect is as follows: 0.50% per annum. Actual fees may vary depending on, among other things, the applicable feeschedule and portfolio size. The composite may contain accounts with performance based fees. Investment management fees are described in Part 2 of the adviser’s FormADV. All returns are expressed in U.S. Dollars.
o U.S. Bank Loans The U.S. Bank Loan Composite ("Composite") includes all fully discretionary, fee-paying, portfolios that are benchmarked to the Credit Suisse Leveraged Loan Index, primarily
invested in USD-denominated banks loans, and generally permitted to allocate at least 15% to high yield bonds and at least 20% to securities rated below B-. The Compositewas created in December 2013.
Returns include the reinvestment of income and other earnings and reflect the deduction of all trading expenses. Gross Return: Gross returns do not reflect the deduction of investment advisory fees or any other expenses that may be incurred in the management of the account. Net Return: Net returns are calculated monthly by reducing the gross return by 1/12th of the highest tier of the fee schedule in effect for the respective period. The
representative management fee schedule currently in effect is as follows: 0.50% per annum. Actual fees may vary depending on, among other things, the applicable feeschedule and portfolio size. The Composite may contain accounts with performance based fees. Investment management fees are described in Part 2 of the adviser’s FormADV. All returns are expressed in U.S. dollars.
• Real Estate Debto Real Estate Debt – Core/Core-Plus Unlevered and Levered
Gross TWR: Calculated as the quotient of (a) the sum of (i) investment income, composed of interest income, fee income, and other income; plus (ii)appreciation/depreciation of investments; and, less (iii) interest expense and financing costs, if any, divided by (b) the weighted average outstanding capital invested.
Net TWR: Calculated as the quotient of (a) the sum of (i) investment income, composed of interest income, fee income, and other income; plus (ii) appreciation/depreciationof investments; less (iii) interest expense and financing costs, if any; and, less (iv) fund expenses, composed of management fees, organizational costs, professional fees, andG&A expenses; divided by (b) the weighted average outstanding capital invested.

Ares Management Corporation Investor Day 2021 - Not for Publication or Distribution 182
Strategy Overview & Outlook EndnotesDelivering Consistent and Attractive Investment Performance Through Cycles (cont’d)• Strategic Initiatives
o Asia Distressed Credit & Asia Senior Lending Performance returns are represented by the combined performance of the underlying funds in each strategy. The fund-level NAV gross IRR is an annualized since inception
gross internal rate of return of cash flows to and from the Fund and the Fund's residual value at the end of the measurement period. The cash flow dates used in the fund-levelNAV gross IRR calculation are based on the actual dates of the cash flows. The fund-level NAV gross IRRs are calculated before giving effect to management fees, carriedinterest and other expenses, as applicable. Reflects current cash coupon or interest received or expected divided by the cost of investment. The fund-level NAV net IRR is anannualized since inception net internal rate of return of cash flows to and from the Fund and the Fund's residual value at the end of the measurement period. The cash flowdates used in the fund-level NAV net IRR calculations are based on the actual dates of the cash flows. The fund-level NAV net IRRs are calculated after giving effect tomanagement fees, carried interest, as applicable, and other expenses. The Fund may utilize a credit facility during the investment period and for general cash managementpurposes. The fund-level NAV net IRRs would likely have been lower had such fund called capital from its limited partners instead of utilizing the credit facility. Pastperformance is not indicative of future results, the achievement of which cannot be assured. The performance results of Special Situations Series shown herein have beencompiled by Ares SSG from actual realized and unrealized investments that are comprised of all investments from SSG Capital Partners I, L.P., SSG Capital Partners II, L.P., SSGCapital Partners III, L.P., SSG Capital Partners IV, L.P., SSG Capital Partners IV Sidecar, L.P., SSG Capital Partners V, L.P., and SSG Capital Partners V Sidecar, L.P. through June 30,2021. The performance results of Senior Lending Series shown herein have been compiled by Ares SSG from actual realized and unrealized investments that are comprised ofall investments from Secured Lending Opportunities I, L.P. and Secured Lending Opportunities II, L.P., through June 30, 2021. Accordingly, these results aggregate all of thecapital that Ares SSG managed with respect to these investments, but such performance returns do not reflect any single investor's performance. Total Gross and Net IRRs foreach strategy are based on a capital invested size-weighted average of individual fund IRRs and do not reflect the experience of an investor in any single fund.

Ares Management Corporation Investor Day 2021 - Not for Publication or Distribution 183
Strategy Overview & Outlook EndnotesDelivering Consistent and Attractive Investment Performance Through Cycles (cont’d)• Private Equity Strategies
o Special Opportunities Gross IRR presented is calculated on the basis of daily inflows and outflows of cash to and from the fund and Unrealized Values, excluding any Bridge Financings, and
assuming all remaining investments were sold at the values shown as of reporting date. Gross IRR excludes the impact of expenses, management fees, and carried interest.Returns to investors will be net of such expenses, management fees and carried interest. Net IRR is calculated after giving effect to management fees, carried interest, fund-level taxes and other expenses, excluding any Bridge Financings, and exclude
commitments of ASOF I’s general partner and its affiliates who pay neither management fees nor carried interest. Net IRR does not exclude limited partners that pay reducedmanagement fees and, therefore, the management fee rate used in calculating Net IRR is a blended rate of full fee and reduced fee limited partners; the Net IRR of a limitedpartner that does not benefit from a fee discount would be lower. The net and gross returns reflect reinvestment of certain gains and other proceeds to the full extent permittedunder the applicable governing documents. Net returns include the impact of fund-level expenses.
o Corporate Opportunities The gross internal rate of return (“Gross IRR”) has been calculated as of June 30, 2021 and excludes the effect of management fees, carried interest, and other expenses. Net IRR
is calculated after giving effect to management fees, carried interest, fund-level taxes and other expenses, and exclude commitments of the Ares affiliates who pay neithermanagement fees nor carried interest. Net IRR does not exclude limited partners that pay reduced management fees and, therefore, the management fee rate used incalculating Net IRR is a blended rate of full fee and reduced fee limited partners; the Net IRR of a limited partner that does not benefit from a fee discount would be lower. GrossIRRs presented are calculated on the basis of inflows and outflows of cash to and from investments and Unrealized Values, excluding any Bridge Financings, assuming suchinflows and outflows occurred as of month end and all remaining investments were sold at the values shown as of June 30, 2021. Net IRRs are fund-level IRRs and take intoconsideration the timing of contributions and distributions to and from the funds. The funds may utilize a credit facility for general cash management purposes. The Net IRRswould generally be lower had the applicable fund called capital from limited partners instead of utilizing the credit facility. The net and gross returns reflect reinvestment ofcertain gains and other proceeds to the full extent permitted under the applicable governing documents. Net returns include the impact of fund-level expenses. Gross / netIRRs as of June 30, 2021 are as follows: ACOF V: 14.0% / 9.0%; ACOF IV: 22.1% / 15.9%; ACOF III: 28.8% / 20.4%; ACOF II: 18.6% / 13.0%; ACOF I: 20.0% / 12.8%. Excluding energy, gross /net IRRs as of June 30, 2021 are as follows: ACOF V: 33.4% / 23.6%; ACOF IV: 21.6% / 14.9%; ACOF III: 30.4% / 22.0%; ACOF II: 22.1% / 15.3%; ACOF I: 20.4% / 14.0%.
o Infrastructure & Power Reflects performance of AEIF V. Gross performance figures are before giving effect to taxes, management fees, carried interest and other expenses. Gross IRRs are based on
aggregate monthly cash flows to/from each investment, including the equity that was funded to each investment, cash flows attributable to any reinvestment of proceeds, andevery cash distribution received from each investment, plus the fair value of unrealized investments as of the measurement date. Net performance figures are after givingeffect to management fees, carried interest and other fund expenses, including the impact of the use of subscription financing, and exclude commitments by the generalpartner or its affiliates. Net IRRs are based on actual cash flows to/from limited partners, plus the net asset value of the limited partners’ capital accounts as of themeasurement date. Past performance is not indicative of future results.

Ares Management Corporation Investor Day 2021 - Not for Publication or Distribution 184
Strategy Overview & Outlook EndnotesDelivering Consistent and Attractive Investment Performance Through Cycles(cont’d)• Real Estate Equity Strategies
o U.S. Value-Add Equity and European Value-Add Equity Performance presented in the chart is based on composites of funds with similar strategies. The U.S. and European composites are constructed using the Value-Add funds for
which performance is reported in each given strategy. Performance for the U.S. Value-Add Composite is comprised of U.S. VII, U.S. VIII and U.S. IX. Performance for the EuropeanReal Estate Value-Add Composite is comprised of EPEP I and EPEP II.
Returns are calculated using the since inception internal rate of return (“IRR”). Cash flows used in return calculations are assumed to occur at quarter-end and returns arereduced by transaction costs. Performance for the U.S. / European Real Estate Equity Composite is calculated in U.S. Dollars.
We believe that composite performance returns reflect overall performance returns in a strategy but are not necessarily investable funds or products themselves. Pastperformance is not indicative of future results. Gross Return: The gross IRR is calculated using cash flows to and from investments in the underlying funds in the composite and the combined residual value of the
investments at the end of the measurement period. Gross IRRs reflect returns to all partners and are calculated before giving effect to management fees, carried interest asapplicable, and other expenses.
Net Return: The net IRR is calculated using cash flows to and from limited partners of each fund in the composite and the combined residual value of the funds at the end ofthe measurement period. Net IRRs reflect returns to the fee-paying partners and, if applicable, excludes interests attributable to the non-fee-paying partners and/or thegeneral partner which do not pay management fees or carried interest or have such fees rebated outside of the fund. Net IRRs are calculated after giving effect to managementfees, carried interest as applicable, other fund expenses, and if applicable, interest expenses related to credit facilities. The underling funds in the composites may utilizecredit facilities during the investment period and for general cash management purposes. Net composite IRRs would generally have been lower had the underlying funds in thecomposite called capital from its limited partners instead of utilizing a credit facility.

Ares Management Corporation Investor Day 2021 - Not for Publication or Distribution 185
Strategy Overview & Outlook EndnotesDelivering Consistent and Attractive Investment Performance Through Cycles (cont’d)• Secondary Solutions Strategies
o Private Equity & Real Estate Performance returns are represented by the combined performance of the underlying funds in each strategy. Returns include the reinvestment of income and other earnings
from securities or other investments and reflect the deduction of all trading expenses. Returns are annualized since inception internal rates of return that are calculated bycombining the cash flows to and from the underlying funds in each strategy and the applicable residual fund values at the end of the measurement period. Gross IRRs arecalculated before giving effect to management fees, administrative expenses, carried interest, and credit facility interest expenses, as applicable. Net IRRs reflect returns tothe fee-paying limited partners and are calculated after giving effect to management fees, administrative expenses, carried interest, and credit facility interest expenses, asapplicable. There may be funds in each strategy that utilize a credit facility during the investment period and for general cash management purposes. Net returns would likelyhave been lower had capital been called from its limited partners instead of utilizing the credit facility. Net IRR do not exclude limited partners that pay reduced managementfees and, therefore, the management fee rate used in calculating Net IRR is a blended rate of full fee and reduced fee limited partners; the Net IRR of a limited partner that doesnot benefit from a fee discount would be lower. Net IRRs are fund-level IRRs and take into consideration the timing of contributions and distributions to and from the funds.The funds may utilize a credit facility for general cash management purposes. The Net IRRs would generally be lower had the applicable fund called capital from limitedpartners instead of utilizing the credit facility. The net and gross returns reflect reinvestment of certain gains and other proceeds to the full extent permitted under theapplicable governing documents. LVP and LEP III used seller financing in the amounts of $45.0M and $111.6M, respectively. LEP XV has a 10% long term leverage cap. LEP XVI hasa 20% long term leverage cap. The Net IRR for Landmark Equity Partners XVI exceeds 40% through the applicable time period. Landmark expects this metric to diminishsignificantly over the life of the fund.

Ares Management Corporation Investor Day 2021 - Not for Publication or Distribution 186
Strategy Overview & Outlook EndnotesHistory of Innovation, Business Building and Strategic Acquisition 1. Represents AUM at initial launch or acquisition or in the case of liquid credit AUM as of 2003.
2. AUM amounts include funds managed by Ivy Hill Asset Management, L.P., a wholly owned portfolio company of Ares Capital Corporation and registered investment adviser. Includes the acquisition of Black Creek Group, which closed on July 1, 2021.
Case Study – Indicus (Alternative Credit)1. Consists of $2 billion managed assets and nearly $4 billion of advisory services as of 8/5/2011 Ares press release.
2. Indicus Alternative Credit assets (CLO Equity) totaled $800 million of the $2 billion in managed assets at acquisition. Remaining assets were in liquid credit.
Case Study – AREA Property Partners (Real Estate Equity)1. Ares press release 5/10/2013.
2. Ares reported $8 billion in segment AUM post closing. AUM as of June 30, 2021, includes the acquisition of Black Creek Group, which closed on July 1, 2021.
3. Includes the acquisition of Black Creek Group, which closed on July 1, 2021.
4. Includes offices and market coverage locations.
Expanding Our Primary Distribution Channels1. Source: PWC Asset & Wealth Management Revolution, the Power to Shape the Future. Assets as of December 31, 2020.

Ares Management Corporation Investor Day 2021 - Not for Publication or DistributionAres Management Corporation Investor Day 2021 - Not for Publication or Distribution
Endnotes – Financial Review & Outlook

Ares Management Corporation Investor Day 2021 - Not for Publication or Distribution 188
Financial Review & Outlook EndnotesWe Have Built a Market Leading Business With Strong Growth Potential1. AUM amounts include funds managed by Ivy Hill Asset Management, L.P., a wholly owned portfolio company of Ares Capital Corporation and registered investment adviser.
Stable and Diversified Management Fee Driven Business Model1. Total fee revenue is calculated as management fees plus realized net performance income and other fees. Percentage of management fees includes the following amounts attributable
to Part I Fees: 17% in 2015, 16% in 2016, 13% in 2017, 13% for 2018, 14% in 2019, 14% in 2020 and 14% in Q2-21 LTM.
Our Model Produces Consistent Growth Even in Volatile Markets1. Benchmarks initial data point at 100 with changes compared to initial data point.
2. GFC, Great Financial Crisis, management fee growth from 12/31/2007 – 12/31/2009. COVID management fee growth is from 12/31/2019 – 6/30/2021.
3. Represents CBOE Volatility Index.
Fee Related Earnings Growth is Driven by AUM and Margin Expansion1. 3-Year CAGR is based on Q2-18 LTM FRE of ~$239 million
2. 5-Year CAGR is based on Q2-16 LTM FRE of ~$161 million
3. The declaration, payment, and determination of the amount of future dividends, if any, is at the sole discretion of our Board of Directors, which may change our dividend policy at any time.

Ares Management Corporation Investor Day 2021 - Not for Publication or Distribution 189
Financial Review & Outlook EndnotesPath to Shareholder Value Creation1. The declaration, payment, and determination of the amount of future dividends, if any, is at the sole discretion of our Board of Directors, which may change our dividend policy at any
time.
Growth of European Waterfall Style Funds1. Projections and forward looking statements are not reliable indicators of future events and there is no guarantee that such activities will occur as expected or at all.2. Represents Incentive Eligible Assets Under Management “IEAUM” from our European Style Waterfall performance fee paying funds.3. Funds are listed by year and size of final close.
European Waterfall Funds Expected to Significantly Enhance Performance Income1. Represents forecasted Net Realized Performance Fees from our European Style Waterfall paying funds, assuming net forecasted fund returns.
European and American Waterfall Funds Expected to Significantly Enhance Performance Income1. Represents forecasted Net Realized Performance Fees from our European and American Style Waterfall paying funds, assuming net forecasted fund returns.
Our Balance Sheet Lite Model Enhances Growth With Less Capital1. Peer group includes BX, APO, KKR and CG. Comparison metrics for illustrative purposes only. Peers selected by Ares based on subjective judgment as to potentially comparable
companies. Peers do not represent entire competitive universe.
Key Takeaways1. The declaration, payment, and determination of the amount of future dividends, if any, is at the sole discretion of our Board of Directors, which may change our dividend policy at any
time.

Ares Management Corporation Investor Day 2021 - Not for Publication or DistributionAres Management Corporation Investor Day 2021 - Not for Publication or Distribution
Endnotes – Business Development & Client Strategy

Ares Management Corporation Investor Day 2021 - Not for Publication or Distribution 191
Business Development & Client Strategy EndnotesAlternative Assets Continue to Take Share1. Source: PwC, Asset and Wealth Management Revolution: The Power to Shape the Future.
2. Source: Preqin, The Future of Alternatives 2025 report.
3. Source: PwC, Asset and Wealth Management Revolution: The Power to Shape the Future. Global AUM Is $64 trillion, $111 trillion and $145 trillion as of 2012, 2020E and 2025E, respectively.

Ares Management Corporation Investor Day 2021 - Not for Publication or DistributionAres Management Corporation Investor Day 2021 - Not for Publication or Distribution
Endnotes – Credit Overview & Outlook

Ares Management Corporation Investor Day 2021 - Not for Publication or Distribution 193
Credit Overview & Outlook Index DefinitionsIndices are provided for illustrative purposes only and not indicative of any investment. They have not been selected to represent appropriate benchmarks or targets for the strategy. Rather, the indicesshown are provided solely to illustrate the performance of well known and widely recognized indices. Any comparisons herein of the investment performance of a strategy to an index are qualified asfollows: (i) the volatility of such index will likely be materially different from that of the strategy; (ii) such index will, in many cases, employ different investment guidelines and criteria than thestrategy and, therefore, holdings in such strategy will differ significantly from holdings of the securities that comprise such index and such strategy may invest in different asset classes altogetherfrom the illustrative index, which may materially impact the performance of the strategy relative to the index; and (iii) the performance of such index is disclosed solely to allow for comparison on thereferenced strategy’s performance to that of a well known index. Comparisons to indices have limitations because indices have risk profiles, volatility, asset composition and other materialcharacteristics that will differ from the strategy. The indices do not reflect the deduction of fees or expenses. You cannot invest directly in an index. No representation is being made as to the riskprofile of any benchmark or index relative to the risk profile of the strategy presented herein. There can be no assurance that the future performance of any specific investment, investment strategy, orproduct will be profitable, equal any corresponding indicated historical performance , or be suitable for a portfolio.
The Credit Suisse Leveraged Loan Index (“CSLLI”) is designed to mirror the investable universe of the $US-denominated leveraged loan market. The index inception is January 1992. The index frequency isdaily, weekly and monthly. New loans are added to the index on their effective date if they qualify according to the following criteria: 1) Loan facilities must be rated “5B” or lower. That is, the highestMoody’s/S&P ratings are Baa1/BB+ or Ba1/BBB+. If unrated, the initial spread level must be Libor plus 125 basis points or higher. 2) Only fully-funded term loan facilities are included. 3) The tenor must be atleast one year. 4) Issuers must be domiciled in developed countries; issuers from developing countries are excluded.
The Credit Suisse Western European Leveraged Loan Index (“CSWELLI”) is designed to mirror the investable universe of the leveraged loan market of issues which are denominated in US$ or WesternEuropean currencies. The issuer has assets located in or revenues derived from Western Europe, or the loan represents assets in Western Europe, such as a loan denominated in a Western European currency.Loan facilities must be rated “5B” or lower. That is, the highest Moody’s/S&P ratings are Baa1/BB+ or Ba1/BBB+. Only fully funded term loan facilities are included and the tenor must be at least one year.Minimum outstanding balance is $100 million and new loans must be priced by a third-party vendor at month-end. The index inception is January 1998.
The ICE BofA US High Yield Master II Index (“H0A0”) tracks the performance of US dollar denominated below investment grade corporate debt publicly issued in the US domestic market. Qualifying securitiesmust have a below investment grade rating (based on an average of Moody’s, S&P and Fitch), at least 18 months to final maturity at the time of issuance, at least one year remaining term to final maturity as ofthe rebalancing date, a fixed coupon schedule and a minimum amount outstanding of $100 million. Index constituents are capitalization-weighted based on their current amount outstanding times themarket price plus accrued interest. Accrued interest is calculated assuming next-day settlement. Cash flows from bond payments that are received during the month are retained in the index until the end ofthe month and then are removed as part of the rebalancing. Cash does not earn any reinvestment income while it is held in the index. The index is rebalanced on the last calendar day of the month, based oninformation available up to and including the
The ICE BofA US High Yield Master II Constrained Index (“HUC0”) contains all securities in The ICE BofA US High Yield Master II Index but caps issuer exposure at 2%. Index constituents are capitalization-weighted, based on their current amount outstanding, provided the total allocation to an individual issuer does not exceed 2%. Issuers that exceed the limit are reduced to 2% and the face value of each of theirbonds is adjusted on a pro-rata basis. Similarly, the face values of bonds of all other issuers that fall below the 2% cap are increased on a pro-rata basis. In the event there are fewer than 50 issuers in the Index,each is equally weighted and the face values of their respective bonds are increased or decreased on a prorata basis. Accrued interest is calculated assuming next-day settlement. Cash flows from bondpayments that are received during the month are retained in the index until the end of the month and then are removed as part of the rebalancing. Cash does not earn any reinvestment income while it is heldin the Index. The Index is rebalanced on the last calendar day of the month, based on information available up to and including the third business day before the last business day of the month. Issues thatmeet the qualifying criteria are included in the Index for the following month. Issues that no longer meet the criteria during the course of the month remain in the Index until the next month-end rebalancing atwhich point they are removed from the Index.
The Credit Suisse Western European High Yield Index (“WEHY”) is a market cap weighted benchmark index designed as an objective proxy for the investable universe of the Western European high yielddebt market. Inception date of the index is January 1995.

Ares Management Corporation Investor Day 2021 - Not for Publication or Distribution 194
Credit Overview & Outlook EndnotesAres Credit Group Overview1. AUM amounts include funds managed by Ivy Hill Asset Management, L.P., a wholly owned portfolio company of Ares Capital Corporation and a registered investment adviser.
Platform Leadership1. Private Debt Investor selected Ares Management for 2020 Global Fund Manager of the Year. Award based on an industry wide global survey across 47 categories conducted by Private
Debt Investor. Survey participants voted independently. In addition, survey participants could nominate another firm not listed in the category.2. Private Debt Investor: The top 10 largest private debt fundraisers of 2020.3. Creditflux, “CLO Manager Ranking by Principal Liabilities as of 2021-03-31.”4. Based on Ares’ view of the market.5. The awards and ratings noted herein relate only to selected funds/strategies and may not be representative of any given client’s experience and should not be viewed as indicative of
Ares’ past performance or its funds’ future performance. All investments involve risk, including loss of principal.• Private Debt Investor selected Ares Management for 2020 Global Fund Manager of the Year and selected Ares Capital Corporation for BDC of the year in the Americas. Awards based
on an industry wide global survey across 47 categories conducted by Private Debt Investor. Survey participants voted independently. In addition, survey participants couldnominate another firm not listed in the category.
• Private Equity International selected Ares Management as Lender of the Year in North America – 2020. Awards based on an industry wide global survey across 77 categoriesconducted by Private Equity International. Survey participants voted independently. In addition, survey participants could nominate another firm not listed in the category.
• ARCC received the 2021 All-America Executive Team Most Honored designation alongside 136 other companies. Various Ares personnel received first place awards as part of the“Brokers, Asset Managers & Exchanges” category for: Investor Relations, CEO, CFO, Investor Day and Communication of Strategy and Risk Management Amid COVID-19. Six otherinstitutions also received a first-, second-, or third-place ranking in this category. Institutional Investor based these awards on the opinions of 3,029 portfolio managers and buy-side analysts, and 497 sell-side analysts who participated in this survey. Institutional Investor logo from Institutional Investor, ©2021 Institutional Investor, LLC. All rights reserved.Used by permission and protected by the Copyright Laws of the United States. The printing, copying, redistribution, or retransmission of this Content without express writtenpermission is prohibited.
• Lipper Rankings reported in Lipper Marketplace Best Money Managers, March 31, 2021. Lipper Marketplace is the source of the long-only and multi-strategy credit rankings. Lipper’sBest Money Managers rankings consider only those funds that meet the following qualification: performance must be calculated “net” of all fees and commissions; must includecash; performance must be calculated in U.S. dollars; asset base must be at least $10 million in size for “traditional” U.S. asset classes (equity, fixed income, and balancedaccounts); and, the classification of the product must fall into one of the categories which they rank. Lipper defines Short Duration as 1-5 years. Lipper’s Active Duration definitiondoes not specify a time period but rather refers to an Active rather than Passive strategy. Ares Institutional Loan Fund was ranked 8 out of 42 for the 40 quarters ended March 31,2021. Composites for Ares U.S. Bank Loan Aggregate and Ares U.S. High Yield additionally received rankings of 7 of 42 and 3 of 28, respectively, for the 40 quarters ended March 31,2021.

Ares Management Corporation Investor Day 2021 - Not for Publication or Distribution 195
Credit Overview & Outlook EndnotesLarge Addressable Global Credit Market1. Source: CSLLI, WELLI (Hedged to USD) and HW00 Global HY Index. Certain broadly syndicated loans are held within CLO structures which are part of the investable universe for
alternative credit. As of March 31, 2021.2. Size of the U.S. Direct Lending Addressable Market detailed below:
• Based on Ares’ own data calculations using information from Refinitiv, S&P Global Market Intelligence and Ares’ own observations. Addressable market based on the average of2020 and 1H21 annualized deal volume and a 2.5 year life assumption.
*Reported Middle Market Loan Volume: Represents reported middle market loan volume per Refinitiv middle market reported deals and S&P Global Market Intelligence reporteddeals with less than $750 million tranche size, excluding duplicates between the two sources (assumed to be 10% based on Ares’ observations).**Ares Loan Volume Reviewed: Represents estimated loan volume reviewed by Ares U.S. Direct Lending platform based on the following information and assumptions: (a) thetotal volume reviewed by Ares’ U.S. Direct Lending platform equals the product of the number of transactions in the pipeline for a given period, the average EBITDA oftransactions in the pipeline for the given period, and the average senior debt to EBITDA of middle market transactions per Refinitiv for the given period and (b) the amountcalculated in (a) above has been adjusted to exclude transaction volume also reported to S&P Global and Refinitiv (assumed to be 25% based on Ares’ observations) andtransaction volume that was not closed either by Ares or the broader market (assumed to be 10% base on Ares’ observations).
$ in billions 2020Annualized
2021Average
Reported Middle Market Loan Volume* $186 $259
Ares Loan Volume Reviewed** $358 $438
Estimated Middle Market Loan Volume $545 $698
Average Life of Middle Market Loans (Years) x 2.5 x 2.5
Est. Middle Market Loans Outstanding $1,362 $1,744 $1,553

Ares Management Corporation Investor Day 2021 - Not for Publication or Distribution 196
Credit Overview & Outlook EndnotesLarge Addressable Global Credit Market (cont’d)3. Size of the EU Direct Lending Addressable Market detailed below:
• Based on Ares’ own data calculations using information from Deloitte, S&P Global Market Intelligence, Preqin and Ares’ own observations. The addressable market is based on thebelow two approaches, which use a 3-year life assumption.
*Annual Direct Lending Market Volume: Ares LTM Q1-21 deployment divided by Ares average annual market share from 2013 through 2020 according to the Deloitte Annual MarketShare study.**Assumed Bank Market Share: Represents the assumed bank share of the market based on Ares’ observations.***Addressable Syndicated Market Volume: Average S&P Market Intelligence loan volume for loans with tranche size less than €750 million for 2020 and Q1-21 LTM.****EU Middle Market PE LBO Volume: Average annual EU middle market loan volume for 2018-2020 per Preqin.
4. Based on Ares’ own calculations using information from Bain and Company, Market Watch, WSJ, Houlihan Lokey, Coral Capital Solutions, Equipment Leasing & Finance Foundation,Real Capital Analytics, Commercial Finance Association, JP Morgan, AIMA, S&P Capital IQ, Credit Suisse, Bloomberg, SIFMA, Cambridge Centre for Alternative Finance and Ares’observations. Includes certain real estate debt held within CMBS structures. As of March 31, 2021.
Approach 1: Debt Market Share Analysis$ in billions
Q1-21
Annual Direct Lending Market Volume* €94
Average Life of Middle Market Loans x 3
Direct Lending Middle Market Loans Outstanding €283
Assumed Bank Market Share** 50%
Total Direct Lending & Bank Middle Market Loans Outstanding €565
Addressable Syndicated Market Volume*** €41
Average Life of Middle Market Loans (Years) x 3
Est. Middle Market Loans Outstanding €122
Total Direct Lending Addressable Market €688
Approach 2: LBO Buy-Out Volume Analysis$ in billions
2020
EU Middle Market PE LBO Volume**** €446
Assumed LBO Volume Debt Financed 50%
LBO Buyout Volume Debt Financed €223
Average Life of Middle Market Loans (Years) x 3
Total Middle Market Buyout Financing €669

Ares Management Corporation Investor Day 2021 - Not for Publication or Distribution 197
Credit Overview & Outlook EndnotesFavorable Global Demand Drivers for Credit1. Sources: From 1998 to Q1-21. Sources: Federal Deposit Insurance Corp Quarterly Banking Profile, Q1-21 and European Central Bank, Q1-21.2. Source: Preqin. As of June 2021.3. Source: Hamilton Lane 2021 Market Overview.4. Source: Cliffwater 2021 Long Term (10 Year) Capital Market Assumptions.
We Are Expanding Our Strategies and AUM to Meet Market Opportunity1. AUM amounts include funds managed by Ivy Hill Asset Management, L.P., a wholly owned portfolio company of Ares Capital Corporation and a registered investment adviser.
Investment Performance Has Supported AUM Growth1. U.S. Loans based on 3, 5, 7 and 10 year gross returns as of June 30, 2021 per eVestment. U.S. High Yield since inception per eVestment.
• Source: eVestment as of June 30, 2021. eVestment Alliance, LLC and its affiliated entities (collectively, “eVestment”) collect information directly from investment management firmsand other sources believed to be reliable, however, eVestment does not guarantee or warrant the accuracy, timeliness, or completeness of the information provided and is notresponsible for any errors or omissions. Data sourced from eVestment is available through a paid subscription with Ares. Performance results may be provided with additionaldisclosures available on eVestment’s systems and other important considerations such as fees that may be applicable. Not for general distribution and limited distribution mayonly be made pursuant to client’s agreement terms. All categories not necessarily included, Totals may not equal 100%. Copyright 2012-2018 eVestment Alliance, LLC. Pastperformance is not indicative of future results. The performance, awards/ratings noted herein relate only to selected funds/strategies and may not be representative of any givenclient’s experience and should not be viewed as indicative of Ares’ past performance or its funds’ future performance. Gross returns do not reflect the deduction of management feesor other expenses. Rankings for Ares U.S. Bank Loans are relative to the U.S. Floating-Rate Bank Loan Fixed Income universe. The Ares Institutional Loan Fund was incepted onDecember 12, 2008. Performance data is from December 31, 2008 through June 30, 2021. For total return, on a 1 year, 3 year, 5 year, 7 year, 10 year and since inception basis, AresInstitutional Loan Fund ranked in the 29th, 6th, 9th, 15th, 18th and 35th percentile, respectively, in the eVestment U.S. Floating-Rate Bank Loan Fixed Income Universe. For Sharpe Ratio,on a 1 year, 3 year, 5 year, 7 year, 10 year and since inception basis, the Ares Institutional Loan Fund ranked in the 9th, 11th, 13th, 19th, 17th and 15th percentile, respectively, in theeVestment U.S. Floating-Rate Bank Loan Fixed Income Universe. Rankings for Ares U.S. High Yield Bonds are relative to the eVestment U.S. High Yield Fixed Income Universe. The AresUS High Yield Composite was incepted May 2007. Performance data is from May 31, 2007 through June 30, 2021. Rankings for Ares U.S. High Yield Composite are relative to theeVestment U.S. High Yield Fixed Income Universe. For total returns, on a 1 year, 3 year, 5 year, 7 year, 10 year and since inception basis, the Ares US High Yield Strategy ranked in the32nd, 24th, 35th, 25th, 35th and 16th percentile, respectively, in the eVestment U.S. High Yield Fixed Income Universe. For Sharpe Ratio, on a 1 year, 3 year, 5 year, 7 year, 10 year and sinceinception basis, the Ares US High Yield Strategy ranked in the 36th, 33rd, 35th, 32nd, 36th and 19th percentile, respectively, in the eVestment U.S. High Yield Fixed Income Universe.

Ares Management Corporation Investor Day 2021 - Not for Publication or Distribution 198
Credit Overview & Outlook EndnotesInvestment Performance Has Supported AUM Growth (cont’d)2. As of June 30, 2021 generated a gross alpha of 69bps annualized since inception. Represented by the Ares Structured European Loan Aggregate Composite ("Composite”). All returns are
expressed in Euros.
• The Structured European Loan Aggregate Composite ("Composite") includes all actual, fully discretionary, fee-paying, portfolios that are structured as collateralized loan obligations(CLOs) and primarily invest in European bank loan, high yield, and mezzanine securities. Performance results of the Composite from inception through November 2011 represent theresults achieved by Indicus Advisors, which Ares acquired in 2011. Accounts in the Composite may utilize derivatives, such as perfect asset swaps, for hedging. The Composite wascreated in December 2011.
• The benchmark for the Composite is the Credit Suisse Western European Leveraged Loan Index, All Denominations, Euro Hedged. The index is designed to mirror the investibleuniverse of the Western European leveraged loan market, with loans denominated in $US and Western European currencies. The returns of the benchmark are provided to representthe investment environment existing during the time period shown and are not covered by the report of the independent verifiers. For comparison purposes the index includes thereinvestment of income and other earnings but does not include any transaction costs, management fees or other costs.
• Returns include the reinvestment of income and other earnings and reflect the deduction of all trading expenses. Gross returns do not reflect the deduction of investment advisoryfees or any other expenses that may be incurred in the management of the account. Net returns are net of actual management fees and performance fees. For portfolios included inthe composite, the combined senior and subordinated fees typically range from 50 bps - 65 bps per annum and the incentive fees typically range from 15% - 20% over a 12% hurdlerate. Actual fees may vary depending on, among other things, the applicable fee schedule and portfolio size. The composite may contain accounts with performance based fees.Investment management fees are described in Part 2 of the adviser’s Form ADV. For a version of the strategy offered as a long-only separately managed account, the fee schedulecurrently in effect is 0.45% per annum. All returns are expressed in Euros.
• Past performance is not indicative of future results. As with any investment there is always the potential for gains as well as the possibility of losses.
3. Represents the LTM annual average par-weighted default rates for the period January 1, 2009 – June 30, 2021. U.S. bank loan default rates represented by the Credit Suisse LeveragedLoan Index (“CSLLI”). Ares default rates are represented by all U.S. bank loan transactions in all commingled funds and separately managed accounts executed by investmentprofessionals within Ares Liquid Credit Group.
4. Represents the LTM annual average par-weighted default rates for the period January 1, 2007 – June 30, 2021. EU bank loan default rates are represented by the Western EuropeanLeveraged Loan Index (“WELLI”). Ares default rates are represented by all EU bank loan transactions in all commingled funds and separately managed accounts executed by investmentprofessionals within Ares Liquid Credit Group.

Ares Management Corporation Investor Day 2021 - Not for Publication or Distribution 199
Credit Overview & Outlook EndnotesInvestment Performance Has Supported AUM Growth (cont’d)5. See notes below
• As of June 30, 2021. For the since inception period, total gross and net returns for U.S. High Yield Composite were 7.59% and 7.06%, vs. 6.98% for the ICE BofA US High Yield Master IIConstrained Index. For the since inception period, total gross and net returns (Euro-hedged) for the Ares Global High Yield Composite were 6.79% and 6.26% vs. 3.89% for the ICEBofA European Currency Developed Markets High Yield Excluding Subordinated Financials Constrained Index, Euro-hedged.
• The U.S. High Yield Composite ("Composite") includes all actual, fully discretionary, fee-paying, separately managed portfolios that primarily invest in U.S. high yield fixed incomesecurities and are benchmarked to the ICE BofA US High Yield Master II Constrained Index. Portfolios in the Composite have an emphasis on capital appreciation and income. TheComposite was created in November 2011.
• The benchmark for the Composite is the ICE BofA US High Yield Master II Constrained Index, which tracks the performance of US Dollar denominated below investment gradecorporate debt publicly issued in the US domestic market with a maximum issuer exposure of 2%. The returns of the benchmark are provided to represent the investmentenvironment existing during the time period shown and are not covered by the report of income and other earnings but does not include any transaction costs, management feesor other costs.
• Returns include the reinvestment of income and other earnings and reflect the deduction of all trading expenses. Gross returns do not reflect the deduction of investment advisoryfees or any other expenses that may be incurred in the management of the account. Net returns are calculated monthly by reducing the gross return by 1/12th of the highest tier ofthe fee schedule in effect for the respective period. The representative management fee schedule currently in effect is as follows: 0.50% per annum. Actual fees may vary dependingon, among other things, the applicable fee schedule and portfolio size. The composite may contain accounts with performance based fees. Investment management fees aredescribed in Part 2 of the adviser’s Form ADV. All returns are expressed in U.S. Dollars.
• The U.S. High Yield Composite ("Composite") includes all actual, fully discretionary, fee-paying, separately managed portfolios that primarily invest in U.S. high yield fixed incomePast performance is not indicative of future results. As with any investment there is always the potential for gains as well as the possibility of losses.
6. Represents the LTM average annual par-weighted default rates for the period January 1, 2009 – June 30, 2021. U.S. high yield default rates are represented by the Bank of America HighYield Master II Index (“H0A0”). Ares default rates are represented by all high yield bond transactions in all commingled funds and separately managed accounts executed byinvestment professionals within Ares Liquid Credit Group.
7. Represents the LTM average annual par-weighted default rates for the period September 30, 2019 – June 30, 2021. EU high yield default rates are represented by the Western EuropeanHigh Yield Index (“WEHY”). Ares default rates are represented by all high yield bond transactions in all commingled funds and separately managed accounts executed by investmentprofessionals within Ares Liquid Credit Group.
8. From December 31, 2015 through June 30, 2021.

Ares Management Corporation Investor Day 2021 - Not for Publication or Distribution 200
Credit Overview & Outlook EndnotesLeading Global Direct Lending Platform1. As of June 30, 2021. US. Direct Lending and Total Direct Lending AUM amounts include funds managed by Ivy Hill Asset Management, L.P., a wholly owned portfolio company of Ares
Capital Corporation and a registered investment adviser.2. From October 8, 2004 through March 31, 2021. Represents U.S. Direct Lending First Lien investments (excluding syndication and other fees or income and includes all realized First Lien
investments of the Credit Group's U.S. direct lending team (excluding venture investments, oil & gas investments, private asset backed securities, investments warehoused or held forseasoning and syndication purposes (including investments held for less than 30 days and other investments determined to be temporarily held by Ares in conjunction withsyndication processes),and investments inherited from portfolio acquisitions), including investments made through Ares Capital Corporation and from separately managed accountsand other funds)) and U.S. Direct Lending Junior Debt investments (includes all second lien, mezzanine, and other private high yield debt investments of the Credit Group's U.S. directlending team (excluding warrants and investments held for less than 30 days and investments inherited from portfolio acquisitions)), including more than 90% from Ares CapitalCorporation and the remaining from separately managed accounts and other funds. EDL transactions as of March 31, 2021 and exclude the Barclays portfolio purchase.
3. U.S. invested capital shown as of March 31, 2021. Includes capital deployed by ARCC, the Senior Secured Loan Program (“SSLP”), the Senior Direct Lending Program (“SLDP”), funds andSMAs. For investments made through the SSLP and the SDLP, invested capital represents the total facility amount funded by the SSLP and the SDLP. Excludes capital deployed by AresCommercial Finance and Ivy Hill Asset Management. Excludes $1.8 billion of assets acquired as part of ARCC's acquisition of Allied Capital Corporation on April 1, 2010. Excludes $2.5billion of assets acquired as part of ARCC’s acquisition of American Capital on January 3, 2017. Invested capital represents the book value of investments net of OID and syndicationswithin one year of investment closing and excludes warrants, CLO investments, LP/vehicles and investments inherited from portfolio acquisitions. For investments made through theSSLP, invested capital represents the total facility amount funded by the SSLP. For European Direct Lending investments, invested capital as of March 31, 2021 and all currencies arebeing converted to USD at the March 31, 2021 spot rate.
4. Total proceeds represents total cash proceeds received from exited debt investments as of March 31, 2021. For realized investments, this includes interest, principal proceeds, fees andrelated expenses.
5. The loss rate shown is pro forma and has been compiled by Ares. Pro forma results have inherent limitations, and no representation is being made that any account will or is likely toachieve profits or losses similar to those shown. Defined as total gains/(losses) on assets with a payment default as a % of total invested capital since inception, divided by number ofyears since inception. For realized investments, includes interest, fees, principal proceeds, and related expenses. For unrealized investments includes interest, principal proceeds, feesand related expenses received to-date, as well as the fair market value of the security as determined by management in accordance with U.S. generally accepted accounting principles.An investment that has experienced a payment default is placed on Non-Accrual status by Accounting; however, prior to placing a loan on Non-Accrual status, Ares U.S. Direct Lendingmay elect to grant a waiver or amendment related to such default and, in such case, the investment would not be placed on Non-Accrual.
6. The loss rate shown is pro forma and has been compiled by Ares. Pro forma results have inherent limitations, and no representation is being made that any account will or is likely toachieve profits or losses similar to those shown. EDL Gross loss rate is calculated as the annualized realized losses since inception divided by invested capital. Realized losses aredefined as amounts written off resulting from “debt for equity” restructurings and / or charge offs. EDL is defined as all investments made by the Ares European Direct Lending Team inits commingled middle market direct lending funds (ACE I, ACE II, ACE III, ACE IV and ACE V) since inception in July 2007, including all Separately Managed Accounts (“SMAs”) managedwithin the European Direct Lending strategy. This includes the Ares portion of the ESSLP, a joint venture between Ares and GE Commercial Bank SAS (“GECFB”), which was in operationbetween 2012-2018 and is now fully realized. Reflects funded capital from inception to March 31, 2021.

Ares Management Corporation Investor Day 2021 - Not for Publication or Distribution 201
Credit Overview & Outlook EndnotesAttractive Performance Across Strategies1. Annualized total shareholder return since IPO in October 2004. Total return is calculated assuming investors did not participate in ARCC’s rights offering issuance in March 2008.
Source: SNL Financial.2. The gross IRR is an annualized since inception gross internal rate of return of cash flows to and from investments and the residual value of the investments at the end of the
measurement period. Gross IRRs reflect returns to all partners. Cash flows used in the gross IRR calculation are assumed to occur at quarter-end. The gross IRRs are calculated beforegiving effect to management fees, carried interest and other expenses, as applicable.
3. The net IRR is an annualized since inception net internal rate of return of cash flows to and from the fund and the fund’s residual value at the end of the measurement period. Net IRRsreflect returns to the fee-paying partners and, if applicable, exclude interests attributable to the non-fee paying partners and/or the general partner which does not pay managementfees or carried interest or has such fees rebated outside of the fund. The cash flow dates used in the net IRR calculation are based on the actual dates of the cash flows. The net IRRs arecalculated after giving effect to management fees, carried interest as applicable, and other expenses.
Leading Scale in Direct Lending Globally1. Data reflects Ares’ estimates. Information based on most recently available public information as of March 31, 2021. Peers include Alcentra, Antares, Apollo, Arcmont, Ardian, Bain
Capital, Benefit Street Partners, Blackstone, Cerberus, Crescent. Golub, Guggenheim, Hayfin, ICG, KKR, HPS, NXT Capital, Owl Rock Capital Partners, Sixth Street Partners.2. Source: Private Debt Investor: The top 10 largest private debt fundraisers as of 2020 and 2017. Growth shown from 2017 to 2020.
Expansion of the Global Direct Lending Platform1. AUM amounts include funds managed by Ivy Hill Asset Management, L.P., a wholly owned portfolio company of Ares Capital Corporation and a registered investment adviser.

Ares Management Corporation Investor Day 2021 - Not for Publication or Distribution 202
Credit Overview & Outlook EndnotesA Market Leader in Global Alternative Credit1. Select Liquid Alternative Credit assets include CLO debt securities, consumer loans and leases, small business loans and leases, trade receivables, whole business securitizations,
equipment leases, wireless towers, data centers, transportation assets, royalties, CMBS, CRE CLOs, and residential mortgages.2. Select Illiquid Alternative Credit assets include fund finance, CLO equity, triple-net leases, secondaries lending, small business loans, ground leases, single family rentals, healthcare
receivables, aviation assets, agriculture loans, REIT finance, structured equity, media and sports finance.3. As of June 2021.4. Since 2011. Please review in conjunction with below performance notes.• Past performance is not indicative of future results. Please see the below performance disclosures for important information about the results shown herein. The investments
reflected herein are intended to be illustrative, and are not intended to be used as an indication of current or future performance of any Ares fund, or investment. Further, reference tothese particular investments is not necessarily indicative that any Ares fund will offer or hold any or all of the investments. The opportunity to invest in future Ares funds or investmentson an ongoing basis is not guaranteed, and will be made by means of definitive offering memoranda, which will be furnished to qualified investors at their request.
• The Total Alternative Credit track record shown includes the following:o Financial: all CLO investments in commingled funds and separately managed accounts executed by investment professionals within Ares Credit Group for the period January 1, 2012
to March 31, 2021; all FINCO debt investments in Ares Capital Corporation executed by investment professionals within Ares Credit Group for the period from January 1, 2012 toMarch 31, 2021; and all financial asset investments in commingled funds and separately managed accounts executed by investment professionals within Ares Credit Group.
o Specialty: all private asset-backed investments in commingled funds and separately managed accounts executed by investment professionals within Ares Credit Group.o Real: all CMBS investments in commingled funds and separately managed accounts executed by investment professionals within Ares Credit Group for the period January 1, 2018 to
March 31, 2021; all real asset investments in commingled funds and separately managed accounts executed by investment professionals within Ares Credit Group; and all K-Seriesinvestments in separately managed accounts executed by investment professionals within Ares Real Estate Group.
• The Liquid Alternative Credit Subset reflects all non-opportunistic Alternative Credit investments. The Illiquid Alternative Credit Subset reflects all opportunistic Alternative Creditinvestments.
• The pro forma performance results shown have been compiled by Ares from actual realized and unrealized investments that were not collectively part of an actual portfolio. However,these results are based on a grouping of assets that are representative of each respective Alternative Credit strategy. Pro forma performance results may have inherent limitations, andno representation is being made that any investor will or is likely to achieve profits or losses similar to those shown. Had a fund focused on the assets represented by this performanceactually existed, Ares may not have made the same investment decisions. Given Ares did not offer an investment vehicle that held all of the assets included in the pro forma trackrecord, an investor was not able to invest in these assets as presented. There are factors related to the markets in general, or to the implementation of any specific portfolio strategy,which cannot be fully accounted for in the preparation of pro forma portfolio performance, all of which can adversely affect actual portfolio results. Returns of unrealized investmentsherein are based in part on unrealized valuations and the actual realized returns of such unrealized investments may differ materially from the returns indicated herein. Theperformance information summarized herein has not been audited. Past performance is not indicative of future results. No individual investor has received the investment performanceindicated by the pro forma returns presented herein. Certain assumptions, not all of which are described herein, have been made to calculate pro forma returns and the use of differentassumptions could produce materially different results.

Ares Management Corporation Investor Day 2021 - Not for Publication or Distribution 203
Credit Overview & Outlook EndnotesA Market Leader in Global Alternative Credit (cont’d)• Represents the asset-level Internal Rate of Return (IRR) of selected investments. IRR is the discount rate that makes the net present value of all cash flows related to a particular
investment equal to zero. IRRs are de-annualized for investments with a holding period of less than one year. Gross asset-level IRR is gross of management and other expenses relatedto investments as these expenses are not allocable to specific investments and differ among funds. Gross asset-level performance does not reflect the effect of management fees,carried interest or other expenses, which in the aggregate may be substantial. The net IRR reflects the deduction of hypothetical management fees, incentive fees, and operating andadministrative expenses from the gross IRR. For the illiquid track record, we assumed management fees of 1.25% per annum, administrative expenses of 0.12% per annum, and one timeorganizational expense of 0.175%. For the incentive fee estimate, we assumed a straight-line 20% deduction against the net return before incentive fees once a 6% hurdle was cleared. Forthe liquid track record, we assumed a management fee of 0.50% per annum, administrative expenses of 0.02% per annum, and one time organizational expense of 0.03%. The effects ofactual management fees, performance fees, and other expenses may differ, maybe materially, from the effects of expenses estimated herein. Investments are considered to be realizedwhen the original investment objective has been achieved through the receipt of cash upon the sale of an investment. Past performance is not indicative of future results, theachievement of which cannot be assured.
• Loss rate represents total net losses on all realized investments divided by total invested capital.
Our Market Presence and Profitability are Also Expanding with Scale1. AUM amounts include funds managed by Ivy Hill Asset Management, L.P., a wholly owned portfolio company of Ares Capital Corporation and a registered investment adviser.2. Pre-Operations Management Group.3. Includes deals reviewed in U.S. Direct Lending, EU Direct Lending and Liquid Credit from 2015 to Q2-21 LTM period.

Ares Management Corporation Investor Day 2021 - Not for Publication or DistributionAres Management Corporation Investor Day 2021 - Not for Publication or Distribution
Endnotes – Private Equity Overview & Outlook

Ares Management Corporation Investor Day 2021 - Not for Publication or Distribution 205
Private Equity Overview & Outlook Endnotes & Performance NotesPrivate Equity is a Large and Growing Market1. Source Preqin. Reflects private equity assets under management as of December 31, 2020. Includes Private Equity (excluding Venture Capital), Distressed Debt, and Special Situations
funds.2. Source: Preqin and World Bank. Private Equity (excluding venture capital, hybrid and fund of funds) Net Asset Value defined as AUM less dry powder. Global Public Equities Market Cap
growth from 2000-2018 is from the World Bank Database, most recent complete global data. 2019 – 2020 increase is based on the growth in the Bloomberg World Exchange MarketCapitalization Index.
3. Source: McKinsey Global Private Markets Review 2021: A year of disruption in the private markets, April 2021. Original data from Preqin Investor Survey, August 2020, and CEMBenchmarking.
Partnership Approach Across Asset Classes• HEC-DowJones (HDJ): The following outlines how HDJ evaluated private equity firms to be been selected. – Report as of January 25, 2021. The 2020 HDJ Private Equity Performance
Ranking are based on the aggregate performance of all buyout funds, as evaluated by HDJ raised between 2007 and 2016. This implies the analysis only includes ACOF III and ACOF IVand excludes ACOF I, ACOF II and ACOF V. The ranking draws on a comprehensive set of data on private equity fund performance provided by Preqin and information directly from privateequity firms and uses a unique methodology to calculate the aggregate performance of a private equity firm based on different performance measures for all the funds managed by thisfirm. The method is created by, proprietary to and calculated by HDJ. HDJ gathered data, as of November 2020, on the universe of private equity firms worldwide on which Preqinprovides performance data or which provided data directly to HDJ for the purpose of the performance rankings. This results in a sample size of 529 private equity firms, covering 977funds raised between 2007 and 2016 with an aggregate equity volume of $1.4 trillion. From this starting sample, they selected all those private equity firms that met the followingobjective criteria:o At least 2 funds which raised over the 2007 to 2016 period for which full performance information is available;o Performance data available on all of these the funds;o At least $3000m raised during this time;o Investments in US, EU or global; ando At least 10 observation years (i.e. the sum of the 'age' of all funds as of today).
• HDJ does not consider funds raised 2017 or later, as their belief is performance is still too unreliable to be judged at this point. The basis for this assessment is the performance of eachfund, measured in terms of three complementary performance measures: IRR, DPI (cash-only return multiple) and TVPI (a return multiple that considers accounting values of ongoinginvestments). HDJ assesses performance in each measure both as absolute values and measured against the corresponding performance benchmark, leading to 2*3=6 performanceindicators, which are then weighted based on a proprietary statistical method. Analysis Limitations: The confidential nature of the private equity industry makes it impossible tocompose a 100% accurate database on private equity and cannot exclude the possibility of biases in results due to missing or inaccurate information. However, HDJ relies on the samedata sources typically used to compose industry-standard statistics of private equity activity. Additional information about the analysis will be provided upon request. ACOF Note: ACOFis a flexible capital strategy combining investments in traditional buyout and distressed securities sub strategies. The historical vintage allocation (or composition) to traditional anddistressed have varied from vintage to vintage. Only those vintages that correspond to the time period of analysis by HDJ were included. Please note the performance shown for the ACOFvintages is as of December 31, 2020 and reflects realized and unrealized investments. This time period may differ than the end performance date used in the analysis. Past performanceis not indicative of future results.

Ares Management Corporation Investor Day 2021 - Not for Publication or Distribution 206
Private Equity Overview & Outlook Endnotes & Performance NotesPartnership Approach Across Asset Classes (cont’d)• Private Equity International (PEI) selected Ares Private Equity Group as the second Distressed Debt Investor of the Year in North America – 2020. In its 2020 annual awards, Private Equity
International selected Ares Private Equity Group as one of the top 2 distressed debt investor of the year, North America. Awards are based on an industry wide survey across 71 categoriesconducted by Private Equity International. Survey participants voted independently. In addition, survey participants could nominate another firm not listed in the category.
• Power Finance & Risk (PFR) selected Ares Infrastructure and Power for Renewables Investor of the Year, Private Equity Sponsor of the Year, and Credit / Mezzanine Fund Manager of theYear for the year 2019. Ares received the awards represented by survey participants that voted independently. PFR provides news, analysis, proprietary data and perspectives onfinancing and M&A in the power and utilities industries and alternative energy firms, covering the Americas. Ares was selected as the winner of the aforementioned awards through aselection process by unprecedented judging panel comprising 45 senior market participants from across project development, banking, law and investing. The PFR editorial teamcombined the feedback obtained in these interviews with PFR’s own reporting and data to determine the final winners. Ares did submit for categories but did not pay a fee to participatein the selection process. The selection of Ares Infrastructure and Power to receive these awards was based in part on subjective criteria and a potentially limited universe ofcompetitors.
• Private Equity Wire (PEW) selected Ares Management for Best Real Assets Manager for the year 2020. The award is based on a ‘peer review system’ whereby Private equity Wire readers –including institutional and high net worth investors as well as managers and other industry professionals at fund administrators, prime brokers, custodians and advisers – wereinvited to elect a ‘best in class’ in a series of categories via an online survey. In each category, the firms with the most votes at the end of the voting period were subject to a final reviewby PEW’s Senior Editorial team. Ares did not submit for categories and did not pay a fee to participate in the selection process. The selection of Ares to receive this award was based inpart on subjective criteria and a potentially limited universe of competitors.
We Have Invested in Our Team and Processes to Scale Deployment1. Includes capital invested from January 1, 2017 through June 30, 2021 (excluding capital invested in energy) for the Ares Corporate Opportunities Funds. Includes Q2’21 commitments
that were invested as of July 2021 for Ares’ sixth flagship corporate private equity fund: (i) $109 million invested in UWH in connection with its acquisition of CCRM Fertility; and (ii)$280 million targeted hold in Resource Label Group pro forma for assumed participation by management and/or anticipated sales by Ares’ sixth flagship corporate private equity fundto potential co-investors; and ACOF V: (i) $92 million invested in Kuecker Pulse Integration. There is no guarantee that Ares’ sixth flagship corporate private equity fund will be able toachieve its targeted investment hold or that any sell-downs of the amounts indicated or at all will occur, including to potential co-investors.
2. Deployment includes $329 million of commitments to CBB, McLaren and Hertz that were signed transactions yet to close as of June 30, 2021. $175 million in CBB has yet to close as ofAugust 3, 2021, is subject to closing conditions, and there is no guarantee that the transaction will close. Hertz $8 million follow-on closed in July 2021 and McLaren $146 millioninvestment closed in August 2021.
3. Includes capital invested from the USPF funds (USPF, USPF II, USPF III and USPF IV), as well as AEIF V and Ares’ climate infrastructure fund.

Ares Management Corporation Investor Day 2021 - Not for Publication or Distribution 207
Private Equity Overview & Outlook Performance NotesCorporate Opportunities: ACOF Overview and Performance• Except as otherwise explicitly noted, all performance information herein is unaudited, is on a “gross” basis, and takes into account the cumulative invested capital, cumulative cash
distributions, other realized proceeds and unrealized gains or losses of the portfolio companies, excluding any bridge financings, before giving effect to deductions for managementfees, carried interest and other expenses, the application of which would reduce such gross rates of return. While Ares' valuations of unrealized investments are based on assumptionsand valuation methodologies that Ares believes are reasonable under the circumstances at the time of calculation, including cost basis, comparable company analysis, M&Atransaction multiple, financial multiples, public market or other basis, all of which are intended to approximate fair value, the actual realized returns on unrealized investments willdepend on, among other factors, future operating results, the value of the assets and market conditions at the time of disposition, any related transaction costs and the timing andmanner of the sale, all of which may materially differ from the assumptions used in calculating the performance information set forth herein. Accordingly, the actual realized returnsmay differ materially from the (assumed) returns indicated herein. There can be no assurance that unrealized investments will be realized at the valuations shown. Past performance isnot indicative of future results. There can be no assurance that the fund will achieve results comparable to those shown herein, will be able to avoid losses or will be able to achieve itsinvestment objectives. Not meaningful (“denoted with N/M”) is shown where a return cannot be calculated or for IRR calculations for investments held less than twelve months;however, those results are taken into account in the fund-level IRRs that are shown.
• “Invested Capital” represents aggregate capital invested in a portfolio company, including recycled capital, but does not include Bridge Financings nor capital committed to beinvested in a portfolio company that has yet to be deployed or amounts contributed by co-investors, if any. Invested Capital reflects capital funded by partners or through the use of theapplicable fund’s subscription facility. Invested Capital excludes asset-level non-recourse debt incurred to purchase or re-finance the investment. Invested Capital excludes BridgeFinancings still outstanding as of June 30, 2021 as follows: Ares’ sixth flagship corporate private equity fund: excludes $150.0 million of capital funded to Vmo Aircraft Leasing; ACOF IV:excludes $2.3 million of capital funded to The Neiman Marcus Group LLC (Mytheresa); and ACOF III: excludes $1.4 million of capital funded to The Neiman Marcus Group LLC (Mytheresa).Invested Capital also excludes Bridge Financings which have been repaid, as follows: ACOF III: excludes $3.1 million of capital funded to 99¢ Only Stores; ACOF IV: excludes $213.0 millionof capital funded to American Tire Distributors Holdings, Inc., $60.0 million provided to Deva Holdings, Inc., and $207.1 million provided to Farrow & Ball Ltd; ACOF V: excludes $85.0million of capital funded to Admiral Permian Resources, LLC, $64.0 million provided to Convergint Technologies LLC, $63.0 million provided DMG Practice Management Solutions LLC,$265.7 million provided to Salt Creek Midstream LLC, $19.6 million provided to Savers, Inc., $310.6 million provided to EPIC Midstream Holdings, LP, $3.0 million provided to Chisholm Oiland Gas Holdings, LLC, $40.0 million provided to Press Ganey, $177.2 million provided to Coolsys, Inc., $197.3 million provided to Cooper’s Hawk and $27.7 million provided to TricorBraun;and Ares’ sixth flagship corporate private equity fund: excludes $90.0 million of capital funded to Unified Women’s Healthcare, $62.3 million provided to TricorBraun, $248.7 millionprovided to Vmo Aircraft Leasing and $80.9 million provided to Exemplar Health Care.
• “Realized Proceeds” represents the sum of all cash dividends, interest income, other fees, cash proceeds and securities from portfolio investments. Realized Proceeds does not takeinto account the capital returned to the fund upon incurrence of any asset-level non-recourse debt and excludes any proceeds received related to Bridge Financings.
• The gross internal rate of return (“Gross IRR”) has been calculated as of June 30, 2021 and excludes the effect of management fees, carried interest, and other expenses. Net IRR iscalculated after giving effect to management fees, carried interest, fund-level taxes and other expenses, and exclude commitments of the Ares affiliates who pay neither managementfees nor carried interest. Net IRR does not exclude limited partners that pay reduced management fees and, therefore, the management fee rate used in calculating Net IRR is a blendedrate of full fee and reduced fee limited partners; the Net IRR of a limited partner that does not benefit from a fee discount would be lower. Gross IRRs presented are calculated on thebasis of inflows and outflows of cash to and from investments and Unrealized Values, excluding any Bridge Financings, assuming such inflows and outflows occurred as of month endand all remaining investments were sold at the values shown as of June 30, 2021. Net IRRs are fund-level IRRs and take into consideration the timing of contributions and distributionsto and from the funds. The funds may utilize a credit facility for general cash management purposes. The Net IRRs would generally be lower had the applicable fund called capital fromlimited partners instead of utilizing the credit facility. The net and gross returns reflect reinvestment of certain gains and other proceeds to the full extent permitted under theapplicable governing documents. Net returns include the impact of fund-level expenses.

Ares Management Corporation Investor Day 2021 - Not for Publication or Distribution 208
Private Equity Overview & Outlook Performance NotesCorporate Opportunities: ACOF Overview and Performance – Pro Forma Performance Notes• The pro forma performance results shown have been compiled by Ares from realized and unrealized investments that were not collectively part of an actual portfolio. The performance
includes all investments made by ACOF Prior Funds. “Prior Funds” is defined as Ares Corporate Opportunities Fund, L.P. (“ACOF I”), Ares Corporate Opportunities Fund II, L.P. (“ACOF II”),Ares Corporate Opportunities Fund III, L.P. (“ACOF III”), Ares Corporate Opportunities Fund IV, L.P. (“ACOF IV”) and Ares Corporate Opportunities Fund V, L.P. (“ACOF V). However, theperformance is provided ex- Energy equipment & services industry, and the oil, gas & consumable fuels related investments, (“ex- Energy”). The pro forma performance is based on agrouping of assets that are representative of the strategy that the Fund generally intends to follow. Pro forma performance results may have inherent limitations, and no representationis being made that any investor will or is likely to achieve profits or losses similar to those shown. Had a fund actually existed that included all assets other than ex-Energy, Ares may nothave made the same investment decisions. Given Ares did not offer an investment vehicle that held all of the assets included in the pro forma track record, an investor was not able toinvest in these assets as presented. There are factors related to the markets in general, or to the implementation of any specific portfolio strategy, which cannot be fully accounted for inthe preparation of pro forma portfolio performance, all of which can adversely affect actual portfolio results. No assurance can be made that unrealized values will be realized asindicated; past performance is not indicative of future results. Returns of realized investments herein are based in part on unrealized valuations and the actual realized returns of suchunrealized investments and may differ materially from the returns indicated herein. The performance information summarized herein has not been audited. No individual investor hasachieved the investment performance indicated herein. Certain assumptions, not all of which are described herein, have been made to calculate pro forma returns and the use ofdifferent assumptions could produce materially different results. Performance of realized and unrealized investments shown reflects actual realized and unrealized investments fromPrior Funds ex-Energy from inception in 2003 through June 30, 2021. Please review in conjunction with the full track record of the ACOF Funds and the ACOF Performance notes on theprevious page.
• The Pro Forma Net IRRs for each portfolio excluding Energy sector investments, reflects the inflows and outflows of cash to and from investments and Unrealized Values, reduced byhypothetical management fees, hypothetical operating and organizational expenses, and hypothetical carried interest, but does not reflect the impact of taxes.
• For purposes of calculating the net returns, fee and expense assumptions are based on the following: operating and organizational expenses of 0.4% per annum on invested capital formature funds, and 0.9% per annum on invested capital for funds still in their investment period, each consistent with average historical fund levels; a management fee of 1.5% perannum on commitments for the earlier of an investment period of five years or the date a Competing Entity (or follow on fund) first receives or begins to accrue management fees, and0.75% per annum on invested capital for an additional five years, averaging to a rate of 2.5% per annum on invested capital for mature funds and 3.00% per annum on invested capitalfor funds still in their investment period; a carried interest rate of 20% on net profits (defined as gross returns less operating and organizational expenses and management fees)subject to an 8% annual preferred return for the Limited Partners.
• Assumptions are based upon what Ares believes represents a reasonable fee analysis based on the ACOF Funds. Fees and expenses for the Fund may be materially different than the feeand expense assumptions provided herein. The actual return realized by any investor may vary based on the timing of capital contributions and distributions and may differ materiallyfrom the returns reflected or contemplated in the hypothetical Net IRRs presented herein.

Ares Management Corporation Investor Day 2021 - Not for Publication or Distribution 209
Corporate Opportunities: ACOF Overview and Performance1. The aggregate IRR and MIC shown does not reflect actual returns to any investor in any of the prior funds. Pro Forma Fund Performance (Ex-Energy) excludes the impact of investments
in the energy equipment & services industry and the oil, gas & consumable fuels related industry, (“ex- Energy”). The pro forma performance results shown have been compiled by Ares from actual realized and unrealized investments that were not collectively part of an actual portfolio. However, these results are based on a grouping of assets that are representative of the strategy that Ares’ sixth flagship corporate private equity fund intends to follow. Pro forma performance results may have inherent limitations, and no representation is being made that any investor will or is likely to achieve profits or losses similar to those shown. Had a fund actually existed that included all assets other than ex-Energy, Ares may not have made the same investment decisions. Given Ares did not offer an investment vehicle that held all of the assets included in the pro forma track record, an investor was not able to invest in these assets as presented. There are factors related to the markets in general, or to the implementation of any specific portfolio strategy, which cannot be fully accounted for in the preparation of pro forma portfolio performance, all of which can adversely affect actual portfolio results. Gross / net IRRs as of June 30, 2021 are as follows: ACOF V: 14.0% / 9.0%; ACOF IV: 22.1% / 15.9%; ACOF III: 28.8% / 20.4%; ACOF II: 18.6% / 13.0%; ACOF I: 20.0% / 12.8%. Gross / net MICs are as follows: ACOF V: 1.4x / 1.2x; ACOF IV: 2.5x / 2.1x; ACOF III: 2.7x / 2.3x; ACOF II: 2.0x / 1.7x; ACOF I: 1.7x / 1.5x. Excluding energy, gross / net IRRs as of June 30, 2021 are as follows: ACOF V: 33.4% / 23.6%; ACOF IV: 21.6% / 14.9%; ACOF III: 30.4% / 22.0%; ACOF II: 22.1% / 15.3%; ACOF I: 20.4% / 14.0%. Excluding energy, gross / net MICs are as follows: ACOF V: 1.9x / 1.6x; ACOF IV: 2.9x / 2.5x; ACOF III: 2.9x / 2.5x; ACOF II: 2.3x / 2.0x; ACOF I: 1.8x / 1.5x.
2. Excludes “Energy” and “Other”. “Other” includes Air Lease Corporation, AmeriQual, Celerity, Kinetics, Marietta, WCA Waste Corporation, undisclosed toe-hold and options. “Other” gross MIC / IRR as of June 30, 2021: 0.9x / (1.8%).
Corporate Opportunities: Systematically Growing Companies is A Key to Our Success1. The companies on this page are representative of traditional platform investments in ACOF III and IV with a CAGR greater than 18% (excluding Aspen and UWH as they are ACOF V and
Ares’ sixth flagship corporate private equity fund investments, respectively). 2. The companies on this page are representative of Ares’ sixth flagship corporate private equity fund investments/ commitments and all ACOF V unrealized platform non-energy
investments.3. Reflects fully realized and partially realized investments in ACOF I-V as of June 30, 2021, excluding distressed for control investments. Analysis excludes fully realized investment for
which there has been less than $100 million of value creation due to the outsized effect of relatively small dollar value increases and decreases on percentage changes (AmeriQualGroup, Smart and Final). Value creation is defined as change in equity value and includes impact of Hanger Orthopedic Group, Inc., GNC Holdings, Inc. and LyondellBasell Industries N.V. shareholder dividends, Douglas Dynamics, Inc. distribution to equity holders, Maidenform Brands, Inc. pre‐IPO dividend, Samsonite Corporation dividend, Aspen Dental Management, Inc. dividend, CHG Healthcare Holdings, L.P. dividend, Floor & Decor Outlets of America, Inc. dividend, Insight Global LLC dividend and OB Hospitalist Group, Inc. dividend. Value creation from debt paydown is adjusted to exclude debt repayments funded by net proceeds from a primary share issuance, as raising equity to repay debt does not represent a creation of value. Analysis does not include investments where realized proceeds are less than initial investment (as there is no value creation), companies with a significant amount of value created through asset sales (White Energy Inc., BlackBrush Investment Holdings, LLC, Noble Energy Inc./Clayton Williams Energy, Inc.), and companies where transformative acquisitions were completed post‐ACOF's investment (SandRidge Energy, Inc. and EXCO Resources, Inc.). Companies where there has not been a sale process but where there have been dividends have also been excluded (DuPage Medical Group and Convergint). Companies where EBITDA is not a relevant metrics (Air Lease Corporation, CIty Ventures, DevaCurl) were also excluded from the analysis. Exit valuations for companies exited over time represent the valuation at the final common stock sale price. Exit valuations of the portfolio companies that were exited through private sales represent the valuation at such sale. Value creation for partially realized investments represents valuation at the time of the partial exit event. Value creation drivers are weighted by gross profit realized to the ACOF Funds.
Private Equity Overview & Outlook Endnotes

Ares Management Corporation Investor Day 2021 - Not for Publication or Distribution 210
Private Equity Overview & Outlook Endnotes and Performance NotesSpecial Opportunities: ASOF Overview and Performance
Note: Fund-level IRRs take into effect the performance benefit of the Savers warehouse facility and the subscription line, which should decrease over time. Since inception fund-level gross/ net returns are as of the first capital call on December 20, 2019. Since inception asset-level gross IRR calculated as of the ASOF I’s first investment in Savers on March 27, 2019. The fund-level IRRs shown here are for Ares Special Opportunities Fund, L.P. ASOF I also includes Ares Special Opportunities Fund (Offshore), L.P., which makes certain investments through a blockercorporation for tax purposes and therefore has lower Gross and Net IRRs as a result of tax costs associated with the blocker corporation
• Gross IRR and MIC presented are calculated on the basis of daily inflows and outflows of cash to and from the fund and Unrealized Values, excluding any Bridge Financings, andassuming all remaining investments were sold at the values shown as of reporting date. Gross IRR excludes the impact of expenses, management fees, and carried interest. Returns toinvestors will be net of such expenses, management fees and carried interest. The Fund-Level Gross MIC is calculated at the fund level and as such reflects recycling and reinvestment.
• Net IRR and MIC presented are calculated after giving effect to management fees, carried interest, fund-level taxes and other expenses, excluding any Bridge Financings, and excludecommitments of ASOF I’s general partner and its affiliates who pay neither management fees nor carried interest. Net IRR does not exclude limited partners that pay reducedmanagement fees and, therefore, the management fee rate used in calculating Net IRR is a blended rate of full fee and reduced fee limited partners; the Net IRR of a limited partner thatdoes not benefit from a fee discount would be lower. The net and gross returns reflect reinvestment of certain gains and other proceeds to the full extent permitted under the applicablegoverning documents. Net returns include the impact of fund-level expenses. The Net MIC is calculated at the fund level and as such reflects recycling and reinvestment.
• Pro forma without the short-term leverage benefit of subscription line financing - ASOF I can only keep a balance on its subscription line up to six months after drawing from it to makea purchase – the fund-level gross and net IRR are 51.7% and 40.3%, respectively, as of the reporting date.
Bridge Financings: Bridge Financings are not included in deployment or performance figures. Asset-specific details provided below.
• As of June 30, 2021, ASOF I had funded $200 million of cost in Vmo of which $100 million was designated as Invested Capital and $100 million was designated as Bridge Financing for leverage that Vmo intends to raise. There is no guarantee that any proposed leverage will be obtained. If any portion of the $100 million Bridge Financing is returned to ASOF I, it could later be redrawn by Vmo.
Special Opportunities: Investing In and Catalyzing Transformational Change Across Market Environments1. Includes following unfunded commitments: $175mm (yet to close) in CBB in Q1 2020; $100mm in Vmo and $24mm DDTL in VAC in Q4 2020; $10mm in CTL in Q1 2021; $146mm in
McLaren and $8mm in Hertz. Follow-on commitment to Hertz closed in July 2021. Commitment to McLaren closed in August 2021. The commitment to CBB is subject to the signed transaction being consummated. The consummation of the transaction is subject to customary closing conditions, including regulatory approvals. There is no assurance that the transactions will close.
2. As of June 30, 2021, ASOF I had funded $200 million of cost in Vmo of which $100 million was designated as Invested Capital and $100 million was designated as Bridge Financing for leverage that Vmo intends to raise. There is no guarantee that any proposed leverage will be obtained. If any portion of the $100 million Bridge Financing is returned to ASOF I, it could later be redrawn by Vmo.

Ares Management Corporation Investor Day 2021 - Not for Publication or Distribution 211
Private Equity Overview & Outlook EndnotesInfrastructure & Power: AIP Overview and Performance1. Invested capital includes relevant investments made by Ares Infrastructure and Power and Ares Direct Lending, including Ares Capital Corporation, that are consistent with AIP’s
investment mandate.2. All performance data is as of June 30, 2021 and reflects realized and unrealized investments. No assurance can be made that unrealized values will be realized as indicated. Past
performance is not indicative of future results. Gross performance figures are before giving effect to taxes, management fees, carried interest and other expenses. Gross IRRs are basedon aggregate monthly cash flows to/from each investment, including the equity that was funded to each investment, cash flows attributable to any reinvestment of proceeds, and everycash distribution received from each investment, plus the fair value of unrealized investments as of the measurement date. Gross Multiple is the sum of realized proceeds andunrealized value of all investments, divided by aggregate dollars invested by the respective fund. Net performance figures are after giving effect to management fees, carried interestand other fund expenses, including the impact of the use of subscription financing, and exclude commitments by the general partner or its affiliates. Net IRRs are based on actual cashflows to/from limited partners, plus the net asset value of the limited partners’ capital accounts as of the measurement date. Net Multiple is the sum of cash distributions plus the netasset value as of the measurement date, divided by the sum of capital contributions. To calculate the multiple based on actual fund size, Net Multiple is adjusted for recallable capital.Past performance is not indicative of future results.

Ares Management Corporation Investor Day 2021 - Not for Publication or DistributionAres Management Corporation Investor Day 2021 - Not for Publication or Distribution
Endnotes – Real Estate Overview & Outlook

Ares Management Corporation Investor Day 2021 - Not for Publication or Distribution 213
Real Estate Overview & Outlook EndnotesGlobal Real Estate Platform with Local Reach1. Based on Gross Asset Value of all active real estate investments in the Ares Real Estate Group portfolio as of March 31, 2021.2. U.S. map excludes $23.2 million of Gross Asset Value that cannot be allocated to a single U.S. region.3. In Madrid and Frankfurt, Ares Real Estate Group does not maintain a physical office but has an investment professional located in this market.4. Non-Ares location providing administrative and support functions to the Ares Real Estate Group.
Investing Across All Strategies with Attractive Performance1. Gross TWR: Calculated as the quotient of (a) the sum of (i) investment income, composed of interest income, fee income, and other income; plus (ii) appreciation/depreciation of
investments; and, less (iii) interest expense and financing costs, if any, divided by (b) the weighted average outstanding capital invested.2. Net TWR: Calculated as the quotient of (a) the sum of (i) investment income, composed of interest income, fee income, and other income; plus (ii) appreciation/depreciation of
investments; less (iii) interest expense and financing costs, if any; and, less (iv) fund expenses, composed of management fees, organizational costs, professional fees, and G&Aexpenses; divided by (b) the weighted average outstanding capital invested.
3. The historical returns presented show share performance since September 30, 2012, which is when the fund converted to a NAV REIT on July 12, 2012. As a result, NAV inception isSeptember 30, 2012. Performance is measured by total return for Class-I shares, which represents the compound annual rate of return assuming reinvestment of all distributions.Returns are presented as if purchased without sales charges and purchased at NAV. Gross returns are calculated before giving effect to operating expenses, management and advisoryfees and specific offering costs incurred by the fund.
4. The historical returns presented show share performance since September 30, 2012, which is when the fund converted to a NAV REIT on July 12, 2012. As a result, NAV inception isSeptember 30, 2012. Performance is measured by total return for Class-I shares, which represents the compound annual rate of return assuming reinvestment of all distributions.Returns are presented as if purchased without sales charges and purchased at NAV. Net returns include the impact of fund-level operating expenses, management and advisory feesand specific offering costs incurred by the fund. Investor net returns may differ by class of share invested.
5. The gross IRR is an annualized since inception gross internal rate of return of cash flows to and from investments and the residual value of the investments at the end of themeasurement period. Gross IRRs reflect returns to all partners. Cash flows used in the gross IRR calculation are assumed to occur at quarter-end. The gross IRRs are calculated beforegiving effect to management fees, carried interest and other expenses, as applicable.
6. The net IRR is an annualized since inception net internal rate of return of cash flows to and from the fund and the fund’s residual value at the end of the measurement period. Net IRRsreflect returns to the fee-paying partners and, if applicable, exclude interests attributable to the non-fee paying partners and/or the general partner which does not pay managementfees or carried interest or has such fees rebated outside of the fund. The cash flow dates used in the net IRR calculation are based on the actual dates of the cash flows. The net IRRs arecalculated after giving effect to management fees, carried interest as applicable, and other expenses.

Ares Management Corporation Investor Day 2021 - Not for Publication or Distribution 214
Real Estate Overview & Outlook EndnotesDeliberate and Resilient Portfolio Construction1. Based on fair market value of our U.S. Equity funds as of March 31, 2020.2. Performance for the U.S. real estate equity portfolio is represented by the U.S. equity real estate composite, which is comprised of DEV II, US VIII and US IX. Performance for the EU real
estate equity portfolio is represented by the European real etate composite, which is comprised of EPEP II, EF IV and EF V. EF IV and EF V are each made up of 2 feeder funds, onedenominated in U.S. dollars and one denominated in Euros. Gross returns do not reflect the deduction of management fees, carried interest, or other expenses, as applicable. Netreturns are after giving effect to applicable management fees, carried interest, as applicable, and other expenses. Net returns for U.S. equity were 3.6%, -3.5%, 2.6%, 5.2%, 6.2% and 5.7% inQ4-19, Q1-20, Q2-20, Q3-20, Q4-20 and Q1-21, respectively. Net returns for EU equity were 4.9%, -4.0%, 3.2%, 0.2%, 3.8% and 6.0% in Q4-19, Q1-20, Q2-20, Q3-20, Q4-20 and Q1-21, respectively.Returns presented are shown for the Euro-denominated composite as this is the best denomination of the funds. We believe aggregated performance returns reflect overall quarterlyperformance returns in a strategy, but are not necessarily investable funds or products themselves.
3. For the period March 31, 2020 to March 31, 2021.
Key Drivers in Real Estate That Support Our Investment Approach• Classified according to Ares' proprietary methodology based on available data. Green circles indicate sectors that we believe are experiencing tailwinds as result of changes created by,
or accelerated by, COVID-19; orange circles represent sectors that we believe are exhibiting a more uncertain outlook as a result of COVID-19; orange/red circles represent sectors that areexperiencing significant headwinds due to COVID-19 and as a result are unlikely to be sectors that Ares seeks to target unless special circumstances present where we believe is aparticularly compelling and resilient investment opportunity. The assumptions underlying this proprietary methodology are subject to change, may not prove to be true and actual risksmay be different than the classifications presented herein. Accordingly, no representation or warranty is made in respect of this information.
Performance and Acquisitions Have Supported AUM Growth1. AUM as of June 30, 2021. Includes the acquisition of Black Creek Group, which closed on July 1, 2021.2. Includes approximately $1.8 billion of gross capital raised for the 12-month period ended June 30, 2021 for the acquisition of Black Creek Group, which closed on July 1, 2021.3. Perpetual non-traded REIT capital of Black Creek refers to AUM of vehicles that have an indefinite term and for which there is no immediate requirement to return invested capital to
investors upon the realization of investments. Perpetual non-traded REIT capital may be withdrawn by investors under certain conditions, including through an election to redeem aninvestors fund investment.
Additional Key Macro Drivers in Real Estate1. Source: McKinsey & Company, July 2021. As of 2019.2. Source: McKinsey & Company, July 2021. Growth measured from 2013 to 2019.3. Source: Capgemini Global Wealth report, June 2021.4. FRED Economic Data, July 2021.5. Ares Estimate.
Significant Market Opportunity with a Leading Retail Platform1. Source: The Stanger Market Pulse Report, Public DPP, Non-Listed REIT & Non-Listed BDC Sales, December 2020, December 2019 and December 2018.2. Source: The Stanger Market Pulse Report, Public DPP, Non-Listed REIT & Non-Listed BDC Sales, December 2020.3. Annual capital raises from 2010 through 2020.4. Source: McKinsey & Company, July 2021.

Ares Management Corporation Investor Day 2021 - Not for Publication or DistributionAres Management Corporation Investor Day 2021 - Not for Publication or Distribution
Endnotes – Secondary Solutions Overview & Outlook

Ares Management Corporation Investor Day 2021 - Not for Publication or Distribution 216
Secondary Solutions Overview & Outlook EndnotesCapital Contributed : Represents equity capital contributed to the funds.
Total Value: Represents Gross Distributions, defined as distributions made to the partners from the funds, including carried interest and investment management fees as applicable, plus remaining Residual Value, which is defined as the reported value of the underlying investments, generally provided by the underlying fund managers as of the table date and other balance sheet items held by the partnerships as of such date.
Performance returns are represented by the combined performance of the underlying funds in each strategy. Returns include the reinvestment of income and other earnings from securities or other investments and reflect the deduction of all trading expenses. The net return is an annualized since inception net internal rate of return that is calculated by combining the cash flows to and from the underlying funds in each strategy and the applicable residual fund values at the end of the measurement period.
Net IRRs reflect returns to the fee-paying limited partners and are calculated after giving effect to management fees, administrative expenses, carried interest, and credit facility interest expenses, as applicable. There may be funds in each strategy that utilize a credit facility during the investment period and for general cash management purposes. Net returns would likely have been lower had capital been called from its limited partners instead of utilizing the credit facility. Net IRR do not exclude limited partners that pay reduced management fees and, therefore, the management fee rate used in calculating Net IRR is a blended rate of full fee and reduced fee limited partners; the Net IRR of a limited partner that does not benefit from a fee discount would be lower. Net IRRs are fund-level IRRs and take into consideration the timing of contributions and distributions to and from the funds. The funds may utilize a credit facility for general cash management purposes. The Net IRRs would generally be lower had the applicable fund called capital from limited partners instead of utilizing the credit facility. The net returns reflect reinvestment of certain gains and other proceeds to the full extent permitted under the applicable governing documents. LVP and LEP III used seller financing in the amounts of $45.0M and $111.6M, respectively. LEP XV has a 10% long term leverage cap. LEP XVI has a 20% long term leverage cap. The Net IRR for Landmark Equity Partners XVI exceeds 40% through the applicable time period. Landmark expects this metric to diminish significantly over the life of the fund.
The results set forth in the performance table are unaudited. Certain funds of the vintage 1990-1995 were co-managed by Landmark Partners and a third-party advisory firm. The performance of each fund is presented together with such fund’s affiliated parallel funds or accounts on a combined basis, given that their investments are substantially the same. Past performance is not necessarily indicative of future results, nor does it ensure that investors will not incur a loss with respect to their investment. Includes realized and unrealized investments and no assurance can be made that unrealized values will be realized as indicated. While Landmark’s reported returns of unrealized or partially realized investments are based on assumptions that Landmark believes are reasonable under the circumstances, the actual realized returns on Landmark’s unrealized investments will depend on, among other factors, future operating results, the value of the assets and market conditions and other similar considerations.

Ares Management Corporation Investor Day 2021 - Not for Publication or DistributionAres Management Corporation Investor Day 2021 - Not for Publication or Distribution
Endnotes – New Platforms Overview & Outlook

Ares Management Corporation Investor Day 2021 - Not for Publication or Distribution 218
New Platforms Overview & Outlook EndnotesStrong Performance Driven by Low Loss Rates and Differentiated Market Opportunities 1. Capital Deployed represents the total amount funded by capital called from the relevant fund (including recycled capital) and from the fund’s credit facility with respect to portfolio
investments plus amounts that have been contractually committed for investments. It does not take into account capital called for management fees or other expenses, or capital called and held in the working capital reserve (if any) and not applied for portfolio investments, management fees or other expenses. As such the aggregate amount of capital actually called from a fund’s investors may vary dramatically from the Capital Invested. Capital Invested excludes capital invested by co-investors (including by a fund’s investors by way of co-investment) in one or more portfolio investments of a fund.
2. Realized Proceeds represents the cash proceeds received by such fund with respect to its portfolio investments, net of withholding taxes.3. Performance returns are represented by the combined performance of the underlying funds in each strategy. The fund-level NAV gross IRR is an annualized since inception gross
internal rate of return of cash flows to and from the Fund and the Fund's residual value at the end of the measurement period. The cash flow dates used in the fund-level NAV gross IRR calculation are based on the actual dates of the cash flows. The fund-level NAV gross IRRs are calculated before giving effect to management fees, carried interest and other expenses, as applicable. Reflects current cash coupon or interest received or expected divided by the cost of investment. The fund-level NAV net IRR is an annualized since inception net internal rate of return of cash flows to and from the Fund and the Fund's residual value at the end of the measurement period. The cash flow dates used in the fund-level NAV net IRR calculations are based on the actual dates of the cash flows. The fund-level NAV net IRRs are calculated after giving effect to management fees, carried interest, as applicable, and other expenses. The Fund may utilize a credit facility during the investment period and for general cash management purposes. The fund-level NAV net IRRs would likely have been lower had such fund called capital from its limited partners instead of utilizing the credit facility. Past performance is not indicative of future results, the achievement of which cannot be assured. The performance results of Special Situations Series shown herein have been compiled by Ares SSG from actual realized and unrealized investments that are comprised of all investments from SSG Capital Partners I, L.P., SSG Capital Partners II, L.P., SSG Capital Partners III, L.P., SSG Capital Partners IV, L.P., SSG Capital Partners IV Sidecar, L.P., SSG Capital Partners V, L.P., and SSG Capital Partners V Sidecar, L.P. through June 30, 2021. The performance results of Senior Lending Series shown herein have been compiled by Ares SSG from actual realized and unrealized investments that are comprised of all investments from Secured Lending Opportunities I, L.P. and Secured Lending Opportunities II, L.P., through June 30, 2021. Accordingly, these results aggregate all of the capital that Ares SSG managed with respect to these investments, but such performance returns do not reflect any single investor's performance. Total Gross and Net IRRs for each strategy are based on a capital invested size-weighted average of individual fund IRRs and do not reflect the experience of an investor in any single fund.
4. Loss Ratio represents the ratio of the sum of the projected loss amount of portfolio investments below cost to aggregate Capital Invested on an annualized basis. The realized Loss Ratio of a fund could vary dramatically from the projected loss ratio as the actual Loss Ratio may vary from Ares-SSG’s projections. Loss Ratio reflects losses from all SSG funds, including: SSG Capital Partners I, L.P., SSG Capital Partners II, L.P., SSG Capital Partners III, L.P., SSG Capital Partners IV, L.P., SSG Capital Partners IV Sidecar, L.P., SSG Capital Partners V, L.P., SSG Capital Partners V Sidecar, L.P., Secured Lending Opportunities I, L.P. and Secured Lending Opportunities II, L.P.
Strong Performance Has Led To Significant AUM Growth 1. Prior to 2017, AUM reflects the fair value of investment less outstanding credit facility plus uncalled capital (if still within investment period). In subsequent periods, AUM reflects fund
NAV plus uncalled capital.

Ares Management Corporation Investor Day 2021 - Not for Publication or Distribution 219
New Platforms Overview & Outlook EndnotesAres Insurance Solutions - Aspida1. Aspida Life Re, Ltd. AUM includes $1.9 billion subadvised by 3rd parties and $0.8 billion subadvised by Ares. When reporting consolidated AUM, Aspida assets subadvised by Ares are
recorded in their respective strategy AUM amounts.2. Source: PwC, “Asset and wealth management revolution: The power to shape the future,” 2020. Reflects estimated assets under management at insurance companies in 2020.
Aspida’s Growth Opportunities1. Aspida Life Re, Ltd. AUM includes $1.9 billion subadvised by 3rd parties and $0.8 billion subadvised by Ares. When reporting consolidated AUM, Aspida assets subadvised by Ares are
recorded in their respective strategy AUM amounts.

Ares Management Corporation Investor Day 2021 - Not for Publication or DistributionAres Management Corporation Investor Day 2021 - Not for Publication or Distribution


![PM 2014 investor day 2014-06-26-Operations Investor Day Slides [FINAL]](https://static.documents.pub/doc/80x56/577cbc651a28aba7118da314/pm-2014-investor-day-2014-06-26-operations-investor-day-slides-final.jpg)


