ORIGINAL RESEARCH published: 07 April 2016 doi: 10.3389/fpsyg.2016.00472 Frontiers in Psychology | www.frontiersin.org 1 April 2016 | Volume 7 | Article 472 Edited by: Dan Ariely, Duke University, USA Reviewed by: Ting Jiang, University of Pennysalvania, USA Stefania Bortolotti, University of Cologne, Germany *Correspondence: Giulia Andrighetto [email protected]Specialty section: This article was submitted to Cognitive Science, a section of the journal Frontiers in Psychology Received: 17 July 2015 Accepted: 17 March 2016 Published: 07 April 2016 Citation: Andrighetto G, Zhang N, Ottone S, Ponzano F, D’Attoma J and Steinmo S (2016) Are Some Countries More Honest than Others? Evidence from a Tax Compliance Experiment in Sweden and Italy. Front. Psychol. 7:472. doi: 10.3389/fpsyg.2016.00472 Are Some Countries More Honest than Others? Evidence from a Tax Compliance Experiment in Sweden and Italy Giulia Andrighetto 1, 2 *, Nan Zhang 3 , Stefania Ottone 4 , Ferruccio Ponzano 5 , John D’Attoma 1 and Sven Steinmo 1, 6 1 Robert Schumann Center for Advanced Studies, European University Institute, San Domenico di Fiesole, Fiesole, Italy, 2 National Council for Research, Institute of Cognitive Science and Technologies, Rome, Italy, 3 Department of Social and Political Sciences, European University Institute, San Domenico di Fiesole, Fiesole, Italy, 4 Department of Economics, Management and Statistics, University of Milano-Bicocca, Milano, Italy, 5 Department of Law, Politics, Economics and Social Sciences, University of Eastern Piedmont, Alessandria, Italy, 6 Department of Political Science, University of Colorado, Boulder, CO, USA This study examines cultural differences in ordinary dishonesty between Italy and Sweden, two countries with different reputations for trustworthiness and probity. Exploiting a set of cross-cultural tax compliance experiments, we find that the average level of tax evasion (as a measure of ordinary dishonesty) does not differ significantly between Swedes and Italians. However, we also uncover differences in national “styles” of dishonesty. Specifically, while Swedes are more likely to be either completely honest or completely dishonest in their fiscal declarations, Italians are more prone to fudging (i.e., cheating by a small amount). We discuss the implications of these findings for the evolution and enforcement of honesty norms. Keywords: tax compliance, ordinary dishonest behavior, fudging, cross-country comparison, social norms INTRODUCTION Ordinary dishonest behavior rarely attracts much attention. Seemingly innocuous practices such as avoiding VAT, double parking, cheating on an exam, and dodging fares on public transport tend to spread, often even in the wake of high-profile, sensationalized scandals. But while such everyday misdeeds may appear benign, taken together, they can result in vast societal damage (DePaulo et al., 1996; Ariely, 2008; Feldman, 2009; Ayal and Gino, 2011). In this study, we examine cross-national variation in individuals’ willingness to engage in ordinary dishonest behavior, as measured by their tendency to underreport income for tax purposes. The extent to which citizens engage in tax evasion and tax avoidance varies enormously across countries (Schneider and Enste, 2013). This is true even within European nations that share important features such as stable democratic institutions, developed economies, EU membership and broadly similar tax systems. Part of the reason underlying this cross-national variation relates to the efficiency of public institutions. Put simply, countries with efficient institutions (with stringent auditing and financial reporting standards) may be more effective at deterring tax evasion. At the same time, efficient institutions may encourage higher compliance because citizens feel that they are receiving something (i.e., high-quality public services) in return for their money (Levi, 1989; Smith and Stalans, 1991; Smith, 1992; Pommerehne et al., 1994; Edlund, 1999; Frey and Feld, 2002; Frey and Torgler, 2007; Torgler and Schneider, 2007; Cummings et al., 2009; Levi et al., 2009). However, there is also reason to believe that variation in norms and culture plays an important role in explaining tax evasion. Consider two European countries that arguably lie at opposite ends
Transcript
ORIGINAL RESEARCHpublished: 07 April 2016
doi: 10.3389/fpsyg.2016.00472
Frontiers in Psychology | www.frontiersin.org 1 April 2016 | Volume 7 | Article 472
Are Some Countries More Honestthan Others? Evidence from a TaxCompliance Experiment in Swedenand ItalyGiulia Andrighetto 1, 2*, Nan Zhang 3, Stefania Ottone 4, Ferruccio Ponzano 5,
John D’Attoma 1 and Sven Steinmo 1, 6
1 Robert Schumann Center for Advanced Studies, European University Institute, San Domenico di Fiesole, Fiesole, Italy,2National Council for Research, Institute of Cognitive Science and Technologies, Rome, Italy, 3Department of Social and
Political Sciences, European University Institute, San Domenico di Fiesole, Fiesole, Italy, 4Department of Economics,
Management and Statistics, University of Milano-Bicocca, Milano, Italy, 5Department of Law, Politics, Economics and Social
Sciences, University of Eastern Piedmont, Alessandria, Italy, 6Department of Political Science, University of Colorado,
Boulder, CO, USA
This study examines cultural differences in ordinary dishonesty between Italy and
Sweden, two countries with different reputations for trustworthiness and probity.
Exploiting a set of cross-cultural tax compliance experiments, we find that the average
level of tax evasion (as a measure of ordinary dishonesty) does not differ significantly
between Swedes and Italians. However, we also uncover differences in national “styles”
of dishonesty. Specifically, while Swedes are more likely to be either completely honest
or completely dishonest in their fiscal declarations, Italians are more prone to fudging
(i.e., cheating by a small amount). We discuss the implications of these findings for the
Ordinary dishonest behavior rarely attracts much attention. Seemingly innocuous practices such asavoiding VAT, double parking, cheating on an exam, and dodging fares on public transport tendto spread, often even in the wake of high-profile, sensationalized scandals. But while such everydaymisdeeds may appear benign, taken together, they can result in vast societal damage (DePaulo et al.,1996; Ariely, 2008; Feldman, 2009; Ayal and Gino, 2011). In this study, we examine cross-nationalvariation in individuals’ willingness to engage in ordinary dishonest behavior, as measured by theirtendency to underreport income for tax purposes.
The extent to which citizens engage in tax evasion and tax avoidance varies enormously acrosscountries (Schneider and Enste, 2013). This is true even within European nations that shareimportant features such as stable democratic institutions, developed economies, EU membershipand broadly similar tax systems. Part of the reason underlying this cross-national variation relates tothe efficiency of public institutions. Put simply, countries with efficient institutions (with stringentauditing and financial reporting standards) may be more effective at deterring tax evasion. At thesame time, efficient institutions may encourage higher compliance because citizens feel that theyare receiving something (i.e., high-quality public services) in return for their money (Levi, 1989;Smith and Stalans, 1991; Smith, 1992; Pommerehne et al., 1994; Edlund, 1999; Frey and Feld, 2002;Frey and Torgler, 2007; Torgler and Schneider, 2007; Cummings et al., 2009; Levi et al., 2009).
However, there is also reason to believe that variation in norms and culture plays an importantrole in explaining tax evasion. Consider two European countries that arguably lie at opposite ends
Andrighetto et al. Ordinary Dishonesty in Tax Compliance
of the spectrum on tax compliance: Sweden and Italy1.Even setting aside differences in the institutional environment,substantial evidence suggests that norms of honesty maydiffer between these two countries. Specifically, Swedes thinkthat honesty is a typical national trait (Daun, 1989), anassessment shared by other Europeans (Zetterberg, 1995)2. Bycontrast, Italy is ranked very low in terms of honesty amongstEuropean countries, and even Italians themselves consider theircompatriots to be less than trustworthy (Mackie, 2001). Infact, the Italian journalist and writer Giuseppe Prezzolini oncedescribed Italy as the “country of cunningness” (paese dei furbi),where people “worship cunningness so much that they even go sofar as to admire those who use it against them” (Prezzolini, 1921).
To what extent can differences in norms and cultures of(dis)honesty explain cross-national variation in fiscal avoidanceand evasion? To address this question, we report data from atax compliance laboratory experiment conducted in Sweden andItaly in 2013/143. Our experimental framework allows us to holdfiscal institutions constant, and thereby isolate the influence ofnational cultures on individuals’ willingness to pay taxes. Givenprevailing national stereotypes about norms of dishonesty, weexpected that Italians would engage in greater fiscal evasion inthe experiment, compared to Swedes.
To preview our basic findings, our experiment reveals,somewhat surprisingly, that average levels of tax evasion inSweden and Italy do not differ significantly. Yet, we uncovercountry-specific styles of dishonesty. More specifically, we findthat Italians engage more frequently in moderately dishonestbehavior, or what Ariely (2012) refers to as “fudging.” By contrast,Swedes are more likely to be perfectly honest in their behavior,but among those Swedes who do cheat, they are much morelikely to cheat to the maximum extent possible. In the concludingsection, we discuss some possible implications of Italians’ greatertendency to fudge for the evolution and enforcement of honestynorms, with a particular eye toward explaining Italy’s reputationas a “country of cunningness.”
RELATED WORK
Several previous studies have attempted to evaluate cross-national variation in cheating and dishonesty using laboratoryexperiments. The results have been mixed. On the one hand, anumber of studies have found that the propensity to engage indishonest behavior does not diverge significantly across countries(Gneezy, 2005; Amir et al., 2008; Ariely, 2012; Pascual-Ezamaet al., 2015; but see Dieckmann et al., 2015 for contradictoryresults). On the other hand, when honesty and dishonesty are
1One of the most obvious differences between these two countries is revealed in
what is known as the “Tax Gap.” The Tax Gap is a measure of the difference
between revenues actually collected and taxes that would have been collected if
all taxpayers had honestly reported their incomes. While it is difficult to precisely
measure these gaps for obvious reasons, it is widely recognized that the Tax Gap
in Sweden is approximately 8–9% of GDP (Slemrod, 2007), whereas in Italy it can
reach as high as 25% to 30% (Santoro, 2010).2In a recent YouGov poll, Northern Europeans perceived Sweden as the most
honest nation in the EU (YouGov’s Eurotrack Series, 2013).3These experiments are part of a larger study on tax compliance behavior in five
countries funded by the European Research Council.
measured in more real life domains (e.g., tax evasion andbribery scenarios) and framed language is used, systematic andpredictable differences are observed across countries (Alm et al.,1995; Torgler, 2004; Bobek et al., 2007; Cummings et al., 2009;Barr and Serra, 2010).
Our study contributes to this literature in two ways. First, wesuggest that national or cultural context can influence behaviorin the lab under some conditions, but not necessarily others. Thisis because although honesty norms may differ across societies,normative considerations may have little effect on behavior if notfirst activated by situational cues in the decision context (Cialdiniet al., 1990; Aarts and Dijksterhuis, 2003; Joly et al., 2008). Forexample, although the general norm in my society may be that“people should not lie,” I could feel perfectly justified in lyingto increase my payoffs in a lab experiment, if I believe that theoperative norm in that specific context is to make as much moneyas possible. Given this, it is unsurprising that experiments usingneutral language and context free tasks find little variation indishonest behavior across countries (since the relevant country-specific norms remain dormant), whereas one finds variationwhen the specific context is made explicit and the correspondingnorms are activated. For this reason, as we describe below,we designed our experiment to explicitly incorporate framedinstructions in order to increase the salience of norms against taxevasion4.
Secondly, we argue that a consideration of “average” countryeffectsmay obscure important variation in patterns of dishonesty.For example, suppose that researchers administer a matrix test to20 participants, divided evenly between country A and countryB. Suppose further that all 10 participants in country A cheat on50% of the test questions, while in country B, 5 participants arecompletely honest, while 5 participants are completely dishonest.In this example, “average cheating” is identical across the twocountries, but this average also masks important variation in thedistribution (i.e., the extent and intensity) of dishonest behavior.
In relation to this last point, several studies have documentedheterogeneity in degrees of dishonesty in experimental tasks(Gneezy et al., 2013). More specifically, one general findingemerging from the psychology literature is that, when givenopportunities to be dishonest in everyday life, most people arewilling to fudge—that is, to cheat “just a little bit” (Mazar et al.,2008; Gino et al., 2009; Ayal and Gino, 2011; Ariely, 2012).The attractiveness of fudging lies in its ability to reduce “ethicaldissonance” by allowing people to recast their transgressions in
4However, as noted by an anonymous reviewer, the use of framed instructions
could introduce an experimenter demand effect: in particular, participants who
wish to “look good” in front of the experimenters may behave more honestly.
As we are interested in cross-national differences in behavior, this demand effect
would be problematic for our analysis only if it also differs across countries.
For example, Italians might care more about “looking good” than Swedes, and
thus moderate the amount by which they cheat on their tax declarations in the
experiment. However, we do not believe that this possibility poses a serious threat
to the validity of our study. In particular, we were careful to ensure from the
very beginning that participants had no knowledge that they were taking part in
a cross-national comparative study. In other words, there is little reason for Italian
(Swedish) participants to feel scrutinized just because they are Italian (Swedish). In
addition, we use only native speakers (indeed, in Italy, only native dialect speakers)
in each laboratory. This should lessen concerns that one needs to “look good” in
front of foreign researchers.
Frontiers in Psychology | www.frontiersin.org 2 April 2016 | Volume 7 | Article 472
Andrighetto et al. Ordinary Dishonesty in Tax Compliance
a more benign light, and thereby reconcile dishonesty with thedesire to maintain a positive moral self-image (Barkan et al.,2012).
In the context of the foregoing discussion, we are interested inexamining how cross-national variation in social norms relatingto tax evasion shapes both aggregate tax compliance as well asthe tendency to engage in “fiscal fudging.” Accordingly, both ofthese considerations—norm specificity and average vs. degrees ofhonesty—inform the design and analysis of the present study.
EXPERIMENTAL OVERVIEW
We report results from a tax experiment involving a total of 638participants in Italy and Sweden (311 in Italy; 327 in Sweden),recruited in five different locations (Rome, Bologna, Milan,Stockholm and Gothenburg)5 during the academic year 2013–20146. The basic design of our experiment is similar to that usedby Alm (1991), and aims to capture some essential features ofthe tax system used in many countries: (1) individuals earn realincome, (2) they pay taxes on income voluntarily reported, (3)they face some chance that unreported taxes will be detected andpenalized, and (4) the total taxes paid are used to provide a publicgood.
We describe our experimental protocols in detail below, buttwo features of our methodology are worth highlighting up front.First, our design explicitly provides a “context rich” setting inwhich tax language is used throughout. This feature is intendedto ensure that participants’ decisions in the lab reflect theirexperiences and social norms pertaining to the specific subjectunder study: taxation (Cummings et al., 2009). By contrast, thestandard approach of using neutral language may encourageparticipants to perceive the decision problem at hand as a riskygamble (i.e., the extra income one earns from unreported taxesweighed against the probability of being caught and fined), asopposed to a tax compliance decision. An additional benefit offraming is that there is no ambiguity for participants about whatconstitutes honest behavior in the experiment. In other words,unlike in standard public good games in which participants mayhave different expectations about the appropriate amount ofmoney to contribute, it is clear in the tax frame that the honestbehavior is to declare the total amount earned.
Secondly, in our task, participants are not restricted to beingeither completely honest or completely dishonest, but instead, areallowed to report any amount (from 0 to 100%) of earned income.Thus, our task allows us to test whether Italians and Swedes differ
5Replicating the experiment in multiple locations within each country provides us
with greater confidence that we are not simply picking up “site-specific” effects,
but rather cross-country differences in patterns of behavior. We chose these five
locations specifically because they were the only active laboratories with suitable
characteristics—i.e. with active participant pools drawn from different fields of
study — that we could find in Sweden and Italy.6Our experiments have been approved by the IRB Committee at the University
of Colorado, Boulder, where the principal investigator holds a professorship. Our
project has also been approved by the Ethics Council of the European Research
Council, and the European University Institute Ethics committee. Finally, our
work has also been authorized by all of the Italian and Swedish laboratories we
have used, but we did not undergo a separate university-based IRB review in each
case as these were not required by the universities in question. All participants
signed a written consent form prior to taking part in the study.
in their tendency to fudge their taxes, an issue that has not beencarefully investigated in previous work.
EXPERIMENTAL PROTOCOL
The experiment consisted of four stages, plus a post-experimentalsurvey, and lasted 90 minutes on average. In this article, wereport the findings of the first three stages of this experiment7.In all, we took great care to ensure that the participant poolswere similar in each experimental location8, and that the protocolwas implemented in exactly the same manner in each country(Appendix Table 1 in the Supplementary Material displaysdescriptive statistics for each country sample, as well as the degreeof similarity between Italian and Swedish participants)9.
Each stage began with participants performing a 5 minuteclerical task in which they copied random strings of lettersand numbers from a sheet of paper onto an electronic form.Participants were paid 10 Experimental Currency Units (ECUs)for each line of text they correctly copied10. After the clericaltask, participants were shown their earned income and askedto “report your income for tax purposes” under a variety ofinstitutional scenarios (described below). Participants were notinformed of how many scenarios would follow or what thespecific content of each scenario might be.
In addition, participants were told that they would facea 5% probability of being audited in each scenario; if theyunderreported their income and were audited, they wouldpay a fine equal to twice the tax that they had avoided.Importantly, we revealed the results of any audits only atthe end of the experiment, to avoid the possibility that beingaudited in one round would affect behavior in subsequentrounds. Moreover, throughout the experiment, participantshad no knowledge of other participants’ performance in thetyping tasks or their tax reporting decisions. This ensured thatindividual choices did not reflect reciprocity or conditionalcooperation.
In each of the three stages of the experiment, we manipulatedfiscal rules relevant to different features of modern taxationsystems, in order to elicit behavior under a range of institutional
7These three stages of the experiment encompass nine rounds of tax reporting (see
Appendix Table 7 in the Supplementary Material for a summary). However, we
report data from the first 8 rounds only. The 9th round involves donations to a
real-world charity, and is not central to our research question. In addition, since
the 9th roundwas the final round (and therefore, did not affect behavior in previous
rounds), we have decided to exclude it from the analysis presented in this paper.8Participants were all recruited using ORSEE (Greiner, 2004). In early versions
of the experiment, the experimental tasks were programmed and conducted
with zTree (Fischbacher, 2007), and the demographic information was collected
through Qualtrics. Later in our project, we were able to integrate the experimental
and survey portions of the study using our own web-based experimental software.
A summary of the reporting rounds and a text version of the instructions
(translated into English) are included in Appendix Table 7 in the Supplementary
Material and Appendix Supplementary Information 8.9We also had the protocol translated (double-blind) to ensure that the meanings
of the words and phrases used were consistent across the countries.10ECUs are converted into real currency at the end of the experiment. One ECU
is worth e0.01 in Italy, and 0.60 SEK in Sweden. These exchange rates are chosen
based on the average hourly pay rates in each country. The average earnings were
14.09 Euros in Italy and 187.60 SEK in Sweden.
Frontiers in Psychology | www.frontiersin.org 3 April 2016 | Volume 7 | Article 472
Andrighetto et al. Ordinary Dishonesty in Tax Compliance
contexts11. In stage 1, we altered the amount that participantsreceived in return for the taxes that they collectively paid. Inthe first scenario (round 1) of stage 1, participants were simplytold that the tax rate is 30%. There was no redistribution of taxrevenues. In the second scenario (round 2), the tax rate remained30%, but all tax revenues were placed in a “general fund”which was subsequently divided equally among all participantsirrespective of how much each individual paid into the fund.In the third scenario (round 3), we again held the tax rate at30%, but all tax revenues in the general fund were doubled andthen redistributed equally to all participants, regardless of howmuch each participant had individually paid into the fund. Ineach round (before they were asked to report their incomes),subjects were given multiple specific examples demonstrating therules in each scenario under a series of hypothetical decisions (seeAppendix Supplementary Information 8 in the SupplementaryMaterial); they were also reminded of the 5% probability of beingaudited, as well as of the fine they would have to pay should theaudit detect any under-reporting.
In stage 2, we held redistribution constant and varied thetax rates. In the first scenario of stage 2 (round 4), we askedparticipants to report their income under a tax rate of 10%. Inthe second scenario (round 5), the tax rate was increased to30%, and in the third scenario (round 6), the tax rate was againincreased to 50%. In all three rounds of stage 2, we held theaudit rate (5%), fines (2x underreported income) and the rulesfor redistribution (tax revenues doubled and then redistributed)constant.
11We also considered randomly ordering the scenarios to control for order effects.
However, we decided that this option was unnecessary because our central concern
is not to evaluate the effects of institutional changes, but rather to examine how
people in different countries would respond to the same institutional scenarios.
Finally, in stage 3, we presented scenarios with two differenttypes of progressive taxation schemes. In round 7, the top 10%of income earners (as defined by self reported income) faced a50% tax rate; participants in the bottom 10% of reported incomesfaced a 10% rate; finally, the middle 80% of reported incomeearners faced a 30% rate. By contrast, in round 8, we introduced amarginal tax rate system (similar to the real tax systems operatingin Italy and Sweden). In this case, all subjects paid a 10% taxon the first 50 ECUs of reported income, a 30% tax on reportedincome between 51 and 100 ECUs, and a 50% tax on all reportedincome above 100 ECUs. In both progressive taxation rounds, alltax revenues were doubled and then redistributed, and we heldthe audit rate constant at 5%. Once again, subjects were givenexplicit examples to ensure their understanding of the rules.
RESULTS
Average Compliance RateDespite the intrinsic social dilemma structure of the tax scenariothat makes evasion the optimal strategy, we find that the level ofcompliance far exceeded the level predicted by expected utilitytheory (Allingham and Sandmo, 1972; Yitzhaki, 1974) in bothcountries and in all rounds. This result is consistent with previousresearch on tax compliance and public goods (Ledyard, 1995;Bosco and Mittone, 1997; Cummings et al., 2009; Alm, 2012).Pooling both countries, we observe that individuals were mostlyhonest, reporting on average 64.9% of total income.
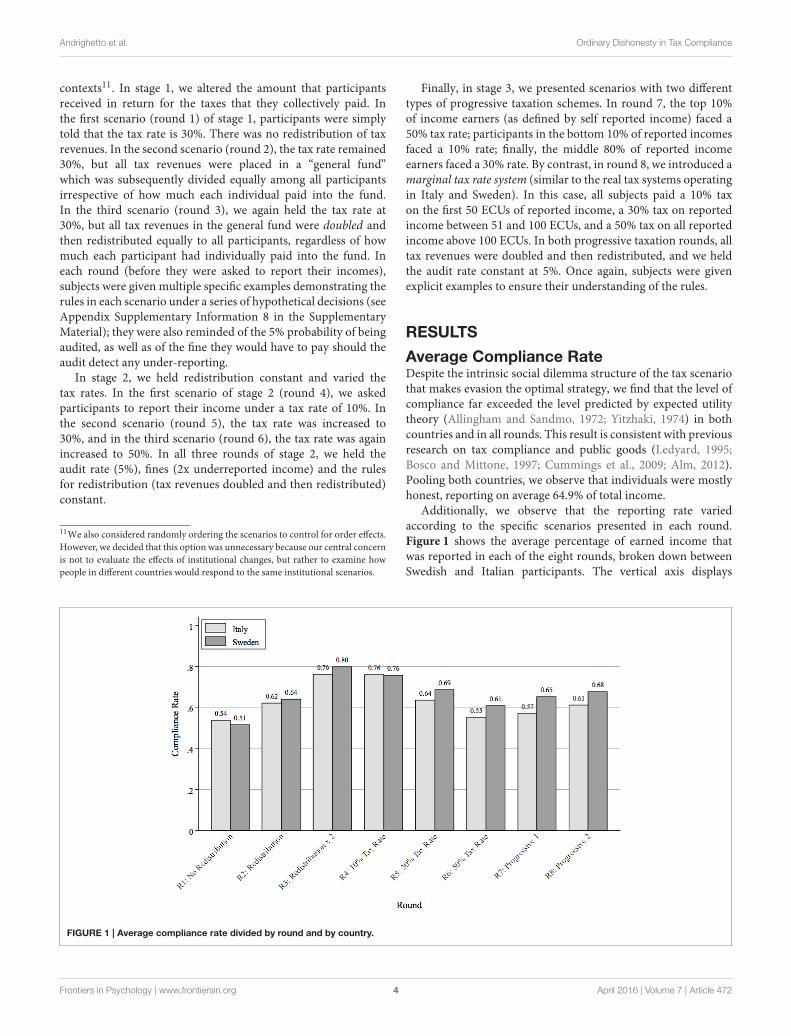
Additionally, we observe that the reporting rate variedaccording to the specific scenarios presented in each round.Figure 1 shows the average percentage of earned income thatwas reported in each of the eight rounds, broken down betweenSwedish and Italian participants. The vertical axis displays
FIGURE 1 | Average compliance rate divided by round and by country.
Frontiers in Psychology | www.frontiersin.org 4 April 2016 | Volume 7 | Article 472
Andrighetto et al. Ordinary Dishonesty in Tax Compliance
the average tax compliance rate, defined as the percentage oftotal earned income that is truthfully declared in each round.Comparing rounds 1 through 3, we see that compliance respondspositively to the efficiency of redistribution: individuals werewilling to declare more when they knew that tax revenuesproduced more public goods. Secondly, individuals responded tohigher tax rates by evading their fiscal obligations: compliancefalls moving from rounds 4 through 6. These results are in linewith previous experimental studies on tax compliance (Alm et al.,1992; Bosco and Mittone, 1997; Torgler, 2002; Blackwell, 2007;Alm, 2012), providing us with some assurance about the validityof our experimental design.
Turning to the cross-country variation in average compliancerates, although we predicted that Swedes would comply more onaverage than Italians, we do not document significant differencesacross countries. Pooling across all 8 rounds of the experiment,Italians reported 63.1% of their earned income (s.e. = 1.8%),as compared to Swedes who reported 66.6% (s.e. = 1.9%),and the cross-country difference is only 3.5% (t-test s.e. =2.6%, p = 0.182). We run several additional tests to assessthe robustness of this result. First, we check whether differentlocations within each country can indeed be pooled to estimate alarger “country” effect. To do so, in Models 1 and 2 of AppendixTable 2 in the Supplementary Material, we estimate individual-level tobit models for the average compliance rate (pooled acrossall 8 rounds) with site-specific dummy variables, separatelyfor Italy and Sweden12. We also cluster standard errors byexperimental session. We find no statistically significant within-country variability, suggesting that the results from differentlocations can indeed be pooled.
Next, we put data from both countries together, and estimatethe effect of a dummy variable for Italian participants on theaverage compliance rate, controlling for a host of individual-level characteristics including gender, age, previous participationin experiments, economics training, earnings in the clericaltask, and beliefs about the honesty of other participants. Inan alternative specification, we also add fixed effects for theindividual treatment round. The inclusion of covariates inModels 3 and 4 of Appendix Table 2 in the SupplementaryMaterial allows us to examine individual-level correlates of taxevasion and dishonesty. We observe that the average compliancerate is lower amongst men, and amongst younger participants(although this latter result is less robust), which is consistent withprevious research (Hasseldine, 1999; Lewis et al., 2009; Torglerand Valev, 2010). Risk aversion is also correlated with higheraverage compliance13. In addition, in line with previous work,we find a positive correlation between economics training and
12The number of observations changes once we include demographic covariates
in our regression models. This is because in early versions of the experiment,
the experimental tasks were implemented in zTree, while the demographic
information was collected separately usingQualtrics. This necessitated participants
entering their anonymous participant-IDs twice: once into zTree, and once
again into Qualtrics. Because some participants accidentally entered different
participant-IDs into the two systems, we were unable to match their experimental
decisions with their demographic data. This problem was fixed in later versions of
the experiment, once we switched to our own web-based experimental software.13Wemeasured risk using a survey item that asks subjects to rank themselves on a
10-point scale, with 1 signifying a person who “normally tries to avoid taking risks”
lower average compliance (Marwell and Ames, 1981; Carter andIrons, 1991; Cullis et al., 2006; Lewis et al., 2009). Finally, wecontrol for participants’ beliefs about the behavior of others inthe experiment14. Individuals who believed that others reportedless also reported less themselves (Fischbacher et al., 2001).
Importantly, the inclusion of these covariates does not changeour overall conclusions regarding cross-country differences inthe average compliance rate. As shown in Models 3 and 4, thecoefficient on the Italy dummy is never statistically significant.These additional results confirm our initial findings reportedabove: regardless of the controls and model specification weemploy, we do not find any significant differences in averagecompliance rates between the two countries15.
Patterns of Compliance and DishonestyAlthough an analysis of the average compliance rate does notsupport prevailing national stereotypes that Swedes are morehonest than Italians, a closer analysis of the distribution ofcompliance decisions yields some interesting cross-nationaldifferences. In particular, a statistic like the average compliancerate does not allow us to distinguish between three differentdecisions: complete compliance (i.e., the decision to declare 100%of earned income), complete evasion (i.e., the decision to declare0% of earned income), and partial compliance or “fudging” (i.e.,the decision to declare more than 0, but less than the total; seealso Mazar et al., 2008 for a similar analysis).
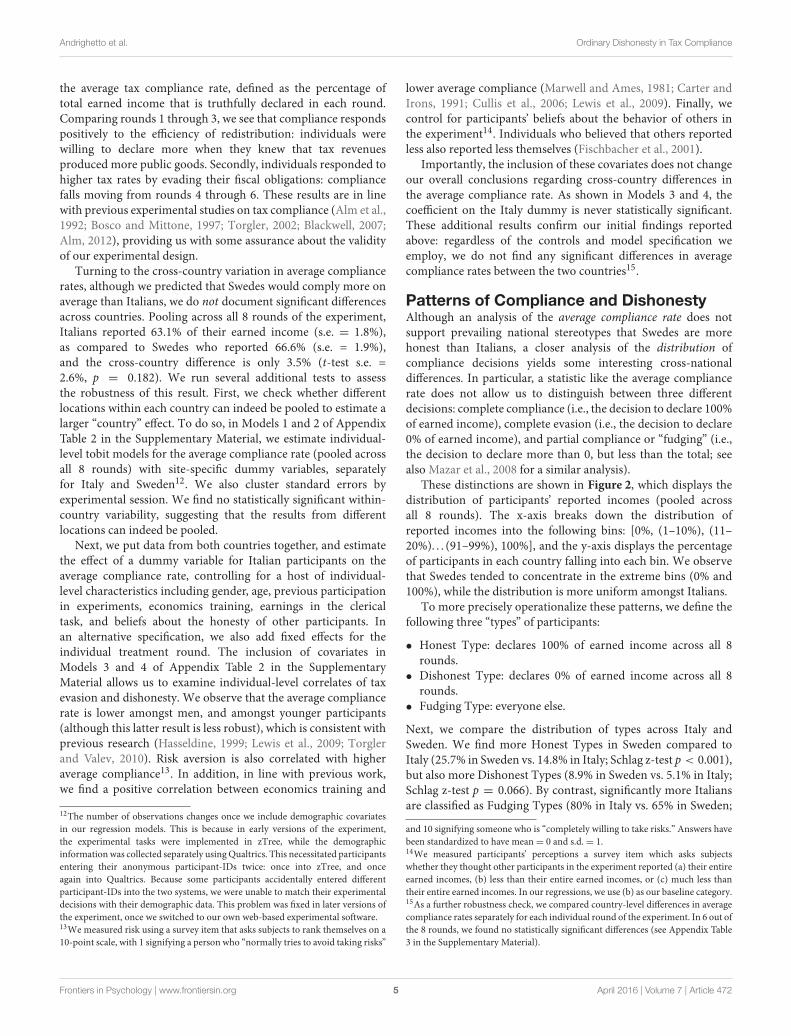
These distinctions are shown in Figure 2, which displays thedistribution of participants’ reported incomes (pooled acrossall 8 rounds). The x-axis breaks down the distribution ofreported incomes into the following bins: [0%, (1–10%), (11–20%). . . (91–99%), 100%], and the y-axis displays the percentageof participants in each country falling into each bin. We observethat Swedes tended to concentrate in the extreme bins (0% and100%), while the distribution is more uniform amongst Italians.
To more precisely operationalize these patterns, we define thefollowing three “types” of participants:
• Honest Type: declares 100% of earned income across all 8rounds.
• Dishonest Type: declares 0% of earned income across all 8rounds.
• Fudging Type: everyone else.
Next, we compare the distribution of types across Italy andSweden. We find more Honest Types in Sweden compared toItaly (25.7% in Sweden vs. 14.8% in Italy; Schlag z-test p < 0.001),but also more Dishonest Types (8.9% in Sweden vs. 5.1% in Italy;Schlag z-test p = 0.066). By contrast, significantly more Italiansare classified as Fudging Types (80% in Italy vs. 65% in Sweden;
and 10 signifying someone who is “completely willing to take risks.” Answers have
been standardized to have mean= 0 and s.d.= 1.14We measured participants’ perceptions a survey item which asks subjects
whether they thought other participants in the experiment reported (a) their entire
earned incomes, (b) less than their entire earned incomes, or (c) much less than
their entire earned incomes. In our regressions, we use (b) as our baseline category.15As a further robustness check, we compared country-level differences in average
compliance rates separately for each individual round of the experiment. In 6 out of
the 8 rounds, we found no statistically significant differences (see Appendix Table
3 in the Supplementary Material).
Frontiers in Psychology | www.frontiersin.org 5 April 2016 | Volume 7 | Article 472
Andrighetto et al. Ordinary Dishonesty in Tax Compliance
FIGURE 2 | Distribution of individual compliance rates.
Schlag z-test p < 0.001). In other words, Swedish participantsdisplayed more clear-cut behaviors: Swedes cheat less frequently,but when they cheat, they are likely to do so completely. Bycontrast, Italians cheat more habitually, but the intensity of theircheating is more restrained: they hold back from “cheating allthey way.”
Interestingly, we also find that, compared to Dishonest Types,Fudging Types are also more likely to deceive (themselves) abouttheir behavior during the experiment. In particular, in our post-experimental survey, participants were asked to indicate howmuch of their total earnings they themselves reported duringthe experiment: 18% of Fudging Types indicating that theyreported their total income, while no Dishonest Types lied. Thislast finding nicely fits with evidence from social psychologicalresearch showing that individuals choose fudging strategies tomaintain a positive moral reputation and self-image (Ayal andGino, 2011; Ariely, 2012).
To check the robustness of these results, we conduct anadditional battery of tests. First, as before, we verify that resultsfrom separate locations within countries can indeed be pooled(Models 1 and 2 of Appendix Table 4 in the SupplementaryMaterial)16. Next, we estimate probit models of the probabilityof being a Fudging Type, conditional upon individual-levelcovariates and round fixed effects (Models 3 and 4 of AppendixTable 4 in the Supplementary Material). In all specifications,Italians were approximately 10% more likely to fudge, comparedto Swedes. Here, we also find that individuals who believed that
16The percentage of Fudging Types in all Italian locations is higher than in all
Swedish locations (83% in Milan, 74% in Bologna and 84% in Rome vs. 67% in
Stockholm and 62% in Gothenburg). Running an “empty” random-effects model,
we find that the variance within countries is about half the size of the variance
across countries.
others behaved honestly in the experiment were significantly lesslikely to fudge17,18.
In summary, although the average level of dishonesty doesnot differ across the two countries, a closer examination of thedata reveals a cross-national difference in patterns of dishonesty.Simply put: Italians are more prone to “fudging” than Swedes.
DISCUSSION AND CONCLUDINGREMARKS
Our results indicate that when Italians and Swedes face a taxcompliance scenario consisting of a transparent tax system,efficient redistributive regime, and clear audit rules and penalties,the average level of honesty is relatively high in both countries.This result does not bear out our initial expectations basedon national stereotypes, where we predicted a greater level ofhonesty in Sweden compared to Italy. However, we also identifyan interesting cross-country difference that may shed light on ourunderstanding of why these stereotypes emerge. In particular, wefind country-specific styles of dishonesty, with Italians engagingmore frequently in fudging, while Swedes were more likely to beboth perfectly honest and perfectly dishonest. In this concludingsection, we offer some conjectures linking this result to the
17We also check whether our results are sensitive to the definition of fudging
we employ. Specifically, we alternatively redefine Fudging Types as those who
reported (a) more than 2/3rds of their income, (b) between 1/3rd and 2/3rds of total
income, and (c) less than 1/3rd of total income. Overall, as shown in Appendix
Table 5 in the Supplementary Material, we find that regardless of the definition of
Fudging Type, Italians were more likely fudge.18We also checked for cross-country differences in the distribution of types
separately for each individual round.We find that in all 8 rounds of the experiment,
Italians were significantly more likely to fudge than Swedes (See Appendix Table 6
in the Supplementary Material).
Frontiers in Psychology | www.frontiersin.org 6 April 2016 | Volume 7 | Article 472
Andrighetto et al. Ordinary Dishonesty in Tax Compliance
development and perpetuation of national stereotypes abouthonesty and dishonesty in Sweden and Italy.
In particular, we argue that when ordinary dishonesty takeson the form of fudging, this behavior may be particularlydifficult to control and eradicate. Part of the reason stemsfrom the fact that fudging introduces a degree of moralambiguity in judging the wrongfulness of a particular action. Asdiscussed in Ayal and Gino (2011), when the categorization ofa behavior is malleable rather than clear-cut, people are morelikely to conceptualize their own actions in acceptable terms.This benevolent interpretation of dishonest behavior helps toreduce any dissonance that may result from the tension betweenunethical conduct and the desire to maintain a moral self-image(Baumeister, 1998; Schweitzer and Hsee, 2002). Fudging thusprovides individuals with greater moral license to indulge in(moderate) wrongdoing.
In addition, in the presence of widespread fudging, it maybe difficult for third parties to enforce honesty norms. Inparticular, when there is uncertainty about what is right orwrong, punishment becomes more risky, since enforcement maygenerate counter-punishment (also from third-party observers)who do not recognize the legitimacy of the punisher (Herrmannet al., 2008; Strimling and Eriksson, 2014). As such, tolerance for(moderate) wrongdoing rises.
Given the difficulties that fudging poses for both self-regulation and peer-regulation of dishonest behavior, ordinarydishonesty tends to spread. This may explain why Italians havesuch a widespread reputation for cunningness, as they areobserved both to engage in ubiquitous small acts of dishonesty,and to tolerate and even justify dishonesty on the part of others.
By contrast, Swedes’ relatively clear-cut behaviors may facilitate
both self-regulation (as it is more difficult to self-justify grossdishonesty) and social control.
Efforts to raise the moral standard of society in the presenceof fudging may thus require actions that (a) increase awarenessof the negative effects of apparently benign behaviors, and(b) support norms enforcers who insist on absolute honesty.In future work, we propose to use agent-based modeling andadditional experiments to explore the dynamics of fudging, itssocial effects, and the effectiveness of policy interventions tofoster greater public integrity.
AUTHOR CONTRIBUTIONS
Conceived and designed the experiments: GA, SO, FP, and SS.Performed the experiments: GA, SO, FP, SS, and NZ. Analyzedthe data: NZ, SO, and JD. Wrote the paper: GA.
FUNDING
The research leading to these results has received funding fromthe European Research Council under the European Union’sSeventh Framework Programme (FP7/2007-2013)/ERC GrantAgreement n. (295675). The funders had no role in study design,data collection and analysis, decision to publish, or preparationof the manuscript.
SUPPLEMENTARY MATERIAL
The Supplementary Material for this article can be foundonline at: http://journal.frontiersin.org/article/10.3389/fpsyg.2016.00472
REFERENCES
Aarts, H., and Dijksterhuis, A. (2003). The silence of the library: environment,
situational norm, and social behavior. J. Pers. Soc. Psychol. 84, 18–28. doi:
10.1037/0022-3514.84.1.18
Allingham, M., and Sandmo, A. (1972). Income tax evasion: a theoretical analysis.
J. Public Econ. 1, 323–338. doi: 10.1016/0047-2727(72)90010-2
Alm, J. (1991). A perspective on the experimental analysis of taxpayer reporting.
Account. Rev. 66, 577–593.
Alm, J. (2012). Measuring, explaining, and controlling tax evasion: lessons from
theory, experiments, and field studies. Int. Tax Public Finance 19, 54–77. doi:
10.1007/s10797-011-9171-2
Alm, J., Jackson, B. R., and McKee, M. (1992). Estimating the determinants of
taxpayer compliance with experimental data. Natl. Tax J. 45, 107–114.
Alm, J., Sanchez, I., and De Juan, A. (1995). Economic and noneconomic factors
in tax compliance. Kyklos 48, 3–18. doi: 10.1111/j.1467-6435.1995.tb02312.x
Amir, O., Ariely, D., and Mazar, N. (2008). The dishonesty of honest people:
a theory of self-concept maintenance. J. Mark. Res. 45, 633–634. doi:
10.1509/jmkr.45.6.633
Ariely, D. (2008). Predictably Irrational. New York, NY: HarperCollins.
Ariely, D. (2012). The (Honest) Truth About Dishonesty: How We Lie to Everyone–
Especially Ourselves. New York, NY: HarperCollins
Ayal, S., and Gino, F. (2011). “Honest rationales for dishonest behavior,” in
The Social Psychology of Morality: Exploring the Causes of Good and Evil.
Herzliya Series on Personality and Social Psychology, eds M. Mikulincer
and P. R. Shaver (Washington, DC: American Psychological Association),
149–166.
Barkan, R., Ayal, S., Gino, F., and Ariely, D. (2012). The pot calling the kettle black:
distancing response to ethical dissonance. J. Exp. Psychol. Gen. 141, 757–773.
doi: 10.1037/a0027588
Barr, A., and Serra, D. (2010). Corruption and culture: an experimental analysis.
J. Public Econ. 94, 862–869. doi: 10.1016/j.jpubeco.2010.07.006
Baumeister, R. F. (1998). “The self,” in Handbook of Social Psychology, eds D. T.
Gilbert, S. T. Fiske, and G. Lindzey (New York, NY: McGraw-Hill), 680–740.
Blackwell, C. (2007). “A meta-analysis of tax compliance experiments,” inWorking
Paper Series, at AYSPS, 0724 International Center for Public Policy. International
Center for Public Policy, Andrew Young School of Policy Studies, Georgia State
University.
Bobek, D. D., Roberts, R. W., and Sweeney, J. T. (2007). The social norms of tax
compliance: evidence from Australia, Singapore, and the United States. J. Bus.
Ethics 7, 49–64. doi: 10.1007/s10551-006-9219-x
Bosco, L., and Mittone, L. (1997). Tax evasion and moral constraints: some
experimental evidence. Kyklos 50, 297–324.
Carter, J., and Irons, M. (1991). Are economists different, and if so, why? J. Econ.
Perspect. 5, 171–177. doi: 10.1257/jep.5.2.171
Cialdini, R. B., Reno, R. R., and Kallgren, C. A. (1990). A focus theory of normative
conduct—recycling the concept of norms to reduce littering in public places.
J. Pers. Soc. Psychol. 58, 1015–1026. doi: 10.1037/0022-3514.58.6.1015
Cullis, J., Jones, P., and Lewis, A. (2006). Tax framing, instrumentality and
individual differences: are there two different cultures? J. Econ. Psychol. 27,
304–320. doi: 10.1016/j.joep.2005.07.003
Cummings, R., Martinez-Vazquez, J., McKee, M., and Torgler, B. (2009). Tax
morale affects tax compliance: evidence from surveys and an artefactual field
experiment. J. Econ. Behav. Organ. 70, 447–457. doi: 10.1016/j.jebo.2008.02.010
Frontiers in Psychology | www.frontiersin.org 7 April 2016 | Volume 7 | Article 472


![CSC Resolution Dishonesty[1]](https://static.documents.pub/doc/80x56/54f785b34a79597b198b4588/csc-resolution-dishonesty1.jpg)


